Embed Size (px)
Citation preview

Project name CA Identity Manager r12.5
Document name Performance Test Report

2
Contents 1. Introduction ............................................................................................................................ 3
2. Summary of findings ............................................................................................................... 3
2.1. 12GA to 12.5 Create User /Modify User / Password Reset comparison ......................... 3
2.2. 12GA to 12.5 Connector comparison ............................................................................... 3
2.3. 12.5 Extended Scenarios .................................................................................................. 4
3. 12GA to 12.5 Create User / Modify User / Password Reset comparison ............................... 4
3.1. Test Results summary ...................................................................................................... 4
3.2. Submissions and Completions ......................................................................................... 5
4. IM 12.5 to 12GA Connector comparison ................................................................................ 7
4.1. Create/Modify/Delete Account ....................................................................................... 7
4.2. Explore/Correlate ............................................................................................................. 9
5. IM12.5 Extended Scenario .................................................................................................... 12
5.1. Identity Policy and Provisioning Role impact ................................................................. 13
5.2. Node Impact ................................................................................................................... 15
5.3. Interface Impact ............................................................................................................. 16
5.4. Bulk Request ................................................................................................................... 17
Appendix A .................................................................................................................................... 19
Test Descriptions ....................................................................................................................... 19
Test Environments .................................................................................................................... 20
Machine Hardware details ........................................................................................................ 21
Appendix B .................................................................................................................................... 22
Detailed Test results for Add/Modify/Delete Account Connector Tests.................................. 22
Add Account Summary Table ................................................................................................ 22
Modify Account Summary Table........................................................................................... 24
Delete Account Summary Table ........................................................................................... 25
Appendix C .................................................................................................................................... 26
Detailed Test results for Explore/Correlate Connector Tests ................................................... 26
Correlate ............................................................................................................................... 26
Explore - Low Memory Algorithm ......................................................................................... 26
Explore - Classic ..................................................................................................................... 27

3
1. Introduction The purpose of this report to provide an overall impression of the performance capabilities of the Identity Manager 12.5 release. The report is broken up into 3 separate sections:
- 12GA to 12.5 Create User / Modify User / Password Reset comparison - 12GA to 12.5 Connector comparison - 12.5 Extended Scenario testing
Overall, there has been a notable increase in the performance of Identity Manager when comparing IM12GA to IM12.5. All tests were performed on identical hardware and data sets to ensure an accurate comparison (The details of the test environment used for the performance testing can be found in Appendix A).
2. Summary of findings
2.1. 12GA to 12.5 Create User /Modify User / Password Reset comparison
The create user, modify user and password reset tests showed that there was an improvement across all operations and tested interfaces between the r12 and 12.5 releases. The create user operation showed an increase of 150% in throughput when tested via TEWS and the web interface (via Silk Performer). The modify user and password reset operations improved more dramatically with a throughput increase of between 200-250%.
2.2. 12GA to 12.5 Connector comparison
The create, modify and delete account tests across a subset of connectors showed an overall performance improvement from 12GA to 12.5. This increase was more noticeable with lower numbers of concurrent operations. A decrease in performance was noted for the modify operations, although this was significant only on the Solaris platform. The performance improvements decreased with increasing concurrent operations reaching a minimum on the Windows platform of a 14% improvement across all operations. For the Correlation tests, the overall results showed a substantial performance improvement in 12.5 over 12GA (>250%). The increase in performance was platform independent. In comparison the performance improvements in the Explore tests were not as significant. The “classic” explore method (Explore compare in memory = yes) showed no change in performance while the “low memory” explore (Explore compare in memory = no) showed a 50% improvement over the r12 results.

4
2.3. 12.5 Extended Scenarios
The main purpose of the Extended Scenario Testing was to observe the performance of the IM12.5 product when the testing environment was altered. The test results helped to diagnose and allow the resolution of the completion ‘lag’ that was seen when processing large amounts of requests. The noticeable delay between the end of the submissions and the end of the completions is now reduced in the 12.5 release. The extended scenario tests helped to identify issues associated with increasing Identity Policies and quantify the impact of app server node ramp up. Additional tests allowed us to expose and minimize differences in throughput of the product via the different interfaces.
3. 12GA to 12.5 Create User / Modify User / Password Reset comparison A series of tests were performed using the create user, modify user and password reset actions in Identity Manager. All tests were performed on the same hardware and data set for direct comparison.
3.1. Test Results summary The tests were run using both the TEWS interface and the Web UI (via Silk Performer). The results shown below illustrate a 150% improvement in throughput for the create user operation through both interfaces. The modify user operation showed a more significant increase of over 200% improvement in throughput for both interfaces. Reset password performance via the Web UI was similarly increased. It is interesting to note that the standard deviations reported for the 12.5 release are in most cases significantly smaller than the r12 release suggesting predictable performance improvements. At no stage during the test was any machine resource constraint noted in CPU, Memory or IO. (Throughput per Min)
Test 12GA 12.5 % Increase
TEWS Create User 38.1 ±5.3 96.8 ±0.4 +154% TEWS Modify User 15.2 ±1.4 47.5 ±0.2 +212% SILK Create User 34.7 ±2.4 90.1 ±1.3 +159% SILK Modify User 14.3 ±0.7 50.3 ±0.1 +252% SILK Reset Pass 24.1 ±1.0 83.1 ±4.8 +244%
5
3.2. Submissions and Completions Worth noting is the decrease in lag time that was achieved during this program. One of the significant findings during previous performance testing was the presence of a “lag” time between the last submission and the final completion of the task. As you can see in the graph below in IM r12 the create user operation through the TEWS interface showed a 19 minute lag time between the last submission and the peak of the completions. The same operation on IM r12.5 with the same data set showed a small lag of only 3 minutes. IM r12GA – Create User Operation – TEWS interface

6
IM 12.5 – Create User Operation – TEWS interface
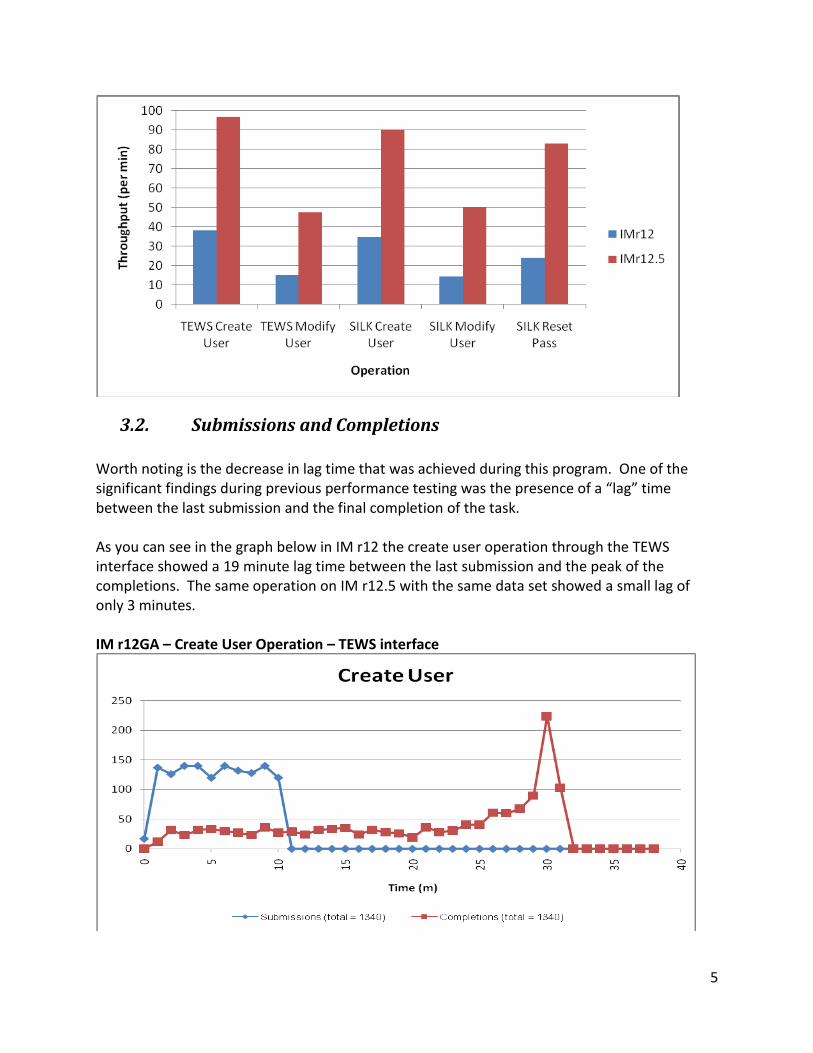
The same lag improvement can be seen in the reset password operation via the Web UI interface (via Silk Performer). In IM r12 the lag was up to 30 minutes after the last submission where as in IM r12.5 it was virtually nonexistent. IM r12GA – Reset Password Operation – Web UI
7
IM r12.5 – Reset Password Operation – Web UI
4. IM 12.5 to 12GA Connector comparison The following operations were tested in order to compare the performance of the Provisioning components using a representative subset of connectors.
- Create / Modify / Delete accounts - Re-explore - Re-correlate
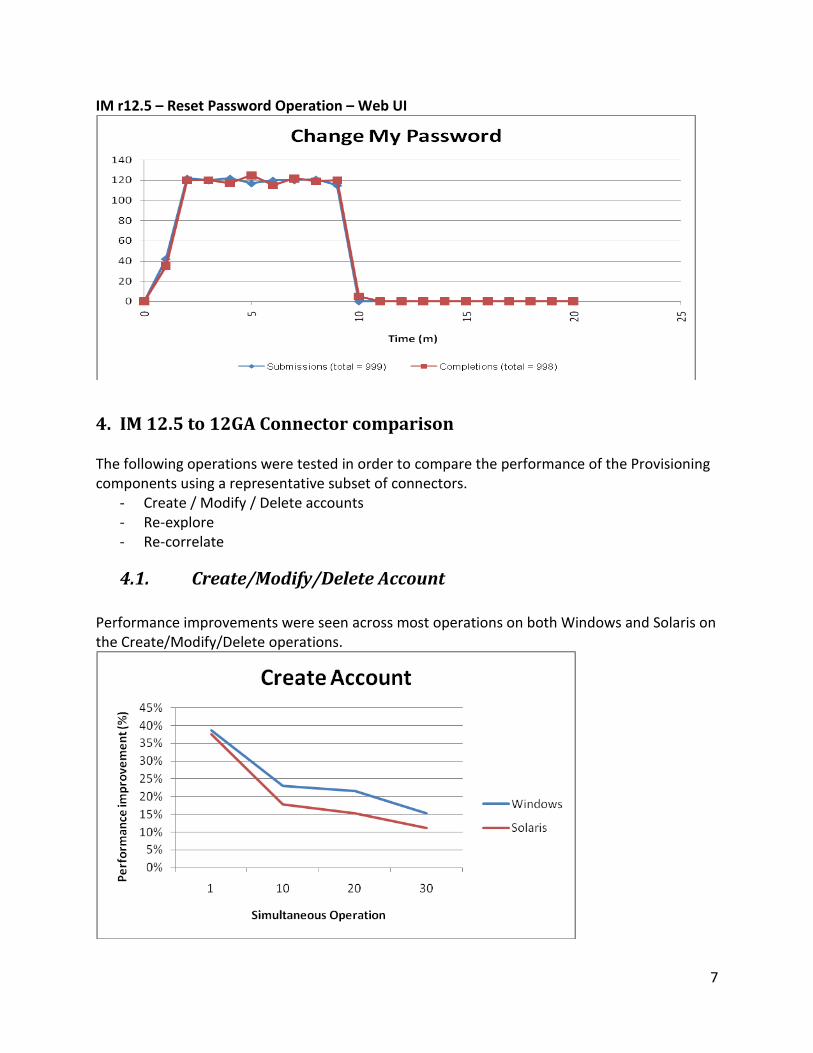
4.1. Create/Modify/Delete Account
Performance improvements were seen across most operations on both Windows and Solaris on the Create/Modify/Delete operations.

8
An interesting result in this series of tests was the decrease in performance on the Solaris platform for the modify operation. While the Windows performance numbers for modify were within the IM r12 range (i.e. no increase or decrease in performance with 10 or more concurrent users), the same tests on Solaris showed up to a 25% decrease in performance.

9
The decrease in performance seen with the modify operation on Solaris was compensated for by the gains in the create and delete operations. As a result the Solaris platform results were not significantly different for all three actions with 30 concurrent operations. The more significant performance gains were seen at the lower levels of concurrent operations for both platforms.
No. of Concurrent Users
1 10 20 30
Windows performance increase 30% 22% 18% 14%
Solaris performance increase 28% 11% 7% 1%
Detailed results and performance comparison can be found in Appendix B
4.2. Explore/Correlate
For the same subset of connectors the following actions were performed with the Provisioning Server on either a Windows or Solaris machine.
- Re-Correlate (second correlate) - Re-Explorer (second explore)
For the explore tests two methods were investigated:
- ‘Classic’ Explore refers to the IMPS setting: ‘Explore and Correlate/Explore Compare in Memory’ set to ‘Yes’
- ‘Low Memory’ Explore refers to the IMPS setting: ‘Explore and Correlate/Explore Compare in Memory’ set to ‘No’

10
The results for the second correlate action showed a significant improvement between IM r12 and 12.5 across the representative connector set (>250%). In comparison both explore methods showed either a comparitively modest or non-existant performance improvement. Much of the performance improvments seen with correlation can be attributed to the inclusion of the dxgrid CA Directory technology.

11
Included below is a comparison of explore times between the “low memory” and “classic” for the IM 12.5 release. The time taken for the operation is significantly reduced when “compare in memory” is set to “yes”.

12
Detailed results for the Explore/Correlate testing can be found in Appendix C
5. IM12.5 Extended Scenario The extended scenario testing consists of test cases that have been used to analyze how the system reacts to increasing load (i.e. Increased policy or role numbers) and to discover bottlenecks in the system. The purpose of the tests was to:
Assess the behavior of the system under Identity Policy and the Provisioning Role ramp up
Assess the behavior of the system under Node ramp up
Compare the System Interfaces between TEWS, Web UI and BulkLoader
Assess the behavior of the BulkLoader under request ramp up.

13
5.1. Identity Policy and Provisioning Role impact
Purpose: To assess the behavior of the system under the Identity Policy and the Provisioning Role ramp up. For each test one of the variables (policies or roles) was ramped up from 100 to 10,000 while the other variable was set at 100. As can be seen from the graphs below the impact of ramping up the provisioning roles on the modify user and reset password was negligible. In comparison the impact on throughput of ramping up the number of Identity Policies is significant for the modify user operation but not for the reset password operation.
Modify Users – Silk Performer (Throughput per min) No of Policies or Roles
100 1,000 10,000
Identity Policies 139.4 94.0 4.2
Provisioning Roles 139.4 157.8 154.6
Modify Users – TEWS (Throughput per min) No of Policies or Roles
100 1,000 10,000
Identity Policies 136.5 89.2 6.0
Provisioning Roles 136.5 138.5 133.7

14
Reset Password – Silk Performer (Throughput per min) No of Policies or Roles
100 1,000 10,000
Identity Policies 146.9 121.1 117.6
Provisioning Roles 146.9 135.7 141.1
To improve the performance of the system with increasing numbers of Identity Policies it is now possible to scope down via Identity Policy space segregation. The results shown above for modify users above illustrates a significant decrease of between 32-35% in throughput when ramping up from 100 to 1,000 Identity Policies. Performing a similar operation with a member rule set (i.e. org=employee) resulted in a less dramatic performance hit of 6%.
15
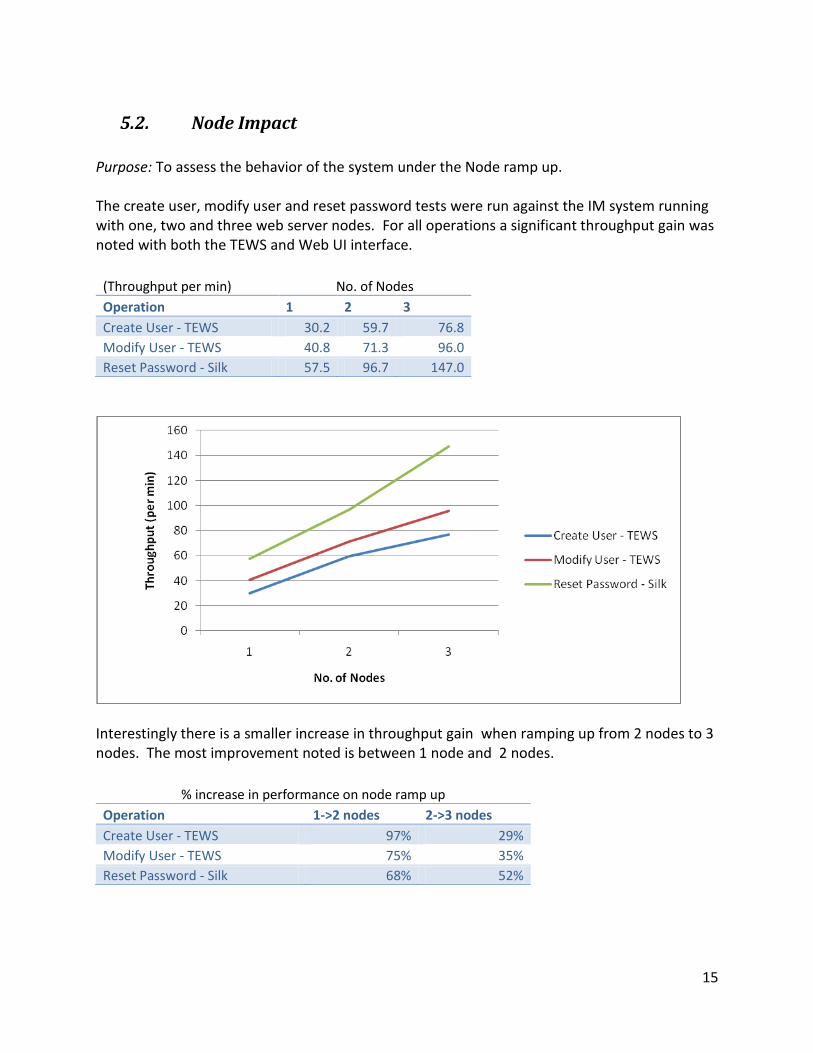
5.2. Node Impact
Purpose: To assess the behavior of the system under the Node ramp up. The create user, modify user and reset password tests were run against the IM system running with one, two and three web server nodes. For all operations a significant throughput gain was noted with both the TEWS and Web UI interface.
(Throughput per min) No. of Nodes
Operation 1 2 3
Create User - TEWS 30.2 59.7 76.8
Modify User - TEWS 40.8 71.3 96.0
Reset Password - Silk 57.5 96.7 147.0
Interestingly there is a smaller increase in throughput gain when ramping up from 2 nodes to 3 nodes. The most improvement noted is between 1 node and 2 nodes.
% increase in performance on node ramp up
Operation 1->2 nodes 2->3 nodes
Create User - TEWS 97% 29%
Modify User - TEWS 75% 35%
Reset Password - Silk 68% 52%

16
This same effect is apparent through the Bulk Loader interface.
(Throughput per min) No. of Nodes
Operation 1 2 % increase
improvement
Create User - Bulk Loader 47.5 79.8 68%
5.3. Interface Impact Purpose: To compare the system interfaces. The modify users tests were run via various interfaces using the following combinations.
Interface # Requests # Tasks
Test 1 TEWS 1,000 1
Test 2 Silk Performer 1,000 1
Test 3 Bulk Loader 1 1,000
The results of the tests illustrated that there was minimal difference in the throughput through the different interfaces. As expected the TEWS interface allowed the a higher throughput than either the Web UI (via Silk Performer) or the Bulk Loader.
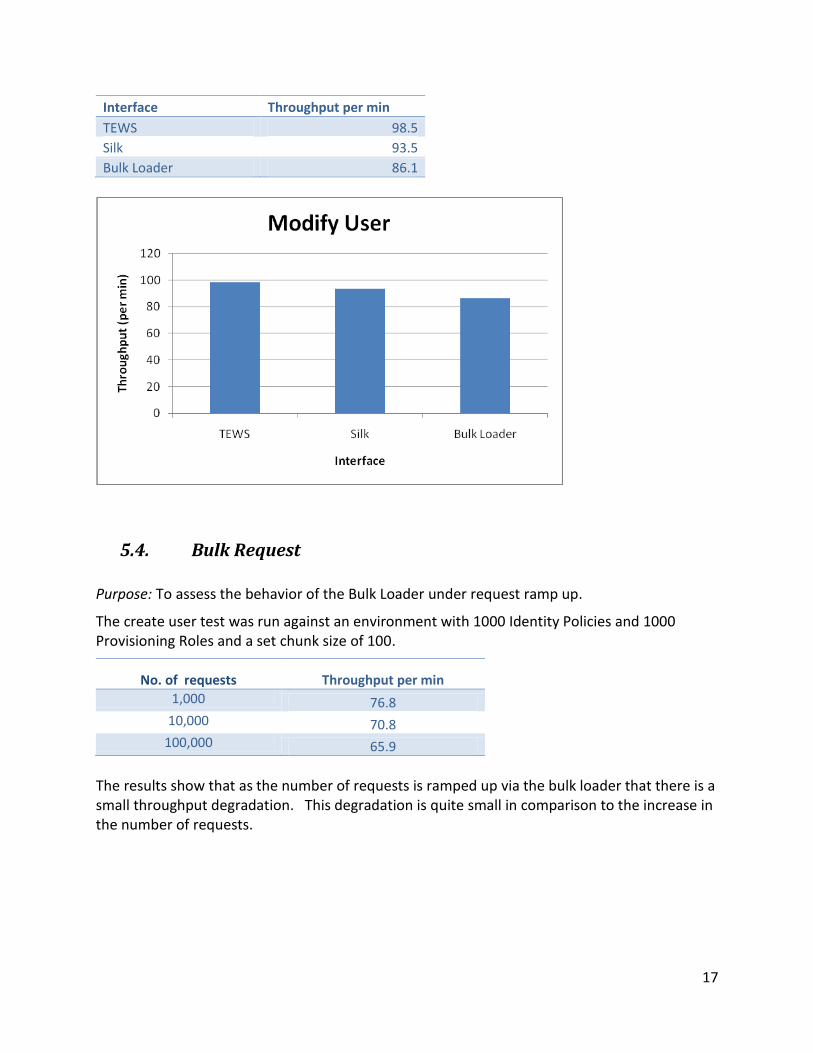
17
Interface Throughput per min
TEWS 98.5
Silk 93.5
Bulk Loader 86.1
5.4. Bulk Request Purpose: To assess the behavior of the Bulk Loader under request ramp up.
The create user test was run against an environment with 1000 Identity Policies and 1000 Provisioning Roles and a set chunk size of 100.
No. of requests Throughput per min
1,000 76.8 10,000 70.8
100,000 65.9
The results show that as the number of requests is ramped up via the bulk loader that there is a small throughput degradation. This degradation is quite small in comparison to the increase in the number of requests.

18
19
Appendix A
Test Descriptions
Two types of tests were run on Identity Manger with Provisioning components: HTTP-GUI tests using Silk Performer and TEWS based performance tests. Load tests (HTTP) using Silk Performer: The tests are configured where each thread would submit a new request as soon as the previous one has been acknowledged. Due to Modify User and Reset password tests requiring prerequisite users to be setup in a dual user store, Silk Performer was configured to submit a fixed number of requests, i.e. 1000 using a Queuing workload. Majority of the time, processing of a request continues after the asynchronous response. The completion times is gathered by examining the state of tasks in the Task Persistence Store. Load tests using TEWS: For these tests a fixed number of threads submit requests at specified intervals, irrespective of the progress and status of the previous requests. The TEWS interface submits direct SOAP requests to carry out the necessary tasks, without asking the application server for screen rendering. Each test runs for 10 minutes and was characterized by the number of threads and submission interval. The Create User and Modify User tasks were used in this scenario. Environment Configuration For the comparison tests, one primary configuration would be used for both releases and where all applicable tests are executed.
A Websphere Cluster Configuration with 3 nodes.
Oracle 10g R2 RAC is used for the Object and Task Persistence Store.
Number of users is 75,000 for both User Store and Provisioning Directory.
Number of Provisioning Roles is 250.
Number of Identity Policies is 250.
A single endpoint system ADS.
The total number of accounts on the endpoint will be 10,000.
Dual Corporate/Provisioning Store. The Operating System that is used will be Solaris SPARC except for the Connector Server and endpoint system which is Windows Server 2008.
20
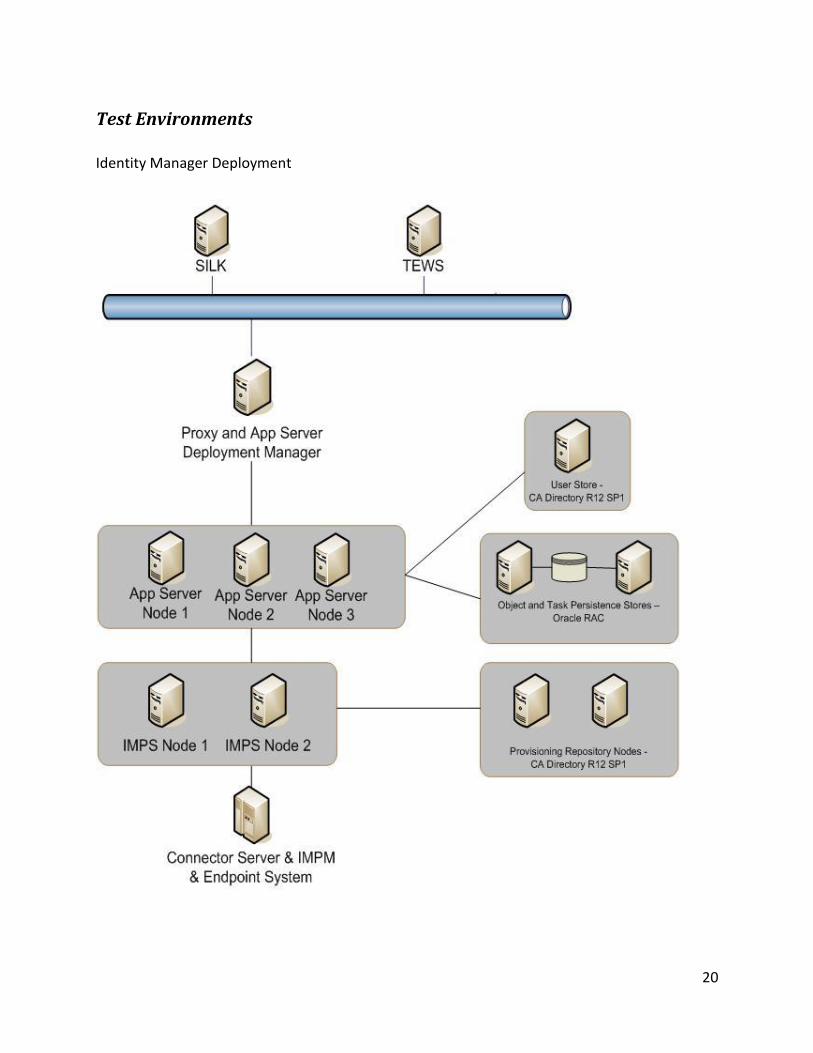
Test Environments
Identity Manager Deployment

21
Machine Hardware details
Role Application Spec OS
Proxy and Application Server Deployment Manager
Web Server and Application Server Node Manager
T2000 8 GB RAM 8 core 1.2GHz (32 virtual CPUs)
Solaris 10
Application Server Node 1
Application Server and Identity Manager
T2000 8 GB RAM 8 core 1.2GHz (32 virtual CPUs)
Solaris 10
Application Server Node 2
Application Server and Identity Manager
T2000 8 GB RAM 8 core 1.2GHz (32 virtual CPUs)
Solaris 10
Application Server Node 3
Application Server and Identity Manager
T2000 8 GB RAM 8 core 1.2GHz (32 virtual CPUs)
Solaris 10
Provisioning Server Node 1
Identity Manager Provisioning Server
T2000 8 GB RAM 8 core 1.2GHz (32 virtual CPUs)
Solaris 10
Provisioning Server Node 2
Identity Manager Provisioning Server
T2000 8 GB RAM 8 core 1.2GHz (32 virtual CPUs)
Solaris 10
Provisioning Repository Node 1
Identity Manager Provisioning Directory
T2000 8 GB RAM 8 core 1.2GHz (32 virtual CPUs)
Solaris 10
Provisioning Repository Node 2
Identity Manager Provisioning Directory
T2000 8 GB RAM 8 core 1.2GHz (32 virtual CPUs)
Solaris 10
Connector Server, Provisioning Manager and Endpoint System
Connector Server, IM Provisioning Manager and ADS
X4600 32 GB RAM 4 Opteron 2.6GHz dual-core
Windows 2008 32 bit
Object and Task Persistence Stores Node 1
Oracle RAC 10g R2 Database
X4600 32 GB RAM 4 Opteron 2.6GHz dual-core
Solaris 10 x86
Object and Task Persistence Stores Node 2
Oracle RAC 10g R2 Database
X4600 32 GB RAM 4 Opteron 2.6GHz
Solaris 10 x86

22
dual-core
User Store CA Directory r12 SP1 SR1
X4600 32 GB RAM 4 Opteron 2.6GHz dual-core
Solaris 10 x86
Silk Controller Silk Performer Intel, Dual Core 4GB Windows 2003 SP2
Custom TEWS client Controller
TEWS client Intel, Dual Core 4GB Windows 2003 SP2
Appendix B
Detailed Test results for Add/Modify/Delete Account Connector Tests
For each Connector across both platforms (Windows and Solaris) a series of tests were run to perform the following actions:
- Add an Account - Modify an Account - Delete an Account
Each test was run 4 times, with an increasing amount of threads running each time. In each test there are 5 ‘actions’ taking place per thread. The endpoints covered in the performance tests were:
- N16 (Windows Server 2003 SP2) - SQL (MS SQL Server 2005 SP2) - ADS (Windows Server 2003 SP2) - ETC (Solaris 10) - SAP (ECC 5.0, Kernel 6.4)
Tests were run against a Provisioning Server installed on both Windows and Solaris.
Add Account Summary Table
Time for action (seconds) vs Numbers of Concurrent Operations Windows
Threads 1 10 20 30
12GA N16 1.94 16.10 35.97 50.90
12.5 N16 1.85 18.65 36.40 52.52
12GA SQL 0.26 0.8 1.45 2.15
12.5 SQL 0.1 0.67 1.29 1.94
12GA ADS 1.03 1.13 1.95 2.76
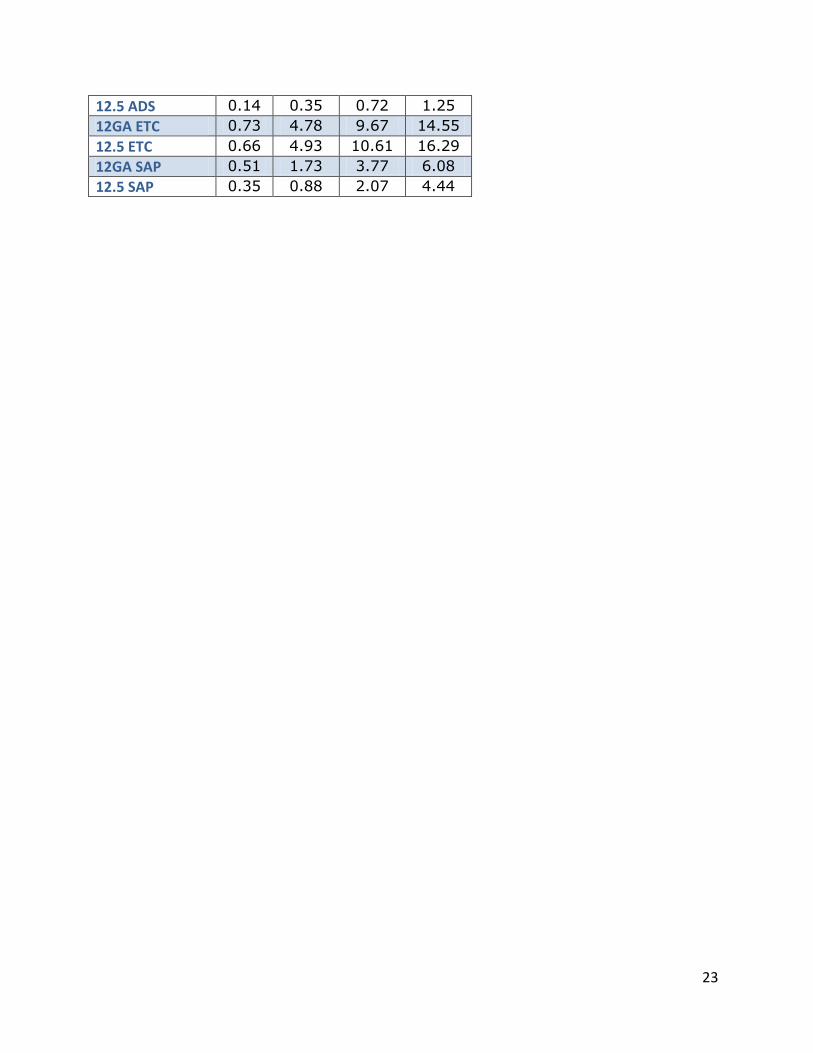
23
12.5 ADS 0.14 0.35 0.72 1.25
12GA ETC 0.73 4.78 9.67 14.55
12.5 ETC 0.66 4.93 10.61 16.29
12GA SAP 0.51 1.73 3.77 6.08
12.5 SAP 0.35 0.88 2.07 4.44

24
Solaris
Threads 1 10 20 30
12GA N16 1.82 15.56 36.00 51.03
12.5 N16 1.91 18.58 36.74 52.50
12GA SQL 0.33 0.89 1.52 2.13
12.5 SQL 0.13 0.77 1.51 1.85
12GA ADS 1.12 1.33 2.36 3.41
12.5 ADS 0.21 0.7 1.48 2.44
12GA ETC 0.77 4.86 9.67 14.43
12.5 ETC 0.68 5 10.68 16.53
12GA SAP 0.48 1.92 4.31 5.71
12.5 SAP 0.29 0.95 2.11 3.91
Modify Account Summary Table
Time for action (seconds) vs Numbers of Concurrent Operations Windows
Threads 1 10 20 30
12GA N16 0.91 3.60 7.19 10.75
12.5 N16 0.68 8.73 16.30 22.41
12GA SQL 0.36 1.16 2.06 3.15
12.5 SQL 0.44 0.81 1.63 2.31
12GA ADS 0.24 0.46 1.09 1.84
12.5 ADS 0.15 0.30 0.74 1.23
12GA ETC 0.54 2.46 4.91 7.38
12.5 ETC 0.45 2.65 5.60 8.47
12GA SAP 0.49 1.66 3.73 5.98
12.5 SAP 0.33 0.94 1.77 4.21
Solaris
Threads 1 10 20 30
12GA N16 0.91 3.86 7.10 10.75
12.5 N16 0.78 8.66 16.50 22.69
12GA SQL 0.5 1.33 2.27 3.27
12.5 SQL 0.58 1.21 1.93 2.94
12GA ADS 0.33 0.74 1.48 2.35
12.5 ADS 0.24 0.7 1.81 2.99
12GA ETC 0.68 2.43 5.02 7.45
12.5 ETC 0.56 2.71 5.64 8.54
12GA SAP 0.54 1.86 3.86 6.05
12.5 SAP 0.34 1.33 2.85 5.26

25
Delete Account Summary Table
Time for action (seconds) vs Numbers of Concurrent Operations Windows
Threads 1 10 20 30
12GA N16 3.20 11.28 17.54 24.87
12.5 N16 3.09 10.44 18.56 26.61
12GA SQL 0.34 1.06 1.92 2.94
12.5 SQL 0.16 0.7 1.41 2.38
12GA ADS 0.25 0.43 0.93 1.59
12.5 ADS 0.17 0.30 0.61 1.00
12GA ETC 0.50 2.52 5.22 7.82
12.5 ETC 0.43 2.52 5.56 8.68
12GA SAP 0.57 1.75 3.88 6.62
12.5 SAP 0.38 0.63 1.80 3.54
Solaris
Threads 1 10 20 30
12GA N16 3.08 11.03 18.00 24.89
12.5 N16 2.97 10.53 18.44 26.66
12GA SQL 0.38 1.09 1.94 2.83
12.5 SQL 0.21 0.79 1.46 2.52
12GA ADS 0.30 0.54 1.08 1.72
12.5 ADS 0.25 0.52 1.25 2.03
12GA ETC 0.54 2.71 5.28 7.85
12.5 ETC 0.47 2.62 5.64 8.78
12GA SAP 0.53 1.79 3.94 6.62
12.5 SAP 0.31 1.15 2.4 4.93

26
Appendix C
Detailed Test results for Explore/Correlate Connector Tests
- N16 (Windows Server 2003 SP2) - SQL (MS SQL Server 2005 SP2) - ADS (Windows Server 2003 SP2) - ETC (Solaris 10) - SAP (ECC 5.0, Kernel 6.4)
Correlate
r12 12.5
Performance Improvement
N16 Windows 949 136 598%
N16 Solaris 1148 277 314%
SQL Windows 945 129 633%
SQL Solaris 1032 277 273%
ETC Windows 961 117 721%
ETC Solaris 1074 280 284%
ADS Windows 606 140 333%
ADS Solaris 801 288 178%
SAP Windows 1052 128 722%
SAP Solaris 1134 275 312%
Explore - Low Memory Algorithm
r12 12.5
Performance Improvement
N16 Windows 331 244 36%
N16 Solaris 432 274 58%
SQL Windows 418 253 65%
SQL Solaris 626 331 89%
ETC Windows 438 346 27%
ETC Solaris 536 404 33%
ADS Windows 357 204 75%
ADS Solaris 390 287 36%
SAP Windows 387 276 40%
SAP Solaris 466 322 45%
27
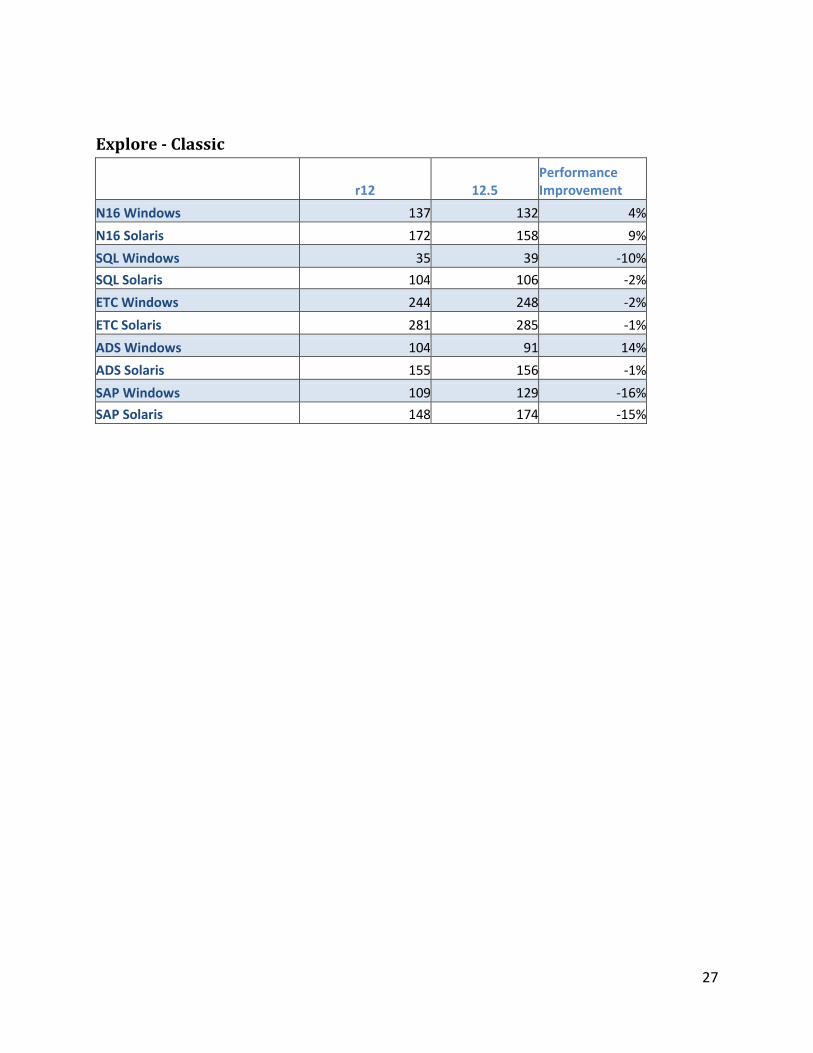
Explore - Classic
r12 12.5
Performance Improvement
N16 Windows 137 132 4%
N16 Solaris 172 158 9%
SQL Windows 35 39 -10%
SQL Solaris 104 106 -2%
ETC Windows 244 248 -2%
ETC Solaris 281 285 -1%
ADS Windows 104 91 14%
ADS Solaris 155 156 -1%
SAP Windows 109 129 -16%
SAP Solaris 148 174 -15%