Embed Size (px)
Citation preview

i
R.V. COLLEGE OF ENGINEERING, BANGALORE-
560059
(Autonomous Institution Affiliated to VTU, Belgaum)
PERFORMANCE STUDIES ON STONE MATRIX
ASPHALT WITH RECYCLED ASPHALT
PAVEMENT
PROJECT REPORT
Submitted by
Swathi L Gowda 1RV10CV033
Deepashree S 1RV11CV400
Souradip Datta 1RV10CV036
Under the Guidance of
Mr. Varuna M
Asst. Professor
Dept. of Civil,
RVCE
in partial fulfilment for the award of degree
of
Bachelor of Engineering
IN
DEPARTMENT OF CIVIL ENGINEERING
JAN – MAY 2014

ii
R.V. COLLEGE OF ENGINEERING, BANGALORE - 560059
(Autonomous Institution Affiliated to VTU, Belgaum)
DEPARTMENT OF CIVIL ENGINEERING
CERTIFICATE
Certified that the project work titled ‘Performance Studies on Stone Matrix
Asphalt with Recycled Asphalt Pavement’ is carried out by Swathi L Gowda
(1RV10CV033), Deepashree S (1RV11CV400), Souradip Datta(1RV10CV036), who are bonafide students of R.V. College of Engineering, Bangalore, in partial
fulfilment for the award of degree of Bachelor of Engineering in Civil Engineering
of the Visvesvaraya Technological University, Belgaum during the year 2013-2014. It
is certified that all corrections/suggestions indicated for the internal assessment have
been incorporated in the report deposited in the departmental library. The project
report has been approved as it satisfies the academic requirements in respect of
project work prescribed by the institution for the said degree.
Mr. Varuna M, Dr. B S Satyanarayana,
Assistant Professor Principal
Dept. of Civil, RVCE RVCE, Bangalore

iii
R.VCOLLEGE OF ENGINEERING, BANGALORE - 560059
(Autonomous Institution Affiliated to VTU, Belgaum)
DEPARTMENT OF CIVIL ENGINEERING
DECLARATION
We, Swathi L Gowda (1RV10CV033), Deepashree S (1RV11CV400), Souradip
Datta(1RV10CV036), students of eighth semester B.E., Civil Engineering, hereby
declare that the project titled “Performance Studies on Stone Matrix Asphalt with
Recycled Asphalt Pavement” has been carried out by us and submitted in partial
fulfillment for the award of degree of Bachelor of Engineering in Civil. We do
declare that this work is not carried out by any other students for the award of degree
in any other branch.
Place: Bangalore Signature
Date: 02/06/2014 1. Swathi L Gowda
2. Deepashree S
3. Souradip Datta

iv
ACKNOWLEDGEMENT
We express our sincere regards and heartfelt gratitude to Mr. Varuna M, Assistant
Professor , Department of Civil Engineering, RVCE under whose guidance this study
was planned, executed and completed. His encouragement, interest and ideas were
source of inspiration and motivation for successful completion of this work.
We are grateful toDr.B.C.Udayashankar, Professor and Head, Department of Civil
Engineering, RVCE for encouraging the project.
We are grateful to our honorable Principal,Dr.B.S.Satyanarayana for giving us the
permission to conduct this project.
We are grateful to P.V.Srinath, Professor, Department of Civil Engineering, RVCE
and K Jagadish, Associate Professor, Department of Civil Engineering, RVCE for
providing valuable inputs for the projects.
We are deeply indebted to all the faculty members of Department of Civil
Engineering, RVCE for their knowledge advice and encouragement throughout the
course of study.
We are grateful to Mr. Shivaprakash for helping in conducting important
experimental works.
We are also grateful to our parents, our family members and all our friends for their
timely support and encouragement throughout the project.
.
v
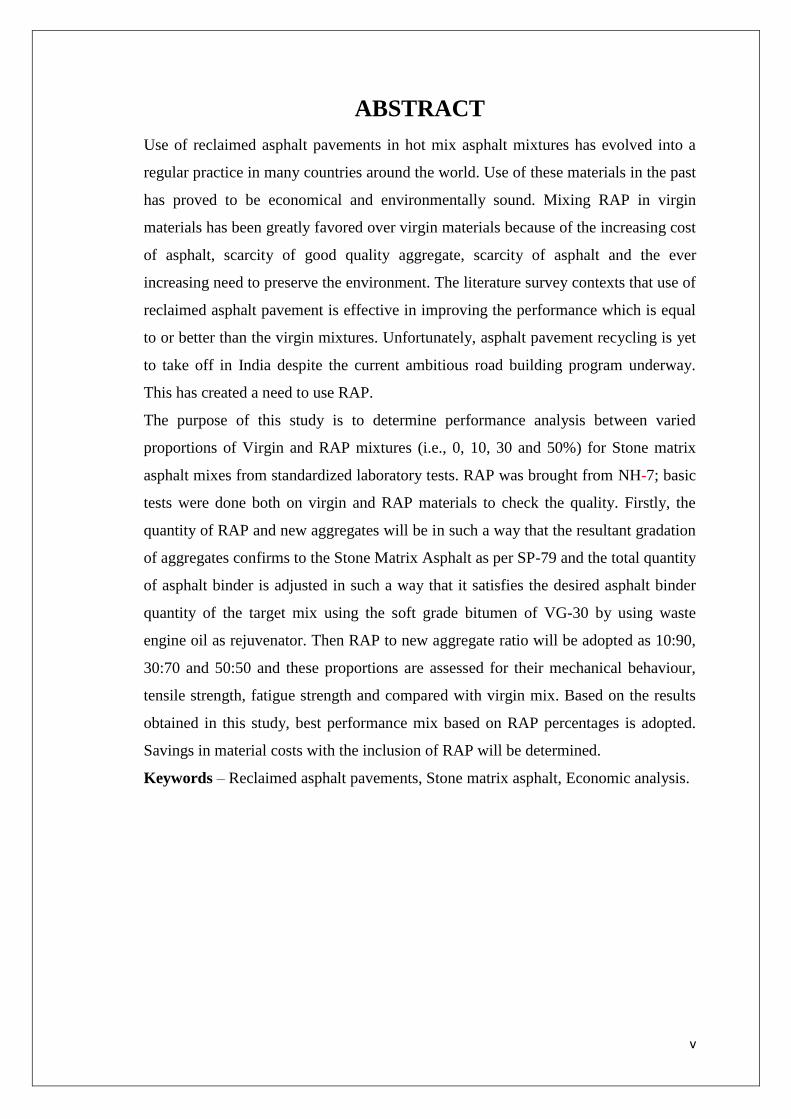
ABSTRACT
Use of reclaimed asphalt pavements in hot mix asphalt mixtures has evolved into a
regular practice in many countries around the world. Use of these materials in the past
has proved to be economical and environmentally sound. Mixing RAP in virgin
materials has been greatly favored over virgin materials because of the increasing cost
of asphalt, scarcity of good quality aggregate, scarcity of asphalt and the ever
increasing need to preserve the environment. The literature survey contexts that use of
reclaimed asphalt pavement is effective in improving the performance which is equal
to or better than the virgin mixtures. Unfortunately, asphalt pavement recycling is yet
to take off in India despite the current ambitious road building program underway.
This has created a need to use RAP.
The purpose of this study is to determine performance analysis between varied
proportions of Virgin and RAP mixtures (i.e., 0, 10, 30 and 50%) for Stone matrix
asphalt mixes from standardized laboratory tests. RAP was brought from NH-7; basic
tests were done both on virgin and RAP materials to check the quality. Firstly, the
quantity of RAP and new aggregates will be in such a way that the resultant gradation
of aggregates confirms to the Stone Matrix Asphalt as per SP-79 and the total quantity
of asphalt binder is adjusted in such a way that it satisfies the desired asphalt binder
quantity of the target mix using the soft grade bitumen of VG-30 by using waste
engine oil as rejuvenator. Then RAP to new aggregate ratio will be adopted as 10:90,
30:70 and 50:50 and these proportions are assessed for their mechanical behaviour,
tensile strength, fatigue strength and compared with virgin mix. Based on the results
obtained in this study, best performance mix based on RAP percentages is adopted.
Savings in material costs with the inclusion of RAP will be determined.
Keywords – Reclaimed asphalt pavements, Stone matrix asphalt, Economic analysis.

vi
TABLE OF CONTENTS
Abstract v
List of Symbols, Acronyms and Nomenclature viii
List of Tables ix
List of Figures xi
1. Introduction 1
1.1 Background 1
1.2 Introduction 2
1.3 Literature Review 2
1.4 Benefits of asphalt recycling 4
1.5 Motivation 5
1.6 Objectives 5
1.7 Methodology 5
1.8 Organization of the Report 6
2. Theory and concepts 6
2.1 General 7
2.2 Methods of recycling pavements 7
2.2.1 Hot in place recycling 7
2.2.2 Cold recycling 8
2..2.3 Full depth reclamation 9
2.2.4 Hot mix recycling 10
2.3 Blending of recycled asphalt pavements 11
2.4 Gradation of recycled asphalt pavements 11
2.5 Mix design 12
2.6 Characteristics of RAP material 12
2.7 Stone matrix asphalt 12
2.8 Advantages of SMA 13
3. Methodology of mix design 14
3.1 Marshall method of mix design 14

vii
3.1.1 Individual gradation of aggregates 15
3.1.2 RAP replacement 16
3.1.3 Specimen preparation 16
3.2 Preparation of graphical plots 17
3.2.1 Relation between Bulk Density and Binder Content 18
3.2.2 Relation between Air Voids and Binder Content 18
3.2.3 Relation between VFB and Binder Content 18
3.2.4 Relation between Stability and Binder Content 18
3.2.5 Relation between Flow and Binder Content: 18
3.3 Selection of OBC 19
3.4 Selection of optimum RAP percentage 19
3.5 Indirect tensile test 19
4. Results
4.1 Tables and Graphs 21
4.2 Economic analysis 33
4.3 Conclusions 35
4.4 Scope for further studies 35
References 36

viii
LIST OF SYMBOLS, ACRONYMS AND
NOMENCLATURE
NHDP National Highway Development Program
SMA Stone Matrix Asphalt
RAP Reclaimed Asphalt Pavement
HMA Hot Mix Asphalt
RTS Retained Tensile Strength
ITS Indirect Tensile Strength
FDR Full Depth Reclamation
OGA Open Grade Asphalt
VFB Voids Filled With Bitumen
VMA Voids In Mineral Aggregates

ix
Table No. LIST OF TABLES Page
No.
Table 3.1 Individual gradation of aggregates 15
Table 3.2 Weight of virgin aggregates for 100% virgin specimen 15
Table 3.3 For RAP replacement 16
Table 3.4 Tests on virgin bitumen 21
Table 3.5 Tests on virgin aggregates 21
Table 3.6 Bitumen extraction and grading 21
Table 3.7 Tests on RAP bitumen 22
Table 3.8 Tests on RAP aggregates 22
Table 3.9 Determination of rejuvenating oil content 22
Table 3.10 Marshal Test results for virgin specimens 23
Table 3.11 Marshall test results for 10% rap 25
Table 3.12 Marshall Test results for 30% rap 28
Table 3.14 Marshall Test results for 50% rap 33
Table 5.1 Cost for Virgin mix 33

x
Table 5.2 Cost for 10% RAP 34
Table 5.3 Cost for 30% RAP 34
Table 5.4 Cost for 50% RAP 34

xi
LIST OF FIGURES
Figure no. Figure name Page No.
Figure 2.1 Hot in place recycling 8
Figure 2.2 Material deposition 9
Figure 2.3 Rejuvenating pavements 10
Figure 2.4 Asphalt batch plant 11
Figure 2.5 SMA and DGA 13
Figure 3.1 Marshall apparatus 17
Figure 3.2 ITS test 20
Figure 3.3 Bulk density v/s Binder content 23
Figure 3.4 Percentage Air voids v/s Binder content 23
Figure 3.5 Percentage VFB v/s Binder content 24
Figure 3.6 Stability v/s Binder content 25
Figure 3.7 Flow v/s Binder Content. 25
Figure 3.8 Bitumen content vs Bulk density 26
Figure 3.9 Bitumen content vs Voids filled with bitumen 26

xii
Figure 3.10 Bitumen content vs Air voids 27
Figure 3.11 Bitumen content vs Stability 27
Figure 3.12 Bitumen content vs Flow 28
Figure 3.13 Bitumen content vs Bulk density 39
Figure 3.14 Bulk density vs Air voids 29
Figure 3.15 Bulk density vs Stability 29
Figure 3.16 Bitumen content vs Flow 30
Figure 3.17 Bitumen content vs Voids filled with bitumen 30
Figure 3.18 Bitumen content vs Bulk density 31
Figure 3.19 Bitumen content vs Air voids 31
Figure 3.20 Bitumen percentage vs Voids filled with bitumen 32
Figure 3.21 Bitumen percentage vs Flow 32
Figure 3.22 Bitumen percentage vs Stability 32
Figure 3.23 ITS graph 33

Dept. Of Civil,RVCE 2013-2014 Page 1
CHAPTER 1
1. INTRODUCTION
1.1Background:
Road Transport in India accounts for 80% of passenger movement and 65% of freight
movement. With 4.3 million km of roads, India has the second largest road network in the
world. Only 50% of the roads are paved, even the paved length has inadequate design
standards. The current state of our nation’s transportation infrastructure is inadequate, and
many state and city municipalities do not have the funds to rehabilitate their road networks to
improve them to an acceptable level. National Highways Authority of India has prepared
plans involving an outlay of Rs. 2,20,000 crores under National Highways Development
Program (NHDP) and 10,000 km of expressways at a cost of Rs 1,00,000 crores are being
planned in order to develop the road infrastructure and to boost the economy in India. The
eleventh plan investment in roads and bridges is about Rs 2,78,658 crores which is about
13.57 % of total outlay.
The Vision 2020 targets the development of a core network of 40000 kms to serve its
industrial, agriculture and tourism industries. To meet the increasing traffic intensities and the
persistent regional disparities in the accessibility to good quality roads, it has been proposed
to increase the road density from the 1.09 km per sq km to 1.50 km per sq km and up
gradation of existing road network to increase the share of roads with carriage width of 2 lane
and above from the current 10.32% to 55%.
These mega road modernization exposes challenges of various concerns pertaining to
depletion of resources like good soil and aggregates, long lead to get good quality aggregates
and increase in fuel consumption etc, and also the increasing cost for the supply of bitumen,
is dependent on foreign sources, and the energy requirement for processing new materials is
becoming costlier every day.
Recycling of existing bituminous mixes are the only alternatives, through the reuse of
aggregates and bitumen. Recycling of asphalt pavements is one of the effective and proven
rehabilitation processes. Estimated world production of asphalt in 2007 is about 1.6 trillion
metric tons of asphalt was produced worldwide. Out of which Asia produced 495 million

Dept. Of Civil,RVCE 2013-2014 Page 2
metric tons of asphalt, nearly 31 percentage of total production [The asphalt paving industry:
a global perspective second edition 2008].Use of the recycled materials in the road
construction has been favoured over virgin materials in the light of increasing cost of
bitumen, scarcity of good quality aggregates and the priority towards preservation of the
environment. Considering the material and construction cost only, it is estimated that using
recycled materials, saving ranging from 14 to 34% can be achieved.
Due to heavy and continuously moving traffic we find rutting of roads and also their
durability is reduced. To tackle these problems new pavement mix called the Stone Matrix
Asphalt (SMA) was formulated. SMA comprises of large amount of coarse aggregates and
hence there will be more stone-to-stone contact which gives a better network to carry the
traffic load.
1.2 Introduction
In this project we have prepared stone matrix asphalt mixes using a certain percentage of
recycled asphalt materials (10%, 30%, 50% RAP), and made specimens. Later the specimens
were tested for marshal stability, for the mix which showed highest stability Indirect Tensile
Strength was performed and at the end of the project economic analysis was done to
determine the cost saved.
1.3 Literature reviews
Recycling of asphalt pavements is a technology developed to rehabilitate and/or replace
pavement structures suffering from permanent deformation and evident structural damage
[1]. In this context, according to [2], the reclaimed asphalt pavement (RAP) is one of the
most reclaimed materials in the world. The first data documented on the use of RAP for the
construction of new roads date back to 1915 [3]. However, the actual development and rise of
RAP usage occurred in the 1970’s during the oil crisis, when the cost of the asphalt binder (or
asphalt) as well as the aggregate shortages where high near the construction sites [4]. Later,
in 1997, with the Kyoto Protocol adaptation by parties and implementation in 2005, recycling
received major attention and broader application in the road construction industry [5].
Several authors state that diverse methods for recycling of asphalt pavements are suitable
including: hot recycling in plant, hot-recycling "in situ", cold-recycling "in situ", and others
[6, 1, and 7]. Nevertheless, hot recycling is one of the most widely techniques used
nowadays, where virgin materials and RAP are combined indifferent proportions and sizes
[8]. Studies in Europe and the United States have concluded that over 80% of the reclaimed
Dept. Of Civil,RVCE 2013-2014 Page 3
material is reused in the construction of roads, but regulations are still strict allowing
inclusion of RAP in proportions ranging between 5 and 50% for production of new hot mix
asphalt (HMA) mixtures [9].
Studies performed to determine the response of HMA mixtures with RAP replacements
between 0 and 40%and fabricated with different asphalts, have shown the low moisture
damage susceptibility of the new HMA mixtures (i.e., based on retained tensile strength
(RTS) values above 95%; Superpave criteria-ASTM D4867).
Similarly, it was found that the resilient modulus values increase regardless of the tests
temperature (-18, 0, 25,and 32 °C), type of asphalt (PG-46-40, PG-52-34, and PG-58-28), and
addition of RAP (15, 30, and 40%) [10].
According to [2], the incorporation of 40% RAP in HMA mixtures created no modification
on the mixture properties. Conversely, when values higher than 40% were included, the
mixture properties changed drastically.
In general, when higher percentages of RAP were used, evident reductions on the relative
energy loss—computed based on the load-displacement curve determined for the indirect
tensile test—were reported with possible appearance of premature distresses. The latter can
be related to possible moisture damage that may affect the mechanical response (i.e.,
permanent deformation- and fatigue-response) and mixture performance.
Recent researches [1, 8, 11, 12], have established that RAP replacement at proportions above
50% are feasible to produce new HMA mixtures, obtaining satisfactory results in the
mechanical properties. Similar fatigue curves were determined for HMA mixtures fabricated
with low penetration asphalt (13/22) and HMA mixtures with60% RAP replacement.
Likewise, the susceptibility to moisture damage was low (RTS values close to 95%). In
addition, the HMA mixtures with RAP replacement increased in 50% the indirect tensile
strength (ITS) as compared to that of the HMA mixtures fabricated with virgin materials. The
energy dissipated during the ITS testalso increased by 100% in the HMA mixtures with RAP
replacement.
Olard et al. (2008) [13] assessed HMA mixtures with high recycling rates (i.e., >50% RAP
replacement) for warm- and HMA-mixture production and stated that RAP foster positive
environmental impacts, including that it:(i) can be done in an asphalt plant or in-place, (ii)
reuses existing materials thus eliminating disposal problems(saving or diminishing land
requirements in populated countries), (iii) saves costly materials and in some countries rare,

Dept. Of Civil,RVCE 2013-2014 Page 4
hard to find good aggregates, (iv) can correct both asphalt content and aggregate gradation of
an existing HMA mixture, and (v) produces a stable pavement structure at a lower cost than
that associated with conventional methods.
Based on the positive experiences and outcomes from global use of HMA mixtures with RAP
inclusion, it can be inferred that relevant results could be obtained from application of this
technology in developing countries such as India. Similarly, the same concerns rose by the
Kyoto protocol and other global policies with regard to air pollution must be taken into
account to minimize risks on human health and ensure environmental quality.
1.4 Benefits of Asphalt Recycling:
The bituminous pavement rehabilitation alternatives are mainly overlaying, recycling and
reconstruction. In the recycling process the material from deteriorated pavement, known as
recycled asphalt pavement (RAP), is partially or fully reused in fresh construction.
It is important to recognize that asphalt recycling is a powerful method to rehabilitate
pavements. When properly carried out, it has substantial long term economic benefits.
1. Reuse and conservation of non-renewable natural resources.
2. Preservation of the environment and reduction in land filling.
3. Energy conservation.
4. Reduction in user delays during construction.
5. Improved pavement smoothness.
6. Cost saving over traditional rehabilitation methods.
7. Improved pavement physical properties by modification of existing aggregate gradation,
and asphalt binder properties.
8. Conserves aggregate and asphalt, which are very important in areas where aggregate and
asphalt are in short of supply or where haul distances to remote locations are excessively
long.
9. With proper design and construction control of recycled hot mix, the performance of the
recycled pavement is equal to traditional method.

Dept. Of Civil,RVCE 2013-2014 Page 5
1.5 Motivation of Present Study:
In India, about 15,000 tonnes of aggregates are required per kilometre of highway. A
standard project of National Highway Development Project (NHDP) of 60 km road
improvement requires 20 lakh ton of material. In India, mostly the old pavement materials are
dumped into landfills. Landfills have been identified as the largest source of methane caused
by humans. The material costs constitute about 40% of total construction cost of the project.
The construction cost is growing exponentially mainly due to increase in the cost of
materials. Recycling of existing bituminous mixes results in substantial savings through the
reuse of aggregates and bitumen. Use of the recycled materials in the road construction has
been favoured over virgin materials in the light of increasing cost of bitumen, scarcity of
good quality aggregates and the priority towards preservation of the environment. This study
makes an attempt at presenting a comprehensive view of one of such technology called
recycled asphalt pavements. It’s high time that the recycling process need to be implemented
owing to their major advantages over overlaying process. These are today’s burning issues
and have become the purpose of the study.
1.6 Objective
1. To determine the basic engineering properties of the Virgin bitumen and Virgin
aggregate.
2. To determine the basic engineering properties of Reclaimed Aggregate and binder
after extraction and Recovery.
3. To carry out the blending of RAP and Virgin aggregates for 10%, 30%, 50% RAP
content as per MORTH V revision, satisfying SMA gradation.
4. To carry out the mix design for 10%, 30%, 50% reclaimed mixes with virgin mixes
5. To study the influence of reclaimed materials on the stability, tensile strength, and
fatigue life of SMA mix through laboratory experiments.
6. To workout the economics of recycling of bituminous pavement materials.
1.7 Methodology:
The methodology for this study involved the following major tasks: Literature Review,
experimental design and materials selection, laboratory testing program, laboratory test result
Dept. Of Civil,RVCE 2013-2014 Page 6
analysis, Marshall Mix design are carried out for virgin and RAP mixtures as per asphalt
institute (MS-II) concept and MoRT&H. Comparison and evaluation of the Marshall
properties, indirect tensile strength, fatigue life and economic analysis for Virgin asphalt
mixtures and various RAP combined with virgin aggregate mixtures i.e., 20, 30, and 50%
finally conclusions and recommendations for future work are present.
1.8 Organization of Thesis:
Chapter 1 includes the brief introduction to the project, the literature review for the project
along with benefits of asphalt recycling, motivation for the study and objectives of the project
and brief summary of the methodology.
Chapter 2 consists of theory and concepts necessary for the project including various type of
asphalt recycling. Their blending and gradation along with the mix design .It also contains
theory on characteristics of RAP, advantages of SMA.
Chapter 3 consists of the methodologies of various processes conducted during the length of
the project including preparation of specimens, Marshall stability test, ITS test etc.
Chapter 4 consists of results and discussions where the results are tabulated and the graphs
are displayed along with the economic analysis, outcomes and scope for further studies.

Dept. Of Civil,RVCE 2013-2014 Page 7
CHAPTER 2
2. THEORY AND CONCEPTS
2.1 General:
This chapter describes the theory and concepts behind the present study which includes the
concepts of recycled asphalt pavements technology, laboratory principles.
2.2 Methods of Recycling Pavements:
The common types of recycling operations include Warm mix recycling, Hot In-place
Recycling (HIR), Cold In-place Recycling (CIR), and Full Depth Reclamation (FDR).
Among this, hot mix recycling is very commonly used for producing Hot Mix Asphalt
(HMA). Hot in- place and Cold in-place recycling are commonly used for preventive
maintenance operations, whereas full depth reclamation is generally used for rehabilitation
work. Based on the process adopted in recycling of bituminous mixes, the methods can be
classified as central plant recycling and in-situ recycling.
2.2.1 Hot In Place Recycling:
Hot in place recycling has been described as an insitu method that rehabilitates deteriorated
asphalt pavements and thereby minimizes the use of new materials. Basically this process
consists of four steps: (1) Softening of the asphalt pavement surface with heat (2)
Scarification and/or mechanical removal of the surface material (3) Mixing of the material
with recycling agent, asphalt binder, or new mix and (4) Lay down and paving of the

Dept. Of Civil,RVCE 2013-2014 Page 8
reclaimed mix on the pavement surface. The primary purpose of hot in -place recycling is to
correct surface distresses.
Fig 2.1 Hot in place recycling
2.2.2 Cold Recycling:
They can be divided into two main parts-cold in-place recycling and cold milling. Cold
milling is used for obtaining materials for hot mix recycling.
(i) Cold Milling: It is a method of automatically controlling the removal of pavement to a
desired depth using specially designed equipment and restoration of the surface to a specified
grade and slope, devoid of bumps, ruts and/or other imperfection.
The modern cold milling equipment has tungsten carbide teeth fixed on drums, with
adjustable cutting width for a variety of pavements and excellent maneuverability for
different milling situations.
(ii) Cold In-place Recycling (CIR): It is defined as a rehabilitation technique in which the
existing pavement materials are reused insitu. The materials are mixed together without the
application of heat. The reclaimed asphalt pavement material is obtained by milling or
crushing the existing pavement. Fresh aggregate or recycling agent or both are added to the
RAP material, which is subsequently laid and compacted. Cold in place recycling can restore
the original profile of old pavements, eliminate existing wheel ruts, restore the crown and
cross slopes and eliminate pot-holes and rough areas.
Dept. Of Civil,RVCE 2013-2014 Page 9
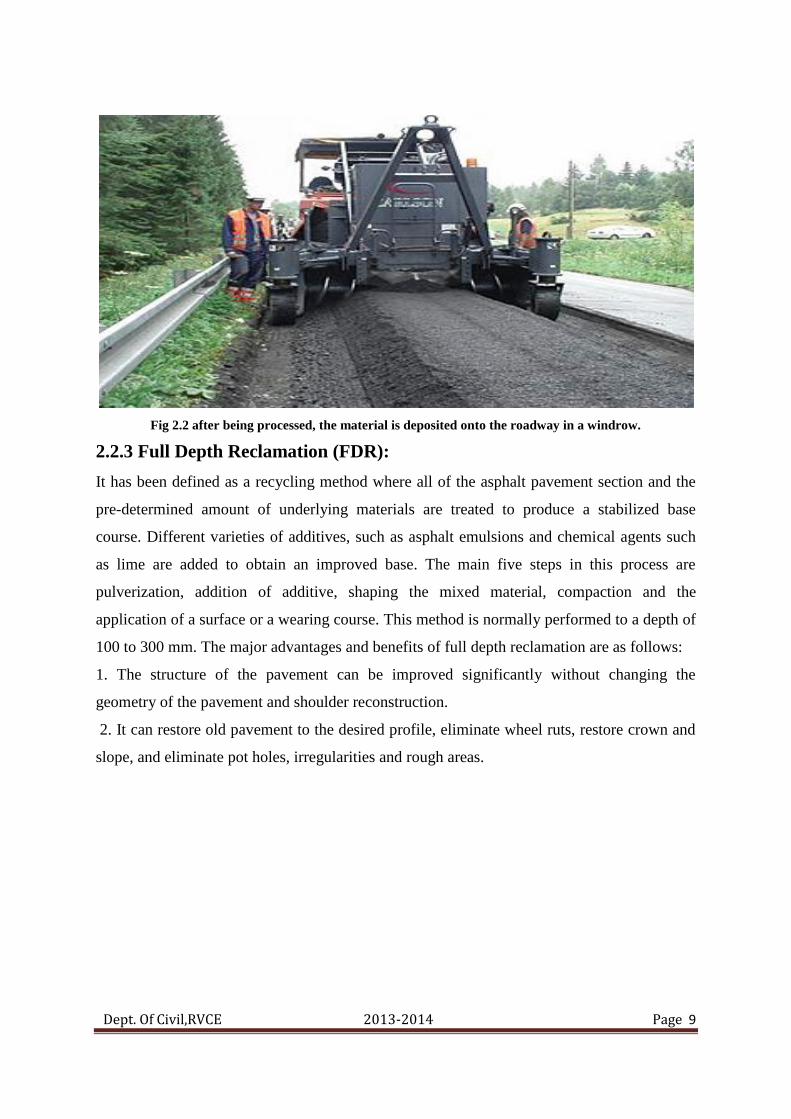
Fig 2.2 after being processed, the material is deposited onto the roadway in a windrow.
2.2.3 Full Depth Reclamation (FDR):
It has been defined as a recycling method where all of the asphalt pavement section and the
pre-determined amount of underlying materials are treated to produce a stabilized base
course. Different varieties of additives, such as asphalt emulsions and chemical agents such
as lime are added to obtain an improved base. The main five steps in this process are
pulverization, addition of additive, shaping the mixed material, compaction and the
application of a surface or a wearing course. This method is normally performed to a depth of
100 to 300 mm. The major advantages and benefits of full depth reclamation are as follows:
1. The structure of the pavement can be improved significantly without changing the
geometry of the pavement and shoulder reconstruction.
2. It can restore old pavement to the desired profile, eliminate wheel ruts, restore crown and
slope, and eliminate pot holes, irregularities and rough areas.

Dept. Of Civil,RVCE 2013-2014 Page 10
Fig 2.3 Rejuvenating existing pavement structure by stabilizing for FDR
2.2.4 Hot Mix Recycling:
It is a method in which RAP is combined with new aggregates and an asphalt cement or
recycling agent to produce HMA. The RAP can be obtained by milling with a rotary drum
cold milling machine.RAP from different sources containing different asphalt contents and
aggregates with different gradations should be stockpiled separately. The RAP cannot be
processed in standard drum mix plant since excessive blue smoke is produced when the RAP
comes in contact with the burner flame. Majority of the smoke problem is caused by the light
oils in soft grades of asphalt binder used to rejuvenate the aged asphalt in the RAP. The
smoke problem could be solved by various processes such as lowering the HMA plant’s
production rate, decreasing the moisture content of the RAP, lowering the discharge
temperature of the reclaimed mix, introducing additional combustion air, and decreasing the
percentage of RAP. Hot mix recycling plant is shown in Figure-2.1.

Dept. Of Civil,RVCE 2013-2014 Page 11
Fig 2.4 Asphalt batch plant with RAP in feed for hot recycling
2.3 Blending Of Recycled Asphalt Pavements:
Although several research studies have reported the use of RAP and its performance in new
asphalt mixtures, none have emphasized the study on how much old asphalt is actually
blended with new mixtures during the mixing process. The studies conducted on a blended
mixture consisting of 20% RAP revealed that only a portion of the aged asphalt participated
in the remixing process while the other portions formed a stiff coating around the RAP
aggregates and RAP behaved as a ―composite black rock. Despite similarities between
producing virgin asphalt mixtures and RAP asphalt mixtures there are challenges for
maximizing RAP usage. Generally the guidelines are based on the assumption that complete
blending occurs between virgin and new mixtures, but later it was understood that the amount
of blending that occurs was somewhere between complete blending and no blending;
however there is no actual methods available to accurately determine the amount of blending
that occurs.
2.4 Gradation of Recycled Asphalt Pavements:
Designing mixes containing RAP requires special attention to ensure minimum Voids in
Mineral Aggregates is met and the aggregate gradation is not significantly altered by the
addition of fines associated with RAP materials. RAP is somewhat finer than virgin
aggregate, therefore it is recommended that RAP used in recycled asphalt should be as coarse
as possible and the fines (< 0.075mm) should be minimized. RAP crushing during production

Dept. Of Civil,RVCE 2013-2014 Page 12
is recommended to minimize the fracture of coarse aggregate and excess fines generation as
high fines content leads to rutting due to low stability. The RAP should be free of foreign
materials such as broken concrete or other contaminants.
2.5 Mix Design:
The basic objective of the recycled mix design is to know the best constituent proportions
between the RAP, virgin binder and new aggregates. The total binder content of the recycled
mix was found out by some preliminary estimation and iterative mix design process done.
The average asphalt binder content of the RAP and the gradation of the old aggregates
present in RAP were found out. The constituent proportions calculated from the equations
were numerically identical to that of calculated as per Asphalt Institute. In the study, the
proportion between the aged and virgin binder, percentage of binder present in RAP and the
percentage of total binder demand of the recycled mix were known. From this percentage of
virgin bitumen and RAP to be added to obtain the recycled mix was estimated.
2.6 Characteristics of Rap Material:
The important characteristic of RAP material that would greatly influence the properties and
performance of the reclaimed mix is the stiffness of its binder. The recovered RAP binder is
more viscous and has lower penetration values than virgin binders due to ageing. The effects
of ageing are caused by chemical changes within the binder. Asphalt bituminous binder
exhibits two stages of ageing namely, short term and long term.
2.7 Stone Matrix Asphalt
Stone mastic asphalt (SMA), also called stone-matrix asphalt, was developed in Europe
(Germany) in the 1960s. It provides a rut resistant, durable surfacing material, suitable for
heavily trafficked roads. SMA has found use in EU, Australia, the United States, and Canada
as a durable asphalt surfacing option for residential streets and highways. SMA has a high
coarse aggregate content that interlocks to form a skeleton that resists
permanent deformation. The stone skeleton is filled with a mastic of bitumen and filler to
which fibres are added to provide adequate stability of bitumen and to prevent drainage of
binder during transport and placement. Typical SMA composition consists of 70−80% coarse
aggregate, 8−12% filler, 6.0−7.0% binder, and 0.3 per cent fibre.

Dept. Of Civil,RVCE 2013-2014 Page 13
Fig 2.5 Stone Matrix Asphalt and Dense Graded Asphalt
2.8 Advantages of Stone Matrix Asphalt
1. SMA provides a durable and rut resistant wearing course.
2. The surface texture characteristics of SMA are similar to Open Graded Asphalt
(OGA) so that the noise generated by traffic is lower than that on DGA but equal to or
slightly higher than OGA.
3. SMA can be produced and compacted with the same plant and equipment available
for normal hot mix, using the above mentioned procedure modifications.
4. SMA may be used at intersections and other high traffic stress situations where OGA
is unsuitable.
5. SMA surfacing may provide reduced reflection cracking from underlying cracked
pavements due to the flexible mastic.

Dept. Of Civil,RVCE 2013-2014 Page 14
CHAPTER 3
3. METHODOLOGY OF MIX DESIGN
3.1 Marshall Method of Mix Design:
In this stage, the bitumen and aggregate quantities to fulfill the gradation and volumetric
requirements of reclaimed mix will be determined for SMA. The mix design was carried out
in two phases. The first phase concentrates on the mix design of virgin materials as per mid
gradation method by Marshall Mix design method. In the later phase, the virgin materials
were blended with RAP of different proportions to meet the graduation requirement of the
mix SMA.
The step by step procedure has been carried out as indicated in the design procedure and the
steps involved are
1. Individual gradation of aggregate
2. RAP replacement
3. Specimen preparation
4. Specimen testing

Dept. Of Civil,RVCE 2013-2014 Page 15
3.1 .1 Individual Gradation Of Aggregates :
Table 3.1
In our project we are preparing specimens for binder course.
Table 3.2 weight of virgin aggregates for 100% virgin specimen
IS Sieve (mm) Cumulative %
by weight of
total aggregate
passing
Passing at mid
point gradation
Total virgin
aggregate %
Total weight of
aggregates in
gm
26.5-19 100 100 0 0
19-13.2 90-100 95 5 60
13.2-9.5 45-70 57.5 37.5 450
9.5-4.75 25-60 42.5 15 180
4.75-2.36 20-28 24 18.5 222
2.36-1.18 16-24 20 4 48
1.18-0.6 13-21 17 3 36
0.6-0.3 12-18 15 3 36
0.3-0.075 10-20 15 3 36
0.075 8-12 10 4 48

Dept. Of Civil,RVCE 2013-2014 Page 16
3.1.2 RAP Replacement:
Table 3.3 For RAP replacement
10% RAP 30% RAP 50% RAP
Wt of virgin
aggregates
in gms
Wt of RAP
aggregates
in gms
Wt of virgin
aggregates
in gms
Wt of RAP
aggregates
in gms
Wt of virgin
aggregates
in gms
Wt of RAP
aggregates in gms
0 0 0 0 0 0
56.4 3.6 42 18 49.2 10.8
411.6 38.4 258 192 334.8 115.2
163.2 16.8 96 84 129.6 50.4
190.8 31.2 66 156 128.4 93.6
39.6 8.4 6 42 22.8 25.2
33.4 2.4 24 12 28.8 7.2
33 2.4 24 12 28.8 7.2
31.2 4.8 12 24 21.6 14.4
45.5 2.4 36 12 40.8 7.2
3.1.3 Specimen Preparation
Stone matrix asphalt mix samples were prepared by using 50 blows of Marshall hammer on
each face at different percentages of binder content varying from 5 to 6.5 progressing in 0.5%
increment. Three specimens were cast for each binder content they are then tested for
Marshall properties such as density, stability, flow, air voids, voids filled with bitumen
(VFB), voids in mineral aggregate (VMA).
Approximately 1200gm of aggregates and filler is heated to a temperature of 175-190oC.
Bitumen is heated to a temperature of 121-125oC with the first trial percentage of bitumen
(say 5.5 or 6% by weight of the mineral aggregates). The heated aggregates and bitumen are
thoroughly mixed at a temperature of 154-160oC. The mix is placed in a preheated mould and
compacted by a rammer with 50 blows on either side at temperature of 138oC to 149oC. The
weight of mixed aggregates taken for the preparation of the specimen may be suitably altered
to obtain a compacted thickness of 63.5+/-3 mm. Vary the bitumen content in the next trial
Dept. Of Civil,RVCE 2013-2014 Page 17
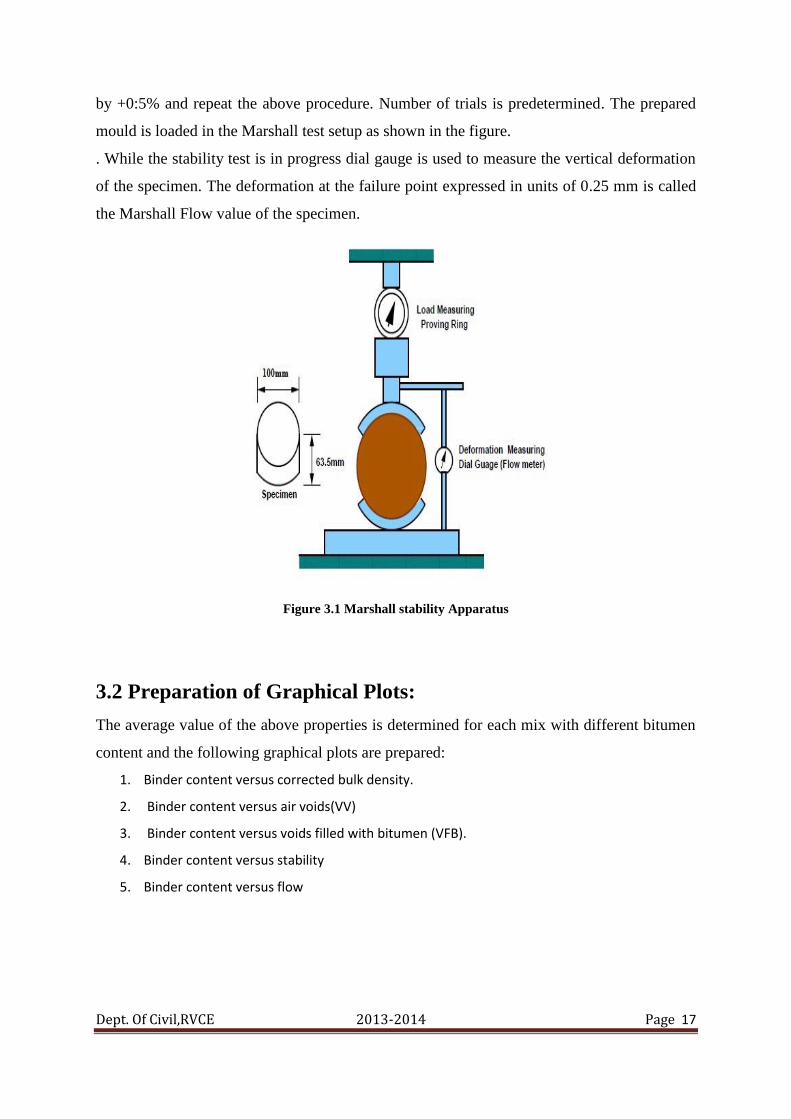
by +0:5% and repeat the above procedure. Number of trials is predetermined. The prepared
mould is loaded in the Marshall test setup as shown in the figure.
. While the stability test is in progress dial gauge is used to measure the vertical deformation
of the specimen. The deformation at the failure point expressed in units of 0.25 mm is called
the Marshall Flow value of the specimen.
Figure 3.1 Marshall stability Apparatus
3.2 Preparation of Graphical Plots:
The average value of the above properties is determined for each mix with different bitumen
content and the following graphical plots are prepared:
1. Binder content versus corrected bulk density.
2. Binder content versus air voids(VV)
3. Binder content versus voids filled with bitumen (VFB).
4. Binder content versus stability
5. Binder content versus flow

Dept. Of Civil,RVCE 2013-2014 Page 18
3.2.1 Relation between Bulk Density and Binder Content:
Relation between bulk density and binder content for virgin bitumen (VG-30) is as shown in
the graph.
The variation of Bulk density with increase in the binder content is as shown in the Figure.
As the binder content increases density also increases up to a certain binder content and
reaches a maximum point then it decreases on further increase in the binder content.
3.2.2 Relation between Air Voids and Binder Content:
Relation between air voids and binder content for virgin bitumen (VG-30) is as shown in the
graph.
The graph of Air Voids in the Aggregate and the binder content is as shown in the figure.
With the increase in bitumen content, VV of Marshall sample decreases, as bitumen replaces
the air voids present in the mix.
3.2.3 Relation between VFB and Binder Content:
Relation between voids filled with bitumen and binder content for virgin bitumen (VG-30) is
as shown in the figure.
The graph of Voids Filled with Bitumen and the binder content is as shown in the figure.
With the increase in bitumen content, VV of Marshall sample decreases, as bitumen replaces
the air voids present in the mix and subsequently VFB increases with the increase in the
bitumen content.
.
3.2.4 Relation between Stability and Binder Content:
Relation between stability and binder content for virgin bitumen (VG-30) is as shown in the
figure.
The variation of the stability with the binder content is as shown in the figure.
Stability value increases with the increase in the bitumen content, as the aggregate-bitumen
bond gradually gets stronger. But with further increase in the bitumen content, the applied
load is transmitted as hydrostatic pressure, keeping the friction across the contact points of
aggregates immobilized. This makes the mix weak against plastic deformation and the
stability falls.
3.2.5. Relation between Flow and Binder Content:
Relation between flow and binder content for virgin bitumen (VG-30) is as shown in the
figure.
Dept. Of Civil,RVCE 2013-2014 Page 19
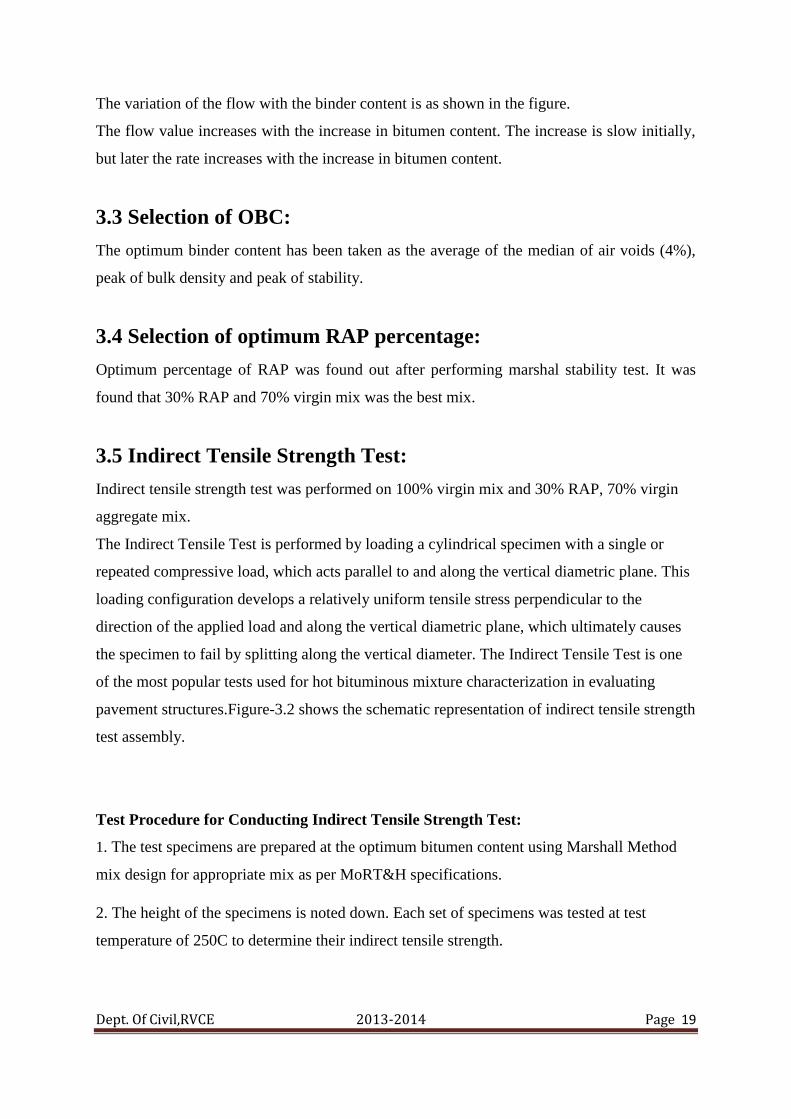
The variation of the flow with the binder content is as shown in the figure.
The flow value increases with the increase in bitumen content. The increase is slow initially,
but later the rate increases with the increase in bitumen content.
3.3 Selection of OBC:
The optimum binder content has been taken as the average of the median of air voids (4%),
peak of bulk density and peak of stability.
3.4 Selection of optimum RAP percentage:
Optimum percentage of RAP was found out after performing marshal stability test. It was
found that 30% RAP and 70% virgin mix was the best mix.
3.5 Indirect Tensile Strength Test:
Indirect tensile strength test was performed on 100% virgin mix and 30% RAP, 70% virgin
aggregate mix.
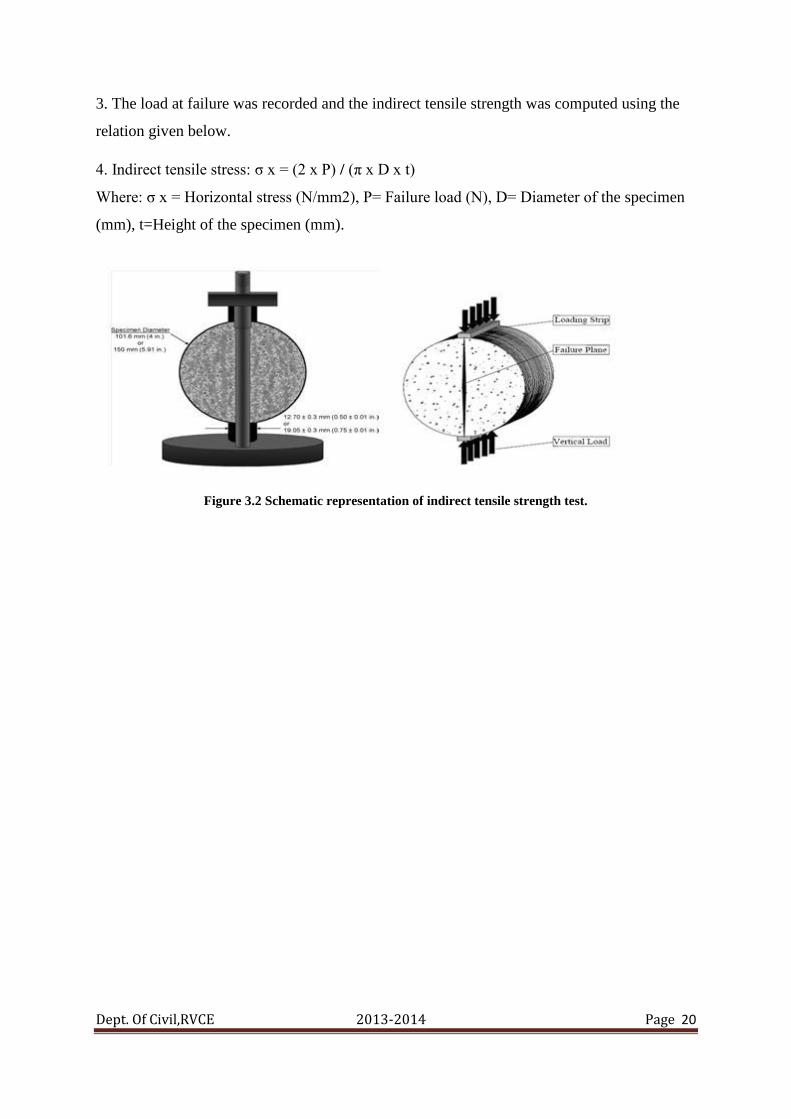
The Indirect Tensile Test is performed by loading a cylindrical specimen with a single or
repeated compressive load, which acts parallel to and along the vertical diametric plane. This
loading configuration develops a relatively uniform tensile stress perpendicular to the
direction of the applied load and along the vertical diametric plane, which ultimately causes
the specimen to fail by splitting along the vertical diameter. The Indirect Tensile Test is one
of the most popular tests used for hot bituminous mixture characterization in evaluating
pavement structures.Figure-3.2 shows the schematic representation of indirect tensile strength
test assembly.
Test Procedure for Conducting Indirect Tensile Strength Test:
1. The test specimens are prepared at the optimum bitumen content using Marshall Method
mix design for appropriate mix as per MoRT&H specifications.
2. The height of the specimens is noted down. Each set of specimens was tested at test
temperature of 250C to determine their indirect tensile strength.
Dept. Of Civil,RVCE 2013-2014 Page 20
3. The load at failure was recorded and the indirect tensile strength was computed using the
relation given below.
4. Indirect tensile stress: σ x = (2 x P) / (π x D x t)
Where: σ x = Horizontal stress (N/mm2), P= Failure load (N), D= Diameter of the specimen
(mm), t=Height of the specimen (mm).
Figure 3.2 Schematic representation of indirect tensile strength test.

Dept. Of Civil,RVCE 2013-2014 Page 21
CHAPTER 4
4. RESULTS
Table 3.4 Tests on virgin bitumen
Properties Obtained value Permissible
Limit Specification
Penetration at
25°c,5sec 65 60-70 IS -1203:1978
Softening
point(R&B),°C 53 45-55 IS -1205:1978
Flash point, °C 235 175 min. IS -1448:1969
Specific gravity 1.01 0.99 min. IS -1202:1978
Table 3.5 Tests on virgin aggregates
Sl.no Properties Conventional
aggregate
Requirements as per table
500-14MORT&H(IV)
specifications
1 Aggregate impact value(%) 17.6 Max 27%
2 Aggregate crushing value(%) 24.9 Max 30%
3 Water absorption of aggregates(%) 0.55 Max 2%
4 Specific gravity of aggregate 2.5 2.5-3
5 Flakiness and elongation index
(combined index)
28.7 Max 30%
From the tests performed on virgin bitumen and virgin aggregates, we can conclude that the
they are suitable for usage since they confirm to the standard specifications.
Table 3.6 Bitumen extraction and grading
Sl. no Weight of RAP in kg Bitumen obtained in
g
Percentage bitumen
1 1 39.7 3.97
2 1.5 55.2 3.68

Dept. Of Civil,RVCE 2013-2014 Page 22
Hence, the total quantity of bitumen in the RAP used is 3.825% Table 3.7 Tests on RAP bitumen
Sl.no properties Rap binder PERMISSIBLE
LIMIT
1 penetration value of bitumen
@25 0C
45 60-70
2 softening point 0C 48 45-55
From the above table, we can conclude that the recycled binder has lost its properties due to
aging and hence has to be rejuvenated.
Table 3.8 Tests on RAP aggregates
The RAP aggregates hence confirm to the MORTH requirements.
Table 3.9 Determination of rejuvenating oil content
Sl. No. Percentage rejuvenating oil Penetration value
1 0 43
2 0.05 64
3 0.1 83
The virgin binder used is of grade 60/70 and hence the penetration value has to be between
60 and 70. Thus, the optimum percentage of rejuvenating oil would be 0.05%.
Sl.no Properties Conventional
aggregate
Requirements as per table
500-14MORT&H(IV)
specifications
1 Aggregate impact value(%) 19 Max 27%
2 Water absorption of
aggregates(%)
0.3 Max 2%
3 Specific gravity of
aggregate
2.4 2.5-3
4 Flakiness and elongation
index (combined index)
25 Max 30%

Dept. Of Civil,RVCE 2013-2014 Page 23
Table 3.10 Marshal Test results for virgin specimens
Bitumen
%
Wt. in
air(g)
Wt. in
water(g)
Bulk
density
(g/cc)
Theore
tical
density
(g/cc)
Vv% Vb% VMA
%
VFB Stability(
kN)
Flow
5 1260 720 2.333 2.461 5.184 11.905 17.089 69.665 30.799
3.35
5 1265 720 2.321 2.461 5.681 11.842 17.523 67.580 29.054 3.28
5 1265 715 2.300 2.461 6.538 11.735 18.273 64.218 29.015 4.2
5.5 1255 722 2.355 2.443 3.635 13.215 16.849 78.428 33.010 4.52
5.5 1265 725 2.343 2.443 4.126 13.147 17.273 76.114 31.799 4.3
5.5 1272 728 2.338 2.443 4.304 13.123 17.427 75.301 32.520 4.7
6 1255 725 2.368 2.426 2.407 14.497 16.904 85.763 35.000 5.4
6 1260 729 2.373 2.426 2.202 14.528 16.730 86.836 38.200 5.1
6 1260 730 2.377 2.426 2.018 14.555 16.573 87.825 37.700 5.2
6.5 1269 732 2.363 2.410 1.929 15.674 17.603 89.040 31.360 7.8
6.5 1275 735 2.361 2.410 2.013 15.660 17.674 88.609 33.390 7.2
6.5 1282 735 2.344 2.410 2.736 15.545 18.281 85.034 29.370 7.6
Figure 3.3: Bulk density v/s Binder content
Figure 3.4 Percentage Air voids v/s Binder content
2.200
2.250
2.300
2.350
2.400
2.450
2.500
4.5 5 5.5 6 6.5 7
bd 1
bd2
bd 3
bitumen %
bu
lk d
ensi
ty g
m/c
c
0.000
1.000
2.000
3.000
4.000
5.000
6.000
7.000
4.5 5 5.5 6 6.5 7
VV
VV2
VV3
air
void
s %

Dept. Of Civil,RVCE 2013-2014 Page 24
Figure 3.5 Percentage VFB v/s Binder content
Figure 3.6 Stability v/s Binder content
Figure 3.7: Flow v/s Binder Content.
60.000
65.000
70.000
75.000
80.000
85.000
90.000
4 4.5 5 5.5 6 6.5 7
vfb1
vfb2
vfb3VF
B%
25.000
28.000
31.000
34.000
37.000
40.000
4.5 5 5.5 6 6.5 7
stability1
stability2
stability3
stab
ilit
yK
N
3
4
5
6
7
8
4 4.5 5 5.5 6 6.5 7
flow1
flow2
flow3flo
w m
m

Dept. Of Civil,RVCE 2013-2014 Page 25
Table 3.11 Marshall test results for 10% rap
Bitu
men
%
Wt. in
air(g)
Wt. in
water(g
)
Bulk
density(
g/cc)
Theor
etical
densit
y(g/cc
)
Vv
%
Vb% VM
A%
VFB
%
Stabilit
y(kN)
Flo
w
5 1253 701
2.2706
2.511
2.445
7.1
6
11.2
4
18.
40
61.
08
11.02
3
5.1
5 1260 708 2.283 2.511 9.10 11.30 20.40 55.4
0
11.582 5.3
5 1240 701 2.301 2.511 8.38 11.39 19.77 57.6
0
12.389 5.6
5.5 1243
707 2.319 2.493 6.96 12.63 19.59 64.4
5
12.975 5.8
5.5 1248 710 2.320 2.493 6.94 12.63 19.57 64.5
5
13.715 5.7
5.5 1248 710 2.320 2.493 6.94 12.63 19.57 64.5
5
14.380 6.5
6 1250 715 2.336 2.475 5.58 13.88 19.46 71.3
1
14.727 6.8
6 1255 715 2.324 2.475 6.08 13.81 19.89 69.4
1
15.552 6.9
6 1252 712 2.319 2.475 6.31 13.77 20.08 68.5
9
14.922 7.0
6.5 1252 715 2.310 2.457 5.11 15 20.11 74.6
0
13.756 7.3
6.5 1264 719 2.319 2.457 5.61 14.93 20.53 72.6
9
12.999 7.5
6.5 1261 714 2.305 2.457 6.18 14.84 21.01 70.6
1
11.795 7.5

Dept. Of Civil,RVCE 2013-2014 Page 26
Fig 3.8 Bitumen content vs Bulk density
Fig 3.9 Bitumen content vs Voids filled with bitumen
2.2202.2602.3002.3402.3802.420
4.5 5 5.5 6 6.5 7
Bu
lk d
en
sity
Bitumen percentage
Bitumen content vs Bulk density
BD 1
BD 2
BD 3
45.00
55.00
65.00
75.00
4.5 5 5.5 6 6.5 7
Vo
ids
fille
d w
ith
bit
um
en
Bitumen percentages
Bitumen content vs Voids filled with bitumen
VFB 1
VFB 2
VFB 3

Dept. Of Civil,RVCE 2013-2014 Page 27
Fig 3.10 Bitumen content vs Air voids
Fig 3.11 Bitumen content vs Stability
0.00
2.00
4.00
6.00
8.00
10.00
4 4.5 5 5.5 6 6.5 7
Air
vo
ids
%
Bitumen percentage
Bitumen content vs Air voids
Vv 1
Vv 2
Vv 3
9.000
11.000
13.000
15.000
17.000
4 4.5 5 5.5 6 6.5 7
Stab
ility
Bitumen percentage
Bitumen content vs Stability
stability 1
stability 2
stability 3

Dept. Of Civil,RVCE 2013-2014 Page 28
Fig 3.12 Bitumen content vs Flow
Table 3.12 Marshall Test results for 30% rap
Bitu
men
%
Wt, in
air(g)
Wt. in
water(
g)
Bulk
densit
y
Theore
tical
density
(g/cc)
Vv% Vb% VMA
%
VFB
%
Stability
(kN)
Flo
w
5 12453
704
2.301
2.441
5.73
11.39 17.12 66.5
4
12.3
0
4.
2
5 1243 714 2.350 2.511 6.43 11.63 18.06 64.4
1
13.14 4.9
5 1248 716 2.346 2.511 6.58 11.61 18.19 63.8
3
13.53 5.1
5.5 1248 718 2.355 2.493 5.53 12.82 18.36 69.8
6
13.85 5.8
5.5 1249 719 2.357 2.493 5.46 12.83 18.29 70.1
6
14.43 6.1
5.5 1250 720 2.358 2.493 5.38 12.84 18.22 70.4
7
14.89 6.4
6 1255 724 2.363 2.475 4.49 14.04 18.53 75.7
6
16.48 6.9
6 1261 727 2.361 2.475 4.57 14.038
18.60 75.4
1
17.26 7
6 1254 724 2.366 2.475 4.39 14.06 18.44 76.2
1
17.29 7.3
6.5 1265 729 2.360 2.457 3.95 15.19 19.13 79.3
8
15.90 7.5
6.5 1268 728 2.348 2.457 4.43 15.11 19.54 77.3
3
14.82 7.8
44.5
55.5
66.5
77.5
8
4 4.5 5 5.5 6 6.5 7
Flo
w
Bitumen percentage
Bitumen content vs Flow
FLOW 1
FLOW 2
FLOW 3

Dept. Of Civil,RVCE 2013-2014 Page 29
6.5 1270 730 2.352 2.457 4.28 15.14 19.42 77.9
5
13.98 7.5
Fig. 3.13 Bitumen content vs Bulk density
Fig 3.14 Bulk density vs Air voids
Fig 3.15 Bulk density vs Stability
2.3002.3102.3202.3302.3402.3502.3602.370
4 4.5 5 5.5 6 6.5 7
Bu
lk d
en
sity
Bitumen percentage
Bitumen content vs Bulk density
bd 1
BD 2
BD 3
0.00
2.00
4.00
6.00
8.00
4 4.5 5 5.5 6 6.5 7
Air
vo
ids
pe
rce
nta
ge
Bitumen percentage
Bulk density vs Air voids
Vv 1
Vv 2
Vv 3
8.00
10.00
12.00
14.00
16.00
18.00
20.00
4 4.5 5 5.5 6 6.5 7
Stab
ility
Bitumen percentage
Bulk density vs Stability
Series1
stability 2
stability 3

Dept. Of Civil,RVCE 2013-2014 Page 30
Fig 3.16 Bitumen content vs Flow
Fig 3.17 Bitumen content vs Voids filled with bitumen
Table 3.13 Marshall Test results for 50% rap
Bitu
men
%
Wt,
in
air(
g)
Wt. in
water
(g)
Bulk
densit
y(g/cc
)
Theore
tical
density
(g/cc)
Vv
%
Vb% VMA% VFB% Stabil
ity(k
N)
Flow
5 1
2
4
5
706
2.310
2.445
5.5
3
11.43482
16.9
624
67.4
1272
11
3.1
5 1247 716 2.348 2.511 6.48 11.62574 18.1046 64.21428 11.76 3.5
5 1247 718 2.357 2.511 6.13 11.66969 17.79498 65.57858 12.42 4.2
5.5 1248 720 2.364 2.493 5.18 12.87129 18.04639 71.32333 12.86 4.5
5.5 1249 721 2.366 2.493 5.10 12.8816 17.98072 71.64117 13.63 4.6
0
2
4
6
8
10
4 4.5 5 5.5 6 6.5 7
Flo
w
Bitumen percentage
Bitumen content vs Flow
FLOW 1
FLOW 2
FLOW 3
50.0055.0060.0065.0070.0075.0080.0085.00
4 4.5 5 5.5 6 6.5 7void
s fi
lled
wit
h b
itu
me
n
Bitumen percentage
Bitumen content vs Voids filled with bitumen
VFB 1
VFB 2
VFB 3

Dept. Of Civil,RVCE 2013-2014 Page 31
5.5 1253 724 2.369 2.493 4.98 12.89843 17.87359 72.1647 13.94 5.1
6 1255 725 2.368 2.475 4.31 14.06688 18.37831 76.54066 14.70 5.5
6 1255 726 2.372 2.475 4.13 14.09347 18.22401 77.33461 14.98 5.4
6 1258 728 2.374 2.475 4.08 14.1005 18.1832 77.5469 14.05 5.9
6.5 1260 725 2.355 2.457 4.15 15.15684 19.30344 78.51886 12.96 6.4
6.5 1262 728 2.363 2.457 3.81 15.20933 19.024 79.94813 12.65 7.5
6.5 1265 730 2.400 2.457 3.77 15.21699 18.98322 80.16022 11.98 7.8
Fig 3.18 Bitumen content vs Bulk density
Fig 3.19 Bitumen content vs Air voids
2.300
2.320
2.340
2.360
2.380
4 4.5 5 5.5 6 6.5 7
Bu
lk d
en
sity
Bitumen percentage
Bitumen content vs Bulk density
BD 1
BD 2
BD 3
0.00
1.00
2.00
3.00
4.00
5.00
6.00
7.00
4 4.5 5 5.5 6 6.5 7
Air
vo
ids
pe
rce
nta
ge
Bitumen percentage
Bitumen content vs Air voids
Vv 1
Vv 2
Vv 3

Dept. Of Civil,RVCE 2013-2014 Page 32
Fig 3.20 Bitumen percentage vs Voids filled with bitumen
Fig 3.21 Bitumen percentage vs Flow
Fig 3.22 Bitumen percentage vs Stability
40
50
60
70
80
90
4 4.5 5 5.5 6 6.5 7
Vo
ids
fille
d w
ith
bit
um
en
Bitumen percentage
Bitumen percentage vs Voids filled with bitumen
VFB 1
VFB 2
VFB 3
0
2
4
6
8
10
4 4.5 5 5.5 6 6.5 7
Flo
w
Bitumen percentage
Bitumen percentage vs Flow
flow 1
FLOW 2
FLOW 3
0.00
5.00
10.00
15.00
20.00
4 4.5 5 5.5 6 6.5 7
Stab
ility
Bitumrn percentage
Bitumen percentage vs Stability
stability 1
stability 2
stability 3

Dept. Of Civil,RVCE 2013-2014 Page 33
Table 3.14 ITS test results
TEMP ITS CONV
ITS 30% RAP
25 0.88 0.942
30 0.809 0.9
Fig 3.23 ITS graph
4.2 ECONOMIC ANALYSIS
In the present study an attempt is made to recycle the paving mixes and work out the cost
involved for recycling.
Furtherly, A comparative assessment is made by computing the cost for the conventional as
well as RAP mixes. A typical example for one kilometer length for two lane highway is
considered for cost analysis. The costs are calculated based on the schedule of rates of Govt.
of Karnataka. The details of economic analysis are given below.
Table 5.1 Cost for Virgin mix
Particular
s
Lengt
h
(m)
Widt
h
(m)
Dept
h
(m)
Qty. Of
aggregate
s
(m3)
Qty. Of
Bitume
n
(m3)
Qty. Of
virgin
material
s
(m3)
Rate/m3
Amount(Rs.
)
SMA 1000 7 0.1 700 42 742 9436 7001512
Total
0.8
0.82
0.84
0.86
0.88
0.9
0.92
0.94
0.96
24 26 28 30 32
Stre
ss M
Pa
Temperature
ITSCONVENTIONAL
ITS 30% RAP

Dept. Of Civil,RVCE 2013-2014 Page 34
Table 5.2 Cost for 10% RAP
Particular
s
Lengt
h
(m)
Widt
h
(m)
Dept
h
(m)
Qty. Of
aggregate
s
(m3)
Qty. Of
Bitume
n
(m3)
Qty. Of
virgin
material
s
(m3)
Rate/m3
Amount(Rs.
)
Milling 1000 9 0.1 - - 990 36 35640
SMA 1000 7 0.1 700 42 668 9436 6303248
Total 6338888
Table 5.3 Cost for 30% RAP
Particular
s
Lengt
h
(m)
Widt
h
(m)
Dept
h
(m)
Qty. Of
aggregate
s
(m3)
Qty. Of
Bitume
n
(m3)
Qty. Of
virgin
material
s
(m3)
Rate/m3
Amount(Rs.
)
Milling 1000 9 0.1 - - 990 36 35640
SMA 1000 7 0.1 700 42 520 9436 4906720
Total 4942360
Table 5.4 Cost for 50% RAP
Particular
s
Lengt
h
(m)
Widt
h
(m)
Dept
h
(m)
Qty. Of
aggregate
s
(m3)
Qty. Of
Bitume
n
(m3)
Qty. Of
virgin
material
s
(m3)
Rate/m3
Amount(Rs.
)
Milling 1000 9 0.1 - - 990 36 35640
SMA 1000 7 0.1 700 42 371 9436 3500756
Total 3536396
After analyzing the economic analysis, the percentage of cost saving realized from the
recycled mixes of 10%, 30%, and 50% in comparison with virgin mix(0% RAP) are
19%,30%,51% respectively are found to be reduction in total cost.

Dept. Of Civil,RVCE 2013-2014 Page 35
4.3 Conclusions
• Based on the Marshall properties, the SMA mixes prepared with RAP material of 10,
30, and 50% shows higher stability when compared with the conventional virgin
mixes (0%).
• Based on the Marshall test results, the SMA mixes prepared with RAP materials of
10%, 30% shows all the Marshall properties of the mixes are well within the specified
limit.
• Indirect tensile strength of SMA mixes prepared with RAP materials shows higher
tensile strength at 25ºC when compared with SMA virgin mix.
• The saving can be realized from utilization of recycled materials as per the
methodology, the reduction in the total cost is 10, 30, and 51% comparing with the
virgin mixes.
4.4 Scope for further studies
• In the present study, the various tests were carried out for 0, 20, 30, and 50% RAP
materials. However various other percentages can be evaluated.
• To know the realistic results and performance accurately 100% RAP materials can be
evaluated.
• Various other binders can be used.
• Semi Field test track studies need to be carried out for validating the performance of
the RAP mixes.

Dept. Of Civil,RVCE 2013-2014 Page 36
References: 1. Valdés, G., Pérez-Jiménez, F., Miró, R., Martínez, A., &Botella, R. (2011). Experimental study
of reclaimed asphalt mixtures with high percentages of reclaimed asphalt pavement (RAP). Construction and Building Materials, 25(3), 1289 – 1297
2. Chen, J., Wang, C. & Huang, C. (2009). Engineering properties of bituminous mixtures blended with second reclaimed asphaltpavements (R2AP). Road Materials and Pavement Design, 10, 129 – 149.
3. Taylor, N. (1997). Life expectancy of reclaimed asphalt paving. Recycling of bituminous pavements (L. E. Wood, Ed.). ASTM STP662, 3–15.
4. Sullivan, J. (1996). Pavement recycling executive summary and report. Report FHWA-SA-95-060 from the Federal HighwayAdministration. Washington, D.C.
5. Reyes, O., Pérez, F., Miro, R., &Botella, R. (2009). Proyectofénix. Mezclassemicalientes. Proceedings del XV CongresoIberolatinoamericano del Asfalto. Lisboa, Portugal.
6. Decker, D. (1997). State of the practice for use of RAP in hot mix asphalt. Journal of the Association of Asphalt Paving Technologists,66, 704.
7. Silva, H., Oliviera, J, & Jesus, C. (2012). Are totally reclaimed hot mix asphalts a sustainable alternative for road paving? JournalResources, Conservation and Recycling, 60, 38 - 48.
8. Reyes, O., & Camacho, J. (2012). InformeProyecto ING-730 Estudio del comportamiento de mezclasasfálticascolombianasaladicionarles RAP en diferentesporcentajes y tamaño. Reporte de la Universidad Militar Nueva Granada. Colombia.
9. Mengqi, W., Haifang, W., Muhunthan, B., &Kalehiwot N. (2012). Influence of RAP content on the air void distribution, permeability and moduli of the base layer in reclaimed asphalt pavements. Proceedings of the 91st Transportation Research Board Meeting. TRB 2012.Washington, D.C., USA.
10. Sondag, M., Chadbourn, B., &Drescher, A. (2002). Investigation of reclaimed asphalt pavement (RAP) mixtures. Technical reportMN/RC – 2002-15. Department of Civil Engineering, University of Minnesota. USA.
11. Pereira, P., Oliveira, J, &Picado-Santos, L. (2004). Mechanical characterization of hot mix reclaimed materials. International Journal of Pavement Engineering, 5 (4), 211 - 220.
12. Celauro, C., Bernardo, C., & Gabriele, B. (2010). Production of innovative, reclaimed and high-performance asphalt for road pavements.Journal Resources, Conservation and Recycling, 54 (6), 337 - 347.
13. Olard, F., Noan, C., Bonneau, D., Dupriet, S., & Alvarez, C. (2008). Very high recycling rate (>50%) in hot mix and warm mixasphalts for sustainable road construction. Proceedings of the 4th Eurasphalt and Eurobitume Congress. Copenhagen, Denmark.
14. KanishkaChopra.,SAnjanKumar.,RajibMallickBasu.,Veeraragavan.A.gat(2012).Investigation on laboratory performance of bituminous mixes with reclaimed pavement materials-A step towards sustainable road infrastructure in India.Journal of Indian road congress.
15. Imad L. Al-Qadi, Mostafa A. Elseifi, Samuel H. Carpenter, “Reclaimed Asphalt Pavement – A Literature Review”, Illinois Center for Transportation-FHWA-ICT-07-001, March 2007.
16. Dr. R. Sathikumar and Nivedya M. K, “Reclaimed Asphalt Pavement (RAP) Technology for a Sustainable Pavement”, National Technological Congress conference, Kerala, 2011.
17. K. Aravind, Animesh Das, “Pavement design with central plant hot-mix recycled asphalt mixes”, Construction and Building Materials journals - Indian Institute of Technology Kanpur, July 2006.

Dept. Of Civil,RVCE 2013-2014 Page 37
18. Williams Kehinde Kupolati, et al, “Characterization of Bitumen Extracted from used Asphalt Pavement”, Journal of Civil Engineering Research and Practice, Vol. 7 No.2, October 2010, pp. 39 – 48.
19. Arshad Hussain and Qiu Yanjun, “Evaluation of Asphalt Mixes Containing Reclaimed Asphalt Pavement for Wearing Courses”, International Conference on Traffic and Transportation Engineering, Singapore, 2012.
20. Elie Y. Hajj, et al, “Evaluation of the Use of Reclaimed Asphalt Pavement in Airfield HMA Pavements”, Journal of Transportation Engineering, ASCE, Vol. 136, No. 3, March 2010.
21. Mingjiang Tao, et al, “Simple Procedure to Assess Performance and Cost Benefits of Using Recycled Materials in Pavement Construction”, Journal of Materials in Civil Engineering,ASCE, Vol. 20, No. 11, November 2008.
22. Luis Guilherme de Picado Santos, et al, “Assessment of the Use of Hot-Mix Recycled Asphalt Concrete in Plant”, Journal of Transportation Engineering, Vol. 136,ASCE, No. 12, December 2010.
23. Amir Modarres, et al, “A parametric study on the laboratory fatigue characteristics of recycled mixes”, Construction and Building Materials-Iran, 2011.
24. Audrey Copeland, “Reclaimed Asphalt Pavement in Asphalt Mixtures: State of the Practice”, FHWA-HRT-11-021, April 2011.
25. B. Barra, et al, “Fatigue behavior of dense asphalt mixes in dry and environmental-conditioning states”, Construction and Building Materials journal 29, 2012, pp 128–134.