Embed Size (px)
Citation preview
PERFORMANCE REVIEW
INTERIM REPORT 2016FONTERRA CO-OPERATIVE GROUP LIMITED
INTERIM DIVIDEND PER SHARE
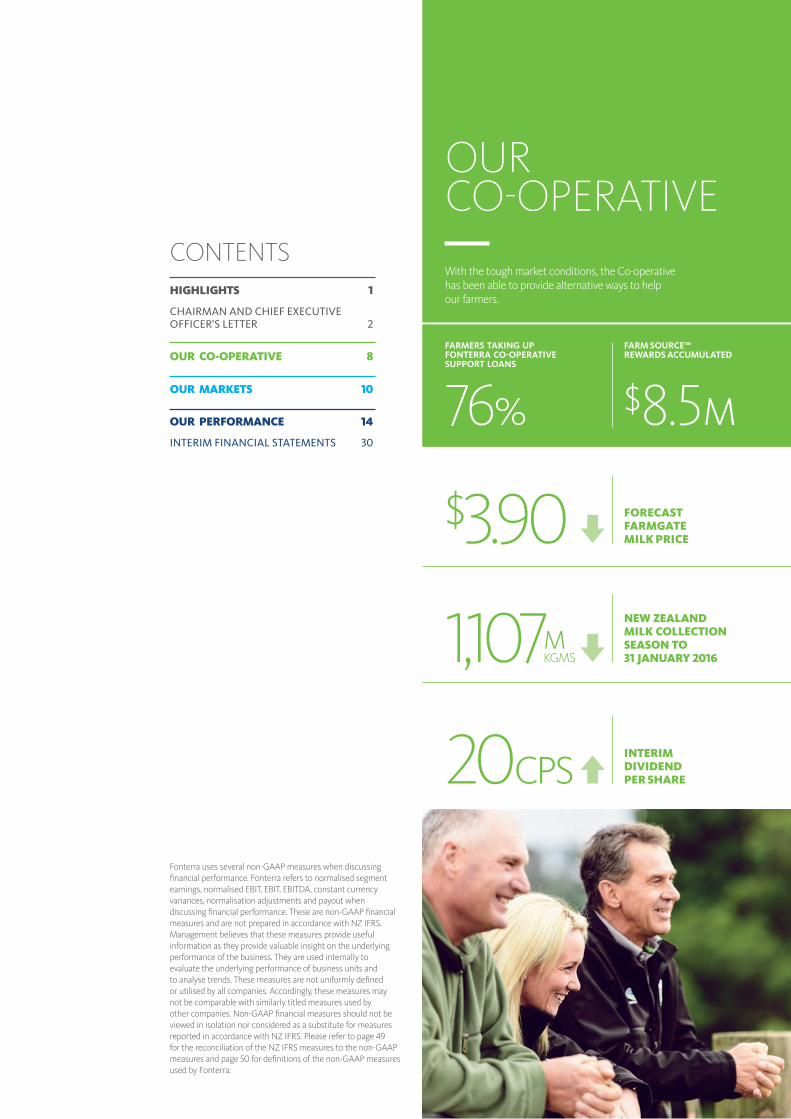
FORECAST FARMGATE MILK PRICE
FARM SOURCE™ REWARDS ACCUMULATED
FARMERS TAKING UP FONTERRA CO-OPERATIVE SUPPORT LOANS
$8.5M 76%
NEW ZEALANDMILK COLLECTION SEASON TO 31 JANUARY 2016
$3.90
20CPS
1,107
OUR CO-OPERATIVE
M KGMS
With the tough market conditions, the Co-operative has been able to provide alternative ways to help our farmers.
Fonterra uses several non-GAAP measures when discussing financial performance. Fonterra refers to normalised segment earnings, normalised EBIT, EBIT, EBITDA, constant currency variances, normalisation adjustments and payout when discussing financial performance. These are non-GAAP financial measures and are not prepared in accordance with NZ IFRS. Management believes that these measures provide useful information as they provide valuable insight on the underlying performance of the business. They are used internally to evaluate the underlying performance of business units and to analyse trends. These measures are not uniformly defined or utilised by all companies. Accordingly, these measures may not be comparable with similarly titled measures used by other companies. Non-GAAP financial measures should not be viewed in isolation nor considered as a substitute for measures reported in accordance with NZ IFRS. Please refer to page 49 for the reconciliation of the NZ IFRS measures to the non-GAAP measures and page 50 for definitions of the non-GAAP measures used by Fonterra.
CHAIRMAN AND CHIEF EXECUTIVE OFFICER’S LETTER 2
HIGHLIGHTS 1
OUR CO-OPERATIVE 8
OUR MARKETS 10
OUR PERFORMANCE 14
INTERIM FINANCIAL STATEMENTS 30
CONTENTS
FONTERRA INTERIM REPORT 2016
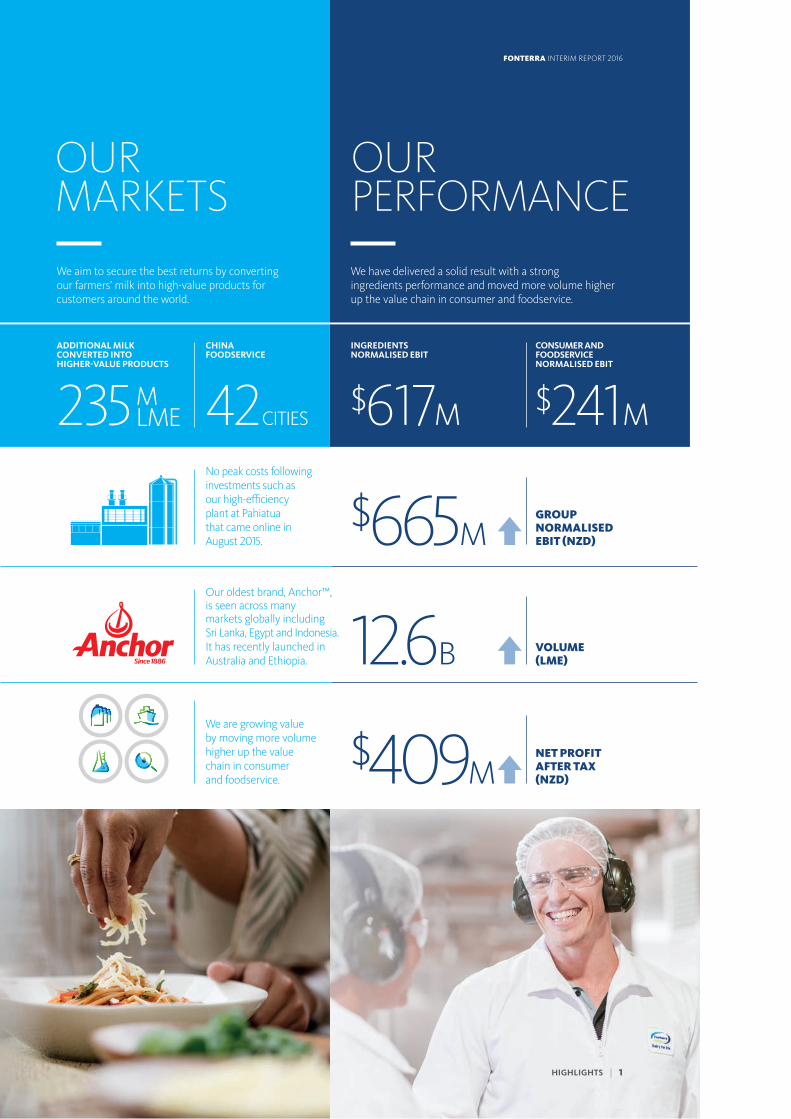
GROUP NORMALISED EBIT (NZD)
NET PROFIT AFTER TAX (NZD)
INGREDIENTS NORMALISED EBIT
ADDITIONAL MILK CONVERTED INTO HIGHER-VALUE PRODUCTS
CONSUMER AND FOODSERVICE NORMALISED EBIT
$617M 235
Our oldest brand, Anchor™, is seen across many markets globally including Sri Lanka, Egypt and Indonesia. It has recently launched in Australia and Ethiopia.
VOLUME (LME)
We are growing value by moving more volume higher up the value chain in consumer and foodservice.
$665M
$409M
12.6B
OUR PERFORMANCE
OUR MARKETS
$241M
No peak costs following investments such as our high-efficiency plant at Pahiatua that came online in August 2015.
We aim to secure the best returns by converting our farmers’ milk into high-value products for customers around the world.
We have delivered a solid result with a strong ingredients performance and moved more volume higher up the value chain in consumer and foodservice.
M LME
CHINA FOODSERVICE
42CITIES
HIGHLIGHTS | 1
FONTERRA INTERIM REPORT 2016
CHAIRMAN AND CHIEF EXECUTIVE OFFICER’S LETTER
Our management is very aware of the need for a strong performance to ensure that we get every possible cent back into farmers’ hands during a very tough year.
OUR PERFORMANCEOur Co-operative delivered a good performance in the first half of the financial year and this built on the solid performance in the second half of last year. Normalised earnings before interest and tax (EBIT) of $665 million is up 77 per cent on the comparable period, and net profit after tax of $409 million is up 123 per cent. Volumes increased eight per cent to 12.6 billion liquid milk equivalent (LME) and included an additional 235 million LME converted into higher-returning products in consumer and foodservice.
This performance came from a sustained effort in three main areas. We focused on the efficiency of our ingredients business and building demand for ingredients in alternative markets. We aimed to make the most of global consumption growth by building demand for higher-value products in our consumer and foodservice markets. Finally, we maintained strict financial discipline to keep lifting our return on capital.
OUR PRIORITY IS FOCUSING ON THE AREAS WITHIN OUR CONTROL. WE AIM TO EFFICIENTLY CONVERT AS MUCH MILK AS POSSIBLE INTO THE HIGHEST-RETURNING PRODUCTS, ESPECIALLY THOSE IN CONSUMER AND FOODSERVICE, WHICH ARE LESS SUBJECT TO DAIRY PRICE VOLATILITY.
This is another tough season for our shareholders. The supply and demand imbalance in the globally traded dairy market has brought prices down to unsustainable levels for farmers around the world and this has placed a great deal of pressure on incomes, farm budgets, and farming families, particularly in New Zealand.
2 | CHAIRMAN AND CHIEF EXECUTIVE OFFICER’S LETTER
FONTERRA INTERIM REPORT 2016 FONTERRA INTERIM REPORT 2016
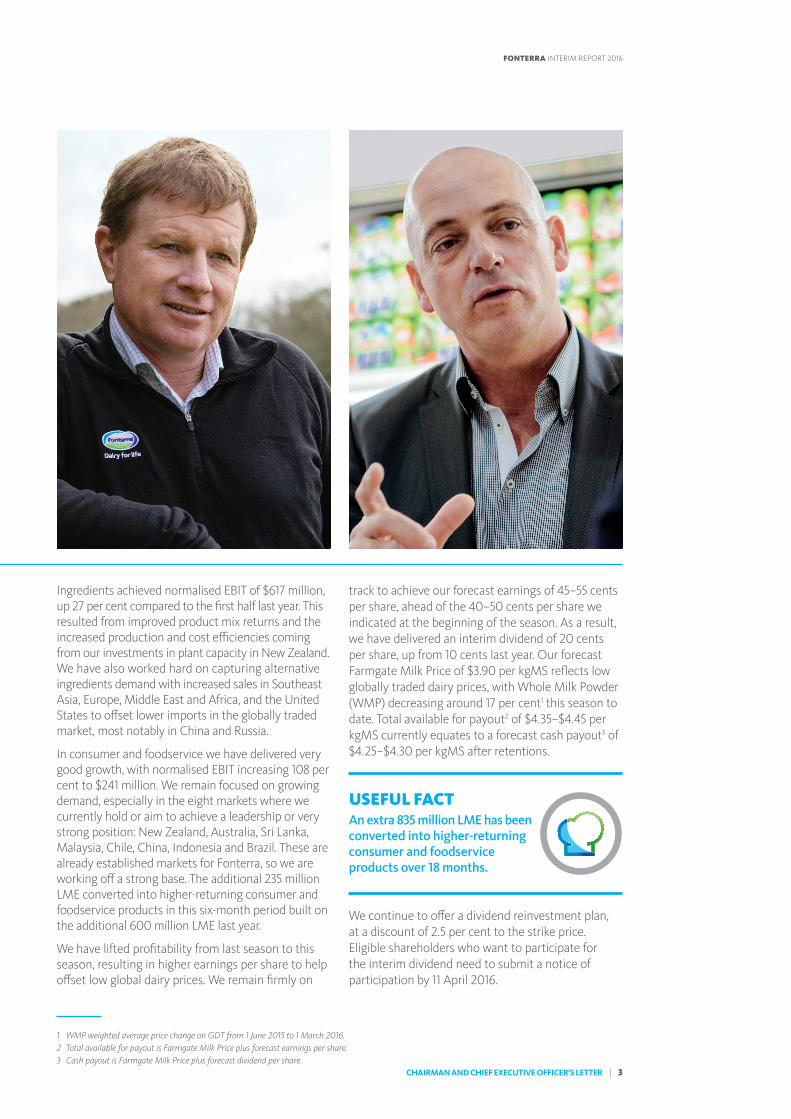
Ingredients achieved normalised EBIT of $617 million, up 27 per cent compared to the first half last year. This resulted from improved product mix returns and the increased production and cost efficiencies coming from our investments in plant capacity in New Zealand. We have also worked hard on capturing alternative ingredients demand with increased sales in Southeast Asia, Europe, Middle East and Africa, and the United States to offset lower imports in the globally traded market, most notably in China and Russia.
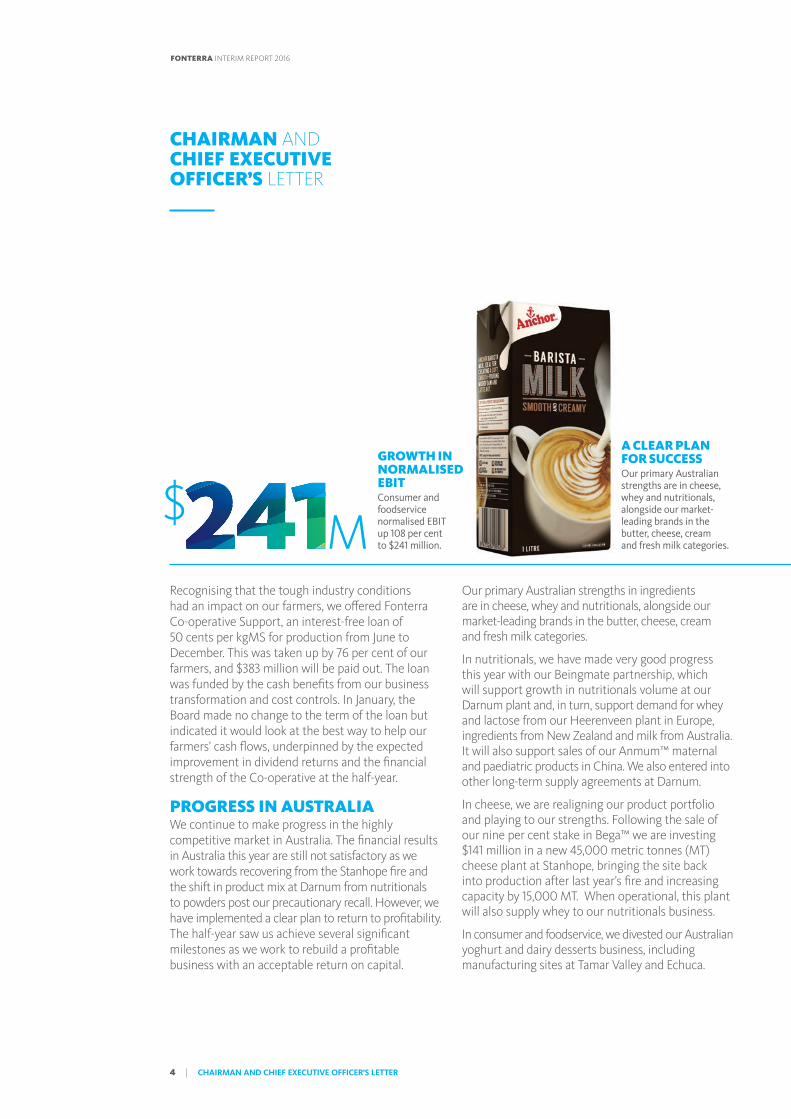
In consumer and foodservice we have delivered very good growth, with normalised EBIT increasing 108 per cent to $241 million. We remain focused on growing demand, especially in the eight markets where we currently hold or aim to achieve a leadership or very strong position: New Zealand, Australia, Sri Lanka, Malaysia, Chile, China, Indonesia and Brazil. These are already established markets for Fonterra, so we are working off a strong base. The additional 235 million LME converted into higher-returning consumer and foodservice products in this six-month period built on the additional 600 million LME last year.
We have lifted profitability from last season to this season, resulting in higher earnings per share to help offset low global dairy prices. We remain firmly on
track to achieve our forecast earnings of 45–55 cents per share, ahead of the 40–50 cents per share we indicated at the beginning of the season. As a result, we have delivered an interim dividend of 20 cents per share, up from 10 cents last year. Our forecast Farmgate Milk Price of $3.90 per kgMS reflects low globally traded dairy prices, with Whole Milk Powder (WMP) decreasing around 17 per cent1 this season to date. Total available for payout2 of $4.35–$4.45 per kgMS currently equates to a forecast cash payout3 of $4.25–$4.30 per kgMS after retentions.
USEFUL FACT An extra 835 million LME has been converted into higher-returning consumer and foodservice products over 18 months.
We continue to offer a dividend reinvestment plan, at a discount of 2.5 per cent to the strike price. Eligible shareholders who want to participate for the interim dividend need to submit a notice of participation by 11 April 2016.
1 WMP weighted average price change on GDT from 1 June 2015 to 1 March 2016.2 Total available for payout is Farmgate Milk Price plus forecast earnings per share.3 Cash payout is Farmgate Milk Price plus forecast dividend per share.
CHAIRMAN AND CHIEF EXECUTIVE OFFICER’S LETTER | 3
FONTERRA INTERIM REPORT 2016 FONTERRA INTERIM REPORT 2016
Recognising that the tough industry conditions had an impact on our farmers, we o�ered Fonterra Co-operative Support, an interest-free loan of 50 cents per kgMS for production from June to December. This was taken up by 76 per cent of our farmers, and $383 million will be paid out. The loan was funded by the cash bene�ts from our business transformation and cost controls. In January, the Board made no change to the term of the loan but indicated it would look at the best way to help our farmers’ cash �ows, underpinned by the expected improvement in dividend returns and the �nancial strength of the Co-operative at the half-year.
PROGRESS IN AUSTRALIAWe continue to make progress in the highly competitive market in Australia. The �nancial results in Australia this year are still not satisfactory as we work towards recovering from the Stanhope �re and the shift in product mix at Darnum from nutritionals to powders post our precautionary recall. However, we have implemented a clear plan to return to pro�tability. The half-year saw us achieve several signi�cant milestones as we work to rebuild a pro�table business with an acceptable return on capital.
Our primary Australian strengths in ingredients are in cheese, whey and nutritionals, alongside our market-leading brands in the butter, cheese, cream and fresh milk categories.
In nutritionals, we have made very good progress this year with our Beingmate partnership, which will support growth in nutritionals volume at our Darnum plant and, in turn, support demand for whey and lactose from our Heerenveen plant in Europe, ingredients from New Zealand and milk from Australia. It will also support sales of our Anmum™ maternal and paediatric products in China. We also entered into other long-term supply agreements at Darnum.
In cheese, we are realigning our product portfolio and playing to our strengths. Following the sale of our nine per cent stake in Bega™ we are investing $141 million in a new 45,000 metric tonnes (MT) cheese plant at Stanhope, bringing the site back into production after last year’s �re and increasing capacity by 15,000 MT. When operational, this plant will also supply whey to our nutritionals business.
In consumer and foodservice, we divested our Australian yoghurt and dairy desserts business, including manufacturing sites at Tamar Valley and Echuca.
CHAIRMAN AND CHIEF EXECUTIVE OFFICER’S LETTER
GROWTH IN NORMALISED EBITConsumer and foodservice normalised EBIT up 108 per cent to $241 million.M
A CLEAR PLAN FOR SUCCESSOur primary Australian strengths are in cheese, whey and nutritionals, alongside our market-leading brands in the butter, cheese, cream and fresh milk categories.
$
4 | CHAIRMAN AND CHIEF EXECUTIVE OFFICER’S LETTER
FONTERRA INTERIM REPORT 2016 FONTERRA INTERIM REPORT 2016

CHINAChina continues to be an attractive opportunity for growth, despite current economic volatility. Following the major milk adulteration issue and changes in the local industry in 2008, we developed a long-term plan to build an integrated business, based on a safe, secure and high-quality local milk supply from our farms, and to capitalise on the opportunities in this key market.
These farms are important to our overall China growth. Dairy consumption in China is expected to achieve compound annual growth rates in the region of four per cent, much of it favouring liquid milk, including UHT and fresh milk. Supporting these demand forecasts are continued urbanisation, a growing population and China’s shift from being a manufacturing to a consuming economy. We are capitalising on these trends, including supplying milk from our China farms to a chain of 700 outlets for a leading foodservice brand.
As with any new farm development, there is a time lag between the investment and the return on capital. China is no exception and reporting separately on international farming ventures was introduced last year so our shareholders could clearly track progress and performance in this long-term investment. In common with our New Zealand shareholders, and other producers, our China farms’ performance is a�ected
by the current low milk prices. We are achieving production e�ciencies that are helping o�set this and our China farms will bene�t when prices improve.
We now have su�cient scale with access to 250 million litres of raw milk, which gives us opportunities inside China’s borders. This will support us to take advantage of growing demand for higher-value fresh dairy, complementing our imported ingredients.
USEFUL FACT China foodservice is now in 42 cities across China.
We are making good progress on our plan to work with local partners to build demand and earnings beyond the farm gate. As the middle class grows, so too does demand for better nutrition, including a shift to a Westernised diet. This in turn is supporting strong volume growth in our foodservice business and good performance from our consumer brands.
Our Beingmate partnership enables us to capitalise on a rapidly changing regulatory environment as we build our market share in infant nutrition by selling our Anmum™ paediatric products through Beingmate’s wide distribution channels.
SUPPORT FOR ANMUM™Our Beingmate partnership will support growth in sales of our Anmum™ maternal and paediatric products in China.
DAIRY CONSUMPTION IN CHINAChina is expected to achieve compound annual growth rates of around four per cent.
CHAIRMAN AND CHIEF EXECUTIVE OFFICER’S LETTER | 5
FONTERRA INTERIM REPORT 2016 FONTERRA INTERIM REPORT 2016
THE GLOBAL MARKET OUTLOOKCurrent global economic conditions remain challenging and are impacting demand and prices in the globally traded dairy market.
This 66 billion litre globally traded market is a fraction of the wider dairy market but it impacts our Farmgate Milk Price, as we export a significant portion of our New Zealand production. In contrast the United States, for example, produced 92 billion litres in 2015 yet exported just 14 per cent of this.
The balance between available dairy exports and imports has been unfavourable for the past 18 months following European production increasing more than expected, lower imports into China and the Russian trade embargo.
This imbalance is likely to continue in the short term, with prices expected to lift later this calendar year, as European production growth slows and China’s imports build in line with overall consumption growth. A market shift, such as Russia reopening its borders or a change in supply in any key dairy-producing country, could put positive tension on prices and increase them at a greater rate, but the current outlook is for a slower recovery.
Although the imbalance between exports and imports remains, the prospects for growth in the broader global market are favourable, with demand increasing by around two to three per cent a year. We will continue to work on capturing demand and margins in the second half of the year, just as we did in the first half, by focusing on our consumer and foodservice volumes and those of specialty ingredients.
Further out, the long-term fundamentals remain strong with demand supported by a growing world population, increasing GDP in Africa, growing middle classes in Asia, urbanisation, favourable demographics, potential growth arising from the new two-child policy in China and Iran opening up for dairy imports.
Our strategy has always been to capture this growth and increase sales of ingredients and consumer and foodservice products in this broader market.
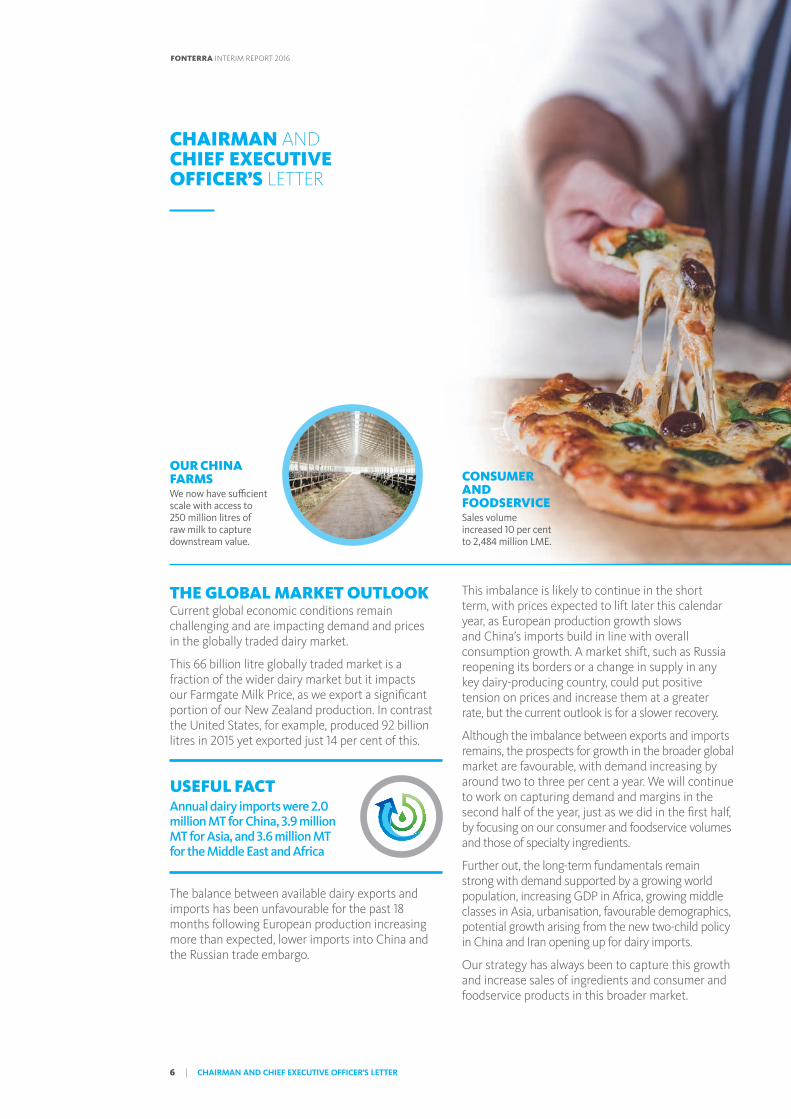
USEFUL FACT Annual dairy imports were 2.0 million MT for China, 3.9 million MT for Asia, and 3.6 million MT for the Middle East and Africa
OUR CHINA FARMSWe now have sufficient scale with access to 250 million litres of raw milk to capture downstream value.
CONSUMER AND FOODSERVICESales volume increased 10 per cent to 2,484 million LME.
CHAIRMAN AND CHIEF EXECUTIVE OFFICER’S LETTER
6 | CHAIRMAN AND CHIEF EXECUTIVE OFFICER’S LETTER
FONTERRA INTERIM REPORT 2016 FONTERRA INTERIM REPORT 2016
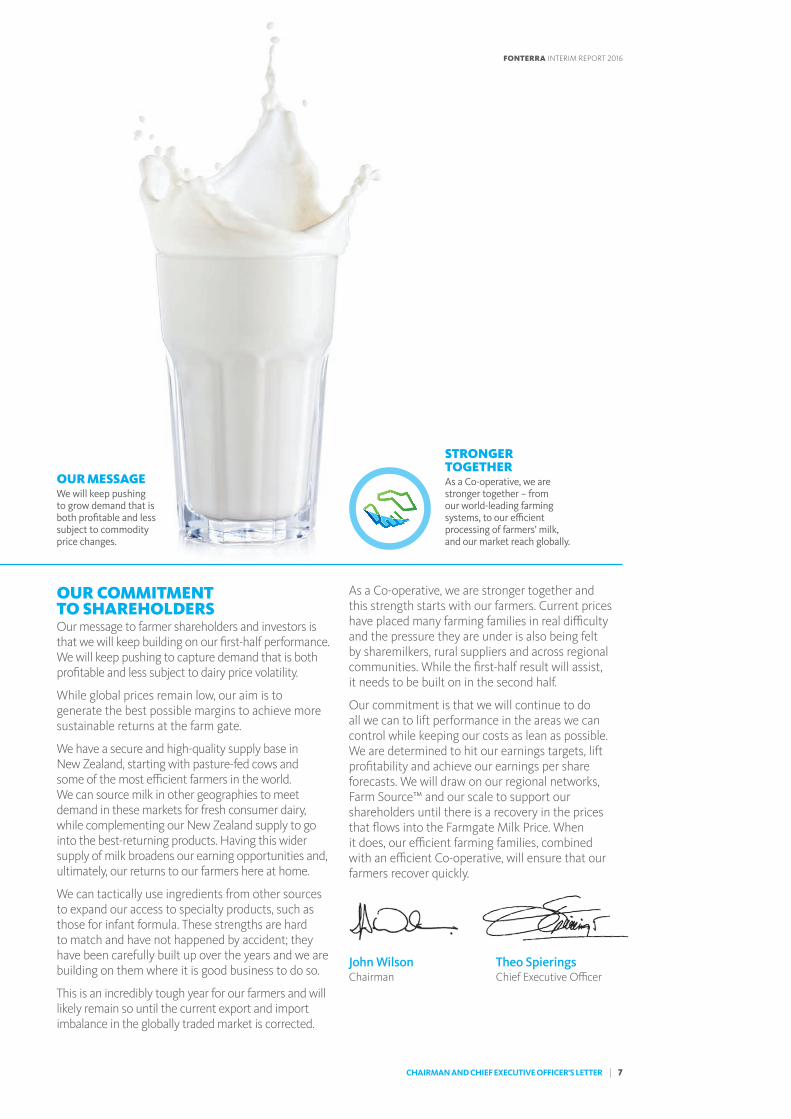
OUR MESSAGEWe will keep pushing to grow demand that is both pro�table and less subject to commodity price changes.
OUR COMMITMENT TO SHAREHOLDERSOur message to farmer shareholders and investors is that we will keep building on our �rst-half performance. We will keep pushing to capture demand that is both pro�table and less subject to dairy price volatility.
While global prices remain low, our aim is to generate the best possible margins to achieve more sustainable returns at the farm gate.
We have a secure and high-quality supply base in New Zealand, starting with pasture-fed cows and some of the most e�cient farmers in the world. We can source milk in other geographies to meet demand in these markets for fresh consumer dairy, while complementing our New Zealand supply to go into the best-returning products. Having this wider supply of milk broadens our earning opportunities and, ultimately, our returns to our farmers here at home.
We can tactically use ingredients from other sources to expand our access to specialty products, such as those for infant formula. These strengths are hard to match and have not happened by accident; they have been carefully built up over the years and we are building on them where it is good business to do so.
This is an incredibly tough year for our farmers and will likely remain so until the current export and import imbalance in the globally traded market is corrected.
As a Co-operative, we are stronger together and this strength starts with our farmers. Current prices have placed many farming families in real di�culty and the pressure they are under is also being felt by sharemilkers, rural suppliers and across regional communities. While the �rst-half result will assist, it needs to be built on in the second half.
Our commitment is that we will continue to do all we can to lift performance in the areas we can control while keeping our costs as lean as possible. We are determined to hit our earnings targets, lift pro�tability and achieve our earnings per share forecasts. We will draw on our regional networks, Farm Source™ and our scale to support our shareholders until there is a recovery in the prices that �ows into the Farmgate Milk Price. When it does, our e�cient farming families, combined with an e�cient Co-operative, will ensure that our farmers recover quickly.
John Wilson Theo SpieringsChairman Chief Executive O�cer
STRONGER TOGETHERAs a Co-operative, we are stronger together – from our world-leading farming systems, to our e�cient processing of farmers’ milk, and our market reach globally.
CHAIRMAN AND CHIEF EXECUTIVE OFFICER’S LETTER | 7
FONTERRA INTERIM REPORT 2016 FONTERRA INTERIM REPORT 2016
FONTERRA INTERIM REPORT 2016
Our farmers’ ability to be �exible and adjust their farming systems in response to the market is important in these di�cult conditions. It also has consequences beyond the farm gate, with cost cutting a�ecting local communities and the services that support farming. In many cases our farmers have had to lay o� some of their farm sta� and this is never an easy decision.
As our farmers and their local communities go through this transition from the high milk price of recent years, it is important that we continue to lower our cost base and lock in the competitive advantage we have in our pasture-based systems.
With market conditions making it di�cult on farm, our farmers deserve considerable credit for maintaining their commitment to sustainability. In every region there are stand-out examples of our farmers investing in their farm infrastructures in ways that bene�t their businesses and the environment. This includes the continued e�ort to exclude stock from waterways with 98 per cent of waterways on Fonterra farms now with stock excluded.
Some farmers have gone beyond minimum requirements, fencing an additional 10,000 kilometres of smaller waterways. We now have 76 per cent of our farmers recording detailed on-farm information to enable nutrient management reports to be prepared and implemented to improve nutrient use e�ciency, bene�ting the environment and particularly waterways.
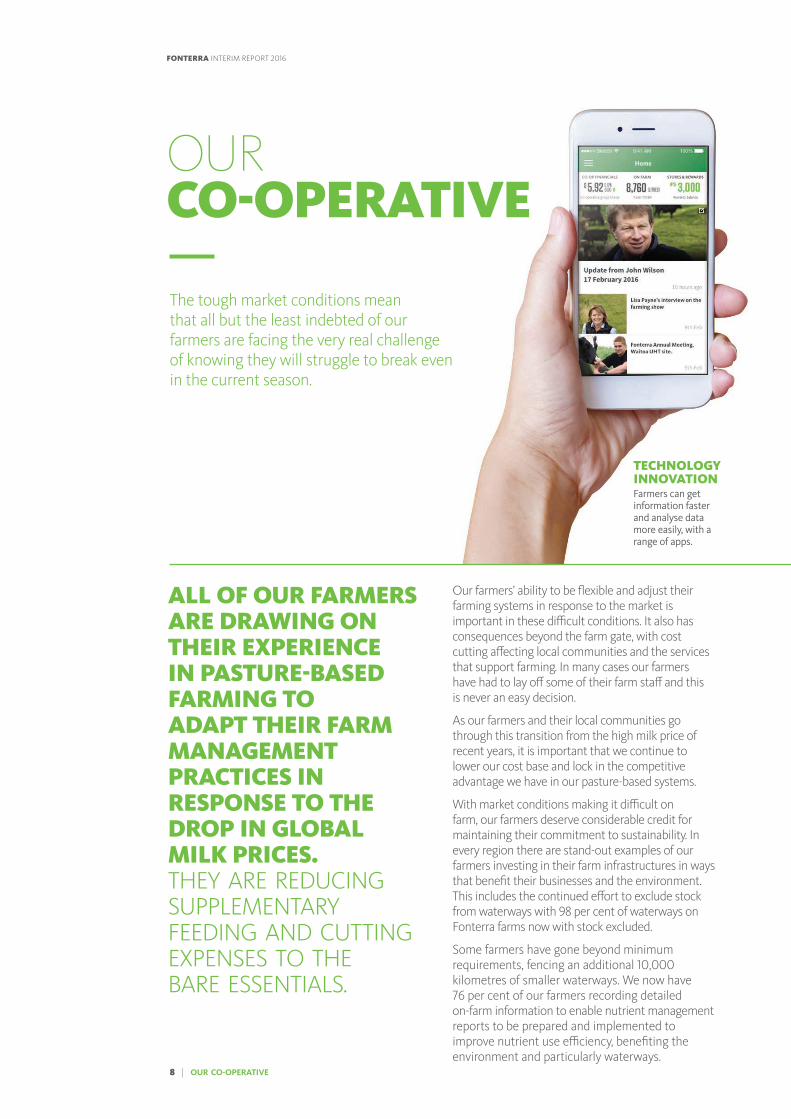
ALL OF OUR FARMERS ARE DRAWING ON THEIR EXPERIENCE IN PASTURE-BASED FARMING TO ADAPT THEIR FARM MANAGEMENT PRACTICES IN RESPONSE TO THE DROP IN GLOBAL MILK PRICES. THEY ARE REDUCING SUPPLEMENTARY FEEDING AND CUTTING EXPENSES TO THE BARE ESSENTIALS.
OUR CO-OPERATIVE
TECHNOLOGY INNOVATIONFarmers can get information faster and analyse data more easily, with a range of apps.
The tough market conditions mean that all but the least indebted of our farmers are facing the very real challenge of knowing they will struggle to break even in the current season.
8 | OUR CO-OPERATIVE
FONTERRA INTERIM REPORT 2016
FONTERRA INTERIM REPORT 2016
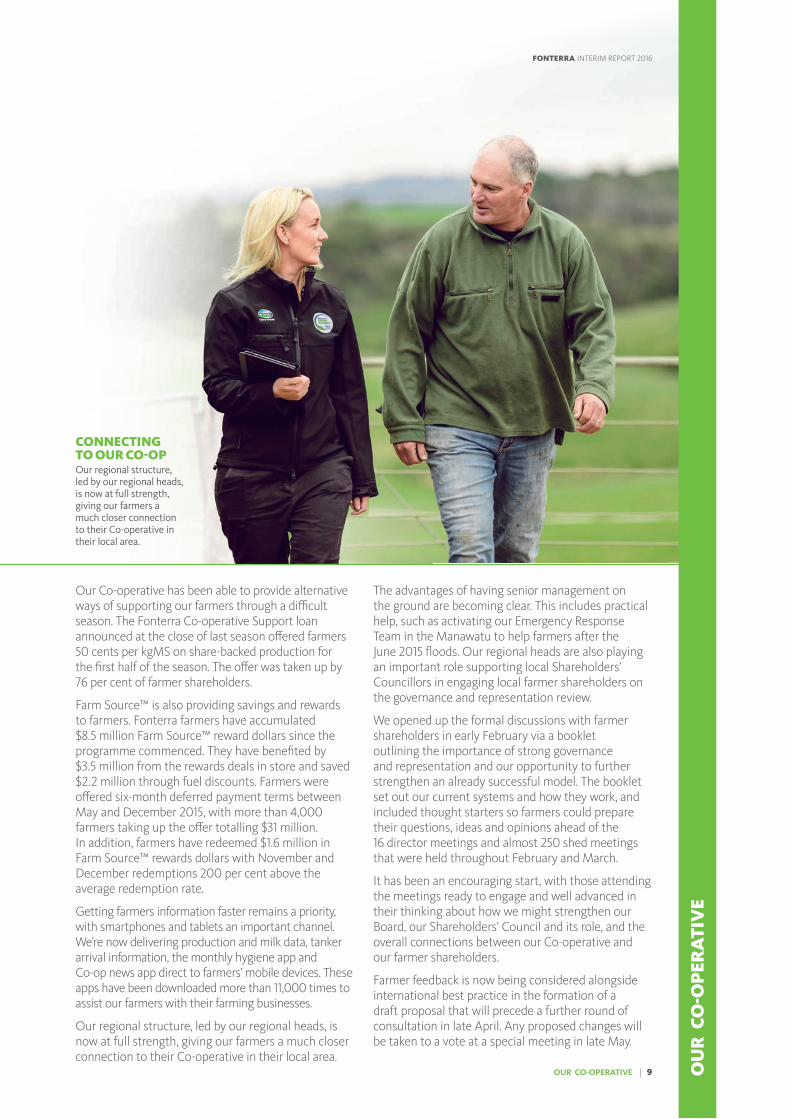
Our Co-operative has been able to provide alternative ways of supporting our farmers through a di�cult season. The Fonterra Co-operative Support loan announced at the close of last season o�ered farmers 50 cents per kgMS on share-backed production for the �rst half of the season. The o�er was taken up by 76 per cent of farmer shareholders.
Farm Source™ is also providing savings and rewards to farmers. Fonterra farmers have accumulated $8.5 million Farm Source™ reward dollars since the programme commenced. They have bene�ted by $3.5 million from the rewards deals in store and saved $2.2 million through fuel discounts. Farmers were o�ered six-month deferred payment terms between May and December 2015, with more than 4,000 farmers taking up the o�er totalling $31 million. In addition, farmers have redeemed $1.6 million in Farm Source™ rewards dollars with November and December redemptions 200 per cent above the average redemption rate.
Getting farmers information faster remains a priority, with smartphones and tablets an important channel. We’re now delivering production and milk data, tanker arrival information, the monthly hygiene app and Co-op news app direct to farmers’ mobile devices. These apps have been downloaded more than 11,000 times to assist our farmers with their farming businesses.
Our regional structure, led by our regional heads, is now at full strength, giving our farmers a much closer connection to their Co-operative in their local area.
The advantages of having senior management on the ground are becoming clear. This includes practical help, such as activating our Emergency Response Team in the Manawatu to help farmers after the June 2015 �oods. Our regional heads are also playing an important role supporting local Shareholders’ Councillors in engaging local farmer shareholders on the governance and representation review.
We opened up the formal discussions with farmer shareholders in early February via a booklet outlining the importance of strong governance and representation and our opportunity to further strengthen an already successful model. The booklet set out our current systems and how they work, and included thought starters so farmers could prepare their questions, ideas and opinions ahead of the 16 director meetings and almost 250 shed meetings that were held throughout February and March.
It has been an encouraging start, with those attending the meetings ready to engage and well advanced in their thinking about how we might strengthen our Board, our Shareholders’ Council and its role, and the overall connections between our Co-operative and our farmer shareholders.
Farmer feedback is now being considered alongside international best practice in the formation of a draft proposal that will precede a further round of consultation in late April. Any proposed changes will be taken to a vote at a special meeting in late May.
CONNECTING TO OUR CO-OPOur regional structure, led by our regional heads, is now at full strength, giving our farmers a much closer connection to their Co-operative in their local area.
OUR CO-OPERATIVE | 9 OU
R C
O-O
PER
ATI
VE
FONTERRA INTERIM REPORT 2016
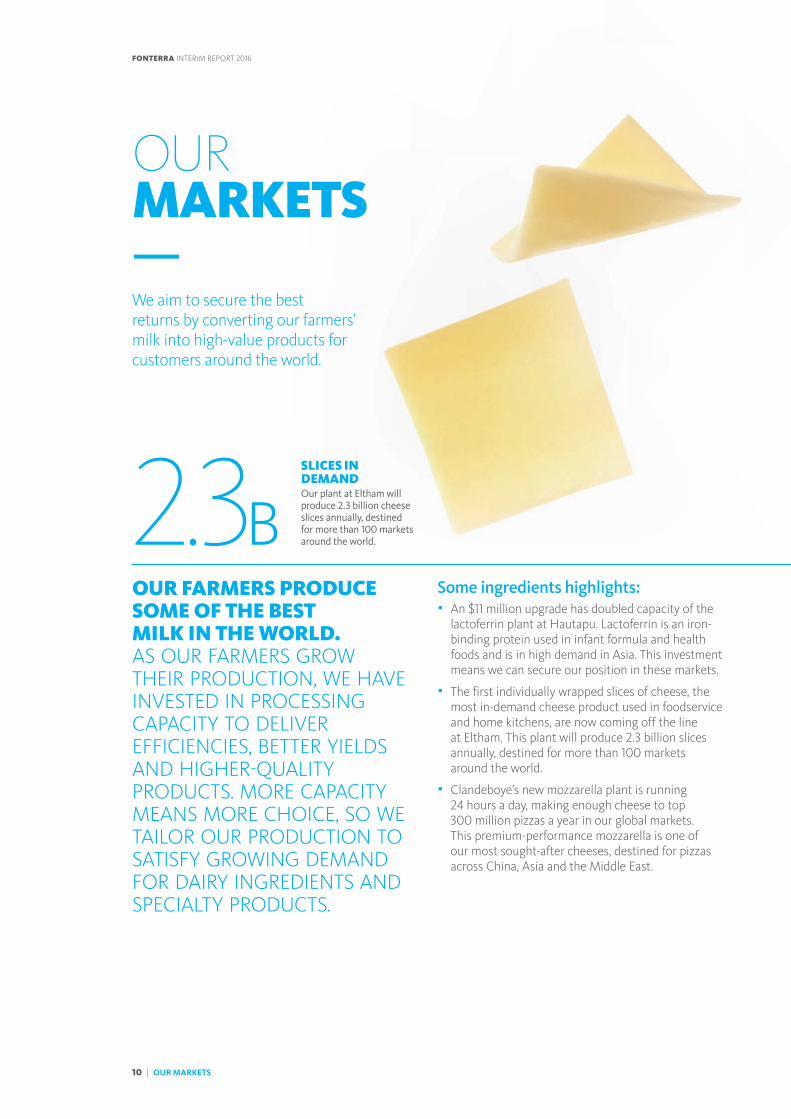
2.3BSLICES IN DEMANDOur plant at Eltham will produce 2.3 billion cheese slices annually, destined for more than 100 markets around the world.
OUR MARKETS
OUR FARMERS PRODUCE SOME OF THE BEST MILK IN THE WORLD. AS OUR FARMERS GROW THEIR PRODUCTION, WE HAVE INVESTED IN PROCESSING CAPACITY TO DELIVER EFFICIENCIES, BETTER YIELDS AND HIGHER-QUALITY PRODUCTS. MORE CAPACITY MEANS MORE CHOICE, SO WE TAILOR OUR PRODUCTION TO SATISFY GROWING DEMAND FOR DAIRY INGREDIENTS AND SPECIALTY PRODUCTS.
Some ingredients highlights:• An $11 million upgrade has doubled capacity of the
lactoferrin plant at Hautapu. Lactoferrin is an iron-binding protein used in infant formula and health foods and is in high demand in Asia. This investment means we can secure our position in these markets.
• The first individually wrapped slices of cheese, the most in-demand cheese product used in foodservice and home kitchens, are now coming off the line at Eltham. This plant will produce 2.3 billion slices annually, destined for more than 100 markets around the world.
• Clandeboye’s new mozzarella plant is running 24 hours a day, making enough cheese to top 300 million pizzas a year in our global markets. This premium-performance mozzarella is one of our most sought-after cheeses, destined for pizzas across China, Asia and the Middle East.
We aim to secure the best returns by converting our farmers’ milk into high-value products for customers around the world.
FONTERRA INTERIM REPORT 2016
10 | OUR MARKETS
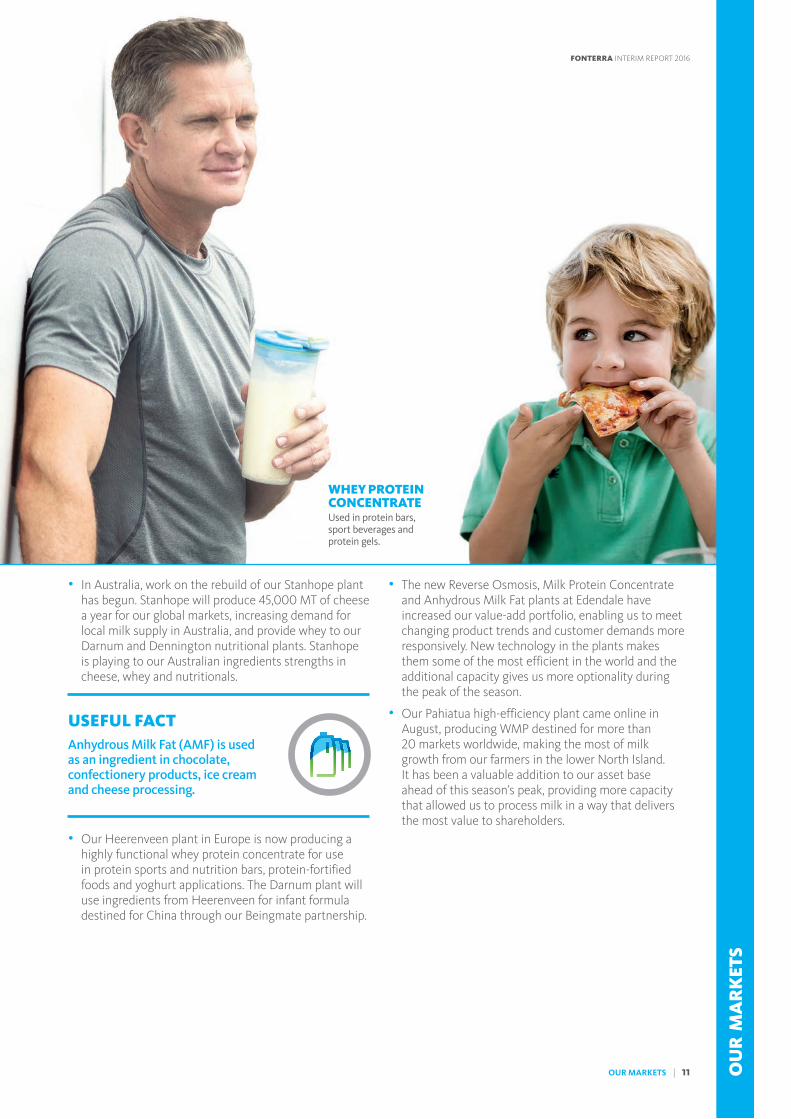
WHEY PROTEIN CONCENTRATEUsed in protein bars, sport beverages and protein gels.
• In Australia, work on the rebuild of our Stanhope plant has begun. Stanhope will produce 45,000 MT of cheese a year for our global markets, increasing demand for local milk supply in Australia, and provide whey to our Darnum and Dennington nutritional plants. Stanhope is playing to our Australian ingredients strengths in cheese, whey and nutritionals.
USEFUL FACTAnhydrous Milk Fat (AMF) is used as an ingredient in chocolate, confectionery products, ice cream and cheese processing.
• Our Heerenveen plant in Europe is now producing a highly functional whey protein concentrate for use in protein sports and nutrition bars, protein-fortified foods and yoghurt applications. The Darnum plant will use ingredients from Heerenveen for infant formula destined for China through our Beingmate partnership.
• The new Reverse Osmosis, Milk Protein Concentrate and Anhydrous Milk Fat plants at Edendale have increased our value-add portfolio, enabling us to meet changing product trends and customer demands more responsively. New technology in the plants makes them some of the most efficient in the world and the additional capacity gives us more optionality during the peak of the season.
• Our Pahiatua high-efficiency plant came online in August, producing WMP destined for more than 20 markets worldwide, making the most of milk growth from our farmers in the lower North Island. It has been a valuable addition to our asset base ahead of this season’s peak, providing more capacity that allowed us to process milk in a way that delivers the most value to shareholders.
OU
R M
AR
KET
S
OUR MARKETS | 11
FONTERRA INTERIM REPORT 2016
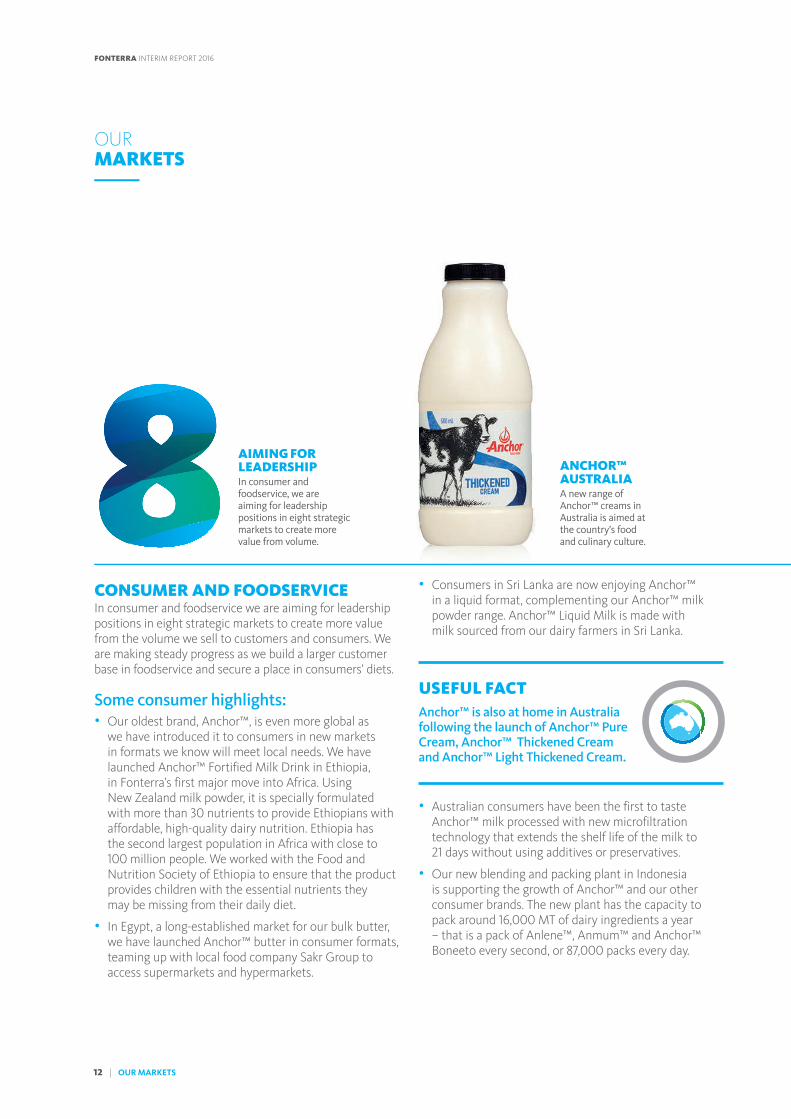
CONSUMER AND FOODSERVICE In consumer and foodservice we are aiming for leadership positions in eight strategic markets to create more value from the volume we sell to customers and consumers. We are making steady progress as we build a larger customer base in foodservice and secure a place in consumers’ diets.
Some consumer highlights:• Our oldest brand, Anchor™, is even more global as
we have introduced it to consumers in new markets in formats we know will meet local needs. We have launched Anchor™ Fortified Milk Drink in Ethiopia, in Fonterra’s first major move into Africa. Using New Zealand milk powder, it is specially formulated with more than 30 nutrients to provide Ethiopians with affordable, high-quality dairy nutrition. Ethiopia has the second largest population in Africa with close to 100 million people. We worked with the Food and Nutrition Society of Ethiopia to ensure that the product provides children with the essential nutrients they may be missing from their daily diet.
• In Egypt, a long-established market for our bulk butter, we have launched Anchor™ butter in consumer formats, teaming up with local food company Sakr Group to access supermarkets and hypermarkets.
• Consumers in Sri Lanka are now enjoying Anchor™ in a liquid format, complementing our Anchor™ milk powder range. Anchor™ Liquid Milk is made with milk sourced from our dairy farmers in Sri Lanka.
USEFUL FACTAnchor™ is also at home in Australia following the launch of Anchor™ Pure Cream, Anchor™ Thickened Cream and Anchor™ Light Thickened Cream.
• Australian consumers have been the first to taste Anchor™ milk processed with new microfiltration technology that extends the shelf life of the milk to 21 days without using additives or preservatives.
• Our new blending and packing plant in Indonesia is supporting the growth of Anchor™ and our other consumer brands. The new plant has the capacity to pack around 16,000 MT of dairy ingredients a year – that is a pack of Anlene™, Anmum™ and Anchor™ Boneeto every second, or 87,000 packs every day.
OUR MARKETS
AIMING FOR LEADERSHIPIn consumer and foodservice, we are aiming for leadership positions in eight strategic markets to create more value from volume.
ANCHOR™ AUSTRALIAA new range of Anchor™ creams in Australia is aimed at the country’s food and culinary culture.
12 | OUR MARKETS
FONTERRA INTERIM REPORT 2016
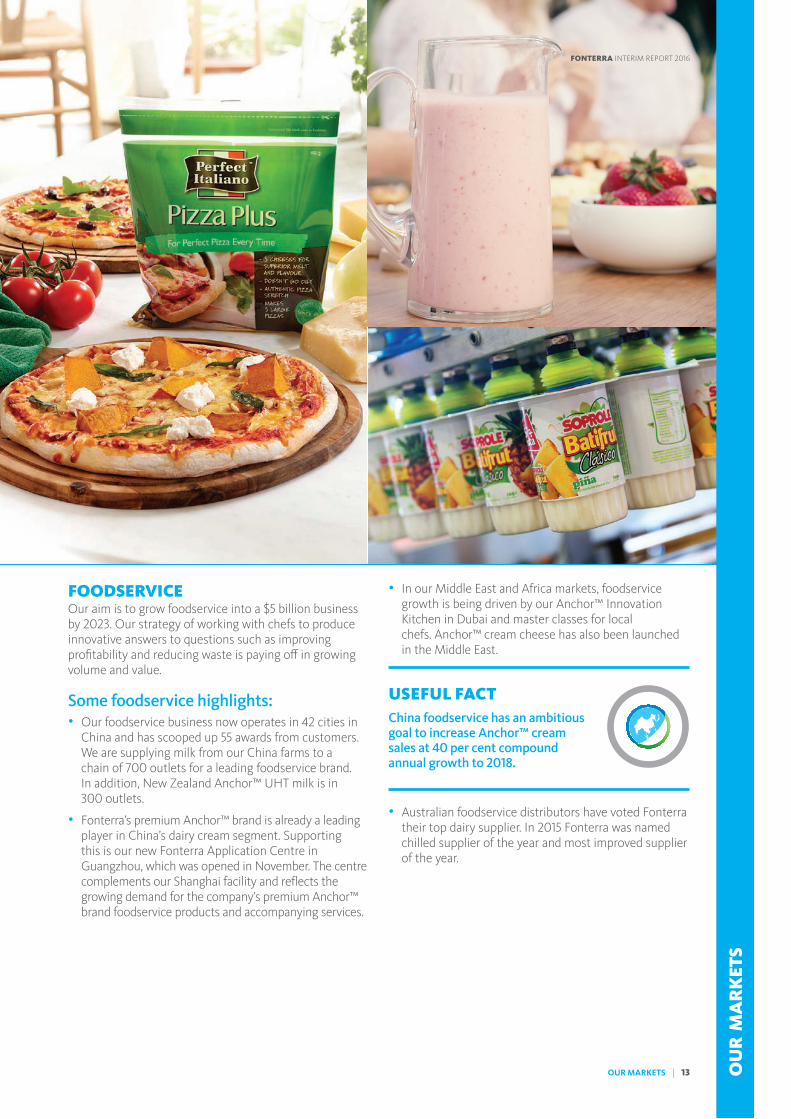
FOODSERVICEOur aim is to grow foodservice into a $5 billion business by 2023. Our strategy of working with chefs to produce innovative answers to questions such as improving pro¤tability and reducing waste is paying o¥ in growing volume and value.
Some foodservice highlights:• Our foodservice business now operates in 42 cities in
China and has scooped up 55 awards from customers. We are supplying milk from our China farms to a chain of 700 outlets for a leading foodservice brand. In addition, New Zealand Anchor™ UHT milk is in 300 outlets.
• Fonterra’s premium Anchor™ brand is already a leading player in China’s dairy cream segment. Supporting this is our new Fonterra Application Centre in Guangzhou, which was opened in November. The centre complements our Shanghai facility and reflects the growing demand for the company’s premium Anchor™ brand foodservice products and accompanying services.
• In our Middle East and Africa markets, foodservice growth is being driven by our Anchor™ Innovation Kitchen in Dubai and master classes for local chefs. Anchor™ cream cheese has also been launched in the Middle East.
USEFUL FACTChina foodservice has an ambitious goal to increase Anchor™ cream sales at 40 per cent compound annual growth to 2018.
• Australian foodservice distributors have voted Fonterra their top dairy supplier. In 2015 Fonterra was named chilled supplier of the year and most improved supplier of the year.
OU
R M
AR
KET
S
OUR MARKETS | 13
FONTERRA INTERIM REPORT 2016
SALES VOLUMEUp eight per cent compared to the same period last year.
Sales volume increased to 2.3 million MT for the six months to 31 January 2016, up six per cent compared to the same period last year.
Key drivers of the volume growth were New Zealand ingredients, where strong sales cleared our higher opening inventory position following the increase in late season milk ows in the 2014/15 season, and consumer and foodservice with growth across the business. In addition international farming ventures had new farms coming into operation during the period.
The Co-operative delivered signi�cantly higher normalised earnings before interest and tax (EBIT) of $665 million for the six months to 31 January 2016, up 77 per cent compared to the �rst half last year. The largest contributors to the strong performance were:
• New Zealand ingredients, where the business benefited from improved product mix returns and efficiencies and no peak costs.
• Asia and Greater China consumer and foodservice, which delivered strong growth in earnings benefiting from volume growth in foodservice and increasing margins due to lower input costs.
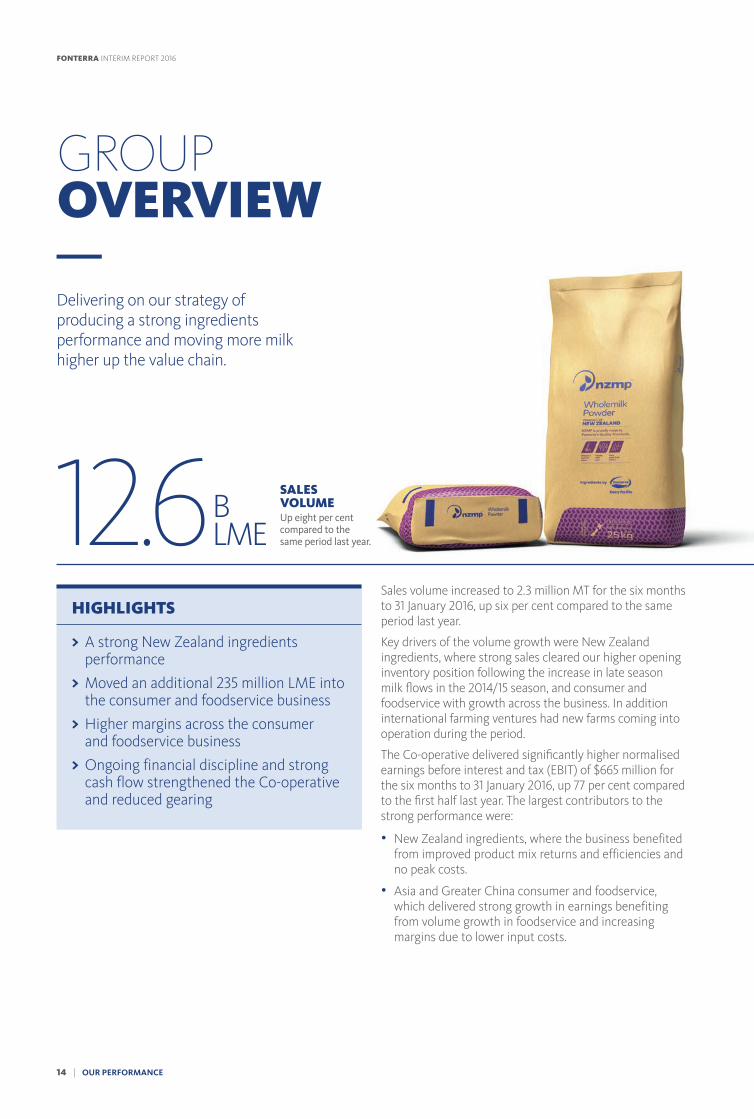
GROUP OVERVIEW
Delivering on our strategy of producing a strong ingredients performance and moving more milk higher up the value chain.
12.6BLME
HIGHLIGHTS
> A strong New Zealand ingredients performance
> Moved an additional 235 million LME into the consumer and foodservice business
> Higher margins across the consumer and foodservice business
> Ongoing financial discipline and strong cash flow strengthened the Co-operative and reduced gearing
14 | OUR PERFORMANCE
FONTERRA INTERIM REPORT 2016
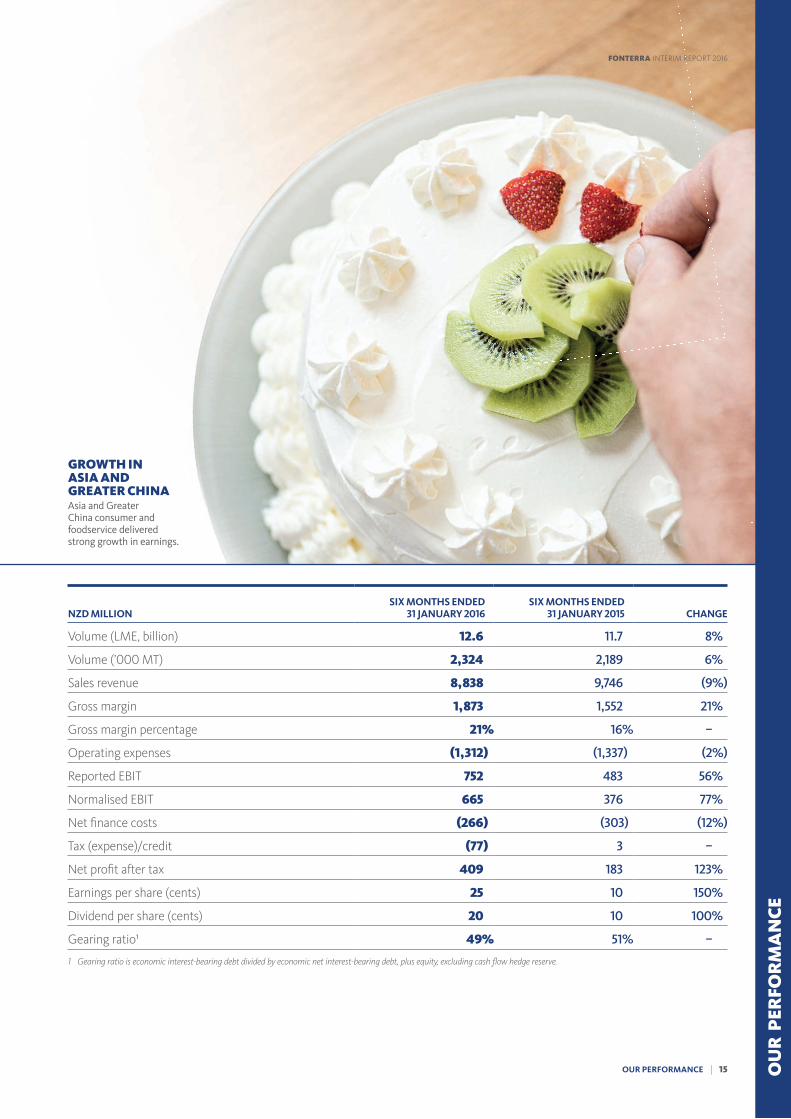
NZD MILLIONSIX MONTHS ENDED
31 JANUARY 2016SIX MONTHS ENDED
31 JANUARY 2015 CHANGE
Volume (LME, billion) 12.6 11.7 8%
Volume (’000 MT) 2,324 2,189 6%
Sales revenue 8,838 9,746 (9%)
Gross margin 1,873 1,552 21%
Gross margin percentage 21% 16% –
Operating expenses (1,312) (1,337) (2%)
Reported EBIT 752 483 56%
Normalised EBIT 665 376 77%
Net �nance costs (266) (303) (12%)
Tax (expense)/credit (77) 3 –
Net pro�t after tax 409 183 123%
Earnings per share (cents) 25 10 150%
Dividend per share (cents) 20 10 100%
Gearing ratio¹ 49% 51% –
1 Gearing ratio is economic interest-bearing debt divided by economic net interest-bearing debt, plus equity, excluding cash �ow hedge reserve.
GROWTH IN ASIA AND GREATER CHINAAsia and Greater China consumer and foodservice delivered strong growth in earnings.
OU
R P
ERFO
RM
AN
CE
OUR PERFORMANCE | 15
FONTERRA INTERIM REPORT 2016
In addition, Oceania had a strong performance and Latin America had solid growth other than in Venezuela where changes were made to the business as a result of the local economy.
Management is addressing challenges in Australia and international farming ventures. In Australia, earnings continued to be impacted by an adverse product mix due to a slower than expected recovery in the nutritionals business and the �re at the Stanhope cheese factory, but we have a clear plan in place and are on track to return the business to pro�tability. International farming ventures’ earnings were impacted by the low domestic milk price in China. However, we have managed to signi�cantly reduce on-farm costs in China to o¢set the lower milk price, which was RMB0.95 per litre lower than the �rst half last year.
We continued our strong focus on cost control. Bene�ts from the transformation project, realised in the second quarter, have been reinvested in additional selling and marketing costs to drive higher volumes. Operating expenses were two per cent lower in the �rst half to 31 January 2016 compared to the �rst half last year.
Net �nance costs for the six months were $266 million, $37 million lower than the same period last year. Tax expense from operations for the �rst half was up compared to the same period last year due to higher tax payable relating to the increased pre-tax pro�t, as well as a tax charge for capital gains relating to the sale of DairiConcepts. This was partially o¢set by the tax credit in relation to the half-year dividend.
GROUP OVERVIEW
INCREASE IN NORMALISED EBITThe Co-operative delivered a signi�cantly higher normalised EBIT of $665 million.77%
16 | OUR PERFORMANCE
FONTERRA INTERIM REPORT 2016
BALANCE SHEET AND CASH FLOWOngoing financial discipline and strong cash flow have enabled us to strengthen the Co-operative and reduce gearing. The gearing ratio has reduced to 49 per cent compared to 51 per cent in the previous year. This reflects the increase in equity and a small reduction in economic net interest-bearing debt; this has been achieved after taking into account the payment for the investment in Beingmate in the second half last year and the higher dividend payment in October 2015, which otherwise would have increased debt. We are on target to reduce the gearing ratio to between 40 and 45 per cent by year-end.
Free cash flow for the six months to 31 January 2016 was $2.1 billion higher than the first half last year, reflecting improvements in both operating and investing cash flows.
Operating cash flow was up $1.9 billion due to higher EBIT, significant working capital improvements and suppliers payable returning to normal levels.
Working capital was lower, predominantly as a result of higher sales volume in New Zealand ingredients and lower inventory valuation due to the lower milk price, plus improved terms for receivables and payables.
Inventory volume was nine per cent lower than the first half last year as a result of strong growth in sales volume, which cleared our higher opening inventory position following the increase in late season milk flows in the 2014/15 season.
Investing cash flow improved by $169 million relative to the first half last year, benefiting from the sale of non-strategic assets including Fonterra’s investment in DairiConcepts and Bega™ shares in Australia, and lower capital expenditure. This lower capital expenditure was achieved after including payments made this year that related to last year.
Fonterra has credit ratings in the A category and a strong liquidity and debt maturity profile.
IMPROVED MARGINSConsumer and foodservice achieved higher margins across the business.
$1.9B
OPERATING CASHFLOWOperating cash flow was $1.9 billion higher due to higher EBIT, significant working capital improvements and suppliers payable returning to normal levels.
OU
R P
ERFO
RM
AN
CE
OUR PERFORMANCE | 17
FONTERRA INTERIM REPORT 2016
VOLUMEMilk collection across New Zealand for the �rst eight months of the 2015/16 season to 31 January 2016 was 1,107 million kgMS, four per cent lower than the same period last season. Lower milk collections for the 2015/16 season are largely a result of the low milk price environment, where farmers have reduced stocking rates and supplementary feeding in order to reduce costs.
In Australia, milk collection for the seven months to 31 January 2016 reached 81 million kgMS, one per cent behind the same period last season. Production was lower as a result of unfavourable pasture growth, due to dry conditions across most dairying regions.
USEFUL FACT Our New Zealand daily milk collection peaked at 87 million litres on 22 October 2015 for the 2015/16 season.
Despite lower milk collection, sales volume grew by six per cent. The increased sales were mainly due to New Zealand ingredients where we cleared our opening inventory position. Fonterra exported record volumes for a single month in December 2015, with more than 300,000 MT shipped to global markets.
INGREDIENTS
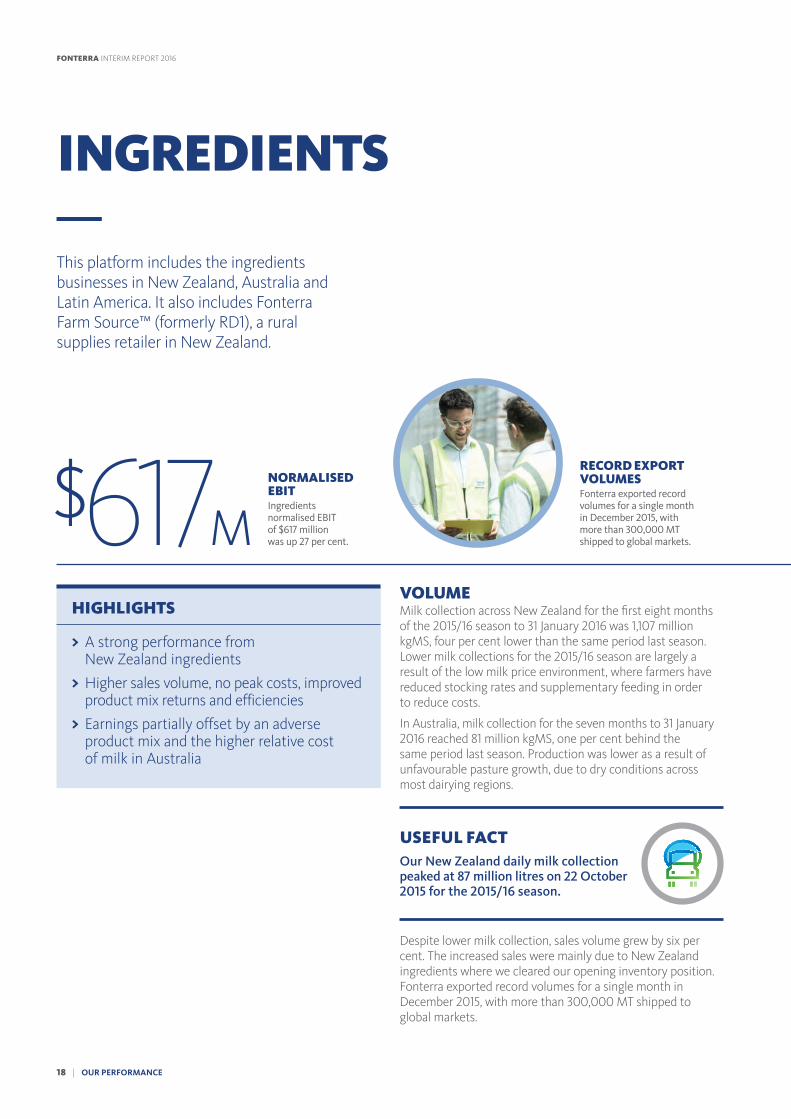
This platform includes the ingredients businesses in New Zealand, Australia and Latin America. It also includes Fonterra Farm Source™ (formerly RD1), a rural supplies retailer in New Zealand.
NORMALISED EBITIngredients normalised EBIT of $617 million was up 27 per cent.
RECORD EXPORT VOLUMESFonterra exported record volumes for a single month in December 2015, with more than 300,000 MT shipped to global markets.
HIGHLIGHTS
> A strong performance from New Zealand ingredients
> Higher sales volume, no peak costs, improved product mix returns and efficiencies
> Earnings partially offset by an adverse product mix and the higher relative cost of milk in Australia
$617M
18 | OUR PERFORMANCE
FONTERRA INTERIM REPORT 2016
NZD MILLIONSIX MONTHS ENDED
31 JANUARY 2016SIX MONTHS ENDED
31 JANUARY 2015 CHANGE
Volume (LME, billion) 11.8 11.1 6%
Volume (’000 MT) 1,624 1,538 6%
Sales revenue 6,709 7,617 (12%)
Total gross margin 992 718 38%
– New Zealand product mix 836 608 38%
New Zealand reference products 351 425 (17%)
New Zealand non-reference products 485 183 165%
– Australian ingredients 9 12 (25%)
– Other gross margin¹ 147 98 50%
Normalised EBIT2, 3 617 486 27%
New Zealand ingredients gross margin per MT
– Reference products ($ per MT) 331 413 (20%)
– Non-reference products ($ per MT) 1,412 640 121%
1 Prior period numbers have been restated to exclude group unallocated costs.2 Normalised EBIT for ingredients excludes unallocated costs.3 The 2015 normalised EBIT has been restated to exclude group unallocated costs.
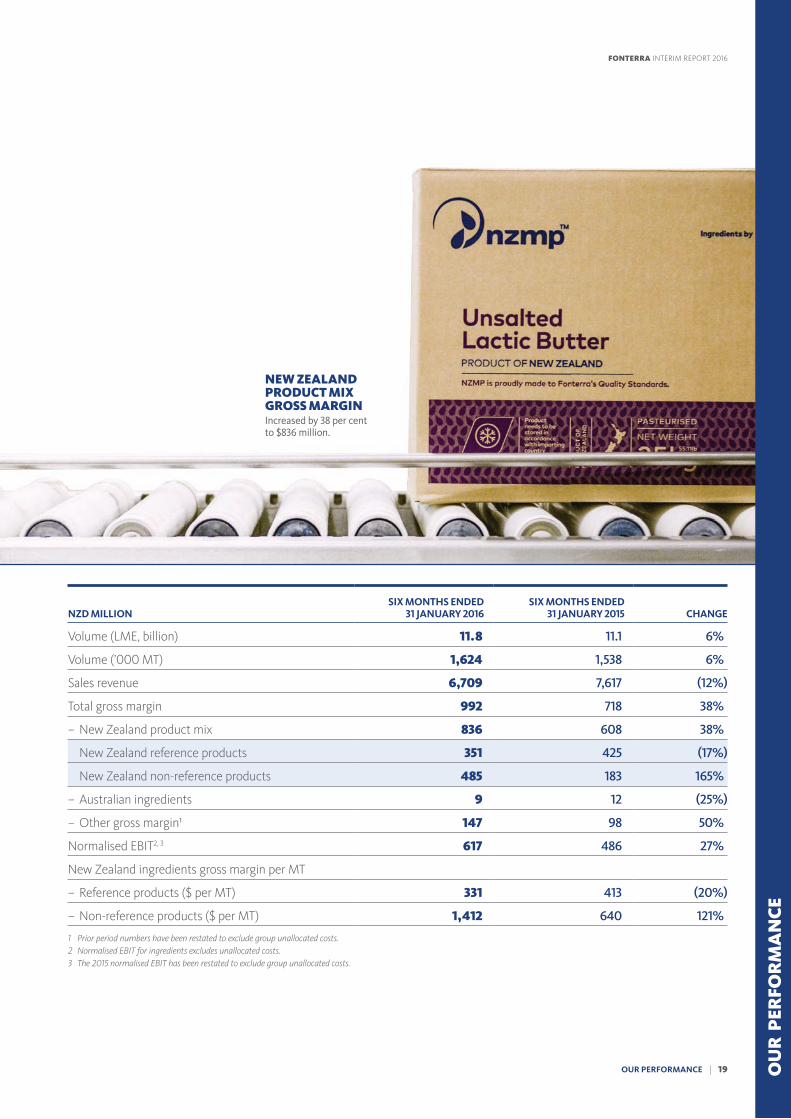
NEW ZEALAND PRODUCT MIX GROSS MARGINIncreased by 38 per cent to $836 million.
OU
R P
ERFO
RM
AN
CE
OUR PERFORMANCE | 19
FONTERRA INTERIM REPORT 2016
December’s sales volume was approximately 10 per cent higher than the previous record month in December 2014. The growth in volumes reflects the successful performance of our direct-to-customer ingredients sales despite the tough global market environment.
Over the past 12 months, the volume of sales to China decreased by around 14 per cent and this was offset by higher volumes into other regions across Southeast Asia, Europe, Middle East and Africa, and the United States. In the past six months sales increased to China compared to the previous period in spite of the uncertainty in that region. Together with increased sales to customers in the United States and Southeast Asia, this enabled the business to build on its strong position in the second half of 2015.
VALUEIngredients delivered another strong performance for the first half to 31 January 2016 with normalised EBIT up 27 per cent to $617 million. This was driven by New Zealand ingredients, where our plant investments and improvement programmes achieved efficiency gains, better yields and quality benefits.
With the increased capacity and lower milk supply, it was possible to optimise our product mix in New Zealand by adjusting our production away from reference products such as WMP towards non-reference products such as cheese and casein to take advantage of the change in relative commodity prices.
The overall New Zealand ingredients product mix gross margin, including both reference and non-reference products, increased by 38 per cent to $836 million. This reflects the value proposition of our ingredients products and services to our global customer base, which uses our high-quality ingredients in numerous product applications. These include consumer powder formats, recombined milk, flavoured milk, drinking and spoonable yoghurt, confectionery, fresh and cream cheese, sports drinks and infant formula.
INGREDIENTS
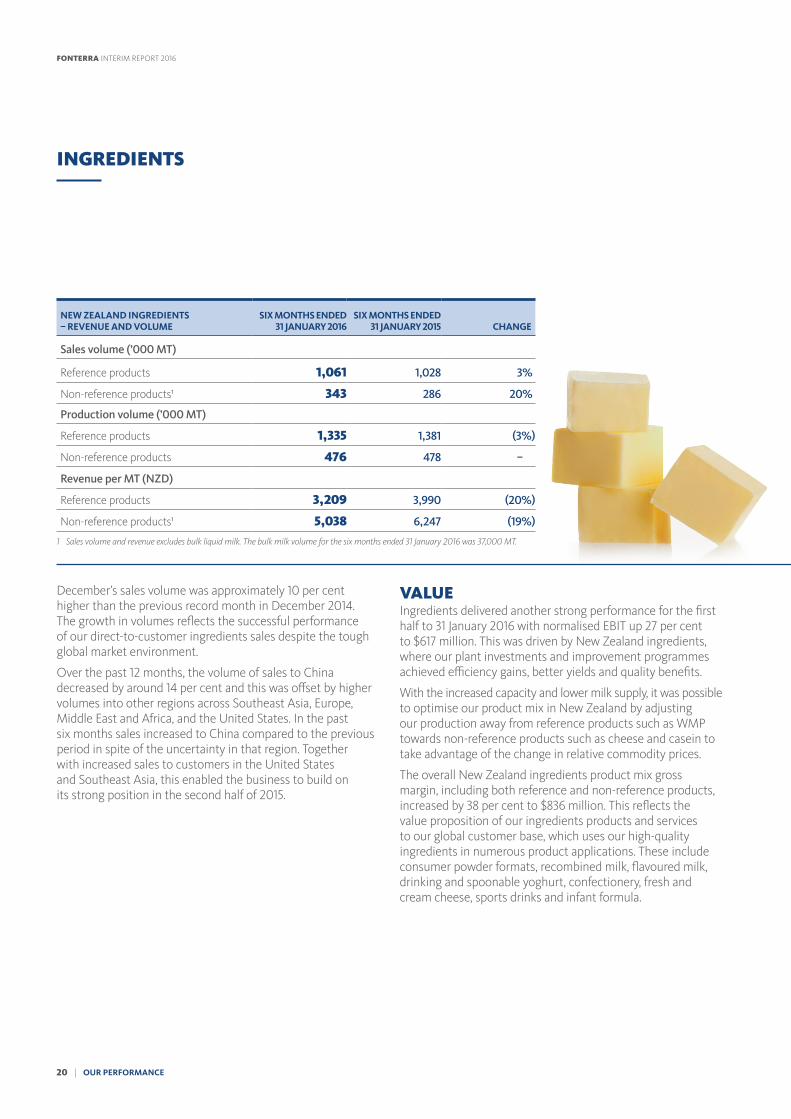
NEW ZEALAND INGREDIENTS – REVENUE AND VOLUME
SIX MONTHS ENDED 31 JANUARY 2016
SIX MONTHS ENDED 31 JANUARY 2015 CHANGE
Sales volume (’000 MT)
Reference products 1,061 1,028 3%
Non-reference products¹ 343 286 20%
Production volume (’000 MT)
Reference products 1,335 1,381 (3%)
Non-reference products 476 478 –
Revenue per MT (NZD)
Reference products 3,209 3,990 (20%)
Non-reference products¹ 5,038 6,247 (19%)
1 Sales volume and revenue excludes bulk liquid milk. The bulk milk volume for the six months ended 31 January 2016 was 37,000 MT.
20 | OUR PERFORMANCE
FONTERRA INTERIM REPORT 2016
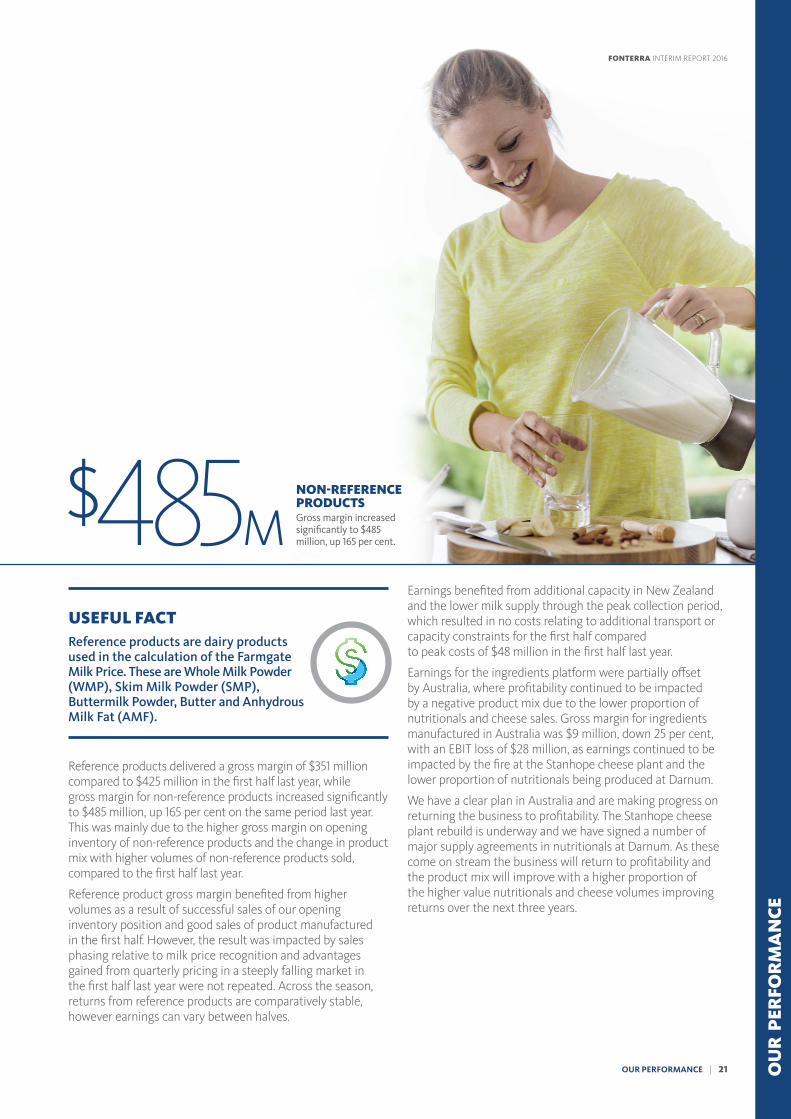
$485M
USEFUL FACT Reference products are dairy products used in the calculation of the Farmgate Milk Price. These are Whole Milk Powder (WMP), Skim Milk Powder (SMP), Buttermilk Powder, Butter and Anhydrous Milk Fat (AMF).
Reference products delivered a gross margin of $351 million compared to $425 million in the first half last year, while gross margin for non-reference products increased significantly to $485 million, up 165 per cent on the same period last year. This was mainly due to the higher gross margin on opening inventory of non-reference products and the change in product mix with higher volumes of non-reference products sold, compared to the first half last year.
Reference product gross margin benefited from higher volumes as a result of successful sales of our opening inventory position and good sales of product manufactured in the first half. However, the result was impacted by sales phasing relative to milk price recognition and advantages gained from quarterly pricing in a steeply falling market in the first half last year were not repeated. Across the season, returns from reference products are comparatively stable, however earnings can vary between halves.
Earnings benefited from additional capacity in New Zealand and the lower milk supply through the peak collection period, which resulted in no costs relating to additional transport or capacity constraints for the first half compared to peak costs of $48 million in the first half last year.
Earnings for the ingredients platform were partially offset by Australia, where profitability continued to be impacted by a negative product mix due to the lower proportion of nutritionals and cheese sales. Gross margin for ingredients manufactured in Australia was $9 million, down 25 per cent, with an EBIT loss of $28 million, as earnings continued to be impacted by the fire at the Stanhope cheese plant and the lower proportion of nutritionals being produced at Darnum.
We have a clear plan in Australia and are making progress on returning the business to profitability. The Stanhope cheese plant rebuild is underway and we have signed a number of major supply agreements in nutritionals at Darnum. As these come on stream the business will return to profitability and the product mix will improve with a higher proportion of the higher value nutritionals and cheese volumes improving returns over the next three years.
NON-REFERENCE PRODUCTSGross margin increased significantly to $485 million, up 165 per cent.
OU
R P
ERFO
RM
AN
CE
OUR PERFORMANCE | 21
FONTERRA INTERIM REPORT 2016
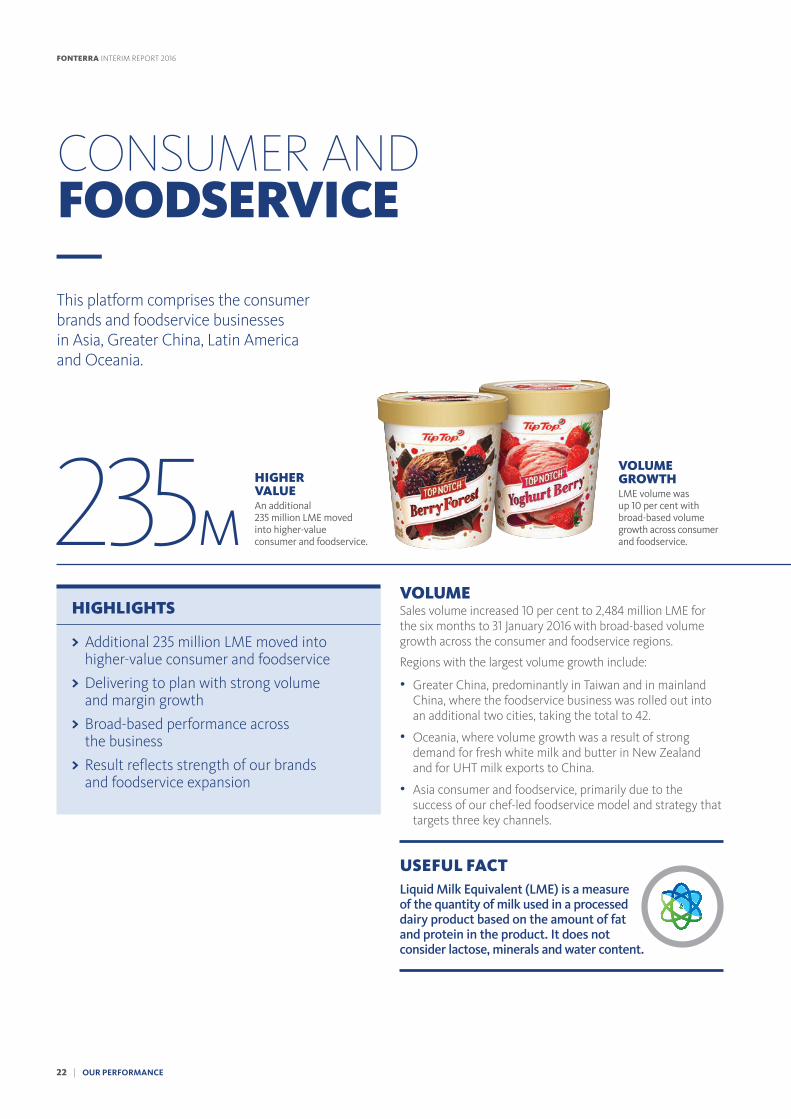
VOLUMESales volume increased 10 per cent to 2,484 million LME for the six months to 31 January 2016 with broad-based volume growth across the consumer and foodservice regions.
Regions with the largest volume growth include:
• Greater China, predominantly in Taiwan and in mainland China, where the foodservice business was rolled out into an additional two cities, taking the total to 42.
• Oceania, where volume growth was a result of strong demand for fresh white milk and butter in New Zealand and for UHT milk exports to China.
• Asia consumer and foodservice, primarily due to the success of our chef-led foodservice model and strategy that targets three key channels.
CONSUMER AND FOODSERVICE
This platform comprises the consumer brands and foodservice businesses in Asia, Greater China, Latin America and Oceania.
USEFUL FACT Liquid Milk Equivalent (LME) is a measure of the quantity of milk used in a processed dairy product based on the amount of fat and protein in the product. It does not consider lactose, minerals and water content.
HIGHER VALUEAn additional 235 million LME moved into higher-value consumer and foodservice.235M
VOLUME GROWTHLME volume was up 10 per cent with broad-based volume growth across consumer and foodservice.
HIGHLIGHTS
> Additional 235 million LME moved into higher-value consumer and foodservice
> Delivering to plan with strong volume and margin growth
> Broad-based performance across the business
> Result reflects strength of our brands and foodservice expansion
22 | OUR PERFORMANCE
FONTERRA INTERIM REPORT 2016
NZD MILLIONSIX MONTHS ENDED
31 JANUARY 2016SIX MONTHS ENDED
31 JANUARY 2015 CHANGE
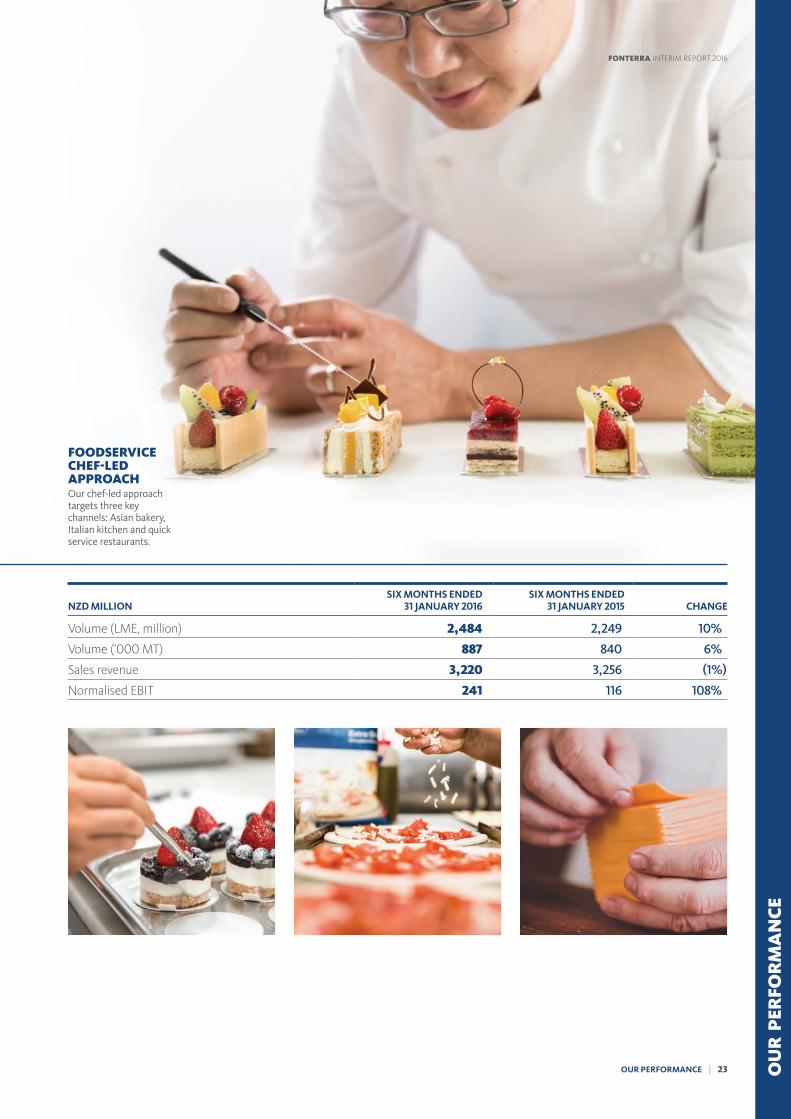
Volume (LME, million) 2,484 2,249 10%
Volume (’000 MT) 887 840 6%
Sales revenue 3,220 3,256 (1%)
Normalised EBIT 241 116 108%
FOODSERVICE CHEF-LED APPROACHOur chef-led approach targets three key channels: Asian bakery, Italian kitchen and quick service restaurants.
OU
R P
ERFO
RM
AN
CE
OUR PERFORMANCE | 23
FONTERRA INTERIM REPORT 2016
CONSUMER AND FOODSERVICE
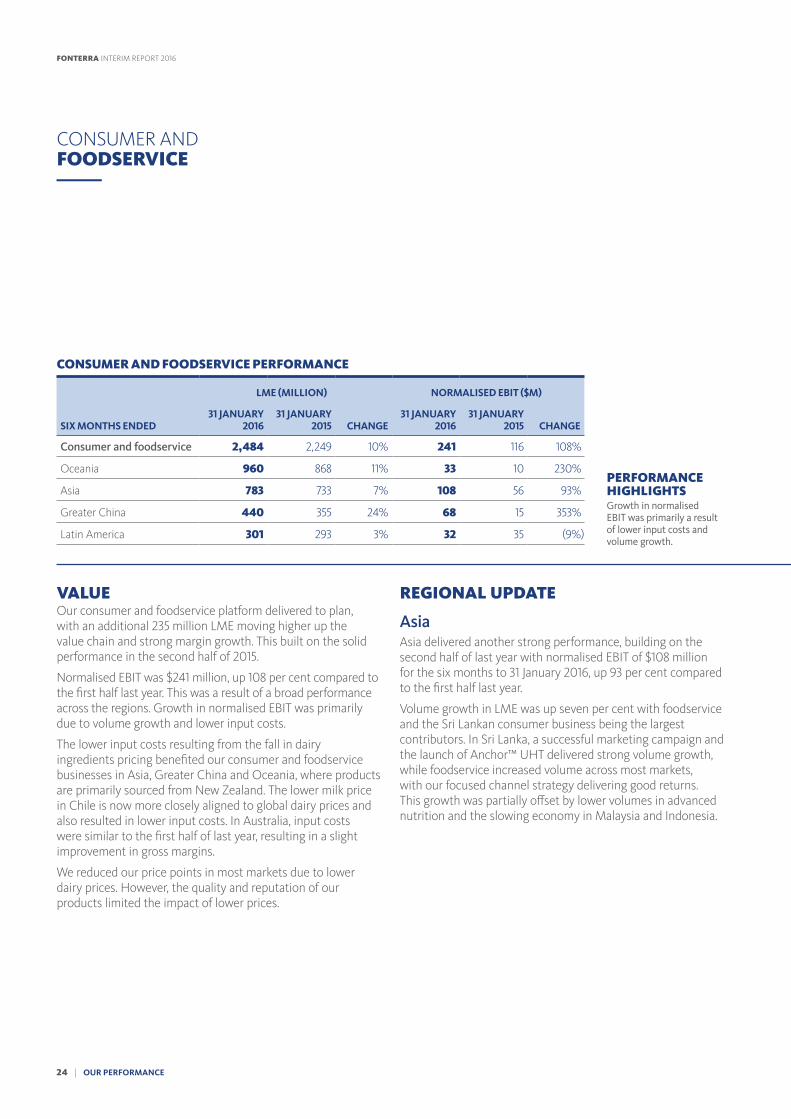
VALUEOur consumer and foodservice platform delivered to plan, with an additional 235 million LME moving higher up the value chain and strong margin growth. This built on the solid performance in the second half of 2015.
Normalised EBIT was $241 million, up 108 per cent compared to the �rst half last year. This was a result of a broad performance across the regions. Growth in normalised EBIT was primarily due to volume growth and lower input costs.
The lower input costs resulting from the fall in dairy ingredients pricing bene�ted our consumer and foodservice businesses in Asia, Greater China and Oceania, where products are primarily sourced from New Zealand. The lower milk price in Chile is now more closely aligned to global dairy prices and also resulted in lower input costs. In Australia, input costs were similar to the �rst half of last year, resulting in a slight improvement in gross margins.
We reduced our price points in most markets due to lower dairy prices. However, the quality and reputation of our products limited the impact of lower prices.
REGIONAL UPDATE
AsiaAsia delivered another strong performance, building on the second half of last year with normalised EBIT of $108 million for the six months to 31 January 2016, up 93 per cent compared to the �rst half last year.
Volume growth in LME was up seven per cent with foodservice and the Sri Lankan consumer business being the largest contributors. In Sri Lanka, a successful marketing campaign and the launch of Anchor™ UHT delivered strong volume growth, while foodservice increased volume across most markets, with our focused channel strategy delivering good returns. This growth was partially o¢set by lower volumes in advanced nutrition and the slowing economy in Malaysia and Indonesia.
PERFORMANCE HIGHLIGHTSGrowth in normalised EBIT was primarily a result of lower input costs and volume growth.
CONSUMER AND FOODSERVICE PERFORMANCE
LME (MILLION) NORMALISED EBIT ($M)
SIX MONTHS ENDED31 JANUARY
201631 JANUARY
2015 CHANGE31 JANUARY
201631 JANUARY
2015 CHANGE
Consumer and foodservice 2,484 2,249 10% 241 116 108%
Oceania 960 868 11% 33 10 230%
Asia 783 733 7% 108 56 93%
Greater China 440 355 24% 68 15 353%
Latin America 301 293 3% 32 35 (9%)
24 | OUR PERFORMANCE
FONTERRA INTERIM REPORT 2016
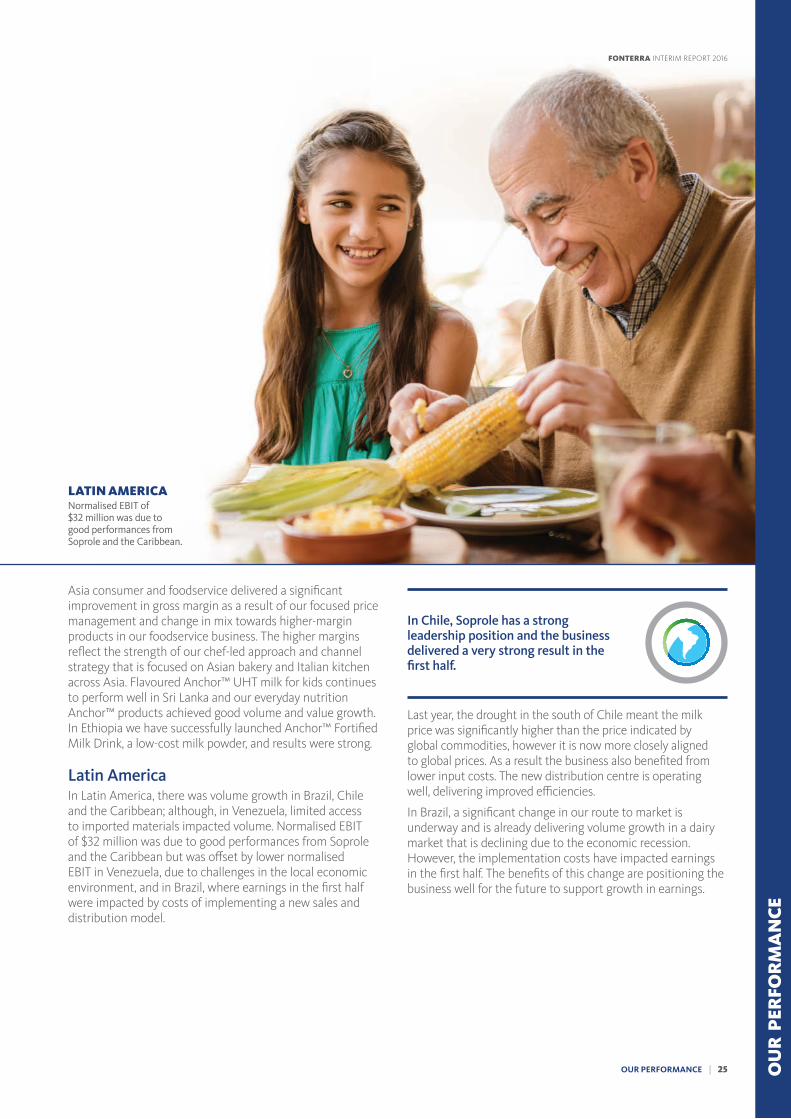
Asia consumer and foodservice delivered a signi�cant improvement in gross margin as a result of our focused price management and change in mix towards higher-margin products in our foodservice business. The higher margins re ect the strength of our chef-led approach and channel strategy that is focused on Asian bakery and Italian kitchen across Asia. Flavoured Anchor™ UHT milk for kids continues to perform well in Sri Lanka and our everyday nutrition Anchor™ products achieved good volume and value growth. In Ethiopia we have successfully launched Anchor™ Forti�ed Milk Drink, a low-cost milk powder, and results were strong.
Latin AmericaIn Latin America, there was volume growth in Brazil, Chile and the Caribbean; although, in Venezuela, limited access to imported materials impacted volume. Normalised EBIT of $32 million was due to good performances from Soprole and the Caribbean but was o¢set by lower normalised EBIT in Venezuela, due to challenges in the local economic environment, and in Brazil, where earnings in the �rst half were impacted by costs of implementing a new sales and distribution model.
In Chile, Soprole has a strong leadership position and the business delivered a very strong result in the �rst half.
Last year, the drought in the south of Chile meant the milk price was signi�cantly higher than the price indicated by global commodities, however it is now more closely aligned to global prices. As a result the business also bene�ted from lower input costs. The new distribution centre is operating well, delivering improved e¯ciencies.
In Brazil, a signi�cant change in our route to market is underway and is already delivering volume growth in a dairy market that is declining due to the economic recession. However, the implementation costs have impacted earnings in the �rst half. The bene�ts of this change are positioning the business well for the future to support growth in earnings.
LATIN AMERICANormalised EBIT of $32 million was due to good performances from Soprole and the Caribbean.
OU
R P
ERFO
RM
AN
CE
OUR PERFORMANCE | 25
FONTERRA INTERIM REPORT 2016
CONSUMER AND FOODSERVICE
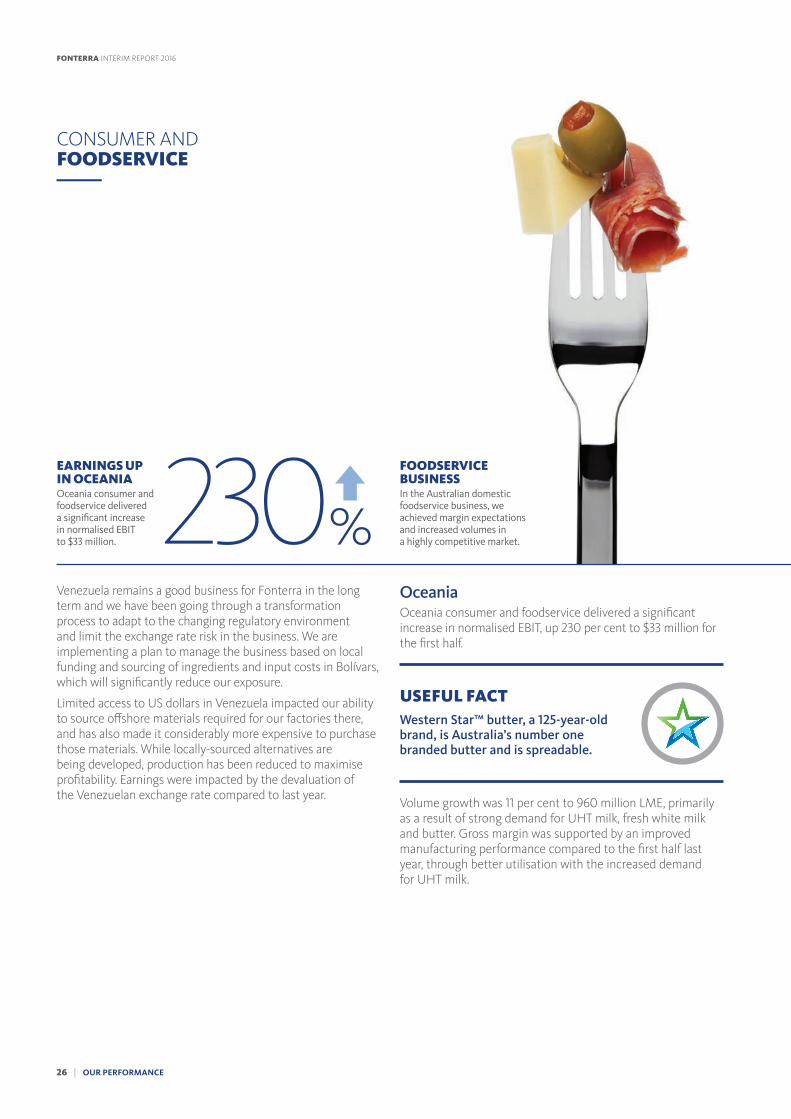
Venezuela remains a good business for Fonterra in the long term and we have been going through a transformation process to adapt to the changing regulatory environment and limit the exchange rate risk in the business. We are implementing a plan to manage the business based on local funding and sourcing of ingredients and input costs in Bolívars, which will signi�cantly reduce our exposure.
Limited access to US dollars in Venezuela impacted our ability to source o¢shore materials required for our factories there, and has also made it considerably more expensive to purchase those materials. While locally-sourced alternatives are being developed, production has been reduced to maximise pro�tability. Earnings were impacted by the devaluation of the Venezuelan exchange rate compared to last year.
OceaniaOceania consumer and foodservice delivered a signi�cant increase in normalised EBIT, up 230 per cent to $33 million for the �rst half.
USEFUL FACT Western Star™ butter, a 125-year-old brand, is Australia’s number one branded butter and is spreadable.
Volume growth was 11 per cent to 960 million LME, primarily as a result of strong demand for UHT milk, fresh white milk and butter. Gross margin was supported by an improved manufacturing performance compared to the �rst half last year, through better utilisation with the increased demand for UHT milk.
230EARNINGS UP IN OCEANIAOceania consumer and foodservice delivered a signi�cant increase in normalised EBIT to $33 million.
FOODSERVICE BUSINESSIn the Australian domestic foodservice business, we achieved margin expectations and increased volumes in a highly competitive market.%
26 | OUR PERFORMANCE
FONTERRA INTERIM REPORT 2016
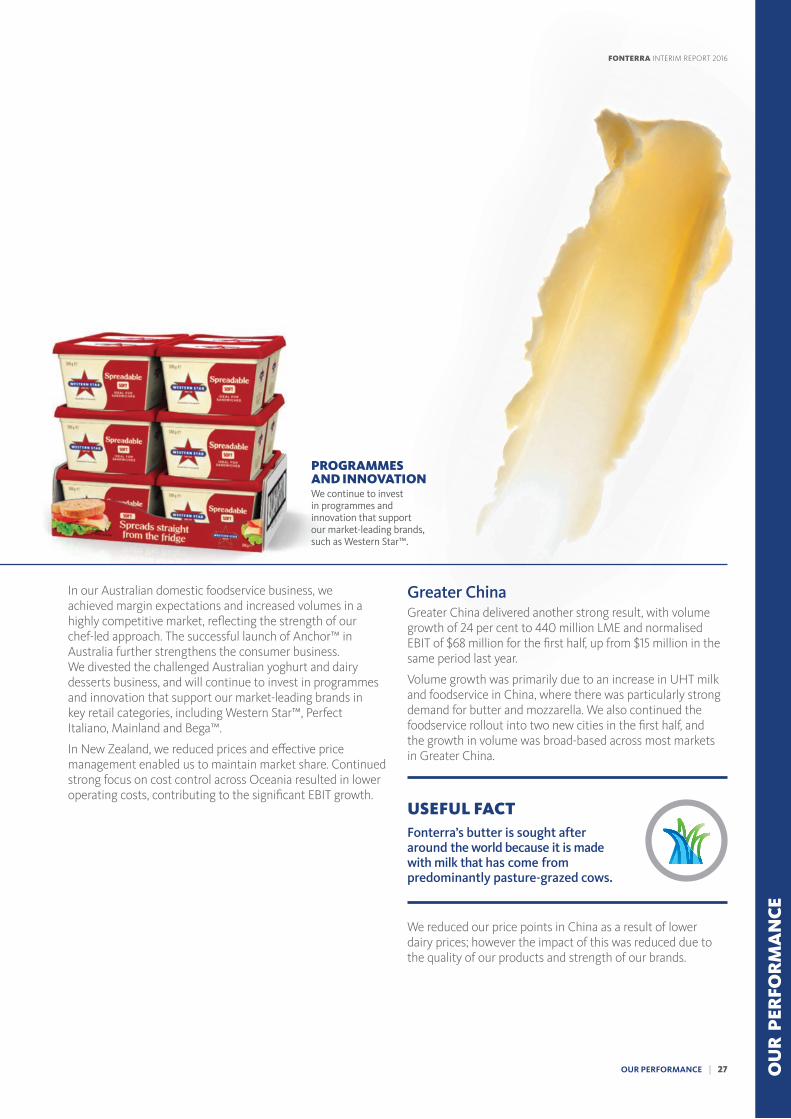
PROGRAMMES AND INNOVATIONWe continue to invest in programmes and innovation that support our market-leading brands, such as Western Star™.
In our Australian domestic foodservice business, we achieved margin expectations and increased volumes in a highly competitive market, re ecting the strength of our chef-led approach. The successful launch of Anchor™ in Australia further strengthens the consumer business. We divested the challenged Australian yoghurt and dairy desserts business, and will continue to invest in programmes and innovation that support our market-leading brands in key retail categories, including Western Star™, Perfect Italiano, Mainland and Bega™.
In New Zealand, we reduced prices and e¢ective price management enabled us to maintain market share. Continued strong focus on cost control across Oceania resulted in lower operating costs, contributing to the signi�cant EBIT growth.
Greater ChinaGreater China delivered another strong result, with volume growth of 24 per cent to 440 million LME and normalised EBIT of $68 million for the �rst half, up from $15 million in the same period last year.
Volume growth was primarily due to an increase in UHT milk and foodservice in China, where there was particularly strong demand for butter and mozzarella. We also continued the foodservice rollout into two new cities in the �rst half, and the growth in volume was broad-based across most markets in Greater China.
USEFUL FACT Fonterra’s butter is sought after around the world because it is made with milk that has come from predominantly pasture-grazed cows.
We reduced our price points in China as a result of lower dairy prices; however the impact of this was reduced due to the quality of our products and strength of our brands.
OU
R P
ERFO
RM
AN
CE
OUR PERFORMANCE | 27
FONTERRA INTERIM REPORT 2016
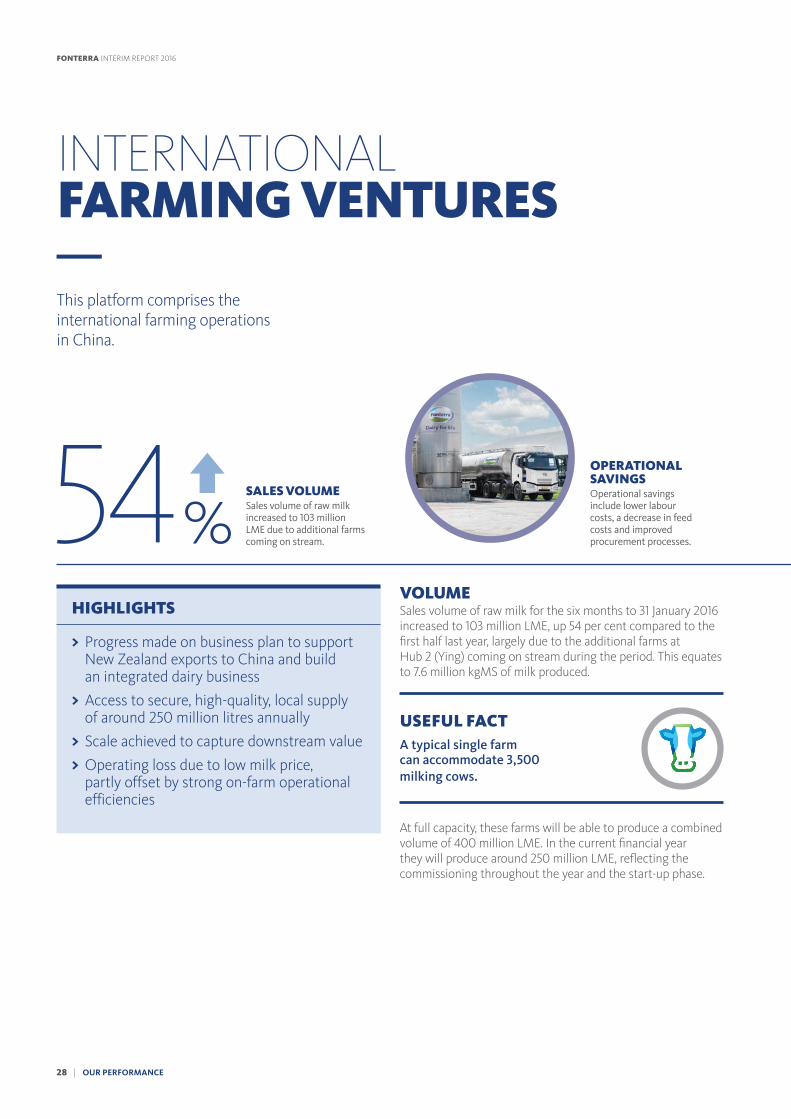
OPERATIONAL SAVINGSOperational savings include lower labour costs, a decrease in feed costs and improved procurement processes.
VOLUMESales volume of raw milk for the six months to 31 January 2016 increased to 103 million LME, up 54 per cent compared to the �rst half last year, largely due to the additional farms at Hub 2 (Ying) coming on stream during the period. This equates to 7.6 million kgMS of milk produced.
USEFUL FACT A typical single farm can accommodate 3,500 milking cows.
At full capacity, these farms will be able to produce a combined volume of 400 million LME. In the current �nancial year they will produce around 250 million LME, re ecting the commissioning throughout the year and the start-up phase.
INTERNATIONAL FARMING VENTURES
This platform comprises the international farming operations in China.
54%SALES VOLUMESales volume of raw milk increased to 103 million LME due to additional farms coming on stream.
HIGHLIGHTS
> Progress made on business plan to support New Zealand exports to China and build an integrated dairy business
> Access to secure, high-quality, local supply of around 250 million litres annually
> Scale achieved to capture downstream value
> Operating loss due to low milk price, partly offset by strong on-farm operational efficiencies
28 | OUR PERFORMANCE
FONTERRA INTERIM REPORT 2016
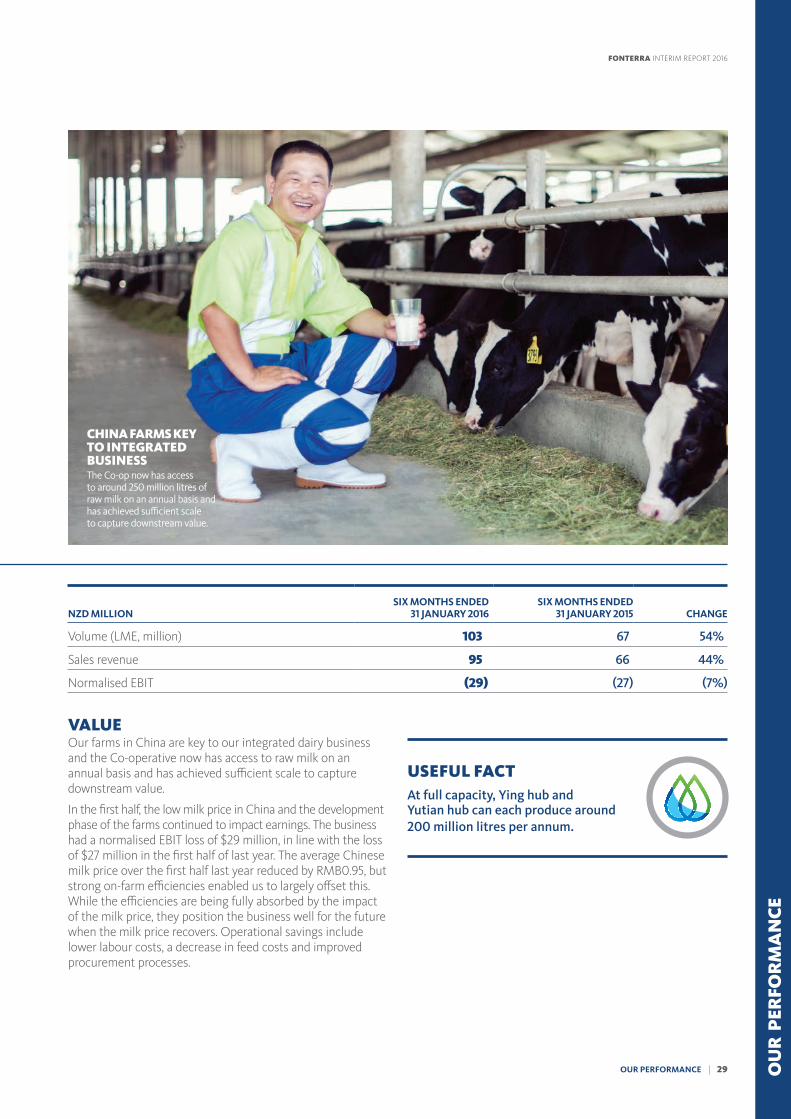
VALUEOur farms in China are key to our integrated dairy business and the Co-operative now has access to raw milk on an annual basis and has achieved sufficient scale to capture downstream value.
In the first half, the low milk price in China and the development phase of the farms continued to impact earnings. The business had a normalised EBIT loss of $29 million, in line with the loss of $27 million in the first half of last year. The average Chinese milk price over the first half last year reduced by RMB0.95, but strong on-farm efficiencies enabled us to largely offset this. While the efficiencies are being fully absorbed by the impact of the milk price, they position the business well for the future when the milk price recovers. Operational savings include lower labour costs, a decrease in feed costs and improved procurement processes.
NZD MILLIONSIX MONTHS ENDED
31 JANUARY 2016SIX MONTHS ENDED
31 JANUARY 2015 CHANGE
Volume (LME, million) 103 67 54%
Sales revenue 95 66 44%
Normalised EBIT (29) (27) (7%)
USEFUL FACT At full capacity, Ying hub and Yutian hub can each produce around 200 million litres per annum.
CHINA FARMS KEY TO INTEGRATED BUSINESSThe Co-op now has access to around 250 million litres of raw milk on an annual basis and has achieved sufficient scale to capture downstream value.
OU
R P
ERFO
RM
AN
CE
OUR PERFORMANCE | 29
FONTERRA INTERIM REPORT 2016
INTERIM FINANCIAL STATEMENTS
For the six months ended 31 January 2016
CONTENTS
DIRECTORS’ STATEMENT 31
INCOME STATEMENT 32
STATEMENT OF COMPREHENSIVE INCOME 33
STATEMENT OF FINANCIAL POSITION 34
STATEMENT OF CHANGES IN EQUITY 35
CASH FLOW STATEMENT 36
BASIS OF PREPARATION 37
NOTES TO THE FINANCIAL STATEMENTS 38
30 | INTERIM FINANCIAL STATEMENTS
FONTERRA INTERIM REPORT 2016
DIRECTORS’ STATEMENT FOR THE SIX MONTHS ENDED 31 JANUARY 2016
The Directors of Fonterra Co-operative Group Limited (Fonterra) are pleased to present to Shareholders the financial statements for Fonterra and its subsidiaries (together the Group) and the Group’s interest in its equity accounted investees for the six months ended 31 January 2016.
The Directors present financial statements for the six months which fairly present the financial position of the Group and its financial performance and cash flows for that period.
The Directors consider the financial statements of the Group have been prepared using accounting policies which have been consistently applied and supported by reasonable judgements and estimates, and that all relevant financial reporting and accounting standards have been followed.
The Directors believe that proper accounting records have been kept which enable, with reasonable accuracy, the determination of the financial position of the Group and facilitate compliance of the financial statements with the NZX Listing Rules.
The Directors consider that they have taken adequate steps to safeguard the assets of the Group, and to prevent and detect fraud and other irregularities.
The Directors hereby approve and authorise for issue the financial statements for the six months ended 31 January 2016 presented on pages 32 to 48.
For and on behalf of the Board:
JOHN WILSON DAVID JACKSONCHAIRMAN DIRECTOR
22 March 2016 22 March 2016
INTERIM FINANCIAL STATEMENTS | 31
FONTERRA INTERIM REPORT 2016
OU
R P
ERFO
RM
AN
CE
The accompanying notes form part of these interim financial statements.
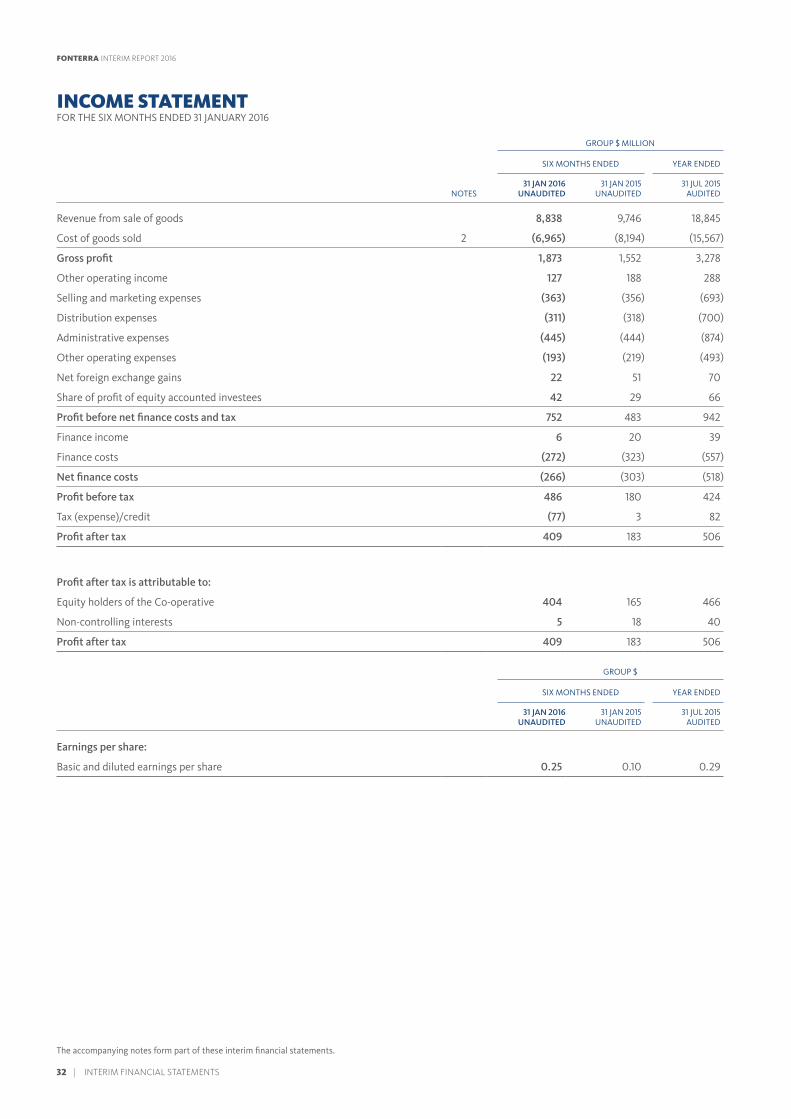
INCOME STATEMENTFOR THE SIX MONTHS ENDED 31 JANUARY 2016
GROUP $ MILLION
SIX MONTHS ENDED YEAR ENDED
NOTES31 JAN 2016
UNAUDITED31 JAN 2015
UNAUDITED31 JUL 2015
AUDITED
Revenue from sale of goods 8,838 9,746 18,845
Cost of goods sold 2 (6,965) (8,194) (15,567)
Gross profit 1,873 1,552 3,278
Other operating income 127 188 288
Selling and marketing expenses (363) (356) (693)
Distribution expenses (311) (318) (700)
Administrative expenses (445) (444) (874)
Other operating expenses (193) (219) (493)
Net foreign exchange gains 22 51 70
Share of profit of equity accounted investees 42 29 66
Profit before net finance costs and tax 752 483 942
Finance income 6 20 39
Finance costs (272) (323) (557)
Net finance costs (266) (303) (518)
Profit before tax 486 180 424
Tax (expense)/credit (77) 3 82
Profit after tax 409 183 506
Profit after tax is attributable to:
Equity holders of the Co-operative 404 165 466
Non-controlling interests 5 18 40
Profit after tax 409 183 506
GROUP $
SIX MONTHS ENDED YEAR ENDED
31 JAN 2016 UNAUDITED
31 JAN 2015 UNAUDITED
31 JUL 2015 AUDITED
Earnings per share:
Basic and diluted earnings per share 0.25 0.10 0.29
32 | INTERIM FINANCIAL STATEMENTS
FONTERRA INTERIM REPORT 2016
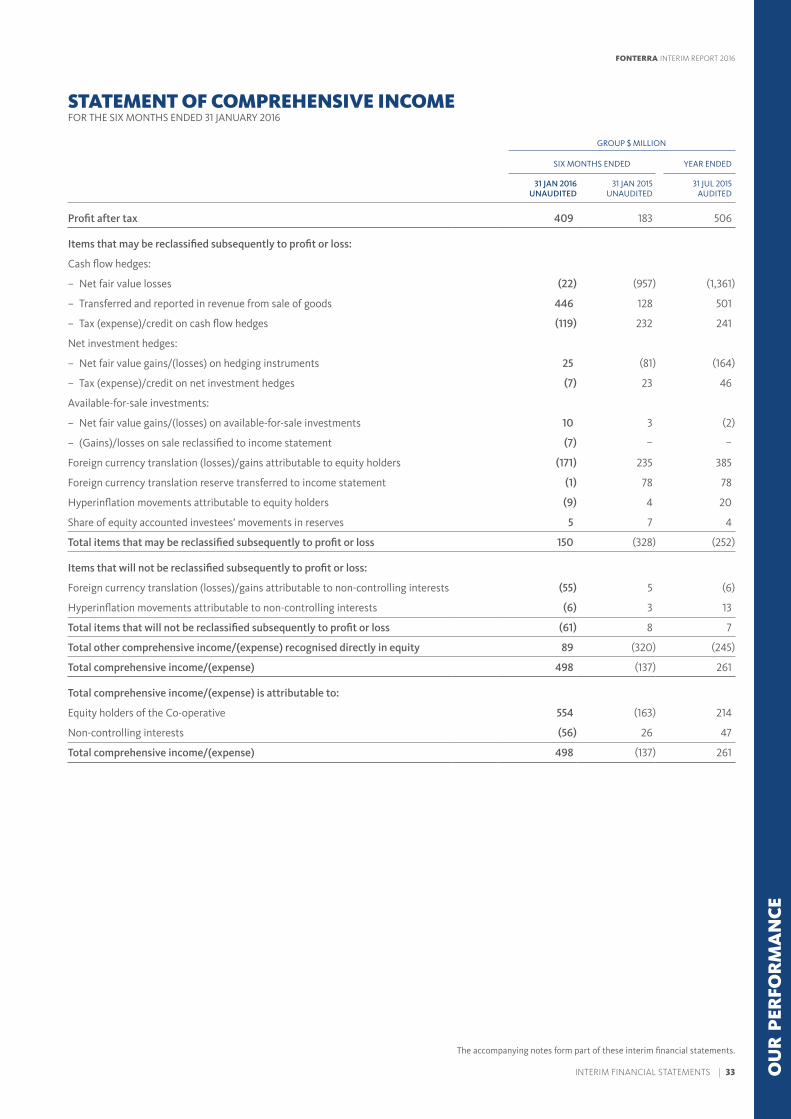
STATEMENT OF COMPREHENSIVE INCOMEFOR THE SIX MONTHS ENDED 31 JANUARY 2016
The accompanying notes form part of these interim financial statements.
GROUP $ MILLION
SIX MONTHS ENDED YEAR ENDED
31 JAN 2016 UNAUDITED
31 JAN 2015 UNAUDITED
31 JUL 2015 AUDITED
Profit after tax 409 183 506
Items that may be reclassified subsequently to profit or loss:
Cash flow hedges:
– Net fair value losses (22) (957) (1,361)
– Transferred and reported in revenue from sale of goods 446 128 501
– Tax (expense)/credit on cash flow hedges (119) 232 241
Net investment hedges:
– Net fair value gains/(losses) on hedging instruments 25 (81) (164)
– Tax (expense)/credit on net investment hedges (7) 23 46
Available-for-sale investments:
– Net fair value gains/(losses) on available-for-sale investments 10 3 (2)
– (Gains)/losses on sale reclassified to income statement (7) – –
Foreign currency translation (losses)/gains attributable to equity holders (171) 235 385
Foreign currency translation reserve transferred to income statement (1) 78 78
Hyperinflation movements attributable to equity holders (9) 4 20
Share of equity accounted investees’ movements in reserves 5 7 4
Total items that may be reclassified subsequently to profit or loss 150 (328) (252)
Items that will not be reclassified subsequently to profit or loss:
Foreign currency translation (losses)/gains attributable to non-controlling interests (55) 5 (6)
Hyperinflation movements attributable to non-controlling interests (6) 3 13
Total items that will not be reclassified subsequently to profit or loss (61) 8 7
Total other comprehensive income/(expense) recognised directly in equity 89 (320) (245)
Total comprehensive income/(expense) 498 (137) 261
Total comprehensive income/(expense) is attributable to:
Equity holders of the Co-operative 554 (163) 214
Non-controlling interests (56) 26 47
Total comprehensive income/(expense) 498 (137) 261
INTERIM FINANCIAL STATEMENTS | 33
FONTERRA INTERIM REPORT 2016
OU
R P
ERFO
RM
AN
CE
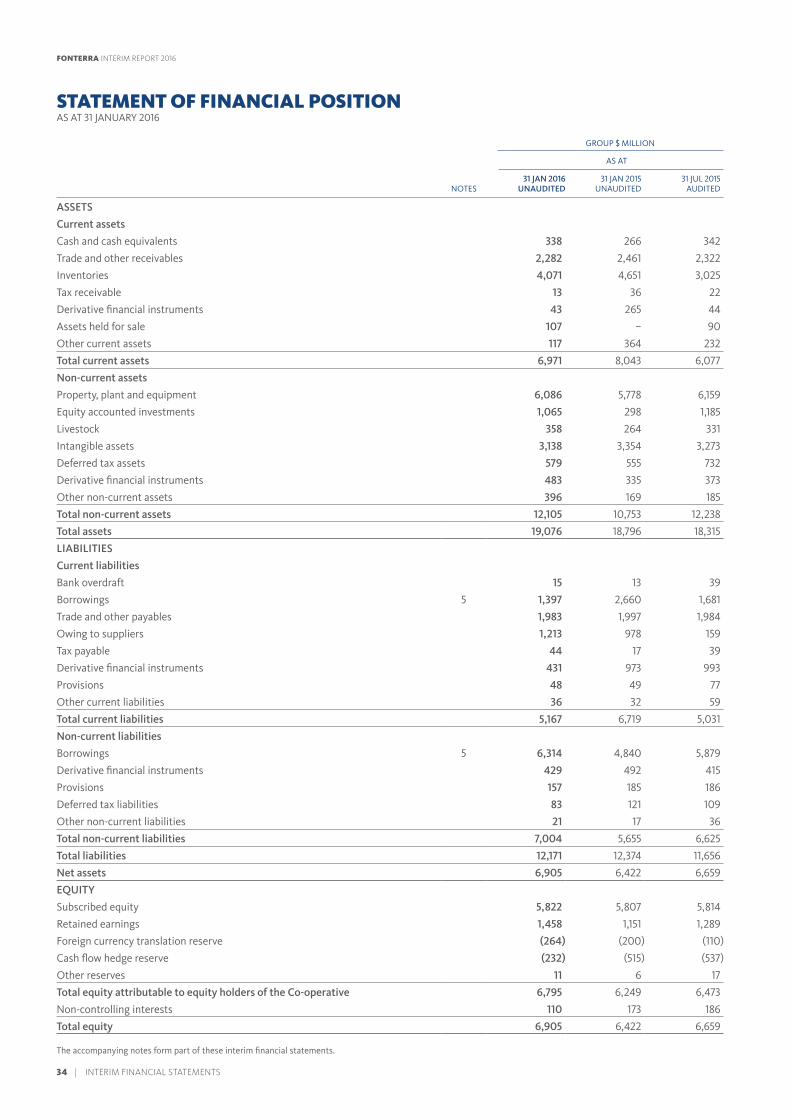
STATEMENT OF FINANCIAL POSITIONAS AT 31 JANUARY 2016
GROUP $ MILLION
AS AT
NOTES31 JAN 2016
UNAUDITED31 JAN 2015
UNAUDITED31 JUL 2015
AUDITED
ASSETS
Current assets
Cash and cash equivalents 338 266 342
Trade and other receivables 2,282 2,461 2,322
Inventories 4,071 4,651 3,025
Tax receivable 13 36 22
Derivative financial instruments 43 265 44
Assets held for sale 107 – 90
Other current assets 117 364 232
Total current assets 6,971 8,043 6,077
Non-current assets
Property, plant and equipment 6,086 5,778 6,159
Equity accounted investments 1,065 298 1,185
Livestock 358 264 331
Intangible assets 3,138 3,354 3,273
Deferred tax assets 579 555 732
Derivative financial instruments 483 335 373
Other non-current assets 396 169 185
Total non-current assets 12,105 10,753 12,238
Total assets 19,076 18,796 18,315
LIABILITIES
Current liabilities
Bank overdraft 15 13 39
Borrowings 5 1,397 2,660 1,681
Trade and other payables 1,983 1,997 1,984
Owing to suppliers 1,213 978 159
Tax payable 44 17 39
Derivative financial instruments 431 973 993
Provisions 48 49 77
Other current liabilities 36 32 59
Total current liabilities 5,167 6,719 5,031
Non-current liabilities
Borrowings 5 6,314 4,840 5,879
Derivative financial instruments 429 492 415
Provisions 157 185 186
Deferred tax liabilities 83 121 109
Other non-current liabilities 21 17 36
Total non-current liabilities 7,004 5,655 6,625
Total liabilities 12,171 12,374 11,656
Net assets 6,905 6,422 6,659
EQUITY
Subscribed equity 5,822 5,807 5,814
Retained earnings 1,458 1,151 1,289
Foreign currency translation reserve (264) (200) (110)
Cash flow hedge reserve (232) (515) (537)
Other reserves 11 6 17
Total equity attributable to equity holders of the Co-operative 6,795 6,249 6,473
Non-controlling interests 110 173 186
Total equity 6,905 6,422 6,659
The accompanying notes form part of these interim financial statements.
34 | INTERIM FINANCIAL STATEMENTS
FONTERRA INTERIM REPORT 2016
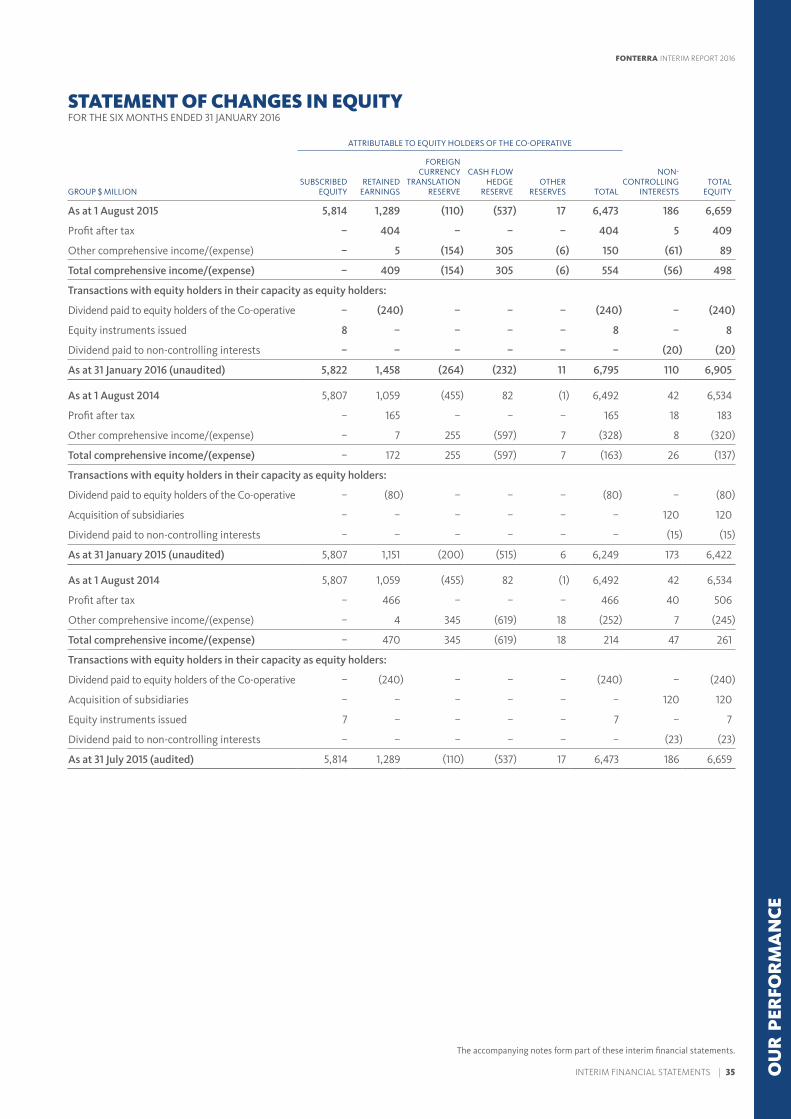
STATEMENT OF CHANGES IN EQUITYFOR THE SIX MONTHS ENDED 31 JANUARY 2016
ATTRIBUTABLE TO EQUITY HOLDERS OF THE CO-OPERATIVE
GROUP $ MILLIONSUBSCRIBED
EQUITYRETAINED
EARNINGS
FOREIGN CURRENCY
TRANSLATION RESERVE
CASH FLOW HEDGE
RESERVEOTHER
RESERVES TOTAL
NON-CONTROLLING
INTERESTSTOTAL
EQUITY
As at 1 August 2015 5,814 1,289 (110) (537) 17 6,473 186 6,659
Profit after tax – 404 – – – 404 5 409
Other comprehensive income/(expense) – 5 (154) 305 (6) 150 (61) 89
Total comprehensive income/(expense) – 409 (154) 305 (6) 554 (56) 498
Transactions with equity holders in their capacity as equity holders:
Dividend paid to equity holders of the Co-operative – (240) – – – (240) – (240)
Equity instruments issued 8 – – – – 8 – 8
Dividend paid to non-controlling interests – – – – – – (20) (20)
As at 31 January 2016 (unaudited) 5,822 1,458 (264) (232) 11 6,795 110 6,905
As at 1 August 2014 5,807 1,059 (455) 82 (1) 6,492 42 6,534
Profit after tax – 165 – – – 165 18 183
Other comprehensive income/(expense) – 7 255 (597) 7 (328) 8 (320)
Total comprehensive income/(expense) – 172 255 (597) 7 (163) 26 (137)
Transactions with equity holders in their capacity as equity holders:
Dividend paid to equity holders of the Co-operative – (80) – – – (80) – (80)
Acquisition of subsidiaries – – – – – – 120 120
Dividend paid to non-controlling interests – – – – – – (15) (15)
As at 31 January 2015 (unaudited) 5,807 1,151 (200) (515) 6 6,249 173 6,422
As at 1 August 2014 5,807 1,059 (455) 82 (1) 6,492 42 6,534
Profit after tax – 466 – – – 466 40 506
Other comprehensive income/(expense) – 4 345 (619) 18 (252) 7 (245)
Total comprehensive income/(expense) – 470 345 (619) 18 214 47 261
Transactions with equity holders in their capacity as equity holders:
Dividend paid to equity holders of the Co-operative – (240) – – – (240) – (240)
Acquisition of subsidiaries – – – – – – 120 120
Equity instruments issued 7 – – – – 7 – 7
Dividend paid to non-controlling interests – – – – – – (23) (23)
As at 31 July 2015 (audited) 5,814 1,289 (110) (537) 17 6,473 186 6,659
The accompanying notes form part of these interim financial statements.
INTERIM FINANCIAL STATEMENTS | 35
FONTERRA INTERIM REPORT 2016
OU
R P
ERFO
RM
AN
CE
The accompanying notes form part of these interim financial statements.
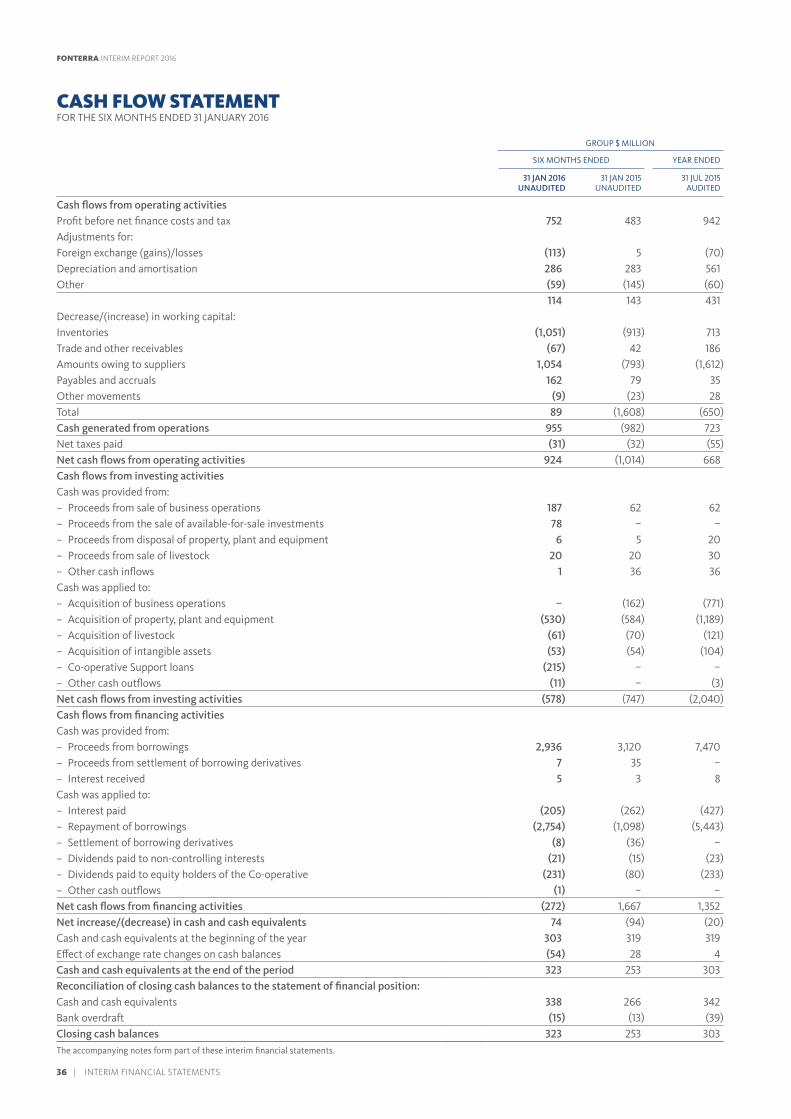
CASH FLOW STATEMENTFOR THE SIX MONTHS ENDED 31 JANUARY 2016
GROUP $ MILLION
SIX MONTHS ENDED YEAR ENDED
31 JAN 2016 UNAUDITED
31 JAN 2015 UNAUDITED
31 JUL 2015 AUDITED
Cash flows from operating activitiesProfit before net finance costs and tax 752 483 942Adjustments for:Foreign exchange (gains)/losses (113) 5 (70)Depreciation and amortisation 286 283 561Other (59) (145) (60)
114 143 431Decrease/(increase) in working capital:Inventories (1,051) (913) 713Trade and other receivables (67) 42 186Amounts owing to suppliers 1,054 (793) (1,612)Payables and accruals 162 79 35Other movements (9) (23) 28Total 89 (1,608) (650)Cash generated from operations 955 (982) 723Net taxes paid (31) (32) (55)Net cash flows from operating activities 924 (1,014) 668Cash flows from investing activitiesCash was provided from:
– Proceeds from sale of business operations 187 62 62 – Proceeds from the sale of available-for-sale investments 78 – – – Proceeds from disposal of property, plant and equipment 6 5 20 – Proceeds from sale of livestock 20 20 30 – Other cash inflows 1 36 36
Cash was applied to: – Acquisition of business operations – (162) (771) – Acquisition of property, plant and equipment (530) (584) (1,189) – Acquisition of livestock (61) (70) (121) – Acquisition of intangible assets (53) (54) (104) – Co-operative Support loans (215) – – – Other cash outflows (11) – (3)
Net cash flows from investing activities (578) (747) (2,040)Cash flows from financing activitiesCash was provided from:
– Proceeds from borrowings 2,936 3,120 7,470 – Proceeds from settlement of borrowing derivatives 7 35 – – Interest received 5 3 8
Cash was applied to: – Interest paid (205) (262) (427) – Repayment of borrowings (2,754) (1,098) (5,443) – Settlement of borrowing derivatives (8) (36) – – Dividends paid to non-controlling interests (21) (15) (23) – Dividends paid to equity holders of the Co-operative (231) (80) (233) – Other cash outflows (1) – –
Net cash flows from financing activities (272) 1,667 1,352Net increase/(decrease) in cash and cash equivalents 74 (94) (20)Cash and cash equivalents at the beginning of the year 303 319 319Effect of exchange rate changes on cash balances (54) 28 4Cash and cash equivalents at the end of the period 323 253 303Reconciliation of closing cash balances to the statement of financial position:Cash and cash equivalents 338 266 342Bank overdraft (15) (13) (39)Closing cash balances 323 253 303
36 | INTERIM FINANCIAL STATEMENTS
FONTERRA INTERIM REPORT 2016
A) GENERAL INFORMATION
Fonterra Co-operative Group Limited (Fonterra or the Co-operative) is a co-operative company incorporated and domiciled in New Zealand. Fonterra is registered under the Companies Act 1993 and the Co-operative Companies Act 1996, and is an FMC Reporting Entity under the Financial Markets Conduct Act 2013. Fonterra is also required to comply with the Dairy Industry Restructuring Act 2001.
These consolidated interim financial statements of Fonterra, as at and for the six months ending 31 January 2016, comprise Fonterra and its subsidiaries (together the Group) and the Group’s interest in its equity accounted investees.
The Group operates predominantly in the international dairy industry. The Group is primarily involved in the collection, manufacture and sale of milk and milk derived products and in fast moving consumer goods and foodservice businesses.
B) BASIS OF PREPARATION
These consolidated interim financial statements have been prepared in accordance with International Accounting Standard 34: Interim Financial Reporting and New Zealand Equivalent to International Accounting Standard 34: Interim Financial Reporting. They have also been prepared in accordance with New Zealand Generally Accepted Accounting Practice (NZ GAAP). They should be read in conjunction with the consolidated financial statements for the year ended 31 July 2015.
These consolidated interim financial statements are presented in New Zealand Dollars ($ or NZD), which is Fonterra’s functional currency, and rounded to the nearest million, except where otherwise stated.
The preparation of interim financial statements requires management to make judgements, estimates and assumptions that affect the application of accounting policies and the reported amounts of assets and liabilities, income and expenses. Actual results may differ from these estimates. In preparing these consolidated interim financial statements the significant judgements made by management in applying the Group’s accounting policies and the key sources of estimation uncertainty were the same as those applied to the consolidated financial statements for the year ended 31 July 2015.
C) ACCOUNTING POLICIES
The same accounting policies are followed in these consolidated interim financial statements as were applied in the Group’s financial statements for the year ended 31 July 2015. The accounting policy for the Fonterra Co-operative Support loans is set out below, as these loans were a new transaction for Fonterra during the period.
Fonterra Co-operative Support loansFonterra Co-operative Support loans are initially recorded at fair value. As the loans are interest free, there is a difference between the cash advanced and the loans’ fair value. This difference is recorded within finance costs at the date Fonterra is contractually committed to advance the funds. Finance income is recognised using the notional interest rate implicit in the loans, over the periods until the loans are repaid.
BASIS OF PREPARATION FOR THE SIX MONTHS ENDED 31 JANUARY 2016
INTERIM FINANCIAL STATEMENTS | 37
FONTERRA INTERIM REPORT 2016
OU
R P
ERFO
RM
AN
CE
PERFORMANCE
1 SEGMENT REPORTING
a) Operating segmentsThe Group has five reportable segments that reflect the Group’s management and reporting structure as viewed by the Fonterra Management Team. Transactions between segments are based on estimated market prices.
REPORTABLE SEGMENT DESCRIPTION
Global Ingredients and Operations
Represents the collection, processing and distribution of New Zealand milk, global sales and marketing of New Zealand and non-New Zealand milk products (including Quick Service Restaurants in Asia and Greater China), Global Brands and Nutrition, Co-operative Affairs, Fonterra Farm Source stores and Group Services.
Oceania Represents Fast Moving Consumer Goods (FMCG) businesses in New Zealand (including export to the Pacific Islands) and all FMCG and ingredients businesses in Australia (including Milk Supply and Manufacturing). It includes foodservice sales in Australia and New Zealand.
Asia Represents FMCG and foodservice businesses (excluding Quick Service Restaurants) in Asia (excluding Greater China), Africa and the Middle East.
Greater China Represents FMCG, foodservice (excluding Quick Service Restaurants) and farming businesses in Greater China.
Latin America Represents FMCG and ingredients businesses in South America and the Caribbean.
From 1 August 2015, Fonterra’s organisational structure was realigned and as a result the Fonterra Farm Source stores have moved out of Oceania into Global Ingredients and Operations. Comparatives have been restated to reflect these changes.
NOTES TO THE FINANCIAL STATEMENTS FOR THE SIX MONTHS ENDED 31 JANUARY 2016
38 | INTERIM FINANCIAL STATEMENTS
FONTERRA INTERIM REPORT 2016
a) Operating segments continued
GROUP $ MILLION
GLOBAL INGREDIENTS AND
OPERATIONS OCEANIA ASIAGREATER
CHINALATIN
AMERICA ELIMINATIONSTOTAL
GROUP
Segment income statement
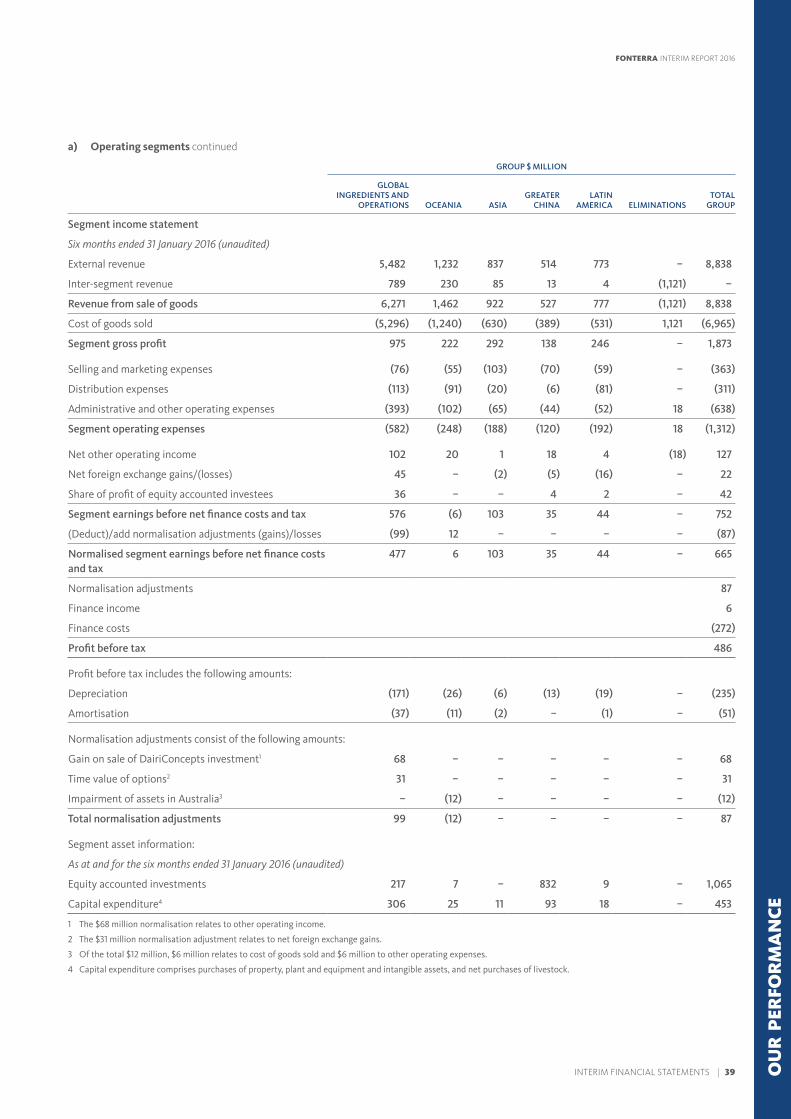
Six months ended 31 January 2016 (unaudited)
External revenue 5,482 1,232 837 514 773 – 8,838
Inter-segment revenue 789 230 85 13 4 (1,121) –
Revenue from sale of goods 6,271 1,462 922 527 777 (1,121) 8,838
Cost of goods sold (5,296) (1,240) (630) (389) (531) 1,121 (6,965)
Segment gross profit 975 222 292 138 246 – 1,873
Selling and marketing expenses (76) (55) (103) (70) (59) – (363)
Distribution expenses (113) (91) (20) (6) (81) – (311)
Administrative and other operating expenses (393) (102) (65) (44) (52) 18 (638)
Segment operating expenses (582) (248) (188) (120) (192) 18 (1,312)
Net other operating income 102 20 1 18 4 (18) 127
Net foreign exchange gains/(losses) 45 – (2) (5) (16) – 22
Share of profit of equity accounted investees 36 – – 4 2 – 42
Segment earnings before net finance costs and tax 576 (6) 103 35 44 – 752
(Deduct)/add normalisation adjustments (gains)/losses (99) 12 – – – – (87)
Normalised segment earnings before net finance costs and tax
477 6 103 35 44 – 665
Normalisation adjustments 87
Finance income 6
Finance costs (272)
Profit before tax 486
Profit before tax includes the following amounts:
Depreciation (171) (26) (6) (13) (19) – (235)
Amortisation (37) (11) (2) – (1) – (51)
Normalisation adjustments consist of the following amounts:
Gain on sale of DairiConcepts investment1 68 – – – – – 68
Time value of options2 31 – – – – – 31
Impairment of assets in Australia3 – (12) – – – – (12)
Total normalisation adjustments 99 (12) – – – – 87
Segment asset information:
As at and for the six months ended 31 January 2016 (unaudited)
Equity accounted investments 217 7 – 832 9 – 1,065
Capital expenditure4 306 25 11 93 18 – 453
1 The $68 million normalisation relates to other operating income.
2 The $31 million normalisation adjustment relates to net foreign exchange gains.
3 Of the total $12 million, $6 million relates to cost of goods sold and $6 million to other operating expenses.
4 Capital expenditure comprises purchases of property, plant and equipment and intangible assets, and net purchases of livestock.
INTERIM FINANCIAL STATEMENTS | 39
FONTERRA INTERIM REPORT 2016
OU
R P
ERFO
RM
AN
CE
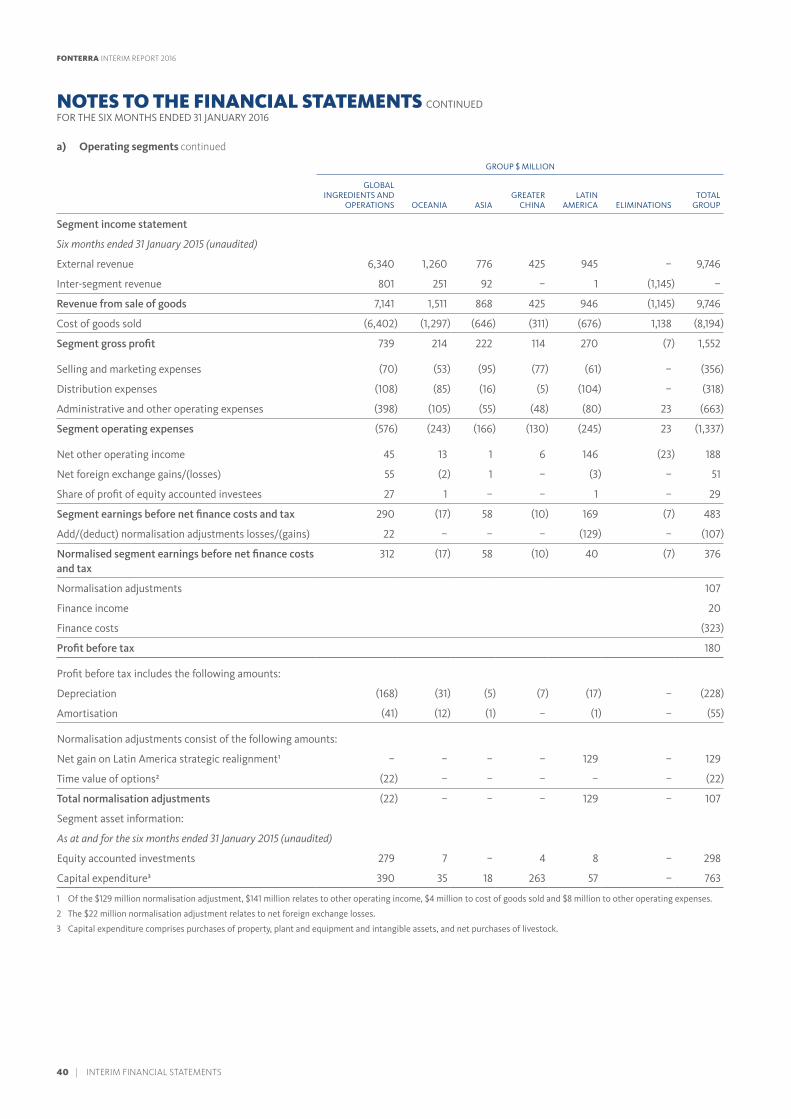
a) Operating segments continued
GROUP $ MILLION
GLOBAL INGREDIENTS AND
OPERATIONS OCEANIA ASIAGREATER
CHINALATIN
AMERICA ELIMINATIONSTOTAL
GROUP
Segment income statement
Six months ended 31 January 2015 (unaudited)
External revenue 6,340 1,260 776 425 945 – 9,746
Inter-segment revenue 801 251 92 – 1 (1,145) –
Revenue from sale of goods 7,141 1,511 868 425 946 (1,145) 9,746
Cost of goods sold (6,402) (1,297) (646) (311) (676) 1,138 (8,194)
Segment gross profit 739 214 222 114 270 (7) 1,552
Selling and marketing expenses (70) (53) (95) (77) (61) – (356)
Distribution expenses (108) (85) (16) (5) (104) – (318)
Administrative and other operating expenses (398) (105) (55) (48) (80) 23 (663)
Segment operating expenses (576) (243) (166) (130) (245) 23 (1,337)
Net other operating income 45 13 1 6 146 (23) 188
Net foreign exchange gains/(losses) 55 (2) 1 – (3) – 51
Share of profit of equity accounted investees 27 1 – – 1 – 29
Segment earnings before net finance costs and tax 290 (17) 58 (10) 169 (7) 483
Add/(deduct) normalisation adjustments losses/(gains) 22 – – – (129) – (107)
Normalised segment earnings before net finance costs and tax
312 (17) 58 (10) 40 (7) 376
Normalisation adjustments 107
Finance income 20
Finance costs (323)
Profit before tax 180
Profit before tax includes the following amounts:
Depreciation (168) (31) (5) (7) (17) – (228)
Amortisation (41) (12) (1) – (1) – (55)
Normalisation adjustments consist of the following amounts:
Net gain on Latin America strategic realignment¹ – – – – 129 – 129
Time value of options² (22) – – – – – (22)
Total normalisation adjustments (22) – – – 129 – 107
Segment asset information:
As at and for the six months ended 31 January 2015 (unaudited)
Equity accounted investments 279 7 – 4 8 – 298
Capital expenditure³ 390 35 18 263 57 – 763
1 Of the $129 million normalisation adjustment, $141 million relates to other operating income, $4 million to cost of goods sold and $8 million to other operating expenses.
2 The $22 million normalisation adjustment relates to net foreign exchange losses.
3 Capital expenditure comprises purchases of property, plant and equipment and intangible assets, and net purchases of livestock.
NOTES TO THE FINANCIAL STATEMENTS CONTINUEDFOR THE SIX MONTHS ENDED 31 JANUARY 2016
40 | INTERIM FINANCIAL STATEMENTS
FONTERRA INTERIM REPORT 2016
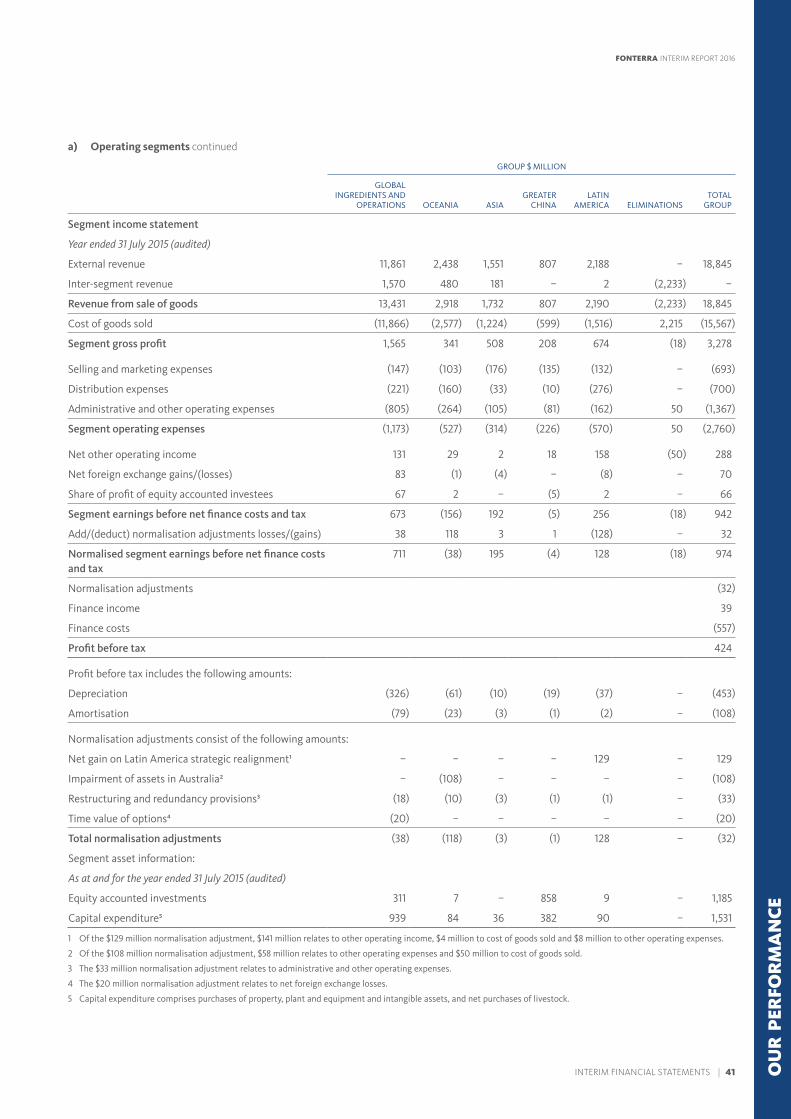
a) Operating segments continued
GROUP $ MILLION
GLOBAL INGREDIENTS AND
OPERATIONS OCEANIA ASIAGREATER
CHINALATIN
AMERICA ELIMINATIONSTOTAL
GROUP
Segment income statement
Year ended 31 July 2015 (audited)
External revenue 11,861 2,438 1,551 807 2,188 – 18,845
Inter-segment revenue 1,570 480 181 – 2 (2,233) –
Revenue from sale of goods 13,431 2,918 1,732 807 2,190 (2,233) 18,845
Cost of goods sold (11,866) (2,577) (1,224) (599) (1,516) 2,215 (15,567)
Segment gross profit 1,565 341 508 208 674 (18) 3,278
Selling and marketing expenses (147) (103) (176) (135) (132) – (693)
Distribution expenses (221) (160) (33) (10) (276) – (700)
Administrative and other operating expenses (805) (264) (105) (81) (162) 50 (1,367)
Segment operating expenses (1,173) (527) (314) (226) (570) 50 (2,760)
Net other operating income 131 29 2 18 158 (50) 288
Net foreign exchange gains/(losses) 83 (1) (4) – (8) – 70
Share of profit of equity accounted investees 67 2 – (5) 2 – 66
Segment earnings before net finance costs and tax 673 (156) 192 (5) 256 (18) 942
Add/(deduct) normalisation adjustments losses/(gains) 38 118 3 1 (128) – 32
Normalised segment earnings before net finance costs and tax
711 (38) 195 (4) 128 (18) 974
Normalisation adjustments (32)
Finance income 39
Finance costs (557)
Profit before tax 424
Profit before tax includes the following amounts:
Depreciation (326) (61) (10) (19) (37) – (453)
Amortisation (79) (23) (3) (1) (2) – (108)
Normalisation adjustments consist of the following amounts:
Net gain on Latin America strategic realignment¹ – – – – 129 – 129
Impairment of assets in Australia² – (108) – – – – (108)
Restructuring and redundancy provisions³ (18) (10) (3) (1) (1) – (33)
Time value of options⁴ (20) – – – – – (20)
Total normalisation adjustments (38) (118) (3) (1) 128 – (32)
Segment asset information:
As at and for the year ended 31 July 2015 (audited)
Equity accounted investments 311 7 – 858 9 – 1,185
Capital expenditure⁵ 939 84 36 382 90 – 1,531
1 Of the $129 million normalisation adjustment, $141 million relates to other operating income, $4 million to cost of goods sold and $8 million to other operating expenses.
2 Of the $108 million normalisation adjustment, $58 million relates to other operating expenses and $50 million to cost of goods sold.
3 The $33 million normalisation adjustment relates to administrative and other operating expenses.
4 The $20 million normalisation adjustment relates to net foreign exchange losses.
5 Capital expenditure comprises purchases of property, plant and equipment and intangible assets, and net purchases of livestock.
INTERIM FINANCIAL STATEMENTS | 41
FONTERRA INTERIM REPORT 2016
OU
R P
ERFO
RM
AN
CE
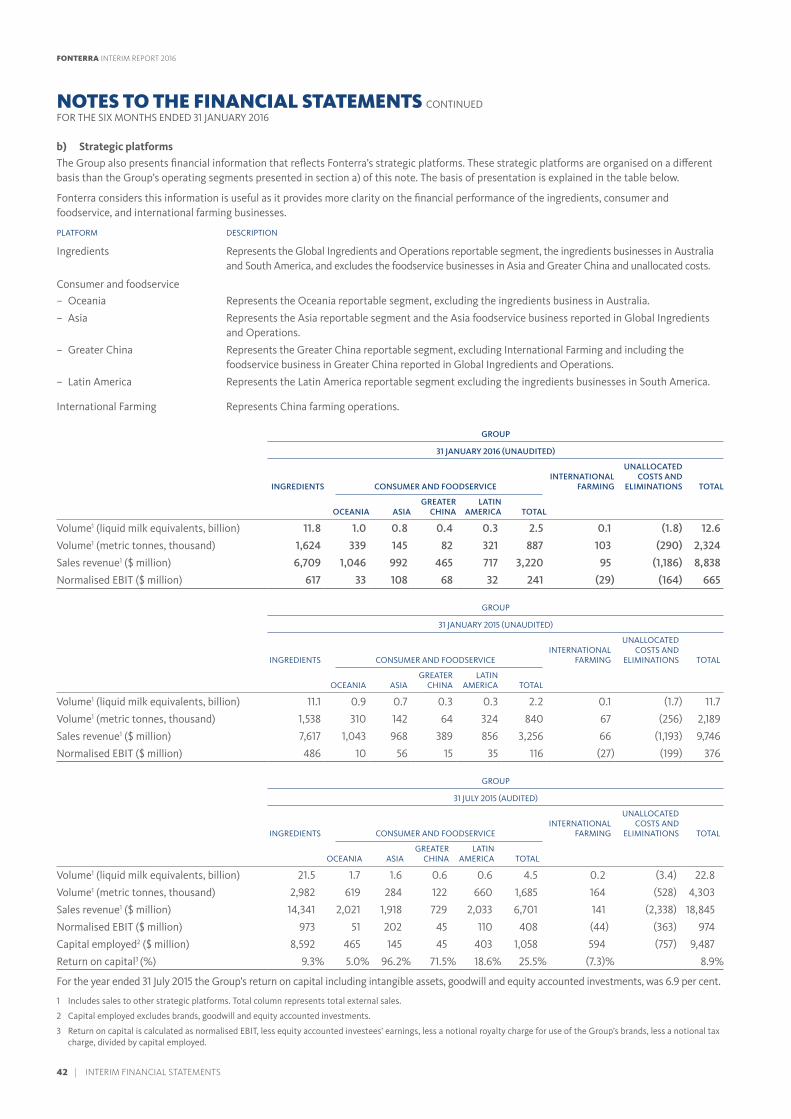
b) Strategic platformsThe Group also presents financial information that reflects Fonterra’s strategic platforms. These strategic platforms are organised on a different basis than the Group’s operating segments presented in section a) of this note. The basis of presentation is explained in the table below.
Fonterra considers this information is useful as it provides more clarity on the financial performance of the ingredients, consumer and foodservice, and international farming businesses.
PLATFORM DESCRIPTION
Ingredients Represents the Global Ingredients and Operations reportable segment, the ingredients businesses in Australia and South America, and excludes the foodservice businesses in Asia and Greater China and unallocated costs.
Consumer and foodservice
– Oceania Represents the Oceania reportable segment, excluding the ingredients business in Australia.
– Asia Represents the Asia reportable segment and the Asia foodservice business reported in Global Ingredients and Operations.
– Greater China Represents the Greater China reportable segment, excluding International Farming and including the foodservice business in Greater China reported in Global Ingredients and Operations.
– Latin America Represents the Latin America reportable segment excluding the ingredients businesses in South America.
International Farming Represents China farming operations.
GROUP
31 JANUARY 2016 (UNAUDITED)
INGREDIENTS CONSUMER AND FOODSERVICEINTERNATIONAL
FARMING
UNALLOCATED COSTS AND
ELIMINATIONS TOTAL
OCEANIA ASIAGREATER
CHINALATIN
AMERICA TOTAL
Volume1 (liquid milk equivalents, billion) 11.8 1.0 0.8 0.4 0.3 2.5 0.1 (1.8) 12.6
Volume1 (metric tonnes, thousand) 1,624 339 145 82 321 887 103 (290) 2,324
Sales revenue1 ($ million) 6,709 1,046 992 465 717 3,220 95 (1,186) 8,838
Normalised EBIT ($ million) 617 33 108 68 32 241 (29) (164) 665
GROUP
31 JANUARY 2015 (UNAUDITED)
INGREDIENTS CONSUMER AND FOODSERVICEINTERNATIONAL
FARMING
UNALLOCATED COSTS AND
ELIMINATIONS TOTAL
OCEANIA ASIAGREATER
CHINALATIN
AMERICA TOTAL
Volume1 (liquid milk equivalents, billion) 11.1 0.9 0.7 0.3 0.3 2.2 0.1 (1.7) 11.7
Volume1 (metric tonnes, thousand) 1,538 310 142 64 324 840 67 (256) 2,189
Sales revenue1 ($ million) 7,617 1,043 968 389 856 3,256 66 (1,193) 9,746
Normalised EBIT ($ million) 486 10 56 15 35 116 (27) (199) 376
GROUP
31 JULY 2015 (AUDITED)
INGREDIENTS CONSUMER AND FOODSERVICEINTERNATIONAL
FARMING
UNALLOCATED COSTS AND
ELIMINATIONS TOTAL
OCEANIA ASIAGREATER
CHINALATIN
AMERICA TOTAL
Volume1 (liquid milk equivalents, billion) 21.5 1.7 1.6 0.6 0.6 4.5 0.2 (3.4) 22.8
Volume1 (metric tonnes, thousand) 2,982 619 284 122 660 1,685 164 (528) 4,303
Sales revenue1 ($ million) 14,341 2,021 1,918 729 2,033 6,701 141 (2,338) 18,845
Normalised EBIT ($ million) 973 51 202 45 110 408 (44) (363) 974
Capital employed2 ($ million) 8,592 465 145 45 403 1,058 594 (757) 9,487
Return on capital3 (%) 9.3% 5.0% 96.2% 71.5% 18.6% 25.5% (7.3)% 8.9%
For the year ended 31 July 2015 the Group’s return on capital including intangible assets, goodwill and equity accounted investments, was 6.9 per cent.
1 Includes sales to other strategic platforms. Total column represents total external sales.
2 Capital employed excludes brands, goodwill and equity accounted investments.
3 Return on capital is calculated as normalised EBIT, less equity accounted investees’ earnings, less a notional royalty charge for use of the Group’s brands, less a notional tax charge, divided by capital employed.
NOTES TO THE FINANCIAL STATEMENTS CONTINUEDFOR THE SIX MONTHS ENDED 31 JANUARY 2016
42 | INTERIM FINANCIAL STATEMENTS
FONTERRA INTERIM REPORT 2016
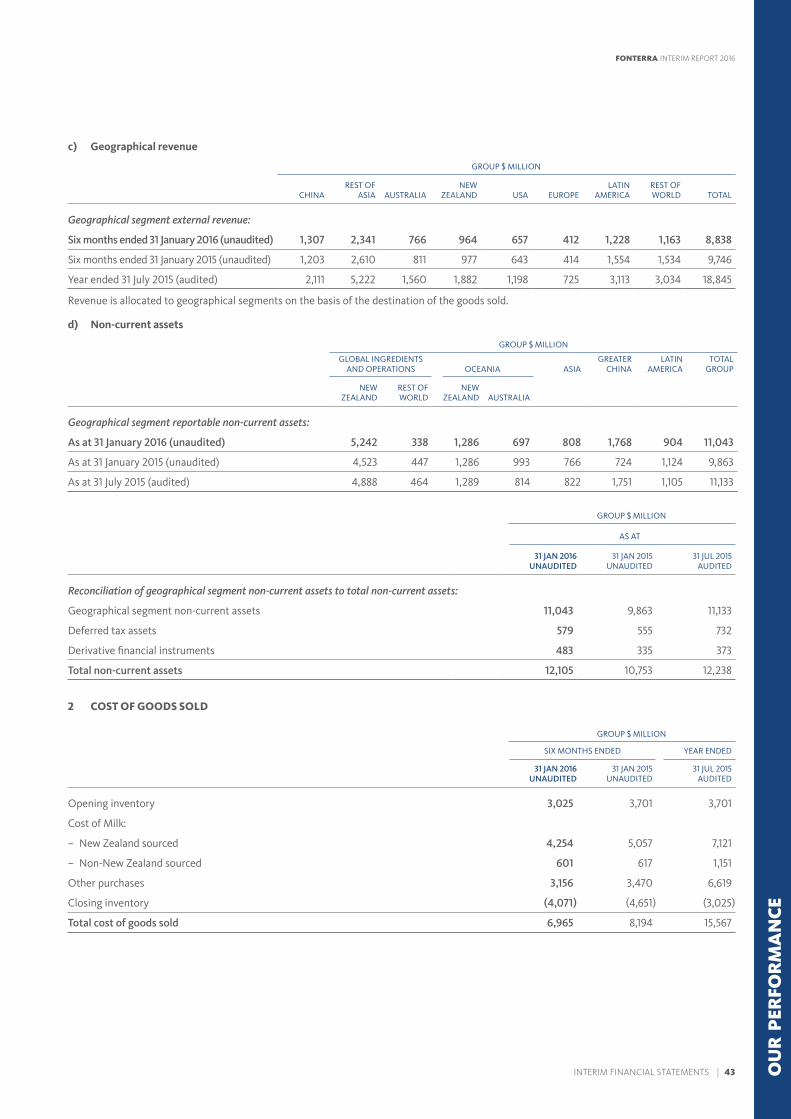
c) Geographical revenue
GROUP $ MILLION
CHINAREST OF
ASIA AUSTRALIANEW
ZEALAND USA EUROPELATIN
AMERICAREST OF WORLD TOTAL
Geographical segment external revenue:
Six months ended 31 January 2016 (unaudited) 1,307 2,341 766 964 657 412 1,228 1,163 8,838
Six months ended 31 January 2015 (unaudited) 1,203 2,610 811 977 643 414 1,554 1,534 9,746
Year ended 31 July 2015 (audited) 2,111 5,222 1,560 1,882 1,198 725 3,113 3,034 18,845
Revenue is allocated to geographical segments on the basis of the destination of the goods sold.
d) Non-current assets
GROUP $ MILLION
GLOBAL INGREDIENTS AND OPERATIONS OCEANIA ASIA
GREATER CHINA
LATIN AMERICA
TOTAL GROUP
NEW ZEALAND
REST OF WORLD
NEW ZEALAND AUSTRALIA
Geographical segment reportable non-current assets:
As at 31 January 2016 (unaudited) 5,242 338 1,286 697 808 1,768 904 11,043
As at 31 January 2015 (unaudited) 4,523 447 1,286 993 766 724 1,124 9,863
As at 31 July 2015 (audited) 4,888 464 1,289 814 822 1,751 1,105 11,133
GROUP $ MILLION
AS AT
31 JAN 2016 UNAUDITED
31 JAN 2015 UNAUDITED
31 JUL 2015 AUDITED
Reconciliation of geographical segment non-current assets to total non-current assets:
Geographical segment non-current assets 11,043 9,863 11,133
Deferred tax assets 579 555 732
Derivative financial instruments 483 335 373
Total non-current assets 12,105 10,753 12,238
2 COST OF GOODS SOLD
GROUP $ MILLION
SIX MONTHS ENDED YEAR ENDED
31 JAN 2016 UNAUDITED
31 JAN 2015 UNAUDITED
31 JUL 2015 AUDITED
Opening inventory 3,025 3,701 3,701
Cost of Milk:
– New Zealand sourced 4,254 5,057 7,121
– Non-New Zealand sourced 601 617 1,151
Other purchases 3,156 3,470 6,619
Closing inventory (4,071) (4,651) (3,025)
Total cost of goods sold 6,965 8,194 15,567
INTERIM FINANCIAL STATEMENTS | 43
FONTERRA INTERIM REPORT 2016
OU
R P
ERFO
RM
AN
CE
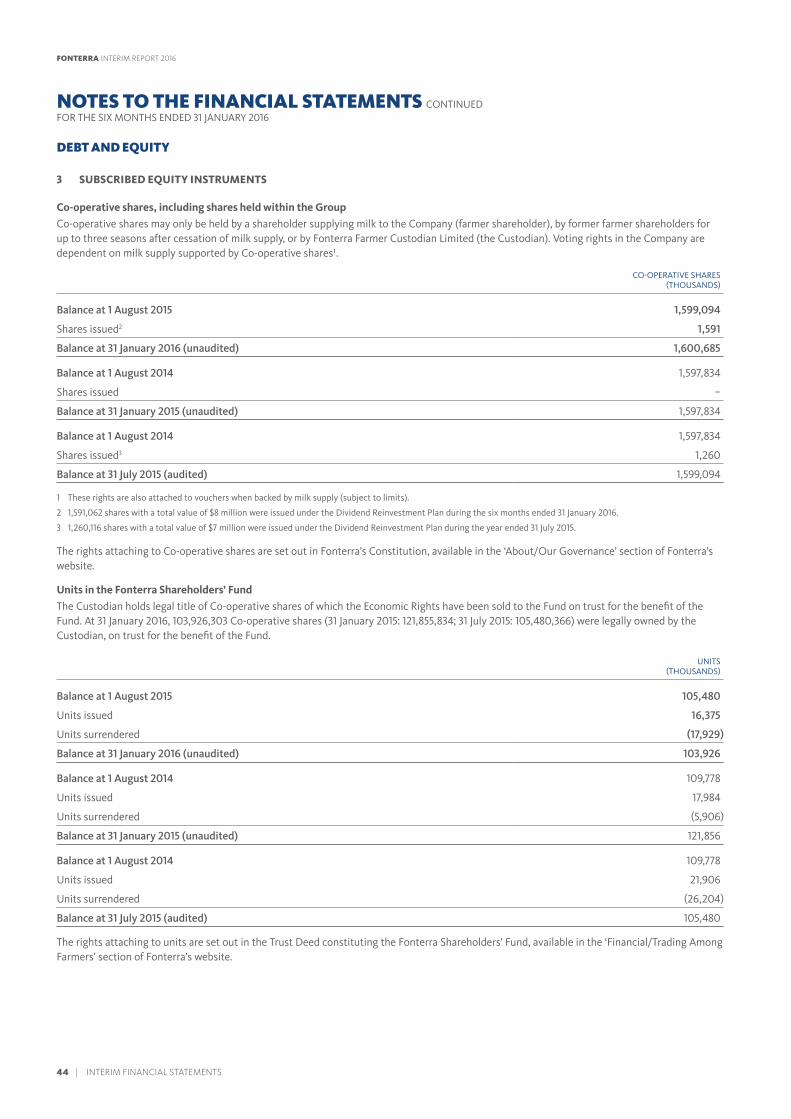
DEBT AND EQUITY
3 SUBSCRIBED EQUITY INSTRUMENTS
Co-operative shares, including shares held within the GroupCo-operative shares may only be held by a shareholder supplying milk to the Company (farmer shareholder), by former farmer shareholders for up to three seasons after cessation of milk supply, or by Fonterra Farmer Custodian Limited (the Custodian). Voting rights in the Company are dependent on milk supply supported by Co-operative shares¹.
CO-OPERATIVE SHARES (THOUSANDS)
Balance at 1 August 2015 1,599,094
Shares issued2 1,591
Balance at 31 January 2016 (unaudited) 1,600,685
Balance at 1 August 2014 1,597,834
Shares issued –
Balance at 31 January 2015 (unaudited) 1,597,834
Balance at 1 August 2014 1,597,834
Shares issued3 1,260
Balance at 31 July 2015 (audited) 1,599,094
1 These rights are also attached to vouchers when backed by milk supply (subject to limits).
2 1,591,062 shares with a total value of $8 million were issued under the Dividend Reinvestment Plan during the six months ended 31 January 2016.
3 1,260,116 shares with a total value of $7 million were issued under the Dividend Reinvestment Plan during the year ended 31 July 2015.
The rights attaching to Co-operative shares are set out in Fonterra’s Constitution, available in the ‘About/Our Governance’ section of Fonterra’s website.
Units in the Fonterra Shareholders’ Fund The Custodian holds legal title of Co-operative shares of which the Economic Rights have been sold to the Fund on trust for the benefit of the Fund. At 31 January 2016, 103,926,303 Co-operative shares (31 January 2015: 121,855,834; 31 July 2015: 105,480,366) were legally owned by the Custodian, on trust for the benefit of the Fund.
UNITS (THOUSANDS)
Balance at 1 August 2015 105,480
Units issued 16,375
Units surrendered (17,929)
Balance at 31 January 2016 (unaudited) 103,926
Balance at 1 August 2014 109,778
Units issued 17,984
Units surrendered (5,906)
Balance at 31 January 2015 (unaudited) 121,856
Balance at 1 August 2014 109,778
Units issued 21,906
Units surrendered (26,204)
Balance at 31 July 2015 (audited) 105,480
The rights attaching to units are set out in the Trust Deed constituting the Fonterra Shareholders’ Fund, available in the ‘Financial/Trading Among Farmers’ section of Fonterra’s website.
NOTES TO THE FINANCIAL STATEMENTS CONTINUEDFOR THE SIX MONTHS ENDED 31 JANUARY 2016
44 | INTERIM FINANCIAL STATEMENTS
FONTERRA INTERIM REPORT 2016
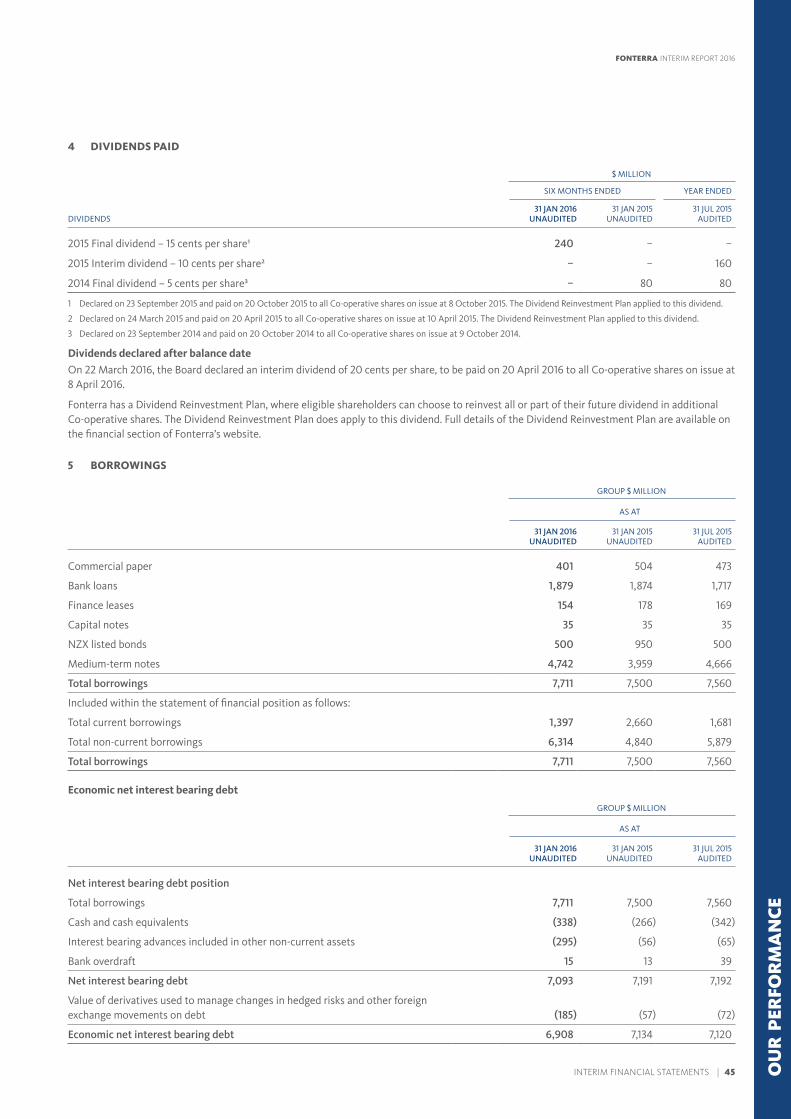
4 DIVIDENDS PAID
$ MILLION
SIX MONTHS ENDED YEAR ENDED
DIVIDENDS31 JAN 2016
UNAUDITED31 JAN 2015
UNAUDITED31 JUL 2015
AUDITED
2015 Final dividend – 15 cents per share¹ 240 – –
2015 Interim dividend – 10 cents per share² – – 160
2014 Final dividend – 5 cents per share³ – 80 80
1 Declared on 23 September 2015 and paid on 20 October 2015 to all Co-operative shares on issue at 8 October 2015. The Dividend Reinvestment Plan applied to this dividend.
2 Declared on 24 March 2015 and paid on 20 April 2015 to all Co-operative shares on issue at 10 April 2015. The Dividend Reinvestment Plan applied to this dividend.
3 Declared on 23 September 2014 and paid on 20 October 2014 to all Co-operative shares on issue at 9 October 2014.
Dividends declared after balance dateOn 22 March 2016, the Board declared an interim dividend of 20 cents per share, to be paid on 20 April 2016 to all Co-operative shares on issue at 8 April 2016.
Fonterra has a Dividend Reinvestment Plan, where eligible shareholders can choose to reinvest all or part of their future dividend in additional Co-operative shares. The Dividend Reinvestment Plan does apply to this dividend. Full details of the Dividend Reinvestment Plan are available on the financial section of Fonterra’s website.
5 BORROWINGS
GROUP $ MILLION
AS AT
31 JAN 2016 UNAUDITED
31 JAN 2015 UNAUDITED
31 JUL 2015 AUDITED
Commercial paper 401 504 473
Bank loans 1,879 1,874 1,717
Finance leases 154 178 169
Capital notes 35 35 35
NZX listed bonds 500 950 500
Medium-term notes 4,742 3,959 4,666
Total borrowings 7,711 7,500 7,560
Included within the statement of financial position as follows:
Total current borrowings 1,397 2,660 1,681
Total non-current borrowings 6,314 4,840 5,879
Total borrowings 7,711 7,500 7,560
Economic net interest bearing debt
GROUP $ MILLION
AS AT
31 JAN 2016 UNAUDITED
31 JAN 2015 UNAUDITED
31 JUL 2015 AUDITED
Net interest bearing debt position
Total borrowings 7,711 7,500 7,560
Cash and cash equivalents (338) (266) (342)
Interest bearing advances included in other non-current assets (295) (56) (65)
Bank overdraft 15 13 39
Net interest bearing debt 7,093 7,191 7,192
Value of derivatives used to manage changes in hedged risks and other foreign exchange movements on debt (185) (57) (72)
Economic net interest bearing debt 6,908 7,134 7,120
INTERIM FINANCIAL STATEMENTS | 45
FONTERRA INTERIM REPORT 2016
OU
R P
ERFO
RM
AN
CE
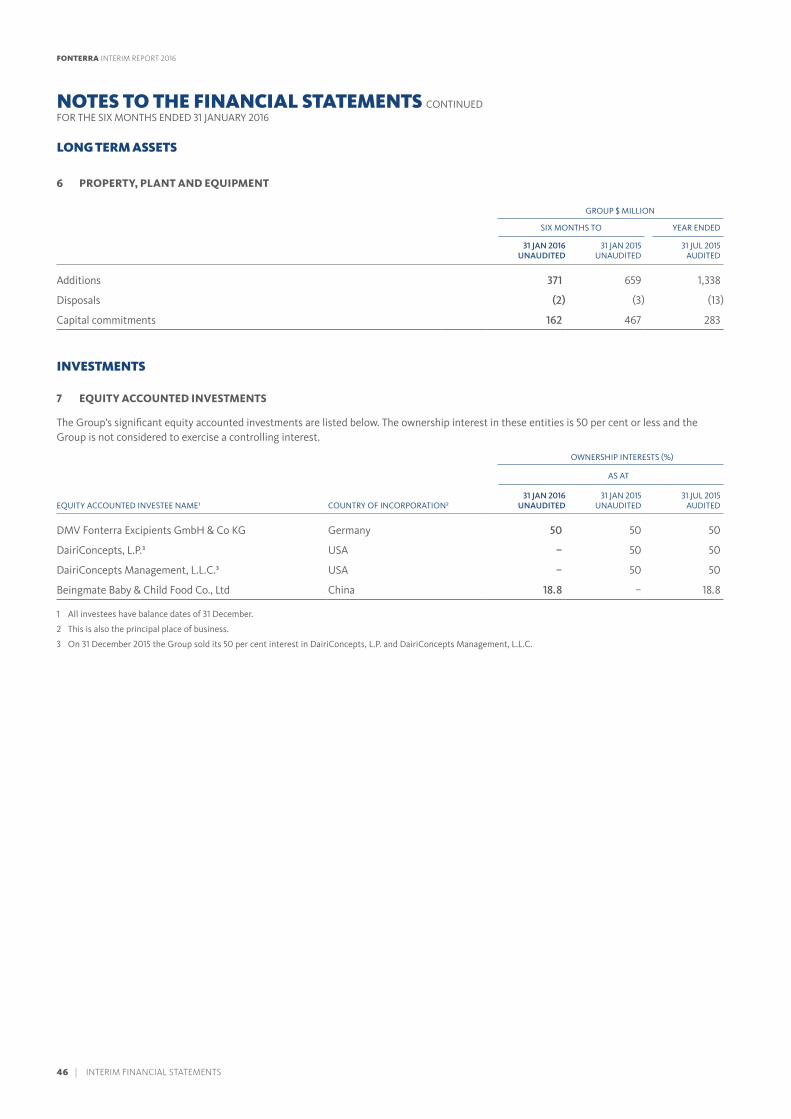
LONG TERM ASSETS
6 PROPERTY, PLANT AND EQUIPMENT
GROUP $ MILLION
SIX MONTHS TO YEAR ENDED
31 JAN 2016 UNAUDITED
31 JAN 2015 UNAUDITED
31 JUL 2015 AUDITED
Additions 371 659 1,338
Disposals (2) (3) (13)
Capital commitments 162 467 283
INVESTMENTS
7 EQUITY ACCOUNTED INVESTMENTS
The Group’s significant equity accounted investments are listed below. The ownership interest in these entities is 50 per cent or less and the Group is not considered to exercise a controlling interest.
OWNERSHIP INTERESTS (%)
AS AT
EQUITY ACCOUNTED INVESTEE NAME¹ COUNTRY OF INCORPORATION²31 JAN 2016
UNAUDITED31 JAN 2015
UNAUDITED31 JUL 2015
AUDITED
DMV Fonterra Excipients GmbH & Co KG Germany 50 50 50
DairiConcepts, L.P.³ USA – 50 50
DairiConcepts Management, L.L.C.³ USA – 50 50
Beingmate Baby & Child Food Co., Ltd China 18.8 – 18.8
1 All investees have balance dates of 31 December.
2 This is also the principal place of business.
3 On 31 December 2015 the Group sold its 50 per cent interest in DairiConcepts, L.P. and DairiConcepts Management, L.L.C.
NOTES TO THE FINANCIAL STATEMENTS CONTINUEDFOR THE SIX MONTHS ENDED 31 JANUARY 2016
46 | INTERIM FINANCIAL STATEMENTS
FONTERRA INTERIM REPORT 2016
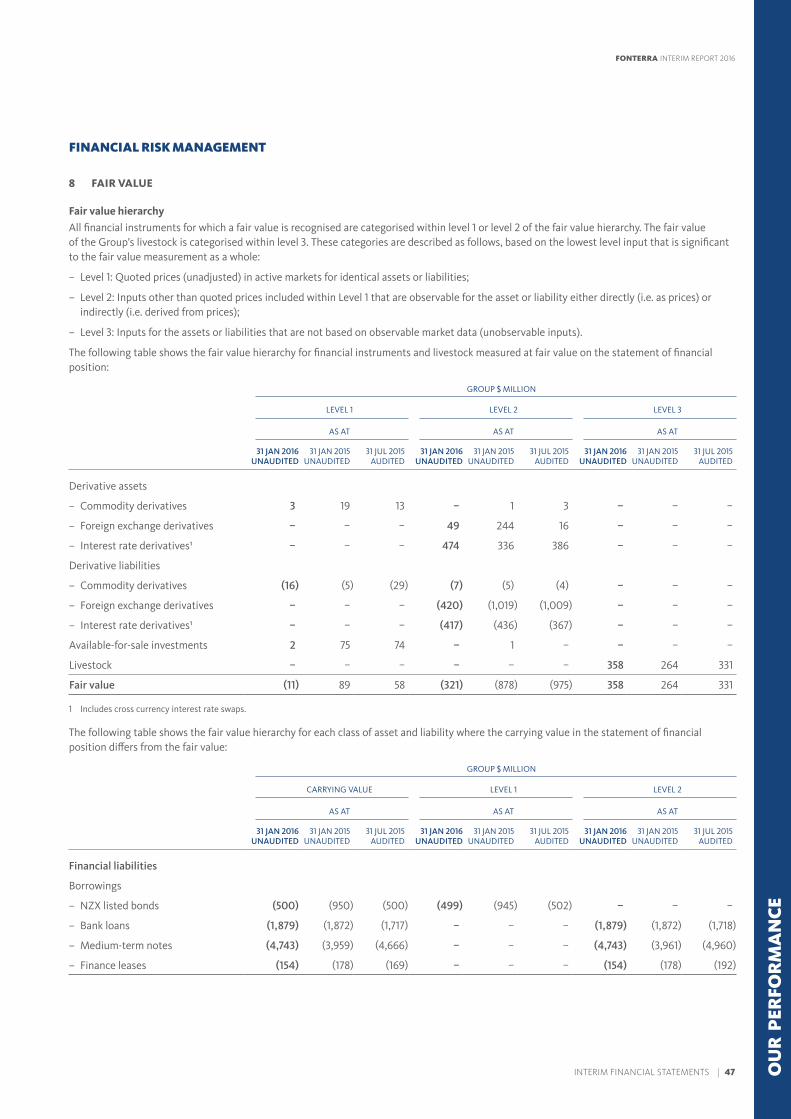
FINANCIAL RISK MANAGEMENT
8 FAIR VALUE
Fair value hierarchyAll financial instruments for which a fair value is recognised are categorised within level 1 or level 2 of the fair value hierarchy. The fair value of the Group’s livestock is categorised within level 3. These categories are described as follows, based on the lowest level input that is significant to the fair value measurement as a whole:
– Level 1: Quoted prices (unadjusted) in active markets for identical assets or liabilities;
– Level 2: Inputs other than quoted prices included within Level 1 that are observable for the asset or liability either directly (i.e. as prices) or indirectly (i.e. derived from prices);
– Level 3: Inputs for the assets or liabilities that are not based on observable market data (unobservable inputs).
The following table shows the fair value hierarchy for financial instruments and livestock measured at fair value on the statement of financial position:
GROUP $ MILLION
LEVEL 1 LEVEL 2 LEVEL 3
AS AT AS AT AS AT
31 JAN 2016 UNAUDITED
31 JAN 2015 UNAUDITED
31 JUL 2015 AUDITED
31 JAN 2016 UNAUDITED
31 JAN 2015 UNAUDITED
31 JUL 2015 AUDITED
31 JAN 2016 UNAUDITED
31 JAN 2015 UNAUDITED
31 JUL 2015 AUDITED
Derivative assets
– Commodity derivatives 3 19 13 – 1 3 – – –
– Foreign exchange derivatives – – – 49 244 16 – – –
– Interest rate derivatives¹ – – – 474 336 386 – – –
Derivative liabilities
– Commodity derivatives (16) (5) (29) (7) (5) (4) – – –
– Foreign exchange derivatives – – – (420) (1,019) (1,009) – – –
– Interest rate derivatives¹ – – – (417) (436) (367) – – –
Available-for-sale investments 2 75 74 – 1 – – – –
Livestock – – – – – – 358 264 331
Fair value (11) 89 58 (321) (878) (975) 358 264 331
1 Includes cross currency interest rate swaps.
The following table shows the fair value hierarchy for each class of asset and liability where the carrying value in the statement of financial position differs from the fair value:
GROUP $ MILLION
CARRYING VALUE LEVEL 1 LEVEL 2
AS AT AS AT AS AT
31 JAN 2016 UNAUDITED
31 JAN 2015 UNAUDITED
31 JUL 2015 AUDITED
31 JAN 2016 UNAUDITED
31 JAN 2015 UNAUDITED
31 JUL 2015 AUDITED
31 JAN 2016 UNAUDITED
31 JAN 2015 UNAUDITED
31 JUL 2015 AUDITED
Financial liabilities
Borrowings
– NZX listed bonds (500) (950) (500) (499) (945) (502) – – –
– Bank loans (1,879) (1,872) (1,717) – – – (1,879) (1,872) (1,718)
– Medium-term notes (4,743) (3,959) (4,666) – – – (4,743) (3,961) (4,960)
– Finance leases (154) (178) (169) – – – (154) (178) (192)
INTERIM FINANCIAL STATEMENTS | 47
FONTERRA INTERIM REPORT 2016
OU
R P
ERFO
RM
AN
CE
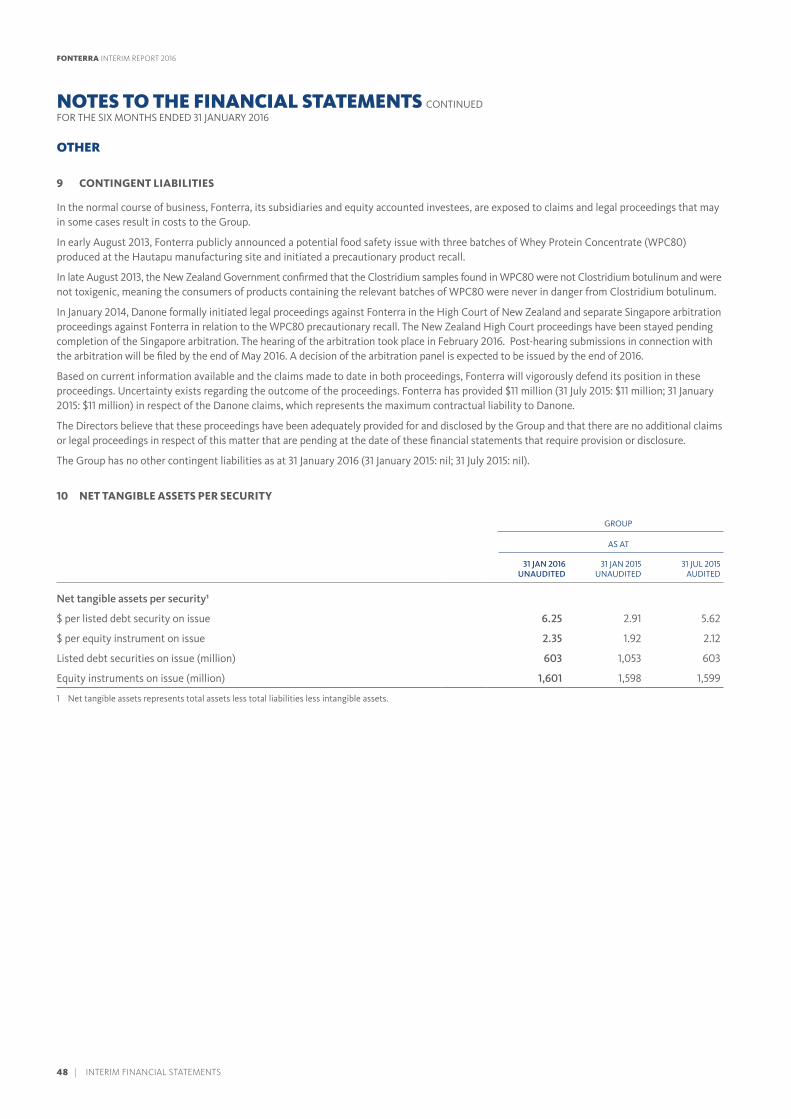
OTHER
9 CONTINGENT LIABILITIES
In the normal course of business, Fonterra, its subsidiaries and equity accounted investees, are exposed to claims and legal proceedings that may in some cases result in costs to the Group.
In early August 2013, Fonterra publicly announced a potential food safety issue with three batches of Whey Protein Concentrate (WPC80) produced at the Hautapu manufacturing site and initiated a precautionary product recall.
In late August 2013, the New Zealand Government confirmed that the Clostridium samples found in WPC80 were not Clostridium botulinum and were not toxigenic, meaning the consumers of products containing the relevant batches of WPC80 were never in danger from Clostridium botulinum.
In January 2014, Danone formally initiated legal proceedings against Fonterra in the High Court of New Zealand and separate Singapore arbitration proceedings against Fonterra in relation to the WPC80 precautionary recall. The New Zealand High Court proceedings have been stayed pending completion of the Singapore arbitration. The hearing of the arbitration took place in February 2016. Post-hearing submissions in connection with the arbitration will be filed by the end of May 2016. A decision of the arbitration panel is expected to be issued by the end of 2016.
Based on current information available and the claims made to date in both proceedings, Fonterra will vigorously defend its position in these proceedings. Uncertainty exists regarding the outcome of the proceedings. Fonterra has provided $11 million (31 July 2015: $11 million; 31 January 2015: $11 million) in respect of the Danone claims, which represents the maximum contractual liability to Danone.
The Directors believe that these proceedings have been adequately provided for and disclosed by the Group and that there are no additional claims or legal proceedings in respect of this matter that are pending at the date of these financial statements that require provision or disclosure.
The Group has no other contingent liabilities as at 31 January 2016 (31 January 2015: nil; 31 July 2015: nil).
10 NET TANGIBLE ASSETS PER SECURITY
GROUP
AS AT
31 JAN 2016 UNAUDITED
31 JAN 2015 UNAUDITED
31 JUL 2015 AUDITED
Net tangible assets per security¹
$ per listed debt security on issue 6.25 2.91 5.62
$ per equity instrument on issue 2.35 1.92 2.12
Listed debt securities on issue (million) 603 1,053 603
Equity instruments on issue (million) 1,601 1,598 1,599
1 Net tangible assets represents total assets less total liabilities less intangible assets.
NOTES TO THE FINANCIAL STATEMENTS CONTINUEDFOR THE SIX MONTHS ENDED 31 JANUARY 2016
48 | INTERIM FINANCIAL STATEMENTS
FONTERRA INTERIM REPORT 2016
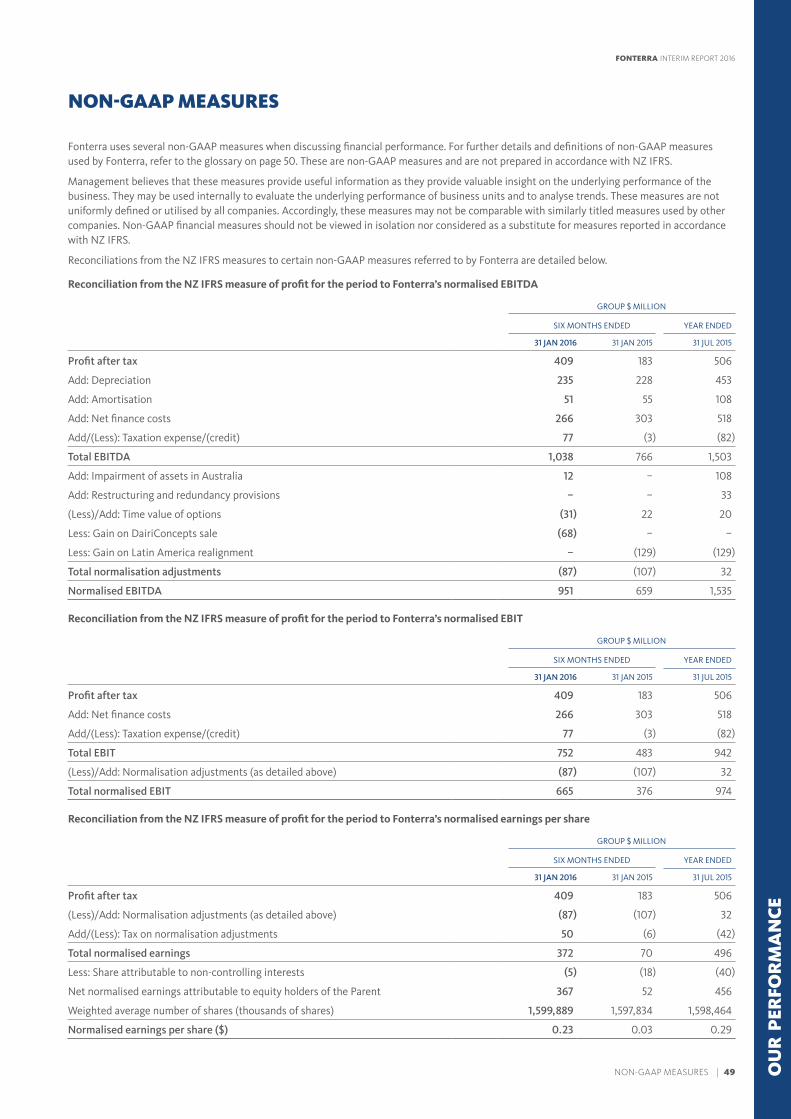
NON-GAAP MEASURES
Fonterra uses several non-GAAP measures when discussing financial performance. For further details and definitions of non-GAAP measures used by Fonterra, refer to the glossary on page 50. These are non-GAAP measures and are not prepared in accordance with NZ IFRS.
Management believes that these measures provide useful information as they provide valuable insight on the underlying performance of the business. They may be used internally to evaluate the underlying performance of business units and to analyse trends. These measures are not uniformly defined or utilised by all companies. Accordingly, these measures may not be comparable with similarly titled measures used by other companies. Non-GAAP financial measures should not be viewed in isolation nor considered as a substitute for measures reported in accordance with NZ IFRS.
Reconciliations from the NZ IFRS measures to certain non-GAAP measures referred to by Fonterra are detailed below.
Reconciliation from the NZ IFRS measure of profit for the period to Fonterra’s normalised EBITDA
GROUP $ MILLION
SIX MONTHS ENDED YEAR ENDED
31 JAN 2016 31 JAN 2015 31 JUL 2015
Profit after tax 409 183 506
Add: Depreciation 235 228 453
Add: Amortisation 51 55 108
Add: Net finance costs 266 303 518
Add/(Less): Taxation expense/(credit) 77 (3) (82)
Total EBITDA 1,038 766 1,503
Add: Impairment of assets in Australia 12 – 108
Add: Restructuring and redundancy provisions – – 33
(Less)/Add: Time value of options (31) 22 20
Less: Gain on DairiConcepts sale (68) – –
Less: Gain on Latin America realignment – (129) (129)
Total normalisation adjustments (87) (107) 32
Normalised EBITDA 951 659 1,535
Reconciliation from the NZ IFRS measure of profit for the period to Fonterra’s normalised EBIT
GROUP $ MILLION
SIX MONTHS ENDED YEAR ENDED
31 JAN 2016 31 JAN 2015 31 JUL 2015
Profit after tax 409 183 506
Add: Net finance costs 266 303 518
Add/(Less): Taxation expense/(credit) 77 (3) (82)
Total EBIT 752 483 942
(Less)/Add: Normalisation adjustments (as detailed above) (87) (107) 32
Total normalised EBIT 665 376 974
Reconciliation from the NZ IFRS measure of profit for the period to Fonterra’s normalised earnings per share
GROUP $ MILLION
SIX MONTHS ENDED YEAR ENDED
31 JAN 2016 31 JAN 2015 31 JUL 2015
Profit after tax 409 183 506
(Less)/Add: Normalisation adjustments (as detailed above) (87) (107) 32
Add/(Less): Tax on normalisation adjustments 50 (6) (42)
Total normalised earnings 372 70 496
Less: Share attributable to non-controlling interests (5) (18) (40)
Net normalised earnings attributable to equity holders of the Parent 367 52 456
Weighted average number of shares (thousands of shares) 1,599,889 1,597,834 1,598,464
Normalised earnings per share ($) 0.23 0.03 0.29
FONTERRA INTERIM REPORT 2016
OU
R P
ERFO
RM
AN
CE
NON-GAAP MEASURES | 49
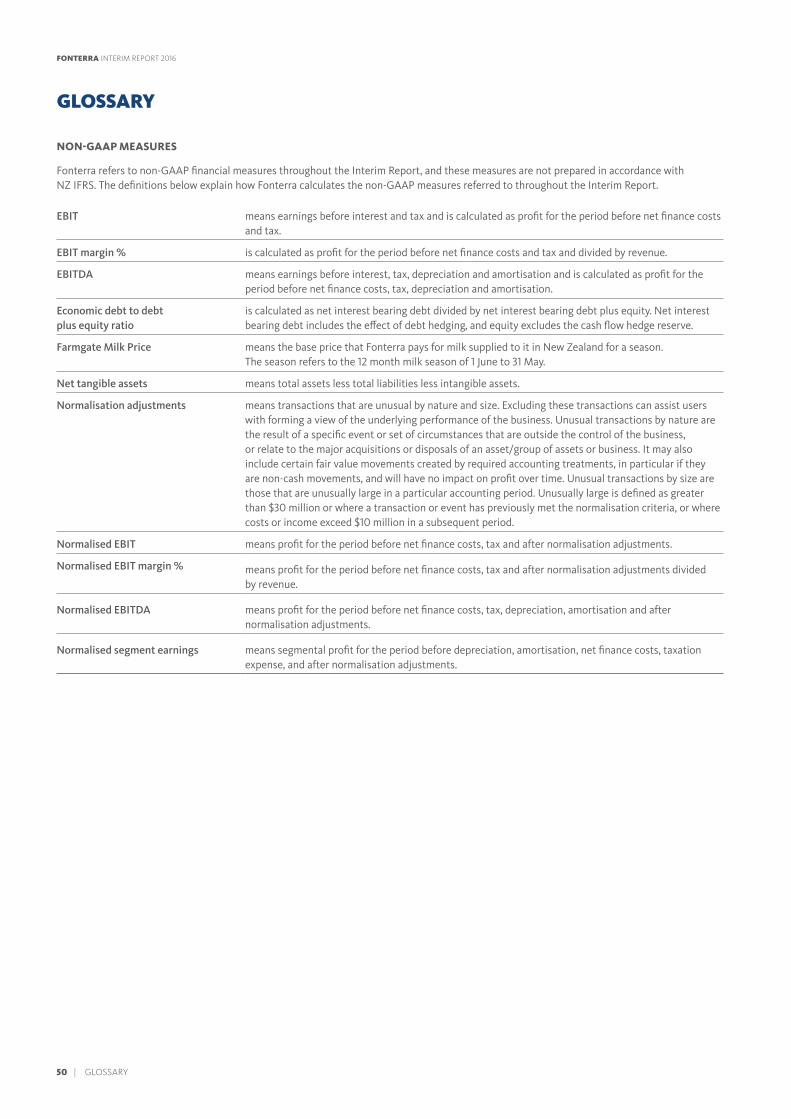
GLOSSARY
NON-GAAP MEASURES
Fonterra refers to non-GAAP financial measures throughout the Interim Report, and these measures are not prepared in accordance with NZ IFRS. The definitions below explain how Fonterra calculates the non-GAAP measures referred to throughout the Interim Report.
EBIT means earnings before interest and tax and is calculated as profit for the period before net finance costs and tax.
EBIT margin % is calculated as profit for the period before net finance costs and tax and divided by revenue.
EBITDA means earnings before interest, tax, depreciation and amortisation and is calculated as profit for the period before net finance costs, tax, depreciation and amortisation.
Economic debt to debt plus equity ratio
is calculated as net interest bearing debt divided by net interest bearing debt plus equity. Net interest bearing debt includes the effect of debt hedging, and equity excludes the cash flow hedge reserve.
Farmgate Milk Price means the base price that Fonterra pays for milk supplied to it in New Zealand for a season. The season refers to the 12 month milk season of 1 June to 31 May.
Net tangible assets means total assets less total liabilities less intangible assets.
Normalisation adjustments means transactions that are unusual by nature and size. Excluding these transactions can assist users with forming a view of the underlying performance of the business. Unusual transactions by nature are the result of a specific event or set of circumstances that are outside the control of the business, or relate to the major acquisitions or disposals of an asset/group of assets or business. It may also include certain fair value movements created by required accounting treatments, in particular if they are non-cash movements, and will have no impact on profit over time. Unusual transactions by size are those that are unusually large in a particular accounting period. Unusually large is defined as greater than $30 million or where a transaction or event has previously met the normalisation criteria, or where costs or income exceed $10 million in a subsequent period.
Normalised EBIT means profit for the period before net finance costs, tax and after normalisation adjustments.
Normalised EBIT margin % means profit for the period before net finance costs, tax and after normalisation adjustments divided by revenue.
Normalised EBITDA means profit for the period before net finance costs, tax, depreciation, amortisation and after normalisation adjustments.
Normalised segment earnings means segmental profit for the period before depreciation, amortisation, net finance costs, taxation expense, and after normalisation adjustments.
FONTERRA INTERIM REPORT 2016
50 | GLOSSARY
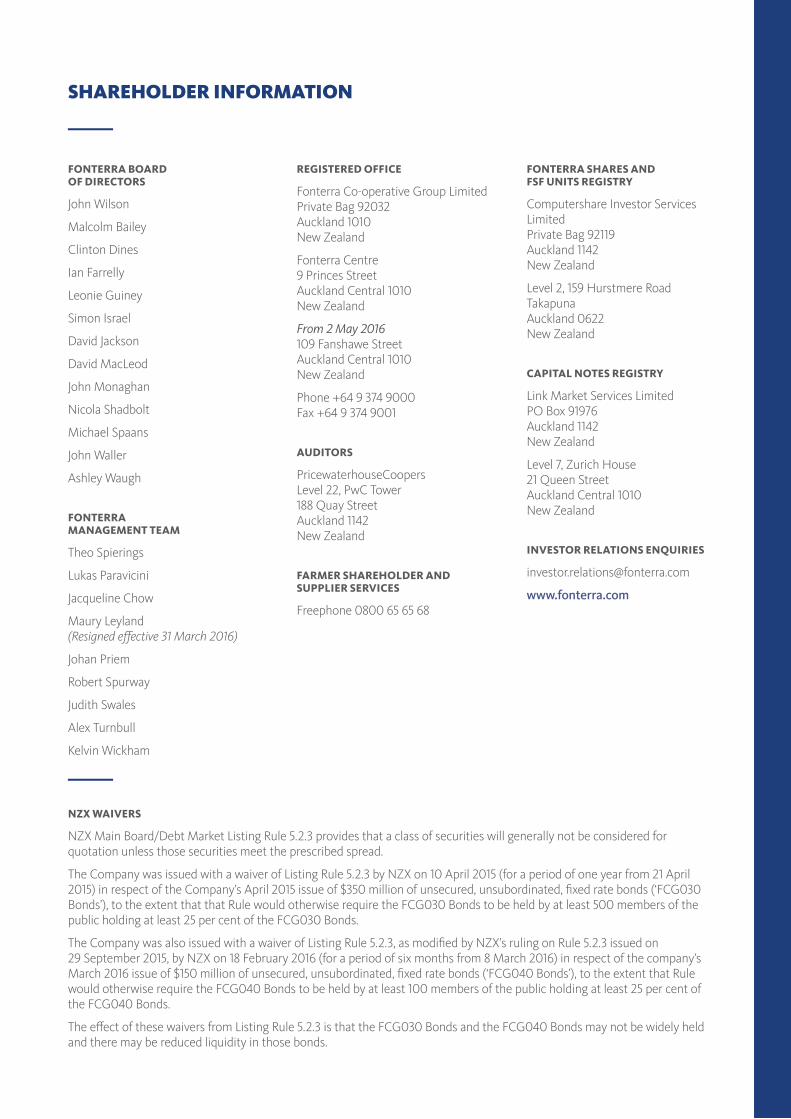
FONTERRA BOARD OF DIRECTORS
John Wilson
Malcolm Bailey
Clinton Dines
Ian Farrelly
Leonie Guiney
Simon Israel
David Jackson
David MacLeod
John Monaghan
Nicola Shadbolt
Michael Spaans
John Waller
Ashley Waugh
FONTERRA MANAGEMENT TEAM
Theo Spierings
Lukas Paravicini
Jacqueline Chow
Maury Leyland (Resigned e�ective 31 March 2016)
Johan Priem
Robert Spurway
Judith Swales
Alex Turnbull
Kelvin Wickham
REGISTERED OFFICE
Fonterra Co-operative Group Limited Private Bag 92032 Auckland 1010 New Zealand
Fonterra Centre 9 Princes Street Auckland Central 1010 New Zealand
From 2 May 2016 109 Fanshawe Street Auckland Central 1010 New Zealand
Phone +64 9 374 9000 Fax +64 9 374 9001
AUDITORS
PricewaterhouseCoopers Level 22, PwC Tower 188 Quay Street Auckland 1142 New Zealand
FARMER SHAREHOLDER AND SUPPLIER SERVICES
Freephone 0800 65 65 68
SHAREHOLDER INFORMATION
FONTERRA SHARES AND FSF UNITS REGISTRY
Computershare Investor Services Limited Private Bag 92119 Auckland 1142 New Zealand
Level 2, 159 Hurstmere Road Takapuna Auckland 0622 New Zealand
CAPITAL NOTES REGISTRY
Link Market Services Limited PO Box 91976 Auckland 1142 New Zealand
Level 7, Zurich House 21 Queen Street Auckland Central 1010 New Zealand
INVESTOR RELATIONS ENQUIRIES
www.fonterra.com
NZX WAIVERS
NZX Main Board/Debt Market Listing Rule 5.2.3 provides that a class of securities will generally not be considered for quotation unless those securities meet the prescribed spread.
The Company was issued with a waiver of Listing Rule 5.2.3 by NZX on 10 April 2015 (for a period of one year from 21 April 2015) in respect of the Company’s April 2015 issue of $350 million of unsecured, unsubordinated, ¤xed rate bonds (‘FCG030 Bonds’), to the extent that that Rule would otherwise require the FCG030 Bonds to be held by at least 500 members of the public holding at least 25 per cent of the FCG030 Bonds.
The Company was also issued with a waiver of Listing Rule 5.2.3, as modi¤ed by NZX’s ruling on Rule 5.2.3 issued on 29 September 2015, by NZX on 18 February 2016 (for a period of six months from 8 March 2016) in respect of the company’s March 2016 issue of $150 million of unsecured, unsubordinated, ¤xed rate bonds (‘FCG040 Bonds’), to the extent that Rule would otherwise require the FCG040 Bonds to be held by at least 100 members of the public holding at least 25 per cent of the FCG040 Bonds.
The e¦ect of these waivers from Listing Rule 5.2.3 is that the FCG030 Bonds and the FCG040 Bonds may not be widely held and there may be reduced liquidity in those bonds.

This document is printed on an environmentally responsible paper produced using elemental chlorine free (ECF) FSC®-certified mixed-source pulp, sourced from well-managed and legally harvested forests, and manufactured under the strict ISO14001 environmental management system.