Embed Size (px)
DESCRIPTION
Citation preview
April 5, 2007
Copyright 2007 MMTC
Performance Benchmarking Reportprepared for:
Sample CompanyCity, State
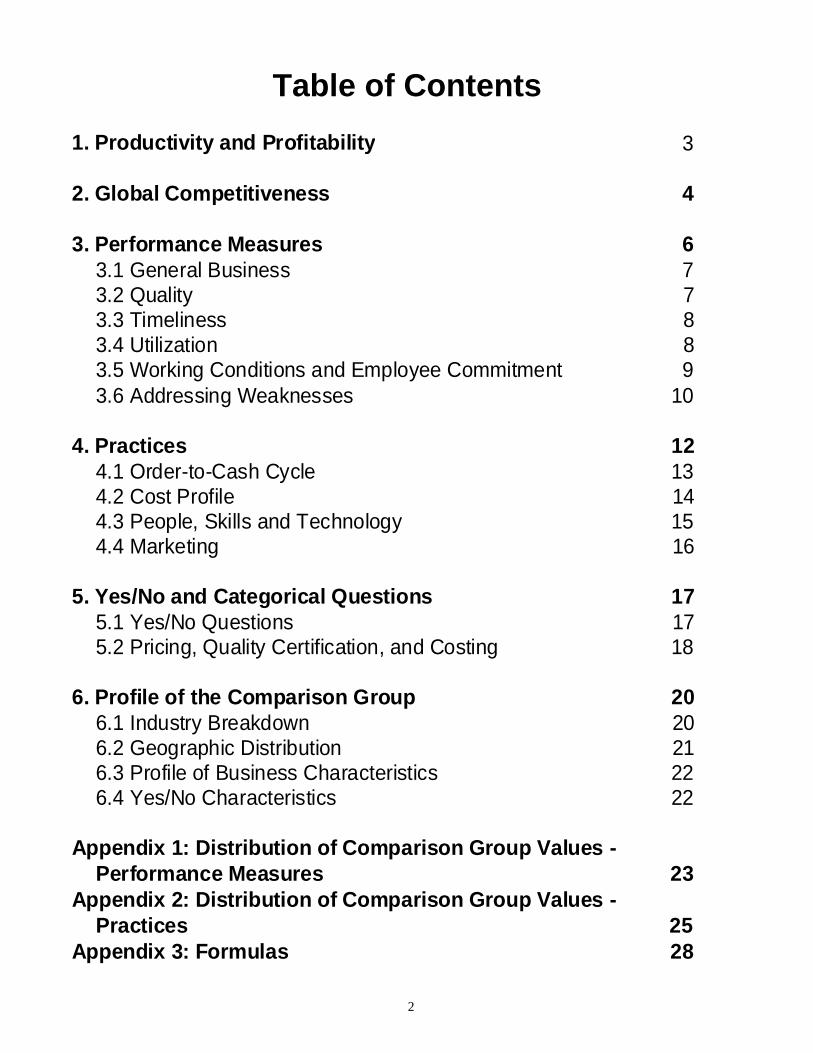
Table of Contents1. Productivity and Profitability 3
2. Global Competitiveness 4
3. Performance Measures 63.1 General Business 73.2 Quality 73.3 Timeliness 83.4 Utilization 83.5 Working Conditions and Employee Commitment 93.6 Addressing Weaknesses 10
4. Practices 124.1 Order-to-Cash Cycle 134.2 Cost Profile 144.3 People, Skills and Technology 154.4 Marketing 16
5. Yes/No and Categorical Questions 175.1 Yes/No Questions 175.2 Pricing, Quality Certification, and Costing 18
6. Profile of the Comparison Group 206.1 Industry Breakdown 206.2 Geographic Distribution 216.3 Profile of Business Characteristics 226.4 Yes/No Characteristics 22
Appendix 1: Distribution of Comparison Group Values -Performance Measures 23
Appendix 2: Distribution of Comparison Group Values -Practices 25
Appendix 3: Formulas 28
2

1. Productivity and ProfitabilityThroughout this report, we display your facility's performance on many metrics. The comparison is donemetric-by-metric, since no company is best at everything. That said, two metrics in this report are most critical.
The first is Value-Added per Full-Time-Equivalent Employee (FTE). Value-added is defined as sales less the costof inputs (material, parts, supplies, services and energy) purchased from other firms. It measures the market valueof the work done at your location. Dividing value-added by FTEs turns it into your output per employee, afundamental measure of labor productivity. Achieving and maintaining high labor productivity is absolutelycritical for North American, Western European, and Japanese manufacturers. Plants in these high-wage regionswill never win the global competition with extremely low-wage producers unless they focus on business areas inwhich they can attain high output per worker.
But it's also clear that high labor productivity is not sufficient for sustainable success. If high productivity comesat very high cost -- due to high labor costs or large capital equipment requirements -- then profitability suffers.
Thus the second critical metric is our Global Competitiveness Index. This index is an indicator of how yourcost-to-output ratio compares against what we view as the global benchmark: the North American landed cost fora low-wage Asian country producer.
124.5%
Your Value-Added per FTE $ 69,926
Your Cost-to-Output Ratio Compared to GlobalBenchmark
Value Percentile(100 = Bestin Group)
46
28
Together these metrics summarize your global competitive risk. The more you compete, or expect to compete,against low-wage offshore companies that are willing to accept thin profit margins, the more critical it is that youreduce your costs.
See Section 3.1 and Appendix 1 for more data on Value-Added per FTE. See Section 2 for a fuller discussion ofour Global Competitiveness Index, and for an analysis of how much you can reduce your Index value throughvarious improvement tactics.
3

2. Global CompetitivenessWe compute your Global Competitiveness Index by estimating how your costs compare with the North Americanlanded cost of products manufactured offshore. Our assumptions about the relative costs of offshore producers are:
1. Production worker wage rates are roughly 10% of wages in the typical North American plant.2. Labor productivity (output per labor hour) is 25% that of the typical North American plant.3. Costs for purchased material, parts and energy are 90% those for the typical North American plant.4. Waste rates (scrap, rework, rejects) run roughly five times higher for the typical offshore facility.5. Freight, duty and taxes -- combined with extra logistics costs -- add roughly 12% to the offshore cost.
Our research indicates that, in most industries, about 15% of small and medium-sized North American manufacturersare already lower-cost than the landed cost of the benchmark offshore competitor. Another 15% would beat theoffshore landed cost benchmark if they were successfully to implement the Thorough Improvement program (Scenario8, below).
Consistent with assumption 5, we add 12% to your costs in comparing you against the global benchmark if your plantis located outside of North America. Further, non-North American plants would fail to gain relative to other offshoreproducers in case of a devaluation of the dollar (i.e., they show no improvement in Scenario 9, below).
Global Cost Benchmark= 100
Your Cost Relative toGlobal BenchmarkCost Cutting Scenario
%124.5Base Case -- Your Current Costs Relative to Typical Offshore Producer
%117.6Scenario 1: You Achieve a 10% Reduction in Material Cost
%120.2Scenario 2: You Achieve a 10% Increase in Labor Productivity
%123.8Scenario 3: You Achieve a 10% Reduction in Fringe Benefits
%124.4Scenario 4: You Achieve a 10% Reduction in Energy Costs
Scenario 5: You Achieve a 25% Reduction in Waste (Scrap and Rework)
%123.1Scenario 6: You Achieve a 25% Reduction in Inventory
%124.3Scenario 7: You Achieve a 10% Increase in Output with Your CurrentCapital Stock
%124.5Scenario 8: Thorough Improvement(Mat'l,Prod'ty,Energy,Waste,Inventory,Output)
%112.1Scenario 9: The Dollar is Devalued by 10% Relative to World Currencies
4
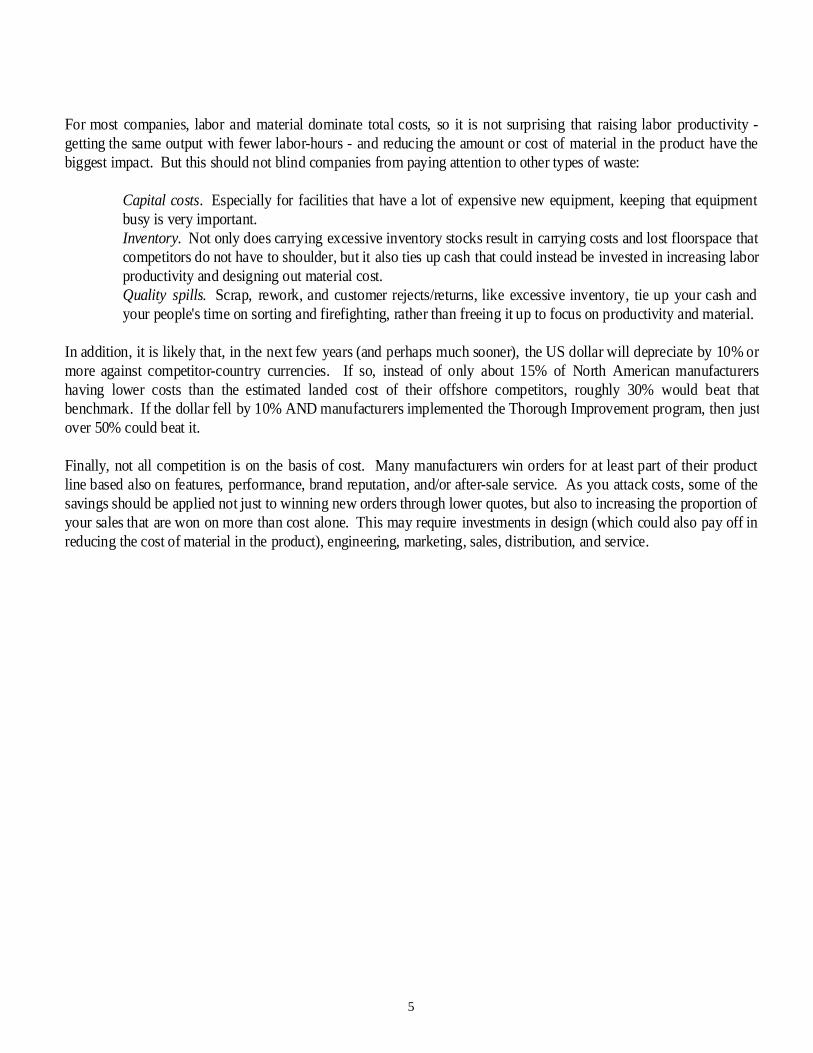
For most companies, labor and material dominate total costs, so it is not surprising that raising labor productivity -getting the same output with fewer labor-hours - and reducing the amount or cost of material in the product have thebiggest impact. But this should not blind companies from paying attention to other types of waste:
Capital costs. Especially for facilities that have a lot of expensive new equipment, keeping that equipmentbusy is very important.Inventory. Not only does carrying excessive inventory stocks result in carrying costs and lost floorspace thatcompetitors do not have to shoulder, but it also ties up cash that could instead be invested in increasing laborproductivity and designing out material cost.Quality spills. Scrap, rework, and customer rejects/returns, like excessive inventory, tie up your cash andyour people's time on sorting and firefighting, rather than freeing it up to focus on productivity and material.
In addition, it is likely that, in the next few years (and perhaps much sooner), the US dollar will depreciate by 10% ormore against competitor-country currencies. If so, instead of only about 15% of North American manufacturershaving lower costs than the estimated landed cost of their offshore competitors, roughly 30% would beat thatbenchmark. If the dollar fell by 10% AND manufacturers implemented the Thorough Improvement program, then justover 50% could beat it.
Finally, not all competition is on the basis of cost. Many manufacturers win orders for at least part of their productline based also on features, performance, brand reputation, and/or after-sale service. As you attack costs, some of thesavings should be applied not just to winning new orders through lower quotes, but also to increasing the proportion ofyour sales that are won on more than cost alone. This may require investments in design (which could also pay off inreducing the cost of material in the product), engineering, marketing, sales, distribution, and service.
5
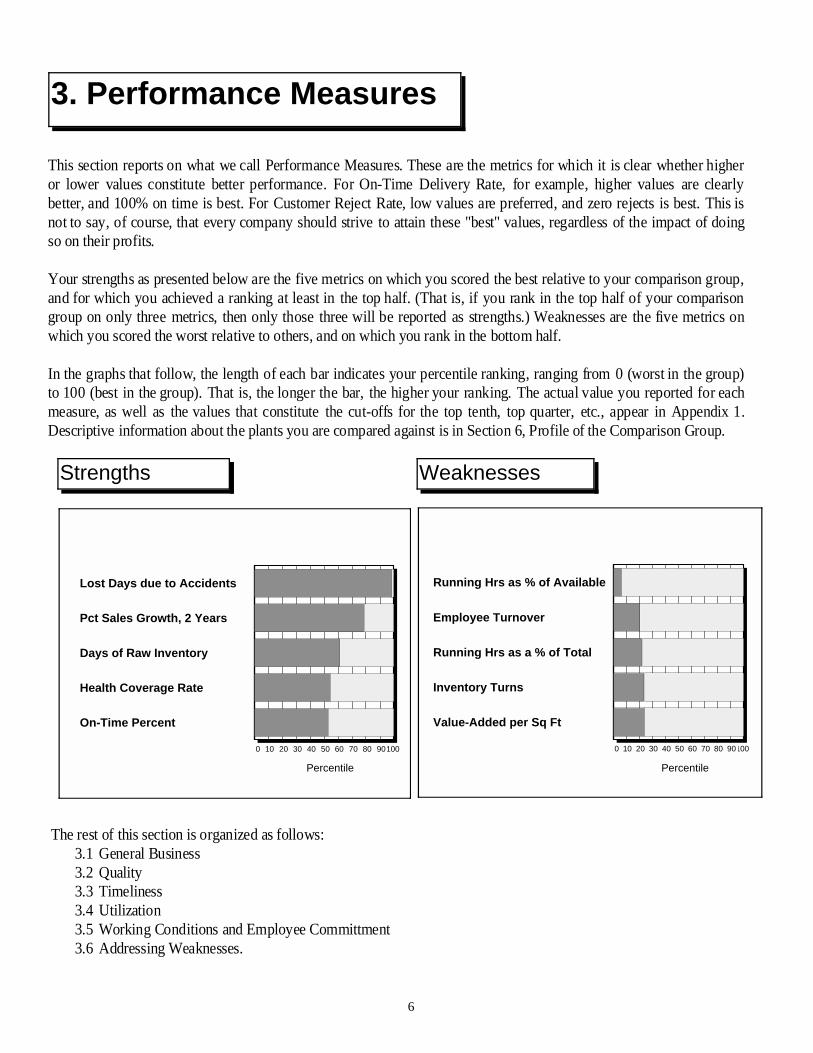
Strengths
0 10 20 30 40 50 60 70 80 90100
Lost Days due to Accidents
Pct Sales Growth, 2 Years
Days of Raw Inventory
Health Coverage Rate
On-Time Percent
Percentile
3. Performance Measures
This section reports on what we call Performance Measures. These are the metrics for which it is clear whether higheror lower values constitute better performance. For On-Time Delivery Rate, for example, higher values are clearlybetter, and 100% on time is best. For Customer Reject Rate, low values are preferred, and zero rejects is best. This isnot to say, of course, that every company should strive to attain these "best" values, regardless of the impact of doingso on their profits.
Your strengths as presented below are the five metrics on which you scored the best relative to your comparison group,and for which you achieved a ranking at least in the top half. (That is, if you rank in the top half of your comparisongroup on only three metrics, then only those three will be reported as strengths.) Weaknesses are the five metrics onwhich you scored the worst relative to others, and on which you rank in the bottom half.
In the graphs that follow, the length of each bar indicates your percentile ranking, ranging from 0 (worst in the group)to 100 (best in the group). That is, the longer the bar, the higher your ranking. The actual value you reported for eachmeasure, as well as the values that constitute the cut-offs for the top tenth, top quarter, etc., appear in Appendix 1.Descriptive information about the plants you are compared against is in Section 6, Profile of the Comparison Group.
The rest of this section is organized as follows:3.1 General Business3.2 Quality3.3 Timeliness3.4 Utilization3.5 Working Conditions and Employee Committment3.6 Addressing Weaknesses.
Weaknesses
0 10 20 30 40 50 60 70 80 90100
Running Hrs as % of Available
Employee Turnover
Running Hrs as a % of Total
Inventory Turns
Value-Added per Sq Ft
Percentile
6
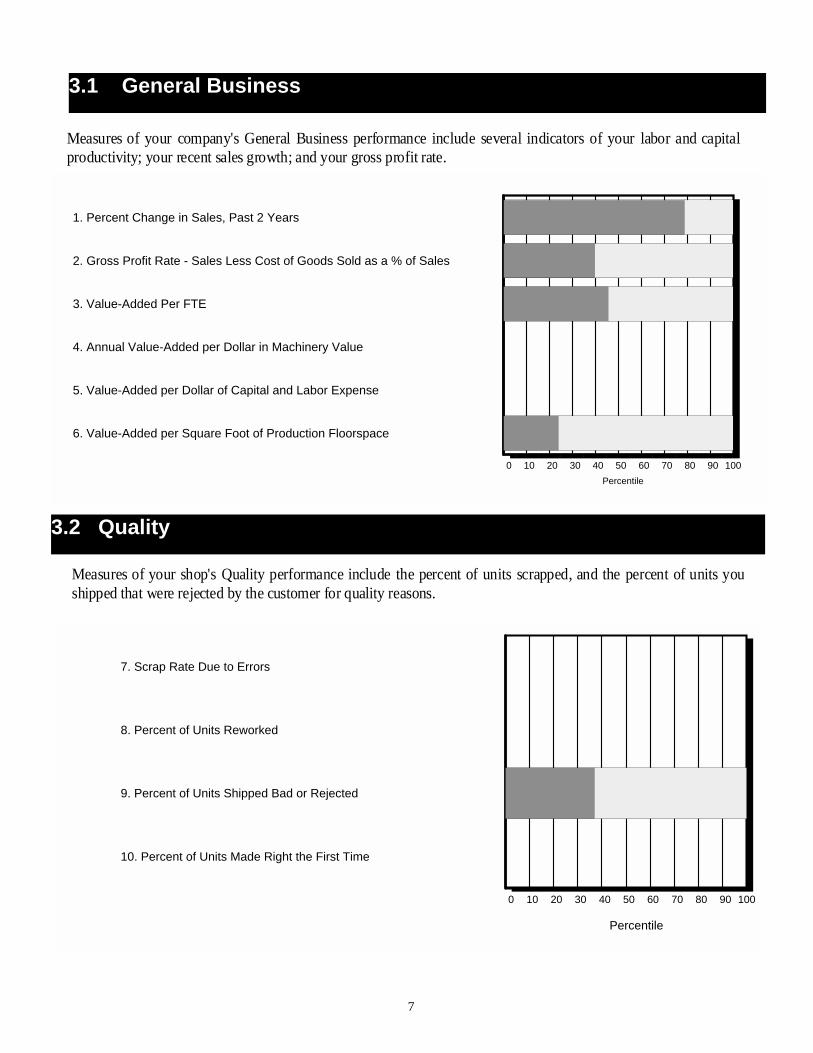
3.1 General Business
0 10 20 30 40 50 60 70 80 90 100
1. Percent Change in Sales, Past 2 Years
2. Gross Profit Rate - Sales Less Cost of Goods Sold as a % of Sales
3. Value-Added Per FTE
4. Annual Value-Added per Dollar in Machinery Value
5. Value-Added per Dollar of Capital and Labor Expense
6. Value-Added per Square Foot of Production Floorspace
Percentile
Measures of your company's General Business performance include several indicators of your labor and capitalproductivity; your recent sales growth; and your gross profit rate.
3.2 Quality
0 10 20 30 40 50 60 70 80 90 100
7. Scrap Rate Due to Errors
8. Percent of Units Reworked
9. Percent of Units Shipped Bad or Rejected
10. Percent of Units Made Right the First Time
Percentile
Measures of your shop's Quality performance include the percent of units scrapped, and the percent of units youshipped that were rejected by the customer for quality reasons.
7
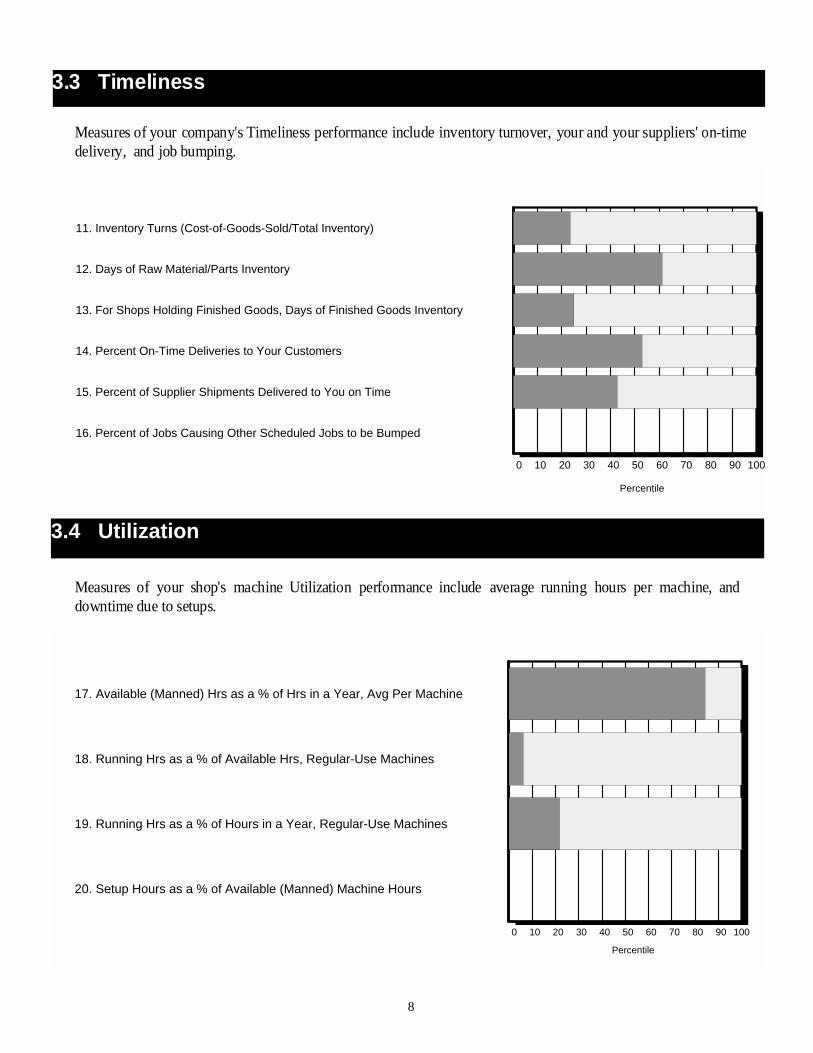
3.3 Timeliness
0 10 20 30 40 50 60 70 80 90 100
11. Inventory Turns (Cost-of-Goods-Sold/Total Inventory)
12. Days of Raw Material/Parts Inventory
13. For Shops Holding Finished Goods, Days of Finished Goods Inventory
14. Percent On-Time Deliveries to Your Customers
15. Percent of Supplier Shipments Delivered to You on Time
16. Percent of Jobs Causing Other Scheduled Jobs to be Bumped
Percentile
Measures of your company's Timeliness performance include inventory turnover, your and your suppliers' on-timedelivery, and job bumping.
3.4 Utilization
0 10 20 30 40 50 60 70 80 90 100
17. Available (Manned) Hrs as a % of Hrs in a Year, Avg Per Machine
18. Running Hrs as a % of Available Hrs, Regular-Use Machines
19. Running Hrs as a % of Hours in a Year, Regular-Use Machines
20. Setup Hours as a % of Available (Manned) Machine Hours
Percentile
Measures of your shop's machine Utilization performance include average running hours per machine, anddowntime due to setups.
8
3.5 Working Conditions and Employee Commitment
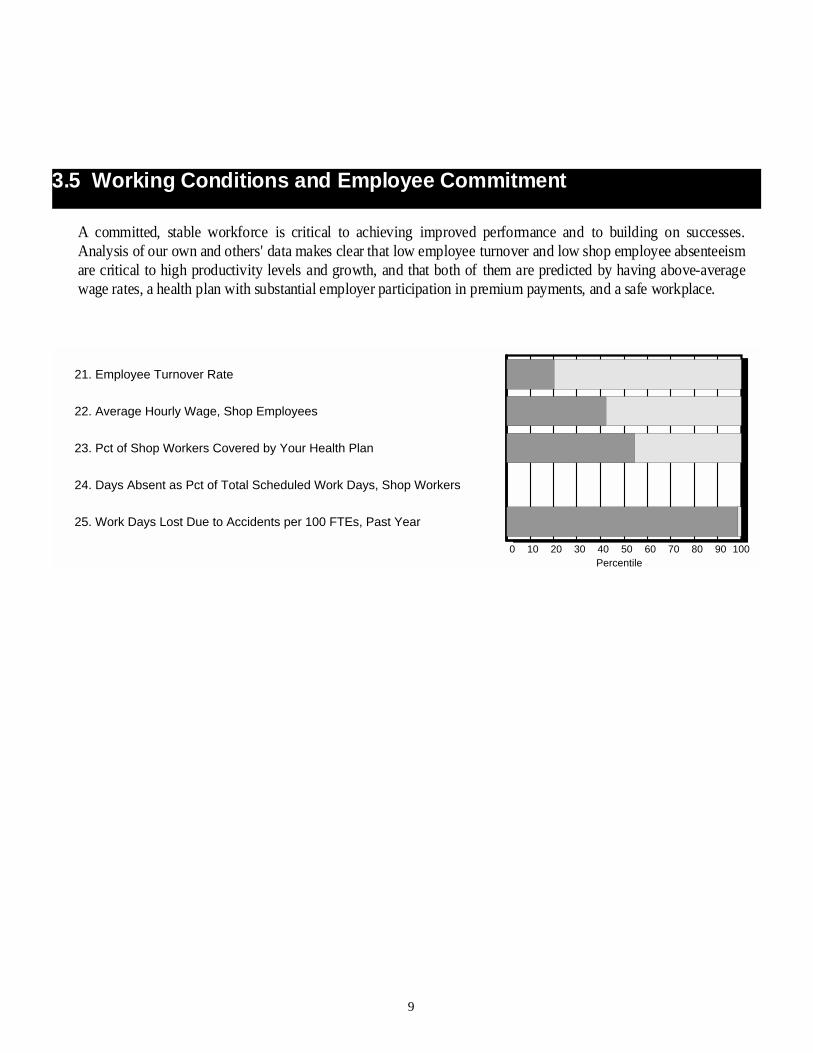
A committed, stable workforce is critical to achieving improved performance and to building on successes.Analysis of our own and others' data makes clear that low employee turnover and low shop employee absenteeismare critical to high productivity levels and growth, and that both of them are predicted by having above-averagewage rates, a health plan with substantial employer participation in premium payments, and a safe workplace.
0 10 20 30 40 50 60 70 80 90 100
21. Employee Turnover Rate
22. Average Hourly Wage, Shop Employees
23. Pct of Shop Workers Covered by Your Health Plan
24. Days Absent as Pct of Total Scheduled Work Days, Shop Workers
25. Work Days Lost Due to Accidents per 100 FTEs, Past Year
Percentile
9
This section presents a brief analysis of up to five "Weaknesses": those metrics on which your performance looksworst relative to the other shops in your comparison group. Of course, this selection of your five worst metrics issomewhat arbitrary and uninformed. Our analysis of past Benchmarking data confirms what common sense tellsus -- virtually no companies are "good" across the board, and trying to achieve the Top Tenth on every metric is aprescription for bankruptcy. Metrics on which you score poorly are worthy of attention if: 1) the cost to fix theproblem is less than the payoff to doing so, and 2) customers will effectively pay you for better performance, ordrop you if you don't achieve it.
With that in mind, we offer a brief discussion of your "bottom five" performance metrics: possible causes,connections and prescriptions. If this section contains only three weaknesses (i.e., you had only three or fewermetrics on which you were in the bottom half of the group), the next page may be blank.
3.6 Addressing Weaknesses
Running Hrs as a % of Available Hrs, Regular-Use Machines
The best measure of your machine utilization is how many hours they run in a year. But once youdetermine the level of manning appropriate to your order book, you also need to look at how manyof those manned, or available, hours your machines are running. The goal is to attack the drivers ofdowntime, including: long or unnecessary setups, unreliable supplier delivery, poor housekeepingand tool management, inadequate preventive maintenance, incapable machines, and poorbreakdown prediction.
Employee Turnover Rate
Calculated as the ratio of W2s to average headcount during the 12-month reporting period,employee turnover is an highly useful measure of employee commitment and attachment. Ourresearch shows that companies with lower rates of turnover have higher productivity. Academicliterature traces this effect to the fact that low-turnover companies hold on to their best, mostexperienced employees. Factors that help companies achieve lower employee turnover includehigher wages, better employee health insurance coverage, and better working conditions, includinga lower accident rate.
10
Running Hrs as a % of Hours in a Year, Regular-Use Machines
The best measure of your machine utilization is how many hours they run in a year – your runningtime as a percent of 365 days x 24 hours. Especially for newer, more expensive machinery, highrunning time is essential if fixed costs per unit are to be kept manageable. Steps include two- orthree-shift, or even three-crew, operation; fuller manning on more shifts; and an assault on all thecauses of downtime, including: long or unnecessary setups, unreliable supplier delivery, poorhousekeeping and tool management, inadequate preventive maintenance, incapable machines, andpoor breakdown prediction.
Inventory Turns (Cost-of-Goods-Sold/Total Inventory)
Low turns may result from excessive raw, finished, or in-process inventory stocks. You shouldexamine your percentile position on each of these to determine the culprit(s). Low raw turns (i.e.,high days) usually signal poor demand forecasting or suppliers that are unwilling to deliver smalllots frequently. Low finished goods turns (high days) often result from excessive stockpiling toinsure the ability to fill rush orders; where possible, consider instead stocking standard componentsbut assembling to order. Finally, high work-in-process (WIP) often reflects bottlenecks that resultin long waits between processing or assembly steps. Poor routings, bad line balancing, andfrequent but unanticipated machine failures are common culprits. Many companies have attackedhigh WIP by changing shop layout to cells, and by making inventory costs visible by replacingwarehousing with floor stock.
Value-Added per Square Foot of Production Floorspace
Value-added, which is defined as sales less the cost of inputs (materials, parts, services, and energy)purchased from the outside, measures the market value of work done inside the company.Value-added per square foot of production floorspace measures whether your factory floorspace --part of your fixed costs -- is being used effectively to produce income. A low value on this measure-- especially if you score fairly well on value-added per FTE, and on value-added per dollar ofequipment -- is worthy of attention even if your site is not particularly space-constrained. It mayindicate that you are struggling with a poor layout, putting significant labor time into merelymoving product around. Or, it may indicate that a large share of floorspace is devoted to storinginventory. In either case, your shop would probably benefit from a disciplined application of "leanproduction" techniques.
11

Where Performance Measures are goals, or ends, Practices are means to those ends. They are metrics on which it isuseful to know where your company stands compared to others in the comparison group. It is not necessarily goodto rank very high or very low if doing so is not required to achieve your goals. Practices include metrics thatsummarize your marketing and sales activities, your use of PCs and other keyboarded devices, and your HRinvestments.
The bars in the charts in this section are drawn relative to the median, or typical, firm. Bars that extend far to the leftshow that your value is near the minimum for the group; bars extending to the right indicate that your value isunusually large. You should look for your "outliers" and think carefully about what might be driving those aspectsof your business that make you unusual.
Note that having no bar at all for a particular metric implies either that your value is the median, or that you did notprovide the data necessary to calculate it. Please see Appendix 2 to see your own value, and the range of values foryour comparison group, for each Practice metric.
This section is organized as follows:4.1 Order-to-Cash Cycle4.2 Cost Profile4.3 People, Skills and Technology
4.4 Marketing
4. Practices
12

4.1 Order-to-Cash Cycle
Time is money. Manufacturers are appropriately increasing their focus on factory time compression, via leanproduction approaches and similar techniques. Yet Manufacturing Lead Time is often a small part of totalOrder-to-Cash time. Pre-production steps, involving everything from when the order is placed until test parts havebeen run and approved, can take months. And customers have an interest in extending Receivables for as long aspossible.
The bar chart below indicates how the components of your Order-to-Cash Cycle compare with those reported byothers in your comparison group. Bear in mind, however, that some group members do mostly repeat orders withtrivial pre-production requirements. Others must do all-new design and order all-new tooling with each order.And, of course, manufacturing lead times will vary with product complexity.
26. Pre-Production Lead Time (Days from Order to Release to Production)
27. Days Manufacturing Lead Time, Typical Order
28. Days Spent in Finished Goods Inventory, Typical Order
29. Order-to-Delivery Days (Pre-Prod'n + Mfg + Fin'd Goods), Typical Order
30. Average Days of Receivables
31. Days Order-to-Cash Lead Time, Typical Order
Your Percentile Relative to the Median
0 50 100
Lowestin theGroup
Medianfor theGroup
Highestin theGroup
In fact, how your lead times compare with the group isn't really the point. What matters is that you recognize thepotential cash flow benefits of reducing your order-to-cash cycle. If your Pre-Production Lead Times aresignificant, you might want to consider whether orders are unnecessarily queued before they even get to the shopfloor.
Your Data26. Pre-Production Lead Time (Days from Order to Release to Production) 84.027. Days Manufacturing Lead Time, Typical Order 10.028. Days Spent in Finished Goods Inventory, Typical Order 5.029. Order-to-Delivery Days (Pre-Prod'n + Mfg + Fin'd Goods), Typical Order 99.030. Average Days of Receivables 46.631. Days Order-to-Cash Lead Time, Typical Order 145.6
13
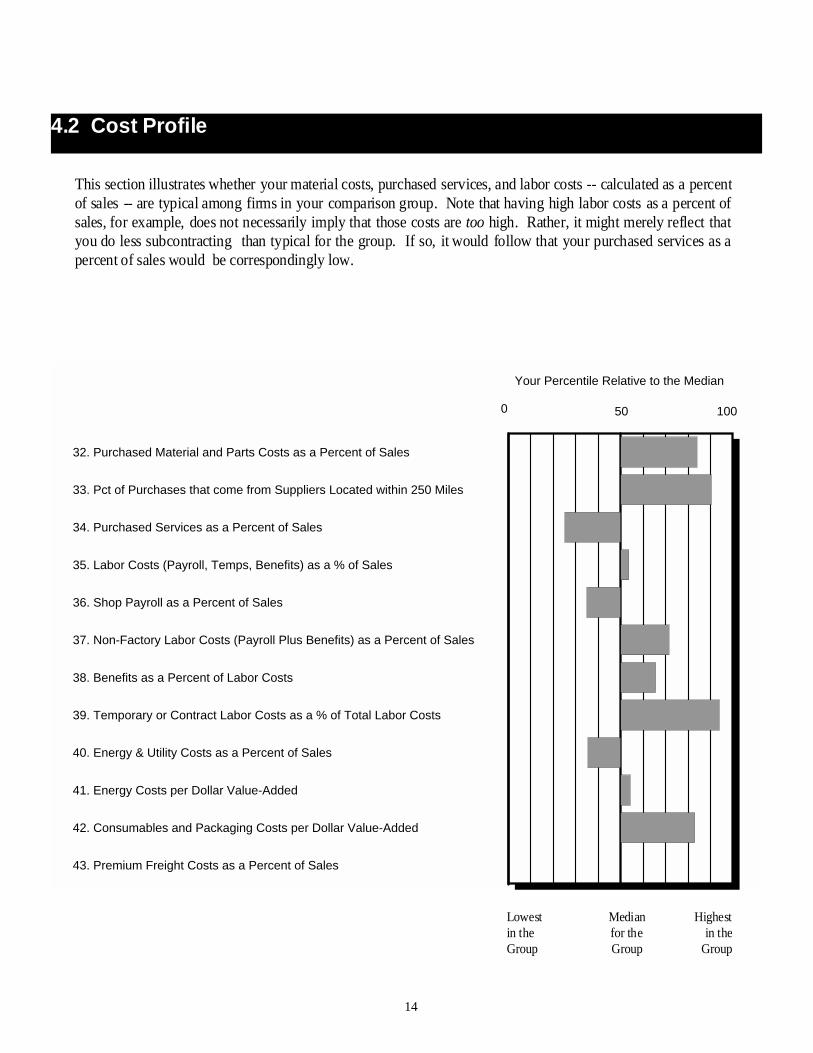
32. Purchased Material and Parts Costs as a Percent of Sales
33. Pct of Purchases that come from Suppliers Located within 250 Miles
34. Purchased Services as a Percent of Sales
35. Labor Costs (Payroll, Temps, Benefits) as a % of Sales
36. Shop Payroll as a Percent of Sales
37. Non-Factory Labor Costs (Payroll Plus Benefits) as a Percent of Sales
38. Benefits as a Percent of Labor Costs
39. Temporary or Contract Labor Costs as a % of Total Labor Costs
40. Energy & Utility Costs as a Percent of Sales
41. Energy Costs per Dollar Value-Added
42. Consumables and Packaging Costs per Dollar Value-Added
43. Premium Freight Costs as a Percent of Sales
Your Percentile Relative to the Median
0 50 100
Lowestin theGroup
Medianfor theGroup
Highestin the
Group
This section illustrates whether your material costs, purchased services, and labor costs -- calculated as a percentof sales -- are typical among firms in your comparison group. Note that having high labor costs as a percent ofsales, for example, does not necessarily imply that those costs are too high. Rather, it might merely reflect thatyou do less subcontracting than typical for the group. If so, it would follow that your purchased services as apercent of sales would be correspondingly low.
4.2 Cost Profile
14
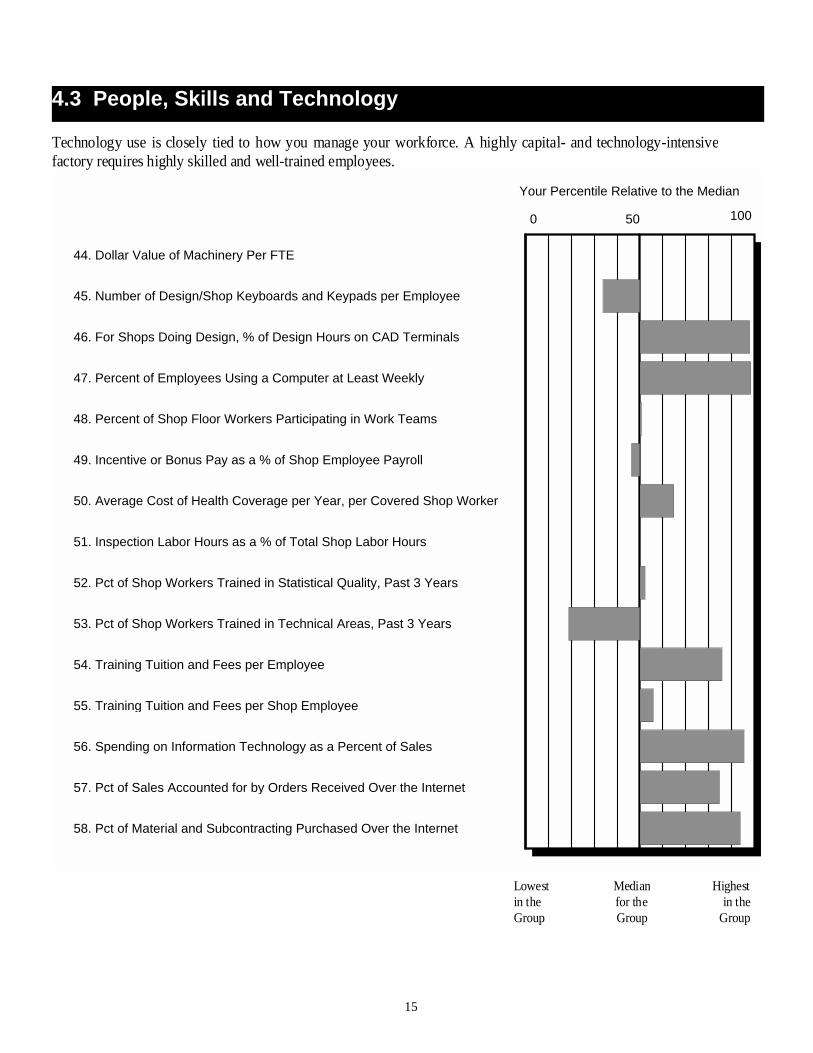
44. Dollar Value of Machinery Per FTE
45. Number of Design/Shop Keyboards and Keypads per Employee
46. For Shops Doing Design, % of Design Hours on CAD Terminals
47. Percent of Employees Using a Computer at Least Weekly
48. Percent of Shop Floor Workers Participating in Work Teams
49. Incentive or Bonus Pay as a % of Shop Employee Payroll
50. Average Cost of Health Coverage per Year, per Covered Shop Worker
51. Inspection Labor Hours as a % of Total Shop Labor Hours
52. Pct of Shop Workers Trained in Statistical Quality, Past 3 Years
53. Pct of Shop Workers Trained in Technical Areas, Past 3 Years
54. Training Tuition and Fees per Employee
55. Training Tuition and Fees per Shop Employee
56. Spending on Information Technology as a Percent of Sales
57. Pct of Sales Accounted for by Orders Received Over the Internet
58. Pct of Material and Subcontracting Purchased Over the Internet
Your Percentile Relative to the Median
0 50 100
Lowestin theGroup
Highestin the
Group
4.3 People, Skills and Technology
Medianfor theGroup
Technology use is closely tied to how you manage your workforce. A highly capital- and technology-intensivefactory requires highly skilled and well-trained employees.
15
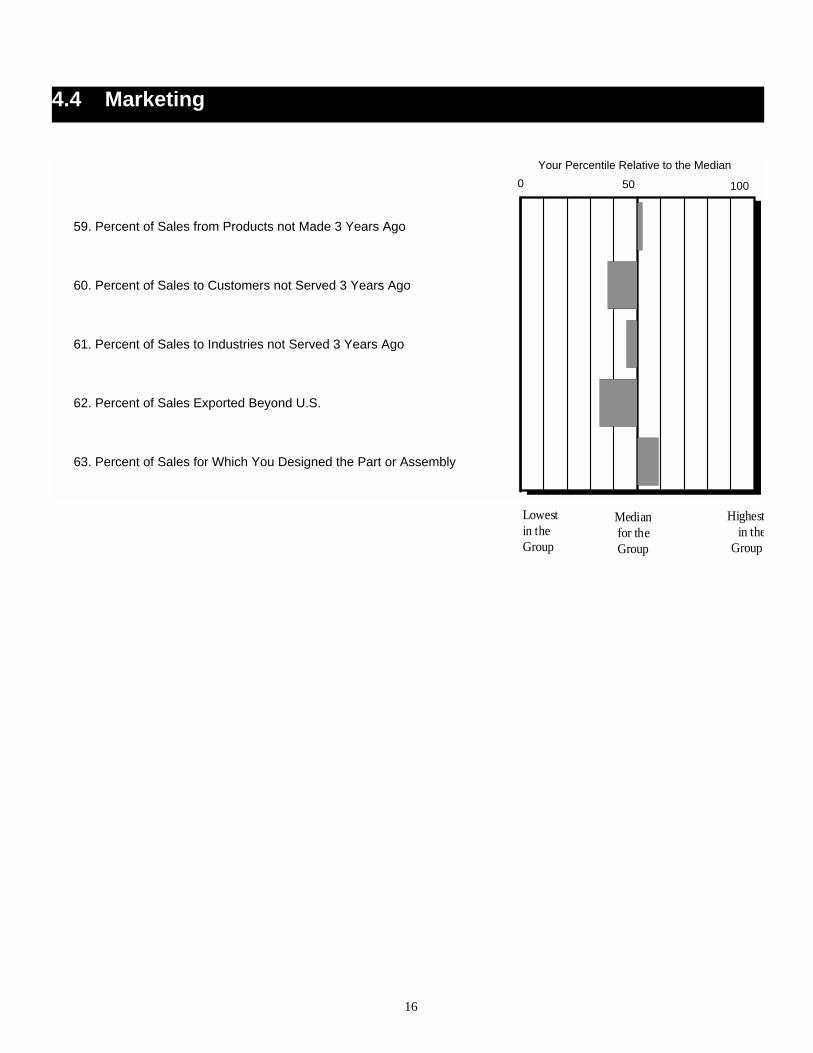
59. Percent of Sales from Products not Made 3 Years Ago
60. Percent of Sales to Customers not Served 3 Years Ago
61. Percent of Sales to Industries not Served 3 Years Ago
62. Percent of Sales Exported Beyond U.S.
63. Percent of Sales for Which You Designed the Part or Assembly
Your Percentile Relative to the Median0 50 100
Lowestin theGroup
Highestin the
Group
4.4 Marketing
Medianfor theGroup
16
QuestionNumber Question
YourAnswer
PercentYes
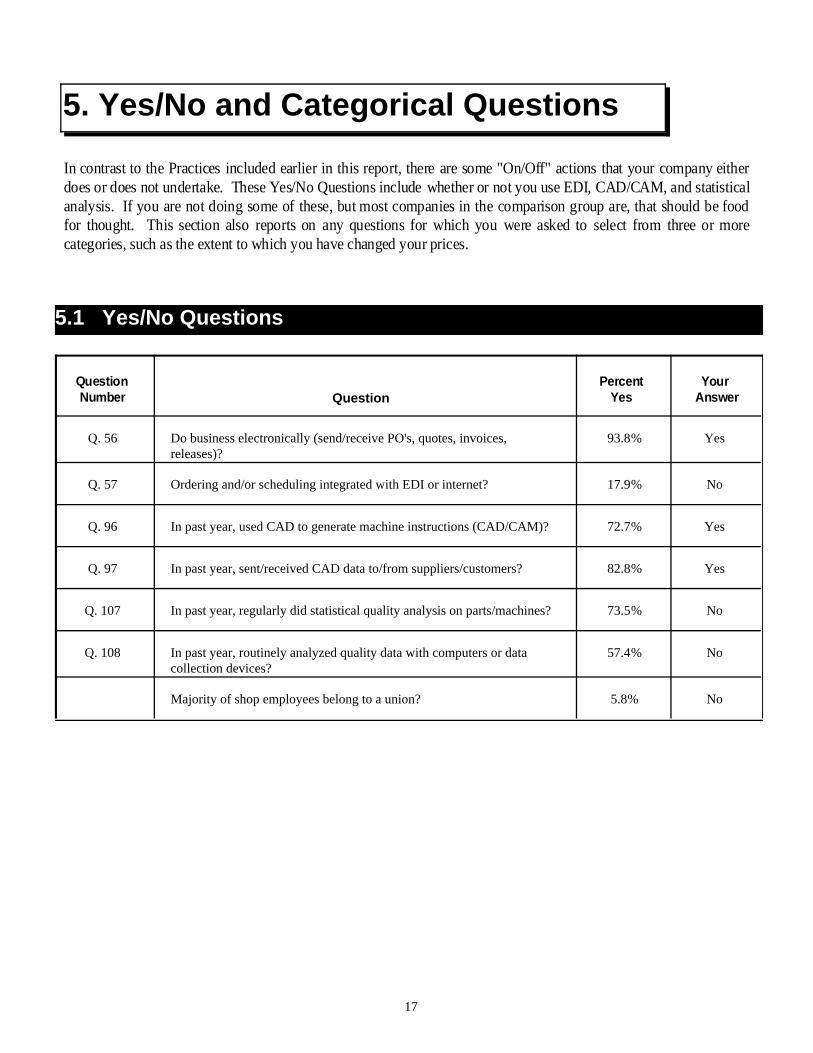
5. Yes/No and Categorical Questions
In contrast to the Practices included earlier in this report, there are some "On/Off" actions that your company eitherdoes or does not undertake. These Yes/No Questions include whether or not you use EDI, CAD/CAM, and statisticalanalysis. If you are not doing some of these, but most companies in the comparison group are, that should be foodfor thought. This section also reports on any questions for which you were asked to select from three or morecategories, such as the extent to which you have changed your prices.
5.1 Yes/No Questions
Do business electronically (send/receive PO's, quotes, invoices,releases)?
93.8%Q. 56 Yes
Ordering and/or scheduling integrated with EDI or internet? 17.9%Q. 57 No
In past year, used CAD to generate machine instructions (CAD/CAM)? 72.7%Q. 96 Yes
In past year, sent/received CAD data to/from suppliers/customers? 82.8%Q. 97 Yes
In past year, regularly did statistical quality analysis on parts/machines? 73.5%Q. 107 No
In past year, routinely analyzed quality data with computers or datacollection devices?
57.4%Q. 108 No
Majority of shop employees belong to a union? 5.8% No
17
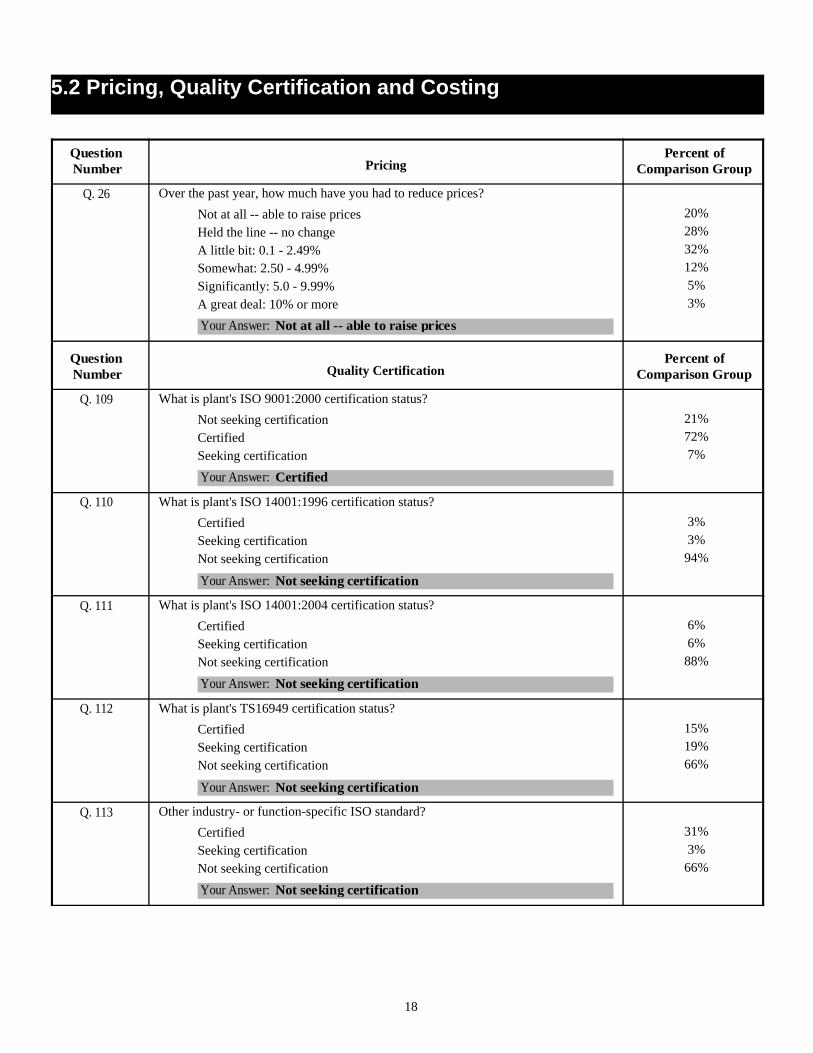
5.2 Pricing, Quality Certification and Costing
QuestionNumber Pricing
Percent ofComparison Group
Q. 26 Over the past year, how much have you had to reduce prices? 20%Not at all -- able to raise prices28%Held the line -- no change32%A little bit: 0.1 - 2.49%12%Somewhat: 2.50 - 4.99%5%Significantly: 5.0 - 9.99%3%A great deal: 10% or more
Your Answer: Not at all -- able to raise prices
QuestionNumber Quality Certification
Percent ofComparison Group
Q. 109 What is plant's ISO 9001:2000 certification status? 21%Not seeking certification72%Certified7%Seeking certification
Your Answer: Certified
Q. 110 What is plant's ISO 14001:1996 certification status? 3%Certified3%Seeking certification
94%Not seeking certification
Your Answer: Not seeking certification
Q. 111 What is plant's ISO 14001:2004 certification status? 6%Certified6%Seeking certification
88%Not seeking certification Your Answer: Not seeking certification
Q. 112 What is plant's TS16949 certification status? 15%Certified19%Seeking certification66%Not seeking certification
Your Answer: Not seeking certification
Q. 113 Other industry- or function-specific ISO standard? 31%Certified3%Seeking certification
66%Not seeking certification Your Answer: Not seeking certification
18

QuestionNumber Costing
Percent ofComparison Group
Q. 49 For cost estimating, how are estimates of direct material expense computed? 93%Calculated Separately for Each Job4%For Some Jobs, Adjust Rates or Add Special Mark-Up3%Always Included in Usual Hourly Billing Rates
Your Answer: Calculated Separately for Each Job
Q. 50 For cost estimating, how are estimates of tooling costs computed? 79%Calculated Separately for Each Job17%For Some Jobs, Adjust Rates or Add Special Mark-Up5%Always Included in Usual Hourly Billing Rates
Your Answer: Calculated Separately for Each Job
Q. 51 For cost estimating, how are estimates of design/engineering labor computed? 29%Calculated Separately for Each Job30%For Some Jobs, Adjust Rates or Add Special Mark-Up41%Always Included in Usual Hourly Billing Rates
Your Answer: For Some Jobs, Adjust Rates or Add Special Mark-Up
Q. 52 For cost estimating, how are estimates of factory indirect labor computed? 18%Calculated Separately for Each Job14%For Some Jobs, Adjust Rates or Add Special Mark-Up68%Always Included in Usual Hourly Billing Rates
Your Answer: Always Included in Usual Hourly Billing Rates
Q. 53 For cost estimating, how are estimates of order processing costs computed? 11%Calculated Separately for Each Job5%For Some Jobs, Adjust Rates or Add Special Mark-Up
84%Always Included in Usual Hourly Billing Rates Your Answer: Calculated Separately for Each Job
Q. 54 For cost estimating, how are estimates of inventory holding costs computed? 14%Calculated Separately for Each Job41%For Some Jobs, Adjust Rates or Add Special Mark-Up45%Always Included in Usual Hourly Billing Rates
Your Answer: For Some Jobs, Adjust Rates or Add Special Mark-Up
19
6.1 Industry Breakdown
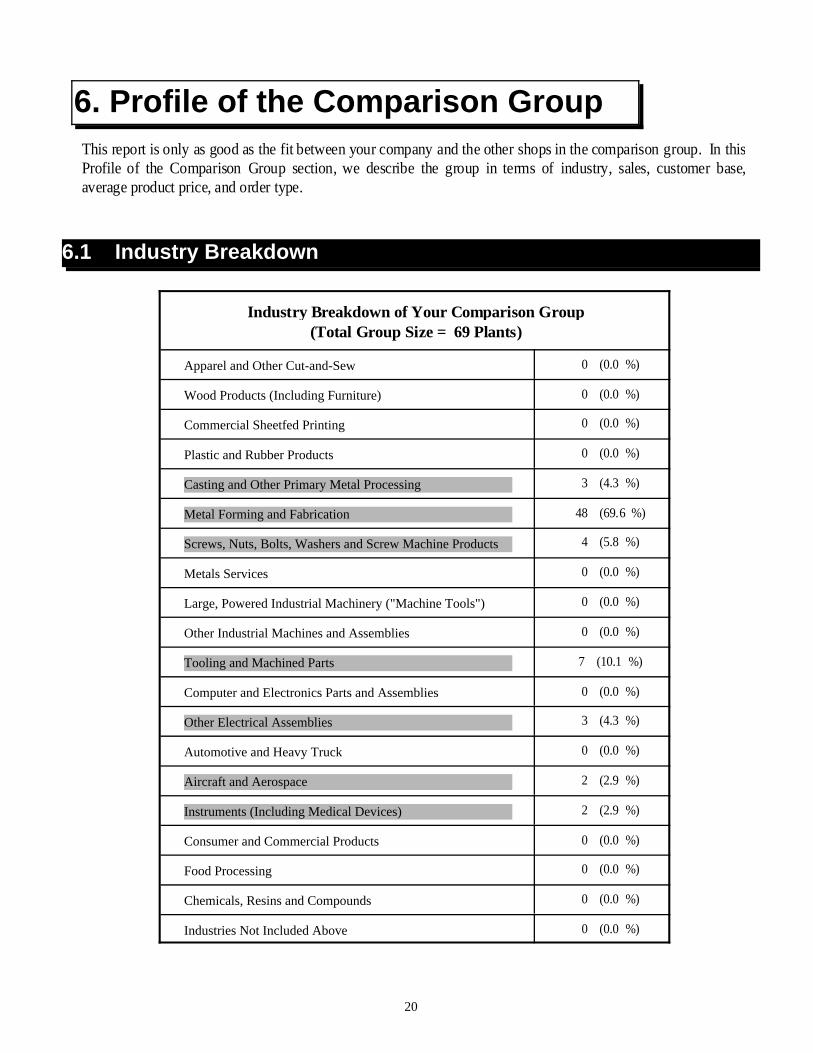
6. Profile of the Comparison GroupThis report is only as good as the fit between your company and the other shops in the comparison group. In thisProfile of the Comparison Group section, we describe the group in terms of industry, sales, customer base,average product price, and order type.
Industry Breakdown of Your Comparison Group(Total Group Size = 69 Plants)
Apparel and Other Cut-and-Sew 0 (0.0 %)
Wood Products (Including Furniture) 0 (0.0 %)
Commercial Sheetfed Printing 0 (0.0 %)
Plastic and Rubber Products 0 (0.0 %)
Casting and Other Primary Metal Processing 3 (4.3 %)
Metal Forming and Fabrication 48 (69.6 %)
Screws, Nuts, Bolts, Washers and Screw Machine Products 4 (5.8 %)
Metals Services 0 (0.0 %)
Large, Powered Industrial Machinery ("Machine Tools") 0 (0.0 %)
Other Industrial Machines and Assemblies 0 (0.0 %)
Tooling and Machined Parts 7 (10.1 %)
Computer and Electronics Parts and Assemblies 0 (0.0 %)
Other Electrical Assemblies 3 (4.3 %)
Automotive and Heavy Truck 0 (0.0 %)
Aircraft and Aerospace 2 (2.9 %)
Instruments (Including Medical Devices) 2 (2.9 %)
Consumer and Commercial Products 0 (0.0 %)
Food Processing 0 (0.0 %)
Chemicals, Resins and Compounds 0 (0.0 %)
Industries Not Included Above 0 (0.0 %)
20

6.2 Geographic Distribution
Number (and Percent) of Comparison Group Members Located in:
US - Michigan 14 ( 20.3 % )
US -Other Great Lakes 24 ( 34.8 % )
US - Northeast 14 ( 20.3 % )
US - South 4 ( 5.8 % )
US - Plains 1 ( 1.4 % )
US - West 8 ( 11.6 % )
Canada 2 ( 2.9 % )
Mexico, Latin America, or Caribbean 0 ( 0.0 % )
Western Europe 0 ( 0.0 % )
Eastern Europe, Turkey and Caucasus 1 ( 1.4 % )
Australia, Japan, New Zealand 0 ( 0.0 % )
Hong Kong, S. Korea, Singapore, Taiwan 0 ( 0.0 % )
Other Asia and the Pacific 1 ( 1.4 % )
Africa 0 ( 0.0 % )
US - MichiganUS -Other Great Lakes
US - NortheastUS - SouthUS - Plains
US - West
CanadaE. EuropeOther Asia
21

QuestionNumber Question
PercentYes
Your Answer
6.4 Yes/No Characteristics
Service business (do quick-turnaround work on parts/materialyour customer provides)?
0.0%Q. 61 No
Is company owner-managed? 64.2%Q. 116 Yes
Is this the only plant in the company? 76.5%Q. 117 Yes
6.3 Profile of Business Characteristics
Distribution of Comparison Group Values
YourValue
25% SaidAt or BelowMedian
25% SaidAt Least
$ 22,344 $ 15,000 $ 7,823 $ 11,400Annual Sales ($000)
$ 15.00 $ 2.14 $ 0.75Average Unit or Piece Price
17,000 2,000 250Typical Units Per Order
10.0% 5.0% 0.0% 1.0%Pct of Sales from One-Off Items (Dies, Prototypes, Etc.)
12.0% 5.0% 0.0% 1.0%Percent of Sales from Short-Term/Job Shop Orders
95.0% 87.0% 70.0% 97.0%Percent of Sales from Long-Term Jobs Run Regularly
5.0% 0.0% 0.0% 1.0%Percent of Sales from Make-to-Stock Work
28.0% 15.0% 8.0% 10.0%Pct of Shop Labor Time Spent Doing Assembly,Packaging, Etc.
40.0% 5.0% 0.0% 2.0%Percent of Sales to the Auto Industry
5.0% 0.0% 0.0% 0.0%Percent of Sales to Aircraft/Aerospace Industry
10.0% 0.0% 0.0% 0.0%Percent of Sales to the Communications/ElectronicsIndustry
1.0% 0.0% 0.0% 0.0%Percent of Sales to Final Consumers, Wholesalers, orRetailers
2.0% 0.0% 0.0% 0.0%Percent of Sales that are Military/Defense-Related
300 100 38 176Number of Distinct Part Numbers Accounting for 80% ofYour Sales
22
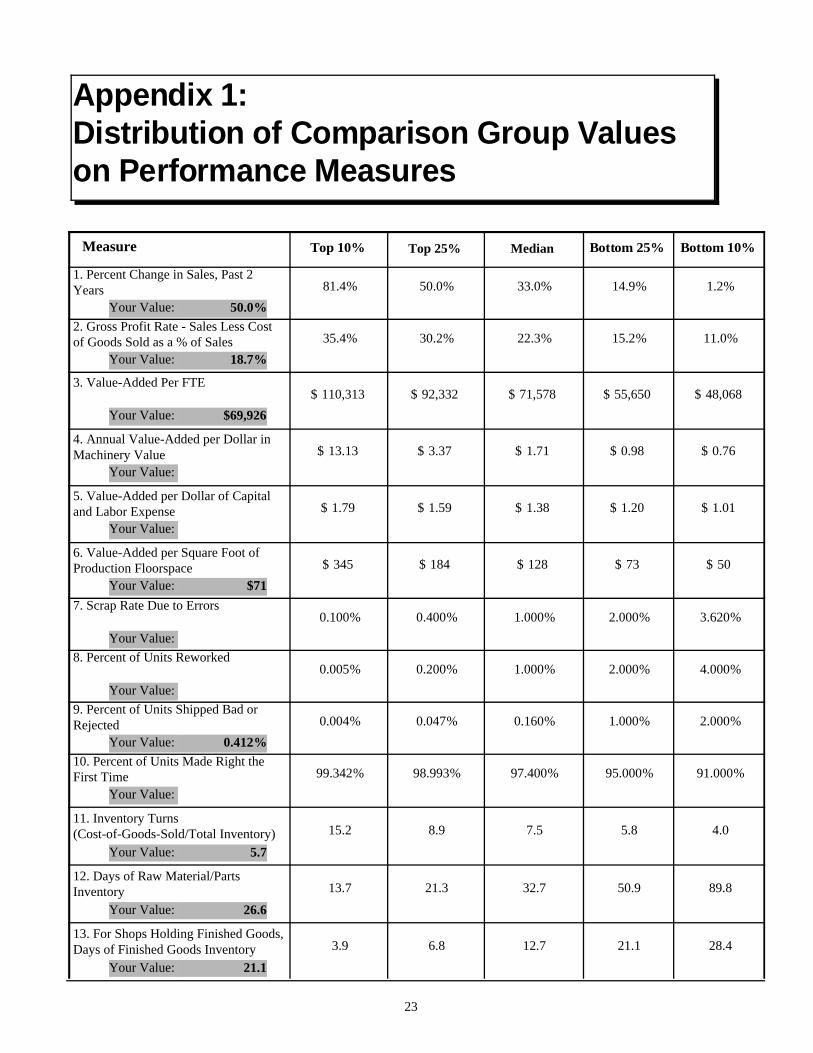
Appendix 1:Distribution of Comparison Group Valueson Performance Measures
Bottom 10%Bottom 25%MedianTop 25%Top 10%Measure
1. Percent Change in Sales, Past 2Years 81.4% 50.0% 33.0% 14.9% 1.2%
%50.0Your Value:2. Gross Profit Rate - Sales Less Costof Goods Sold as a % of Sales 35.4% 30.2% 22.3% 15.2% 11.0%
%18.7Your Value:
$ 110,313 $ 92,332 $ 71,578 $ 55,650 $ 48,0683. Value-Added Per FTE
Your Value: $69,926
$ 13.13 $ 3.37 $ 1.71 $ 0.98 $ 0.764. Annual Value-Added per Dollar inMachinery Value
Your Value:
$ 1.79 $ 1.59 $ 1.38 $ 1.20 $ 1.015. Value-Added per Dollar of Capitaland Labor Expense
Your Value:
$ 345 $ 184 $ 128 $ 73 $ 506. Value-Added per Square Foot ofProduction Floorspace
Your Value: $717. Scrap Rate Due to Errors
0.100% 0.400% 1.000% 2.000% 3.620%Your Value:
8. Percent of Units Reworked0.005% 0.200% 1.000% 2.000% 4.000%
Your Value:9. Percent of Units Shipped Bad orRejected 0.004% 0.047% 0.160% 1.000% 2.000%
%0.412Your Value:10. Percent of Units Made Right theFirst Time 99.342% 98.993% 97.400% 95.000% 91.000%
Your Value:
15.2 8.9 7.5 5.8 4.011. Inventory Turns(Cost-of-Goods-Sold/Total Inventory)
Your Value: 5.7
13.7 21.3 32.7 50.9 89.812. Days of Raw Material/PartsInventory
Your Value: 26.6
3.9 6.8 12.7 21.1 28.413. For Shops Holding Finished Goods,Days of Finished Goods Inventory
Your Value: 21.1
23

Bottom 10%Bottom 25%MedianTop 25%Top 10%Measure
14. Percent On-Time Deliveries toYour Customers 99.2% 98.0% 95.2% 86.0% 78.9%
%95.8Your Value:15. Percent of Supplier ShipmentsDelivered to You on Time 98.0% 95.0% 90.0% 80.0% 75.0%
%87.0Your Value:16. Percent of Jobs Causing OtherScheduled Jobs to be Bumped 1.5% 2.8% 6.3% 14.7% 48.9%
Your Value:17. Available (Manned) Hrs as a % ofHrs in a Year, Avg Per Machine 60.8% 41.7% 28.8% 21.7% 16.2%
%46.6Your Value:18. Running Hrs as a % of AvailableHrs, Regular-Use Machines 83.3% 78.3% 65.1% 50.0% 27.6%
%23.2Your Value:19. Running Hrs as a % of Hours in aYear, Regular-Use Machines 33.4% 24.4% 17.6% 11.2% 7.6%
%10.8Your Value:20. Setup Hours as a % of Available(Manned) Machine Hours 1.0% 3.6% 8.3% 13.2% 21.3%
Your Value:21. Employee Turnover Rate
6.1% 13.5% 23.5% 40.0% 59.5%%42.4Your Value:
$ 17.44 $ 15.83 $ 14.20 $ 12.23 $ 11.1522. Average Hourly Wage, ShopEmployees
Your Value: $13.7323. Pct of Shop Workers Covered byYour Health Plan 100.0% 95.6% 83.3% 70.0% 60.0%
%85.4Your Value:24. Days Absent as Pct of TotalScheduled Work Days, Shop Workers 0.5% 1.0% 2.0% 3.0% 5.0%
Your Value:
0.0 0.0 3.1 19.6 133.725. Work Days Lost Due to Accidentsper 100 FTEs, Past Year
Your Value: 0.0
24
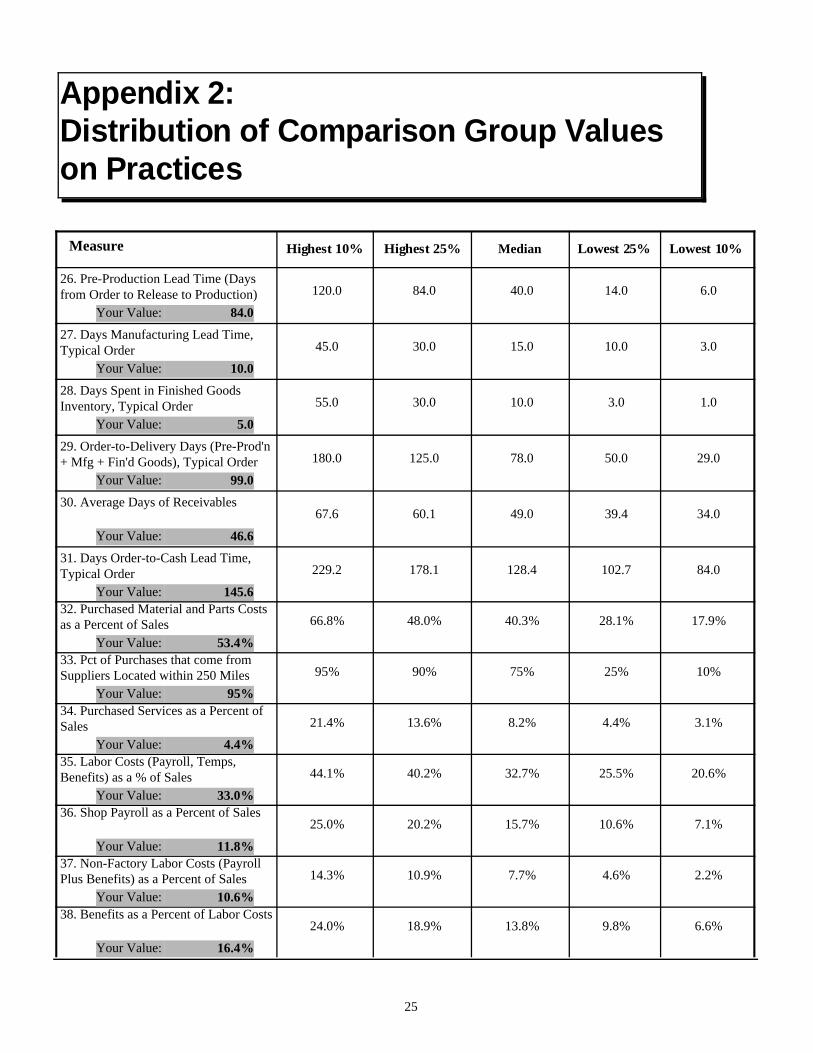
Appendix 2:Distribution of Comparison Group Valueson Practices
Lowest 10%Lowest 25%MedianHighest 25%Highest 10%Measure
120.0 84.0 40.0 14.0 6.026. Pre-Production Lead Time (Daysfrom Order to Release to Production)
Your Value: 84.0
45.0 30.0 15.0 10.0 3.027. Days Manufacturing Lead Time,Typical Order
Your Value: 10.0
55.0 30.0 10.0 3.0 1.028. Days Spent in Finished GoodsInventory, Typical Order
Your Value: 5.0
180.0 125.0 78.0 50.0 29.029. Order-to-Delivery Days (Pre-Prod'n+ Mfg + Fin'd Goods), Typical Order
Your Value: 99.0
67.6 60.1 49.0 39.4 34.030. Average Days of Receivables
Your Value: 46.6
229.2 178.1 128.4 102.7 84.031. Days Order-to-Cash Lead Time,Typical Order
Your Value: 145.632. Purchased Material and Parts Costsas a Percent of Sales 66.8% 48.0% 40.3% 28.1% 17.9%
%53.4Your Value:33. Pct of Purchases that come fromSuppliers Located within 250 Miles 95% 90% 75% 25% 10%
%95Your Value:34. Purchased Services as a Percent ofSales 21.4% 13.6% 8.2% 4.4% 3.1%
%4.4Your Value:35. Labor Costs (Payroll, Temps,Benefits) as a % of Sales 44.1% 40.2% 32.7% 25.5% 20.6%
%33.0Your Value:36. Shop Payroll as a Percent of Sales
25.0% 20.2% 15.7% 10.6% 7.1%
%11.8Your Value:37. Non-Factory Labor Costs (PayrollPlus Benefits) as a Percent of Sales 14.3% 10.9% 7.7% 4.6% 2.2%
%10.6Your Value:38. Benefits as a Percent of Labor Costs
24.0% 18.9% 13.8% 9.8% 6.6%
%16.4Your Value:
25

Lowest 10%Lowest 25%MedianHighest 25%Highest 10%Measure
39. Temporary or Contract Labor Costsas a % of Total Labor Costs 11.2% 6.4% 2.0% 0.0% 0.0%
%11.5Your Value:40. Energy & Utility Costs as a Percentof Sales 2.59% 1.67% 1.20% 0.88% 0.60%
%1.02Your Value:
$ 0.07 $ 0.04 $ 0.02 $ 0.02 $ 0.0141. Energy Costs per DollarValue-Added
Your Value: $0.02
$ 0.14 $ 0.07 $ 0.03 $ 0.02 $ 0.0142. Consumables and Packaging Costsper Dollar Value-Added
Your Value: $0.1043. Premium Freight Costs as a Percentof Sales 0.423% 0.171% 0.051% 0.009% 0.000%
Your Value:
$ 106,618 $ 74,608 $ 43,628 $ 27,799 $ 9,69044. Dollar Value of Machinery Per FTE
Your Value:
0.778 0.588 0.320 0.167 0.06945. Number of Design/Shop Keyboardsand Keypads per Employee
Your Value: 0.20346. For Shops Doing Design, % ofDesign Hours on CAD Terminals 100.0% 100.0% 90.0% 30.0% 8.0%
%100.0Your Value:47. Percent of Employees Using aComputer at Least Weekly 100.0% 100.0% 83.3% 40.8% 24.0%
%100.0Your Value:48. Percent of Shop Floor WorkersParticipating in Work Teams 78.5% 13.3% 0.0% 0.0% 0.0%
%0.0Your Value:49. Incentive or Bonus Pay as a % ofShop Employee Payroll 10.0% 5.0% 0.9% 0.0% 0.0%
%0.0Your Value:
$ 6,879 $ 5,786 $ 4,750 $ 3,312 $ 2,32150. Average Cost of Health Coverageper Year, per Covered Shop Worker
Your Value: $5,34351. Inspection Labor Hours as a % ofTotal Shop Labor Hours 16.4% 10.0% 8.1% 5.2% 2.4%
Your Value:52. Pct of Shop Workers Trained inStatistical Quality, Past 3 Years 100% 40% 5% 0% 0%
%5Your Value:53. Pct of Shop Workers Trained inTechnical Areas, Past 3 Years 100.0% 70.0% 20.0% 5.0% 0.0%
%0.0Your Value:
$ 625 $ 294 $ 162 $ 93 $ 3354. Training Tuition and Fees perEmployee
Your Value: $508
26
Lowest 10%Lowest 25%MedianHighest 25%Highest 10%Measure
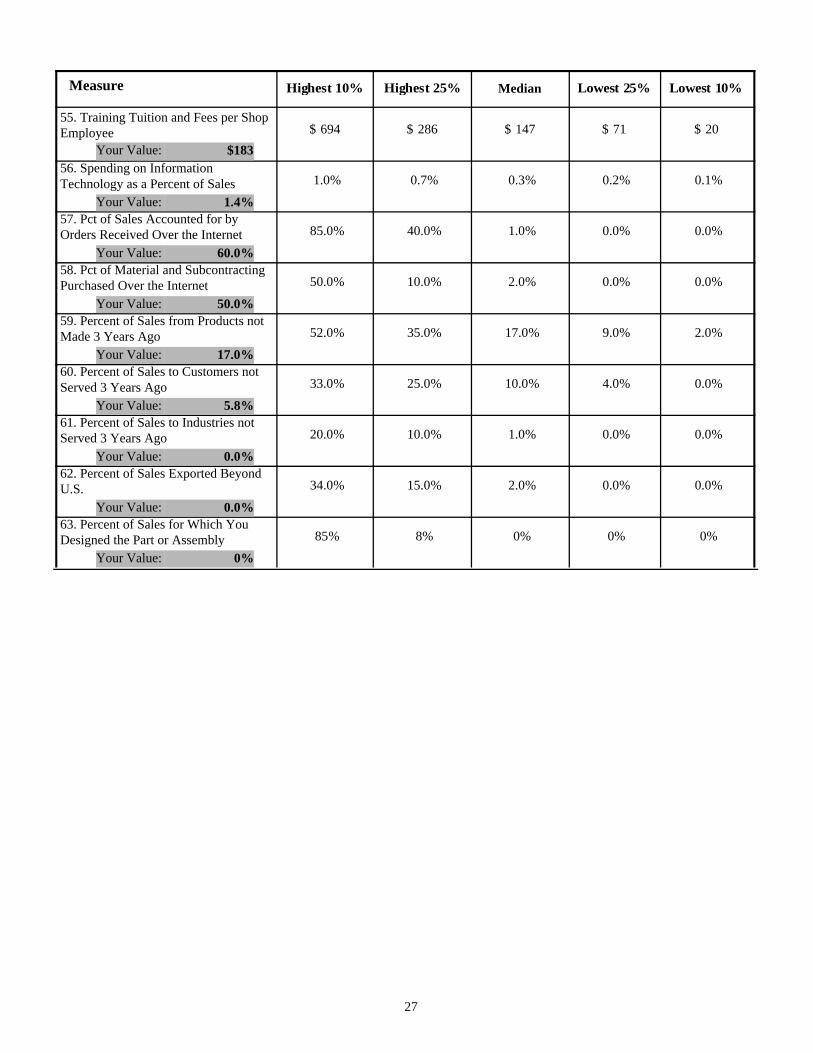
$ 694 $ 286 $ 147 $ 71 $ 2055. Training Tuition and Fees per ShopEmployee
Your Value: $18356. Spending on InformationTechnology as a Percent of Sales 1.0% 0.7% 0.3% 0.2% 0.1%
%1.4Your Value:57. Pct of Sales Accounted for byOrders Received Over the Internet 85.0% 40.0% 1.0% 0.0% 0.0%
%60.0Your Value:58. Pct of Material and SubcontractingPurchased Over the Internet 50.0% 10.0% 2.0% 0.0% 0.0%
%50.0Your Value:59. Percent of Sales from Products notMade 3 Years Ago 52.0% 35.0% 17.0% 9.0% 2.0%
%17.0Your Value:60. Percent of Sales to Customers notServed 3 Years Ago 33.0% 25.0% 10.0% 4.0% 0.0%
%5.8Your Value:61. Percent of Sales to Industries notServed 3 Years Ago 20.0% 10.0% 1.0% 0.0% 0.0%
%0.0Your Value:62. Percent of Sales Exported BeyondU.S. 34.0% 15.0% 2.0% 0.0% 0.0%
%0.0Your Value:63. Percent of Sales for Which YouDesigned the Part or Assembly 85% 8% 0% 0% 0%
%0Your Value:
27
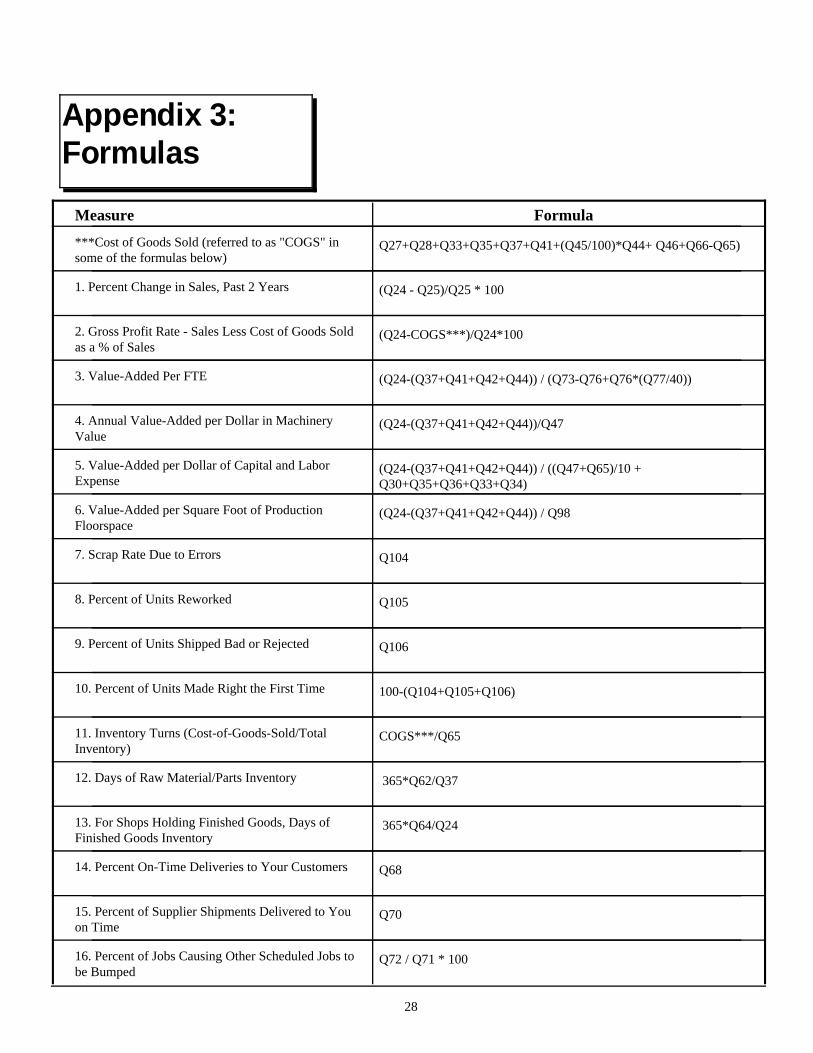
Appendix 3:Formulas
FormulaMeasure***Cost of Goods Sold (referred to as "COGS" insome of the formulas below)
Q27+Q28+Q33+Q35+Q37+Q41+(Q45/100)*Q44+ Q46+Q66-Q65)
1. Percent Change in Sales, Past 2 Years (Q24 - Q25)/Q25 * 100
2. Gross Profit Rate - Sales Less Cost of Goods Soldas a % of Sales
(Q24-COGS***)/Q24*100
3. Value-Added Per FTE (Q24-(Q37+Q41+Q42+Q44)) / (Q73-Q76+Q76*(Q77/40))
4. Annual Value-Added per Dollar in MachineryValue
(Q24-(Q37+Q41+Q42+Q44))/Q47
5. Value-Added per Dollar of Capital and LaborExpense
(Q24-(Q37+Q41+Q42+Q44)) / ((Q47+Q65)/10 +Q30+Q35+Q36+Q33+Q34)
6. Value-Added per Square Foot of ProductionFloorspace
(Q24-(Q37+Q41+Q42+Q44)) / Q98
7. Scrap Rate Due to Errors Q104
8. Percent of Units Reworked Q105
9. Percent of Units Shipped Bad or Rejected Q106
10. Percent of Units Made Right the First Time 100-(Q104+Q105+Q106)
11. Inventory Turns (Cost-of-Goods-Sold/TotalInventory)
COGS***/Q65
12. Days of Raw Material/Parts Inventory 365*Q62/Q37
13. For Shops Holding Finished Goods, Days ofFinished Goods Inventory
365*Q64/Q24
14. Percent On-Time Deliveries to Your Customers Q68
15. Percent of Supplier Shipments Delivered to Youon Time
Q70
16. Percent of Jobs Causing Other Scheduled Jobs tobe Bumped
Q72 / Q71 * 100
28
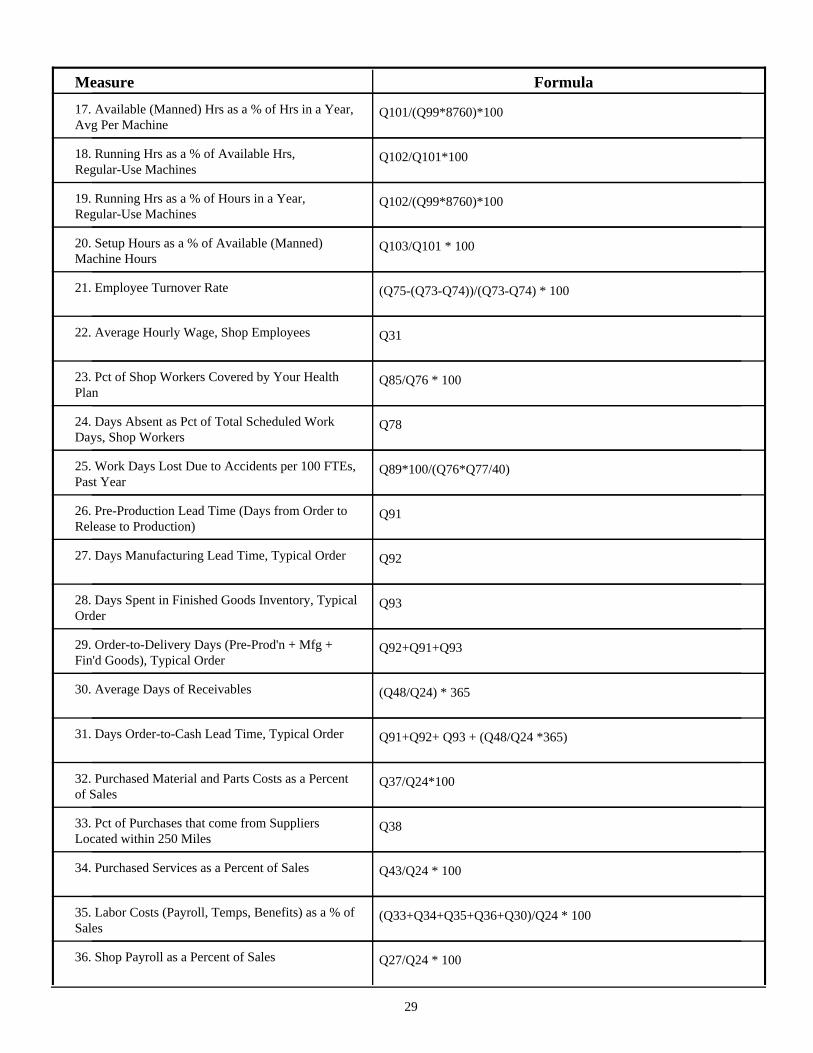
FormulaMeasure17. Available (Manned) Hrs as a % of Hrs in a Year,Avg Per Machine
Q101/(Q99*8760)*100
18. Running Hrs as a % of Available Hrs,Regular-Use Machines
Q102/Q101*100
19. Running Hrs as a % of Hours in a Year,Regular-Use Machines
Q102/(Q99*8760)*100
20. Setup Hours as a % of Available (Manned)Machine Hours
Q103/Q101 * 100
21. Employee Turnover Rate (Q75-(Q73-Q74))/(Q73-Q74) * 100
22. Average Hourly Wage, Shop Employees Q31
23. Pct of Shop Workers Covered by Your HealthPlan
Q85/Q76 * 100
24. Days Absent as Pct of Total Scheduled WorkDays, Shop Workers
Q78
25. Work Days Lost Due to Accidents per 100 FTEs,Past Year
Q89*100/(Q76*Q77/40)
26. Pre-Production Lead Time (Days from Order toRelease to Production)
Q91
27. Days Manufacturing Lead Time, Typical Order Q92
28. Days Spent in Finished Goods Inventory, TypicalOrder
Q93
29. Order-to-Delivery Days (Pre-Prod'n + Mfg +Fin'd Goods), Typical Order
Q92+Q91+Q93
30. Average Days of Receivables (Q48/Q24) * 365
31. Days Order-to-Cash Lead Time, Typical Order Q91+Q92+ Q93 + (Q48/Q24 *365)
32. Purchased Material and Parts Costs as a Percentof Sales
Q37/Q24*100
33. Pct of Purchases that come from SuppliersLocated within 250 Miles
Q38
34. Purchased Services as a Percent of Sales Q43/Q24 * 100
35. Labor Costs (Payroll, Temps, Benefits) as a % ofSales
(Q33+Q34+Q35+Q36+Q30)/Q24 * 100
36. Shop Payroll as a Percent of Sales Q27/Q24 * 100
29
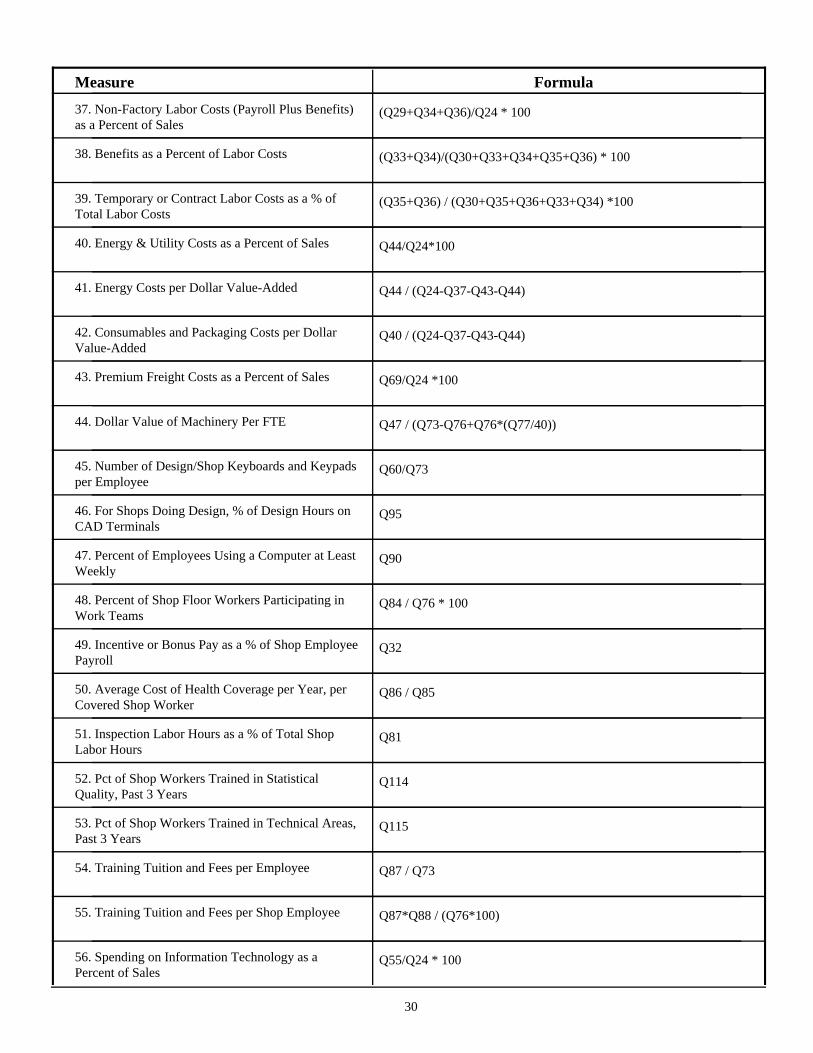
FormulaMeasure37. Non-Factory Labor Costs (Payroll Plus Benefits)as a Percent of Sales
(Q29+Q34+Q36)/Q24 * 100
38. Benefits as a Percent of Labor Costs (Q33+Q34)/(Q30+Q33+Q34+Q35+Q36) * 100
39. Temporary or Contract Labor Costs as a % ofTotal Labor Costs
(Q35+Q36) / (Q30+Q35+Q36+Q33+Q34) *100
40. Energy & Utility Costs as a Percent of Sales Q44/Q24*100
41. Energy Costs per Dollar Value-Added Q44 / (Q24-Q37-Q43-Q44)
42. Consumables and Packaging Costs per DollarValue-Added
Q40 / (Q24-Q37-Q43-Q44)
43. Premium Freight Costs as a Percent of Sales Q69/Q24 *100
44. Dollar Value of Machinery Per FTE Q47 / (Q73-Q76+Q76*(Q77/40))
45. Number of Design/Shop Keyboards and Keypadsper Employee
Q60/Q73
46. For Shops Doing Design, % of Design Hours onCAD Terminals
Q95
47. Percent of Employees Using a Computer at LeastWeekly
Q90
48. Percent of Shop Floor Workers Participating inWork Teams
Q84 / Q76 * 100
49. Incentive or Bonus Pay as a % of Shop EmployeePayroll
Q32
50. Average Cost of Health Coverage per Year, perCovered Shop Worker
Q86 / Q85
51. Inspection Labor Hours as a % of Total ShopLabor Hours
Q81
52. Pct of Shop Workers Trained in StatisticalQuality, Past 3 Years
Q114
53. Pct of Shop Workers Trained in Technical Areas,Past 3 Years
Q115
54. Training Tuition and Fees per Employee Q87 / Q73
55. Training Tuition and Fees per Shop Employee Q87*Q88 / (Q76*100)
56. Spending on Information Technology as aPercent of Sales
Q55/Q24 * 100
30
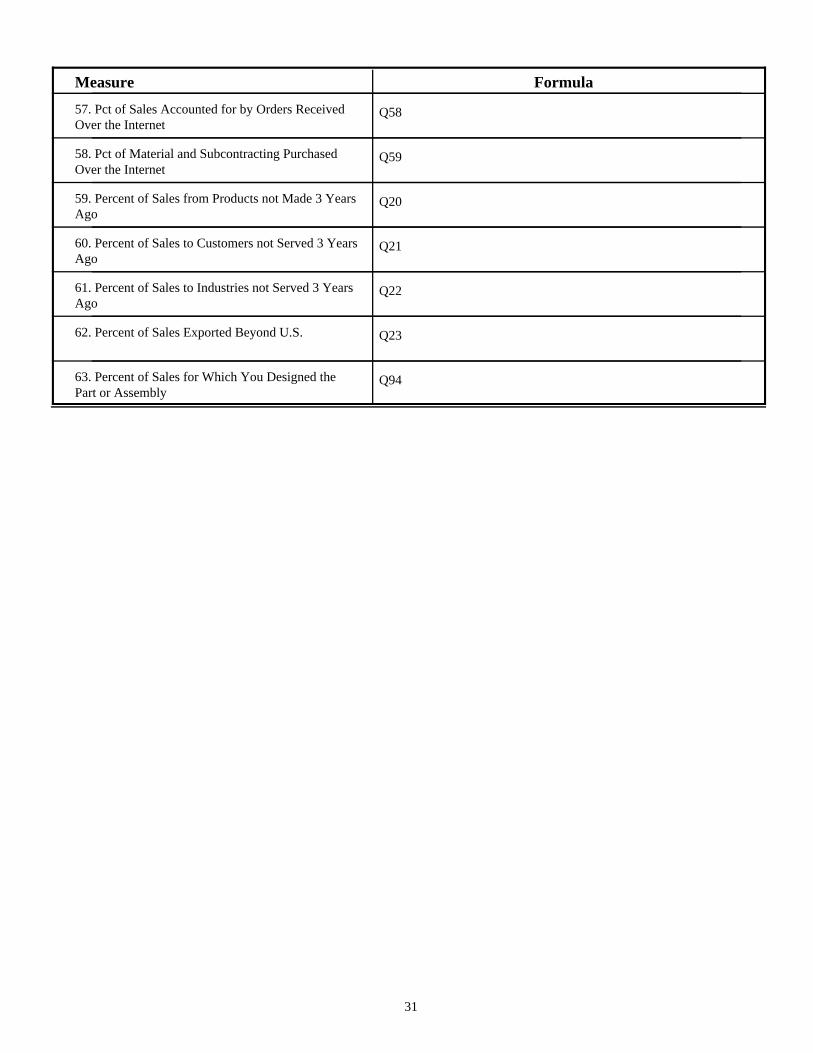
FormulaMeasure57. Pct of Sales Accounted for by Orders ReceivedOver the Internet
Q58
58. Pct of Material and Subcontracting PurchasedOver the Internet
Q59
59. Percent of Sales from Products not Made 3 YearsAgo
Q20
60. Percent of Sales to Customers not Served 3 YearsAgo
Q21
61. Percent of Sales to Industries not Served 3 YearsAgo
Q22
62. Percent of Sales Exported Beyond U.S. Q23
63. Percent of Sales for Which You Designed thePart or Assembly
Q94
31