Embed Size (px)
Citation preview
WHITE PAPER PERFORMANCE REPORT PRIMERGY RX900 S2
© Fujitsu Technology Solutions 2011 Page 1 (40)
WHITE PAPER FUJITSU PRIMERGY SERVERS PERFORMANCE REPORT PRIMERGY RX900 S2
This document contains a summary of the benchmarks executed for the PRIMERGY RX900 S2.
The PRIMERGY RX900 S2 performance data are compared with the data of other PRIMERGY models and discussed. In addition to the benchmark results, an explanation has been included for each benchmark and for the benchmark environment.
Version
1.2
2011-10-28
Contents
Document history ................................... 2
Technical data ........................................ 3
SPECcpu2006 ........................................ 4
SPECjbb2005 ......................................... 9
OLTP-2 ................................................. 12
TPC-E with TPC-Energy ...................... 16
vServCon .............................................. 22
VMmark V2 ........................................... 32
STREAM ............................................... 35
LINPACK .............................................. 37
Literature .............................................. 39
Contact ................................................. 40

WHITE PAPER PERFORMANCE REPORT PRIMERGY RX900 S2 VERSION: 1.2 2011-10-28
Page 2 (40) © Fujitsu Technology Solutions 2011
Document history
Version 1.0
First report version including the benchmark chapters
SPECcpu2006 Measurements with Xeon E7-8830, E7-8837, E7-8850, E7-8860 and E7-8870
SPECjbb2005 Measurements with Xeon E7-8830, E7-8837, E7-8850, E7-8860 and E7-8870
OLTP-2 Results for Xeon E7-8830, E7-8837, E7-8850, E7-8860 and E7-8870
TPC-E with TPC-Energy Measurement with Xeon E7-8870
vServCon Results for Xeon E7-8800, E7-4800 and E7-2800 processor series
STREAM Measurements with Xeon E7-8830, E7-8837, E7-8850, E7-8860 and E7-8870
LINPACK Measurements with Xeon E7-8830, E7-8837, E7-8850, E7-8860 and E7-8870
Version 1.1
New benchmark chapters:
VMmark V2 Measurement with Xeon E7-8870
Version 1.2
Updated benchmark chapters:
OLTP-2 New results for 4-socket configurations
WHITE PAPER PERFORMANCE REPORT PRIMERGY RX900 S2 VERSION: 1.2 2011-10-28
© Fujitsu Technology Solutions 2011 Page 3 (40)
Technical data
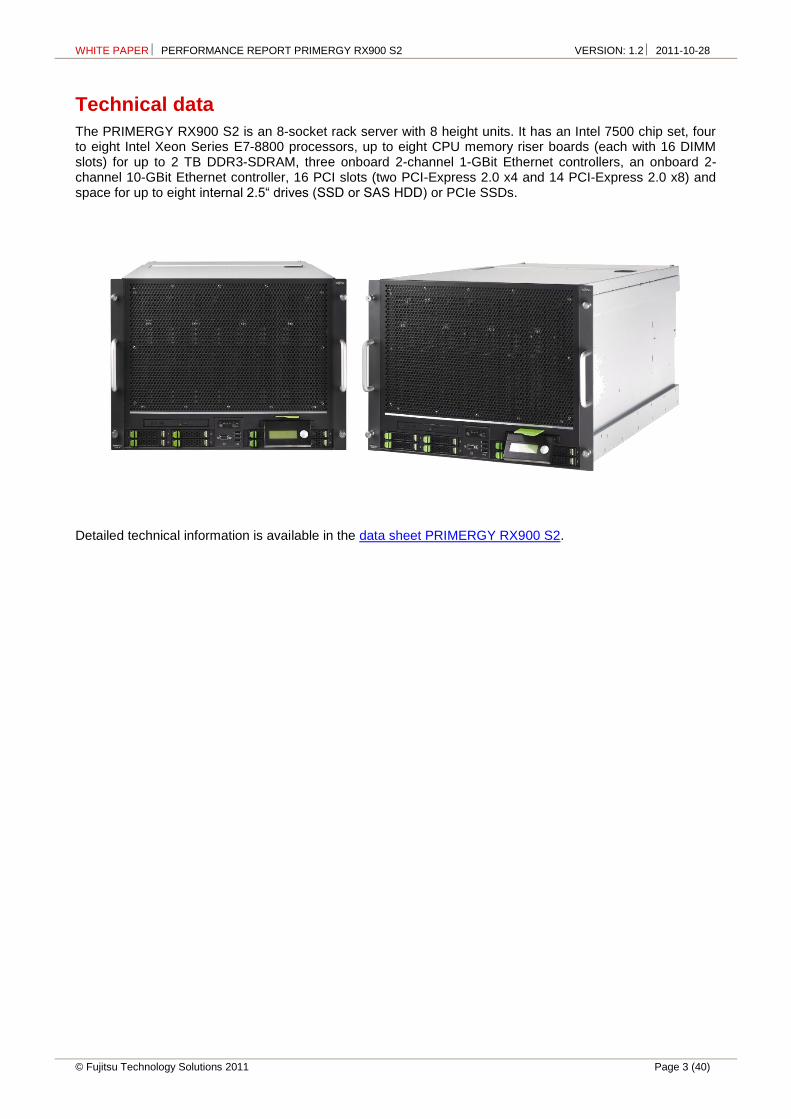
The PRIMERGY RX900 S2 is an 8-socket rack server with 8 height units. It has an Intel 7500 chip set, four to eight Intel Xeon Series E7-8800 processors, up to eight CPU memory riser boards (each with 16 DIMM slots) for up to 2 TB DDR3-SDRAM, three onboard 2-channel 1-GBit Ethernet controllers, an onboard 2-channel 10-GBit Ethernet controller, 16 PCI slots (two PCI-Express 2.0 x4 and 14 PCI-Express 2.0 x8) and space for up to eight internal 2.5“ drives (SSD or SAS HDD) or PCIe SSDs.
Detailed technical information is available in the data sheet PRIMERGY RX900 S2.
WHITE PAPER PERFORMANCE REPORT PRIMERGY RX900 S2 VERSION: 1.2 2011-10-28
Page 4 (40) © Fujitsu Technology Solutions 2011
SPECcpu2006
Benchmark description
SPECcpu2006 is a benchmark which measures the system efficiency with integer and floating-point operations. It consists of an integer test suite (SPECint2006) containing 12 applications and a floating-point test suite (SPECfp2006) containing 17 applications. Both test suites are extremely computing-intensive and concentrate on the CPU and the memory. Other components, such as Disk I/O and network, are not measured by this benchmark.
SPECcpu2006 is not tied to a special operating system. The benchmark is available as source code and is compiled before the actual measurement. The used compiler version and their optimization settings also affect the measurement result.
SPECcpu2006 contains two different performance measurement methods: the first method (SPECint2006 or SPECfp2006) determines the time which is required to process single task. The second method (SPECint_rate2006 or SPECfp_rate2006) determines the throughput, i.e. the number of tasks that can be handled in parallel. Both methods are also divided into two measurement runs, "base" and "peak" which differ in the use of compiler optimization. When publishing the results the base values are always used; the peak values are optional.
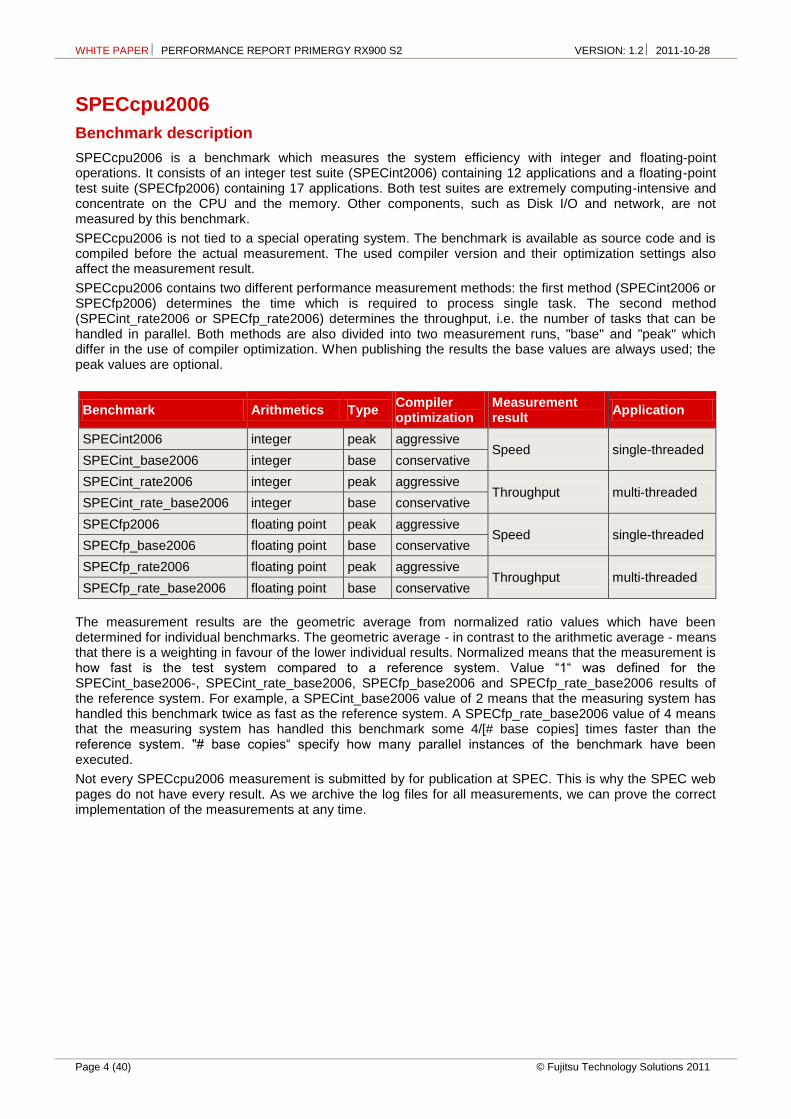
Benchmark Arithmetics Type Compiler optimization
Measurement result
Application
SPECint2006 integer peak aggressive Speed single-threaded
SPECint_base2006 integer base conservative
SPECint_rate2006 integer peak aggressive Throughput multi-threaded
SPECint_rate_base2006 integer base conservative
SPECfp2006 floating point peak aggressive Speed single-threaded
SPECfp_base2006 floating point base conservative
SPECfp_rate2006 floating point peak aggressive Throughput multi-threaded
SPECfp_rate_base2006 floating point base conservative
The measurement results are the geometric average from normalized ratio values which have been determined for individual benchmarks. The geometric average - in contrast to the arithmetic average - means that there is a weighting in favour of the lower individual results. Normalized means that the measurement is how fast is the test system compared to a reference system. Value “1“ was defined for the SPECint_base2006-, SPECint_rate_base2006, SPECfp_base2006 and SPECfp_rate_base2006 results of the reference system. For example, a SPECint_base2006 value of 2 means that the measuring system has handled this benchmark twice as fast as the reference system. A SPECfp_rate_base2006 value of 4 means that the measuring system has handled this benchmark some 4/[# base copies] times faster than the reference system. "# base copies“ specify how many parallel instances of the benchmark have been executed.
Not every SPECcpu2006 measurement is submitted by for publication at SPEC. This is why the SPEC web pages do not have every result. As we archive the log files for all measurements, we can prove the correct implementation of the measurements at any time.
WHITE PAPER PERFORMANCE REPORT PRIMERGY RX900 S2 VERSION: 1.2 2011-10-28
© Fujitsu Technology Solutions 2011 Page 5 (40)
Benchmark results
The PRIMERGY RX900 S2 was measured with Xeon series E7-8800 processors. The benchmark programs were compiled with Intel C++/Fortran Compiler 12.0 and run under SUSE Linux Enterprise Server 11 SP1 (64-bit). All results are published at http://www.spec.org.
Processor Cores GHz L3-Cache Bus TDP SPECint_rate_base2006 SPECint_rate2006
8 chips 8 chips
Xeon E7-8830 8 2.13 24 MB 1067 MHz 105 Watt 1320 1410
Xeon E7-8837 8 2.67 24 MB 1067 MHz 130 Watt 1370 1450
Xeon E7-8850 10 2 24 MB 1067 MHz 130 Watt 1520 1620
Xeon E7-8860 10 2.27 24 MB 1067 MHz 130 Watt 1640 1750
Xeon E7-8870 10 2.40 30 MB 1067 MHz 130 Watt 1770 1890
Processor Cores GHz L3-Cache Bus TDP SPECfp_rate_base2006 SPECfp_rate2006
8 chips 8 chips
Xeon E7-8830 8 2.13 24 MB 1067 MHz 105 Watt 902 953
Xeon E7-8837 8 2.67 24 MB 1067 MHz 130 Watt 981 1050
Xeon E7-8850 10 2 24 MB 1067 MHz 130 Watt 981 1030
Xeon E7-8860 10 2.27 24 MB 1067 MHz 130 Watt 1050 1110
Xeon E7-8870 10 2.40 30 MB 1067 MHz 130 Watt 1110 1190
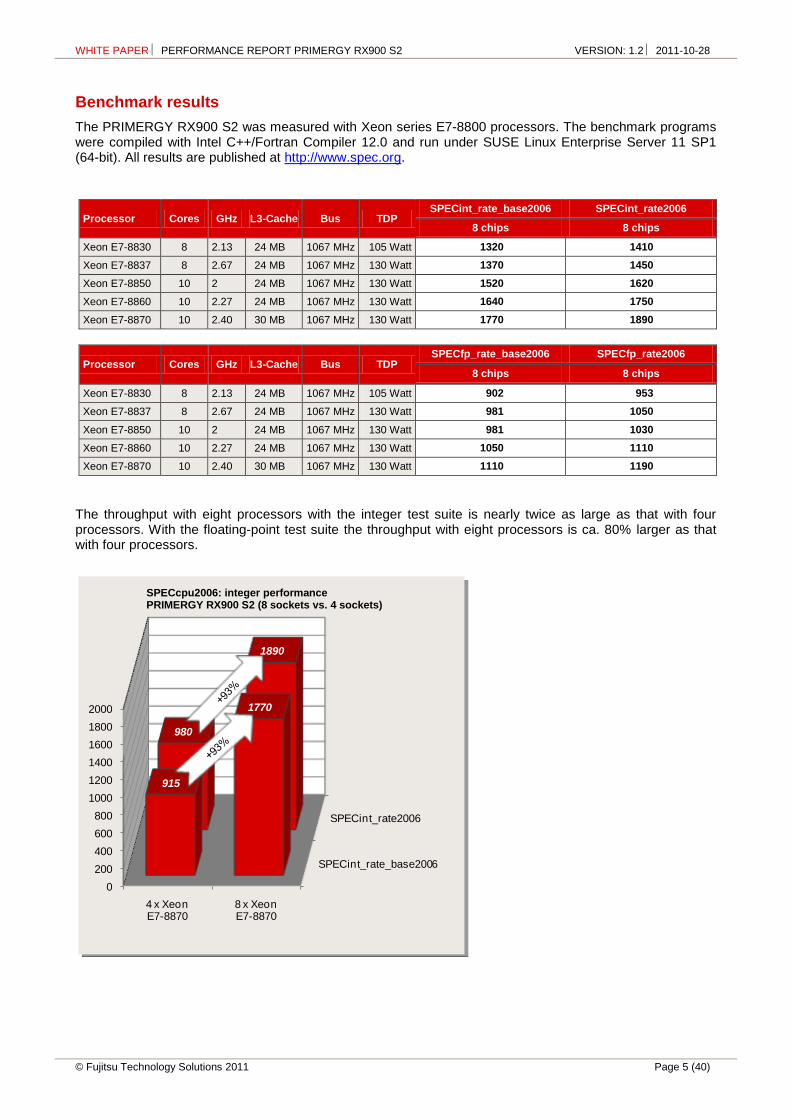
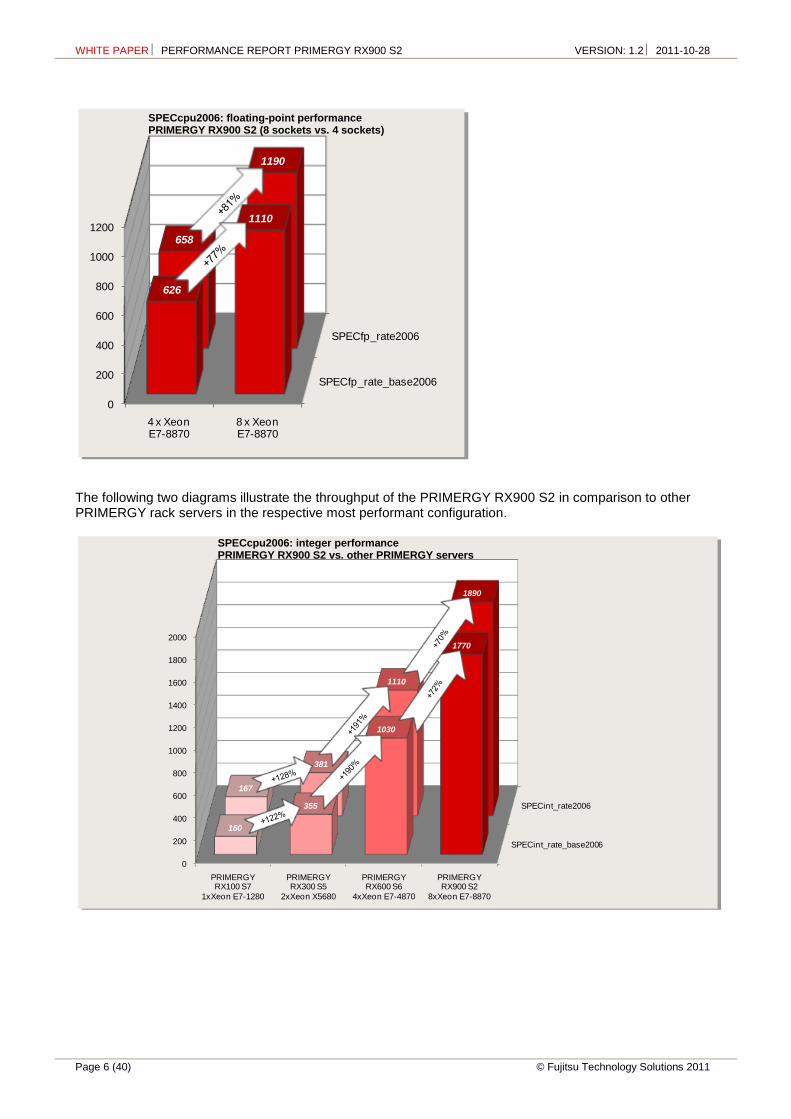
The throughput with eight processors with the integer test suite is nearly twice as large as that with four processors. With the floating-point test suite the throughput with eight processors is ca. 80% larger as that with four processors.
SPECint_rate_base2006
SPECint_rate2006
0
200
400
600
800
1000
1200
1400
1600
1800
2000
4 x Xeon E7-8870
8 x Xeon E7-8870
915
1770
980
1890
SPECcpu2006: integer performance PRIMERGY RX900 S2 (8 sockets vs. 4 sockets)
WHITE PAPER PERFORMANCE REPORT PRIMERGY RX900 S2 VERSION: 1.2 2011-10-28
Page 6 (40) © Fujitsu Technology Solutions 2011
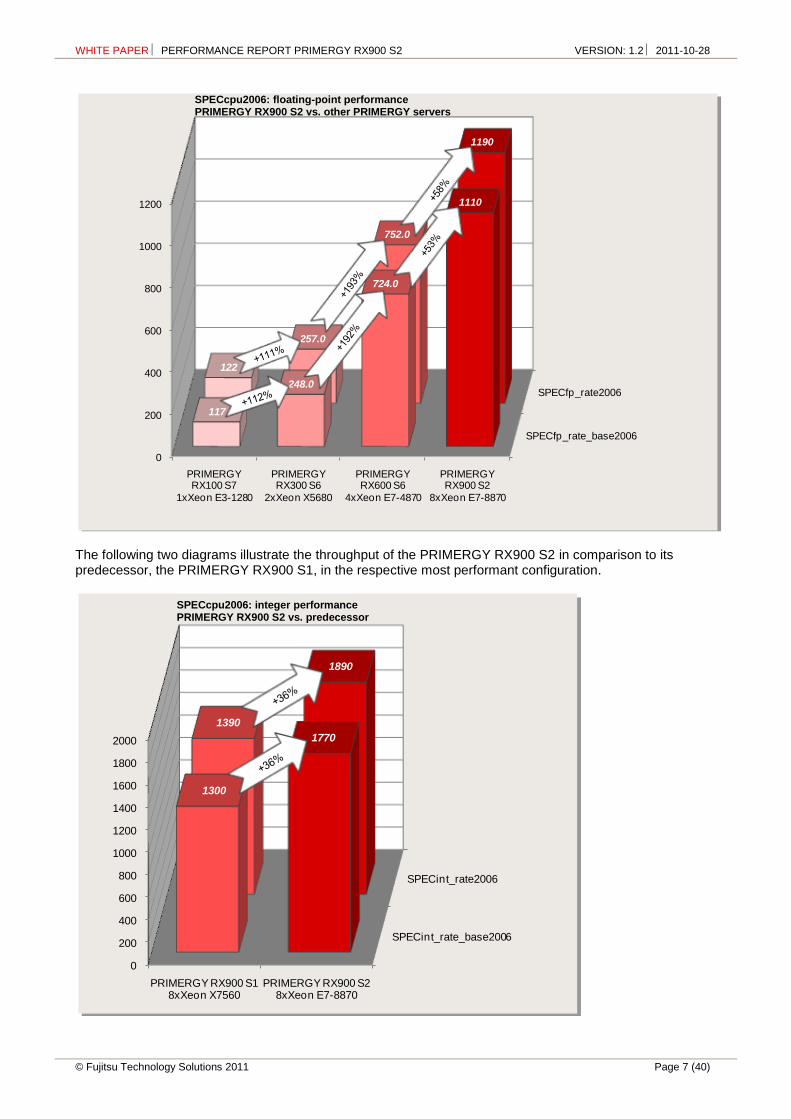
The following two diagrams illustrate the throughput of the PRIMERGY RX900 S2 in comparison to other PRIMERGY rack servers in the respective most performant configuration.
SPECfp_rate_base2006
SPECfp_rate2006
0
200
400
600
800
1000
1200
4 x Xeon E7-8870
8 x Xeon E7-8870
626
1110
658
1190
SPECint_rate_base2006
SPECint_rate2006
0
200
400
600
800
1000
1200
1400
1600
1800
2000
PRIMERGY RX100 S7
1xXeon E7-1280
PRIMERGY RX300 S5
2xXeon X5680
PRIMERGY RX600 S6
4xXeon E7-4870
PRIMERGY RX900 S2
8xXeon E7-8870
160
355
1030
1770
167
381
1110
1890
SPECcpu2006: floating-point performance PRIMERGY RX900 S2 (4 sockets vs. 2 sockets)
SPECcpu2006: integer performance PRIMERGY RX900 S2 vs. predecessor
SPECcpu2006: floating-point performance PRIMERGY RX900 S2 (8 sockets vs. 4 sockets)
SPECcpu2006: integer performance PRIMERGY RX900 S2 vs. other PRIMERGY servers
WHITE PAPER PERFORMANCE REPORT PRIMERGY RX900 S2 VERSION: 1.2 2011-10-28
© Fujitsu Technology Solutions 2011 Page 7 (40)
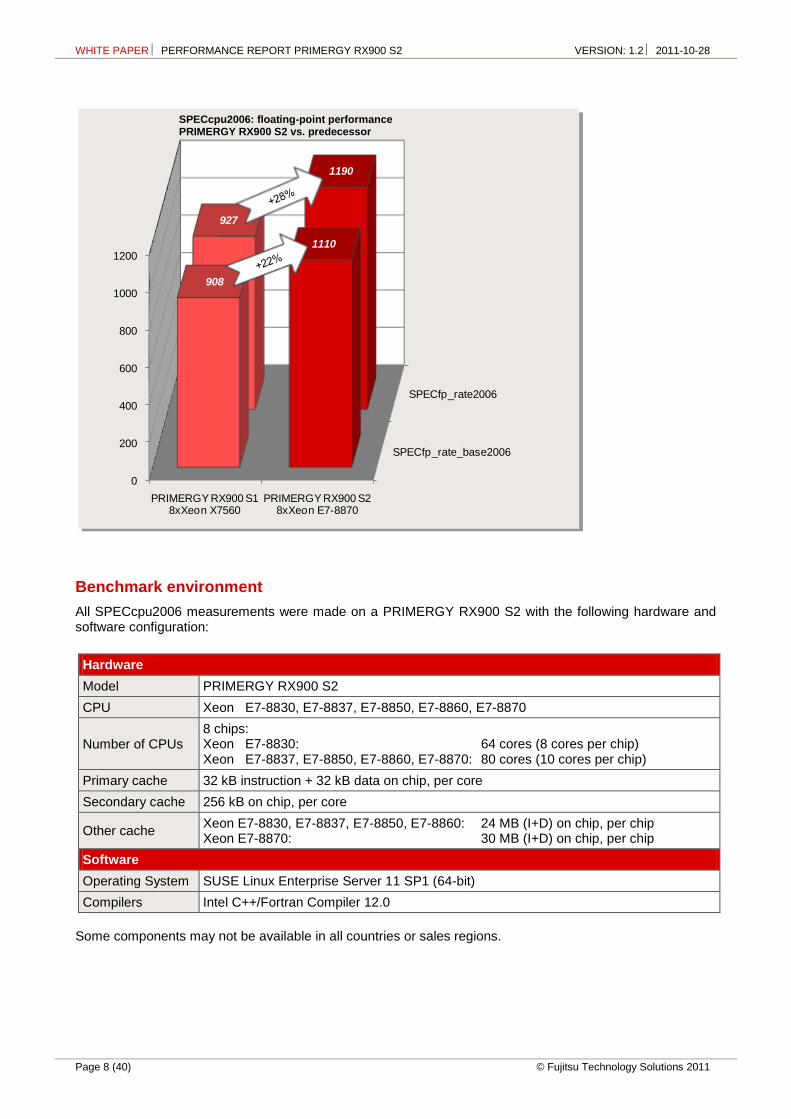
The following two diagrams illustrate the throughput of the PRIMERGY RX900 S2 in comparison to its predecessor, the PRIMERGY RX900 S1, in the respective most performant configuration.
SPECfp_rate_base2006
SPECfp_rate2006
0
200
400
600
800
1000
1200
PRIMERGY RX100 S7
1xXeon E3-1280
PRIMERGY RX300 S6
2xXeon X5680
PRIMERGY RX600 S6
4xXeon E7-4870
PRIMERGY RX900 S2
8xXeon E7-8870
117
248.0
724.0
1110
122
257.0
752.0
1190
SPECint_rate_base2006
SPECint_rate2006
0
200
400
600
800
1000
1200
1400
1600
1800
2000
PRIMERGY RX900 S18xXeon X7560
PRIMERGY RX900 S28xXeon E7-8870
1300
1770
1390
1890
SPECcpu2006: floating-point performance PRIMERGY RX900 S2 vs. other PRIMERGY servers
SPECcpu2006: integer performance PRIMERGY RX900 S2 vs. predecessor
WHITE PAPER PERFORMANCE REPORT PRIMERGY RX900 S2 VERSION: 1.2 2011-10-28
Page 8 (40) © Fujitsu Technology Solutions 2011
Benchmark environment
All SPECcpu2006 measurements were made on a PRIMERGY RX900 S2 with the following hardware and software configuration:
Hardware
Model PRIMERGY RX900 S2
CPU Xeon E7-8830, E7-8837, E7-8850, E7-8860, E7-8870
Number of CPUs 8 chips: Xeon E7-8830: 64 cores (8 cores per chip) Xeon E7-8837, E7-8850, E7-8860, E7-8870: 80 cores (10 cores per chip)
Primary cache 32 kB instruction + 32 kB data on chip, per core
Secondary cache 256 kB on chip, per core
Other cache Xeon E7-8830, E7-8837, E7-8850, E7-8860: 24 MB (I+D) on chip, per chip Xeon E7-8870: 30 MB (I+D) on chip, per chip
Software
Operating System SUSE Linux Enterprise Server 11 SP1 (64-bit)
Compilers Intel C++/Fortran Compiler 12.0
Some components may not be available in all countries or sales regions.
SPECfp_rate_base2006
SPECfp_rate2006
0
200
400
600
800
1000
1200
PRIMERGY RX900 S18xXeon X7560
PRIMERGY RX900 S28xXeon E7-8870
908
1110
927
1190
SPECcpu2006: floating-point performance PRIMERGY RX900 S2 vs. predecessor
SPECcpu2006: floating-point performance PRIMERGY RX900 S2 vs. predecessor
WHITE PAPER PERFORMANCE REPORT PRIMERGY RX900 S2 VERSION: 1.2 2011-10-28
© Fujitsu Technology Solutions 2011 Page 9 (40)
SPECjbb2005
Benchmark description
SPECjbb2005 is a Java business benchmark that focuses on the performance of Java Server platforms. SPECjbb2005 is essentially a modernized SPECjbb2000. The main differences are:
The transactions have become more complex in order to cover a greater functional scope. The working set of the benchmark has been enlarged to the extent that the total system load has
increased. SPECjbb2000 allows only one active Java Virtual Machine instance (JVM) whereas SPECjbb2005
permits several instances, which in turn achieves greater closeness to reality, particularly with large systems.
On the software side SPECjbb2005 primarily measures the performance of the JVM used with its just-in-time compiler as well as their thread and garbage collection implementation. Some aspects of the operating system used also play a role. As far as hardware is concerned, it measures the efficiency of the CPUs and caches, the memory subsystem and the scalability of shared memory systems (SMP). Disk and network I/O are irrelevant.
SPECjbb2005 emulates a 3-tier client/server system that is typical for modern business process applications with the emphasis on the middle-tier system:
Clients generate the load, consisting of driver threads, which on the basis of TPC-C benchmark generate OLTP accesses to a database without thinking times.
The middle tier system implements the business processes and the updating of the database. The database takes on the data management and is emulated by Java objects that are in the
memory. Transaction logging is implemented on an XML basis.
The major advantage of this benchmark is that it includes all three tiers that run together on a single host. The performance of the middle-tier is measured. Large-scale hardware installations are thus avoided and direct comparisons between the SPECjbb2005 results from the various systems are possible. Client and database emulation are also written in Java.
SPECjbb2005 only needs the operating system as well as a Java Virtual Machine with J2SE 5.0 features.
The scaling unit is a warehouse with approx. 25 MB Java objects. Precisely one Java thread per warehouse executes the operations on these objects. The business operations are assumed by TPC-C:
New Order Entry Payment Order Status Inquiry Delivery Stock Level Supervision Customer Report
However, these are the only features SPECjbb2005 and TPC-C have in common. The results of the two benchmarks are not comparable.
SPECjbb2005 has 2 performance metrics:
bops (business operations per second) is the overall rate of all business operations performed per second.
bops/JVM is the ratio of the first metrics and the number of active JVM instances.
In comparisons of various SPECjbb2005 results, both metrics must be specified.
The following rules, according to which a compliant benchmark run has to be performed, are the basis for these three metrics:
A compliant benchmark run consists of a sequence of measuring points with an increasing number of warehouses (and thus of threads) with the number in each case being increased by one warehouse. The run is started at one warehouse up through 2*MaxWh, but not less than 8 warehouses. MaxWh is the number of warehouses with the highest rate per second the benchmark expects. Per default the benchmark equates MaxWh with the number of CPUs visible by the operating system.
The metric bops is the arithmetic average of all measured operation rates with MaxWh warehouses up to 2*MaxWh warehouses.
WHITE PAPER PERFORMANCE REPORT PRIMERGY RX900 S2 VERSION: 1.2 2011-10-28
Page 10 (40) © Fujitsu Technology Solutions 2011
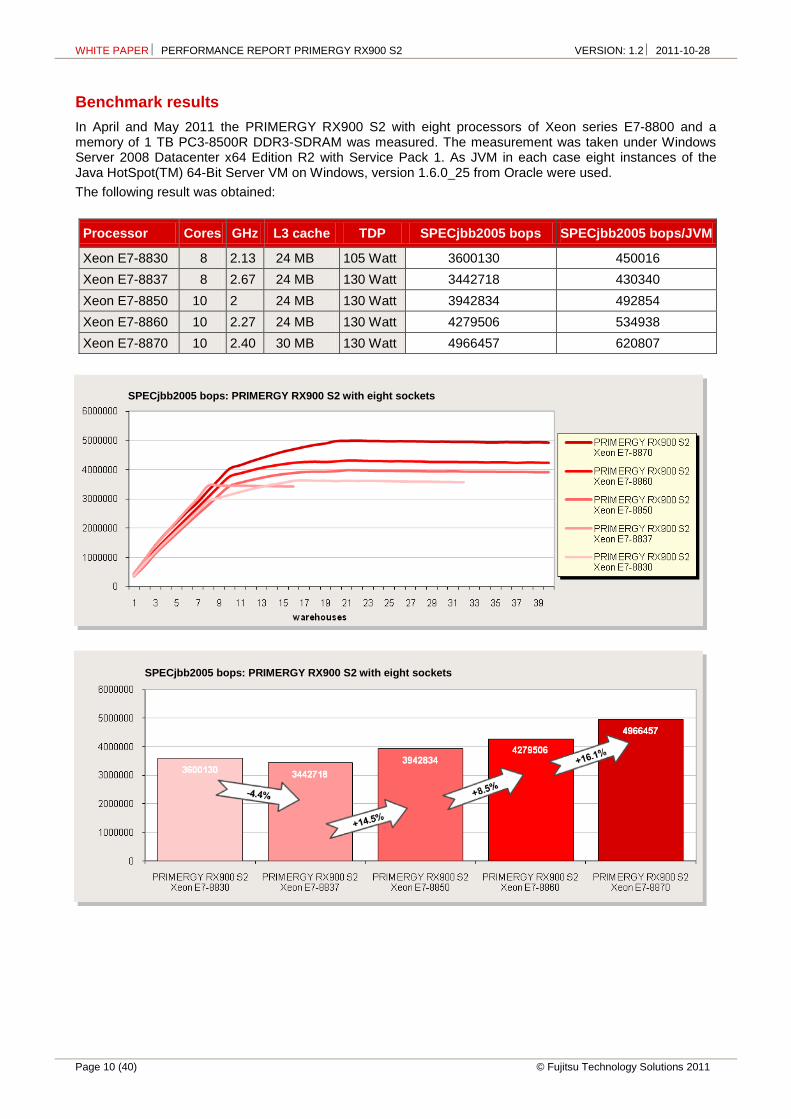
Benchmark results
In April and May 2011 the PRIMERGY RX900 S2 with eight processors of Xeon series E7-8800 and a memory of 1 TB PC3-8500R DDR3-SDRAM was measured. The measurement was taken under Windows Server 2008 Datacenter x64 Edition R2 with Service Pack 1. As JVM in each case eight instances of the Java HotSpot(TM) 64-Bit Server VM on Windows, version 1.6.0_25 from Oracle were used.
The following result was obtained:
Processor Cores GHz L3 cache TDP SPECjbb2005 bops SPECjbb2005 bops/JVM
Xeon E7-8830 8 2.13 24 MB 105 Watt 3600130 450016
Xeon E7-8837 8 2.67 24 MB 130 Watt 3442718 430340
Xeon E7-8850 10 2 24 MB 130 Watt 3942834 492854
Xeon E7-8860 10 2.27 24 MB 130 Watt 4279506 534938
Xeon E7-8870 10 2.40 30 MB 130 Watt 4966457 620807
SPECjbb2005 bops: PRIMERGY RX900 S2 with eight sockets
SPECjbb2005 bops: PRIMERGY RX900 S2 with eight sockets

WHITE PAPER PERFORMANCE REPORT PRIMERGY RX900 S2 VERSION: 1.2 2011-10-28
© Fujitsu Technology Solutions 2011 Page 11 (40)
The following graphics illustrate the throughput of the PRIMERGY RX900 S2 in comparison to its predecessor PRIMERGY RX900 S1, in the respective most performant configuration.
Benchmark environment
The SPECjbb2005 measurements were run on a PRIMERGY RX900 S2 with the following hardware and software configuration:
Hardware
Model PRIMERGY RX900 S2
Processor Xeon E7-8830, E7-8837, E7-8850, E7-8860 and E7-8870
Number of chips Xeon E7-8830: 8 chips, 64 cores, 8 cores per chip, 2 threads per core Xeon E7-8837: 8 chips, 64 cores, 8 cores per chip, 1 thread per core all others: 8 chips, 80 cores, 10 cores per chip, 2 threads per core
Primary Cache 32 KB instruction + 32 KB data on chip, per core
Secondary Cache 256 KB (I+D) on chip, per core
Tertiary Cache Xeon E7-8830, E7-8837, E7-8850, E7-8860: 24 MB (I+D) on chip, per chip Xeon E7-8870: 30 MB (I+D) on chip, per chip
Memory 128 x 8 GB PC3-8500R DDR3-SDRAM
Software
Operating System Windows Server 2008 R2 Datacenter + SP1
JVM Version Oracle Java HotSpot(TM) 64-Bit Server VM on Windows, version 1.6.0_25
Some components may not be available in all countries or sales regions.
SPECjbb2005 bops: PRIMERGY RX900 S2 vs. predecessor
SPECjbb2005 bops: PRIMERGY RX900 S2 vs. predecessor
WHITE PAPER PERFORMANCE REPORT PRIMERGY RX900 S2 VERSION: 1.2 2011-10-28
Page 12 (40) © Fujitsu Technology Solutions 2011
OLTP-2
Benchmark description
OLTP stands for Online Transaction Processing. The OLTP-2 benchmark is based on the typical application scenario of a database solution. In OLTP-2 database access is simulated and the number of transactions achieved per second (tps) determined as the unit of measurement for the system.
In contrast to benchmarks such as SPECint and TPC-E, which were standardized by independent bodies and for which adherence to the respective rules and regulations are monitored, OLTP-2 is an internal benchmark of Fujitsu. OLTP-2 is based on the well-known database benchmark TPC-E. OLTP-2 was designed in such a way that a wide range of configurations can be measured to present the scaling of a system with regard to the CPU and memory configuration.
Even if the two benchmarks OLTP-2 and TPC-E simulate similar application scenarios using the same load profiles, the results cannot be compared or even treated as equal, as the two benchmarks use different methods to simulate user load. OLTP-2 values are typically similar to TPC-E values. A direct comparison, or even referring to the OLTP-2 result as TPC-E, is not permitted, especially because there is no price-performance calculation.
Further information can be found in the document Benchmark Overview OLTP-2.
Benchmark results
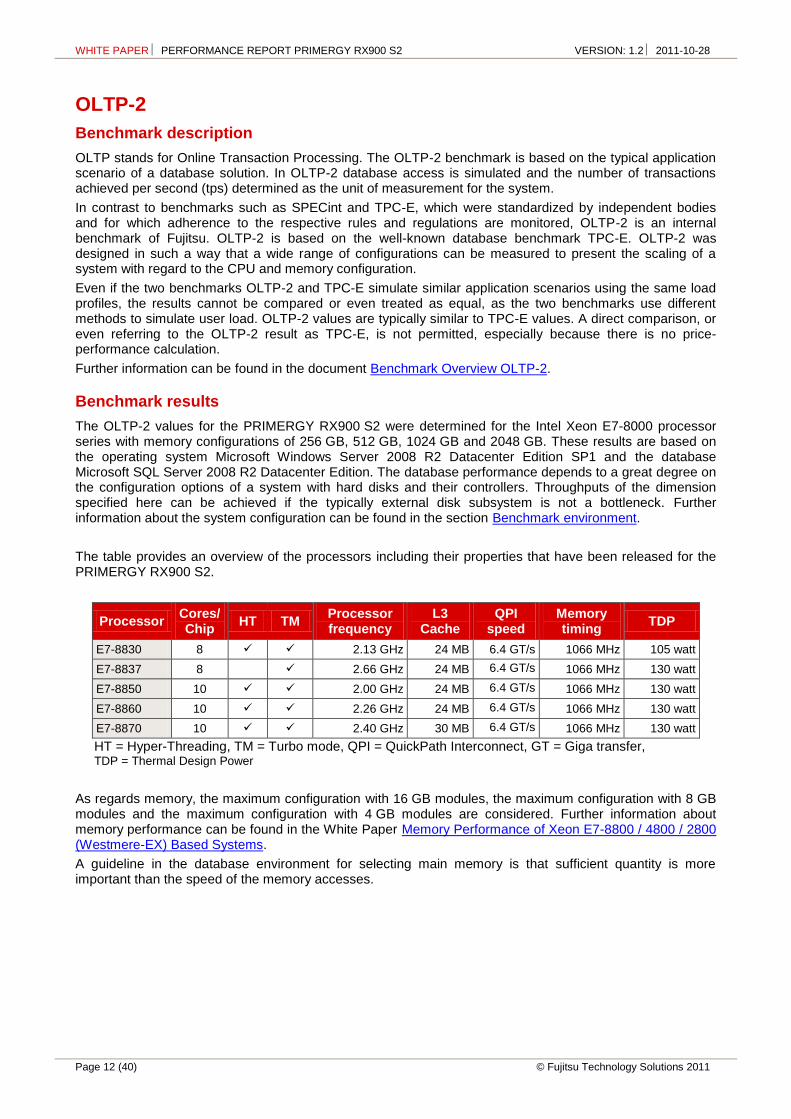
The OLTP-2 values for the PRIMERGY RX900 S2 were determined for the Intel Xeon E7-8000 processor series with memory configurations of 256 GB, 512 GB, 1024 GB and 2048 GB. These results are based on the operating system Microsoft Windows Server 2008 R2 Datacenter Edition SP1 and the database Microsoft SQL Server 2008 R2 Datacenter Edition. The database performance depends to a great degree on the configuration options of a system with hard disks and their controllers. Throughputs of the dimension specified here can be achieved if the typically external disk subsystem is not a bottleneck. Further information about the system configuration can be found in the section Benchmark environment.
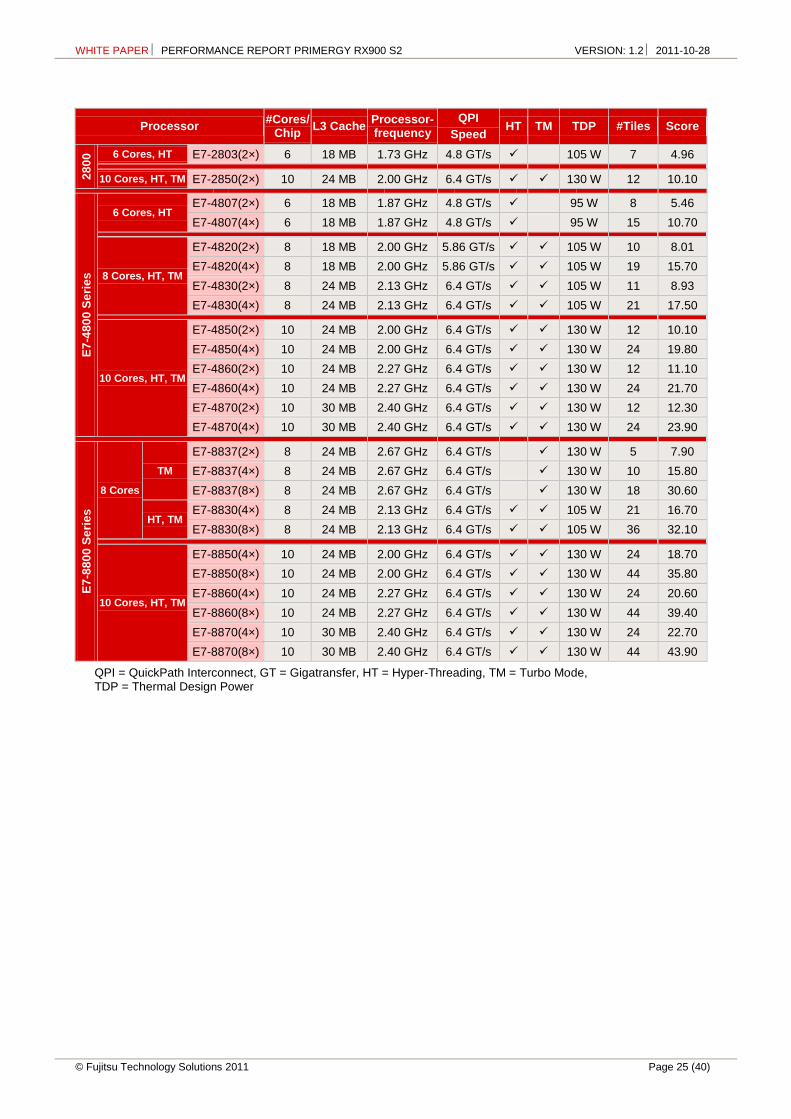
The table provides an overview of the processors including their properties that have been released for the PRIMERGY RX900 S2.
Processor Cores/ Chip
HT TM Processor frequency
L3 Cache
QPI speed
Memory timing
TDP
E7-8830 8 2.13 GHz 24 MB 6.4 GT/s 1066 MHz 105 watt
E7-8837 8 2.66 GHz 24 MB 6.4 GT/s 1066 MHz 130 watt
E7-8850 10 2.00 GHz 24 MB 6.4 GT/s 1066 MHz 130 watt
E7-8860 10 2.26 GHz 24 MB 6.4 GT/s 1066 MHz 130 watt
E7-8870 10 2.40 GHz 30 MB 6.4 GT/s 1066 MHz 130 watt
HT = Hyper-Threading, TM = Turbo mode, QPI = QuickPath Interconnect, GT = Giga transfer, TDP = Thermal Design Power
As regards memory, the maximum configuration with 16 GB modules, the maximum configuration with 8 GB modules and the maximum configuration with 4 GB modules are considered. Further information about memory performance can be found in the White Paper Memory Performance of Xeon E7-8800 / 4800 / 2800 (Westmere-EX) Based Systems.
A guideline in the database environment for selecting main memory is that sufficient quantity is more important than the speed of the memory accesses.
WHITE PAPER PERFORMANCE REPORT PRIMERGY RX900 S2 VERSION: 1.2 2011-10-28
© Fujitsu Technology Solutions 2011 Page 13 (40)
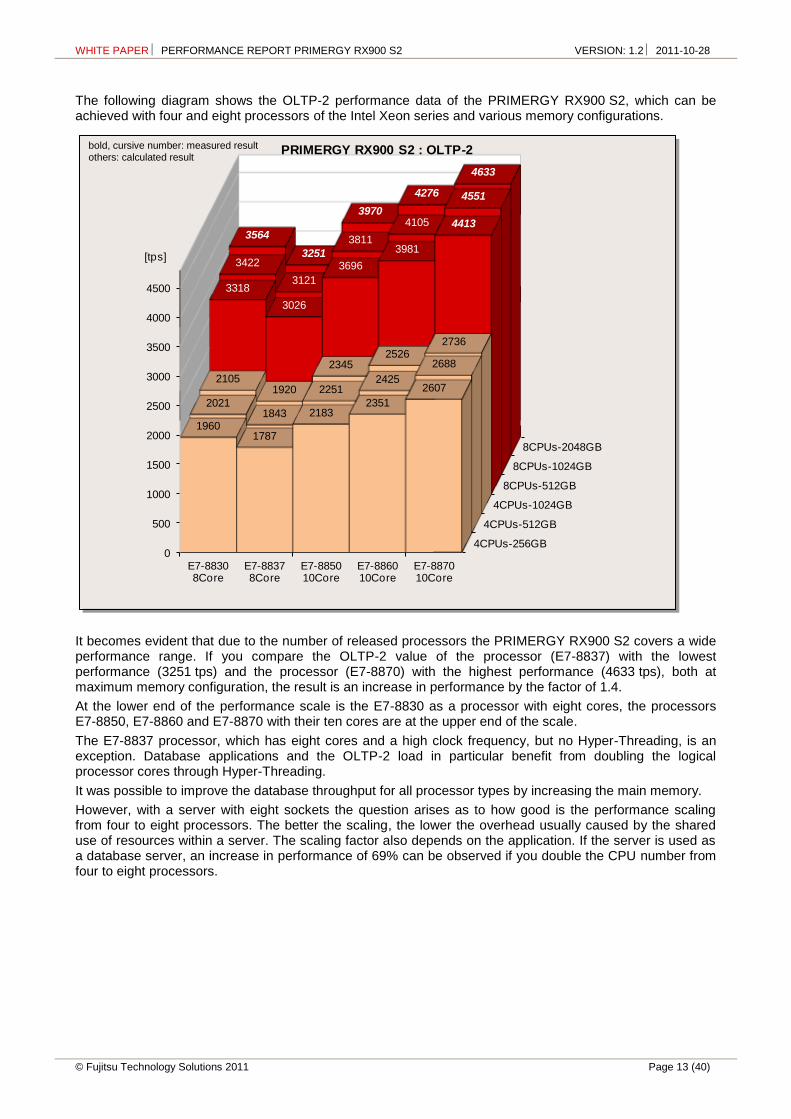
The following diagram shows the OLTP-2 performance data of the PRIMERGY RX900 S2, which can be achieved with four and eight processors of the Intel Xeon series and various memory configurations.
It becomes evident that due to the number of released processors the PRIMERGY RX900 S2 covers a wide performance range. If you compare the OLTP-2 value of the processor (E7-8837) with the lowest performance (3251 tps) and the processor (E7-8870) with the highest performance (4633 tps), both at maximum memory configuration, the result is an increase in performance by the factor of 1.4.
At the lower end of the performance scale is the E7-8830 as a processor with eight cores, the processors E7-8850, E7-8860 and E7-8870 with their ten cores are at the upper end of the scale.
The E7-8837 processor, which has eight cores and a high clock frequency, but no Hyper-Threading, is an exception. Database applications and the OLTP-2 load in particular benefit from doubling the logical processor cores through Hyper-Threading.
It was possible to improve the database throughput for all processor types by increasing the main memory.
However, with a server with eight sockets the question arises as to how good is the performance scaling from four to eight processors. The better the scaling, the lower the overhead usually caused by the shared use of resources within a server. The scaling factor also depends on the application. If the server is used as a database server, an increase in performance of 69% can be observed if you double the CPU number from four to eight processors.
4CPUs-256GB
4CPUs-512GB
4CPUs-1024GB
8CPUs-512GB
8CPUs-1024GB
8CPUs-2048GB
0
500
1000
1500
2000
2500
3000
3500
4000
4500
E7-88308Core
E7-88378Core
E7-885010Core
E7-886010Core
E7-887010Core
19601787
21832351
2607
20211843
22512425
2688
21051920
23452526
2736
3318
3026
3696
3981
4413
3422
3121
3811
4105
4551
3564
3251
3970
4276
4633
[tps]
PRIMERGY RX900 S2 : OLTP-2bold, cursive number: measured result
others: calculated result

WHITE PAPER PERFORMANCE REPORT PRIMERGY RX900 S2 VERSION: 1.2 2011-10-28
Page 14 (40) © Fujitsu Technology Solutions 2011
Benchmark environment
A typical OLTP-2 benchmark environment is shown symbolically in the following diagram:
Database Server (Tier B)
Hardware
System PRIMERGY RX900 S2
Processor 4 × Xeon E7-8830 (8C, 2.13 GHz) 4 × Xeon E7-8837 (8C, 2.66 GHz) 4 × Xeon E7-8850 (10C, 2.00 GHz) 4 × Xeon E7-8860 (10C, 2.26 GHz) 4 × Xeon E7-8870 (10C, 2.40 GHz)
8 × Xeon E7-8830 (8C, 2.13 GHz) 8 × Xeon E7-8837 (8C, 2.66 GHz) 8 × Xeon E7-8850 (10C, 2.00 GHz) 8 × Xeon E7-8860 (10C, 2.26 GHz) 8 × Xeon E7-8870 (10C, 2.40 GHz)
Memory 256 GB – 2048 GB, 1066 MHz registered ECC DDR3 (16 GB DIMMs), or 1066 MHz registered ECC DDR3 (8 GB DIMMs), or 1066 MHz registered ECC DDR3 (4 GB DIMMs)
BIOS Version: 00.21, Settings (default): Turbo Mode enabled, NUMA Support enabled, Hyper-Threading enabled
Network interface 6 × onboard LAN 1 Gb/s
Disk subsystem RX900 S2: Onboard RAID Ctrl SAS 6G 5/6 512MB
2 × 146 GB 10k rpm SAS Drive, RAID1 (OS)
6 × 450 GB 10k rpm SAS Drive, RAID10 (LOG)
16 × LSI MegaRAID SAS 9280-8e
16 × JX40: 24 × 64 GB SSD Drive each, RAID5 (data)
Software
Operating system Windows Server 2008 R2 Datacenter SP1
Database SQL Server 2008 R2 Datacenter
Application Server (Tier A)
Hardware
System 2 × PRIMERGY RX200 S6
Processor 2 × Xeon E5647 (4C, 2.93 GHz)
Memory 12 GB, 1333 MHz registered ECC DDR3
Network interface 2 × onboard LAN 1 Gb/s, 2 × Dual Port LAN 1 Gb/s
Disk subsystem 1 × 73 GB 15k rpm SAS Drive
Software
Operating system Windows Server 2008 R2 Standard
Application Server
Tier A Tier B
Network
Network
Clients
Database Server
Storage Subsystem
System under Test (SUT)
Driver
WHITE PAPER PERFORMANCE REPORT PRIMERGY RX900 S2 VERSION: 1.2 2011-10-28
© Fujitsu Technology Solutions 2011 Page 15 (40)
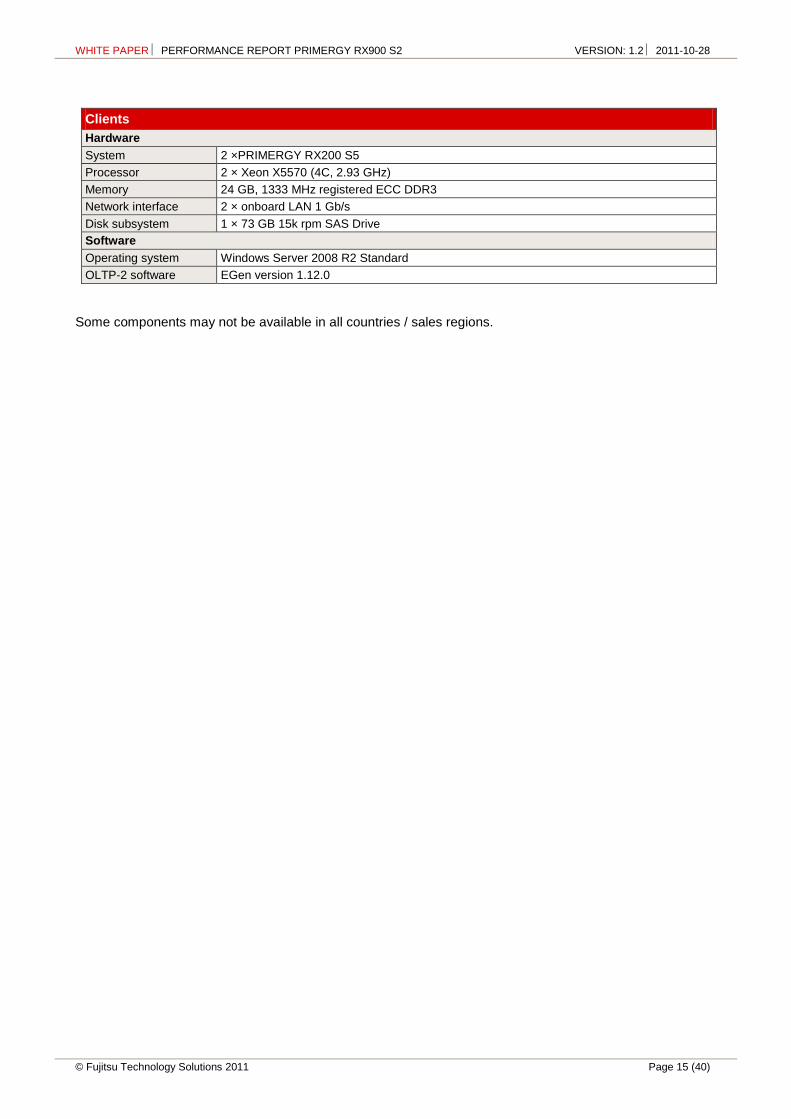
Clients
Hardware
System 2 ×PRIMERGY RX200 S5
Processor 2 × Xeon X5570 (4C, 2.93 GHz)
Memory 24 GB, 1333 MHz registered ECC DDR3
Network interface 2 × onboard LAN 1 Gb/s
Disk subsystem 1 × 73 GB 15k rpm SAS Drive
Software
Operating system Windows Server 2008 R2 Standard
OLTP-2 software EGen version 1.12.0
Some components may not be available in all countries / sales regions.
WHITE PAPER PERFORMANCE REPORT PRIMERGY RX900 S2 VERSION: 1.2 2011-10-28
Page 16 (40) © Fujitsu Technology Solutions 2011
TPC-E with TPC-Energy
Benchmark description
The TPC-E benchmark measures the performance of online transaction processing systems (OLTP) and is based on a complex database and a number of different transaction types that are carried out on it. TPC-E is not only a hardware-independent but also a software-independent benchmark and can thus be run on every test platform, i.e. proprietary or open. In addition to the results of the measurement, all the details of the systems measured and the measuring method must also be explained in a measurement report (Full Disclosure Report or FDR). Consequently, this ensures that the measurement meets all benchmark requirements and is reproducible. TPC-E does not just measure an individual server, but a rather extensive system configuration. Keys to performance in this respect are the database server, disk I/O and network communication.
The performance metric is tpsE, where tps means transactions per second. tpsE is the average number of Trade-Result-Transactions that are performed within a second. The TPC-E standard defines a result as the tpsE rate, the price per performance value (e.g. $/tpsE) and the availability date of the measured configuration.
TPC-Energy is an augmentation to the existing TPC benchmarks (e.g. TPC-C, TPC-E, TPC-H). Energy consumption of the systems is measured while the TPC benchmark is performed. For this TPC has defined a set of rules on how to measure these values. As the result of this benchmark a metric in the form of "Energy / Performance" is calculated from the measured values. The result for TPC-E is the metric Watts/tpsE.
Further information about TPC-E and TPC-Energy can be found in the overview document Benchmark Overview TPC-E.
Benchmark results
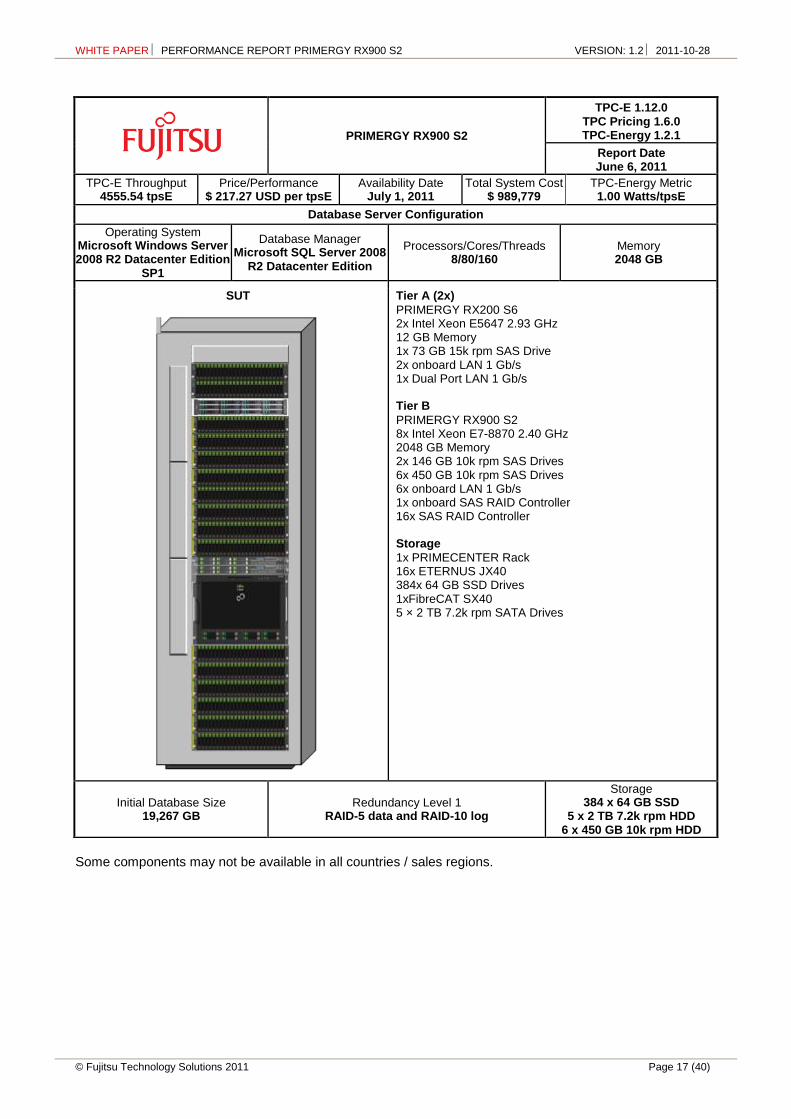
In June 2011 Fujitsu submitted a TPC-E benchmark result for the PRIMERGY RX900 S2 with the 10-core processor Intel Xeon E7-8870 and 2048 GB memory. This publication also revealed TPC-Energy values for the PRIMERGY RX900 S2.
The results show an increase in performance compared with the PRIMERGY RX900 S1 with a simultaneous reduction in costs and, in comparison with the competitors, lower energy consumption.
WHITE PAPER PERFORMANCE REPORT PRIMERGY RX900 S2 VERSION: 1.2 2011-10-28
© Fujitsu Technology Solutions 2011 Page 17 (40)
Some components may not be available in all countries / sales regions.
PRIMERGY RX900 S2
TPC-E 1.12.0 TPC Pricing 1.6.0 TPC-Energy 1.2.1
Report Date June 6, 2011
TPC-E Throughput 4555.54 tpsE
Price/Performance $ 217.27 USD per tpsE
Availability Date July 1, 2011
Total System Cost $ 989,779
TPC-Energy Metric 1.00 Watts/tpsE
Database Server Configuration
Operating System Microsoft Windows Server 2008 R2 Datacenter Edition
SP1
Database Manager Microsoft SQL Server 2008
R2 Datacenter Edition
Processors/Cores/Threads 8/80/160
Memory 2048 GB
SUT
Tier A (2x)
PRIMERGY RX200 S6 2x Intel Xeon E5647 2.93 GHz 12 GB Memory 1x 73 GB 15k rpm SAS Drive 2x onboard LAN 1 Gb/s 1x Dual Port LAN 1 Gb/s Tier B
PRIMERGY RX900 S2 8x Intel Xeon E7-8870 2.40 GHz 2048 GB Memory 2x 146 GB 10k rpm SAS Drives 6x 450 GB 10k rpm SAS Drives 6x onboard LAN 1 Gb/s 1x onboard SAS RAID Controller 16x SAS RAID Controller Storage
1x PRIMECENTER Rack 16x ETERNUS JX40 384x 64 GB SSD Drives 1xFibreCAT SX40 5 × 2 TB 7.2k rpm SATA Drives
Initial Database Size 19,267 GB
Redundancy Level 1 RAID-5 data and RAID-10 log
Storage 384 x 64 GB SSD
5 x 2 TB 7.2k rpm HDD 6 x 450 GB 10k rpm HDD
WHITE PAPER PERFORMANCE REPORT PRIMERGY RX900 S2 VERSION: 1.2 2011-10-28
Page 18 (40) © Fujitsu Technology Solutions 2011
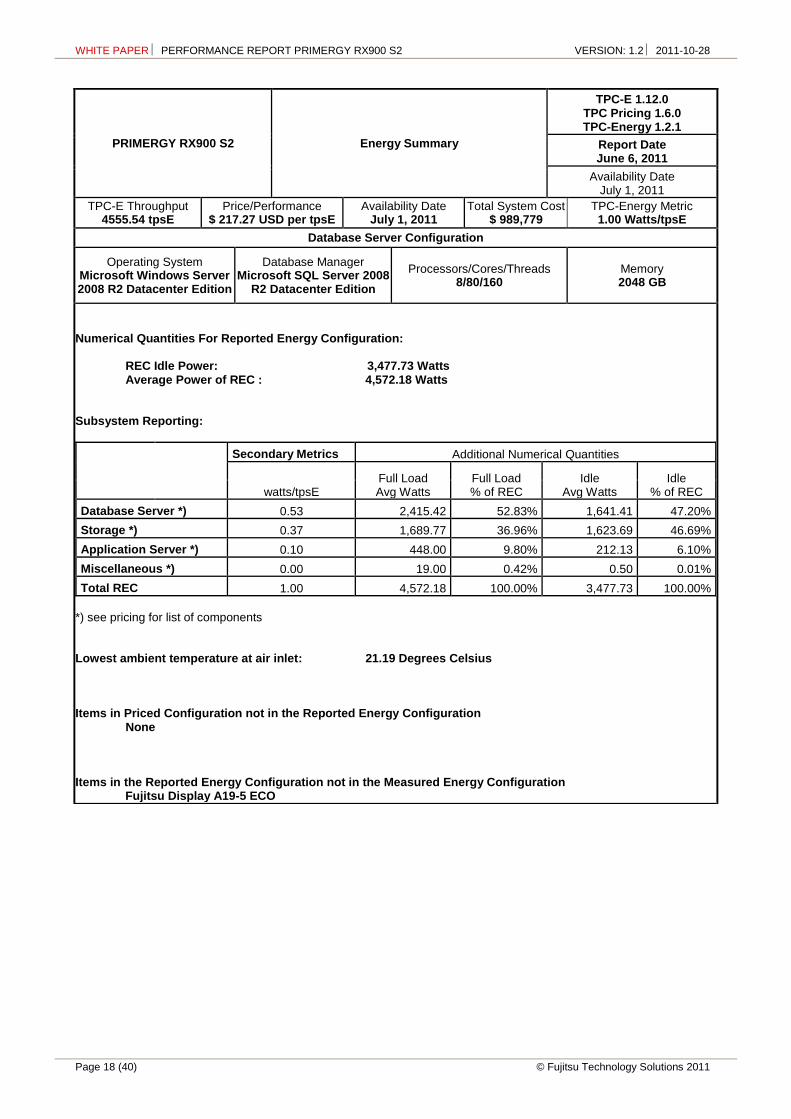
PRIMERGY RX900 S2 Energy Summary
TPC-E 1.12.0 TPC Pricing 1.6.0 TPC-Energy 1.2.1
Report Date June 6, 2011
Availability Date July 1, 2011
TPC-E Throughput 4555.54 tpsE
Price/Performance $ 217.27 USD per tpsE
Availability Date July 1, 2011
Total System Cost $ 989,779
TPC-Energy Metric 1.00 Watts/tpsE
Database Server Configuration
Operating System Microsoft Windows Server 2008 R2 Datacenter Edition
Database Manager Microsoft SQL Server 2008
R2 Datacenter Edition
Processors/Cores/Threads 8/80/160
Memory 2048 GB
Numerical Quantities For Reported Energy Configuration: REC Idle Power: 3,477.73 Watts Average Power of REC : 4,572.18 Watts Subsystem Reporting:
Secondary Metrics Additional Numerical Quantities
watts/tpsE Full Load Avg Watts
Full Load % of REC
Idle Avg Watts
Idle % of REC
Database Server *) 0.53 2,415.42 52.83% 1,641.41 47.20%
Storage *) 0.37 1,689.77 36.96% 1,623.69 46.69%
Application Server *) 0.10 448.00 9.80% 212.13 6.10%
Miscellaneous *) 0.00 19.00 0.42% 0.50 0.01%
Total REC 1.00 4,572.18 100.00% 3,477.73 100.00%
*) see pricing for list of components Lowest ambient temperature at air inlet: 21.19 Degrees Celsius Items in Priced Configuration not in the Reported Energy Configuration None Items in the Reported Energy Configuration not in the Measured Energy Configuration Fujitsu Display A19-5 ECO
WHITE PAPER PERFORMANCE REPORT PRIMERGY RX900 S2 VERSION: 1.2 2011-10-28
© Fujitsu Technology Solutions 2011 Page 19 (40)
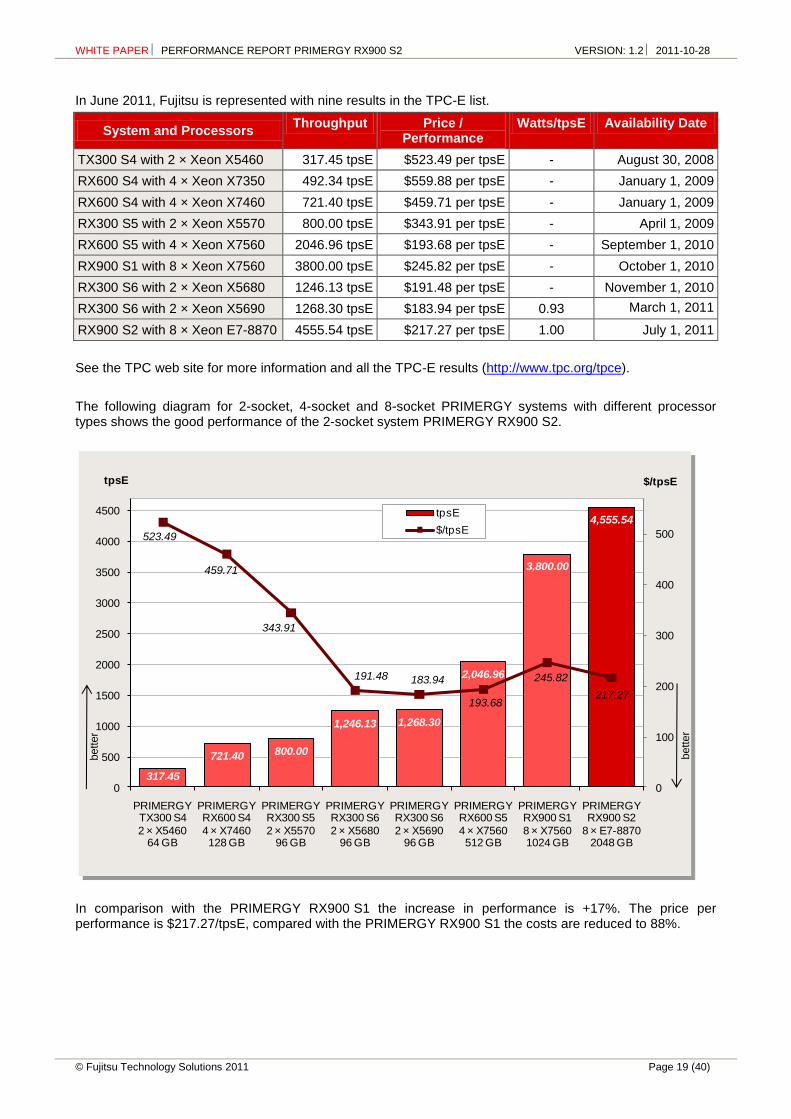
In June 2011, Fujitsu is represented with nine results in the TPC-E list.
System and Processors Throughput Price /
Performance Watts/tpsE Availability Date
TX300 S4 with 2 × Xeon X5460 317.45 tpsE $523.49 per tpsE - August 30, 2008
RX600 S4 with 4 × Xeon X7350 492.34 tpsE $559.88 per tpsE - January 1, 2009
RX600 S4 with 4 × Xeon X7460 721.40 tpsE $459.71 per tpsE - January 1, 2009
RX300 S5 with 2 × Xeon X5570 800.00 tpsE $343.91 per tpsE - April 1, 2009
RX600 S5 with 4 × Xeon X7560 2046.96 tpsE $193.68 per tpsE - September 1, 2010
RX900 S1 with 8 × Xeon X7560 3800.00 tpsE $245.82 per tpsE - October 1, 2010
RX300 S6 with 2 × Xeon X5680 1246.13 tpsE $191.48 per tpsE - November 1, 2010
RX300 S6 with 2 × Xeon X5690 1268.30 tpsE $183.94 per tpsE 0.93 March 1, 2011
RX900 S2 with 8 × Xeon E7-8870 4555.54 tpsE $217.27 per tpsE 1.00 July 1, 2011
See the TPC web site for more information and all the TPC-E results (http://www.tpc.org/tpce).
The following diagram for 2-socket, 4-socket and 8-socket PRIMERGY systems with different processor types shows the good performance of the 2-socket system PRIMERGY RX900 S2.
In comparison with the PRIMERGY RX900 S1 the increase in performance is +17%. The price per performance is $217.27/tpsE, compared with the PRIMERGY RX900 S1 the costs are reduced to 88%.
317.45
721.40 800.00
1,246.13 1,268.30
2,046.96
3,800.00
4,555.54
523.49
459.71
343.91
191.48 183.94
193.68
245.82
217.27
0
100
200
300
400
500
0
500
1000
1500
2000
2500
3000
3500
4000
4500
PRIMERGYTX300 S4
2 × X546064 GB
PRIMERGYRX600 S4
4 × X7460128 GB
PRIMERGYRX300 S5
2 × X557096 GB
PRIMERGYRX300 S6
2 × X568096 GB
PRIMERGYRX300 S6
2 × X569096 GB
PRIMERGYRX600 S5
4 × X7560512 GB
PRIMERGYRX900 S1
8 × X75601024 GB
PRIMERGYRX900 S2
8 × E7-88702048 GB
$/tpsEtpsE
tpsE
$/tpsE
better
better
WHITE PAPER PERFORMANCE REPORT PRIMERGY RX900 S2 VERSION: 1.2 2011-10-28
Page 20 (40) © Fujitsu Technology Solutions 2011
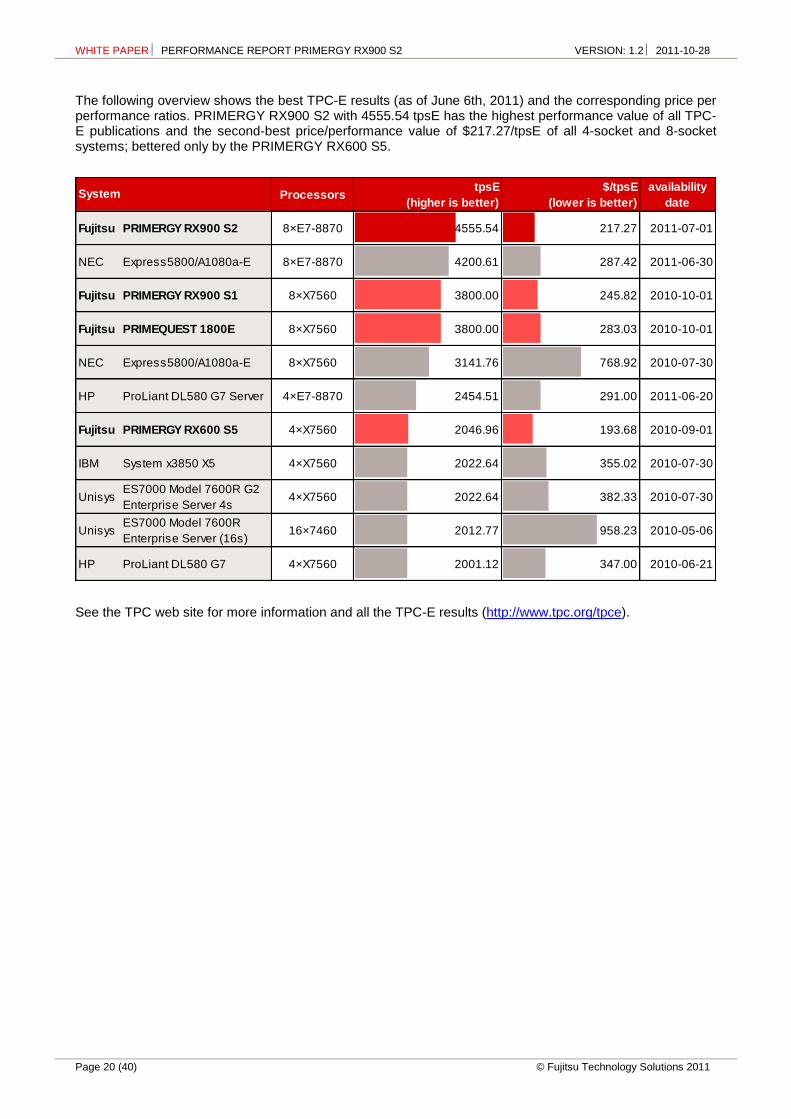
The following overview shows the best TPC-E results (as of June 6th, 2011) and the corresponding price per performance ratios. PRIMERGY RX900 S2 with 4555.54 tpsE has the highest performance value of all TPC-E publications and the second-best price/performance value of $217.27/tpsE of all 4-socket and 8-socket systems; bettered only by the PRIMERGY RX600 S5.
See the TPC web site for more information and all the TPC-E results (http://www.tpc.org/tpce).
ProcessorstpsE
(higher is better)
$/tpsE
(lower is better)
availability
date
Fujitsu PRIMERGY RX900 S2 8×E7-8870 4555.54 217.27 2011-07-01
NEC Express5800/A1080a-E 8×E7-8870 4200.61 287.42 2011-06-30
Fujitsu PRIMERGY RX900 S1 8×X7560 3800.00 245.82 2010-10-01
Fujitsu PRIMEQUEST 1800E 8×X7560 3800.00 283.03 2010-10-01
NEC Express5800/A1080a-E 8×X7560 3141.76 768.92 2010-07-30
HP ProLiant DL580 G7 Server 4×E7-8870 2454.51 291.00 2011-06-20
Fujitsu PRIMERGY RX600 S5 4×X7560 2046.96 193.68 2010-09-01
IBM System x3850 X5 4×X7560 2022.64 355.02 2010-07-30
UnisysES7000 Model 7600R G2
Enterprise Server 4s4×X7560 2022.64 382.33 2010-07-30
UnisysES7000 Model 7600R
Enterprise Server (16s)16×7460 2012.77 958.23 2010-05-06
HP ProLiant DL580 G7 4×X7560 2001.12 347.00 2010-06-21
System
WHITE PAPER PERFORMANCE REPORT PRIMERGY RX900 S2 VERSION: 1.2 2011-10-28
© Fujitsu Technology Solutions 2011 Page 21 (40)
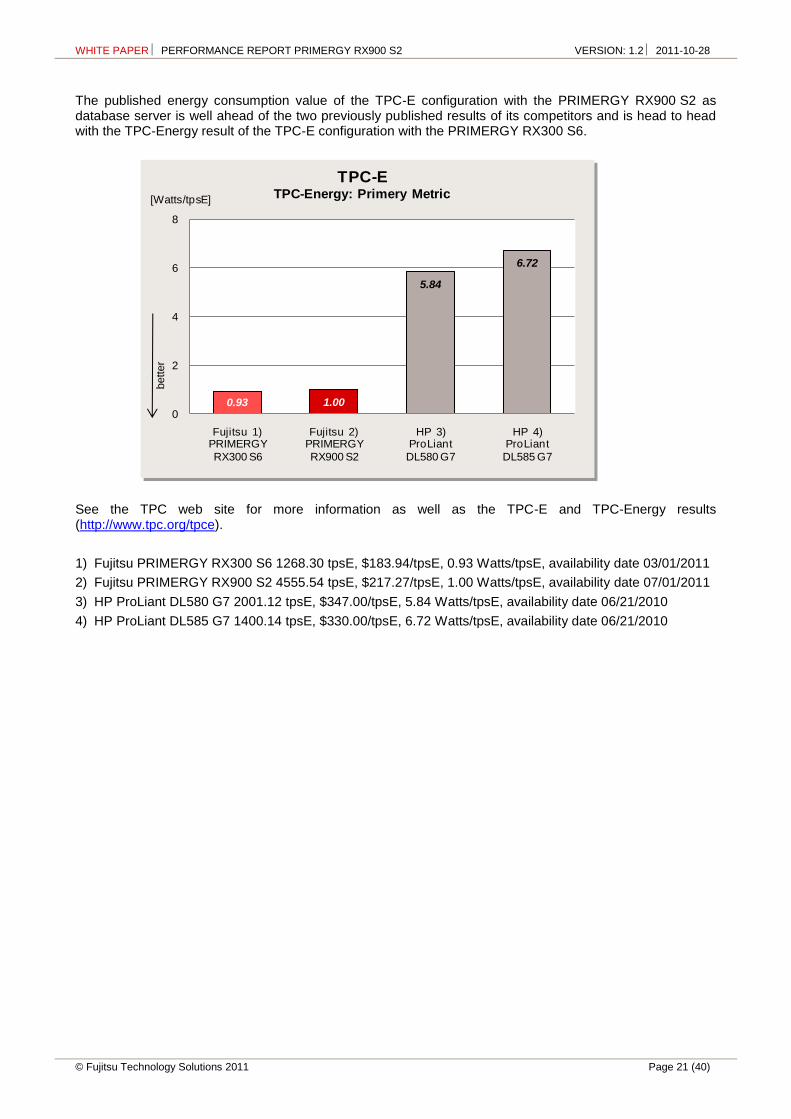
The published energy consumption value of the TPC-E configuration with the PRIMERGY RX900 S2 as database server is well ahead of the two previously published results of its competitors and is head to head with the TPC-Energy result of the TPC-E configuration with the PRIMERGY RX300 S6.
See the TPC web site for more information as well as the TPC-E and TPC-Energy results (http://www.tpc.org/tpce).
1) Fujitsu PRIMERGY RX300 S6 1268.30 tpsE, $183.94/tpsE, 0.93 Watts/tpsE, availability date 03/01/2011
2) Fujitsu PRIMERGY RX900 S2 4555.54 tpsE, $217.27/tpsE, 1.00 Watts/tpsE, availability date 07/01/2011
3) HP ProLiant DL580 G7 2001.12 tpsE, $347.00/tpsE, 5.84 Watts/tpsE, availability date 06/21/2010
4) HP ProLiant DL585 G7 1400.14 tpsE, $330.00/tpsE, 6.72 Watts/tpsE, availability date 06/21/2010
[Watts/tpsE]
0.93 1.00
5.84
6.72
0
2
4
6
8
Fujitsu 1)PRIMERGY
RX300 S6
Fujitsu 2)PRIMERGY
RX900 S2
HP 3)ProLiant
DL580 G7
HP 4)ProLiant
DL585 G7
TPC-E TPC-Energy: Primery Metric[Watts/tpsE]
better
WHITE PAPER PERFORMANCE REPORT PRIMERGY RX900 S2 VERSION: 1.2 2011-10-28
Page 22 (40) © Fujitsu Technology Solutions 2011
vServCon
Benchmark description
vServCon is a benchmark used by Fujitsu Technology Solutions to compare server configurations with hypervisor with regard to their suitability for server consolidation. This allows both the comparison of systems, processors and I/O technologies as well as the comparison of hypervisors, virtualization forms and additional drivers for virtual machines.
vServCon is not a new benchmark in the true sense of the word. It is more a framework that combines already established benchmarks (or in modified form) as workloads in order to reproduce the load of a consolidated and virtualized server environment. Three proven benchmarks are used which cover the application scenarios database, application server and web server.
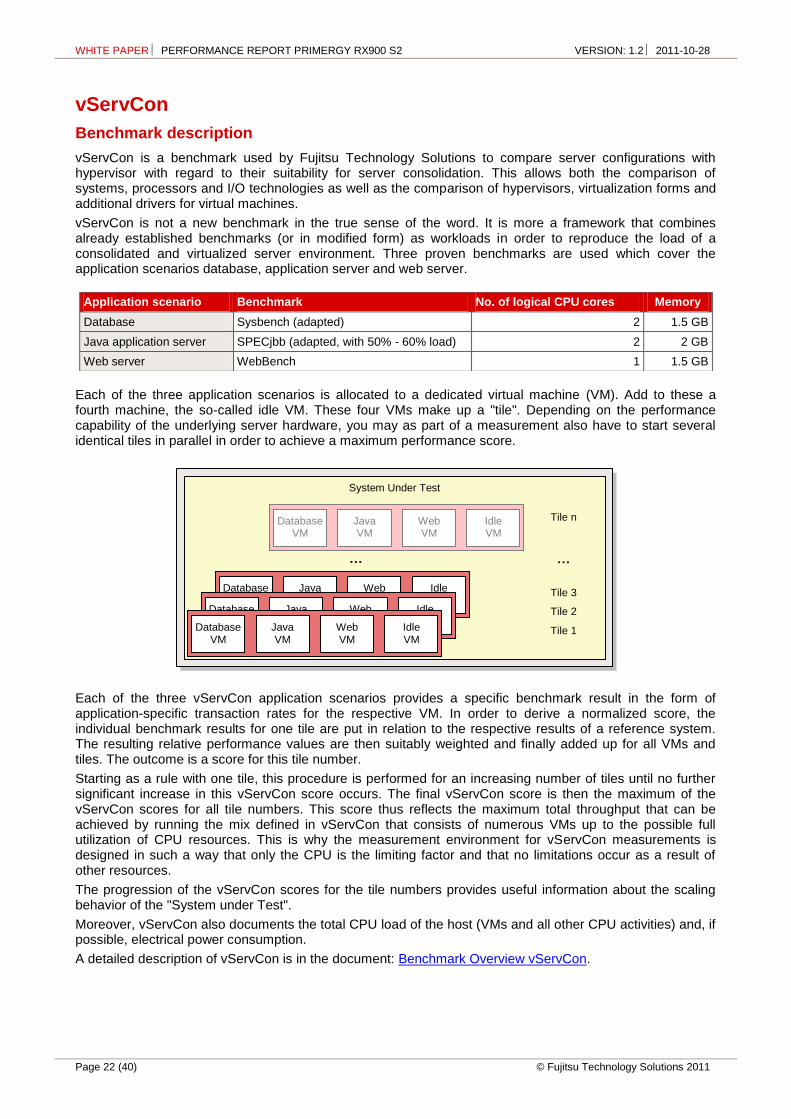
Each of the three application scenarios is allocated to a dedicated virtual machine (VM). Add to these a fourth machine, the so-called idle VM. These four VMs make up a "tile". Depending on the performance capability of the underlying server hardware, you may as part of a measurement also have to start several identical tiles in parallel in order to achieve a maximum performance score.
Each of the three vServCon application scenarios provides a specific benchmark result in the form of application-specific transaction rates for the respective VM. In order to derive a normalized score, the individual benchmark results for one tile are put in relation to the respective results of a reference system. The resulting relative performance values are then suitably weighted and finally added up for all VMs and tiles. The outcome is a score for this tile number.
Starting as a rule with one tile, this procedure is performed for an increasing number of tiles until no further significant increase in this vServCon score occurs. The final vServCon score is then the maximum of the vServCon scores for all tile numbers. This score thus reflects the maximum total throughput that can be achieved by running the mix defined in vServCon that consists of numerous VMs up to the possible full utilization of CPU resources. This is why the measurement environment for vServCon measurements is designed in such a way that only the CPU is the limiting factor and that no limitations occur as a result of other resources.
The progression of the vServCon scores for the tile numbers provides useful information about the scaling behavior of the "System under Test".
Moreover, vServCon also documents the total CPU load of the host (VMs and all other CPU activities) and, if possible, electrical power consumption.
A detailed description of vServCon is in the document: Benchmark Overview vServCon.
Application scenario Benchmark No. of logical CPU cores Memory
Database Sysbench (adapted) 2 1.5 GB
Java application server SPECjbb (adapted, with 50% - 60% load) 2 2 GB
Web server WebBench 1 1.5 GB
System Under Test
… …
Tile n
Tile 3
Tile 2
Tile 1
Database VM
Web VM
Idle VM
Java VM
Database VM
Web VM
Idle VM
Java VM
Database VM
Web VM
Idle VM
Java VM Database
VM Web VM
Idle VM
Java VM
WHITE PAPER PERFORMANCE REPORT PRIMERGY RX900 S2 VERSION: 1.2 2011-10-28
© Fujitsu Technology Solutions 2011 Page 23 (40)
Benchmark results
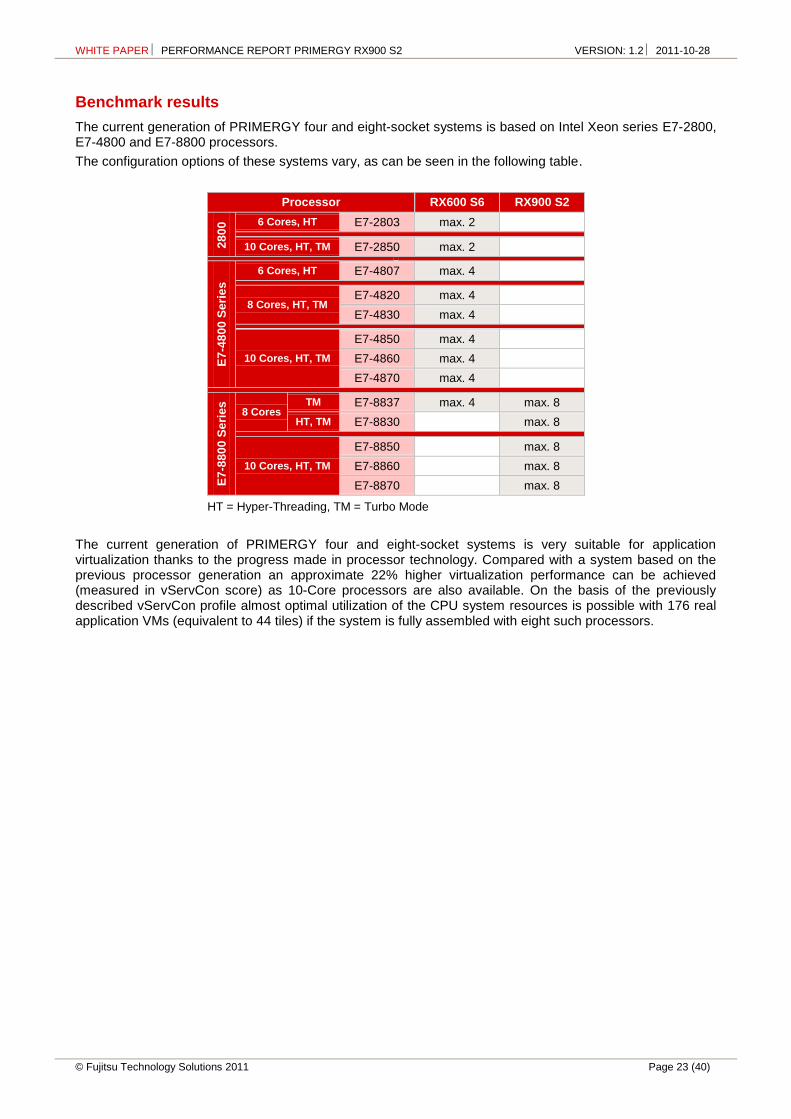
The current generation of PRIMERGY four and eight-socket systems is based on Intel Xeon series E7-2800, E7-4800 and E7-8800 processors.
The configuration options of these systems vary, as can be seen in the following table.
Processor RX600 S6 RX900 S2
28
00 6 Cores, HT E7-2803 max. 2
10 Cores, HT, TM E7-2850 max. 2
E7
-48
00 S
eri
es
6 Cores, HT E7-4807 max. 4
8 Cores, HT, TM E7-4820 max. 4
E7-4830 max. 4
10 Cores, HT, TM
E7-4850 max. 4
E7-4860 max. 4
E7-4870 max. 4
E7
-88
00 S
eri
es
8 Cores TM E7-8837 max. 4 max. 8
HT, TM E7-8830 max. 8
10 Cores, HT, TM
E7-8850 max. 8
E7-8860 max. 8
E7-8870 max. 8
HT = Hyper-Threading, TM = Turbo Mode
The current generation of PRIMERGY four and eight-socket systems is very suitable for application virtualization thanks to the progress made in processor technology. Compared with a system based on the previous processor generation an approximate 22% higher virtualization performance can be achieved (measured in vServCon score) as 10-Core processors are also available. On the basis of the previously described vServCon profile almost optimal utilization of the CPU system resources is possible with 176 real application VMs (equivalent to 44 tiles) if the system is fully assembled with eight such processors.
WHITE PAPER PERFORMANCE REPORT PRIMERGY RX900 S2 VERSION: 1.2 2011-10-28
Page 24 (40) © Fujitsu Technology Solutions 2011
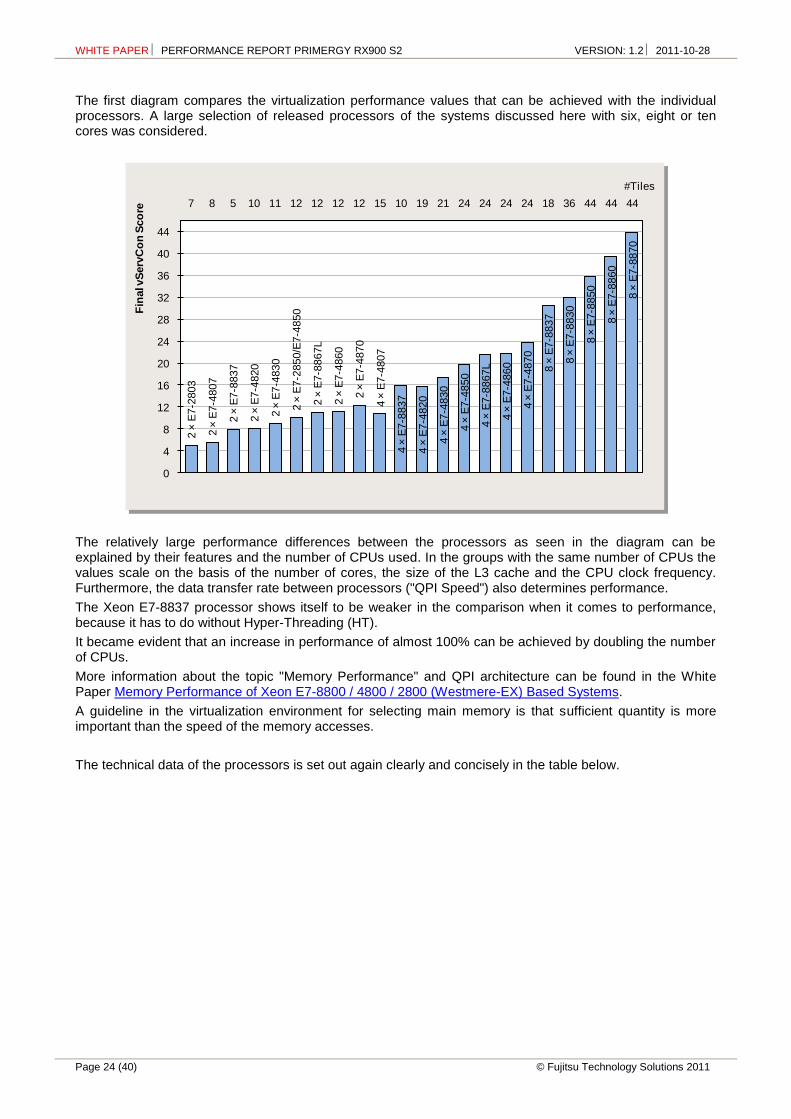
The first diagram compares the virtualization performance values that can be achieved with the individual processors. A large selection of released processors of the systems discussed here with six, eight or ten cores was considered.
The relatively large performance differences between the processors as seen in the diagram can be explained by their features and the number of CPUs used. In the groups with the same number of CPUs the values scale on the basis of the number of cores, the size of the L3 cache and the CPU clock frequency. Furthermore, the data transfer rate between processors ("QPI Speed") also determines performance.
The Xeon E7-8837 processor shows itself to be weaker in the comparison when it comes to performance, because it has to do without Hyper-Threading (HT).
It became evident that an increase in performance of almost 100% can be achieved by doubling the number of CPUs.
More information about the topic "Memory Performance" and QPI architecture can be found in the White Paper Memory Performance of Xeon E7-8800 / 4800 / 2800 (Westmere-EX) Based Systems.
A guideline in the virtualization environment for selecting main memory is that sufficient quantity is more important than the speed of the memory accesses.
The technical data of the processors is set out again clearly and concisely in the table below.
2 ×
E7-2
803
2 ×
E7-4
807
2 ×
E7-8
837
2 ×
E7-4
820
2 ×
E7-4
830
2 ×
E7-2
850/E
7-4
850
2 ×
E7-8
867L
2 ×
E7-4
860
2 ×
E7-4
870
4 ×
E7-4
807
4 ×
E7-8
837
4 ×
E7-4
820
4 ×
E7-4
830
4 ×
E7-4
850
4 ×
E7-8
867L
4 ×
E7-4
860
4 ×
E7-4
870
8 ×
E7-8
837
8 ×
E7-8
830
8 ×
E7-8
850
8 ×
E7-8
860
8 ×
E7-8
870
7 8 5 10 11 12 12 12 12 15 10 19 21 24 24 24 24 18 36 44 44 44
0
4
8
12
16
20
24
28
32
36
40
44
Fin
al v
Serv
Co
n S
co
re
#Tiles
WHITE PAPER PERFORMANCE REPORT PRIMERGY RX900 S2 VERSION: 1.2 2011-10-28
© Fujitsu Technology Solutions 2011 Page 25 (40)
Processor #Cores/
Chip L3 Cache
Processor-frequency
QPI
Speed HT TM TDP #Tiles Score
28
00 6 Cores, HT E7-2803(2×) 6 18 MB 1.73 GHz 4.8 GT/s 105 W 7 4.96
10 Cores, HT, TM E7-2850(2×) 10 24 MB 2.00 GHz 6.4 GT/s 130 W 12 10.10
E7
-48
00 S
eri
es
6 Cores, HT E7-4807(2×) 6 18 MB 1.87 GHz 4.8 GT/s 95 W 8 5.46
E7-4807(4×) 6 18 MB 1.87 GHz 4.8 GT/s 95 W 15 10.70
8 Cores, HT, TM
E7-4820(2×) 8 18 MB 2.00 GHz 5.86 GT/s 105 W 10 8.01
E7-4820(4×) 8 18 MB 2.00 GHz 5.86 GT/s 105 W 19 15.70
E7-4830(2×) 8 24 MB 2.13 GHz 6.4 GT/s 105 W 11 8.93
E7-4830(4×) 8 24 MB 2.13 GHz 6.4 GT/s 105 W 21 17.50
10 Cores, HT, TM
E7-4850(2×) 10 24 MB 2.00 GHz 6.4 GT/s 130 W 12 10.10
E7-4850(4×) 10 24 MB 2.00 GHz 6.4 GT/s 130 W 24 19.80
E7-4860(2×) 10 24 MB 2.27 GHz 6.4 GT/s 130 W 12 11.10
E7-4860(4×) 10 24 MB 2.27 GHz 6.4 GT/s 130 W 24 21.70
E7-4870(2×) 10 30 MB 2.40 GHz 6.4 GT/s 130 W 12 12.30
E7-4870(4×) 10 30 MB 2.40 GHz 6.4 GT/s 130 W 24 23.90
E7
-88
00 S
eri
es
8 Cores
TM
E7-8837(2×) 8 24 MB 2.67 GHz 6.4 GT/s 130 W 5 7.90
E7-8837(4×) 8 24 MB 2.67 GHz 6.4 GT/s 130 W 10 15.80
E7-8837(8×) 8 24 MB 2.67 GHz 6.4 GT/s 130 W 18 30.60
HT, TM E7-8830(4×) 8 24 MB 2.13 GHz 6.4 GT/s 105 W 21 16.70
E7-8830(8×) 8 24 MB 2.13 GHz 6.4 GT/s 105 W 36 32.10
10 Cores, HT, TM
E7-8850(4×) 10 24 MB 2.00 GHz 6.4 GT/s 130 W 24 18.70
E7-8850(8×) 10 24 MB 2.00 GHz 6.4 GT/s 130 W 44 35.80
E7-8860(4×) 10 24 MB 2.27 GHz 6.4 GT/s 130 W 24 20.60
E7-8860(8×) 10 24 MB 2.27 GHz 6.4 GT/s 130 W 44 39.40
E7-8870(4×) 10 30 MB 2.40 GHz 6.4 GT/s 130 W 24 22.70
E7-8870(8×) 10 30 MB 2.40 GHz 6.4 GT/s 130 W 44 43.90
QPI = QuickPath Interconnect, GT = Gigatransfer, HT = Hyper-Threading, TM = Turbo Mode, TDP = Thermal Design Power
WHITE PAPER PERFORMANCE REPORT PRIMERGY RX900 S2 VERSION: 1.2 2011-10-28
Page 26 (40) © Fujitsu Technology Solutions 2011
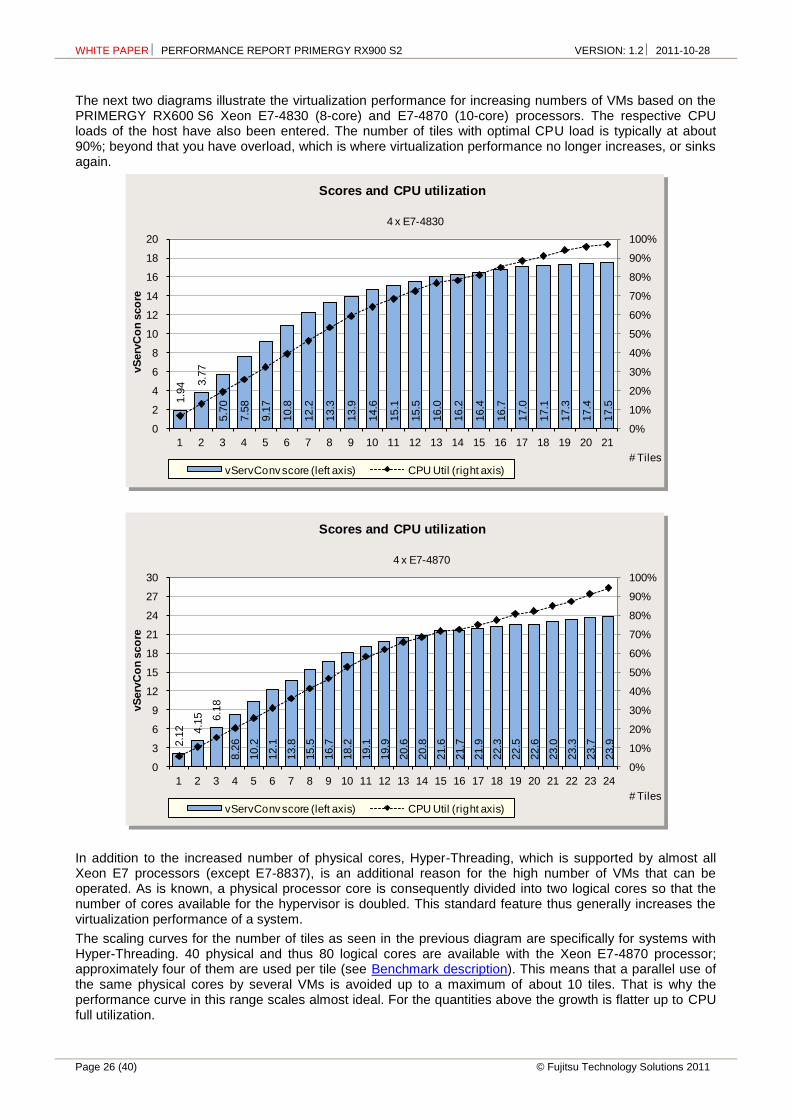
The next two diagrams illustrate the virtualization performance for increasing numbers of VMs based on the PRIMERGY RX600 S6 Xeon E7-4830 (8-core) and E7-4870 (10-core) processors. The respective CPU loads of the host have also been entered. The number of tiles with optimal CPU load is typically at about 90%; beyond that you have overload, which is where virtualization performance no longer increases, or sinks again.
In addition to the increased number of physical cores, Hyper-Threading, which is supported by almost all Xeon E7 processors (except E7-8837), is an additional reason for the high number of VMs that can be operated. As is known, a physical processor core is consequently divided into two logical cores so that the number of cores available for the hypervisor is doubled. This standard feature thus generally increases the virtualization performance of a system.
The scaling curves for the number of tiles as seen in the previous diagram are specifically for systems with Hyper-Threading. 40 physical and thus 80 logical cores are available with the Xeon E7-4870 processor; approximately four of them are used per tile (see Benchmark description). This means that a parallel use of the same physical cores by several VMs is avoided up to a maximum of about 10 tiles. That is why the performance curve in this range scales almost ideal. For the quantities above the growth is flatter up to CPU full utilization.
1.9
4 3.7
7
5.7
0
7.5
8
9.1
7
10.8
12.2
13.3
13.9
14.6
15.1
15.5
16.0
16.2
16.4
16.7
17.0
17.1
17.3
17.4
17.5
0%
10%
20%
30%
40%
50%
60%
70%
80%
90%
100%
4 x E7-4830
0
2
4
6
8
10
12
14
16
18
20
1 2 3 4 5 6 7 8 9 10 11 12 13 14 15 16 17 18 19 20 21
vS
erv
Co
n s
co
re
# Tiles
Scores and CPU utilization
vServConv score (left axis) CPU Util (right axis)
2.1
2 4.1
5 6.1
8
8.2
6
10.2
12.1
13.8
15.5
16.7
18.2
19.1
19.9
20.6
20.8
21.6
21.7
21.9
22.3
22.5
22.6
23.0
23.3
23.7
23.9
0%
10%
20%
30%
40%
50%
60%
70%
80%
90%
100%
4 x E7-4870
0
3
6
9
12
15
18
21
24
27
30
1 2 3 4 5 6 7 8 9 10 11 12 13 14 15 16 17 18 19 20 21 22 23 24
vS
erv
Co
n s
co
re
# Tiles
Scores and CPU utilization
vServConv score (left axis) CPU Util (right axis)
WHITE PAPER PERFORMANCE REPORT PRIMERGY RX900 S2 VERSION: 1.2 2011-10-28
© Fujitsu Technology Solutions 2011 Page 27 (40)
The previous diagram examined the total performance of all application VMs of a host. However, studying the performance from an individual application VM viewpoint is also interesting. This information is in the previous diagram. For example, the total optimum is reached in the above Xeon E7-4870 situation with 72 application VMs (24 tiles, not including the idle VMs); the low load case is represented by three application VMs (one tile, not including the idle VM). Remember: the vServCon score for one tile is an average value across the three application scenarios in vServCon. This average performance of one tile drops when changing from the low load case to the total optimum of the vServCon score - from 2.12 to 23.90/24=0.99, i.e. to 47%. The individual types of application VMs can react very differently in the high load situation. It is thus clear that in a specific situation the performance requirements of an individual application must be balanced against the overall requirements regarding the numbers of VMs on a virtualization host.
WHITE PAPER PERFORMANCE REPORT PRIMERGY RX900 S2 VERSION: 1.2 2011-10-28
Page 28 (40) © Fujitsu Technology Solutions 2011
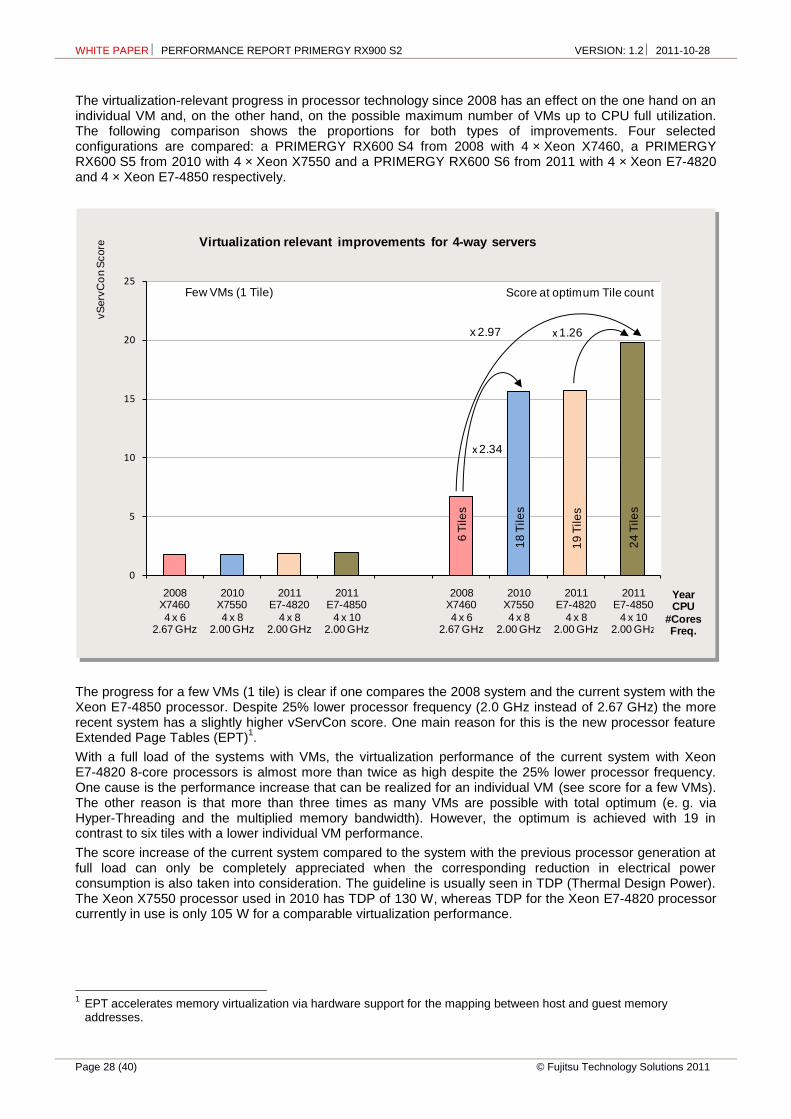
The virtualization-relevant progress in processor technology since 2008 has an effect on the one hand on an individual VM and, on the other hand, on the possible maximum number of VMs up to CPU full utilization. The following comparison shows the proportions for both types of improvements. Four selected configurations are compared: a PRIMERGY RX600 S4 from 2008 with 4 × Xeon X7460, a PRIMERGY RX600 S5 from 2010 with 4 × Xeon X7550 and a PRIMERGY RX600 S6 from 2011 with 4 × Xeon E7-4820 and 4 × Xeon E7-4850 respectively.
The progress for a few VMs (1 tile) is clear if one compares the 2008 system and the current system with the Xeon E7-4850 processor. Despite 25% lower processor frequency (2.0 GHz instead of 2.67 GHz) the more recent system has a slightly higher vServCon score. One main reason for this is the new processor feature Extended Page Tables (EPT)
1.
With a full load of the systems with VMs, the virtualization performance of the current system with Xeon E7-4820 8-core processors is almost more than twice as high despite the 25% lower processor frequency. One cause is the performance increase that can be realized for an individual VM (see score for a few VMs). The other reason is that more than three times as many VMs are possible with total optimum (e. g. via Hyper-Threading and the multiplied memory bandwidth). However, the optimum is achieved with 19 in contrast to six tiles with a lower individual VM performance.
The score increase of the current system compared to the system with the previous processor generation at full load can only be completely appreciated when the corresponding reduction in electrical power consumption is also taken into consideration. The guideline is usually seen in TDP (Thermal Design Power). The Xeon X7550 processor used in 2010 has TDP of 130 W, whereas TDP for the Xeon E7-4820 processor currently in use is only 105 W for a comparable virtualization performance.
1 EPT accelerates memory virtualization via hardware support for the mapping between host and guest memory addresses.
0
5
10
15
20
25
2008X7460
4 x 62.67 GHz
2010X7550
4 x 82.00 GHz
2011E7-4820
4 x 82.00 GHz
2011E7-4850
4 x 102.00 GHz
2008X7460
4 x 62.67 GHz
2010X7550
4 x 82.00 GHz
2011E7-4820
4 x 82.00 GHz
2011E7-4850
4 x 102.00 GHz
Score at optimum Tile countFew VMs (1 Tile)
Virtualization relevant improvements for 4-way servers
x 2.34
vS
erv
Co
n S
core
x 2.97
Year CPU
#CoresFreq.
x 1.26
6 T
ile
s
18
Tile
s
19
Tile
s
24
Tile
s
WHITE PAPER PERFORMANCE REPORT PRIMERGY RX900 S2 VERSION: 1.2 2011-10-28
© Fujitsu Technology Solutions 2011 Page 29 (40)
A further increase in the virtualization performance can be obtained by using a processor with a higher number of cores. If one considers (also with full load) the same measurements with the current system for the 10-core processor instead of the 8-core processor, you can see a clear improvement in comparison to the 2008 system.
We must explicitly point out that the increased virtualization performance as seen in the score cannot be completely deemed as an improvement for one individual VM. Performance increases in the virtualization environment since 2010 are mainly achieved by increases in the maximum number of VMs that can be operated.
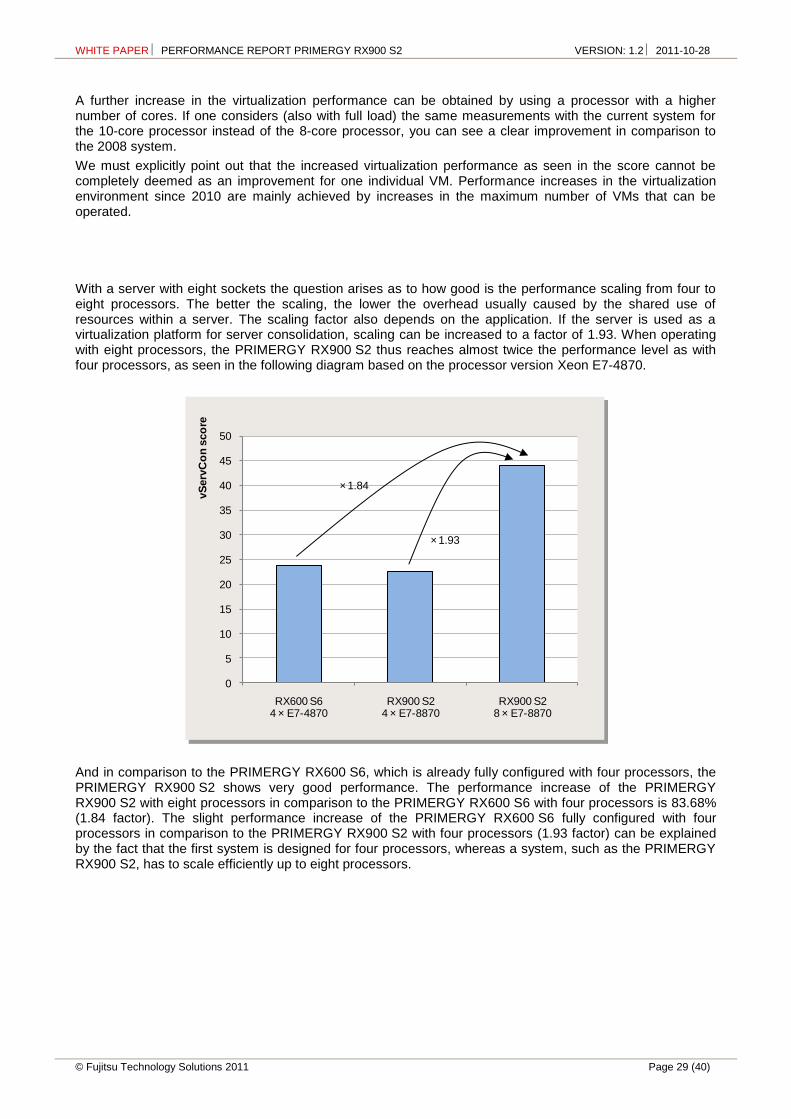
With a server with eight sockets the question arises as to how good is the performance scaling from four to eight processors. The better the scaling, the lower the overhead usually caused by the shared use of resources within a server. The scaling factor also depends on the application. If the server is used as a virtualization platform for server consolidation, scaling can be increased to a factor of 1.93. When operating with eight processors, the PRIMERGY RX900 S2 thus reaches almost twice the performance level as with four processors, as seen in the following diagram based on the processor version Xeon E7-4870.
And in comparison to the PRIMERGY RX600 S6, which is already fully configured with four processors, the PRIMERGY RX900 S2 shows very good performance. The performance increase of the PRIMERGY RX900 S2 with eight processors in comparison to the PRIMERGY RX600 S6 with four processors is 83.68% (1.84 factor). The slight performance increase of the PRIMERGY RX600 S6 fully configured with four processors in comparison to the PRIMERGY RX900 S2 with four processors (1.93 factor) can be explained by the fact that the first system is designed for four processors, whereas a system, such as the PRIMERGY RX900 S2, has to scale efficiently up to eight processors.
0
5
10
15
20
25
30
35
40
45
50
RX600 S64 × E7-4870
RX900 S24 × E7-8870
RX900 S28 × E7-8870
× 1.93
vS
erv
Co
n s
co
re
× 1.84
WHITE PAPER PERFORMANCE REPORT PRIMERGY RX900 S2 VERSION: 1.2 2011-10-28
Page 30 (40) © Fujitsu Technology Solutions 2011
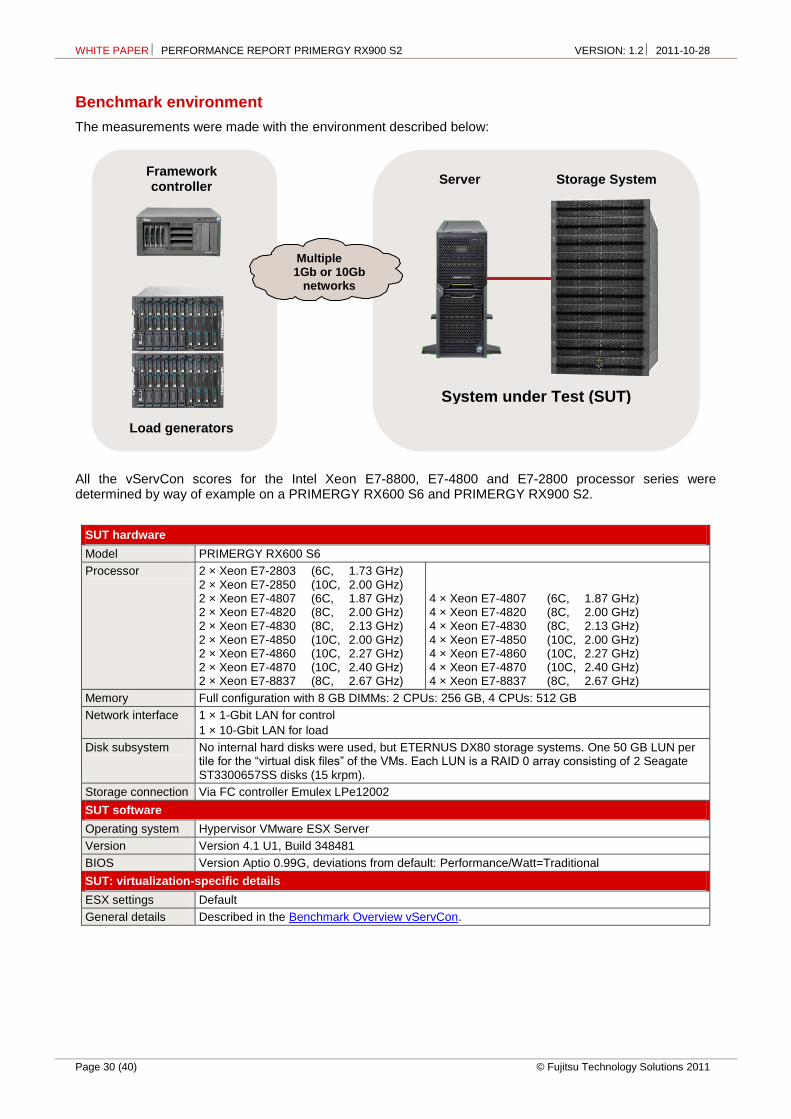
Benchmark environment
The measurements were made with the environment described below:
All the vServCon scores for the Intel Xeon E7-8800, E7-4800 and E7-2800 processor series were determined by way of example on a PRIMERGY RX600 S6 and PRIMERGY RX900 S2.
SUT hardware
Model PRIMERGY RX600 S6
Processor 2 × Xeon E7-2803 (6C, 1.73 GHz) 2 × Xeon E7-2850 (10C, 2.00 GHz) 2 × Xeon E7-4807 (6C, 1.87 GHz) 2 × Xeon E7-4820 (8C, 2.00 GHz) 2 × Xeon E7-4830 (8C, 2.13 GHz) 2 × Xeon E7-4850 (10C, 2.00 GHz) 2 × Xeon E7-4860 (10C, 2.27 GHz) 2 × Xeon E7-4870 (10C, 2.40 GHz) 2 × Xeon E7-8837 (8C, 2.67 GHz)
4 × Xeon E7-4807 (6C, 1.87 GHz) 4 × Xeon E7-4820 (8C, 2.00 GHz) 4 × Xeon E7-4830 (8C, 2.13 GHz) 4 × Xeon E7-4850 (10C, 2.00 GHz) 4 × Xeon E7-4860 (10C, 2.27 GHz) 4 × Xeon E7-4870 (10C, 2.40 GHz) 4 × Xeon E7-8837 (8C, 2.67 GHz)
Memory Full configuration with 8 GB DIMMs: 2 CPUs: 256 GB, 4 CPUs: 512 GB
Network interface 1 × 1-Gbit LAN for control
1 × 10-Gbit LAN for load
Disk subsystem No internal hard disks were used, but ETERNUS DX80 storage systems. One 50 GB LUN per tile for the “virtual disk files” of the VMs. Each LUN is a RAID 0 array consisting of 2 Seagate ST3300657SS disks (15 krpm).
Storage connection Via FC controller Emulex LPe12002
SUT software
Operating system Hypervisor VMware ESX Server
Version Version 4.1 U1, Build 348481
BIOS Version Aptio 0.99G, deviations from default: Performance/Watt=Traditional
SUT: virtualization-specific details
ESX settings Default
General details Described in the Benchmark Overview vServCon.
Multiple 1Gb or 10Gb
networks
Load generators
Server Storage System
System under Test (SUT)
Framework controller
WHITE PAPER PERFORMANCE REPORT PRIMERGY RX900 S2 VERSION: 1.2 2011-10-28
© Fujitsu Technology Solutions 2011 Page 31 (40)
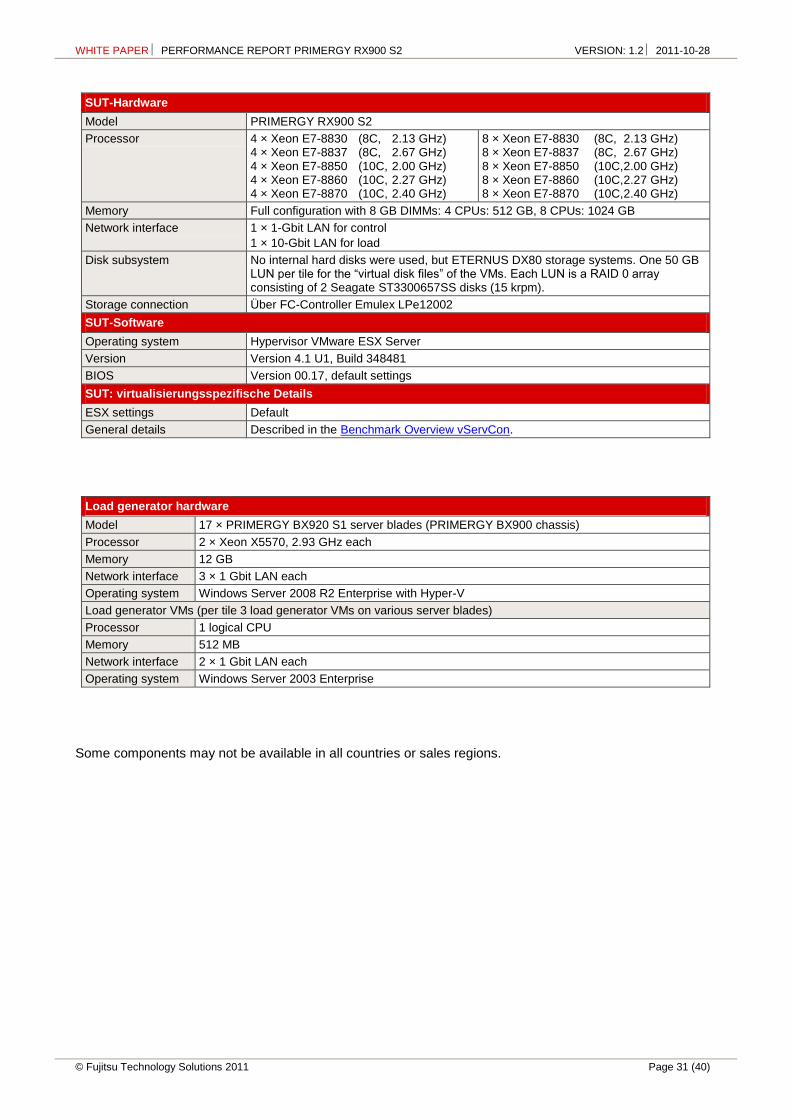
SUT-Hardware
Model PRIMERGY RX900 S2
Processor 4 × Xeon E7-8830 (8C, 2.13 GHz) 4 × Xeon E7-8837 (8C, 2.67 GHz) 4 × Xeon E7-8850 (10C, 2.00 GHz) 4 × Xeon E7-8860 (10C, 2.27 GHz) 4 × Xeon E7-8870 (10C, 2.40 GHz)
8 × Xeon E7-8830 (8C, 2.13 GHz) 8 × Xeon E7-8837 (8C, 2.67 GHz) 8 × Xeon E7-8850 (10C, 2.00 GHz) 8 × Xeon E7-8860 (10C, 2.27 GHz) 8 × Xeon E7-8870 (10C, 2.40 GHz)
Memory Full configuration with 8 GB DIMMs: 4 CPUs: 512 GB, 8 CPUs: 1024 GB
Network interface 1 × 1-Gbit LAN for control
1 × 10-Gbit LAN for load
Disk subsystem No internal hard disks were used, but ETERNUS DX80 storage systems. One 50 GB LUN per tile for the “virtual disk files” of the VMs. Each LUN is a RAID 0 array consisting of 2 Seagate ST3300657SS disks (15 krpm).
Storage connection Über FC-Controller Emulex LPe12002
SUT-Software
Operating system Hypervisor VMware ESX Server
Version Version 4.1 U1, Build 348481
BIOS Version 00.17, default settings
SUT: virtualisierungsspezifische Details
ESX settings Default
General details Described in the Benchmark Overview vServCon.
Load generator hardware
Model 17 × PRIMERGY BX920 S1 server blades (PRIMERGY BX900 chassis)
Processor 2 × Xeon X5570, 2.93 GHz each
Memory 12 GB
Network interface 3 × 1 Gbit LAN each
Operating system Windows Server 2008 R2 Enterprise with Hyper-V
Load generator VMs (per tile 3 load generator VMs on various server blades)
Processor 1 logical CPU
Memory 512 MB
Network interface 2 × 1 Gbit LAN each
Operating system Windows Server 2003 Enterprise
Some components may not be available in all countries or sales regions.
WHITE PAPER PERFORMANCE REPORT PRIMERGY RX900 S2 VERSION: 1.2 2011-10-28
Page 32 (40) © Fujitsu Technology Solutions 2011
VMmark V2
Benchmark description
VMmark V2 is a benchmark developed by VMware to compare server configurations with hypervisor solutions from VMware regarding their suitability for server consolidation. In addition to the software for load generation, the benchmark consists of a defined load profile and binding regulations. The benchmark results can be submitted to VMware and are published on their Internet site after a successful review process. After the discontinuation of the proven benchmark “VMmark V1” in October 2010, it has been succeeded by “VMmark V2”, which requires a cluster of at least two servers and covers data center functions, like Cloning and Deployment of virtual machines (VMs), Load Balancing, as well as the moving of VMs with vMotion and also Storage vMotion.
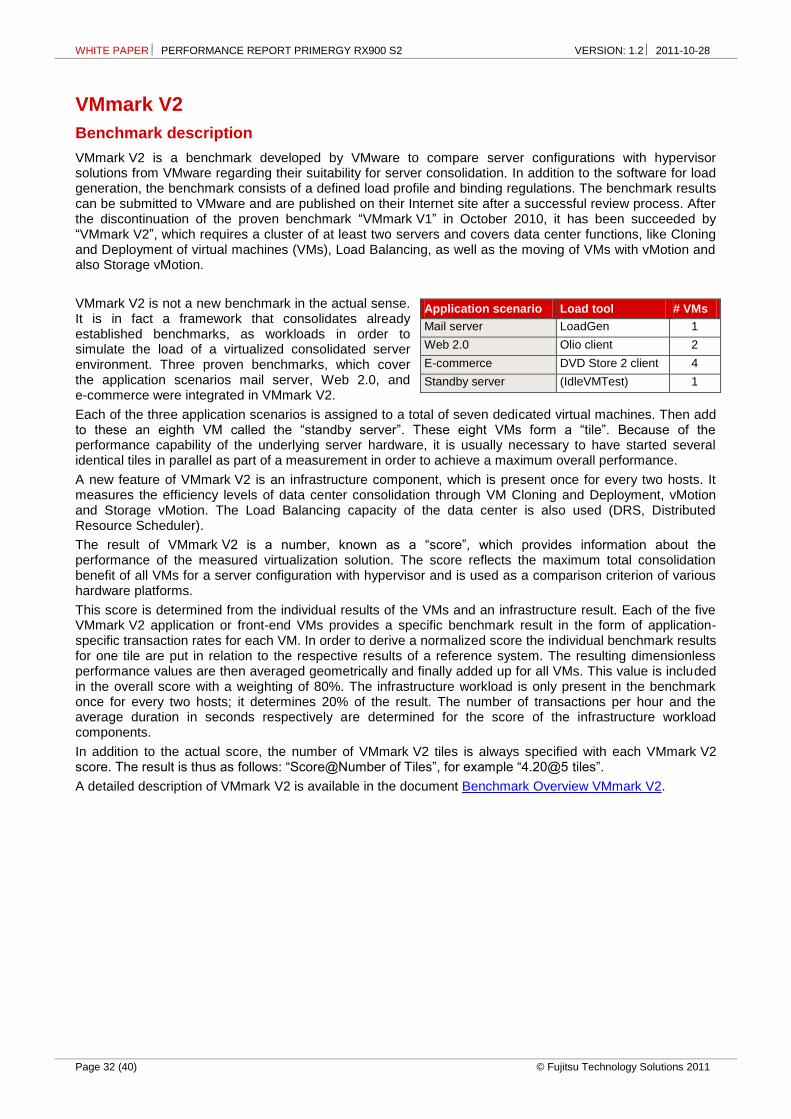
VMmark V2 is not a new benchmark in the actual sense. It is in fact a framework that consolidates already established benchmarks, as workloads in order to simulate the load of a virtualized consolidated server environment. Three proven benchmarks, which cover the application scenarios mail server, Web 2.0, and e-commerce were integrated in VMmark V2.
Each of the three application scenarios is assigned to a total of seven dedicated virtual machines. Then add to these an eighth VM called the “standby server”. These eight VMs form a “tile”. Because of the performance capability of the underlying server hardware, it is usually necessary to have started several identical tiles in parallel as part of a measurement in order to achieve a maximum overall performance.
A new feature of VMmark V2 is an infrastructure component, which is present once for every two hosts. It measures the efficiency levels of data center consolidation through VM Cloning and Deployment, vMotion and Storage vMotion. The Load Balancing capacity of the data center is also used (DRS, Distributed Resource Scheduler).
The result of VMmark V2 is a number, known as a “score”, which provides information about the performance of the measured virtualization solution. The score reflects the maximum total consolidation benefit of all VMs for a server configuration with hypervisor and is used as a comparison criterion of various hardware platforms.
This score is determined from the individual results of the VMs and an infrastructure result. Each of the five VMmark V2 application or front-end VMs provides a specific benchmark result in the form of application-specific transaction rates for each VM. In order to derive a normalized score the individual benchmark results for one tile are put in relation to the respective results of a reference system. The resulting dimensionless performance values are then averaged geometrically and finally added up for all VMs. This value is included in the overall score with a weighting of 80%. The infrastructure workload is only present in the benchmark once for every two hosts; it determines 20% of the result. The number of transactions per hour and the average duration in seconds respectively are determined for the score of the infrastructure workload components.
In addition to the actual score, the number of VMmark V2 tiles is always specified with each VMmark V2 score. The result is thus as follows: “Score@Number of Tiles”, for example “4.20@5 tiles”.
A detailed description of VMmark V2 is available in the document Benchmark Overview VMmark V2.
Application scenario Load tool # VMs
Mail server LoadGen 1
Web 2.0 Olio client 2
E-commerce DVD Store 2 client 4
Standby server (IdleVMTest) 1

WHITE PAPER PERFORMANCE REPORT PRIMERGY RX900 S2 VERSION: 1.2 2011-10-28
© Fujitsu Technology Solutions 2011 Page 33 (40)
Benchmark results
On August 23, 2011 Fujitsu achieved with a PRIMERGY RX900 S2 with Xeon E7-8870 processors and VMware ESX 4.1 U1 a VMmark V2 score of “29.03@30 tiles” in a system configuration with a total of 2 × 80 processor cores and when using two identical servers in the “System under Test” (SUT).
This score as well as the detailed results and configuration data can be seen at http://www.vmware.com/a/vmmark/.
With this result the PRIMERGY RX900 S2 is from a VMmark V2 viewpoint the most powerful server in a “matched pair” configuration consisting of two identical hosts and at the same time occupies the first position in the VMmark V2 rankings (valid as of benchmark results publication date).
The diagram shows the top VMmark V2 results with the result of the PRIMERGY RX900 S2 in comparison2
to the other VMmark V2 results.
The processors used, which with a good hypervisor setting could make optimal use of their processor features, were the essential prerequisites for achieving the PRIMERGY RX900 S2 result. These features include the extended page tables (EPT
3) and Hyper-Threading. All this has a particularly positive effect
during virtualization.
All VMs, their application data, the host operating system as well as additionally required data were on a powerful fibre channel disk subsystem from ETERNUS DX80 systems. If possible, the configuration of the disk subsystem takes the specific requirements of the benchmark into account. The use of SSDs (Solid State Disk) resulted in advantages in the number and response times of the hard disks used.
The network connection of the load generators and the infrastructure workload connection between the hosts were implemented with functionally assigned 1GbE LAN ports in each case.
All the components used were optimally attuned to each other.
2 The above comparisons for the competitor products reflect the status of 23th August 2011. The VMmark V2 results are available at http://www.vmware.com/a/vmmark/.
3 EPT accelerates memory virtualization via hardware support for the mapping between host and guest memory addresses.
29
.03
@3
0 tile
s
17
.98
@1
8 tile
s
17
.11
@2
1 tile
s
16
.89
@1
8 tile
s
16
.89
@2
0 tile
s
16
.68
@1
8 tile
s
0
2
4
6
8
10
12
14
16
18
20
22
24
26
28
30
FujitsuPRIMERGY
RX900 S28 ×
XeonE7-8870
FujitsuPRIMERGY
RX600 S64 ×
XeonE7-4870
HPProLiant
DL580 G7 4 ×
XeonE7-4870
CiscoUCS
C460 M24 ×
XeonE7-4870
HPProLiant
DL580 G7 4 ×
XeonE7-4870
CiscoUCS
C460 M24 ×
XeonE7-4870
VM
mark
V2 S
co
re
WHITE PAPER PERFORMANCE REPORT PRIMERGY RX900 S2 VERSION: 1.2 2011-10-28
Page 34 (40) © Fujitsu Technology Solutions 2011
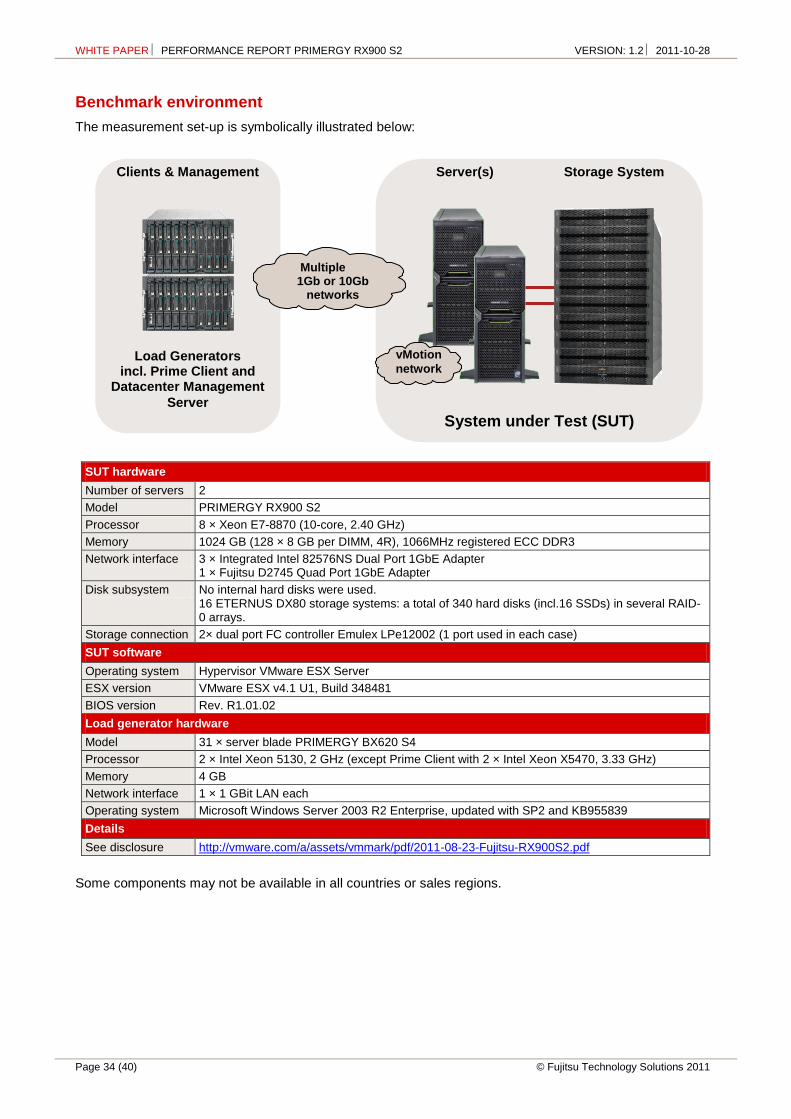
Benchmark environment
The measurement set-up is symbolically illustrated below:
SUT hardware
Number of servers 2
Model PRIMERGY RX900 S2
Processor 8 × Xeon E7-8870 (10-core, 2.40 GHz)
Memory 1024 GB (128 × 8 GB per DIMM, 4R), 1066MHz registered ECC DDR3
Network interface 3 × Integrated Intel 82576NS Dual Port 1GbE Adapter 1 × Fujitsu D2745 Quad Port 1GbE Adapter
Disk subsystem No internal hard disks were used. 16 ETERNUS DX80 storage systems: a total of 340 hard disks (incl.16 SSDs) in several RAID-0 arrays.
Storage connection 2× dual port FC controller Emulex LPe12002 (1 port used in each case)
SUT software
Operating system Hypervisor VMware ESX Server
ESX version VMware ESX v4.1 U1, Build 348481
BIOS version Rev. R1.01.02
Load generator hardware
Model 31 × server blade PRIMERGY BX620 S4
Processor 2 × Intel Xeon 5130, 2 GHz (except Prime Client with 2 × Intel Xeon X5470, 3.33 GHz)
Memory 4 GB
Network interface 1 × 1 GBit LAN each
Operating system Microsoft Windows Server 2003 R2 Enterprise, updated with SP2 and KB955839
Details
See disclosure http://vmware.com/a/assets/vmmark/pdf/2011-08-23-Fujitsu-RX900S2.pdf
Some components may not be available in all countries or sales regions.
Multiple
1Gb or 10Gb networks
Load Generators incl. Prime Client and
Datacenter Management
Server
Server(s) Storage System
System under Test (SUT)
vMotion
network
Clients & Management
WHITE PAPER PERFORMANCE REPORT PRIMERGY RX900 S2 VERSION: 1.2 2011-10-28
© Fujitsu Technology Solutions 2011 Page 35 (40)
STREAM
Benchmark description
STREAM is a synthetic benchmark that has been used for many years to determine memory throughput and which was developed by John McCalpin during his professorship at the University of Delaware. Today STREAM is supported at the University of Virginia, where the source code can be downloaded in either Fortran or C. STREAM continues to play an important role in the HPC environment in particular. It is for example an integral part of the HPC Challenge benchmark suite.
The benchmark is designed in such a way that it can be used both on PCs and on server systems. The unit of measurement of the benchmark is GB/s, i.e. the number of gigabytes that can be read and written per second.
STREAM measures the memory throughput for sequential accesses. These can generally be performed more efficiently than accesses that are randomly distributed on the memory, because the CPU caches are used for sequential access.
Before execution the source code is adapted to the environment to be measured. Therefore, the size of the data area must be at least four times larger than the total of all CPU caches so that these have as little influence as possible on the result. The OpenMP program library is used to enable selected parts of the program to be executed in parallel during the runtime of the benchmark, consequently achieving optimal load distribution to the available processor cores.
During implementation the defined data area, consisting of 8-byte elements, is successively copied to four types, and arithmetic calculations are also performed to some extent.
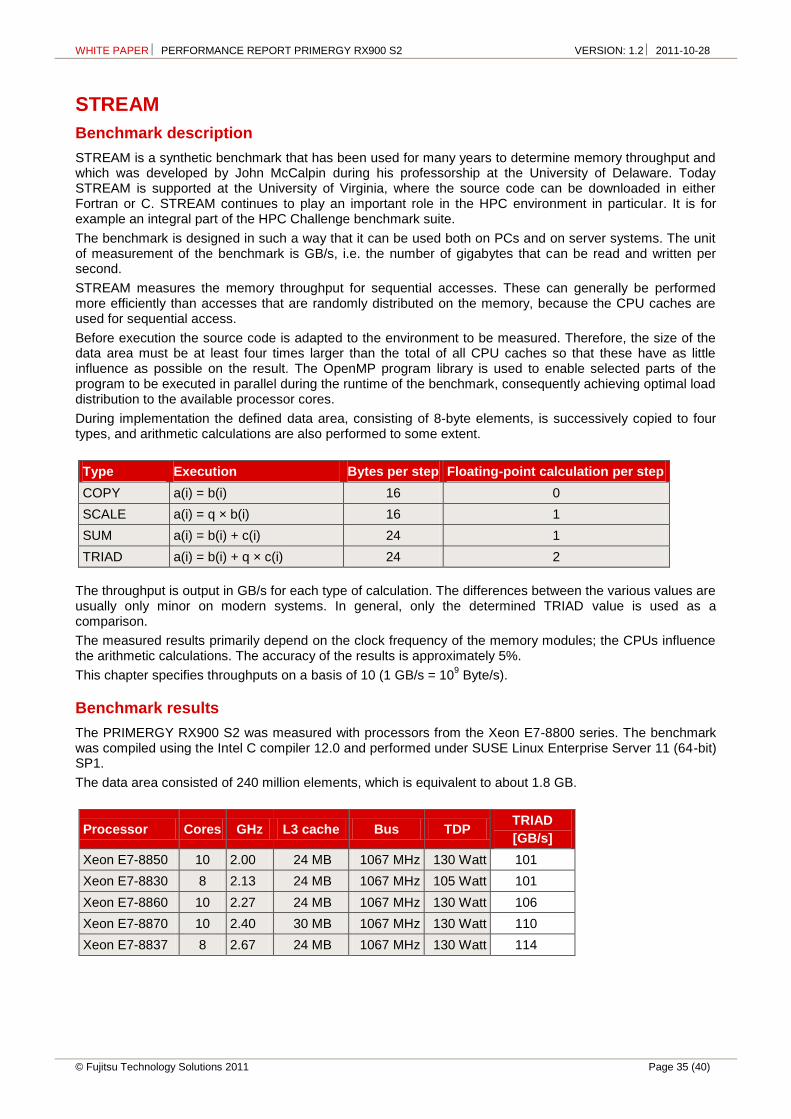
Type Execution Bytes per step Floating-point calculation per step
COPY a(i) = b(i) 16 0
SCALE a(i) = q × b(i) 16 1
SUM a(i) = b(i) + c(i) 24 1
TRIAD a(i) = b(i) + q × c(i) 24 2
The throughput is output in GB/s for each type of calculation. The differences between the various values are usually only minor on modern systems. In general, only the determined TRIAD value is used as a comparison.
The measured results primarily depend on the clock frequency of the memory modules; the CPUs influence the arithmetic calculations. The accuracy of the results is approximately 5%.
This chapter specifies throughputs on a basis of 10 (1 GB/s = 109 Byte/s).
Benchmark results
The PRIMERGY RX900 S2 was measured with processors from the Xeon E7-8800 series. The benchmark was compiled using the Intel C compiler 12.0 and performed under SUSE Linux Enterprise Server 11 (64-bit) SP1.
The data area consisted of 240 million elements, which is equivalent to about 1.8 GB.
Processor Cores GHz L3 cache Bus TDP TRIAD
[GB/s]
Xeon E7-8850 10 2.00 24 MB 1067 MHz 130 Watt 101
Xeon E7-8830 8 2.13 24 MB 1067 MHz 105 Watt 101
Xeon E7-8860 10 2.27 24 MB 1067 MHz 130 Watt 106
Xeon E7-8870 10 2.40 30 MB 1067 MHz 130 Watt 110
Xeon E7-8837 8 2.67 24 MB 1067 MHz 130 Watt 114
WHITE PAPER PERFORMANCE REPORT PRIMERGY RX900 S2 VERSION: 1.2 2011-10-28
Page 36 (40) © Fujitsu Technology Solutions 2011
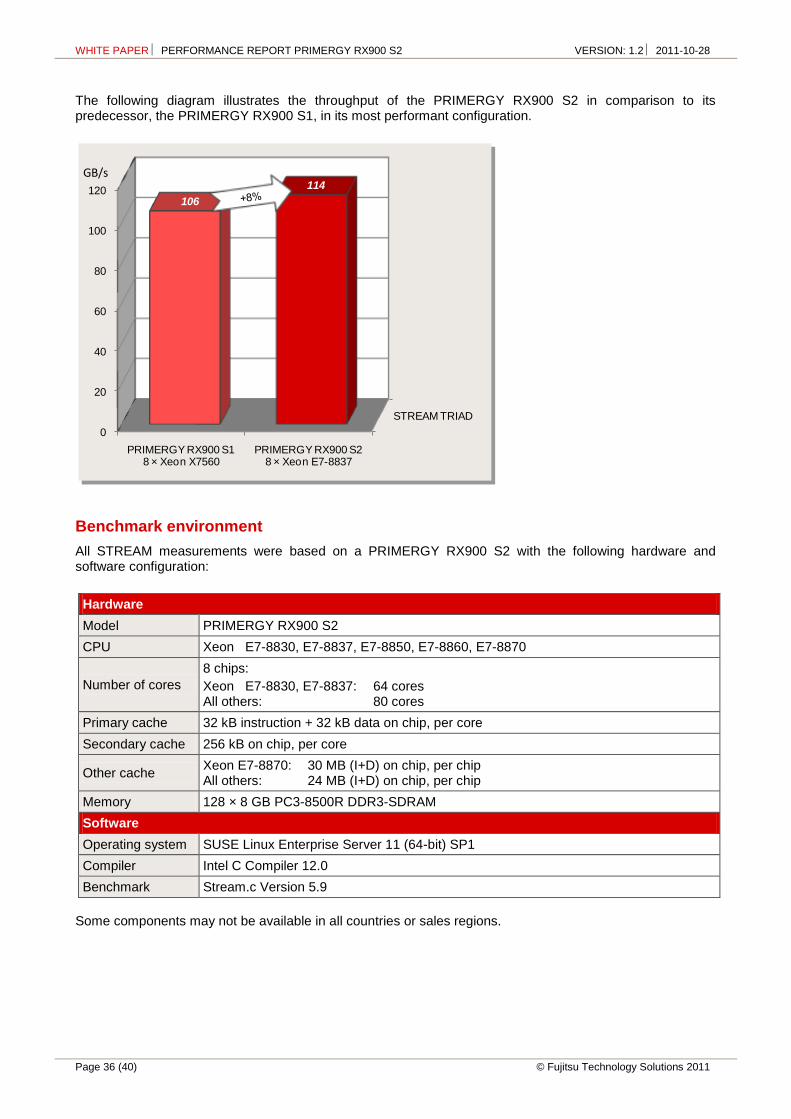
The following diagram illustrates the throughput of the PRIMERGY RX900 S2 in comparison to its predecessor, the PRIMERGY RX900 S1, in its most performant configuration.
Benchmark environment
All STREAM measurements were based on a PRIMERGY RX900 S2 with the following hardware and software configuration:
Hardware
Model PRIMERGY RX900 S2
CPU Xeon E7-8830, E7-8837, E7-8850, E7-8860, E7-8870
Number of cores
8 chips:
Xeon E7-8830, E7-8837: 64 cores All others: 80 cores
Primary cache 32 kB instruction + 32 kB data on chip, per core
Secondary cache 256 kB on chip, per core
Other cache Xeon E7-8870: 30 MB (I+D) on chip, per chip All others: 24 MB (I+D) on chip, per chip
Memory 128 × 8 GB PC3-8500R DDR3-SDRAM
Software
Operating system SUSE Linux Enterprise Server 11 (64-bit) SP1
Compiler Intel C Compiler 12.0
Benchmark Stream.c Version 5.9
Some components may not be available in all countries or sales regions.
STREAM TRIAD
0
20
40
60
80
100
120
PRIMERGY RX900 S18 × Xeon X7560
PRIMERGY RX900 S28 × Xeon E7-8837
106
114GB/s
SPECcpu2006: floating-point performance PRIMERGY TX200 S6 vs. predecessor
WHITE PAPER PERFORMANCE REPORT PRIMERGY RX900 S2 VERSION: 1.2 2011-10-28
© Fujitsu Technology Solutions 2011 Page 37 (40)
LINPACK
Benchmark description
LINPACK was developed in the 1970s by Jack Dongarra and some other people to show the performance of supercomputers. The benchmark consists of a collection of library functions for the analysis and solution of linear system of equations. A description can be found in the document http://www.netlib.org/utk/people/JackDongarra/PAPERS/hplpaper.pdf.
LINPACK can be used to measure the speed of a computer during the solution of an N–dimensional linear system of equations. The result is specified in GFlops (Giga Floating Point Operations per Second). It is a measure of how many floating-point operations can be carried out per second. The number of floating-point operations required for the solution is determined by the formula
2/3 × N
3 + 2 × N
2.
For the calculation LINPACK requires a matrix of size N × N in the main memory with the value N standing for the number of equations to be solved. Maximum performance is achieved if the available main memory can be fully used as a result of choosing this value. However, the determination of this limit is very time-consuming and the expected increase in the result is only minor. The memory bandwidth of the system also has hardly any impact on the result, because floating-point calculations are chiefly carried out during the run and data exchange only seldom takes place between the parallel processes. Thus the benchmark result is determined for a value of N that is somewhat below the maximum value.
LINPACK is classed as one of the leading benchmarks in the field of high performance computing (HPC). LINPACK is one of the seven benchmarks currently included in the HPC Challenge benchmark suite, which takes other performance aspects in the HPC environment into account.
It is possible to publish LINPACK results at http://www.top500.org/. Prerequisite for this is the use of an MPI-based (Message Passing Interface) version. (See: http://www.netlib.org/benchmark/hpl)
The maximum theoretical performance of a processor core follows from the number of floating-point operations that are performed within a clock cycle. Thus e.g. a processor with a clocking frequency of 2.4 GHz and 4 floating-point operations per cycle would achieve a maximum performance of 9.6 GFlops. The ratio of the measured result to the maximum value shows the efficiency of the system for floating-point calculations. The fewer memory accesses required during the calculation, the better the ratio. Experience shows that current processor architectures achieve approximately 90%.
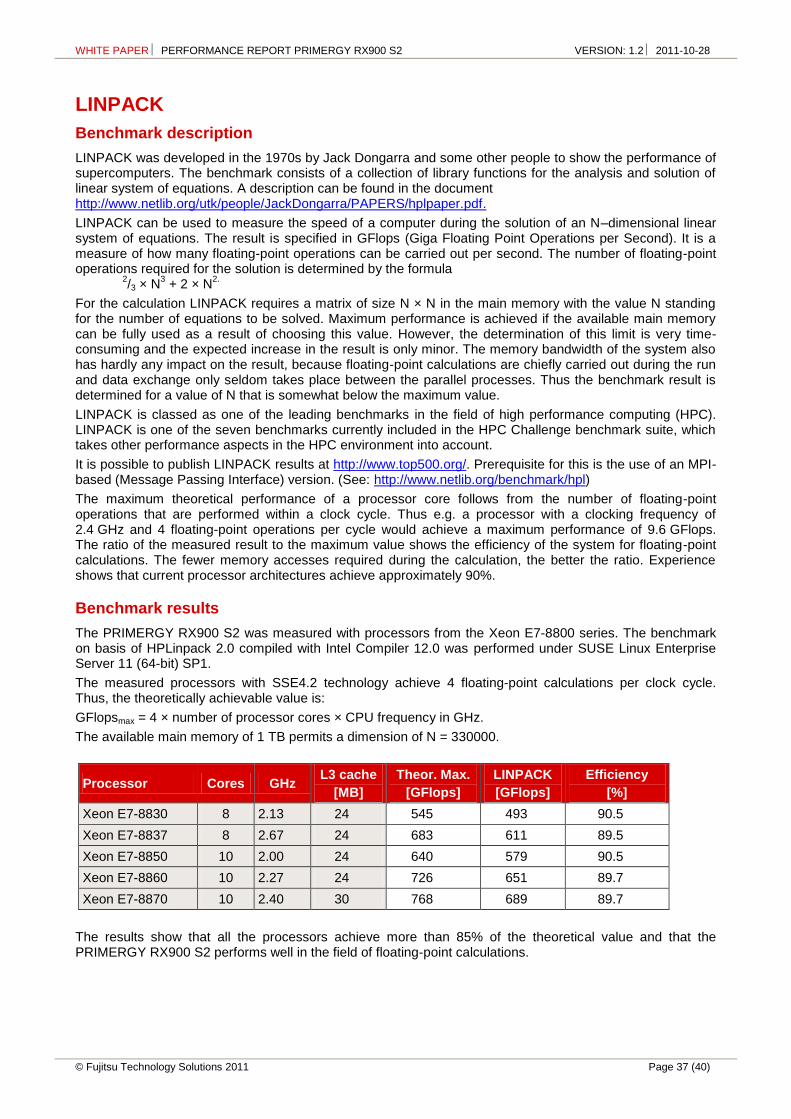
Benchmark results
The PRIMERGY RX900 S2 was measured with processors from the Xeon E7-8800 series. The benchmark on basis of HPLinpack 2.0 compiled with Intel Compiler 12.0 was performed under SUSE Linux Enterprise Server 11 (64-bit) SP1.
The measured processors with SSE4.2 technology achieve 4 floating-point calculations per clock cycle. Thus, the theoretically achievable value is:
GFlopsmax = 4 × number of processor cores × CPU frequency in GHz.
The available main memory of 1 TB permits a dimension of N = 330000.
Processor Cores GHz L3 cache
[MB]
Theor. Max.
[GFlops]
LINPACK
[GFlops]
Efficiency
[%]
Xeon E7-8830 8 2.13 24 545 493 90.5
Xeon E7-8837 8 2.67 24 683 611 89.5
Xeon E7-8850 10 2.00 24 640 579 90.5
Xeon E7-8860 10 2.27 24 726 651 89.7
Xeon E7-8870 10 2.40 30 768 689 89.7
The results show that all the processors achieve more than 85% of the theoretical value and that the PRIMERGY RX900 S2 performs well in the field of floating-point calculations.

WHITE PAPER PERFORMANCE REPORT PRIMERGY RX900 S2 VERSION: 1.2 2011-10-28
Page 38 (40) © Fujitsu Technology Solutions 2011
The following diagram illustrates the throughput of the PRIMERGY RX900 S2 in comparison to its predecessor, the PRIMERGY RX900 S1, in its most performant configuration.
Benchmark environment
All LINPACK measurements were based on a PRIMERGY RX900 S2 with the following hardware and software configuration:
Hardware
Model PRIMERGY RX900 S2
CPU Xeon E7-8830, E7-8837, E7-8850, E7-8860, E7-8870
Number of cores
8 chips:
Xeon E7-8830, E7-8837: 64 cores All others: 80 cores
Primary cache 32 kB instruction + 32 kB data on chip, per core
Secondary cache 256 kB on chip, per core
Other cache Xeon E7-8870: 30 MB (I+D) on chip, per chip All others: 24 MB (I+D) on chip, per chip
Memory 128 × 8 GB PC3-8500R DDR3-SDRAM
Software
Operating system SUSE Linux Enterprise Server 11 (64-bit) SP1
Benchmark HPLinpack 2.0, Intel Compiler 12.0
Some components may not be available in all countries or sales regions.
0
100
200
300
400
500
600
700
PRIMERGY RX900 S18 × Xeon X7560
PRIMERGY RX900 S28 × Xeon E7-8870
510
689GFlops
SPECcpu2006: floating-point performance PRIMERGY TX200 S6 vs. predecessor
LINPACK: PRIMERGY RX900S2 vs. predecessor
WHITE PAPER PERFORMANCE REPORT PRIMERGY RX900 S2 VERSION: 1.2 2011-10-28
© Fujitsu Technology Solutions 2011 Page 39 (40)
Literature
PRIMERGY Systems
http://ts.fujitsu.com/primergy
PRIMERGY RX900 S2
Data sheet http://docs.ts.fujitsu.com/dl.aspx?id=6f788cb9-7ac3-4841-b1db-19e099732737
Memory Performance of Xeon E7-8800 / 4800 / 2800 (Westmere-EX) Based Systems http://docs.ts.fujitsu.com/dl.aspx?id=b6b47119-6ebd-4c54-921d-0e70d37ea375
PRIMERGY Performance
http://ts.fujitsu.com/products/standard_servers/primergy_bov.html
LINPACK
http://www.netlib.org/linpack/
OLTP-2
Benchmark Overview OLTP-2 http://docs.ts.fujitsu.com/dl.aspx?id=e6f7a4c9-aff6-4598-b199-836053214d3f
SPECcpu2006
http://www.spec.org/osg/cpu2006
Benchmark overview SPECcpu2006 http://docs.ts.fujitsu.com/dl.aspx?id=1a427c16-12bf-41b0-9ca3-4cc360ef14ce
SPECjbb2005
http://www.spec.org/jbb2005
Benchmark overview SPECjbb2005 http://docs.ts.fujitsu.com/dl.aspx?id=5411e8f9-8c56-4ee9-9b3b-98981ab3e820
STREAM
http://www.cs.virginia.edu/stream/
TPC-E with TPC-Energy
http://www.tpc.org/tpce
Benchmark Overview TPC-E http://docs.ts.fujitsu.com/dl.aspx?id=da0ce7b7-3d80-48cd-9b3a-d12e0b40ed6d
VMmark V2
Benchmark Overview VMmark V2 http://docs.ts.fujitsu.com/dl.aspx?id=2b61a08f-52f4-4067-bbbf-dc0b58bee1bd
VMmark V2 http://www.vmmark.com
VMmark V2 Results http://www.vmware.com/a/vmmark/
vServCon
Benchmark Overview vServCon http://docs.ts.fujitsu.com/dl.aspx?id=b953d1f3-6f98-4b93-95f5-8c8ba3db4e59
WHITE PAPER PERFORMANCE REPORT PRIMERGY RX900 S2 VERSION: 1.2 2011-10-28
Page 40 (40) © Fujitsu Technology Solutions 2011
Contact
FUJITSU Technology Solutions
Website: http://ts.fujitsu.com
PRIMERGY Product Marketing
mailto:[email protected]
PRIMERGY Performance and Benchmarks
mailto:[email protected]
All rights reserved, including intellectual property rights. Technical data subject to modifications and delivery subject to availability. Any liability that the data and illustrations are complete, actual or correct is excluded. Designations may be trademarks and/or copyrights of the respective manufacturer, the use of which by third parties for their own purposes may infringe the rights of such owner. For further information see http://ts.fujitsu.com/terms_of_use.html
2011-10-28 WW EN Copyright © Fujitsu Technology Solutions GmbH 2011
![PRIMERGY BX600 Start Guide - Fujitsu Global for this server are stored in the PRIMERGY Startup Disc. Insert the PRIMERGY Startup Disc and click [PRIMERGY Manuals] on the [PRIMERGY](https://img.pdfslide.us/doc/110x75/5aff609a7f8b9a68498fad97/primergy-bx600-start-guide-fujitsu-global-for-this-server-are-stored-in-the-primergy.jpg)