Embed Size (px)
Citation preview
WHITE PAPER PERFORMANCE REPORT PRIMERGY RX600 S5
© Fujitsu Technology Solutions 2010-2011 Page 1 (38)
WHITE PAPER FUJITSU PRIMERGY SERVERS PERFORMANCE REPORT PRIMERGY RX600 S5
This document contains a summary of the benchmarks executed for the PRIMERGY RX600 S5.
The PRIMERGY RX600 S5 performance data are compared with the data of other PRIMERGY models and discussed. In addition to the benchmark results, an explanation has been included for each benchmark and for the benchmark environment.
Version
1.4
2011-06-30
Contents
Document history ................................... 2
Technical data ........................................ 3
SPECcpu2006 ........................................ 4
SPECjbb2005 ....................................... 10
OLTP-2 ................................................. 13
TPC-E ................................................... 18
SAP SD ................................................ 21
SAP BI-D .............................................. 24
vServCon .............................................. 26
VMmark V1 ........................................... 32
Literature .............................................. 37
Contact ................................................. 38
WHITE PAPER PERFORMANCE REPORT PRIMERGY RX600 S5 VERSION: 1.4 2011-06-30
Page 2 (38) © Fujitsu Technology Solutions 2010-2011
Document history
Version 1.0
First report version including the benchmark chapters
SPECcpu2006 Measurements with Xeon E7520, E7530, L7545, E7540, X7542, X7550, L7555 and X7560
SPECjbb2005 Measurement with Xeon X7560
TPC-E Measurement with Xeon X7560
SAP SD Certification number 2010017
VMmark V1 Measurement with Xeon X7560
Version 1.1
New benchmark chapters:
vServCon Measurements with Xeon E7520, E7530, L7545, E7540, X7542, L7555, X7550 and X7560
Version 1.2
New benchmark chapters:
OLTP-2 Results for Xeon E7520, E7530, E7540, L7545, L7555, X7542, X7550, X7560
Updated benchmark chapters:
VMmark V1 New measurements with Xeon E7540 and Xeon X7560
Version 1.3
New benchmark chapters:
SAP BI-D Certification number 2010011 and 2010024
Version 1.4
Updated benchmark chapters:
SAP SD Certification number 2011013
WHITE PAPER PERFORMANCE REPORT PRIMERGY RX600 S5 VERSION: 1.4 2011-06-30
© Fujitsu Technology Solutions 2010-2011 Page 3 (38)
Technical data
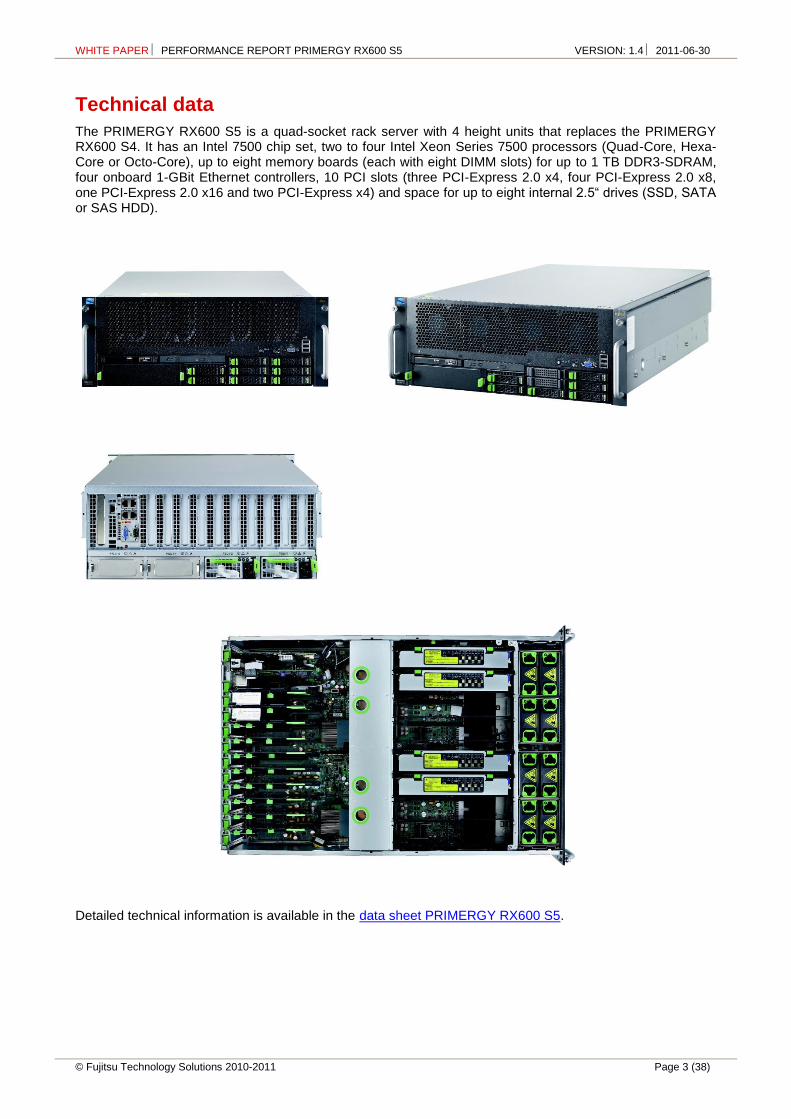
The PRIMERGY RX600 S5 is a quad-socket rack server with 4 height units that replaces the PRIMERGY RX600 S4. It has an Intel 7500 chip set, two to four Intel Xeon Series 7500 processors (Quad-Core, Hexa-Core or Octo-Core), up to eight memory boards (each with eight DIMM slots) for up to 1 TB DDR3-SDRAM, four onboard 1-GBit Ethernet controllers, 10 PCI slots (three PCI-Express 2.0 x4, four PCI-Express 2.0 x8, one PCI-Express 2.0 x16 and two PCI-Express x4) and space for up to eight internal 2.5“ drives (SSD, SATA or SAS HDD).
Detailed technical information is available in the data sheet PRIMERGY RX600 S5.
WHITE PAPER PERFORMANCE REPORT PRIMERGY RX600 S5 VERSION: 1.4 2011-06-30
Page 4 (38) © Fujitsu Technology Solutions 2010-2011
SPECcpu2006
Benchmark description
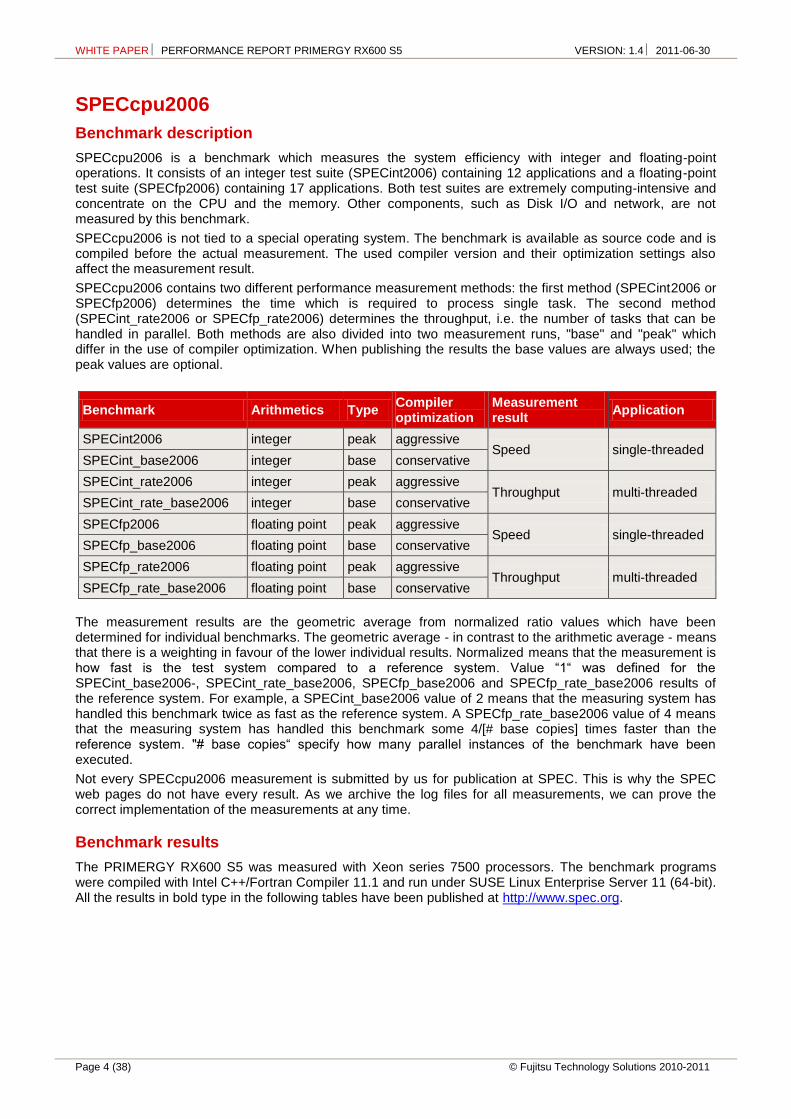
SPECcpu2006 is a benchmark which measures the system efficiency with integer and floating-point operations. It consists of an integer test suite (SPECint2006) containing 12 applications and a floating-point test suite (SPECfp2006) containing 17 applications. Both test suites are extremely computing-intensive and concentrate on the CPU and the memory. Other components, such as Disk I/O and network, are not measured by this benchmark.
SPECcpu2006 is not tied to a special operating system. The benchmark is available as source code and is compiled before the actual measurement. The used compiler version and their optimization settings also affect the measurement result.
SPECcpu2006 contains two different performance measurement methods: the first method (SPECint2006 or SPECfp2006) determines the time which is required to process single task. The second method (SPECint_rate2006 or SPECfp_rate2006) determines the throughput, i.e. the number of tasks that can be handled in parallel. Both methods are also divided into two measurement runs, "base" and "peak" which differ in the use of compiler optimization. When publishing the results the base values are always used; the peak values are optional.
Benchmark Arithmetics Type Compiler optimization
Measurement result
Application
SPECint2006 integer peak aggressive Speed single-threaded
SPECint_base2006 integer base conservative
SPECint_rate2006 integer peak aggressive Throughput multi-threaded
SPECint_rate_base2006 integer base conservative
SPECfp2006 floating point peak aggressive Speed single-threaded
SPECfp_base2006 floating point base conservative
SPECfp_rate2006 floating point peak aggressive Throughput multi-threaded
SPECfp_rate_base2006 floating point base conservative
The measurement results are the geometric average from normalized ratio values which have been determined for individual benchmarks. The geometric average - in contrast to the arithmetic average - means that there is a weighting in favour of the lower individual results. Normalized means that the measurement is how fast is the test system compared to a reference system. Value “1“ was defined for the SPECint_base2006-, SPECint_rate_base2006, SPECfp_base2006 and SPECfp_rate_base2006 results of the reference system. For example, a SPECint_base2006 value of 2 means that the measuring system has handled this benchmark twice as fast as the reference system. A SPECfp_rate_base2006 value of 4 means that the measuring system has handled this benchmark some 4/[# base copies] times faster than the reference system. "# base copies“ specify how many parallel instances of the benchmark have been executed.
Not every SPECcpu2006 measurement is submitted by us for publication at SPEC. This is why the SPEC web pages do not have every result. As we archive the log files for all measurements, we can prove the correct implementation of the measurements at any time.
Benchmark results
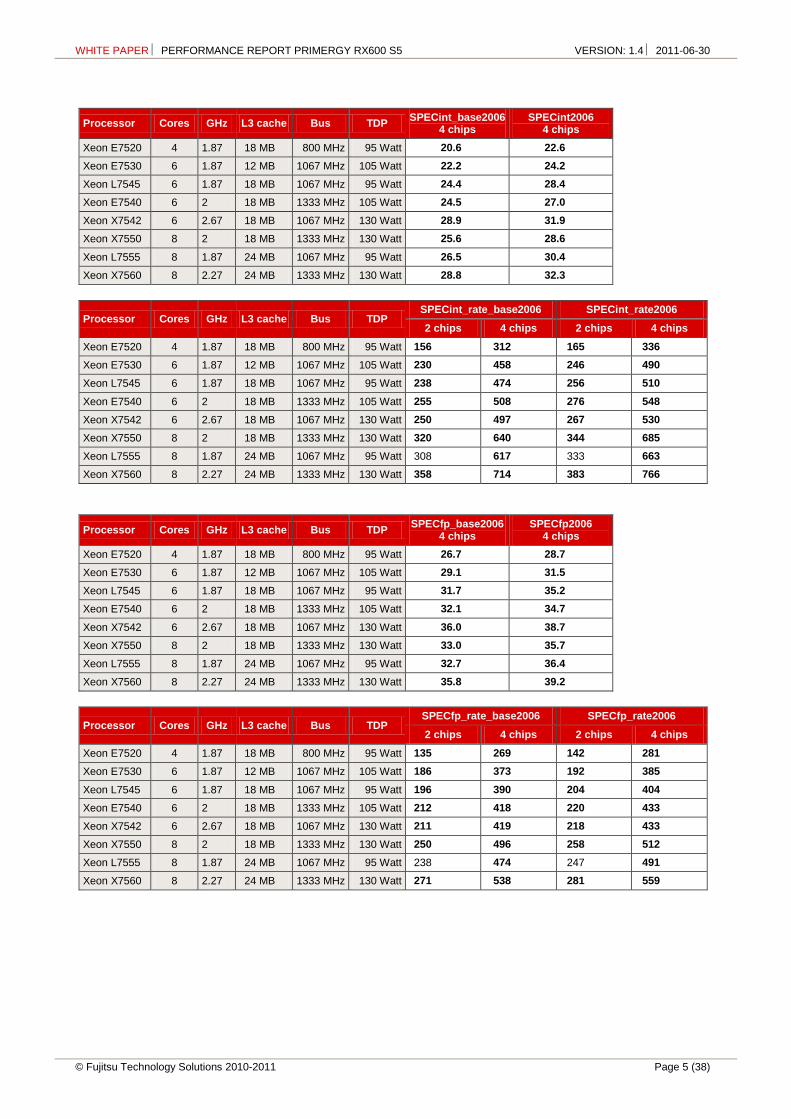
The PRIMERGY RX600 S5 was measured with Xeon series 7500 processors. The benchmark programs were compiled with Intel C++/Fortran Compiler 11.1 and run under SUSE Linux Enterprise Server 11 (64-bit). All the results in bold type in the following tables have been published at http://www.spec.org.
WHITE PAPER PERFORMANCE REPORT PRIMERGY RX600 S5 VERSION: 1.4 2011-06-30
© Fujitsu Technology Solutions 2010-2011 Page 5 (38)
Processor Cores GHz L3 cache Bus TDP SPECint_base2006
4 chips SPECint2006
4 chips
Xeon E7520 4 1.87 18 MB 800 MHz 95 Watt 20.6 22.6
Xeon E7530 6 1.87 12 MB 1067 MHz 105 Watt 22.2 24.2
Xeon L7545 6 1.87 18 MB 1067 MHz 95 Watt 24.4 28.4
Xeon E7540 6 2 18 MB 1333 MHz 105 Watt 24.5 27.0
Xeon X7542 6 2.67 18 MB 1067 MHz 130 Watt 28.9 31.9
Xeon X7550 8 2 18 MB 1333 MHz 130 Watt 25.6 28.6
Xeon L7555 8 1.87 24 MB 1067 MHz 95 Watt 26.5 30.4
Xeon X7560 8 2.27 24 MB 1333 MHz 130 Watt 28.8 32.3
Processor Cores GHz L3 cache Bus TDP SPECint_rate_base2006 SPECint_rate2006
2 chips 4 chips 2 chips 4 chips
Xeon E7520 4 1.87 18 MB 800 MHz 95 Watt 156 312 165 336
Xeon E7530 6 1.87 12 MB 1067 MHz 105 Watt 230 458 246 490
Xeon L7545 6 1.87 18 MB 1067 MHz 95 Watt 238 474 256 510
Xeon E7540 6 2 18 MB 1333 MHz 105 Watt 255 508 276 548
Xeon X7542 6 2.67 18 MB 1067 MHz 130 Watt 250 497 267 530
Xeon X7550 8 2 18 MB 1333 MHz 130 Watt 320 640 344 685
Xeon L7555 8 1.87 24 MB 1067 MHz 95 Watt 308 617 333 663
Xeon X7560 8 2.27 24 MB 1333 MHz 130 Watt 358 714 383 766
Processor Cores GHz L3 cache Bus TDP SPECfp_base2006
4 chips SPECfp2006
4 chips
Xeon E7520 4 1.87 18 MB 800 MHz 95 Watt 26.7 28.7
Xeon E7530 6 1.87 12 MB 1067 MHz 105 Watt 29.1 31.5
Xeon L7545 6 1.87 18 MB 1067 MHz 95 Watt 31.7 35.2
Xeon E7540 6 2 18 MB 1333 MHz 105 Watt 32.1 34.7
Xeon X7542 6 2.67 18 MB 1067 MHz 130 Watt 36.0 38.7
Xeon X7550 8 2 18 MB 1333 MHz 130 Watt 33.0 35.7
Xeon L7555 8 1.87 24 MB 1067 MHz 95 Watt 32.7 36.4
Xeon X7560 8 2.27 24 MB 1333 MHz 130 Watt 35.8 39.2
Processor Cores GHz L3 cache Bus TDP SPECfp_rate_base2006 SPECfp_rate2006
2 chips 4 chips 2 chips 4 chips
Xeon E7520 4 1.87 18 MB 800 MHz 95 Watt 135 269 142 281
Xeon E7530 6 1.87 12 MB 1067 MHz 105 Watt 186 373 192 385
Xeon L7545 6 1.87 18 MB 1067 MHz 95 Watt 196 390 204 404
Xeon E7540 6 2 18 MB 1333 MHz 105 Watt 212 418 220 433
Xeon X7542 6 2.67 18 MB 1067 MHz 130 Watt 211 419 218 433
Xeon X7550 8 2 18 MB 1333 MHz 130 Watt 250 496 258 512
Xeon L7555 8 1.87 24 MB 1067 MHz 95 Watt 238 474 247 491
Xeon X7560 8 2.27 24 MB 1333 MHz 130 Watt 271 538 281 559
WHITE PAPER PERFORMANCE REPORT PRIMERGY RX600 S5 VERSION: 1.4 2011-06-30
Page 6 (38) © Fujitsu Technology Solutions 2010-2011
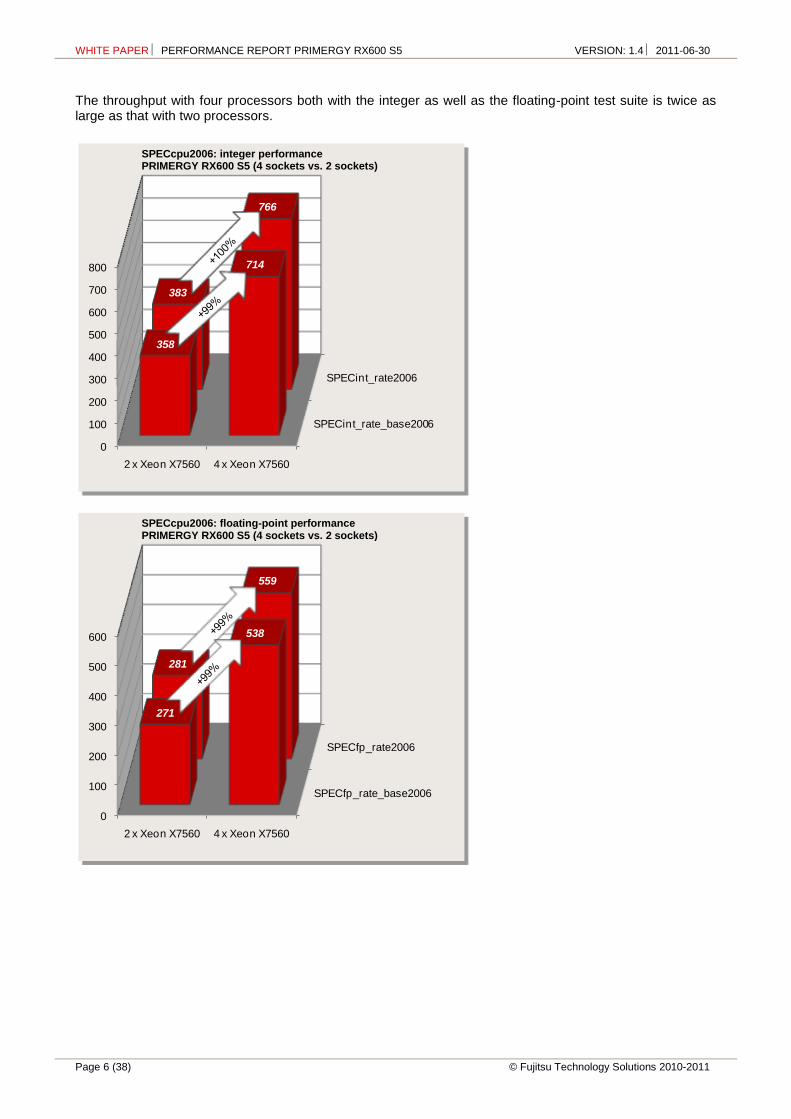
The throughput with four processors both with the integer as well as the floating-point test suite is twice as large as that with two processors.
SPECint_rate_base2006
SPECint_rate2006
0
100
200
300
400
500
600
700
800
2 x Xeon X7560 4 x Xeon X7560
358
714
383
766
SPECfp_rate_base2006
SPECfp_rate2006
0
100
200
300
400
500
600
2 x Xeon X7560 4 x Xeon X7560
271
538
281
559
SPECcpu2006: floating-point performance PRIMERGY RX600 S5 (4 sockets vs. 2 sockets)
SPECcpu2006: floating-point performance PRIMERGY RX600 S5 (4 sockets vs. 2 sockets)
SPECcpu2006: integer performance PRIMERGY RX600 S5 (4 sockets vs. 2 sockets)
WHITE PAPER PERFORMANCE REPORT PRIMERGY RX600 S5 VERSION: 1.4 2011-06-30
© Fujitsu Technology Solutions 2010-2011 Page 7 (38)
SPECint_base2006
SPECint2006
0
5
10
15
20
25
30
35
PRIMERGY RX600 S44 x Xeon X7460
PRIMERGY RX600 S54 x Xeon X7542
PRIMERGY RX600 S54 x Xeon X7560
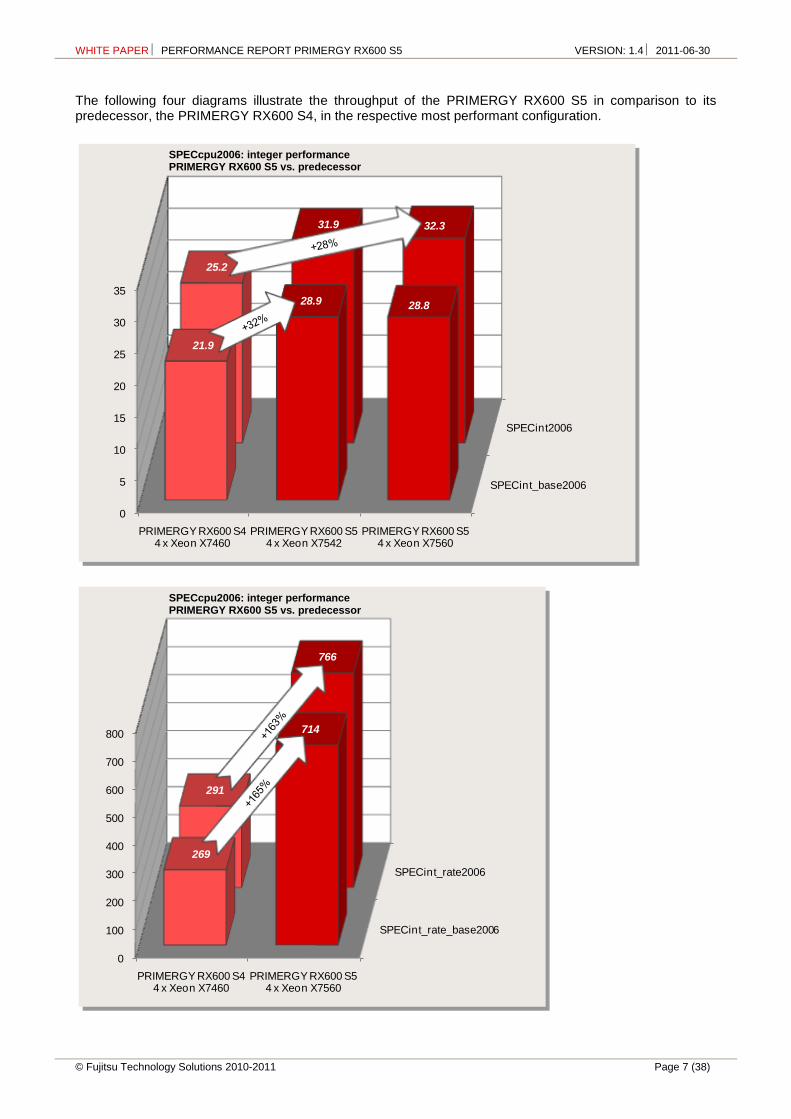
21.9
28.9 28.8
25.2
31.9 32.3
The following four diagrams illustrate the throughput of the PRIMERGY RX600 S5 in comparison to its predecessor, the PRIMERGY RX600 S4, in the respective most performant configuration.
SPECint_rate_base2006
SPECint_rate2006
0
100
200
300
400
500
600
700
800
PRIMERGY RX600 S44 x Xeon X7460
PRIMERGY RX600 S54 x Xeon X7560
269
714
291
766
SPECcpu2006: integer performance PRIMERGY RX600 S5 vs. predecessor
SPECcpu2006: integer performance PRIMERGY RX600 S5 vs. predecessor
WHITE PAPER PERFORMANCE REPORT PRIMERGY RX600 S5 VERSION: 1.4 2011-06-30
Page 8 (38) © Fujitsu Technology Solutions 2010-2011
SPECfp_base2006
SPECfp2006
0
5
10
15
20
25
30
35
40
PRIMERGY RX600 S44 x Xeon X7460
PRIMERGY RX600 S54 x Xeon X7542
PRIMERGY RX600 S54 x Xeon X7560
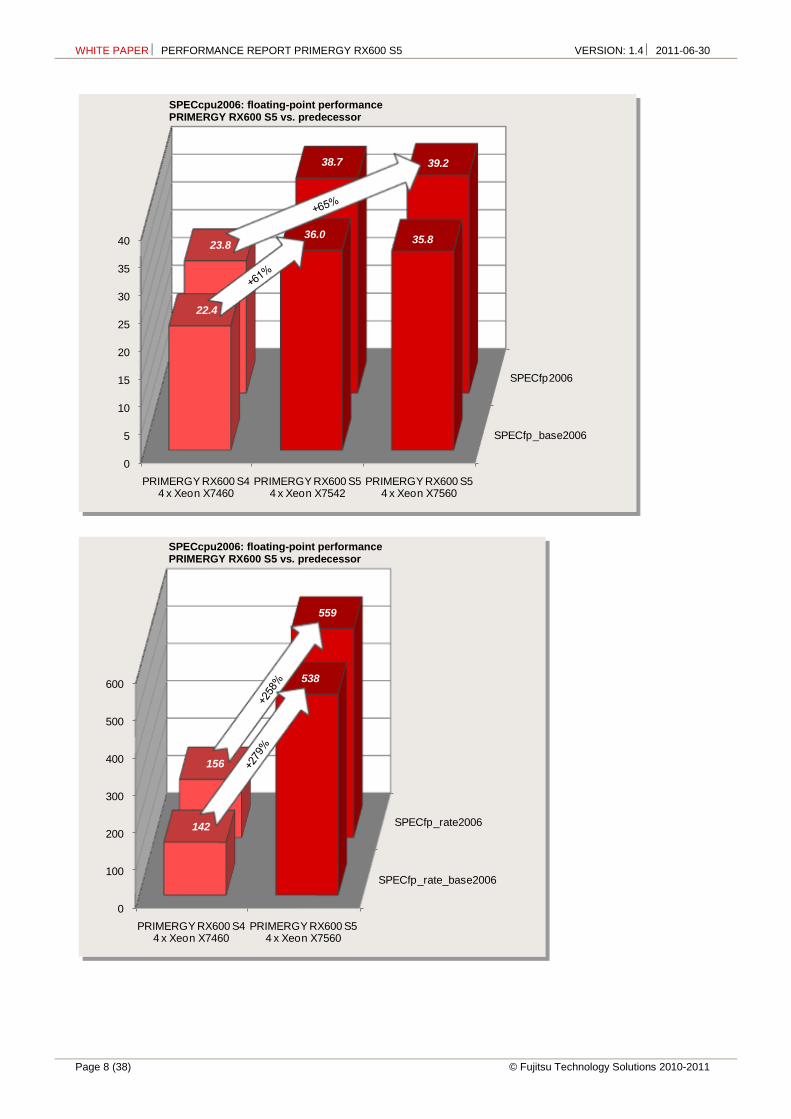
22.4
36.0 35.823.8
38.7 39.2
SPECfp_rate_base2006
SPECfp_rate2006
0
100
200
300
400
500
600
PRIMERGY RX600 S44 x Xeon X7460
PRIMERGY RX600 S54 x Xeon X7560
142
538
156
559
SPECcpu2006: floating-point performance PRIMERGY RX600 S5 vs. predecessor
SPECcpu2006: floating-point performance PRIMERGY RX600 S5 vs. predecessor
WHITE PAPER PERFORMANCE REPORT PRIMERGY RX600 S5 VERSION: 1.4 2011-06-30
© Fujitsu Technology Solutions 2010-2011 Page 9 (38)
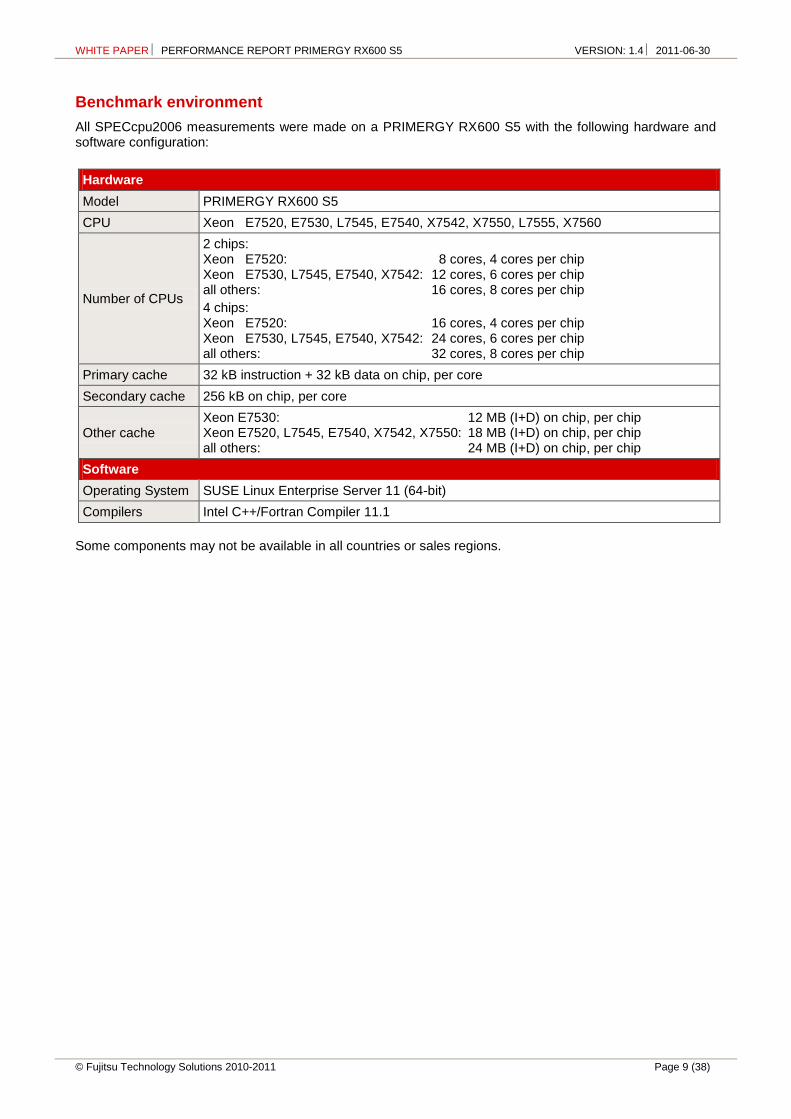
Benchmark environment
All SPECcpu2006 measurements were made on a PRIMERGY RX600 S5 with the following hardware and software configuration:
Hardware
Model PRIMERGY RX600 S5
CPU Xeon E7520, E7530, L7545, E7540, X7542, X7550, L7555, X7560
Number of CPUs
2 chips: Xeon E7520: 8 cores, 4 cores per chip Xeon E7530, L7545, E7540, X7542: 12 cores, 6 cores per chip all others: 16 cores, 8 cores per chip
4 chips: Xeon E7520: 16 cores, 4 cores per chip Xeon E7530, L7545, E7540, X7542: 24 cores, 6 cores per chip all others: 32 cores, 8 cores per chip
Primary cache 32 kB instruction + 32 kB data on chip, per core
Secondary cache 256 kB on chip, per core
Other cache Xeon E7530: 12 MB (I+D) on chip, per chip Xeon E7520, L7545, E7540, X7542, X7550: 18 MB (I+D) on chip, per chip all others: 24 MB (I+D) on chip, per chip
Software
Operating System SUSE Linux Enterprise Server 11 (64-bit)
Compilers Intel C++/Fortran Compiler 11.1
Some components may not be available in all countries or sales regions.
WHITE PAPER PERFORMANCE REPORT PRIMERGY RX600 S5 VERSION: 1.4 2011-06-30
Page 10 (38) © Fujitsu Technology Solutions 2010-2011
SPECjbb2005
Benchmark description
SPECjbb2005 is a Java business benchmark that focuses on the performance of Java Server platforms. SPECjbb2005 is essentially a modernized SPECjbb2000. The main differences are:
The transactions have become more complex in order to cover a greater functional scope. The working set of the benchmark has been enlarged to the extent that the total system load has
increased. SPECjbb2000 allows only one active Java Virtual Machine instance (JVM) whereas SPECjbb2005
permits several instances, which in turn achieves greater closeness to reality, particularly with large systems.
On the software side SPECjbb2005 primarily measures the performance of the JVM used with its just-in-time compiler as well as their thread and garbage collection implementation. Some aspects of the operating system used also play a role. As far as hardware is concerned, it measures the efficiency of the CPUs and caches, the memory subsystem and the scalability of shared memory systems (SMP). Disk and network I/O are irrelevant.
SPECjbb2005 emulates a 3-tier client/server system that is typical for modern business process applications with the emphasis on the middle-tier system:
Clients generate the load, consisting of driver threads, which on the basis of TPC-C benchmark generate OLTP accesses to a database without thinking times.
The middle tier system implements the business processes and the updating of the database. The database takes on the data management and is emulated by Java objects that are in the
memory. Transaction logging is implemented on an XML basis.
The major advantage of this benchmark is that it includes all three tiers that run together on a single host. The performance of the middle-tier is measured. Large-scale hardware installations are thus avoided and direct comparisons between the SPECjbb2005 results from the various systems are possible. Client and database emulation are also written in Java.
SPECjbb2005 only needs the operating system as well as a Java Virtual Machine with J2SE 5.0 features.
The scaling unit is a warehouse with approx. 25 MB Java objects. Precisely one Java thread per warehouse executes the operations on these objects. The business operations are assumed by TPC-C:
New Order Entry Payment Order Status Inquiry Delivery Stock Level Supervision Customer Report
However, these are the only features SPECjbb2005 and TPC-C have in common. The results of the two benchmarks are not comparable.
SPECjbb2005 has 2 performance metrics:
bops (business operations per second) is the overall rate of all business operations performed per second.
bops/JVM is the ratio of the first metrics and the number of active JVM instances.
In comparisons of various SPECjbb2005 results, both metrics must be specified.
The following rules, according to which a compliant benchmark run has to be performed, are the basis for these three metrics:
A compliant benchmark run consists of a sequence of measuring points with an increasing number of warehouses (and thus of threads) with the number in each case being increased by one warehouse. The run is started at one warehouse up through 2*MaxWh, but not less than 8 warehouses. MaxWh is the number of warehouses with the highest rate per second the benchmark expects. Per default the benchmark equates MaxWh with the number of CPUs visible by the operating system.
The metric bops is the arithmetic average of all measured operation rates with MaxWh warehouses up to 2*MaxWh warehouses.
WHITE PAPER PERFORMANCE REPORT PRIMERGY RX600 S5 VERSION: 1.4 2011-06-30
© Fujitsu Technology Solutions 2010-2011 Page 11 (38)
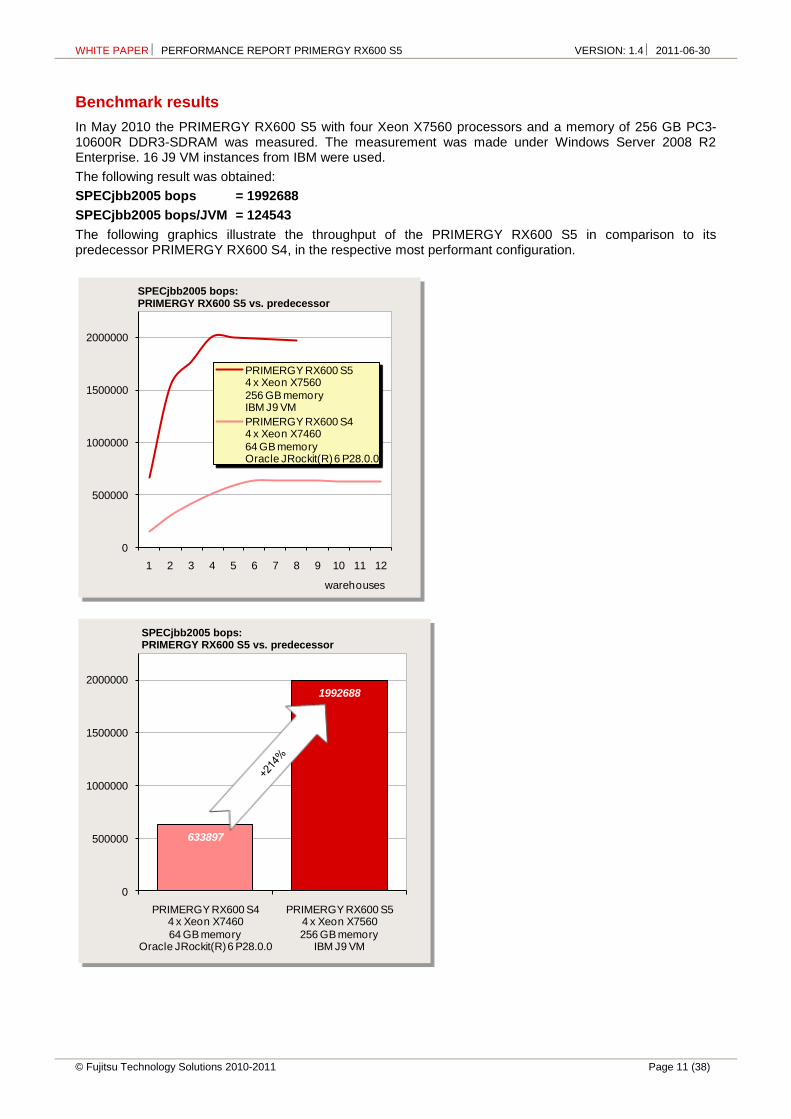
Benchmark results
In May 2010 the PRIMERGY RX600 S5 with four Xeon X7560 processors and a memory of 256 GB PC3-10600R DDR3-SDRAM was measured. The measurement was made under Windows Server 2008 R2 Enterprise. 16 J9 VM instances from IBM were used.
The following result was obtained:
SPECjbb2005 bops = 1992688
SPECjbb2005 bops/JVM = 124543
The following graphics illustrate the throughput of the PRIMERGY RX600 S5 in comparison to its predecessor PRIMERGY RX600 S4, in the respective most performant configuration.
0
500000
1000000
1500000
2000000
1 2 3 4 5 6 7 8 9 10 11 12
warehouses
PRIMERGY RX600 S54 x Xeon X7560
256 GB memoryIBM J9 VM
PRIMERGY RX600 S44 x Xeon X7460
64 GB memoryOracle JRockit(R) 6 P28.0.0
633897
1992688
0
500000
1000000
1500000
2000000
PRIMERGY RX600 S44 x Xeon X7460
64 GB memoryOracle JRockit(R) 6 P28.0.0
PRIMERGY RX600 S54 x Xeon X7560
256 GB memoryIBM J9 VM
SPECjbb2005 bops: PRIMERGY RX600 S5 vs. predecessor
SPECjbb2005 bops: PRIMERGY RX600 S5 vs. predecessor
WHITE PAPER PERFORMANCE REPORT PRIMERGY RX600 S5 VERSION: 1.4 2011-06-30
Page 12 (38) © Fujitsu Technology Solutions 2010-2011
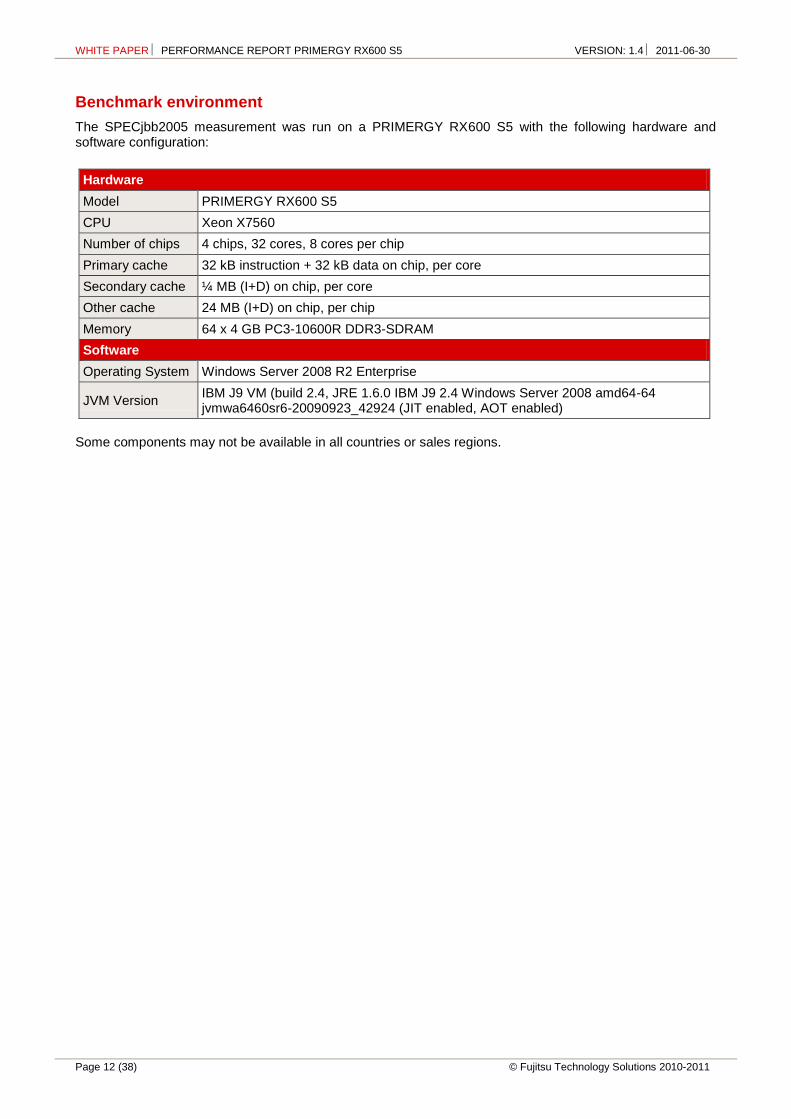
Benchmark environment
The SPECjbb2005 measurement was run on a PRIMERGY RX600 S5 with the following hardware and software configuration:
Hardware
Model PRIMERGY RX600 S5
CPU Xeon X7560
Number of chips 4 chips, 32 cores, 8 cores per chip
Primary cache 32 kB instruction + 32 kB data on chip, per core
Secondary cache ¼ MB (I+D) on chip, per core
Other cache 24 MB (I+D) on chip, per chip
Memory 64 x 4 GB PC3-10600R DDR3-SDRAM
Software
Operating System Windows Server 2008 R2 Enterprise
JVM Version IBM J9 VM (build 2.4, JRE 1.6.0 IBM J9 2.4 Windows Server 2008 amd64-64 jvmwa6460sr6-20090923_42924 (JIT enabled, AOT enabled)
Some components may not be available in all countries or sales regions.
WHITE PAPER PERFORMANCE REPORT PRIMERGY RX600 S5 VERSION: 1.4 2011-06-30
© Fujitsu Technology Solutions 2010-2011 Page 13 (38)
OLTP-2
Benchmark description
OLTP stands for Online Transaction Processing. The OLTP-2 benchmark is based on the typical application scenario of a database solution. In OLTP-2 database access is simulated and the number of transactions achieved per second (tps) determined as the unit of measurement for the system.
In contrast to benchmarks such as SPECint and TPC-E, which were standardized by independent bodies and for which adherence to the respective rules and regulations are monitored, OLTP-2 is an internal benchmark of Fujitsu. OLTP-2 is based on the well-known database benchmark TPC-E. OLTP-2 was designed in such a way that a wide range of configurations can be measured to present the scaling of a system with regard to the CPU and memory configuration.
Even if the two benchmarks OLTP-2 and TPC-E simulate similar application scenarios using the same load profiles, the results cannot be compared or even treated as equal, as the two benchmarks use different methods to simulate user load. OLTP-2 values are typically similar to TPC-E values. A direct comparison, or even referring to the OLTP-2 result as TPC-E, is not permitted, especially because there is no price-performance calculation.
Further information can be found in the document Benchmark Overview OLTP-2.
Benchmark results
The OLTP-2 values for the PRIMERGY RX600 S5 were determined for the Intel Xeon 75xx processor series with memory configurations of 64 GB, 128 GB, 256 GB and 512 GB. These results are based on the operating system Microsoft Windows Server 2008 R2 Enterprise x64 Edition and the database SQL Server 2008 R2 Enterprise x64 Edition. The database performance depends to a great degree on the configuration options of a system with hard disks and their controllers. Throughputs of the dimension specified here can be achieved if the typically external disk subsystem is not a bottleneck. Further information about the system configuration can be found in the section Benchmark environment.
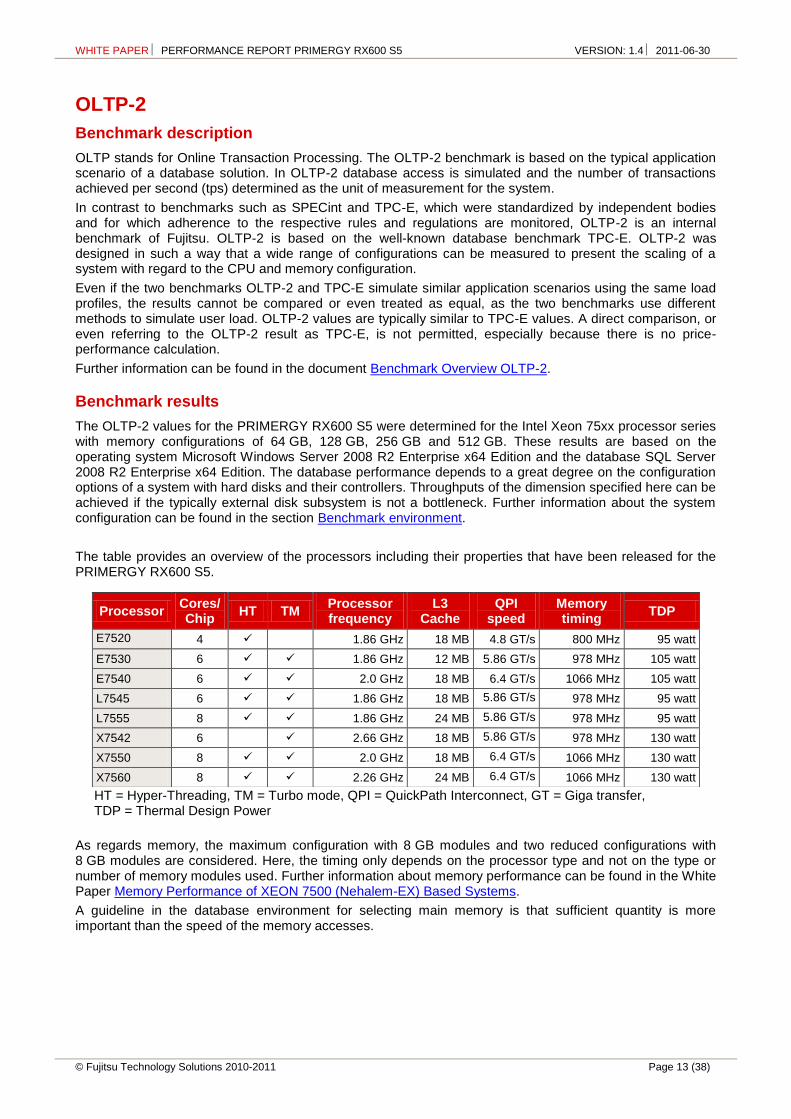
The table provides an overview of the processors including their properties that have been released for the PRIMERGY RX600 S5.
HT = Hyper-Threading, TM = Turbo mode, QPI = QuickPath Interconnect, GT = Giga transfer, TDP = Thermal Design Power
As regards memory, the maximum configuration with 8 GB modules and two reduced configurations with 8 GB modules are considered. Here, the timing only depends on the processor type and not on the type or number of memory modules used. Further information about memory performance can be found in the White Paper Memory Performance of XEON 7500 (Nehalem-EX) Based Systems.
A guideline in the database environment for selecting main memory is that sufficient quantity is more important than the speed of the memory accesses.
Processor Cores/ Chip
HT TM Processor frequency
L3 Cache
QPI speed
Memory timing
TDP
E7520 4 1.86 GHz 18 MB 4.8 GT/s 800 MHz 95 watt
E7530 6 1.86 GHz 12 MB 5.86 GT/s 978 MHz 105 watt
E7540 6 2.0 GHz 18 MB 6.4 GT/s 1066 MHz 105 watt
L7545 6 1.86 GHz 18 MB 5.86 GT/s 978 MHz 95 watt
L7555 8 1.86 GHz 24 MB 5.86 GT/s 978 MHz 95 watt
X7542 6 2.66 GHz 18 MB 5.86 GT/s 978 MHz 130 watt
X7550 8 2.0 GHz 18 MB 6.4 GT/s 1066 MHz 130 watt
X7560 8 2.26 GHz 24 MB 6.4 GT/s 1066 MHz 130 watt
WHITE PAPER PERFORMANCE REPORT PRIMERGY RX600 S5 VERSION: 1.4 2011-06-30
Page 14 (38) © Fujitsu Technology Solutions 2010-2011
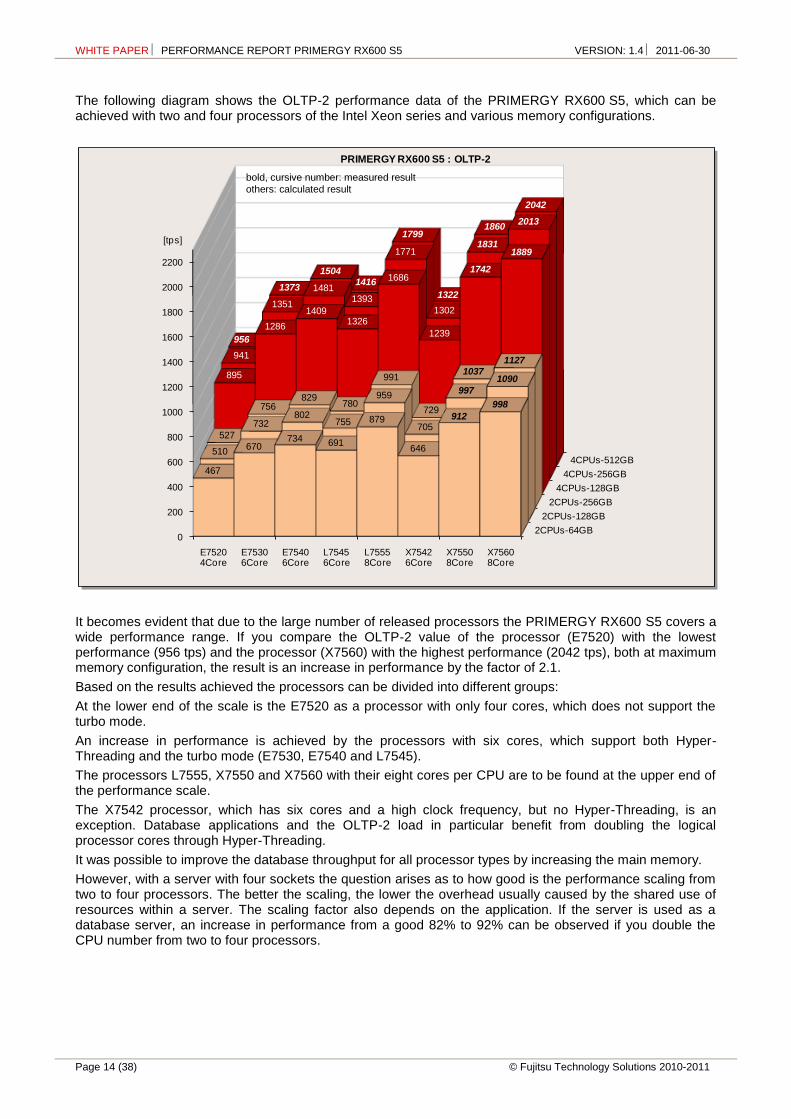
The following diagram shows the OLTP-2 performance data of the PRIMERGY RX600 S5, which can be achieved with two and four processors of the Intel Xeon series and various memory configurations.
It becomes evident that due to the large number of released processors the PRIMERGY RX600 S5 covers a wide performance range. If you compare the OLTP-2 value of the processor (E7520) with the lowest performance (956 tps) and the processor (X7560) with the highest performance (2042 tps), both at maximum memory configuration, the result is an increase in performance by the factor of 2.1.
Based on the results achieved the processors can be divided into different groups:
At the lower end of the scale is the E7520 as a processor with only four cores, which does not support the turbo mode.
An increase in performance is achieved by the processors with six cores, which support both Hyper-Threading and the turbo mode (E7530, E7540 and L7545).
The processors L7555, X7550 and X7560 with their eight cores per CPU are to be found at the upper end of the performance scale.
The X7542 processor, which has six cores and a high clock frequency, but no Hyper-Threading, is an exception. Database applications and the OLTP-2 load in particular benefit from doubling the logical processor cores through Hyper-Threading.
It was possible to improve the database throughput for all processor types by increasing the main memory.
However, with a server with four sockets the question arises as to how good is the performance scaling from two to four processors. The better the scaling, the lower the overhead usually caused by the shared use of resources within a server. The scaling factor also depends on the application. If the server is used as a database server, an increase in performance from a good 82% to 92% can be observed if you double the CPU number from two to four processors.
2CPUs-64GB
2CPUs-128GB
2CPUs-256GB
4CPUs-128GB
4CPUs-256GB
4CPUs-512GB
0
200
400
600
800
1000
1200
1400
1600
1800
2000
2200
E75204Core
E75306Core
E75406Core
L75456Core
L75558Core
X75426Core
X75508Core
X75608Core
467
670734 691
879
646
912
998
510
732802
755
959
705
997
1090
527
756829
780
991
729
1037
1127
895
1286
14091326
1686
1239
1742
1889
941
1351
14811393
1771
1302
1831
2013
956
1373
15041416
1799
1322
1860
2042
[tps]
PRIMERGY RX600 S5 : OLTP-2
bold, cursive number: measured result
others: calculated result
WHITE PAPER PERFORMANCE REPORT PRIMERGY RX600 S5 VERSION: 1.4 2011-06-30
© Fujitsu Technology Solutions 2010-2011 Page 15 (38)
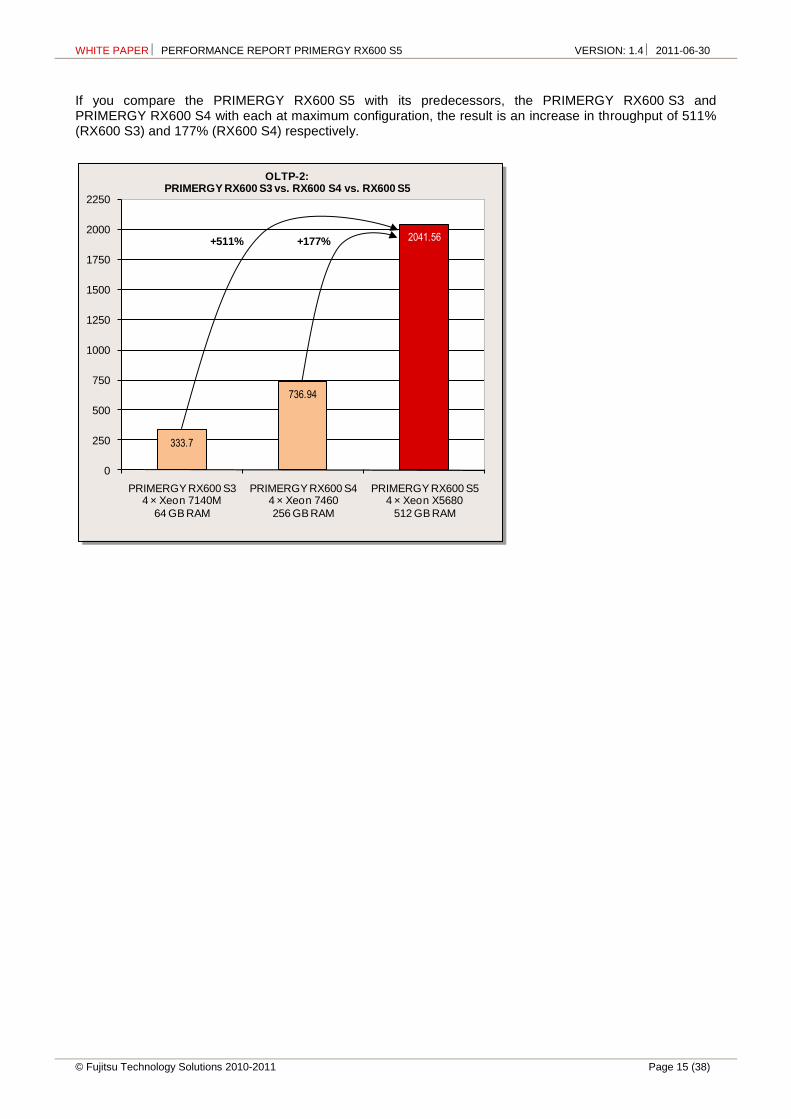
If you compare the PRIMERGY RX600 S5 with its predecessors, the PRIMERGY RX600 S3 and PRIMERGY RX600 S4 with each at maximum configuration, the result is an increase in throughput of 511% (RX600 S3) and 177% (RX600 S4) respectively.
333.7
736.94
2041.56
0
250
500
750
1000
1250
1500
1750
2000
2250
PRIMERGY RX600 S34 × Xeon 7140M
64 GB RAM
PRIMERGY RX600 S44 × Xeon 7460
256 GB RAM
PRIMERGY RX600 S54 × Xeon X5680
512 GB RAM
OLTP-2:PRIMERGY RX600 S3 vs. RX600 S4 vs. RX600 S5
+177%+511%
WHITE PAPER PERFORMANCE REPORT PRIMERGY RX600 S5 VERSION: 1.4 2011-06-30
Page 16 (38) © Fujitsu Technology Solutions 2010-2011
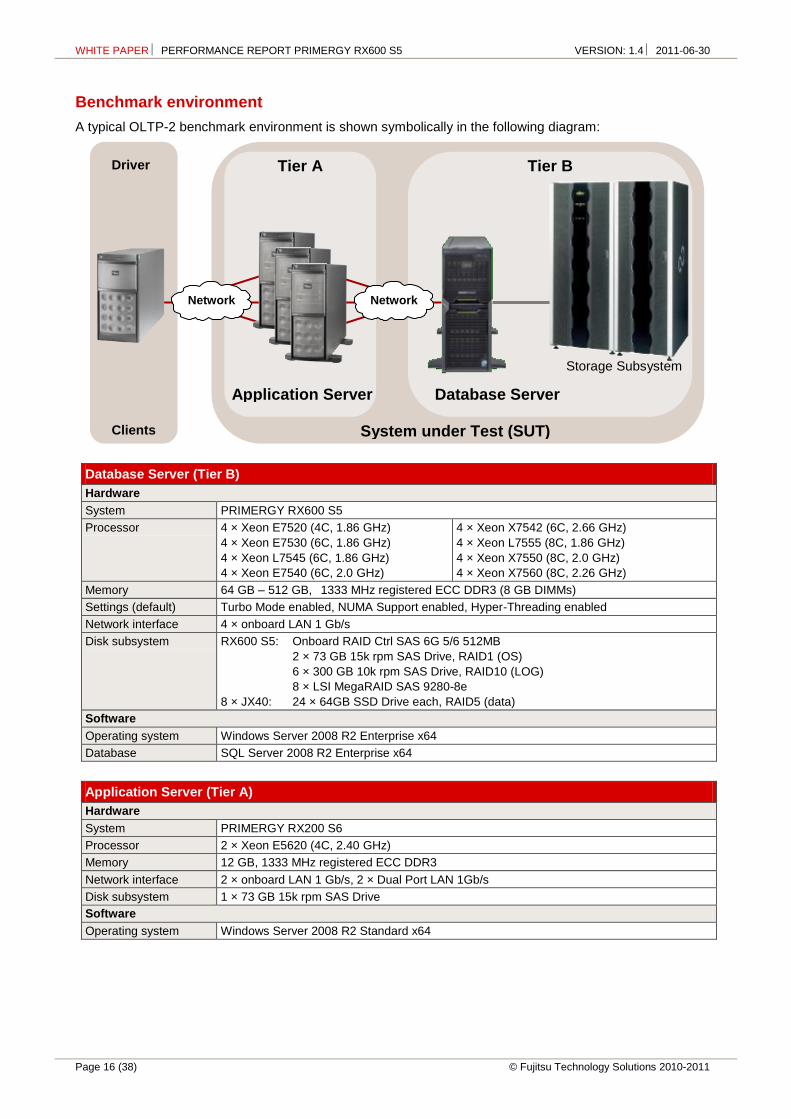
Benchmark environment
A typical OLTP-2 benchmark environment is shown symbolically in the following diagram:
Database Server (Tier B)
Hardware
System PRIMERGY RX600 S5
Processor 4 × Xeon E7520 (4C, 1.86 GHz)
4 × Xeon E7530 (6C, 1.86 GHz)
4 × Xeon L7545 (6C, 1.86 GHz)
4 × Xeon E7540 (6C, 2.0 GHz)
4 × Xeon X7542 (6C, 2.66 GHz)
4 × Xeon L7555 (8C, 1.86 GHz)
4 × Xeon X7550 (8C, 2.0 GHz)
4 × Xeon X7560 (8C, 2.26 GHz)
Memory 64 GB – 512 GB, 1333 MHz registered ECC DDR3 (8 GB DIMMs)
Settings (default) Turbo Mode enabled, NUMA Support enabled, Hyper-Threading enabled
Network interface 4 × onboard LAN 1 Gb/s
Disk subsystem RX600 S5: Onboard RAID Ctrl SAS 6G 5/6 512MB
2 × 73 GB 15k rpm SAS Drive, RAID1 (OS)
6 × 300 GB 10k rpm SAS Drive, RAID10 (LOG)
8 × LSI MegaRAID SAS 9280-8e
8 × JX40: 24 × 64GB SSD Drive each, RAID5 (data)
Software
Operating system Windows Server 2008 R2 Enterprise x64
Database SQL Server 2008 R2 Enterprise x64
Application Server (Tier A)
Hardware
System PRIMERGY RX200 S6
Processor 2 × Xeon E5620 (4C, 2.40 GHz)
Memory 12 GB, 1333 MHz registered ECC DDR3
Network interface 2 × onboard LAN 1 Gb/s, 2 × Dual Port LAN 1Gb/s
Disk subsystem 1 × 73 GB 15k rpm SAS Drive
Software
Operating system Windows Server 2008 R2 Standard x64
Application Server
Tier A Tier B
Network
Network
Clients
Database Server
Storage Subsystem
System under Test (SUT)
Driver
WHITE PAPER PERFORMANCE REPORT PRIMERGY RX600 S5 VERSION: 1.4 2011-06-30
© Fujitsu Technology Solutions 2010-2011 Page 17 (38)
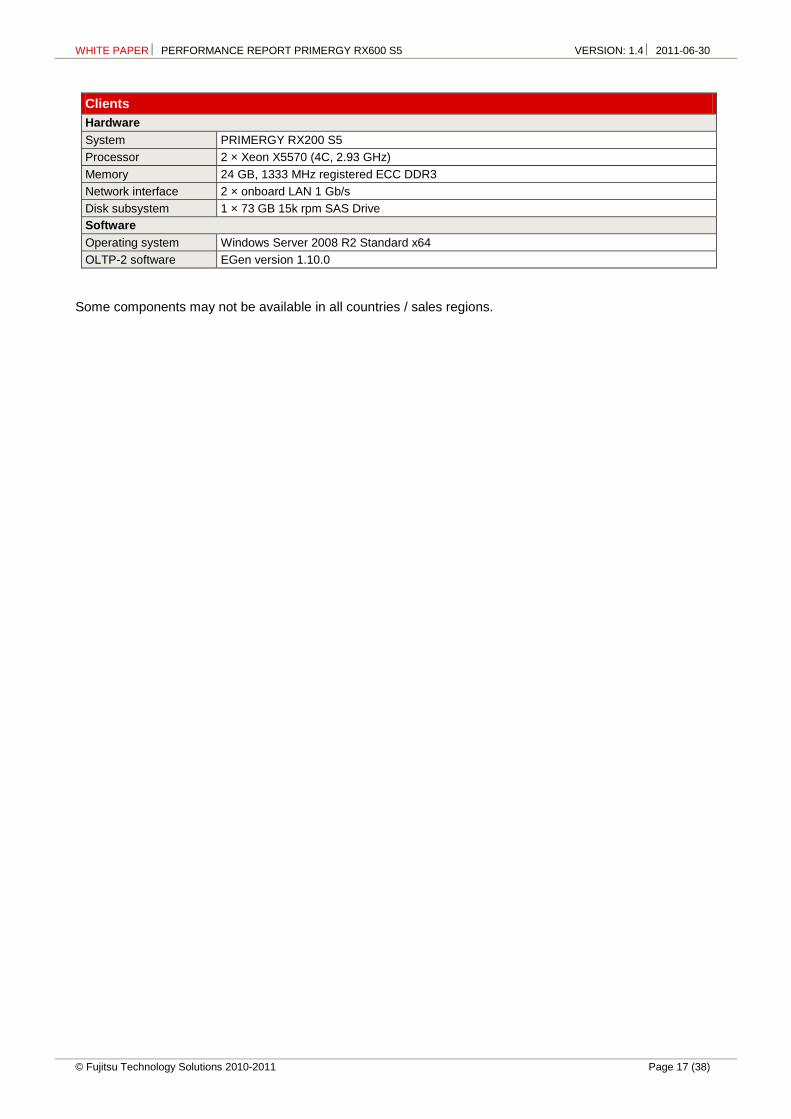
Clients
Hardware
System PRIMERGY RX200 S5
Processor 2 × Xeon X5570 (4C, 2.93 GHz)
Memory 24 GB, 1333 MHz registered ECC DDR3
Network interface 2 × onboard LAN 1 Gb/s
Disk subsystem 1 × 73 GB 15k rpm SAS Drive
Software
Operating system Windows Server 2008 R2 Standard x64
OLTP-2 software EGen version 1.10.0
Some components may not be available in all countries / sales regions.
WHITE PAPER PERFORMANCE REPORT PRIMERGY RX600 S5 VERSION: 1.4 2011-06-30
Page 18 (38) © Fujitsu Technology Solutions 2010-2011
TPC-E
Benchmark description
The TPC-E benchmark measures the performance of online transaction processing systems (OLTP) and is based on a complex database and a number of different transaction types that are carried out on it. TPC-E is not only a hardware-independent but also a software-independent benchmark and can thus be run on every test platform, i.e. proprietary or open. In addition to the results of the measurement, all the details of the systems measured and the measuring method must also be explained in a measurement report (Full Disclosure Report or FDR). Consequently, this ensures that the measurement meets all benchmark requirements and is reproducible. TPC-E does not just measure an individual server, but a rather extensive system configuration. Keys to performance in this respect are the database server, disk I/O and network communication.
The performance metric is tpsE, where tps means transactions per second. tpsE is the average number of Trade-Result-Transactions that are performed within a second. The TPC-E standard defines a result as the tpsE rate, the price per performance value (e.g. $/tpsE) and the availability date of the measured configuration. Further information can be found in the document Benchmark Overview TPC-E.
Benchmark results
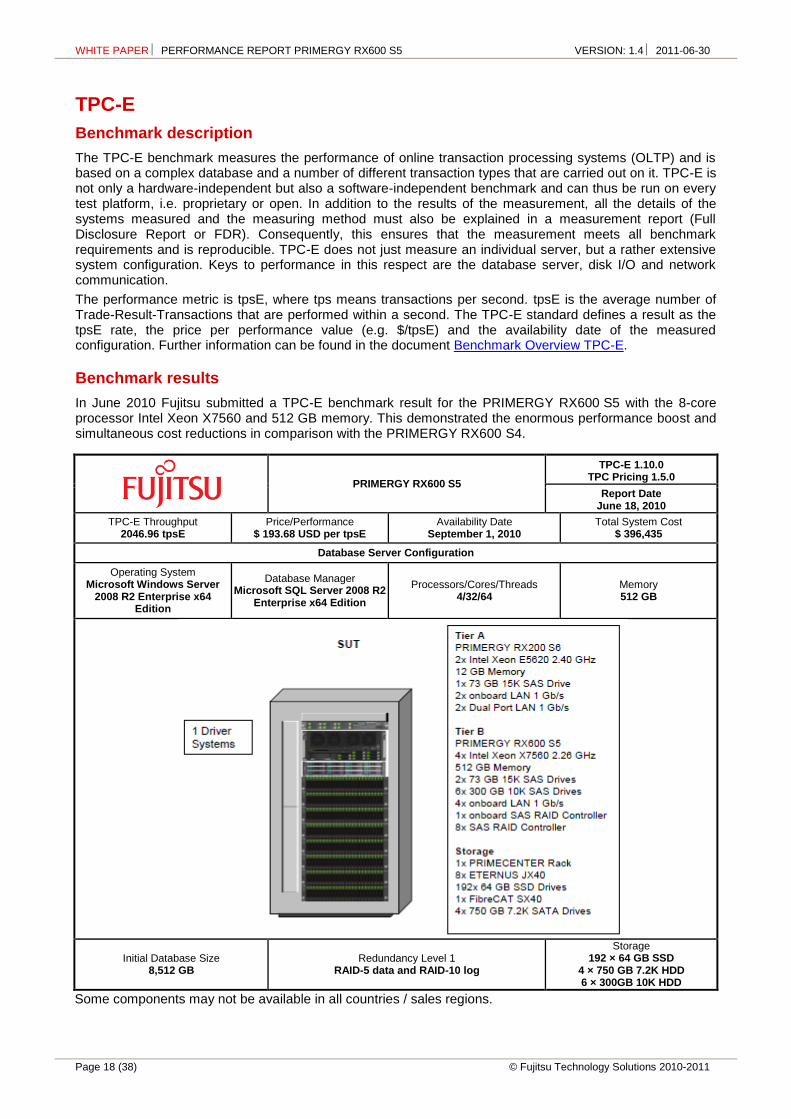
In June 2010 Fujitsu submitted a TPC-E benchmark result for the PRIMERGY RX600 S5 with the 8-core processor Intel Xeon X7560 and 512 GB memory. This demonstrated the enormous performance boost and simultaneous cost reductions in comparison with the PRIMERGY RX600 S4.
PRIMERGY RX600 S5
TPC-E 1.10.0 TPC Pricing 1.5.0
Report Date June 18, 2010
TPC-E Throughput 2046.96 tpsE
Price/Performance $ 193.68 USD per tpsE
Availability Date September 1, 2010
Total System Cost $ 396,435
Database Server Configuration
Operating System Microsoft Windows Server
2008 R2 Enterprise x64 Edition
Database Manager Microsoft SQL Server 2008 R2
Enterprise x64 Edition
Processors/Cores/Threads 4/32/64
Memory 512 GB
Initial Database Size 8,512 GB
Redundancy Level 1 RAID-5 data and RAID-10 log
Storage 192 × 64 GB SSD
4 × 750 GB 7.2K HDD 6 × 300GB 10K HDD
Some components may not be available in all countries / sales regions.
WHITE PAPER PERFORMANCE REPORT PRIMERGY RX600 S5 VERSION: 1.4 2011-06-30
© Fujitsu Technology Solutions 2010-2011 Page 19 (38)
Further information and a comparison with the competitors can be found at the TPC website (http://www.tpc.org/tpce).
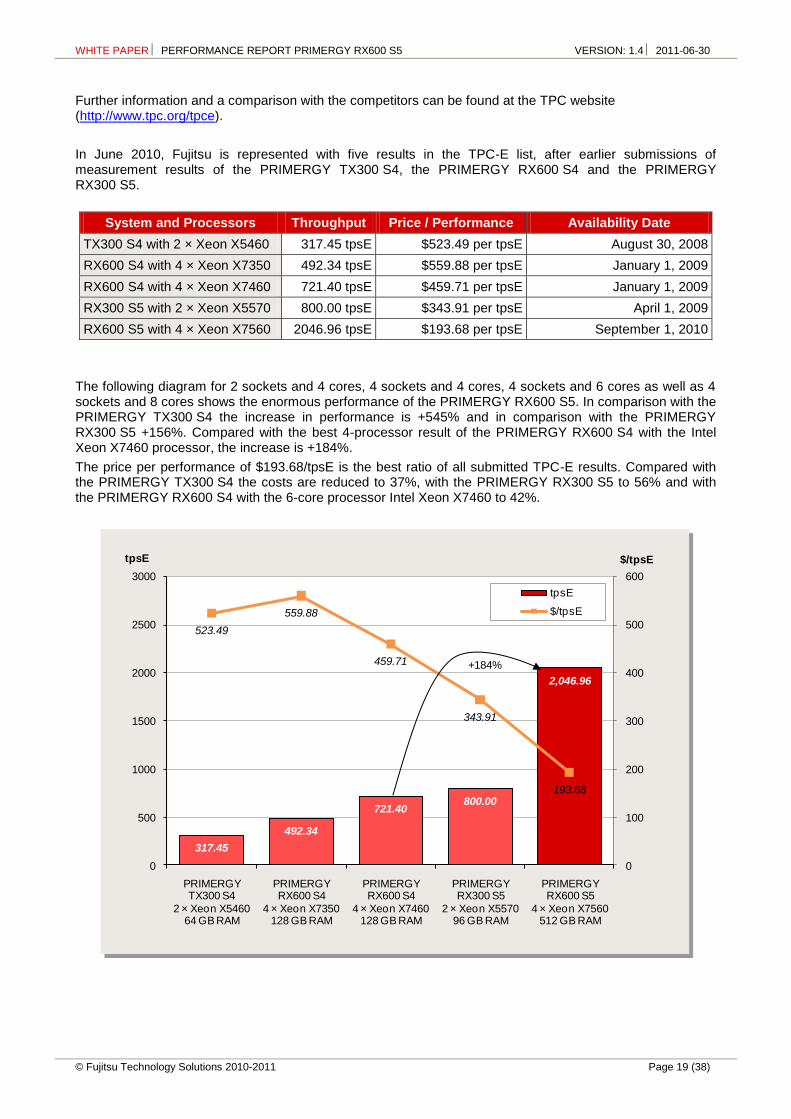
In June 2010, Fujitsu is represented with five results in the TPC-E list, after earlier submissions of measurement results of the PRIMERGY TX300 S4, the PRIMERGY RX600 S4 and the PRIMERGY RX300 S5.
System and Processors Throughput Price / Performance Availability Date
TX300 S4 with 2 × Xeon X5460 317.45 tpsE $523.49 per tpsE August 30, 2008
RX600 S4 with 4 × Xeon X7350 492.34 tpsE $559.88 per tpsE January 1, 2009
RX600 S4 with 4 × Xeon X7460 721.40 tpsE $459.71 per tpsE January 1, 2009
RX300 S5 with 2 × Xeon X5570 800.00 tpsE $343.91 per tpsE April 1, 2009
RX600 S5 with 4 × Xeon X7560 2046.96 tpsE $193.68 per tpsE September 1, 2010
The following diagram for 2 sockets and 4 cores, 4 sockets and 4 cores, 4 sockets and 6 cores as well as 4 sockets and 8 cores shows the enormous performance of the PRIMERGY RX600 S5. In comparison with the PRIMERGY TX300 S4 the increase in performance is +545% and in comparison with the PRIMERGY RX300 S5 +156%. Compared with the best 4-processor result of the PRIMERGY RX600 S4 with the Intel Xeon X7460 processor, the increase is +184%.
The price per performance of $193.68/tpsE is the best ratio of all submitted TPC-E results. Compared with the PRIMERGY TX300 S4 the costs are reduced to 37%, with the PRIMERGY RX300 S5 to 56% and with the PRIMERGY RX600 S4 with the 6-core processor Intel Xeon X7460 to 42%.
317.45
492.34
721.40800.00
2,046.96
523.49
559.88
459.71
343.91
193.68
0
100
200
300
400
500
600
0
500
1000
1500
2000
2500
3000
PRIMERGYTX300 S4
2 × Xeon X546064 GB RAM
PRIMERGYRX600 S4
4 × Xeon X7350128 GB RAM
PRIMERGYRX600 S4
4 × Xeon X7460128 GB RAM
PRIMERGYRX300 S5
2 × Xeon X557096 GB RAM
PRIMERGYRX600 S5
4 × Xeon X7560512 GB RAM
$/tpsEtpsE
tpsE
$/tpsE
+184%
WHITE PAPER PERFORMANCE REPORT PRIMERGY RX600 S5 VERSION: 1.4 2011-06-30
Page 20 (38) © Fujitsu Technology Solutions 2010-2011
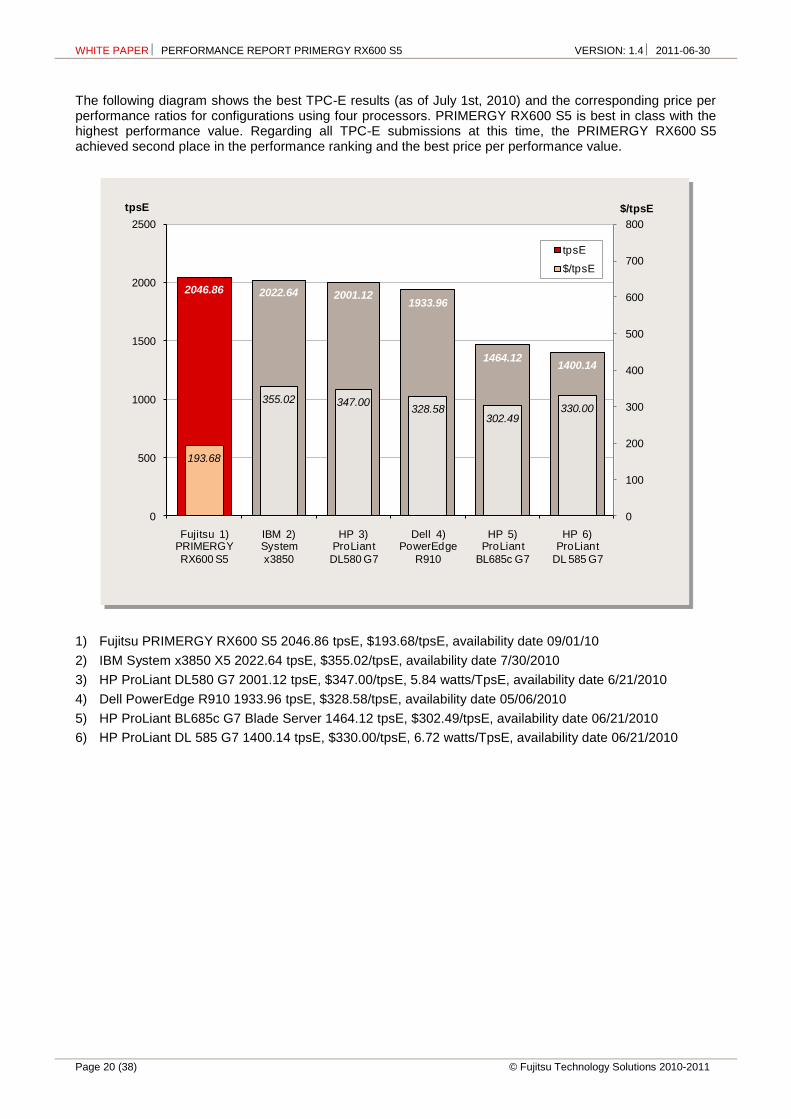
The following diagram shows the best TPC-E results (as of July 1st, 2010) and the corresponding price per performance ratios for configurations using four processors. PRIMERGY RX600 S5 is best in class with the highest performance value. Regarding all TPC-E submissions at this time, the PRIMERGY RX600 S5 achieved second place in the performance ranking and the best price per performance value.
1) Fujitsu PRIMERGY RX600 S5 2046.86 tpsE, $193.68/tpsE, availability date 09/01/10
2) IBM System x3850 X5 2022.64 tpsE, $355.02/tpsE, availability date 7/30/2010
3) HP ProLiant DL580 G7 2001.12 tpsE, $347.00/tpsE, 5.84 watts/TpsE, availability date 6/21/2010
4) Dell PowerEdge R910 1933.96 tpsE, $328.58/tpsE, availability date 05/06/2010
5) HP ProLiant BL685c G7 Blade Server 1464.12 tpsE, $302.49/tpsE, availability date 06/21/2010
6) HP ProLiant DL 585 G7 1400.14 tpsE, $330.00/tpsE, 6.72 watts/TpsE, availability date 06/21/2010
2046.86 2022.64 2001.121933.96
1464.121400.14
193.68
355.02 347.00328.58
302.49330.00
0
100
200
300
400
500
600
700
800
0
500
1000
1500
2000
2500
Fujitsu 1)PRIMERGY
RX600 S5
IBM 2)System
x3850
HP 3)ProLiant
DL580 G7
Dell 4)PowerEdge
R910
HP 5)ProLiant
BL685c G7
HP 6)ProLiant
DL 585 G7
$/tpsEtpsE
tpsE
$/tpsE
WHITE PAPER PERFORMANCE REPORT PRIMERGY RX600 S5 VERSION: 1.4 2011-06-30
© Fujitsu Technology Solutions 2010-2011 Page 21 (38)
SAP SD
Benchmark description
The SAP application software consists of modules used to manage all standard business processes. These include modules for ERP (Enterprise Resource Planning), such as Assemble-to-Order (ATO), Financial Accounting (FI), Human Resources (HR), Materials Management (MM), Production Planning (PP) plus Sales and Distribution (SD), as well as modules for SCM (Supply Chain Management), Retail, Banking, Utilities, BI (Business Intelligence), CRM (Customer Relation Management) or PLM (Product Lifecycle Management).
The application software is always based on a database so that a SAP configuration consists of the hardware, the software components operating system, the database and the SAP software itself.
SAP AG has developed SAP Standard Application Benchmarks in order to verify the performance, stability and scaling of a SAP application system. The benchmarks, of which SD Benchmark is the most commonly used and most important, analyze the performance of the entire system and thus measure the quality of the integrated individual components.
The benchmark differentiates between a 2-tier and a 3-tier configuration. The 2-tier configuration has the SAP application and database installed on one server. With a 3-tier configuration the individual components of the SAP application can be distributed via several servers and an additional server handles the database.
The entire specification of the benchmark developed by SAP AG, Walldorf, Germany can be found at: http://www.sap.com/benchmark.
WHITE PAPER PERFORMANCE REPORT PRIMERGY RX600 S5 VERSION: 1.4 2011-06-30
Page 22 (38) © Fujitsu Technology Solutions 2010-2011
Benchmark results
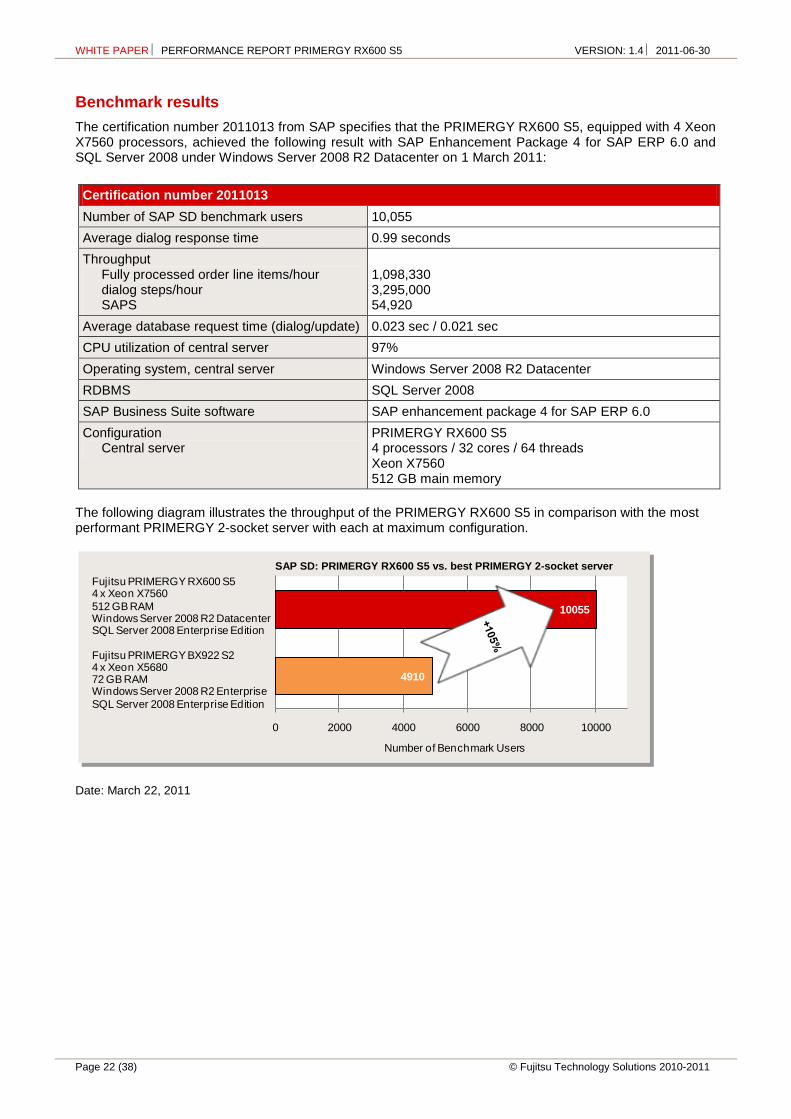
The certification number 2011013 from SAP specifies that the PRIMERGY RX600 S5, equipped with 4 Xeon X7560 processors, achieved the following result with SAP Enhancement Package 4 for SAP ERP 6.0 and SQL Server 2008 under Windows Server 2008 R2 Datacenter on 1 March 2011:
Certification number 2011013
Number of SAP SD benchmark users 10,055
Average dialog response time 0.99 seconds
Throughput Fully processed order line items/hour dialog steps/hour SAPS
1,098,330 3,295,000 54,920
Average database request time (dialog/update) 0.023 sec / 0.021 sec
CPU utilization of central server 97%
Operating system, central server Windows Server 2008 R2 Datacenter
RDBMS SQL Server 2008
SAP Business Suite software SAP enhancement package 4 for SAP ERP 6.0
Configuration Central server
PRIMERGY RX600 S5 4 processors / 32 cores / 64 threads Xeon X7560 512 GB main memory
The following diagram illustrates the throughput of the PRIMERGY RX600 S5 in comparison with the most performant PRIMERGY 2-socket server with each at maximum configuration.
Date: March 22, 2011
4910
10055
0 2000 4000 6000 8000 10000
Number of Benchmark Users
Fujitsu PRIMERGY RX600 S54 x Xeon X7560
512 GB RAMWindows Server 2008 R2 DatacenterSQL Server 2008 Enterprise Edition
Fujitsu PRIMERGY BX922 S24 x Xeon X568072 GB RAMWindows Server 2008 R2 Enterprise
SQL Server 2008 Enterprise Edition
SAP SD: PRIMERGY RX600 S5 vs. best PRIMERGY 2-socket server
WHITE PAPER PERFORMANCE REPORT PRIMERGY RX600 S5 VERSION: 1.4 2011-06-30
© Fujitsu Technology Solutions 2010-2011 Page 23 (38)
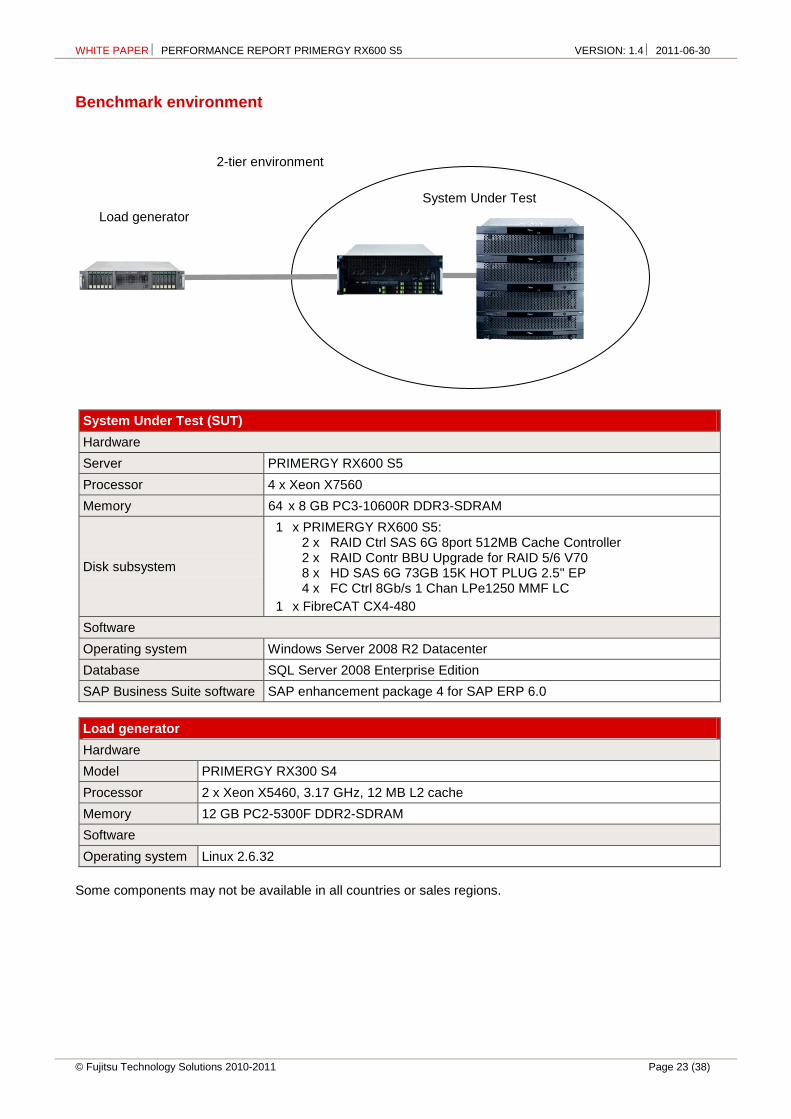
Benchmark environment
System Under Test (SUT)
Hardware
Server PRIMERGY RX600 S5
Processor 4 x Xeon X7560
Memory 64 x 8 GB PC3-10600R DDR3-SDRAM
Disk subsystem
1 x PRIMERGY RX600 S5: 2 x RAID Ctrl SAS 6G 8port 512MB Cache Controller 2 x RAID Contr BBU Upgrade for RAID 5/6 V70 8 x HD SAS 6G 73GB 15K HOT PLUG 2.5" EP 4 x FC Ctrl 8Gb/s 1 Chan LPe1250 MMF LC
1 x FibreCAT CX4-480
Software
Operating system Windows Server 2008 R2 Datacenter
Database SQL Server 2008 Enterprise Edition
SAP Business Suite software SAP enhancement package 4 for SAP ERP 6.0
Load generator
Hardware
Model PRIMERGY RX300 S4
Processor 2 x Xeon X5460, 3.17 GHz, 12 MB L2 cache
Memory 12 GB PC2-5300F DDR2-SDRAM
Software
Operating system Linux 2.6.32
Some components may not be available in all countries or sales regions.
System Under Test
2-tier environment
Load generator
WHITE PAPER PERFORMANCE REPORT PRIMERGY RX600 S5 VERSION: 1.4 2011-06-30
Page 24 (38) © Fujitsu Technology Solutions 2010-2011
SAP BI-D
Benchmark description
SAP and its hardware and technology partners have developed a suite of SAP Standard Application Benchmarks in order to verify the performance, stability and scaling of a SAP application system. They consist of a number of script files that simulate the most typical transactions and workflow of a SAP user. They also have a predefined SAP client database that contains sample company data against which the benchmarks run. One main characteristic and differentiator of the SAP Standard Application Benchmarks compared to other standard benchmarks is to run commercial application code instead of synthetic benchmark code.
The SAP Business Intelligence-Data Mart (BI-D) Standard Application Benchmark is widely used by enterprises to efficiently analyze and optimize system performance in business warehousing (BW) environments. It provides a real-world indication of enterprise database performance through measuring system performance in handling high-volume queries to a business warehouse system database. The data mart scenario is one use of the business intelligence capabilities of the SAP NetWeaver technology platform. The data mart contains a static snapshot of a huge amount of operational data. Multiple users run queries on this data in 10 InfoCubes than contain 2.5 billion (2,500,000,000) records. Master data as well as the queries are created randomly. The key figure is the number of query navigation steps per hour.
The benchmark differentiates between a 2-tier and a 3-tier configuration. The 2-tier configuration has the SAP application and database installed on one server. With a 3-tier configuration the individual components of the SAP application can be distributed via several servers.
The entire specification of the benchmark developed by SAP AG, Walldorf, Germany can be found at: http://www.sap.com/benchmark.
Benchmark results
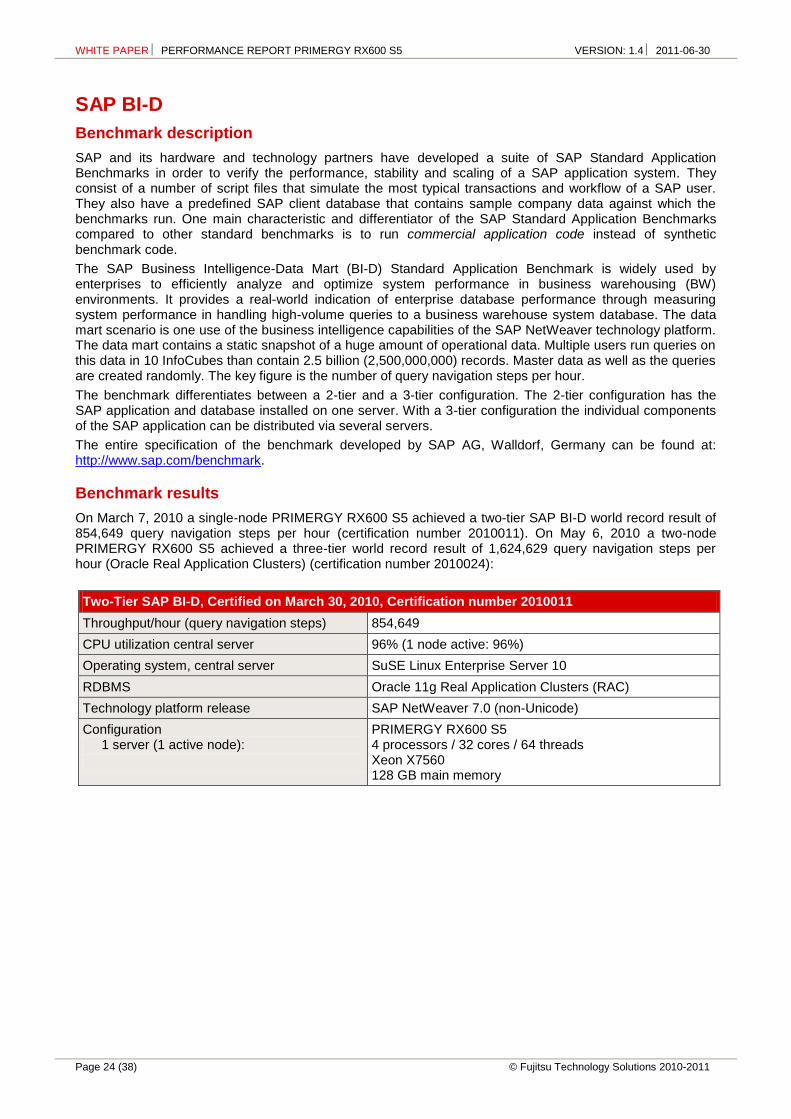
On March 7, 2010 a single-node PRIMERGY RX600 S5 achieved a two-tier SAP BI-D world record result of 854,649 query navigation steps per hour (certification number 2010011). On May 6, 2010 a two-node PRIMERGY RX600 S5 achieved a three-tier world record result of 1,624,629 query navigation steps per hour (Oracle Real Application Clusters) (certification number 2010024):
Two-Tier SAP BI-D, Certified on March 30, 2010, Certification number 2010011
Throughput/hour (query navigation steps) 854,649
CPU utilization central server 96% (1 node active: 96%)
Operating system, central server SuSE Linux Enterprise Server 10
RDBMS Oracle 11g Real Application Clusters (RAC)
Technology platform release SAP NetWeaver 7.0 (non-Unicode)
Configuration 1 server (1 active node):
PRIMERGY RX600 S5 4 processors / 32 cores / 64 threads Xeon X7560 128 GB main memory
WHITE PAPER PERFORMANCE REPORT PRIMERGY RX600 S5 VERSION: 1.4 2011-06-30
© Fujitsu Technology Solutions 2010-2011 Page 25 (38)
Three-Tier SAP BI-D, Certified on May 31, 2010, Certification number 2010024
Throughput/hour (query navigation steps) 1,624,629
CPU utilization central server 94% (node 1 active: 93%)
(node 2 active: 94%)
Operating system, central server SuSE Linux Enterprise Server 10
RDBMS Oracle 11g Real Application Clusters (RAC)
Technology platform release SAP NetWeaver 7.0 (non-Unicode)
Configuration 1 server (1 active node):
1 server (1 active node):
PRIMERGY RX600 S5 4 processors / 32 cores / 64 threads Xeon X7560, 128 GB main memory
PRIMERGY RX600 S5
4 processors / 32 cores / 64 threads
Xeon X7560, 256 GB main memory
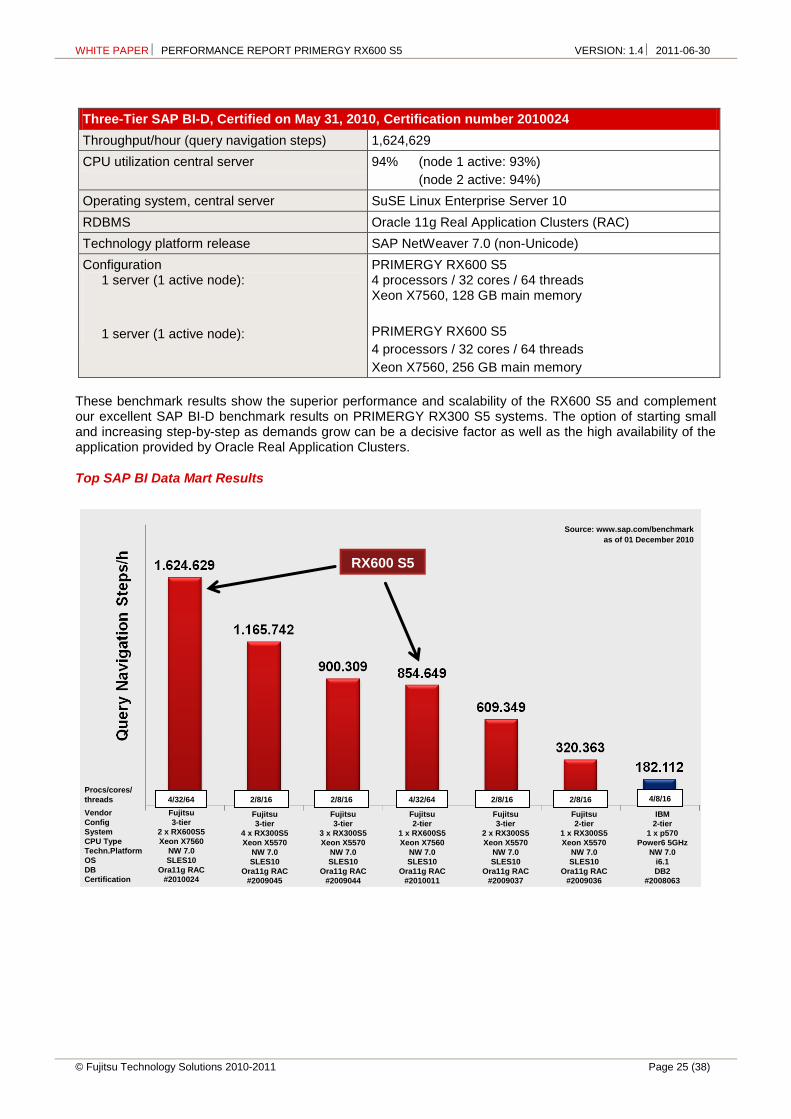
These benchmark results show the superior performance and scalability of the RX600 S5 and complement our excellent SAP BI-D benchmark results on PRIMERGY RX300 S5 systems. The option of starting small and increasing step-by-step as demands grow can be a decisive factor as well as the high availability of the application provided by Oracle Real Application Clusters.
Top SAP BI Data Mart Results
Source: www.sap.com/benchmark
as of 01 December 2010
Vendor
Config
System
CPU Type
Techn.Platform
OS
DB
Certification
Procs/cores/
threads 4/8/164/32/64
Fujitsu
3-tier
2 x RX600S5
Xeon X7560
NW 7.0
SLES10
Ora11g RAC
#2010024
2/8/16 2/8/16 2/8/164/32/64 2/8/16
Fujitsu
3-tier
4 x RX300S5
Xeon X5570
NW 7.0
SLES10
Ora11g RAC
#2009045
Fujitsu
3-tier
3 x RX300S5
Xeon X5570
NW 7.0
SLES10
Ora11g RAC
#2009044
Fujitsu
2-tier
1 x RX600S5
Xeon X7560
NW 7.0
SLES10
Ora11g RAC
#2010011
Fujitsu
3-tier
2 x RX300S5
Xeon X5570
NW 7.0
SLES10
Ora11g RAC
#2009037
Fujitsu
2-tier
1 x RX300S5
Xeon X5570
NW 7.0
SLES10
Ora11g RAC
#2009036
IBM
2-tier
1 x p570
Power6 5GHz
NW 7.0
i6.1
DB2
#2008063
RX600 S5
WHITE PAPER PERFORMANCE REPORT PRIMERGY RX600 S5 VERSION: 1.4 2011-06-30
Page 26 (38) © Fujitsu Technology Solutions 2010-2011
vServCon
Benchmark description
vServCon is a benchmark used by Fujitsu Technology Solutions to compare server configurations with hypervisor with regard to their suitability for server consolidation. This allows both the comparison of systems, processors and I/O technologies as well as the comparison of hypervisors, virtualization forms and additional drivers for virtual machines.
vServCon is not a new benchmark in the true sense of the word. It is more a framework that combines already established benchmarks (or in modified form) as workloads in order to reproduce the load of a consolidated and virtualized server environment. Three proven benchmarks are used which cover the application scenarios database, application server and web server.
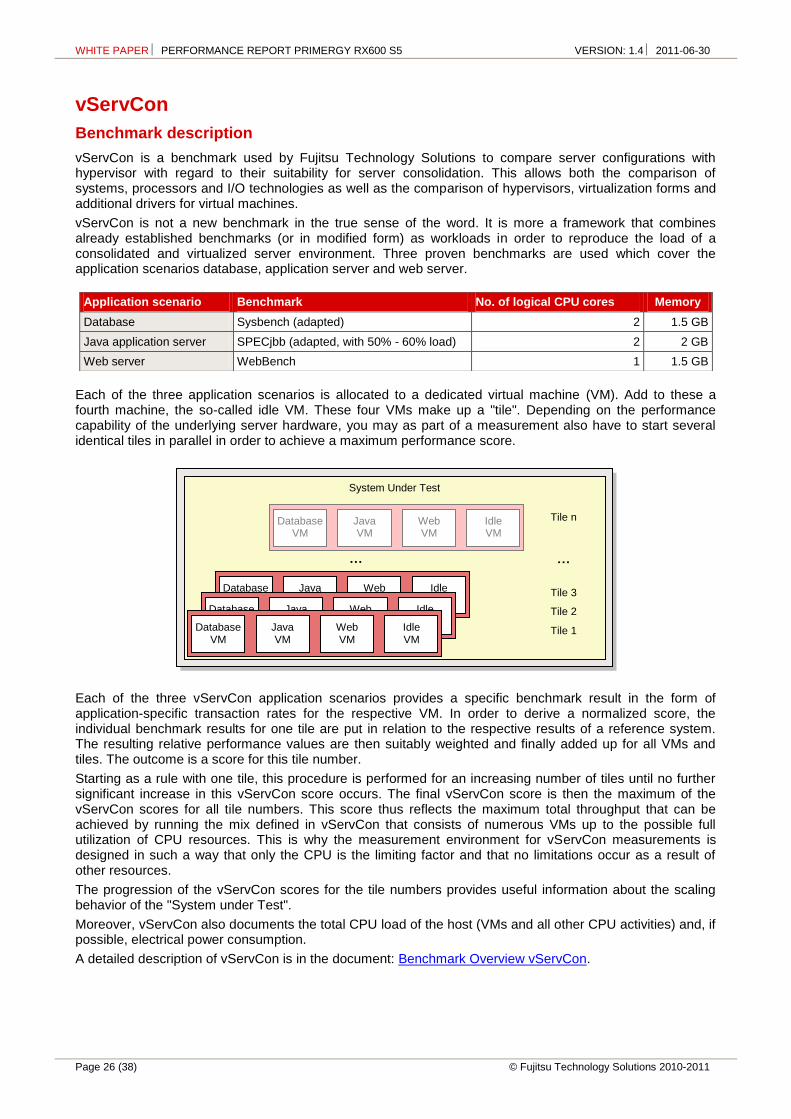
Each of the three application scenarios is allocated to a dedicated virtual machine (VM). Add to these a fourth machine, the so-called idle VM. These four VMs make up a "tile". Depending on the performance capability of the underlying server hardware, you may as part of a measurement also have to start several identical tiles in parallel in order to achieve a maximum performance score.
Each of the three vServCon application scenarios provides a specific benchmark result in the form of application-specific transaction rates for the respective VM. In order to derive a normalized score, the individual benchmark results for one tile are put in relation to the respective results of a reference system. The resulting relative performance values are then suitably weighted and finally added up for all VMs and tiles. The outcome is a score for this tile number.
Starting as a rule with one tile, this procedure is performed for an increasing number of tiles until no further significant increase in this vServCon score occurs. The final vServCon score is then the maximum of the vServCon scores for all tile numbers. This score thus reflects the maximum total throughput that can be achieved by running the mix defined in vServCon that consists of numerous VMs up to the possible full utilization of CPU resources. This is why the measurement environment for vServCon measurements is designed in such a way that only the CPU is the limiting factor and that no limitations occur as a result of other resources.
The progression of the vServCon scores for the tile numbers provides useful information about the scaling behavior of the "System under Test".
Moreover, vServCon also documents the total CPU load of the host (VMs and all other CPU activities) and, if possible, electrical power consumption.
A detailed description of vServCon is in the document: Benchmark Overview vServCon.
Application scenario Benchmark No. of logical CPU cores Memory
Database Sysbench (adapted) 2 1.5 GB
Java application server SPECjbb (adapted, with 50% - 60% load) 2 2 GB
Web server WebBench 1 1.5 GB
System Under Test
… …
Tile n
Tile 3
Tile 2
Tile 1
Database VM
Web VM
Idle VM
Java VM
Database VM
Web VM
Idle VM
Java VM
Database VM
Web VM
Idle VM
Java VM Database
VM Web VM
Idle VM
Java VM
WHITE PAPER PERFORMANCE REPORT PRIMERGY RX600 S5 VERSION: 1.4 2011-06-30
© Fujitsu Technology Solutions 2010-2011 Page 27 (38)
Benchmark results
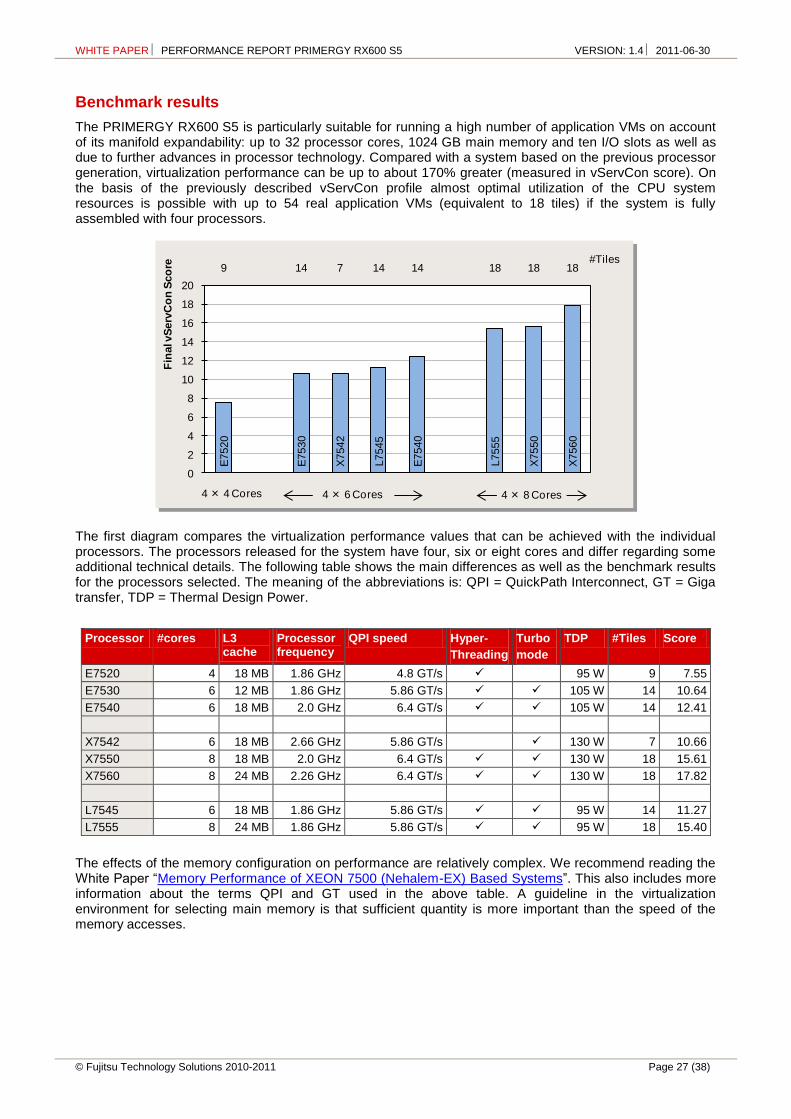
The PRIMERGY RX600 S5 is particularly suitable for running a high number of application VMs on account of its manifold expandability: up to 32 processor cores, 1024 GB main memory and ten I/O slots as well as due to further advances in processor technology. Compared with a system based on the previous processor generation, virtualization performance can be up to about 170% greater (measured in vServCon score). On the basis of the previously described vServCon profile almost optimal utilization of the CPU system resources is possible with up to 54 real application VMs (equivalent to 18 tiles) if the system is fully assembled with four processors.
The first diagram compares the virtualization performance values that can be achieved with the individual processors. The processors released for the system have four, six or eight cores and differ regarding some additional technical details. The following table shows the main differences as well as the benchmark results for the processors selected. The meaning of the abbreviations is: QPI = QuickPath Interconnect, GT = Giga transfer, TDP = Thermal Design Power.
Processor #cores L3 cache
Processor frequency
QPI speed Hyper-
Threading
Turbo
mode
TDP #Tiles Score
E7520 4 18 MB 1.86 GHz 4.8 GT/s 95 W 9 7.55
E7530 6 12 MB 1.86 GHz 5.86 GT/s 105 W 14 10.64
E7540 6 18 MB 2.0 GHz 6.4 GT/s 105 W 14 12.41
X7542 6 18 MB 2.66 GHz 5.86 GT/s 130 W 7 10.66
X7550 8 18 MB 2.0 GHz 6.4 GT/s 130 W 18 15.61
X7560 8 24 MB 2.26 GHz 6.4 GT/s 130 W 18 17.82
L7545 6 18 MB 1.86 GHz 5.86 GT/s 95 W 14 11.27
L7555 8 24 MB 1.86 GHz 5.86 GT/s 95 W 18 15.40
The effects of the memory configuration on performance are relatively complex. We recommend reading the White Paper “Memory Performance of XEON 7500 (Nehalem-EX) Based Systems”. This also includes more information about the terms QPI and GT used in the above table. A guideline in the virtualization environment for selecting main memory is that sufficient quantity is more important than the speed of the memory accesses.
E7520
E7530
X7542
L7545
E7540
L7555
X7550
X7560
9 14 7 14 14 18 18 18
0
2
4
6
8
10
12
14
16
18
20
Fin
al v
Serv
Co
n S
co
re
#Tiles
4 × 4 Cores 4 × 6 Cores 4 × 8 Cores
WHITE PAPER PERFORMANCE REPORT PRIMERGY RX600 S5 VERSION: 1.4 2011-06-30
Page 28 (38) © Fujitsu Technology Solutions 2010-2011
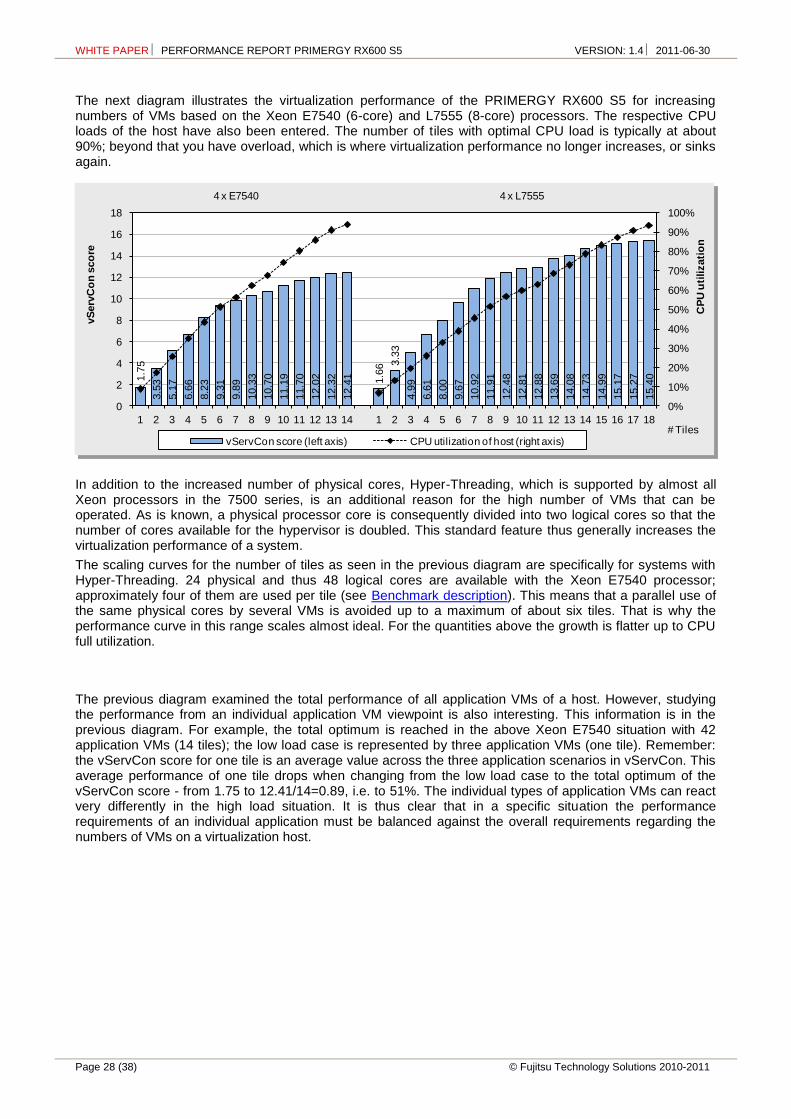
The next diagram illustrates the virtualization performance of the PRIMERGY RX600 S5 for increasing numbers of VMs based on the Xeon E7540 (6-core) and L7555 (8-core) processors. The respective CPU loads of the host have also been entered. The number of tiles with optimal CPU load is typically at about 90%; beyond that you have overload, which is where virtualization performance no longer increases, or sinks again.
In addition to the increased number of physical cores, Hyper-Threading, which is supported by almost all Xeon processors in the 7500 series, is an additional reason for the high number of VMs that can be operated. As is known, a physical processor core is consequently divided into two logical cores so that the number of cores available for the hypervisor is doubled. This standard feature thus generally increases the virtualization performance of a system.
The scaling curves for the number of tiles as seen in the previous diagram are specifically for systems with Hyper-Threading. 24 physical and thus 48 logical cores are available with the Xeon E7540 processor; approximately four of them are used per tile (see Benchmark description). This means that a parallel use of the same physical cores by several VMs is avoided up to a maximum of about six tiles. That is why the performance curve in this range scales almost ideal. For the quantities above the growth is flatter up to CPU full utilization.
The previous diagram examined the total performance of all application VMs of a host. However, studying the performance from an individual application VM viewpoint is also interesting. This information is in the previous diagram. For example, the total optimum is reached in the above Xeon E7540 situation with 42 application VMs (14 tiles); the low load case is represented by three application VMs (one tile). Remember: the vServCon score for one tile is an average value across the three application scenarios in vServCon. This average performance of one tile drops when changing from the low load case to the total optimum of the vServCon score - from 1.75 to 12.41/14=0.89, i.e. to 51%. The individual types of application VMs can react very differently in the high load situation. It is thus clear that in a specific situation the performance requirements of an individual application must be balanced against the overall requirements regarding the numbers of VMs on a virtualization host.
1.7
5
3.5
3
5.1
7
6.6
6
8.2
3
9.3
1
9.8
9
10.3
3
10.7
0
11.1
9
11.7
0
12.0
2
12.3
2
12.4
1 1.6
6 3.3
3
4.9
9
6.6
1
8.0
0
9.6
7
10.9
2
11.9
1
12.4
8
12.8
1
12.8
8
13.6
9
14.0
8
14.7
3
14.9
9
15.1
7
15.2
7
15.4
0
0%
10%
20%
30%
40%
50%
60%
70%
80%
90%
100%
4 x E7540 4 x L7555
0
2
4
6
8
10
12
14
16
18
1 2 3 4 5 6 7 8 9 10 11 12 13 14 1 2 3 4 5 6 7 8 9 10 11 12 13 14 15 16 17 18
CP
U u
tilizati
on
vS
erv
Co
n s
co
re
# TilesvServCon score (left axis) CPU utilization of host (right axis)
WHITE PAPER PERFORMANCE REPORT PRIMERGY RX600 S5 VERSION: 1.4 2011-06-30
© Fujitsu Technology Solutions 2010-2011 Page 29 (38)
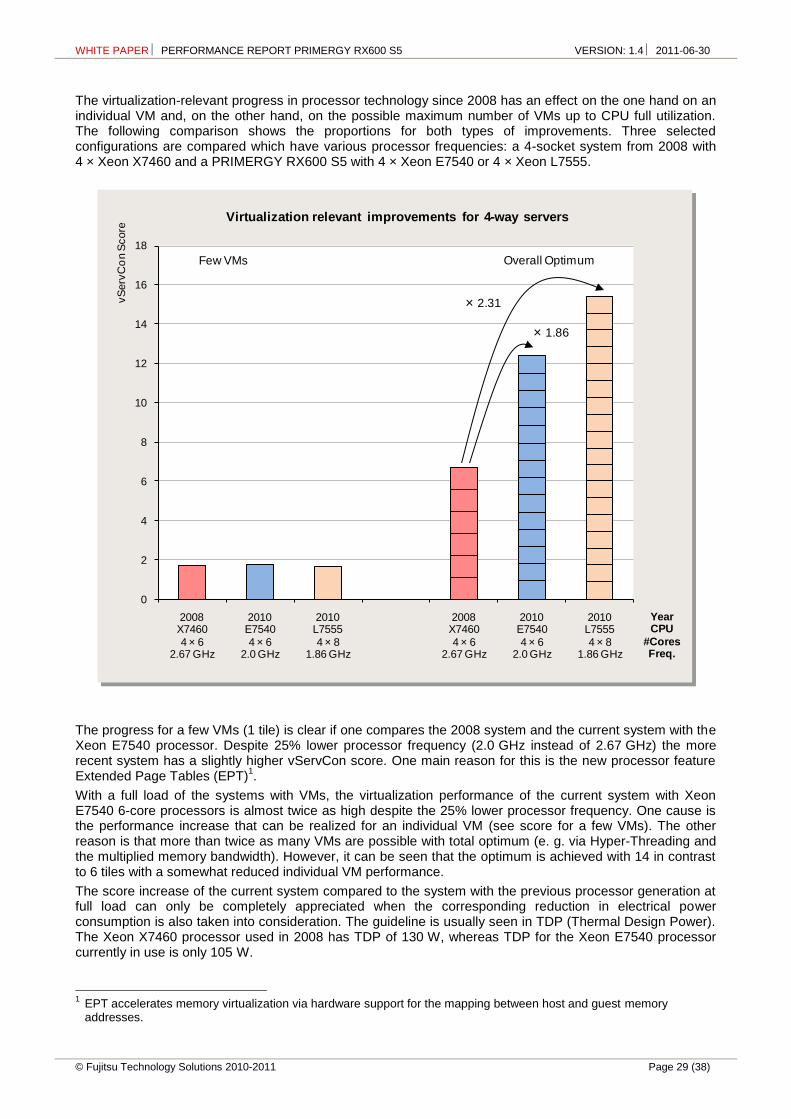
The virtualization-relevant progress in processor technology since 2008 has an effect on the one hand on an individual VM and, on the other hand, on the possible maximum number of VMs up to CPU full utilization. The following comparison shows the proportions for both types of improvements. Three selected configurations are compared which have various processor frequencies: a 4-socket system from 2008 with 4 × Xeon X7460 and a PRIMERGY RX600 S5 with 4 × Xeon E7540 or 4 × Xeon L7555.
The progress for a few VMs (1 tile) is clear if one compares the 2008 system and the current system with the Xeon E7540 processor. Despite 25% lower processor frequency (2.0 GHz instead of 2.67 GHz) the more recent system has a slightly higher vServCon score. One main reason for this is the new processor feature Extended Page Tables (EPT)
1.
With a full load of the systems with VMs, the virtualization performance of the current system with Xeon E7540 6-core processors is almost twice as high despite the 25% lower processor frequency. One cause is the performance increase that can be realized for an individual VM (see score for a few VMs). The other reason is that more than twice as many VMs are possible with total optimum (e. g. via Hyper-Threading and the multiplied memory bandwidth). However, it can be seen that the optimum is achieved with 14 in contrast to 6 tiles with a somewhat reduced individual VM performance.
The score increase of the current system compared to the system with the previous processor generation at full load can only be completely appreciated when the corresponding reduction in electrical power consumption is also taken into consideration. The guideline is usually seen in TDP (Thermal Design Power). The Xeon X7460 processor used in 2008 has TDP of 130 W, whereas TDP for the Xeon E7540 processor currently in use is only 105 W.
1 EPT accelerates memory virtualization via hardware support for the mapping between host and guest memory addresses.
0
2
4
6
8
10
12
14
16
18
2008X7460
4 × 62.67 GHz
2010E7540
4 × 62.0 GHz
2010L7555
4 × 81.86 GHz
2008X7460
4 × 62.67 GHz
2010E7540
4 × 62.0 GHz
2010L7555
4 × 81.86 GHz
Overall OptimumFew VMs
Virtualization relevant improvements for 4-way servers
× 1.86
vS
erv
Co
n S
core
×2.31
Year CPU
#CoresFreq.
WHITE PAPER PERFORMANCE REPORT PRIMERGY RX600 S5 VERSION: 1.4 2011-06-30
Page 30 (38) © Fujitsu Technology Solutions 2010-2011
A further increase in the virtualization performance can be obtained by using a processor with a higher number of cores. If one considers (also with full load) the same measurements with the current system for the 8-core processor instead of the 6-core processor, you can see a clear improvement in comparison to the 2008 system. Despite the processor clock frequency which is 30% lower in this example, the virtualization performance increases by a factor of 2.31; the energy efficiency is better as a result of the processor TDP which has dropped to 95 W.
We must explicitly point out that the increased virtualization performance as seen in the score cannot be completely deemed as an improvement for one individual VM. More than approximately 30% to 50% increased throughput compared to an identically clocked processor of the Xeon 7400 generation from 2008 is not possible here. Performance increases in the virtualization environment since 2009 are mainly achieved by increases in the maximum number of VMs that can be operated.
WHITE PAPER PERFORMANCE REPORT PRIMERGY RX600 S5 VERSION: 1.4 2011-06-30
© Fujitsu Technology Solutions 2010-2011 Page 31 (38)
Benchmark environment
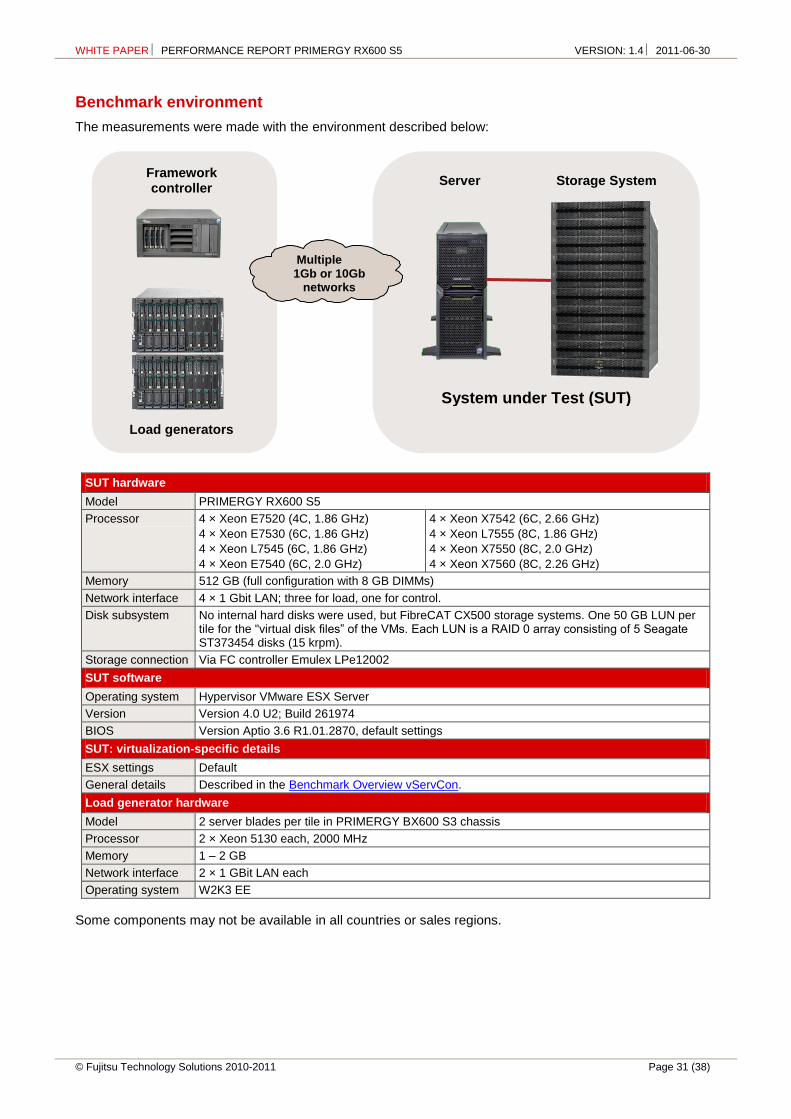
The measurements were made with the environment described below:
SUT hardware
Model PRIMERGY RX600 S5
Processor 4 × Xeon E7520 (4C, 1.86 GHz)
4 × Xeon E7530 (6C, 1.86 GHz)
4 × Xeon L7545 (6C, 1.86 GHz)
4 × Xeon E7540 (6C, 2.0 GHz)
4 × Xeon X7542 (6C, 2.66 GHz)
4 × Xeon L7555 (8C, 1.86 GHz)
4 × Xeon X7550 (8C, 2.0 GHz)
4 × Xeon X7560 (8C, 2.26 GHz)
Memory 512 GB (full configuration with 8 GB DIMMs)
Network interface 4 × 1 Gbit LAN; three for load, one for control.
Disk subsystem No internal hard disks were used, but FibreCAT CX500 storage systems. One 50 GB LUN per tile for the "virtual disk files” of the VMs. Each LUN is a RAID 0 array consisting of 5 Seagate ST373454 disks (15 krpm).
Storage connection Via FC controller Emulex LPe12002
SUT software
Operating system Hypervisor VMware ESX Server
Version Version 4.0 U2; Build 261974
BIOS Version Aptio 3.6 R1.01.2870, default settings
SUT: virtualization-specific details
ESX settings Default
General details Described in the Benchmark Overview vServCon.
Load generator hardware
Model 2 server blades per tile in PRIMERGY BX600 S3 chassis
Processor 2 × Xeon 5130 each, 2000 MHz
Memory 1 – 2 GB
Network interface 2 × 1 GBit LAN each
Operating system W2K3 EE
Some components may not be available in all countries or sales regions.
Multiple 1Gb or 10Gb
networks
Load generators
Server Storage System
System under Test (SUT)
Framework controller
WHITE PAPER PERFORMANCE REPORT PRIMERGY RX600 S5 VERSION: 1.4 2011-06-30
Page 32 (38) © Fujitsu Technology Solutions 2010-2011
VMmark V1
Benchmark description
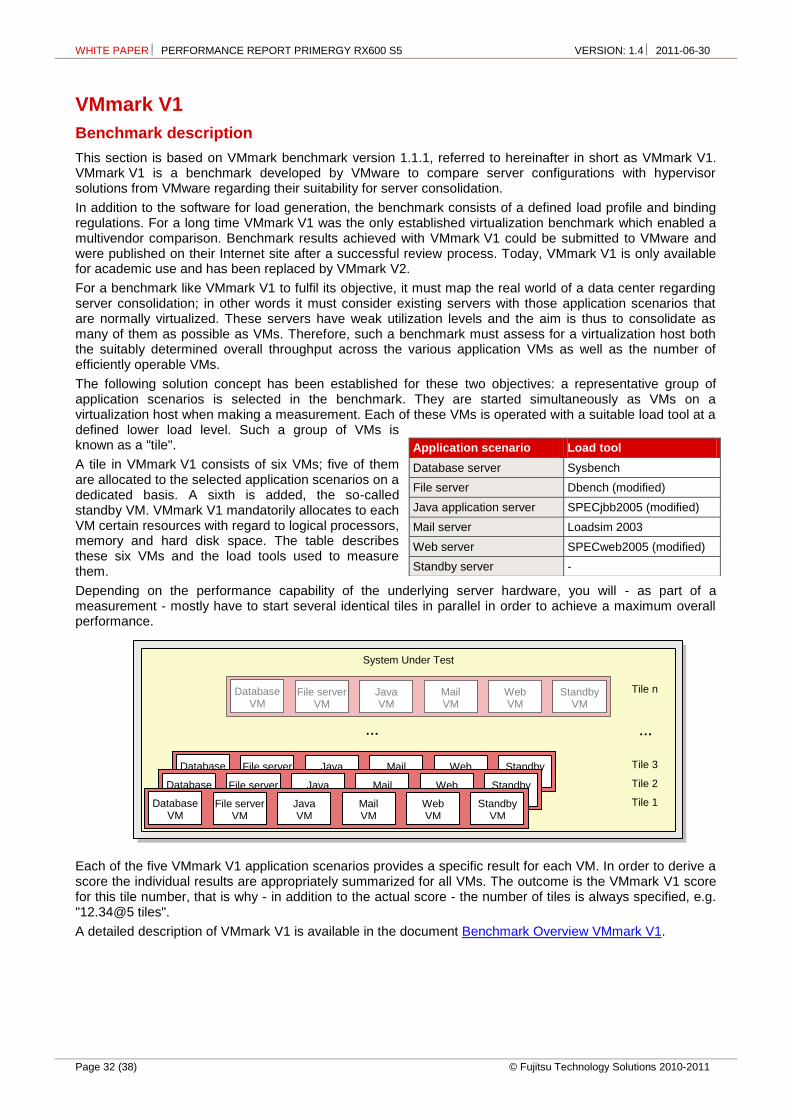
This section is based on VMmark benchmark version 1.1.1, referred to hereinafter in short as VMmark V1. VMmark V1 is a benchmark developed by VMware to compare server configurations with hypervisor solutions from VMware regarding their suitability for server consolidation.
In addition to the software for load generation, the benchmark consists of a defined load profile and binding regulations. For a long time VMmark V1 was the only established virtualization benchmark which enabled a multivendor comparison. Benchmark results achieved with VMmark V1 could be submitted to VMware and were published on their Internet site after a successful review process. Today, VMmark V1 is only available for academic use and has been replaced by VMmark V2.
For a benchmark like VMmark V1 to fulfil its objective, it must map the real world of a data center regarding server consolidation; in other words it must consider existing servers with those application scenarios that are normally virtualized. These servers have weak utilization levels and the aim is thus to consolidate as many of them as possible as VMs. Therefore, such a benchmark must assess for a virtualization host both the suitably determined overall throughput across the various application VMs as well as the number of efficiently operable VMs.
The following solution concept has been established for these two objectives: a representative group of application scenarios is selected in the benchmark. They are started simultaneously as VMs on a virtualization host when making a measurement. Each of these VMs is operated with a suitable load tool at a defined lower load level. Such a group of VMs is known as a "tile".
A tile in VMmark V1 consists of six VMs; five of them are allocated to the selected application scenarios on a dedicated basis. A sixth is added, the so-called standby VM. VMmark V1 mandatorily allocates to each VM certain resources with regard to logical processors, memory and hard disk space. The table describes these six VMs and the load tools used to measure them.
Depending on the performance capability of the underlying server hardware, you will - as part of a measurement - mostly have to start several identical tiles in parallel in order to achieve a maximum overall performance.
Each of the five VMmark V1 application scenarios provides a specific result for each VM. In order to derive a score the individual results are appropriately summarized for all VMs. The outcome is the VMmark V1 score for this tile number, that is why - in addition to the actual score - the number of tiles is always specified, e.g. "12.34@5 tiles".
A detailed description of VMmark V1 is available in the document Benchmark Overview VMmark V1.
Application scenario Load tool
Database server Sysbench
File server Dbench (modified)
Java application server SPECjbb2005 (modified)
Mail server Loadsim 2003
Web server SPECweb2005 (modified)
Standby server -
System Under Test
Tile n
Tile 3
Tile 2
Tile 1
Database VM
Java VM
Mail VM
File server VM
Web VM
Standby VM
Database VM
Java VM
Mail VM
File server VM
Web VM
Standby VM
Database VM
Java VM
Mail VM
File server VM
Web VM
Standby VM
Database VM
Java VM
Mail VM
File server VM
Web VM
Standby VM
… …
WHITE PAPER PERFORMANCE REPORT PRIMERGY RX600 S5 VERSION: 1.4 2011-06-30
© Fujitsu Technology Solutions 2010-2011 Page 33 (38)
Benchmark results
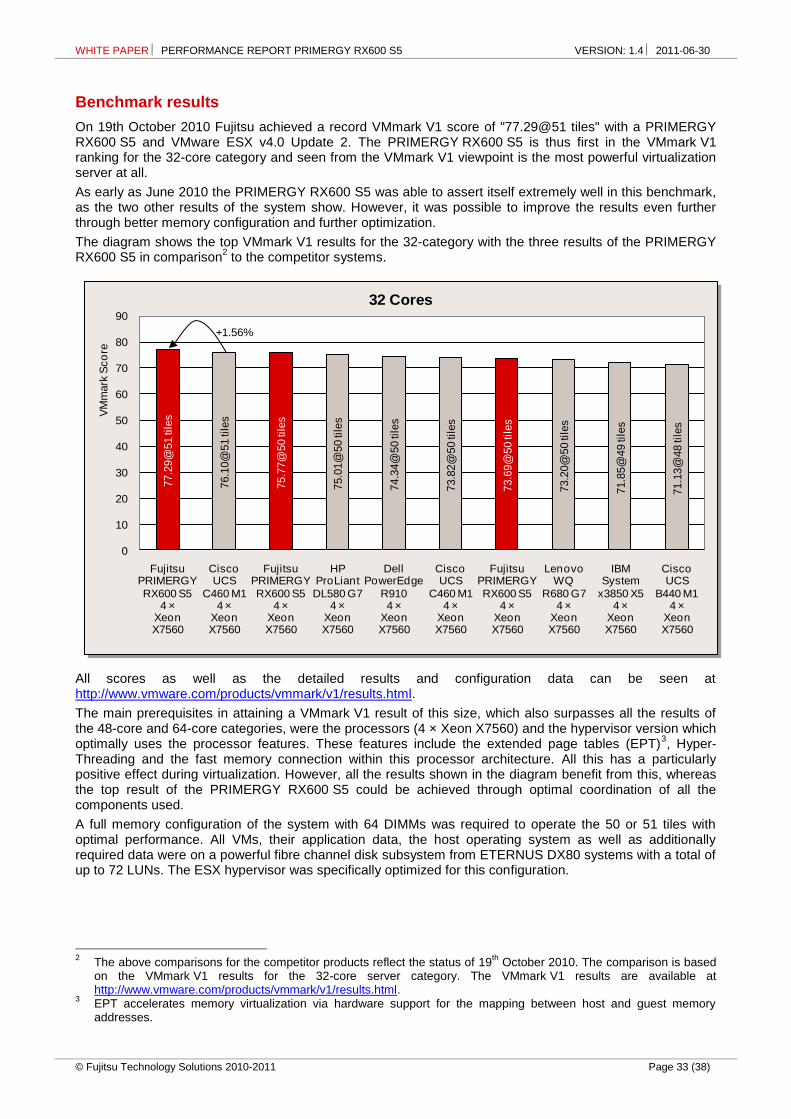
On 19th October 2010 Fujitsu achieved a record VMmark V1 score of "77.29@51 tiles" with a PRIMERGY RX600 S5 and VMware ESX v4.0 Update 2. The PRIMERGY RX600 S5 is thus first in the VMmark V1 ranking for the 32-core category and seen from the VMmark V1 viewpoint is the most powerful virtualization server at all.
As early as June 2010 the PRIMERGY RX600 S5 was able to assert itself extremely well in this benchmark, as the two other results of the system show. However, it was possible to improve the results even further through better memory configuration and further optimization.
The diagram shows the top VMmark V1 results for the 32-category with the three results of the PRIMERGY RX600 S5 in comparison
2 to the competitor systems.
All scores as well as the detailed results and configuration data can be seen at http://www.vmware.com/products/vmmark/v1/results.html.
The main prerequisites in attaining a VMmark V1 result of this size, which also surpasses all the results of the 48-core and 64-core categories, were the processors (4 × Xeon X7560) and the hypervisor version which optimally uses the processor features. These features include the extended page tables (EPT)
3, Hyper-
Threading and the fast memory connection within this processor architecture. All this has a particularly positive effect during virtualization. However, all the results shown in the diagram benefit from this, whereas the top result of the PRIMERGY RX600 S5 could be achieved through optimal coordination of all the components used.
A full memory configuration of the system with 64 DIMMs was required to operate the 50 or 51 tiles with optimal performance. All VMs, their application data, the host operating system as well as additionally required data were on a powerful fibre channel disk subsystem from ETERNUS DX80 systems with a total of up to 72 LUNs. The ESX hypervisor was specifically optimized for this configuration.
2 The above comparisons for the competitor products reflect the status of 19
th October 2010. The comparison is based
on the VMmark V1 results for the 32-core server category. The VMmark V1 results are available at http://www.vmware.com/products/vmmark/v1/results.html.
3 EPT accelerates memory virtualization via hardware support for the mapping between host and guest memory
addresses.
77.2
9@
51 ti
les
76.1
0@
51 ti
les
75.7
7@
50 ti
les
75.0
1@
50 ti
les
74.3
4@
50 ti
les
73.8
2@
50 ti
les
73.6
9@
50 ti
les
73.2
0@
50 ti
les
71.8
5@
49 ti
les
71.1
3@
48 ti
les
0
10
20
30
40
50
60
70
80
90
FujitsuPRIMERGY
RX600 S54 ×
XeonX7560
CiscoUCS
C460 M1 4 ×
XeonX7560
FujitsuPRIMERGY
RX600 S54 ×
XeonX7560
HPProLiant
DL580 G74 ×
XeonX7560
DellPowerEdge
R9104 ×
XeonX7560
CiscoUCS
C460 M1 4 ×
XeonX7560
FujitsuPRIMERGY
RX600 S54 ×
XeonX7560
LenovoWQ
R680 G74 ×
XeonX7560
IBMSystem
x3850 X54 ×
XeonX7560
CiscoUCS
B440 M14 ×
XeonX7560
32 Cores
+1.56%
VM
mark
Sco
re
WHITE PAPER PERFORMANCE REPORT PRIMERGY RX600 S5 VERSION: 1.4 2011-06-30
Page 34 (38) © Fujitsu Technology Solutions 2010-2011
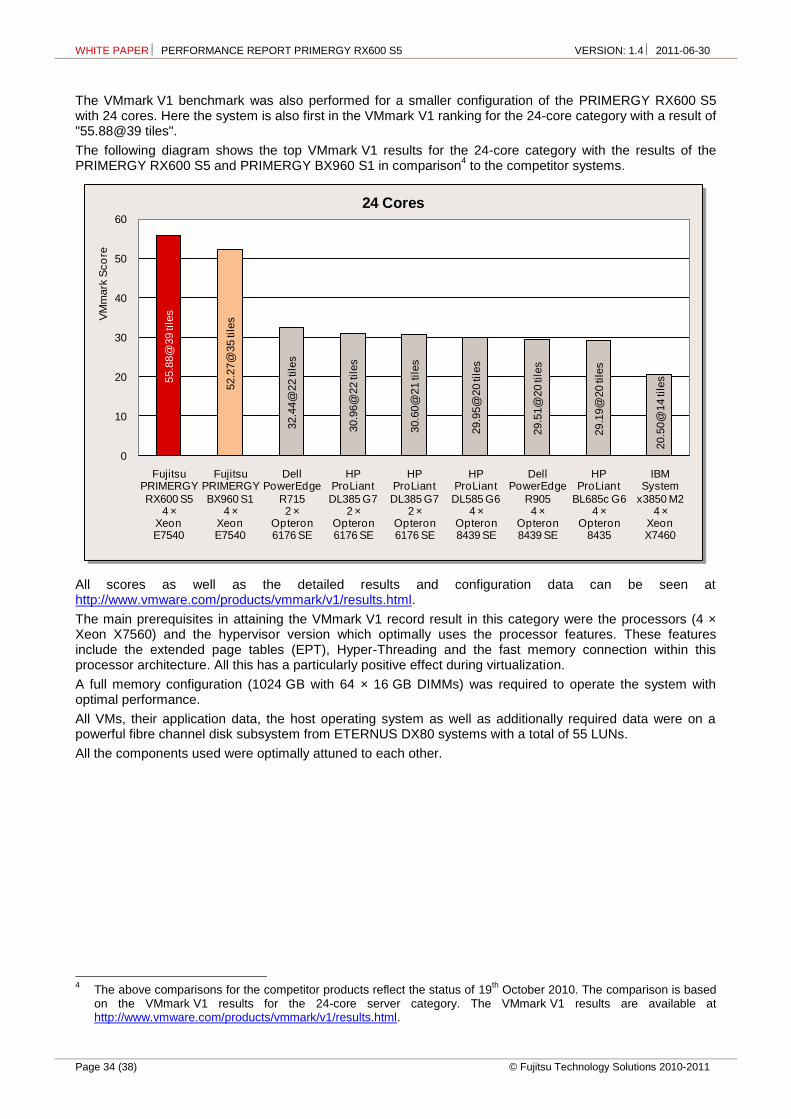
The VMmark V1 benchmark was also performed for a smaller configuration of the PRIMERGY RX600 S5 with 24 cores. Here the system is also first in the VMmark V1 ranking for the 24-core category with a result of "55.88@39 tiles".
The following diagram shows the top VMmark V1 results for the 24-core category with the results of the PRIMERGY RX600 S5 and PRIMERGY BX960 S1 in comparison
4 to the competitor systems.
All scores as well as the detailed results and configuration data can be seen at http://www.vmware.com/products/vmmark/v1/results.html.
The main prerequisites in attaining the VMmark V1 record result in this category were the processors (4 × Xeon X7560) and the hypervisor version which optimally uses the processor features. These features include the extended page tables (EPT), Hyper-Threading and the fast memory connection within this processor architecture. All this has a particularly positive effect during virtualization.
A full memory configuration (1024 GB with 64 × 16 GB DIMMs) was required to operate the system with optimal performance.
All VMs, their application data, the host operating system as well as additionally required data were on a powerful fibre channel disk subsystem from ETERNUS DX80 systems with a total of 55 LUNs.
All the components used were optimally attuned to each other.
4 The above comparisons for the competitor products reflect the status of 19
th October 2010. The comparison is based
on the VMmark V1 results for the 24-core server category. The VMmark V1 results are available at http://www.vmware.com/products/vmmark/v1/results.html.
55.8
8@
39 ti
les
52.2
7@
35 ti
les
32.4
4@
22 ti
les
30.9
6@
22 ti
les
30.6
0@
21 ti
les
29.9
5@
20 ti
les
29.5
1@
20 ti
les
29.1
9@
20 ti
les
20.5
0@
14 ti
les
0
10
20
30
40
50
60
FujitsuPRIMERGY
RX600 S54 ×
XeonE7540
FujitsuPRIMERGY
BX960 S14 ×
XeonE7540
DellPowerEdge
R7152 ×
Opteron6176 SE
HPProLiant
DL385 G72 ×
Opteron6176 SE
HPProLiant
DL385 G72 ×
Opteron6176 SE
HPProLiant
DL585 G64 ×
Opteron8439 SE
DellPowerEdge
R9054 ×
Opteron8439 SE
HPProLiant
BL685c G64 ×
Opteron8435
IBMSystem
x3850 M24 ×
XeonX7460
24 Cores
VM
mark
Sco
re
WHITE PAPER PERFORMANCE REPORT PRIMERGY RX600 S5 VERSION: 1.4 2011-06-30
© Fujitsu Technology Solutions 2010-2011 Page 35 (38)
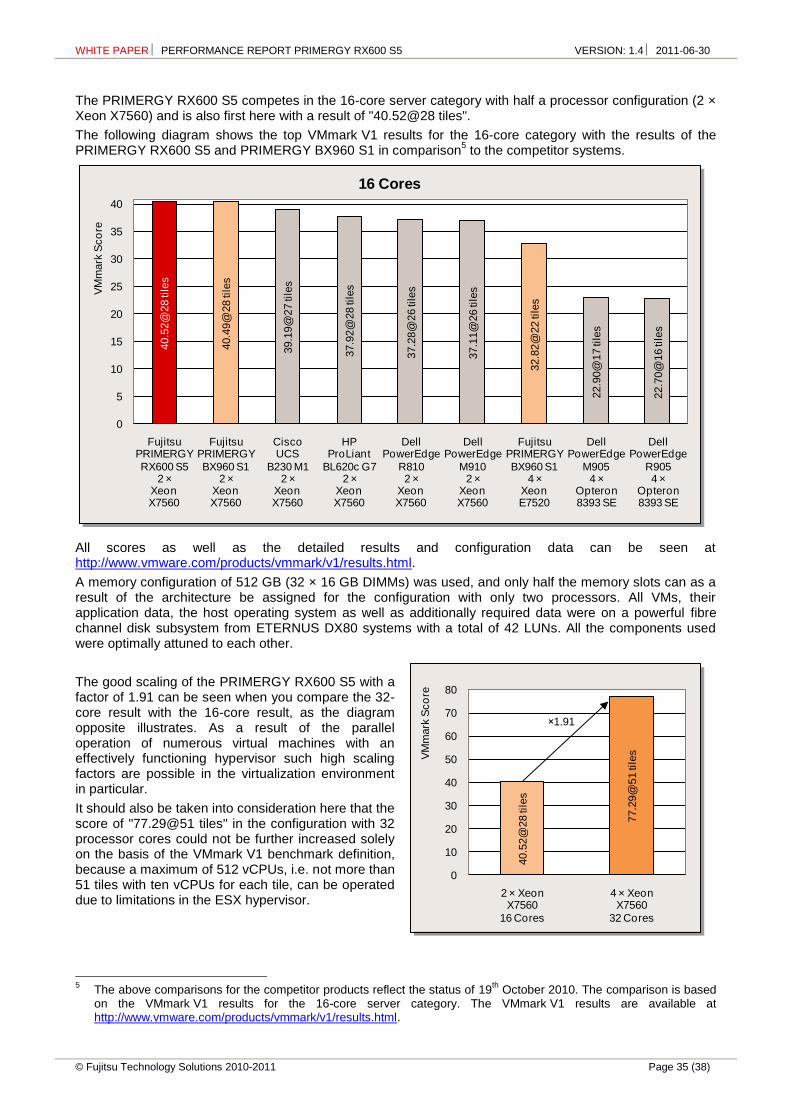
The PRIMERGY RX600 S5 competes in the 16-core server category with half a processor configuration (2 × Xeon X7560) and is also first here with a result of "40.52@28 tiles".
The following diagram shows the top VMmark V1 results for the 16-core category with the results of the PRIMERGY RX600 S5 and PRIMERGY BX960 S1 in comparison
5 to the competitor systems.
All scores as well as the detailed results and configuration data can be seen at http://www.vmware.com/products/vmmark/v1/results.html.
A memory configuration of 512 GB (32 × 16 GB DIMMs) was used, and only half the memory slots can as a result of the architecture be assigned for the configuration with only two processors. All VMs, their application data, the host operating system as well as additionally required data were on a powerful fibre channel disk subsystem from ETERNUS DX80 systems with a total of 42 LUNs. All the components used were optimally attuned to each other.
The good scaling of the PRIMERGY RX600 S5 with a factor of 1.91 can be seen when you compare the 32-core result with the 16-core result, as the diagram opposite illustrates. As a result of the parallel operation of numerous virtual machines with an effectively functioning hypervisor such high scaling factors are possible in the virtualization environment in particular.
It should also be taken into consideration here that the score of "77.29@51 tiles" in the configuration with 32 processor cores could not be further increased solely on the basis of the VMmark V1 benchmark definition, because a maximum of 512 vCPUs, i.e. not more than 51 tiles with ten vCPUs for each tile, can be operated due to limitations in the ESX hypervisor.
5 The above comparisons for the competitor products reflect the status of 19
th October 2010. The comparison is based
on the VMmark V1 results for the 16-core server category. The VMmark V1 results are available at http://www.vmware.com/products/vmmark/v1/results.html.
40.5
2@
28 ti
les
40.4
9@
28 ti
les
39.1
9@
27 ti
les
37.9
2@
28 ti
les
37.2
8@
26 ti
les
37.1
1@
26 ti
les
32.8
2@
22 ti
les
22.9
0@
17 ti
les
22.7
0@
16 ti
les
0
5
10
15
20
25
30
35
40
FujitsuPRIMERGY
RX600 S52 ×
XeonX7560
FujitsuPRIMERGY
BX960 S12 ×
XeonX7560
CiscoUCS
B230 M12 ×
XeonX7560
HPProLiant
BL620c G72 ×
XeonX7560
DellPowerEdge
R8102 ×
XeonX7560
DellPowerEdge
M9102 ×
XeonX7560
FujitsuPRIMERGY
BX960 S14 ×
XeonE7520
DellPowerEdge
M9054 ×
Opteron8393 SE
DellPowerEdge
R9054 ×
Opteron8393 SE
16 Cores
VM
mark
Sco
re
40.5
2@
28 ti
les
77.2
9@
51 ti
les
0
10
20
30
40
50
60
70
80
2 × XeonX7560
16 Cores
4 × XeonX7560
32 Cores
1.91
VM
mark
Sco
re
WHITE PAPER PERFORMANCE REPORT PRIMERGY RX600 S5 VERSION: 1.4 2011-06-30
Page 36 (38) © Fujitsu Technology Solutions 2010-2011
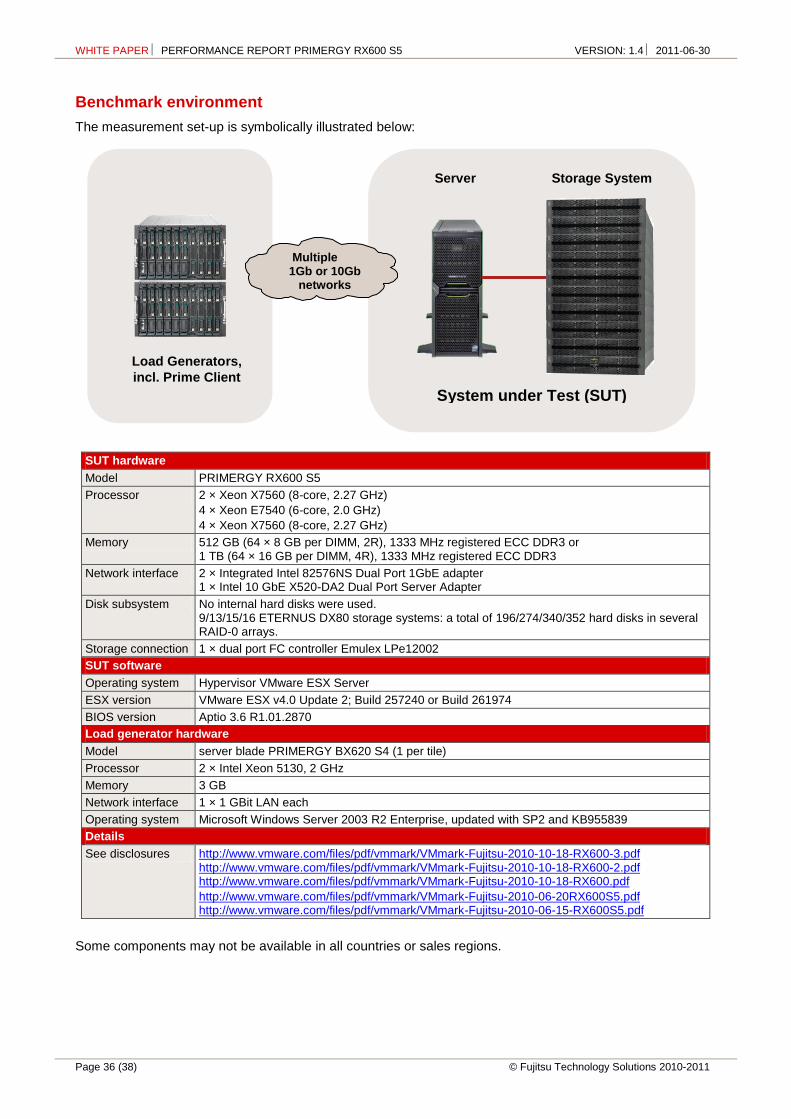
Benchmark environment
The measurement set-up is symbolically illustrated below:
SUT hardware
Model PRIMERGY RX600 S5
Processor 2 × Xeon X7560 (8-core, 2.27 GHz)
4 × Xeon E7540 (6-core, 2.0 GHz)
4 × Xeon X7560 (8-core, 2.27 GHz)
Memory 512 GB (64 × 8 GB per DIMM, 2R), 1333 MHz registered ECC DDR3 or 1 TB (64 × 16 GB per DIMM, 4R), 1333 MHz registered ECC DDR3
Network interface 2 × Integrated Intel 82576NS Dual Port 1GbE adapter 1 × Intel 10 GbE X520-DA2 Dual Port Server Adapter
Disk subsystem No internal hard disks were used. 9/13/15/16 ETERNUS DX80 storage systems: a total of 196/274/340/352 hard disks in several RAID-0 arrays.
Storage connection 1 × dual port FC controller Emulex LPe12002
SUT software
Operating system Hypervisor VMware ESX Server
ESX version VMware ESX v4.0 Update 2; Build 257240 or Build 261974
BIOS version Aptio 3.6 R1.01.2870
Load generator hardware
Model server blade PRIMERGY BX620 S4 (1 per tile)
Processor 2 × Intel Xeon 5130, 2 GHz
Memory 3 GB
Network interface 1 × 1 GBit LAN each
Operating system Microsoft Windows Server 2003 R2 Enterprise, updated with SP2 and KB955839
Details
See disclosures http://www.vmware.com/files/pdf/vmmark/VMmark-Fujitsu-2010-10-18-RX600-3.pdf http://www.vmware.com/files/pdf/vmmark/VMmark-Fujitsu-2010-10-18-RX600-2.pdf http://www.vmware.com/files/pdf/vmmark/VMmark-Fujitsu-2010-10-18-RX600.pdf
http://www.vmware.com/files/pdf/vmmark/VMmark-Fujitsu-2010-06-20RX600S5.pdf http://www.vmware.com/files/pdf/vmmark/VMmark-Fujitsu-2010-06-15-RX600S5.pdf
Some components may not be available in all countries or sales regions.
Multiple
1Gb or 10Gb networks
Load Generators,
incl. Prime Client
Server Storage System
System under Test (SUT)
WHITE PAPER PERFORMANCE REPORT PRIMERGY RX600 S5 VERSION: 1.4 2011-06-30
© Fujitsu Technology Solutions 2010-2011 Page 37 (38)
Literature
PRIMERGY Systems
http://ts.fujitsu.com/primergy
PRIMERGY RX600 S5
Data sheet http://docs.ts.fujitsu.com/dl.aspx?id=bd8615ca-a35f-45a6-8e7d-8d34fe9ae0e0
Memory performance of Xeon 7500 (Nehalem-EX) based systems http://docs.ts.fujitsu.com/dl.aspx?id=b3bfe45f-1ca8-43fc-8e32-c2a4534b4b3b
PRIMERGY Performance
http://ts.fujitsu.com/products/standard_servers/primergy_bov.html
OLTP-2
Benchmark Overview OLTP-2 http://docs.ts.fujitsu.com/dl.aspx?id=e6f7a4c9-aff6-4598-b199-836053214d3f
SAP BI-D
http://www.sap.com/benchmark
SAP SD
http://www.sap.com/benchmark
Benchmark overview SAP SD http://docs.ts.fujitsu.com/dl.aspx?id=0a1e69a6-e366-4fd1-a1a6-0dd93148ea10
SPECcpu2006
http://www.spec.org/osg/cpu2006
Benchmark overview SPECcpu2006 http://docs.ts.fujitsu.com/dl.aspx?id=1a427c16-12bf-41b0-9ca3-4cc360ef14ce
SPECjbb2005
http://www.spec.org/jbb2005
Benchmark overview SPECjbb2005 http://docs.ts.fujitsu.com/dl.aspx?id=5411e8f9-8c56-4ee9-9b3b-98981ab3e820
TPC-E
http://www.tpc.org/tpce
Benchmark Overview TPC-E http://docs.ts.fujitsu.com/dl.aspx?id=da0ce7b7-3d80-48cd-9b3a-d12e0b40ed6d
VMmark V1
Benchmark overview VMmark V1 http://docs.ts.fujitsu.com/dl.aspx?id=5cbc7fe2-e493-479d-b52a-f88dc46efe21
VMmark V1 http://www.vmware.com/products/vmmark/v1/overview.html
VMmark V1 results http://www.vmware.com/products/vmmark/v1/results.html
vServCon
Benchmark Overview vServCon http://docs.ts.fujitsu.com/dl.aspx?id=b953d1f3-6f98-4b93-95f5-8c8ba3db4e59
WHITE PAPER PERFORMANCE REPORT PRIMERGY RX600 S5 VERSION: 1.4 2011-06-30
Page 38 (38) © Fujitsu Technology Solutions 2010-2011
Contact
FUJITSU Technology Solutions
Website: http://ts.fujitsu.com
PRIMERGY Product Marketing
mailto:[email protected]
PRIMERGY Performance and Benchmarks
mailto:[email protected]
All rights reserved, including intellectual property rights. Technical data subject to modifications and delivery subject to availability. Any liability that the data and illustrations are complete, actual or correct is excluded. Designations may be trademarks and/or copyrights of the respective manufacturer, the use of which by third parties for their own purposes may infringe the rights of such owner. For further information see http://ts.fujitsu.com/terms_of_use.html
2011-06-30 WW EN Copyright © Fujitsu Technology Solutions GmbH 2010-2011