Embed Size (px)
Citation preview

WHITE PAPER PERFORMANCE REPORT PRIMERGY RX350 S7
© Fujitsu Technology Solutions 2012-2013 Page 1 (54)
WHITE PAPER FUJITSU PRIMERGY SERVERS PERFORMANCE REPORT PRIMERGY RX350 S7
This document contains a summary of the benchmarks executed for the PRIMERGY RX350 S7.
The PRIMERGY RX350 S7 performance data are compared with the data of other PRIMERGY models and discussed. In addition to the benchmark results, an explanation has been included for each benchmark and for the benchmark environment.
Version
1.4
2013-05-08
WHITE PAPER PERFORMANCE REPORT PRIMERGY RX350 S7 VERSION: 1.4 2013-05-08
Page 2 (54) © Fujitsu Technology Solutions 2012-2013
Contents
Document history ................................................................................................................................................ 3
Technical data .................................................................................................................................................... 4
SPECcpu2006 .................................................................................................................................................... 7
SPECjbb2005 ................................................................................................................................................... 14
SPECpower_ssj2008 ........................................................................................................................................ 16
Disk I/O ............................................................................................................................................................. 21
OLTP-2 ............................................................................................................................................................. 28
vServCon .......................................................................................................................................................... 32
VMmark V2 ....................................................................................................................................................... 39
STREAM ........................................................................................................................................................... 43
LINPACK .......................................................................................................................................................... 45
Literature ........................................................................................................................................................... 53
Contact ............................................................................................................................................................. 54
WHITE PAPER PERFORMANCE REPORT PRIMERGY RX350 S7 VERSION: 1.4 2013-05-08
© Fujitsu Technology Solutions 2012-2013 Page 3 (54)
Document history
Version 1.0
New:
Technical data SPECcpu2006
Measurements with processors of Xeon series E5-2600 SPECjbb2005
Measurement with Xeon E5-2690 OLTP-2
Results for Xeon E5-2600 processor series vServCon
Results for Xeon E5-2600 processor series VMmark V2
Measurement with Xeon E5-2690 STREAM
Measurements with Xeon E5-2600 processor series LINPACK
Measurements with Xeon E5-2600 processor series
Version 1.0a
Minor corrections
Version 1.1
New:
SPECpower_ssj2008 Measurement with Oracle Java HotSpot VM
Version 1.2
New:
Disk I/O Measurements with “LSI SW RAID on Intel C600 (Onboard SATA)”, “LSI SW RAID on Intel C600 (Onboard SAS)”, “RAID Ctrl SAS 6G 0/1”,“RAID Ctrl SAS 5/6 512MB (D2616)” and “RAID Ctrl SAS 6G 5/6 1GB (D3116)” controllers
Updated:
SPECpower_ssj2008 Measurement with IBM J9 VM
LINPACK Measurements with 2 × Xeon E5-2690 and up to 2 × PY NVIDIA Tesla C2075 GPGPU
Version 1.3
Updated:
Technical data GPGPUs/coprocessors added
LINPACK Measurements with 2 × Xeon E5-2690 and up to 2 × PY NVIDIA Tesla K20 GPGPU Measurements with 2 × Xeon E5-2690 and up to 2 × PY NVIDIA Tesla K20X GPGPU
Version 1.4
Updated:
LINPACK Measurements with 2 × Xeon E5-2690 and up to 2 × Intel Xeon Phi Co-Processor 5110P
WHITE PAPER PERFORMANCE REPORT PRIMERGY RX350 S7 VERSION: 1.4 2013-05-08
Page 4 (54) © Fujitsu Technology Solutions 2012-2013
Technical data
Decimal prefixes according to the SI standard are used for measurement units in this white paper (e.g. 1 GB = 10
9 bytes). In contrast, these prefixes should be interpreted as binary prefixes (e.g. 1 GB = 2
30 bytes) for
the capacities of caches and storage modules. Separate reference will be made to any further exceptions where applicable.
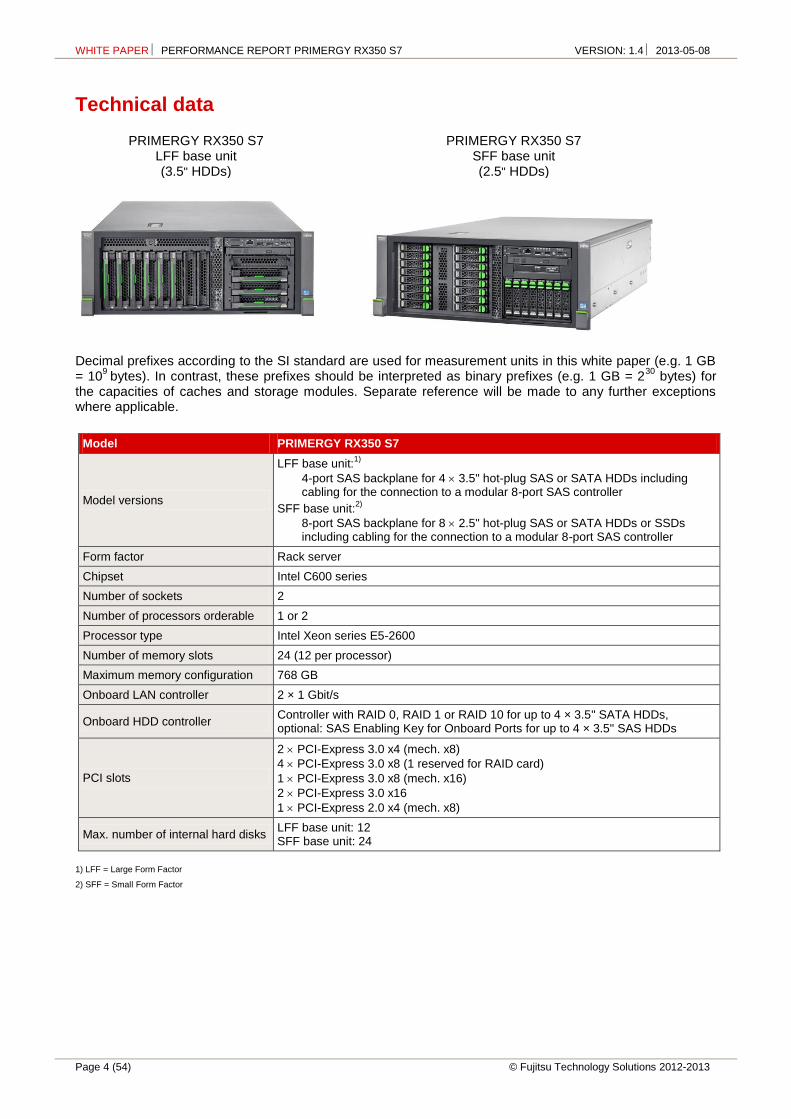
Model PRIMERGY RX350 S7
Model versions
LFF base unit:1)
4-port SAS backplane for 4 3.5" hot-plug SAS or SATA HDDs including cabling for the connection to a modular 8-port SAS controller
SFF base unit:2)
8-port SAS backplane for 8 2.5" hot-plug SAS or SATA HDDs or SSDs including cabling for the connection to a modular 8-port SAS controller
Form factor Rack server
Chipset Intel C600 series
Number of sockets 2
Number of processors orderable 1 or 2
Processor type Intel Xeon series E5-2600
Number of memory slots 24 (12 per processor)
Maximum memory configuration 768 GB
Onboard LAN controller 2 × 1 Gbit/s
Onboard HDD controller Controller with RAID 0, RAID 1 or RAID 10 for up to 4 × 3.5" SATA HDDs, optional: SAS Enabling Key for Onboard Ports for up to 4 × 3.5" SAS HDDs
PCI slots
2 PCI-Express 3.0 x4 (mech. x8)
4 PCI-Express 3.0 x8 (1 reserved for RAID card)
1 PCI-Express 3.0 x8 (mech. x16)
2 PCI-Express 3.0 x16
1 PCI-Express 2.0 x4 (mech. x8)
Max. number of internal hard disks LFF base unit: 12 SFF base unit: 24
1) LFF = Large Form Factor
2) SFF = Small Form Factor
PRIMERGY RX350 S7 LFF base unit (3.5" HDDs)
PRIMERGY RX350 S7 SFF base unit (2.5" HDDs)
WHITE PAPER PERFORMANCE REPORT PRIMERGY RX350 S7 VERSION: 1.4 2013-05-08
© Fujitsu Technology Solutions 2012-2013 Page 5 (54)
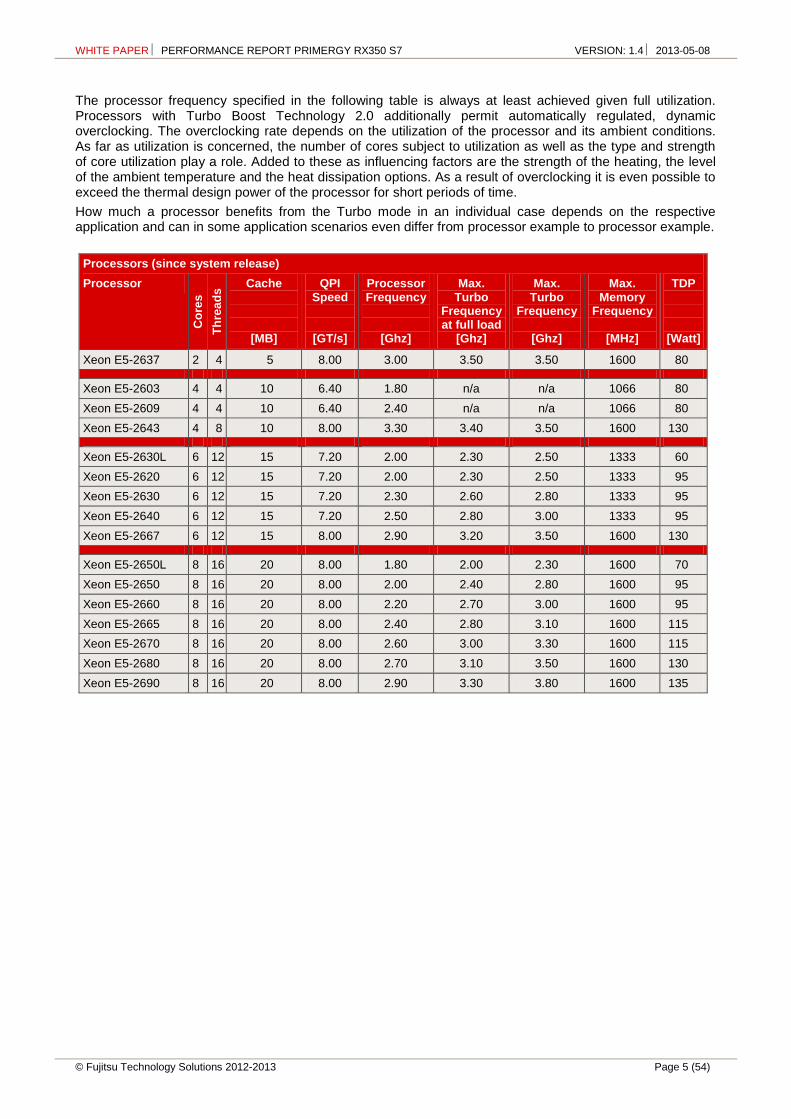
The processor frequency specified in the following table is always at least achieved given full utilization. Processors with Turbo Boost Technology 2.0 additionally permit automatically regulated, dynamic overclocking. The overclocking rate depends on the utilization of the processor and its ambient conditions. As far as utilization is concerned, the number of cores subject to utilization as well as the type and strength of core utilization play a role. Added to these as influencing factors are the strength of the heating, the level of the ambient temperature and the heat dissipation options. As a result of overclocking it is even possible to exceed the thermal design power of the processor for short periods of time.
How much a processor benefits from the Turbo mode in an individual case depends on the respective application and can in some application scenarios even differ from processor example to processor example.
Processors (since system release)
Processor
Co
res
Th
rea
ds Cache
[MB]
QPI Speed
[GT/s]
Processor Frequency
[Ghz]
Max. Turbo
Frequency at full load
[Ghz]
Max. Turbo
Frequency
[Ghz]
Max. Memory
Frequency
[MHz]
TDP
[Watt]
Xeon E5-2637 2 4 5 8.00 3.00 3.50 3.50 1600 80
Xeon E5-2603 4 4 10 6.40 1.80 n/a n/a 1066 80
Xeon E5-2609 4 4 10 6.40 2.40 n/a n/a 1066 80
Xeon E5-2643 4 8 10 8.00 3.30 3.40 3.50 1600 130
Xeon E5-2630L 6 12 15 7.20 2.00 2.30 2.50 1333 60
Xeon E5-2620 6 12 15 7.20 2.00 2.30 2.50 1333 95
Xeon E5-2630 6 12 15 7.20 2.30 2.60 2.80 1333 95
Xeon E5-2640 6 12 15 7.20 2.50 2.80 3.00 1333 95
Xeon E5-2667 6 12 15 8.00 2.90 3.20 3.50 1600 130
Xeon E5-2650L 8 16 20 8.00 1.80 2.00 2.30 1600 70
Xeon E5-2650 8 16 20 8.00 2.00 2.40 2.80 1600 95
Xeon E5-2660 8 16 20 8.00 2.20 2.70 3.00 1600 95
Xeon E5-2665 8 16 20 8.00 2.40 2.80 3.10 1600 115
Xeon E5-2670 8 16 20 8.00 2.60 3.00 3.30 1600 115
Xeon E5-2680 8 16 20 8.00 2.70 3.10 3.50 1600 130
Xeon E5-2690 8 16 20 8.00 2.90 3.30 3.80 1600 135

WHITE PAPER PERFORMANCE REPORT PRIMERGY RX350 S7 VERSION: 1.4 2013-05-08
Page 6 (54) © Fujitsu Technology Solutions 2012-2013
Memory modules (since system release)
Memory module
Ca
pa
cit
y [
GB
]
Ra
nk
s
Bit
wid
th o
f th
e
me
mo
ry c
hip
s
Fre
qu
en
cy
[M
Hz]
Lo
w v
olt
ag
e
Lo
ad
re
du
ce
d
Re
gis
tere
d
EC
C
2GB (1x2GB) 1Rx8 L DDR3-1600 U ECC (2 GB 1Rx8 PC3L-12800E)
2 1 8 1600
4GB (1x4GB) 2Rx8 L DDR3-1600 U ECC (4 GB 2Rx8 PC3L-12800E)
4 2 8 1600
4GB (1x4GB) 1Rx4 L DDR3-1333 R ECC (4 GB 1Rx4 PC3L-10600R)
4 1 4 1333
4GB (1x4GB) 1Rx4 L DDR3-1600 R ECC (4 GB 1Rx4 PC3L-12800R)
4 1 4 1600
4GB (1x4GB) 2Rx8 L DDR3-1600 R ECC (4 GB 2Rx8 PC3L-12800R)
4 2 8 1600
8GB (1x8GB) 2Rx4 L DDR3-1333 R ECC (8 GB 2Rx4 PC3L-10600R)
8 2 4 1333
8GB (1x8GB) 2Rx4 L DDR3-1600 R ECC (8 GB 2Rx4 PC3L-12800R)
8 2 4 1600
16GB (1x16GB) 4Rx4 L DDR3-1333 LR ECC (16 GB 4Rx4 PC3L-10600L)
16 4 4 1333
16GB (1x16GB) 2Rx4 L DDR3-1600 R ECC (16 GB 2Rx4 PC3L-12800R)
16 2 4 1600
32GB (1x32GB) 4Rx4 L DDR3-1333 LR ECC (32 GB 4Rx4 PC3L-10600L)
32 4 4 1333
GPGPUs/coprocessors (since system release)
GPGPU/coprocessor Cores Peak double precision floating point performance
[GFlops]
Max. number of GPGPUs
PY NVIDIA Tesla C2075 GPGPU 448 515 2
PY NVIDIA Tesla K20 GPGPU 2496 1170 2
PY NVIDIA Tesla K20X GPGPU 2688 1310 2
Intel Xeon Phi Co-Processor 5110P 60 1011 2
Power supplies (since system release) Max. number
Power supply 450W (hot-plug) 4
Power supply 800W (hot-plug) 4
Some components may not be available in all countries or sales regions.
Detailed technical information is available in the data sheet PRIMERGY RX350 S7.
WHITE PAPER PERFORMANCE REPORT PRIMERGY RX350 S7 VERSION: 1.4 2013-05-08
© Fujitsu Technology Solutions 2012-2013 Page 7 (54)
SPECcpu2006
Benchmark description
SPECcpu2006 is a benchmark which measures the system efficiency with integer and floating-point operations. It consists of an integer test suite (SPECint2006) containing 12 applications and a floating-point test suite (SPECfp2006) containing 17 applications. Both test suites are extremely computing-intensive and concentrate on the CPU and the memory. Other components, such as Disk I/O and network, are not measured by this benchmark.
SPECcpu2006 is not tied to a special operating system. The benchmark is available as source code and is compiled before the actual measurement. The used compiler version and their optimization settings also affect the measurement result.
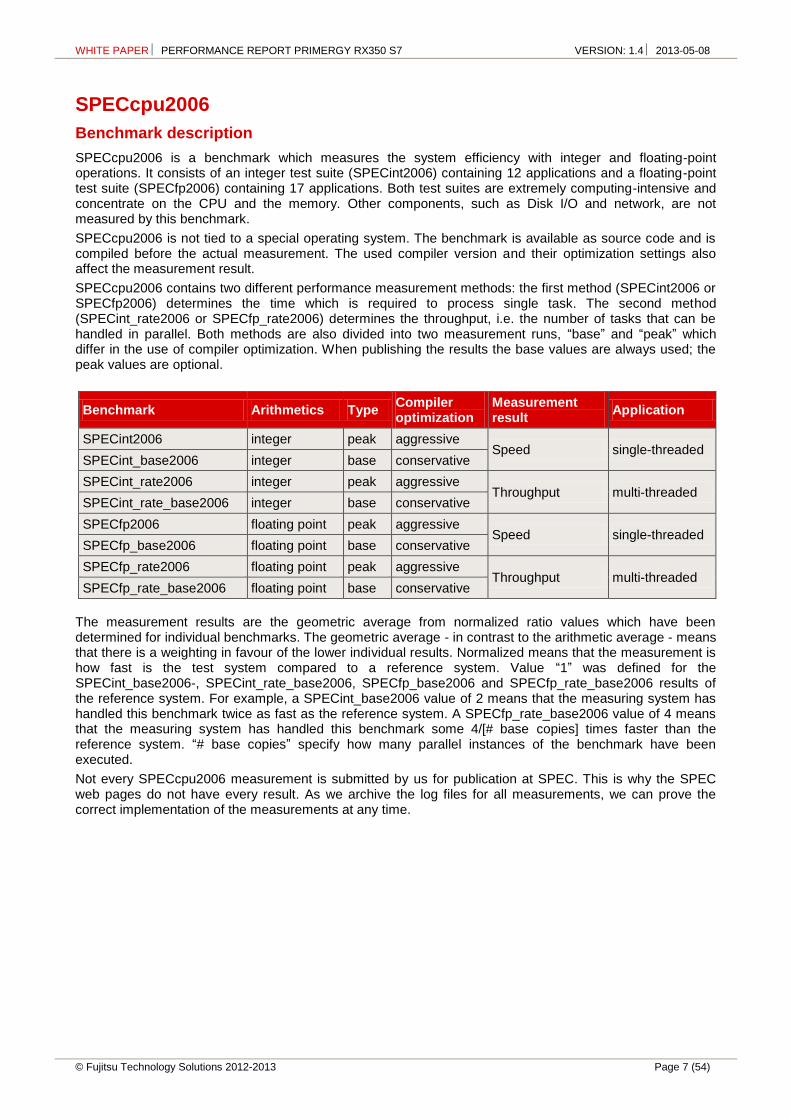
SPECcpu2006 contains two different performance measurement methods: the first method (SPECint2006 or SPECfp2006) determines the time which is required to process single task. The second method (SPECint_rate2006 or SPECfp_rate2006) determines the throughput, i.e. the number of tasks that can be handled in parallel. Both methods are also divided into two measurement runs, “base” and “peak” which differ in the use of compiler optimization. When publishing the results the base values are always used; the peak values are optional.
Benchmark Arithmetics Type Compiler optimization
Measurement result
Application
SPECint2006 integer peak aggressive Speed single-threaded
SPECint_base2006 integer base conservative
SPECint_rate2006 integer peak aggressive Throughput multi-threaded
SPECint_rate_base2006 integer base conservative
SPECfp2006 floating point peak aggressive Speed single-threaded
SPECfp_base2006 floating point base conservative
SPECfp_rate2006 floating point peak aggressive Throughput multi-threaded
SPECfp_rate_base2006 floating point base conservative
The measurement results are the geometric average from normalized ratio values which have been determined for individual benchmarks. The geometric average - in contrast to the arithmetic average - means that there is a weighting in favour of the lower individual results. Normalized means that the measurement is how fast is the test system compared to a reference system. Value “1” was defined for the SPECint_base2006-, SPECint_rate_base2006, SPECfp_base2006 and SPECfp_rate_base2006 results of the reference system. For example, a SPECint_base2006 value of 2 means that the measuring system has handled this benchmark twice as fast as the reference system. A SPECfp_rate_base2006 value of 4 means that the measuring system has handled this benchmark some 4/[# base copies] times faster than the reference system. “# base copies” specify how many parallel instances of the benchmark have been executed.
Not every SPECcpu2006 measurement is submitted by us for publication at SPEC. This is why the SPEC web pages do not have every result. As we archive the log files for all measurements, we can prove the correct implementation of the measurements at any time.
WHITE PAPER PERFORMANCE REPORT PRIMERGY RX350 S7 VERSION: 1.4 2013-05-08
Page 8 (54) © Fujitsu Technology Solutions 2012-2013
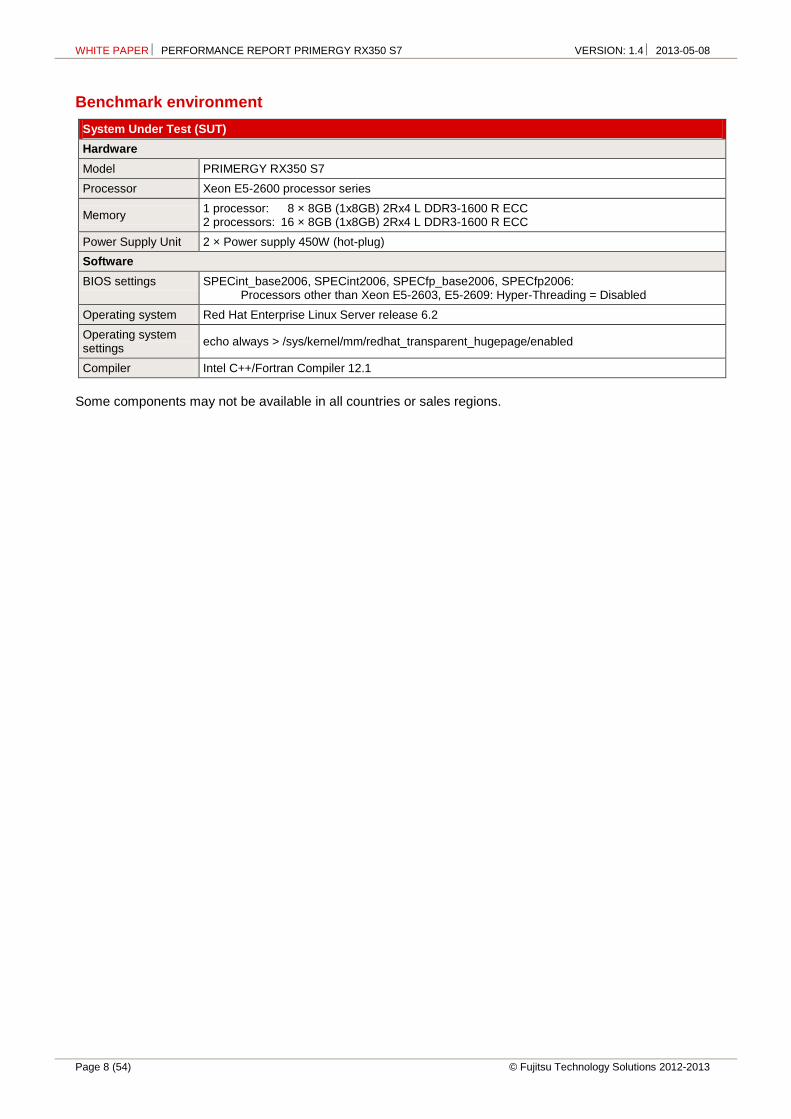
Benchmark environment
System Under Test (SUT)
Hardware
Model PRIMERGY RX350 S7
Processor Xeon E5-2600 processor series
Memory 1 processor: 8 × 8GB (1x8GB) 2Rx4 L DDR3-1600 R ECC 2 processors: 16 × 8GB (1x8GB) 2Rx4 L DDR3-1600 R ECC
Power Supply Unit 2 × Power supply 450W (hot-plug)
Software
BIOS settings SPECint_base2006, SPECint2006, SPECfp_base2006, SPECfp2006: Processors other than Xeon E5-2603, E5-2609: Hyper-Threading = Disabled
Operating system Red Hat Enterprise Linux Server release 6.2
Operating system settings
echo always > /sys/kernel/mm/redhat_transparent_hugepage/enabled
Compiler Intel C++/Fortran Compiler 12.1
Some components may not be available in all countries or sales regions.

WHITE PAPER PERFORMANCE REPORT PRIMERGY RX350 S7 VERSION: 1.4 2013-05-08
© Fujitsu Technology Solutions 2012-2013 Page 9 (54)
Benchmark results
In terms of processors the benchmark result depends primarily on the size of the processor cache, the support for Hyper-Threading, the number of processor cores and on the processor frequency. In the case of processors with Turbo mode the number of cores, which are loaded by the benchmark, determines the maximum processor frequency that can be achieved. In the case of single-threaded benchmarks, which largely load one core only, the maximum processor frequency that can be achieved is higher than with multi-threaded benchmarks (see the processor table in the section "Technical Data").
Processor
Nu
mb
er
of
pro
ce
sso
rs
SP
EC
int_
ba
se2
006
SP
EC
int2
00
6
Nu
mb
er
of
pro
ce
sso
rs
SP
EC
int_
rate
_b
as
e20
06
SP
EC
int_
rate
200
6
Nu
mb
er
of
pro
ce
sso
rs
SP
EC
int_
rate
_b
as
e20
06
SP
EC
int_
rate
200
6
Xeon E5-2637 2 44.8 47.4 1 96.2 101 2 187 195
Xeon E5-2603 2 26.7 28.0 1 85.9 89.5 2 168 175
Xeon E5-2609 2 34.9 36.6 1 111 115 2 217 226
Xeon E5-2643 2 49.3 51.9 1 186 194 2 362 378
Xeon E5-2630L 2 36.9 39.2 1 193 202 2 377 393
Xeon E5-2620 2 36.8 39.1 1 192 201 2 376 392
Xeon E5-2630 2 41.0 43.4 1 214 223 2 417 436
Xeon E5-2640 2 44.0 46.8 1 227 238 2 444 464
Xeon E5-2667 2 50.3 53.7 1 258 269 2 503 525
Xeon E5-2650L 2 35.1 37.6 1 226 236 2 441 461
Xeon E5-2650 2 42.1 45.5 1 265 276 2 518 542
Xeon E5-2660 2 45.5 48.8 1 291 303 2 569 594
Xeon E5-2665 2 46.6 49.9 1 301 313 2 588 614
Xeon E5-2670 2 49.4 52.9 1 317 330 2 620 646
Xeon E5-2680 2 51.8 55.8 1 326 339 2 638 664
Xeon E5-2690 2 55.8 60.7 1 339 353 2 661 691

WHITE PAPER PERFORMANCE REPORT PRIMERGY RX350 S7 VERSION: 1.4 2013-05-08
Page 10 (54) © Fujitsu Technology Solutions 2012-2013
Processor
Nu
mb
er
of
pro
ce
sso
rs
SP
EC
fp_
ba
se2
00
6
SP
EC
fp2
00
6
Nu
mb
er
of
pro
ce
sso
rs
SP
EC
fp_
rate
_b
as
e20
06
SP
EC
fp_
rate
20
06
Nu
mb
er
of
pro
ce
sso
rs
SP
EC
fp_
rate
_b
as
e20
06
SP
EC
fp_
rate
20
06
Xeon E5-2637 2 65.7 67.6 1 89.0 92.1 2 175 181
Xeon E5-2603 2 45.3 47.0 1 90.1 91.7 2 177 182
Xeon E5-2609 2 56.7 58.8 1 110 114 2 217 221
Xeon E5-2643 2 78.0 81.5 1 163 168 2 323 331
Xeon E5-2630L 2 61.8 65.1 1 166 170 2 328 336
Xeon E5-2620 2 61.2 64.4 1 164 169 2 326 334
Xeon E5-2630 2 66.4 70.0 1 176 181 2 350 359
Xeon E5-2640 2 70.1 73.6 1 184 189 2 365 374
Xeon E5-2667 2 79.8 84.1 1 209 215 2 415 426
Xeon E5-2650L 2 58.0 61.6 1 192 196 2 377 387
Xeon E5-2650 2 66.7 70.9 1 212 218 2 420 432
Xeon E5-2660 2 71.9 75.6 1 225 232 2 446 459
Xeon E5-2665 2 75.2 79.5 1 230 237 2 455 469
Xeon E5-2670 2 77.0 81.4 1 237 244 2 470 484
Xeon E5-2680 2 79.0 83.7 1 241 249 2 479 493
Xeon E5-2690 2 86.6 92.7 1 248 256 2 491 507
WHITE PAPER PERFORMANCE REPORT PRIMERGY RX350 S7 VERSION: 1.4 2013-05-08
© Fujitsu Technology Solutions 2012-2013 Page 11 (54)
SPECint_base2006
SPECint2006
0
10
20
30
40
50
60
70
PRIMERGY TX300 S62 x Xeon X5687
PRIMERGY RX350 S72 x Xeon E5-2690
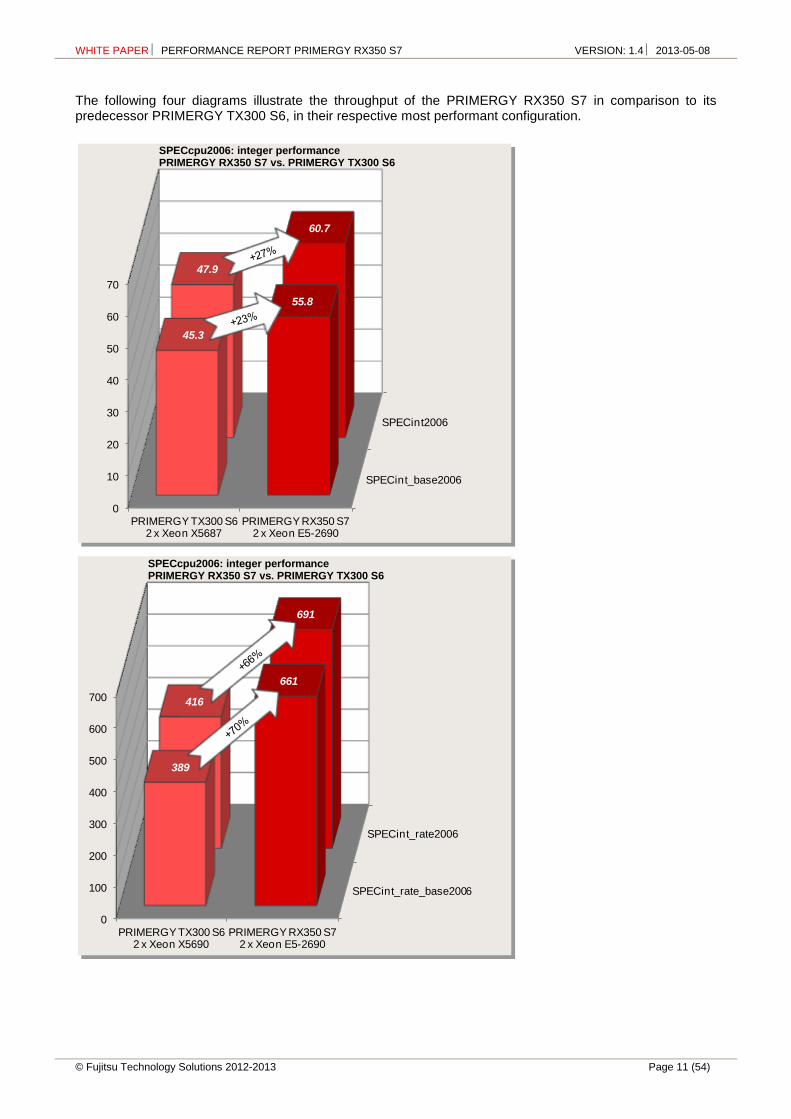
45.3
55.8
47.9
60.7
SPECint_rate_base2006
SPECint_rate2006
0
100
200
300
400
500
600
700
PRIMERGY TX300 S62 x Xeon X5690
PRIMERGY RX350 S72 x Xeon E5-2690
389
661
416
691
The following four diagrams illustrate the throughput of the PRIMERGY RX350 S7 in comparison to its predecessor PRIMERGY TX300 S6, in their respective most performant configuration.
SPECcpu2006: integer performance PRIMERGY RX350 S7 vs. PRIMERGY TX300 S6
SPECcpu2006: integer performance PRIMERGY RX350 S7 vs. PRIMERGY TX300 S6

WHITE PAPER PERFORMANCE REPORT PRIMERGY RX350 S7 VERSION: 1.4 2013-05-08
Page 12 (54) © Fujitsu Technology Solutions 2012-2013
SPECfp_base2006
SPECfp2006
0
10
20
30
40
50
60
70
80
90
100
PRIMERGY TX300 S62 x Xeon X5687
PRIMERGY RX350 S72 x Xeon E5-2690
62.0
86.665.7
92.7
SPECfp_rate_base2006
SPECfp_rate2006
0
100
200
300
400
500
600
PRIMERGY TX300 S62 x Xeon X5690
PRIMERGY RX350 S72 x Xeon E5-2690
266
491
273
507
SPECcpu2006: floating-point performance PRIMERGY RX350 S7 vs. PRIMERGY TX300 S6
SPECcpu2006: floating-point performance PRIMERGY RX350 S7 vs. PRIMERGY TX300 S6

WHITE PAPER PERFORMANCE REPORT PRIMERGY RX350 S7 VERSION: 1.4 2013-05-08
© Fujitsu Technology Solutions 2012-2013 Page 13 (54)
The two diagrams below reflect how the performance of the PRIMERGY RX350 S7 scales from one to two processors when using the Xeon E5-2690.
SPECint_rate_base2006
SPECint_rate2006
0
100
200
300
400
500
600
700
1 x Xeon E5-2690 2 x Xeon E5-2690
339
661
353
691
SPECfp_rate_base2006
SPECfp_rate2006
0
100
200
300
400
500
600
1 x Xeon E5-2690 2 x Xeon E5-2690
248
491
256
507
SPECcpu2006: integer performance PRIMERGY RX350 S7 (2 sockets vs. 1 socket)
SPECcpu2006: floating-point performance PRIMERGY RX350 S7 (2 sockets vs. 1 socket)

WHITE PAPER PERFORMANCE REPORT PRIMERGY RX350 S7 VERSION: 1.4 2013-05-08
Page 14 (54) © Fujitsu Technology Solutions 2012-2013
SPECjbb2005
Benchmark description
SPECjbb2005 is a Java business benchmark that focuses on the performance of Java Server platforms. SPECjbb2005 is essentially a modernized SPECjbb2000. The main differences are:
The transactions have become more complex in order to cover a greater functional scope. The working set of the benchmark has been enlarged to the extent that the total system load has
increased. SPECjbb2000 allows only one active Java Virtual Machine instance (JVM) whereas SPECjbb2005
permits several instances, which in turn achieves greater closeness to reality, particularly with large systems.
On the software side SPECjbb2005 primarily measures the performance of the JVM used with its just-in-time compiler as well as their thread and garbage collection implementation. Some aspects of the operating system used also play a role. As far as hardware is concerned, it measures the efficiency of the CPUs and caches, the memory subsystem and the scalability of shared memory systems (SMP). Disk and network I/O are irrelevant.
SPECjbb2005 emulates a 3-tier client/server system that is typical for modern business process applications with the emphasis on the middle-tier system:
Clients generate the load, consisting of driver threads, which on the basis of TPC-C benchmark generate OLTP accesses to a database without thinking times.
The middle tier system implements the business processes and the updating of the database. The database takes on the data management and is emulated by Java objects that are in the
memory. Transaction logging is implemented on an XML basis.
The major advantage of this benchmark is that it includes all three tiers that run together on a single host. The performance of the middle-tier is measured. Large-scale hardware installations are thus avoided and direct comparisons between the SPECjbb2005 results from the various systems are possible. Client and database emulation are also written in Java.
SPECjbb2005 only needs the operating system as well as a Java Virtual Machine with J2SE 5.0 features.
The scaling unit is a warehouse with approx. 25 MB Java objects. Precisely one Java thread per warehouse executes the operations on these objects. The business operations are assumed by TPC-C:
New Order Entry Payment Order Status Inquiry Delivery Stock Level Supervision Customer Report
However, these are the only features SPECjbb2005 and TPC-C have in common. The results of the two benchmarks are not comparable.
SPECjbb2005 has 2 performance metrics:
bops (business operations per second) is the overall rate of all business operations performed per second.
bops/JVM is the ratio of the first metrics and the number of active JVM instances.
In comparisons of various SPECjbb2005 results, both metrics must be specified.
The following rules, according to which a compliant benchmark run has to be performed, are the basis for these three metrics:
A compliant benchmark run consists of a sequence of measuring points with an increasing number of warehouses (and thus of threads) with the number in each case being increased by one warehouse. The run is started at one warehouse up through 2*MaxWh, but not less than 8 warehouses. MaxWh is the number of warehouses with the highest rate per second the benchmark expects. Per default the benchmark equates MaxWh with the number of CPUs visible by the operating system.
The metric bops is the arithmetic average of all measured operation rates with MaxWh warehouses up to 2*MaxWh warehouses.

WHITE PAPER PERFORMANCE REPORT PRIMERGY RX350 S7 VERSION: 1.4 2013-05-08
© Fujitsu Technology Solutions 2012-2013 Page 15 (54)
Benchmark environment
System Under Test (SUT)
Hardware
Model PRIMERGY RX350 S7
Power Supply Unit 2 × Power supply 800W (hot-plug)
Processor 2 × Xeon E5-2690
Memory 16 × 8GB (1x8GB) 2Rx4 L DDR3-1600 R ECC
Software
BIOS settings Hardware Prefetch = Disable
Adjacent Sector Prefetch = Disable
DCU Streamer Prefetch = Disable
SAS/SATA OpROM = LSI MegaRAID
Operating system Microsoft Windows Server 2008 R2 Enterprise SP1
Operating system settings
Using the local security settings console, “lock pages in memory” was enabled for the user running the benchmark.
JVM Oracle Java HotSpot(TM) 64-Bit Server VM on Windows, version 1.6.0_31
JVM settings start /HIGH /AFFINITY [0xFFFF,0xFFFF0000] /B java -server -Xmx29g -Xms29g -Xmn24g -XX:BiasedLockingStartupDelay=200 -XX:ParallelGCThreads=16 -XX:SurvivorRatio=60 -XX:TargetSurvivorRatio=90 -XX:InlineSmallCode=3900 -XX:MaxInlineSize=270 -XX:FreqInlineSize=2500 -XX:AllocatePrefetchDistance=256 -XX:AllocatePrefetchLines=4 -XX:InitialTenuringThreshold=12 -XX:MaxTenuringThreshold=15 -XX:LoopUnrollLimit=45 -XX:+UseCompressedStrings -XX:+AggressiveOpts -XX:+UseLargePages -XX:+UseParallelOldGC -XX:-UseAdaptiveSizePolicy
Some components may not be available in all countries or sales regions.
Benchmark results
SPECjbb2005 bops = 1537350
SPECjbb2005 bops/JVM = 768675
The following diagrams illustrate the throughput of the PRIMERGY RX350 S7 in comparison to its predecessor PRIMERGY TX300 S6, in their respective most performant configuration.
SPECjbb2005 bops: PRIMERGY RX350 S7 vs. TX300 S6
SPECjbb2005 bops: PRIMERGY RX350 S7 vs. TX300 S6
WHITE PAPER PERFORMANCE REPORT PRIMERGY RX350 S7 VERSION: 1.4 2013-05-08
Page 16 (54) © Fujitsu Technology Solutions 2012-2013
SPECpower_ssj2008
Benchmark description
SPECpower_ssj2008 is the first industry-standard SPEC benchmark that evaluates the power and performance characteristics of a server. With SPECpower_ssj2008 SPEC has defined standards for server power measurements in the same way they have done for performance.
The benchmark workload represents typical server-side Java business applications. The workload is scalable, multi-threaded, portable across a wide range of platforms and easy to run. The benchmark tests CPUs, caches, the memory hierarchy and scalability of symmetric multiprocessor systems (SMPs), as well as the implementation of Java Virtual Machine (JVM), Just In Time (JIT) compilers, garbage collection, threads and some aspects of the operating system.
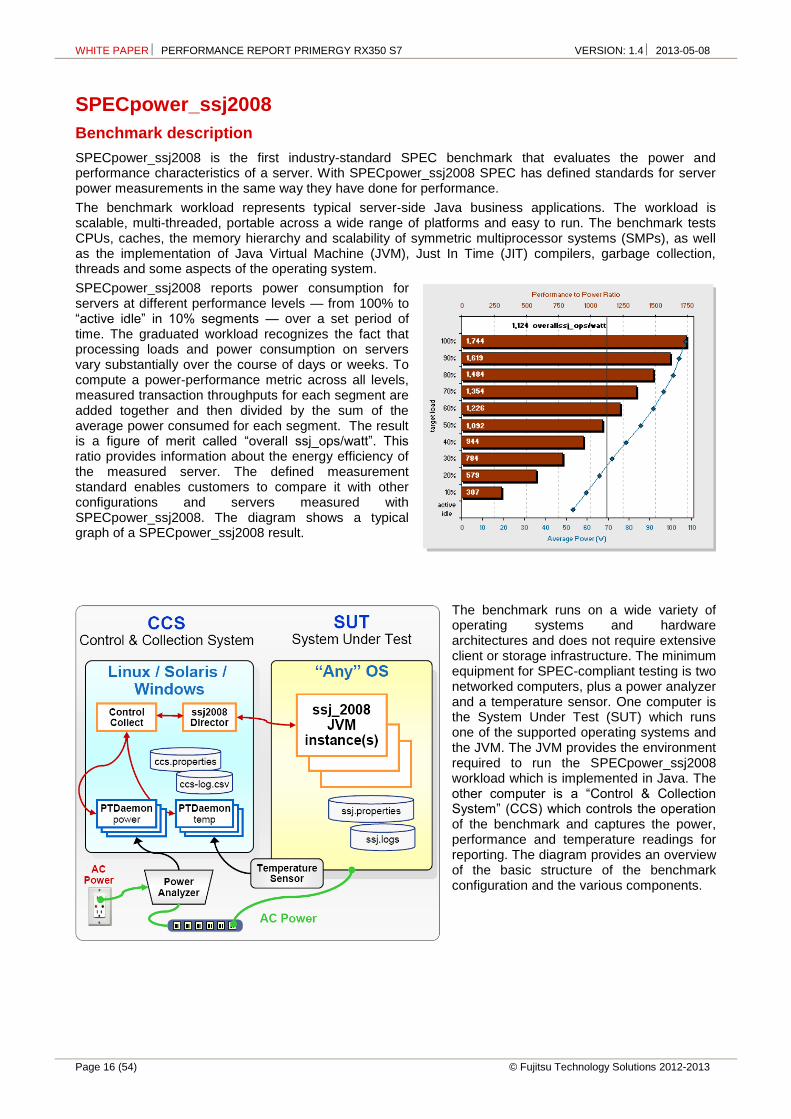
SPECpower_ssj2008 reports power consumption for servers at different performance levels — from 100% to “active idle” in 10% segments — over a set period of time. The graduated workload recognizes the fact that processing loads and power consumption on servers vary substantially over the course of days or weeks. To compute a power-performance metric across all levels, measured transaction throughputs for each segment are added together and then divided by the sum of the average power consumed for each segment. The result is a figure of merit called “overall ssj_ops/watt”. This ratio provides information about the energy efficiency of the measured server. The defined measurement standard enables customers to compare it with other configurations and servers measured with SPECpower_ssj2008. The diagram shows a typical graph of a SPECpower_ssj2008 result.
The benchmark runs on a wide variety of operating systems and hardware architectures and does not require extensive client or storage infrastructure. The minimum equipment for SPEC-compliant testing is two networked computers, plus a power analyzer and a temperature sensor. One computer is the System Under Test (SUT) which runs one of the supported operating systems and the JVM. The JVM provides the environment required to run the SPECpower_ssj2008 workload which is implemented in Java. The other computer is a “Control & Collection System” (CCS) which controls the operation of the benchmark and captures the power, performance and temperature readings for reporting. The diagram provides an overview of the basic structure of the benchmark configuration and the various components.
WHITE PAPER PERFORMANCE REPORT PRIMERGY RX350 S7 VERSION: 1.4 2013-05-08
© Fujitsu Technology Solutions 2012-2013 Page 17 (54)
Benchmark environment
System Under Test (SUT)
Hardware
Model PRIMERGY RX350 S7
Model version SFF base unit
Processor 2 × Xeon E5-2660
Memory 6 × 4GB (1x4GB) 2Rx8 L DDR3-1600 U ECC
Network-Interface Onboard LAN-Controller (1 port used)
Disk-Subsystem Onboard HDD-Controller
Measurement with Oracle Java HotSpot VM: 1 × SSD SATA 3G 32GB SLC HOT PLUG 2.5" EP
Measurement with IBM J9 VM: 1 × HD SATA 6G 250GB 7.2K HOT PL 2.5" BC
Power Supply Unit 1 × Power supply 450W (hot-plug)
Software
BIOS Measurement with Oracle Java HotSpot VM: R1.9.0 Measurement with IBM J9 VM: R1.15.0
BIOS settings Adjacent Sector Prefetch = Disabled Hardware Prefetch = Disabled DCU Streamer Prefetch = Disabled Memory Speed = Low-Voltage optimized USB Port Control = Enable internal ports only QPI Link Speed = 6.4GT/s P-State coordination = SW_ANY Intel Virtualization Technology = Disabled SAS/SATA OpROM = LSI MegaRAID ASPM Support = Auto LAN Controller = LAN 1
Firmware Measurement with Oracle Java HotSpot VM: 6.52A Measurement with IBM J9 VM: 6.53A
Operating system Microsoft Windows Server 2008 R2 Enterprise SP1
Operating system settings
Using the local security settings console, “lock pages in memory” was enabled for the user running the benchmark.
Power Management: Enabled (“Fujitsu Enhanced Power Settings” power plan)
Set “Turn off hard disk after = 1 Minute” in OS.
Benchmark was started via Windows Remote Desktop Connection.
JVM Measurement with Oracle Java HotSpot VM: Oracle Java HotSpot(TM) 64-Bit Server VM on Windows, version 1.6.0_30
Measurement with IBM J9 VM: IBM J9 VM (build 2.6, JRE 1.7.0 Windows Server 2008 R2 amd64-64 20120322_106209 (JIT enabled, AOT enabled)
JVM settings start /NODE [0,1] /AFFINITY [0x3,0xC,0x30,0xC0,0x300,0xC00,0x3000,0xC000]
Measurement with Oracle Java HotSpot VM: -server -Xmx1024m -Xms1024m -Xmn853m -XX:ParallelGCThreads=2 -XX:SurvivorRatio=60 -XX:TargetSurvivorRatio=90 -XX:InlineSmallCode=3900 -XX:MaxInlineSize=270 -XX:FreqInlineSize=2500 -XX:AllocatePrefetchDistance=256 -XX:AllocatePrefetchLines=4 -XX:InitialTenuringThreshold=12 -XX:MaxTenuringThreshold=15 -XX:LoopUnrollLimit=45 -XX:+UseCompressedStrings -XX:+AggressiveOpts -XX:+UseLargePages -XX:+UseParallelOldGC
Measurement with IBM J9 VM: -Xaggressive -Xcompressedrefs -Xgcpolicy:gencon -Xmn800m -Xms1024m -Xmx1024m -XlockReservation -Xnoloa -XtlhPrefetch -Xlp -Xconcurrentlevel0
WHITE PAPER PERFORMANCE REPORT PRIMERGY RX350 S7 VERSION: 1.4 2013-05-08
Page 18 (54) © Fujitsu Technology Solutions 2012-2013
Other software Measurement with Oracle Java HotSpot VM: none
Measurement with IBM J9 VM: IBM SDK Java Technology Edition Version 7.0 for Windows x64
Some components may not be available in all countries or sales regions.
Benchmark results
Measurement with Oracle Java HotSpot VM
The PRIMERGY RX350 S7 achieved the following result:
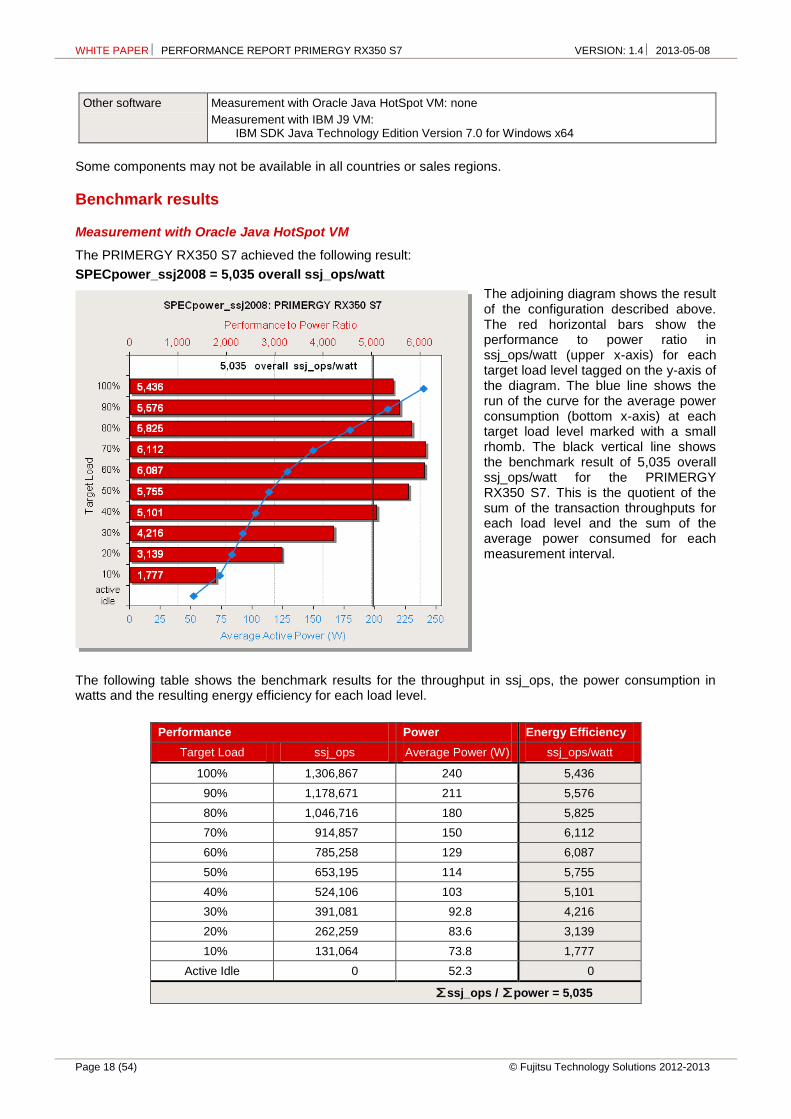
SPECpower_ssj2008 = 5,035 overall ssj_ops/watt
The adjoining diagram shows the result of the configuration described above. The red horizontal bars show the performance to power ratio in ssj_ops/watt (upper x-axis) for each target load level tagged on the y-axis of the diagram. The blue line shows the run of the curve for the average power consumption (bottom x-axis) at each target load level marked with a small rhomb. The black vertical line shows the benchmark result of 5,035 overall ssj_ops/watt for the PRIMERGY RX350 S7. This is the quotient of the sum of the transaction throughputs for each load level and the sum of the average power consumed for each measurement interval.
The following table shows the benchmark results for the throughput in ssj_ops, the power consumption in watts and the resulting energy efficiency for each load level.
Performance Power Energy Efficiency
Target Load ssj_ops Average Power (W) ssj_ops/watt
100% 1,306,867 240 5,436
90% 1,178,671 211 5,576
80% 1,046,716 180 5,825
70% 914,857 150 6,112
60% 785,258 129 6,087
50% 653,195 114 5,755
40% 524,106 103 5,101
30% 391,081 92.8 4,216
20% 262,259 83.6 3,139
10% 131,064 73.8 1,777
Active Idle 0 52.3 0
∑ssj_ops / ∑power = 5,035

WHITE PAPER PERFORMANCE REPORT PRIMERGY RX350 S7 VERSION: 1.4 2013-05-08
© Fujitsu Technology Solutions 2012-2013 Page 19 (54)
Measurement with IBM J9 VM
The PRIMERGY RX350 S7 achieved the following result:
SPECpower_ssj2008 = 5,347 overall ssj_ops/watt
The adjoining diagram shows the result of the configuration described above. The red horizontal bars show the performance to power ratio in ssj_ops/watt (upper x-axis) for each target load level tagged on the y-axis of the diagram. The blue line shows the run of the curve for the average power consumption (bottom x-axis) at each target load level marked with a small rhomb. The black vertical line shows the benchmark result of 5,347 overall ssj_ops/watt for the PRIMERGY RX350 S7. This is the quotient of the sum of the transaction throughputs for each load level and the sum of the average power consumed for each measurement interval.
The following table shows the benchmark results for the throughput in ssj_ops, the power consumption in watts and the resulting energy efficiency for each load level.
Performance Power Energy Efficiency
Target Load ssj_ops Average Power (W) ssj_ops/watt
100% 1,432,623 245 5,838
90% 1,286,820 216 5,966
80% 1,147,726 185 6,208
70% 1,003,643 156 6,452
60% 855,351 133 6,429
50% 714,045 117 6,081
40% 571,551 106 5,378
30% 432,416 96.4 4,484
20% 286,840 86.6 3,311
10% 144,587 76.5 1,890
Active Idle 0 55.2 0
∑ssj_ops / ∑power = 5,347
The PRIMERGY RX350 S7 achieved a new class record with this result (date: September 19, 2012). Thus, the PRIMERGY RX350 S7 proves itself to be the most energy-efficient 2-socket 4U rack server in the world. The current results can be found at http://www.spec.org/power_ssj2008/results.
WHITE PAPER PERFORMANCE REPORT PRIMERGY RX350 S7 VERSION: 1.4 2013-05-08
Page 20 (54) © Fujitsu Technology Solutions 2012-2013
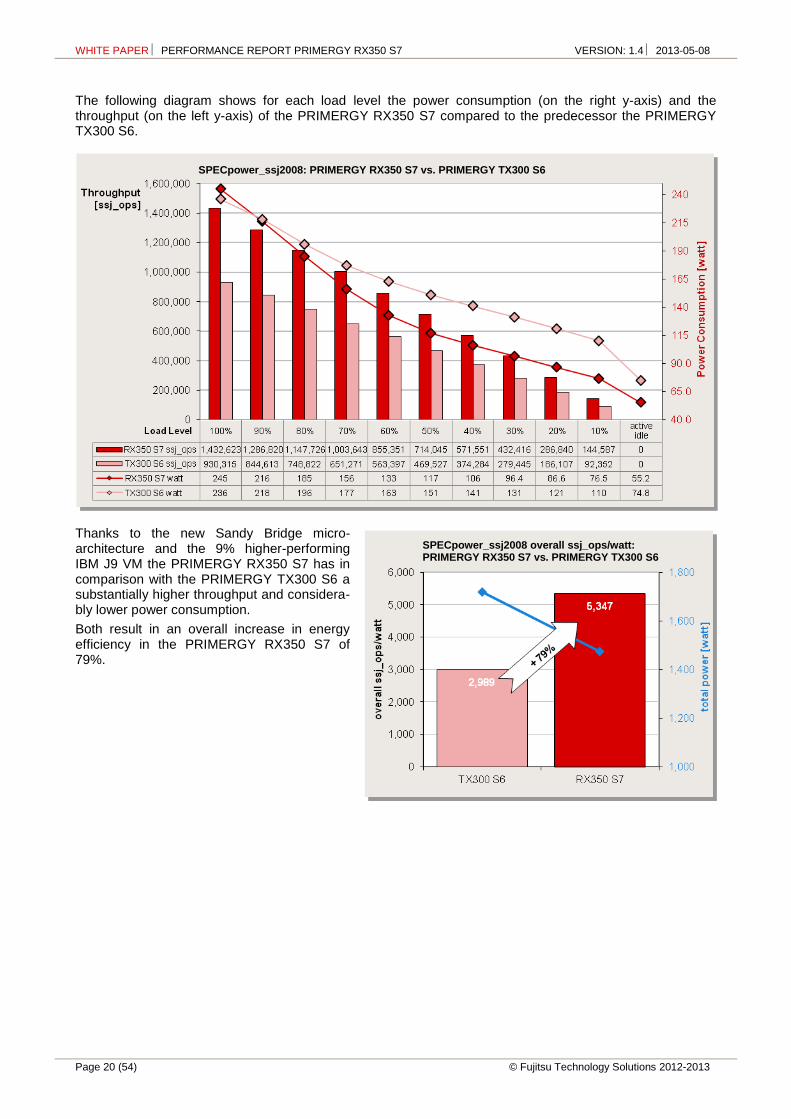
The following diagram shows for each load level the power consumption (on the right y-axis) and the throughput (on the left y-axis) of the PRIMERGY RX350 S7 compared to the predecessor the PRIMERGY TX300 S6.
Thanks to the new Sandy Bridge micro-architecture and the 9% higher-performing IBM J9 VM the PRIMERGY RX350 S7 has in comparison with the PRIMERGY TX300 S6 a substantially higher throughput and considera-bly lower power consumption.
Both result in an overall increase in energy efficiency in the PRIMERGY RX350 S7 of 79%.
SPECpower_ssj2008: PRIMERGY RX350 S7 vs. PRIMERGY TX300 S6
SPECpower_ssj2008 overall ssj_ops/watt: PRIMERGY RX350 S7 vs. PRIMERGY TX300 S6
WHITE PAPER PERFORMANCE REPORT PRIMERGY RX350 S7 VERSION: 1.4 2013-05-08
© Fujitsu Technology Solutions 2012-2013 Page 21 (54)
Disk I/O
Benchmark description
Performance measurements of disk subsystems for PRIMERGY servers are used to assess their performance and enable a comparison of the different storage connections for PRIMERGY servers. As standard, these performance measurements are carried out with a defined measurement method, which models the hard disk accesses of real application scenarios on the basis of specifications.
The essential specifications are:
Share of random accesses / sequential accesses Share of read / write access types Block size (kB) Number of parallel accesses (# of outstanding I/Os)
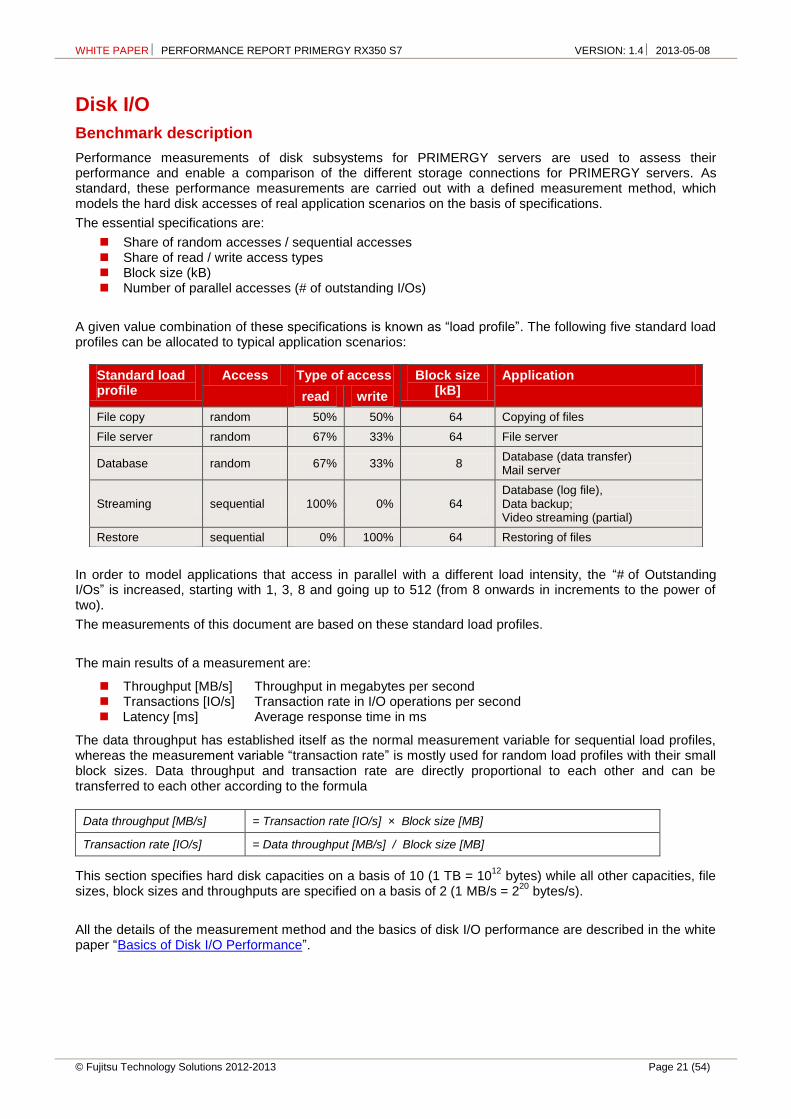
A given value combination of these specifications is known as “load profile”. The following five standard load profiles can be allocated to typical application scenarios:
In order to model applications that access in parallel with a different load intensity, the “# of Outstanding I/Os” is increased, starting with 1, 3, 8 and going up to 512 (from 8 onwards in increments to the power of two).
The measurements of this document are based on these standard load profiles.
The main results of a measurement are:
Throughput [MB/s] Throughput in megabytes per second Transactions [IO/s] Transaction rate in I/O operations per second Latency [ms] Average response time in ms
The data throughput has established itself as the normal measurement variable for sequential load profiles, whereas the measurement variable “transaction rate” is mostly used for random load profiles with their small block sizes. Data throughput and transaction rate are directly proportional to each other and can be transferred to each other according to the formula
Data throughput [MB/s] = Transaction rate [IO/s] × Block size [MB]
Transaction rate [IO/s] = Data throughput [MB/s] / Block size [MB]
This section specifies hard disk capacities on a basis of 10 (1 TB = 1012
bytes) while all other capacities, file sizes, block sizes and throughputs are specified on a basis of 2 (1 MB/s = 2
20 bytes/s).
All the details of the measurement method and the basics of disk I/O performance are described in the white paper “Basics of Disk I/O Performance”.
Standard load profile
Access Type of access Block size [kB]
Application
read write
File copy random 50% 50% 64 Copying of files
File server random 67% 33% 64 File server
Database random 67% 33% 8 Database (data transfer) Mail server
Streaming sequential 100% 0% 64 Database (log file), Data backup; Video streaming (partial)
Restore sequential 0% 100% 64 Restoring of files

WHITE PAPER PERFORMANCE REPORT PRIMERGY RX350 S7 VERSION: 1.4 2013-05-08
Page 22 (54) © Fujitsu Technology Solutions 2012-2013
Benchmark environment
All the measurement results discussed in this chapter were determined using the hardware and software components listed below:
System Under Test (SUT)
Hardware
Controller 1 × “LSI SW RAID on Intel C600 (Onboard SATA)” 1 × “LSI SW RAID on Intel C600 (Onboard SAS)” 1 × “RAID Ctrl SAS 6G 0/1 (D2607)” 1 × “RAID Ctrl SAS 5/6 512MB (D2616)” 1 × “RAID Ctrl SAS 6G 5/6 1GB (D3116)”
Drive 24 × EP HDD SAS 6 Gbit/s 2.5 15000 rpm 146 GB
12 × EP HDD SAS 6 Gbit/s 3.5 15000 rpm 300 GB
24 × EP SSD SAS 6 Gbit/s 2.5 200 GB MLC
4 × BC HDD SATA 6 Gbit/s 3.5 7200 rpm 3 TB
Software
Operating system Microsoft Windows Server 2008 Enterprise x64 Edition SP2
Administration software
ServerView RAID Manager 5.0.2
Initialization of RAID arrays
RAID arrays are initialized before the measurement with an elementary block size of 64 kB (“stripe size”)
File system NTFS
Measuring tool Iometer 2006.07.27
Measurement data Measurement files of 32 GB with 1 – 8 hard disks; 64 GB with 9 – 16 hard disks; 128 GB with 17 or more hard disks
Some components may not be available in all countries / sales regions.
WHITE PAPER PERFORMANCE REPORT PRIMERGY RX350 S7 VERSION: 1.4 2013-05-08
© Fujitsu Technology Solutions 2012-2013 Page 23 (54)
Benchmark results
The results presented here are designed to help you choose the right solution from the various configuration options of the PRIMERGY RX350 S7 in the light of disk-I/O performance. The selection of suitable components and the right settings of their parameters is important here. These two aspects should therefore be dealt with as preparation for the discussion of the performance values.
Components
The hard disks are the first essential component. If there is a reference below to “hard disks”, this is meant as the generic term for HDDs (“hard disk drives”, in other words conventional hard disks) and SSDs (“solid state drives”, i.e. non-volatile electronic storage media). When selecting the type of hard disk and number of hard disks you can move the weighting in the direction of storage capacity, performance, security or price. In order to enable a pre-selection of the hard disk types – depending on the required weighting – the hard disk types for PRIMERGY servers are divided into three classes:
“Economic” (ECO): low-priced hard disks “Business Critical” (BC): very failsafe hard disks “Enterprise” (EP): very failsafe and very high-performance hard disks
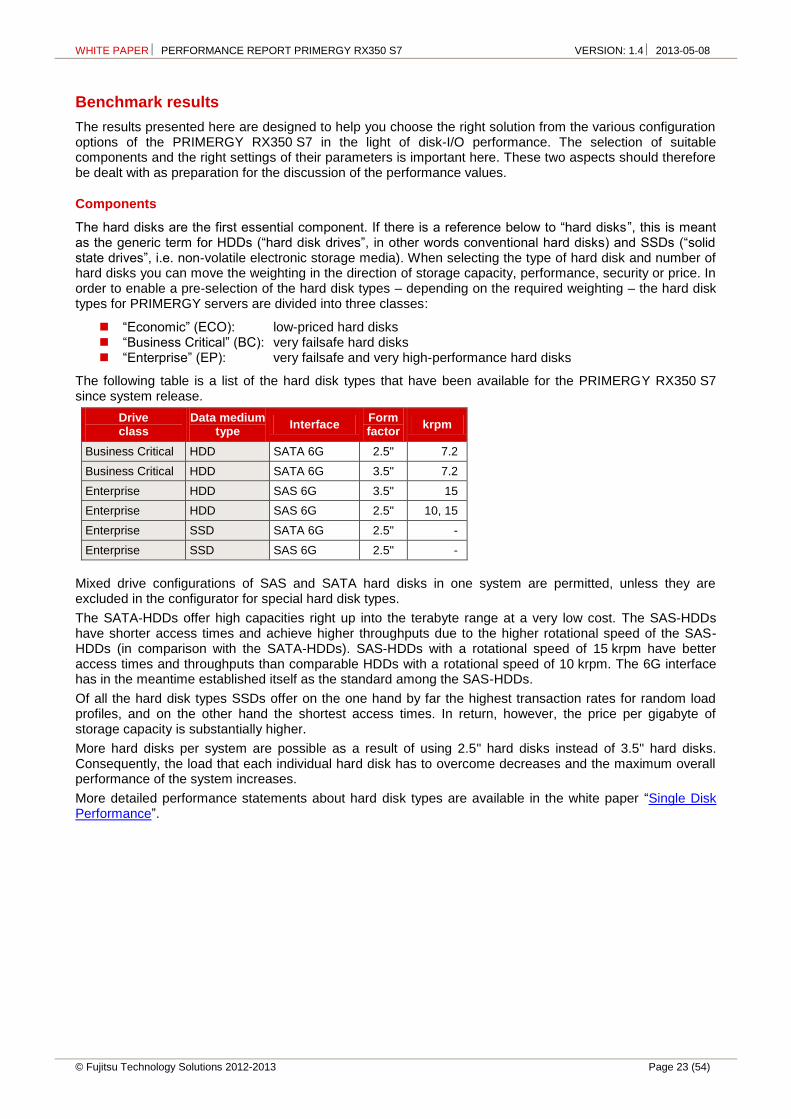
The following table is a list of the hard disk types that have been available for the PRIMERGY RX350 S7 since system release.
Drive class
Data medium type
Interface Form factor
krpm
Business Critical HDD SATA 6G 2.5" 7.2
Business Critical HDD SATA 6G 3.5" 7.2
Enterprise HDD SAS 6G 3.5" 15
Enterprise HDD SAS 6G 2.5" 10, 15
Enterprise SSD SATA 6G 2.5" -
Enterprise SSD SAS 6G 2.5" -
Mixed drive configurations of SAS and SATA hard disks in one system are permitted, unless they are excluded in the configurator for special hard disk types.
The SATA-HDDs offer high capacities right up into the terabyte range at a very low cost. The SAS-HDDs have shorter access times and achieve higher throughputs due to the higher rotational speed of the SAS-HDDs (in comparison with the SATA-HDDs). SAS-HDDs with a rotational speed of 15 krpm have better access times and throughputs than comparable HDDs with a rotational speed of 10 krpm. The 6G interface has in the meantime established itself as the standard among the SAS-HDDs.
Of all the hard disk types SSDs offer on the one hand by far the highest transaction rates for random load profiles, and on the other hand the shortest access times. In return, however, the price per gigabyte of storage capacity is substantially higher.
More hard disks per system are possible as a result of using 2.5" hard disks instead of 3.5" hard disks. Consequently, the load that each individual hard disk has to overcome decreases and the maximum overall performance of the system increases.
More detailed performance statements about hard disk types are available in the white paper “Single Disk Performance”.
WHITE PAPER PERFORMANCE REPORT PRIMERGY RX350 S7 VERSION: 1.4 2013-05-08
Page 24 (54) © Fujitsu Technology Solutions 2012-2013
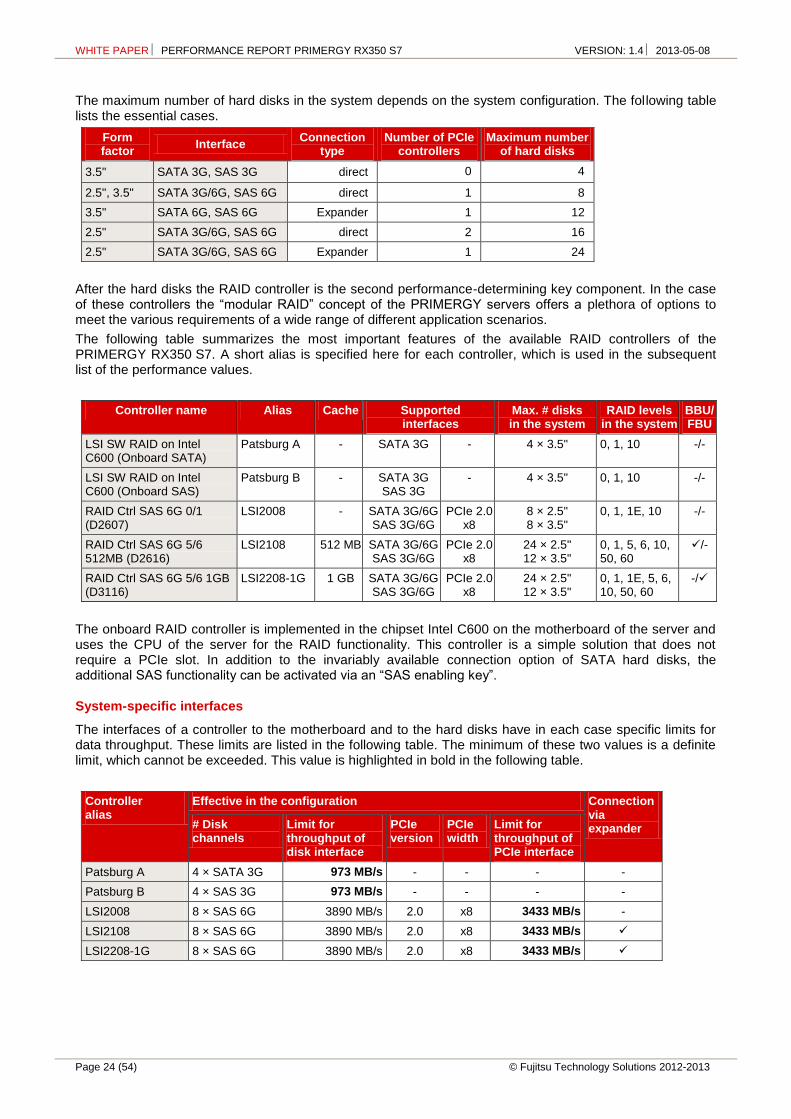
The maximum number of hard disks in the system depends on the system configuration. The following table lists the essential cases.
Form factor
Interface Connection
type Number of PCIe
controllers Maximum number
of hard disks
3.5" SATA 3G, SAS 3G direct 0 4
2.5", 3.5" SATA 3G/6G, SAS 6G direct 1 8
3.5" SATA 6G, SAS 6G Expander 1 12
2.5" SATA 3G/6G, SAS 6G direct 2 16
2.5" SATA 3G/6G, SAS 6G Expander 1 24
After the hard disks the RAID controller is the second performance-determining key component. In the case of these controllers the “modular RAID” concept of the PRIMERGY servers offers a plethora of options to meet the various requirements of a wide range of different application scenarios.
The following table summarizes the most important features of the available RAID controllers of the PRIMERGY RX350 S7. A short alias is specified here for each controller, which is used in the subsequent list of the performance values.
Controller name Alias Cache Supported interfaces
Max. # disks in the system
RAID levels in the system
BBU/ FBU
LSI SW RAID on Intel C600 (Onboard SATA)
Patsburg A - SATA 3G - 4 × 3.5" 0, 1, 10 -/-
LSI SW RAID on Intel C600 (Onboard SAS)
Patsburg B - SATA 3G SAS 3G
- 4 × 3.5" 0, 1, 10 -/-
RAID Ctrl SAS 6G 0/1 (D2607)
LSI2008 - SATA 3G/6G SAS 3G/6G
PCIe 2.0 x8
8 × 2.5" 8 × 3.5"
0, 1, 1E, 10 -/-
RAID Ctrl SAS 6G 5/6 512MB (D2616)
LSI2108 512 MB SATA 3G/6G SAS 3G/6G
PCIe 2.0 x8
24 × 2.5" 12 × 3.5"
0, 1, 5, 6, 10, 50, 60
/-
RAID Ctrl SAS 6G 5/6 1GB (D3116)
LSI2208-1G 1 GB SATA 3G/6G SAS 3G/6G
PCIe 2.0 x8
24 × 2.5" 12 × 3.5"
0, 1, 1E, 5, 6, 10, 50, 60
-/
The onboard RAID controller is implemented in the chipset Intel C600 on the motherboard of the server and uses the CPU of the server for the RAID functionality. This controller is a simple solution that does not require a PCIe slot. In addition to the invariably available connection option of SATA hard disks, the additional SAS functionality can be activated via an “SAS enabling key”.
System-specific interfaces
The interfaces of a controller to the motherboard and to the hard disks have in each case specific limits for data throughput. These limits are listed in the following table. The minimum of these two values is a definite limit, which cannot be exceeded. This value is highlighted in bold in the following table.
Controller alias
Effective in the configuration Connection via expander # Disk
channels Limit for throughput of disk interface
PCIe version
PCIe width
Limit for throughput of PCIe interface
Patsburg A 4 × SATA 3G 973 MB/s - - - -
Patsburg B 4 × SAS 3G 973 MB/s - - - -
LSI2008 8 × SAS 6G 3890 MB/s 2.0 x8 3433 MB/s -
LSI2108 8 × SAS 6G 3890 MB/s 2.0 x8 3433 MB/s
LSI2208-1G 8 × SAS 6G 3890 MB/s 2.0 x8 3433 MB/s

WHITE PAPER PERFORMANCE REPORT PRIMERGY RX350 S7 VERSION: 1.4 2013-05-08
© Fujitsu Technology Solutions 2012-2013 Page 25 (54)
An expander makes it possible to connect more hard disks in a system than the SAS channels that the controller has. An expander cannot increase the possible maximum throughput of a controller, but makes it available in total to all connected hard disks.
More details about the RAID controllers of the PRIMERGY systems are available in the white paper “RAID Controller Performance”.
Settings
In most cases, the cache of the hard disks has a great influence on disk-I/O performance. This is particular valid for HDDs. It is frequently regarded as a security problem in case of power failure and is thus switched off. On the other hand, it was integrated by hard disk manufacturers for the good reason of increasing the write performance. For performance reasons it is therefore advisable to enable the hard disk cache. This is particular valid for SATA-HDDs. The performance can as a result increase more than tenfold for specific access patterns and hard disk types. More information about the performance impact of the hard disk cache is available in the document “Single Disk Performance”. To prevent data loss in case of power failure you are recommended to equip the system with a UPS.
In the case of controllers with a cache there are several parameters that can be set. The optimal settings can depend on the RAID level, the application scenario and the type of data medium. In the case of RAID levels 5 and 6 in particular (and the more complex RAID level combinations 50 and 60) it is obligatory to enable the controller cache for application scenarios with write share. If the controller cache is enabled, the data temporarily stored in the cache should be safeguarded against loss in case of power failure. Suitable accessories are available for this purpose (e.g. a BBU or FBU).
For the purpose of easy and reliable handling of the settings for RAID controllers and hard disks it is advisable to use the RAID-Manager software “ServerView RAID” that is supplied for PRIMERGY servers. All the cache settings for controllers and hard disks can usually be made en bloc – specifically for the application – by using the pre-defined modi “Performance” or “Data Protection”. The “Performance” mode ensures the best possible performance settings for the majority of the application scenarios.
More information about the setting options of the controller cache is available in the white paper “RAID Controller Performance”.
Performance values
In general, disk-I/O performance of a RAID array depends on the type and number of hard disks, on the RAID level and on the RAID controller. If the limits of the system-specific interfaces are not exceeded, the statements on disk-I/O performance are therefore valid for all PRIMERGY systems. This is why all the performance statements of the document “RAID Controller Performance” also apply for the PRIMERGY RX350 S7 if the configurations measured there are also supported by this system.
The performance values of the PRIMERGY RX350 S7 are listed in table form below, specifically for different RAID levels, access types and block sizes. Substantially different configuration versions are dealt with separately.
The performance values in the following tables use the established measurement variables, as already mentioned in the subsection Benchmark description. Thus, transaction rate is specified for random accesses and data throughput for sequential accesses. To avoid any confusion among the measurement units the tables have been separated for the two access types.
The table cells contain the maximum achievable values. This has three implications: On the one hand hard disks with optimal performance were used (the components used are described in more detail in the subsection Benchmark environment). Furthermore, cache settings of controllers and hard disks, which are optimal for the respective access scenario and the RAID level, are used as a basis. And ultimately each value is the maximum value for the entire load intensity range (# of outstanding I/Os).
In order to also visualize the numerical values each table cell is highlighted with a horizontal bar, the length of which is proportional to the numerical value in the table cell. All bars shown in the same scale of length have the same color. In other words, a visual comparison only makes sense for table cells with the same colored bars.
Since the horizontal bars in the table cells depict the maximum achievable performance values, they are shown by the color getting lighter as you move from left to right. The light shade of color at the right end of the bar tells you that the value is a maximum value and can only be achieved under optimal prerequisites. The darker the shade becomes as you move to the left, the more frequently it will be possible to achieve the corresponding value in practice.

WHITE PAPER PERFORMANCE REPORT PRIMERGY RX350 S7 VERSION: 1.4 2013-05-08
Page 26 (54) © Fujitsu Technology Solutions 2012-2013
Random accesses (performance values in IO/s):
RA
ID
Co
ntr
olle
r
Ha
rd d
isk
typ
e
Fo
rm f
ac
tor
#D
isk
s
SS
Ds
ra
nd
om
64
kB
blo
ck
s
67
% r
ea
d
[IO
/s]
Configuration
version
RA
ID le
ve
l
HD
Ds
ra
nd
om
8 k
B b
loc
ks
67
% r
ea
d
[IO
/s]
HD
Ds
ra
nd
om
64
kB
blo
ck
s
67
% r
ea
d
[IO
/s]
SS
Ds
ra
nd
om
8 k
B b
loc
ks
67
% r
ea
d
[IO
/s]
2 1 500 448 N/A N/A
4 0 1062 609 N/A N/A
4 10 832 479 N/A N/A
2 1 780 660 N/A N/A
4 0 1824 1008 N/A N/A
4 10 1359 755 N/A N/A
2 1 820 702 17649 4117
8 0 3491 1980 40766 12706
8 10 2716 1516 28692 10539
2 1 868 729 N/A N/A
8 0 3476 1971 N/A N/A
8 10 2705 1497 N/A N/A
2 1 859 679 19002 4400
16 10 7944 4124 25172 15894
24 0 14300 7841 69173 39993
24 5 8467 4891 19570 12162
2 1 1042 730 N/A N/A
12 10 5904 3038 N/A N/A
12 0 8989 4542 N/A N/A
12 5 4427 2496 N/A N/A
2 1 1109 863 20201 4362
16 10 8135 4232 59199 31605
24 0 14396 7745 191255 51084
24 5 8727 4983 40669 24885
2 1 1105 746 N/A N/A
12 10 5944 3074 N/A N/A
12 0 8259 4278 N/A N/A
12 5 4773 2597 N/A N/A
Patsburg A BC SATA HDD 3.5"
Patsburg B EP SAS HDD 3.5"
LSI2108 EP SAS HDD 3.5"
LSI2008EP SAS HDD
EP SAS SSD2.5"
LSI2008 EP SAS HDD 3.5"
LSI2108EP SAS HDD
EP SAS SSD2.5"
LSI2208-1G EP SAS HDD 3.5"
LSI2208-1GEP SAS HDD
EP SAS SSD2.5"
WHITE PAPER PERFORMANCE REPORT PRIMERGY RX350 S7 VERSION: 1.4 2013-05-08
© Fujitsu Technology Solutions 2012-2013 Page 27 (54)
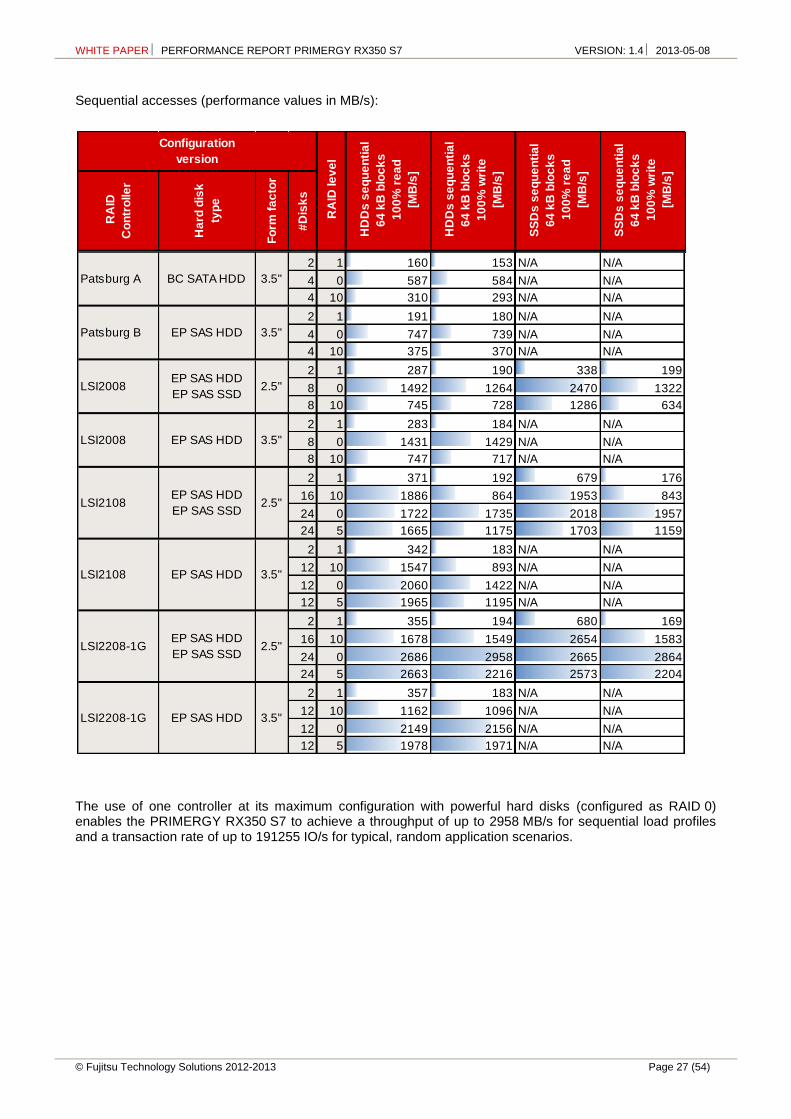
Sequential accesses (performance values in MB/s):
The use of one controller at its maximum configuration with powerful hard disks (configured as RAID 0) enables the PRIMERGY RX350 S7 to achieve a throughput of up to 2958 MB/s for sequential load profiles and a transaction rate of up to 191255 IO/s for typical, random application scenarios.
RA
ID
Co
ntr
olle
r
Ha
rd d
isk
typ
e
Fo
rm f
ac
tor
#D
isk
s
SS
Ds
se
qu
en
tia
l
64
kB
blo
ck
s
10
0%
wri
te
[MB
/s]
Configuration
version
RA
ID le
ve
l
HD
Ds
se
qu
en
tia
l
64
kB
blo
ck
s
10
0%
re
ad
[MB
/s]
HD
Ds
se
qu
en
tia
l
64
kB
blo
ck
s
10
0%
wri
te
[MB
/s]
SS
Ds
se
qu
en
tia
l
64
kB
blo
ck
s
10
0%
re
ad
[MB
/s]
2 1 160 153 N/A N/A
4 0 587 584 N/A N/A
4 10 310 293 N/A N/A
2 1 191 180 N/A N/A
4 0 747 739 N/A N/A
4 10 375 370 N/A N/A
2 1 287 190 338 199
8 0 1492 1264 2470 1322
8 10 745 728 1286 634
2 1 283 184 N/A N/A
8 0 1431 1429 N/A N/A
8 10 747 717 N/A N/A
2 1 371 192 679 176
16 10 1886 864 1953 843
24 0 1722 1735 2018 1957
24 5 1665 1175 1703 1159
2 1 342 183 N/A N/A
12 10 1547 893 N/A N/A
12 0 2060 1422 N/A N/A
12 5 1965 1195 N/A N/A
2 1 355 194 680 169
16 10 1678 1549 2654 1583
24 0 2686 2958 2665 2864
24 5 2663 2216 2573 2204
2 1 357 183 N/A N/A
12 10 1162 1096 N/A N/A
12 0 2149 2156 N/A N/A
12 5 1978 1971 N/A N/A
Patsburg A BC SATA HDD 3.5"
Patsburg B EP SAS HDD 3.5"
LSI2008EP SAS HDD
EP SAS SSD2.5"
LSI2008 EP SAS HDD 3.5"
LSI2108EP SAS HDD
EP SAS SSD2.5"
LSI2208-1G EP SAS HDD 3.5"
LSI2208-1GEP SAS HDD
EP SAS SSD2.5"
LSI2108 EP SAS HDD 3.5"

WHITE PAPER PERFORMANCE REPORT PRIMERGY RX350 S7 VERSION: 1.4 2013-05-08
Page 28 (54) © Fujitsu Technology Solutions 2012-2013
OLTP-2
Benchmark description
OLTP stands for Online Transaction Processing. The OLTP-2 benchmark is based on the typical application scenario of a database solution. In OLTP-2 database access is simulated and the number of transactions achieved per second (tps) determined as the unit of measurement for the system.
In contrast to benchmarks such as SPECint and TPC-E, which were standardized by independent bodies and for which adherence to the respective rules and regulations are monitored, OLTP-2 is an internal benchmark of Fujitsu. OLTP-2 is based on the well-known database benchmark TPC-E. OLTP-2 was designed in such a way that a wide range of configurations can be measured to present the scaling of a system with regard to the CPU and memory configuration.
Even if the two benchmarks OLTP-2 and TPC-E simulate similar application scenarios using the same load profiles, the results cannot be compared or even treated as equal, as the two benchmarks use different methods to simulate user load. OLTP-2 values are typically similar to TPC-E values. A direct comparison, or even referring to the OLTP-2 result as TPC-E, is not permitted, especially because there is no price-performance calculation.
Further information can be found in the document Benchmark Overview OLTP-2.
Benchmark environment
The measurement set-up is symbolically illustrated below:
All results were determined by way of example on a PRIMERGY RX300 S7.
Application Server
Tier A Tier B
Clients
Database Server Disk
subsystem
System Under Test (SUT)
Driver
Network
Network

WHITE PAPER PERFORMANCE REPORT PRIMERGY RX350 S7 VERSION: 1.4 2013-05-08
© Fujitsu Technology Solutions 2012-2013 Page 29 (54)
Database Server (Tier B)
Hardware
Model PRIMERGY RX300 S7
Processor Xeon E5-2600 processor series
Memory 1 processor: 8 × 32GB (1x32GB) 4Rx4 L DDR3-1333 LR ECC 2 processors: 16 × 32GB (1x32GB) 4Rx4 L DDR3-1333 LR ECC
Network interface 2 × onboard LAN 1 Gb/s
Disk subsystem RX300 S7: Onboard RAID Ctrl SAS 6G 5/6 1024MB (D3116)
2 × 73 GB 15k rpm SAS Drive, RAID1 (OS),
6 × 147 GB 15k rpm SAS Drive, RAID10 (LOG)
3 × LSI MegaRAID SAS 9286CV-8e
6 × JX40: 24 × 64 GB SSD Drive each, RAID5 (data)
Software
BIOS Version V4.6.5.1 R1.0.5
Operating system Microsoft Windows Server 2008 R2 Enterprise SP1
Database Microsoft SQL Server 2008 R2 Enterprise SP1
Application Server (Tier A)
Hardware
Model 1 × PRIMERGY RX200 S6
Processor 2 × Xeon X5647
Memory 12 GB, 1333 MHz registered ECC DDR3
Network interface 2 × onboard LAN 1 Gb/s 2 × Dual Port LAN 1Gb/s
Disk subsystem 1 × 73 GB 15k rpm SAS Drive
Software
Operating system Microsoft Windows Server 2008 R2 Standard
Client
Hardware
Model 1 × PRIMERGY RX200 S5
Processor 2 × Xeon X5570
Memory 24 GB, 1333 MHz registered ECC DDR3
Network interface 2 × onboard LAN 1 Gb/s
Disk subsystem 1 × 73 GB 15k rpm SAS Drive
Software
Operating system Microsoft Windows Server 2008 R2 Standard
Benchmark OLTP-2 Software EGen version 1.12.0
Some components may not be available in all countries / sales regions.
WHITE PAPER PERFORMANCE REPORT PRIMERGY RX350 S7 VERSION: 1.4 2013-05-08
Page 30 (54) © Fujitsu Technology Solutions 2012-2013
Benchmark results
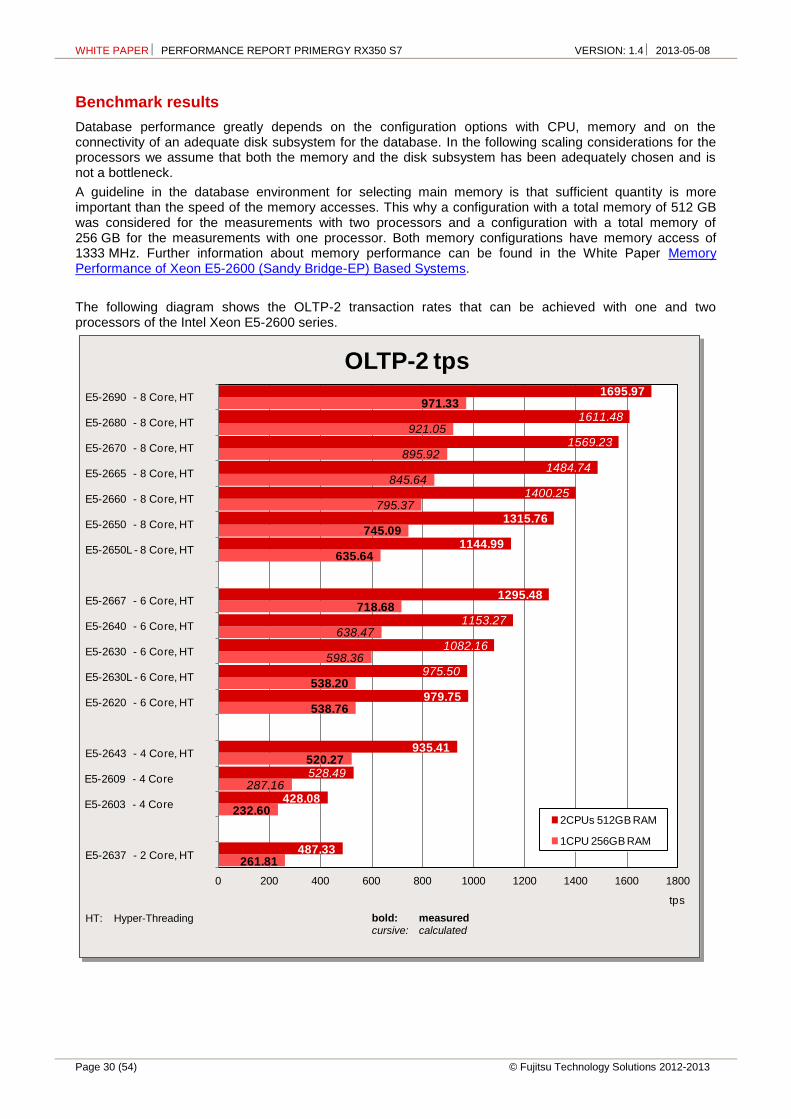
Database performance greatly depends on the configuration options with CPU, memory and on the connectivity of an adequate disk subsystem for the database. In the following scaling considerations for the processors we assume that both the memory and the disk subsystem has been adequately chosen and is not a bottleneck.
A guideline in the database environment for selecting main memory is that sufficient quantity is more important than the speed of the memory accesses. This why a configuration with a total memory of 512 GB was considered for the measurements with two processors and a configuration with a total memory of 256 GB for the measurements with one processor. Both memory configurations have memory access of 1333 MHz. Further information about memory performance can be found in the White Paper Memory Performance of Xeon E5-2600 (Sandy Bridge-EP) Based Systems.
The following diagram shows the OLTP-2 transaction rates that can be achieved with one and two processors of the Intel Xeon E5-2600 series.
261.81
232.60
287.16
520.27
538.76
538.20
598.36
638.47
718.68
635.64
745.09
795.37
845.64
895.92
921.05
971.33
487.33
428.08
528.49
935.41
979.75
975.50
1082.16
1153.27
1295.48
1144.99
1315.76
1400.25
1484.74
1569.23
1611.48
1695.97
0 200 400 600 800 1000 1200 1400 1600 1800
E5-2637 - 2 Core, HT
E5-2603 - 4 Core
E5-2609 - 4 Core
E5-2643 - 4 Core, HT
E5-2620 - 6 Core, HT
E5-2630L - 6 Core, HT
E5-2630 - 6 Core, HT
E5-2640 - 6 Core, HT
E5-2667 - 6 Core, HT
E5-2650L - 8 Core, HT
E5-2650 - 8 Core, HT
E5-2660 - 8 Core, HT
E5-2665 - 8 Core, HT
E5-2670 - 8 Core, HT
E5-2680 - 8 Core, HT
E5-2690 - 8 Core, HT
OLTP-2 tps
2CPUs 512GB RAM
1CPU 256GB RAM
tps
bold: measured cursive: calculated
HT: Hyper-Threading

WHITE PAPER PERFORMANCE REPORT PRIMERGY RX350 S7 VERSION: 1.4 2013-05-08
© Fujitsu Technology Solutions 2012-2013 Page 31 (54)
It is evident that a wide performance range is covered by the variety of released processors. If you compare the OLTP-2 value of the processor with the lowest performance (Xeon E5-2603) with the value of the processor with the highest performance (Xeon E5-2690), the result is a 4-fold increase in performance.
Based on the results achieved the processors can be divided into different performance groups:
The start is made with Xeon E5-2603 and E5-2609 as processors with four cores, but without Hyper-Threading and without turbo mode. Although the Xeon E5-2637 only has two cores, it is nevertheless Hyper-Threading-capable and on account of the clock frequency lies, as far as performance is concerned, between these two processors. Due to its high clock frequency and the high QPI speed of 8.00 GT/s the throughput rates of the 6-core processors with the lowest frequencies (Xeon E5-2620 and E5-2630L) are almost achieved with the performance-optimized 4-core processor Xeon E5-2643. However, the processors with 95 Watt and 60 Watt respectively also have distinctly lower power consumption than the Xeon E5-2643 with 130 Watt.
The 6-core processors are all Hyper-Threading-capable, have with 7.20 GT/s a higher QPI speed than the group of 4-core processors with 6.40 GT/s and they have a 50% larger L3 cache of 15 MB. At the upper end of the performance scale of the 6-core processors is the Xeon E5-2667 (130 Watt) with its especially high frequency, which on the other hand achieves an OLTP performance that is slightly above the 8-core processor with the lowest performance, Xeon E5-2650L (70 Watt).
The group of processors with eight cores, a QPI speed of 8.00 GT/s and a 20 MB L3 cache is to be found at the upper end of the performance scale. Due to the graduated CPU clock frequencies an OLTP performance of between 1145 tps (2 × Xeon E5-2650L) and 1696 tps (2 × Xeon E5-2690) is achieved.
If you compare the maximum achievable OLTP-2 values of the current system generation with the values that were achieved on the predecessor systems, the result is an increase of about 34%.
Current System TX300 S7 RX200 S7 RX300 S7 RX350 S7 BX924 S3
Predecessor System TX300 S6 RX200 S6 RX300 S6 TX300 S6 BX924 S2
0
200
400
600
800
1000
1200
1400
1600
1800
2000
+ ~ 34%
tps
Current System Predecessor System
Maximum OLTP-2 tps
Comparison of system generations
2 × X5690
192 GB 2 × E5-2690
512 GB
WHITE PAPER PERFORMANCE REPORT PRIMERGY RX350 S7 VERSION: 1.4 2013-05-08
Page 32 (54) © Fujitsu Technology Solutions 2012-2013
vServCon
Benchmark description
vServCon is a benchmark used by Fujitsu Technology Solutions to compare server configurations with hypervisor with regard to their suitability for server consolidation. This allows both the comparison of systems, processors and I/O technologies as well as the comparison of hypervisors, virtualization forms and additional drivers for virtual machines.
vServCon is not a new benchmark in the true sense of the word. It is more a framework that combines already established benchmarks (or in modified form) as workloads in order to reproduce the load of a consolidated and virtualized server environment. Three proven benchmarks are used which cover the application scenarios database, application server and web server.
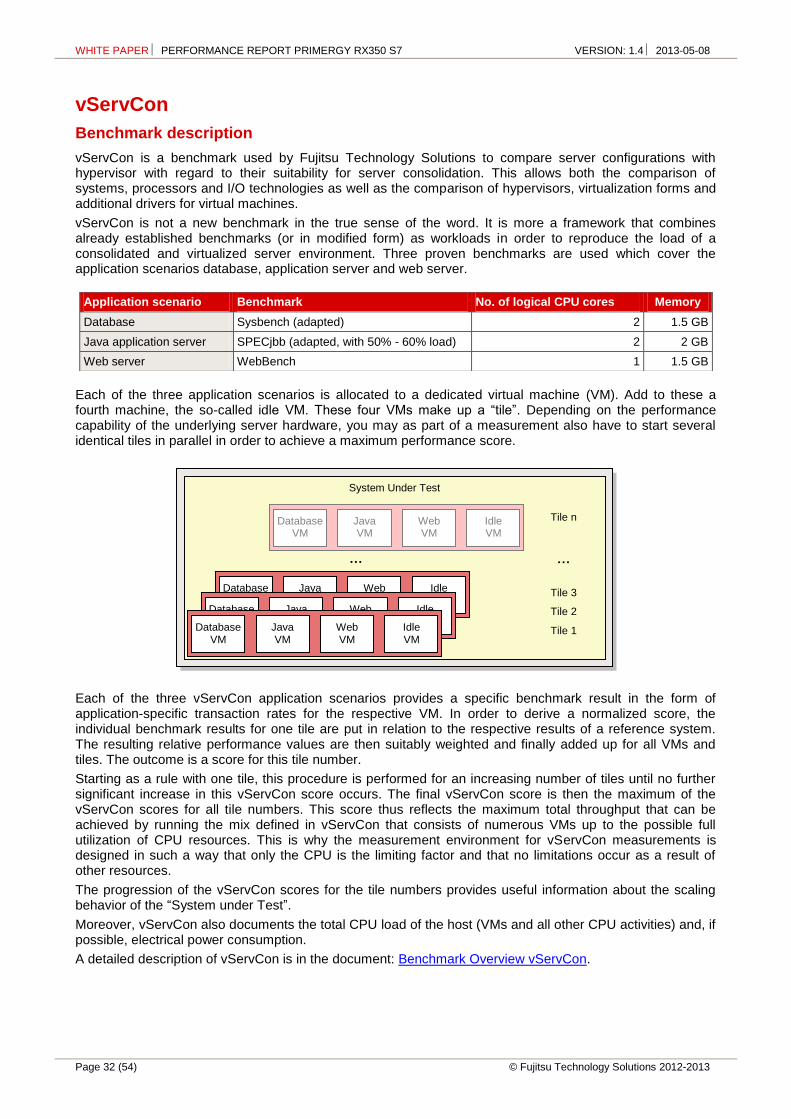
Each of the three application scenarios is allocated to a dedicated virtual machine (VM). Add to these a fourth machine, the so-called idle VM. These four VMs make up a “tile”. Depending on the performance capability of the underlying server hardware, you may as part of a measurement also have to start several identical tiles in parallel in order to achieve a maximum performance score.
Each of the three vServCon application scenarios provides a specific benchmark result in the form of application-specific transaction rates for the respective VM. In order to derive a normalized score, the individual benchmark results for one tile are put in relation to the respective results of a reference system. The resulting relative performance values are then suitably weighted and finally added up for all VMs and tiles. The outcome is a score for this tile number.
Starting as a rule with one tile, this procedure is performed for an increasing number of tiles until no further significant increase in this vServCon score occurs. The final vServCon score is then the maximum of the vServCon scores for all tile numbers. This score thus reflects the maximum total throughput that can be achieved by running the mix defined in vServCon that consists of numerous VMs up to the possible full utilization of CPU resources. This is why the measurement environment for vServCon measurements is designed in such a way that only the CPU is the limiting factor and that no limitations occur as a result of other resources.
The progression of the vServCon scores for the tile numbers provides useful information about the scaling behavior of the “System under Test”.
Moreover, vServCon also documents the total CPU load of the host (VMs and all other CPU activities) and, if possible, electrical power consumption.
A detailed description of vServCon is in the document: Benchmark Overview vServCon.
Application scenario Benchmark No. of logical CPU cores Memory
Database Sysbench (adapted) 2 1.5 GB
Java application server SPECjbb (adapted, with 50% - 60% load) 2 2 GB
Web server WebBench 1 1.5 GB
System Under Test
… …
Tile n
Tile 3
Tile 2
Tile 1
Database VM
Web VM
Idle VM
Java VM
Database VM
Web VM
Idle VM
Java VM
Database VM
Web VM
Idle VM
Java VM Database
VM Web VM
Idle VM
Java VM

WHITE PAPER PERFORMANCE REPORT PRIMERGY RX350 S7 VERSION: 1.4 2013-05-08
© Fujitsu Technology Solutions 2012-2013 Page 33 (54)
Benchmark environment
The measurement set-up is symbolically illustrated below:
All results were determined by way of example on a PRIMERGY RX350 S7.
System Under Test (SUT)
Hardware
Model PRIMERGY RX350 S7
Processor Xeon E5-2600 processor series
Memory 1 processor: 8 × 8GB (1x8GB) 2Rx4 L DDR3-1600 R ECC 2 processors: 16 × 8GB (1x8GB) 2Rx4 L DDR3-1600 R ECC
Network interface 1 × dual port 1GbE adapter 1 × dual port 10GbE server adapter
Disk subsystem 1 × dual-channel FC controller Emulex LPe12002
ETERNUS DX80 storage systems:
Each tile: 50 GB LUN
Each LUN: RAID 0 with 2 × Seagate ST3300657SS disks (15 krpm)
Software
Operating system VMware ESX 5.0.0 Build 469512
Load generator (incl. Framework controller)
Hardware (Shared)
Enclosure PRIMERGY BX900
Hardware
Model 18 × PRIMERGY BX920 S1 server blades
Processor 2 × Xeon X5570
Memory 12 GB
Network interface 3 × 1 Gbit/s LAN
Software
Operating system Microsoft Windows Server 2003 R2 Enterprise with Hyper-V
Multiple 1Gb or 10Gb
networks
Load generators
Server Disk subsystem
System Under Test (SUT)
Framework
controller

WHITE PAPER PERFORMANCE REPORT PRIMERGY RX350 S7 VERSION: 1.4 2013-05-08
Page 34 (54) © Fujitsu Technology Solutions 2012-2013
Load generator VM (per tile 3 load generator VMs on various server blades)
Hardware
Processor 1 × logical CPU
Memory 512 MB
Network interface 2 × 1 Gbit/s LAN
Software
Operating system Microsoft Windows Server 2003 R2 Enterprise Edition
Some components may not be available in all countries or sales regions.
WHITE PAPER PERFORMANCE REPORT PRIMERGY RX350 S7 VERSION: 1.4 2013-05-08
© Fujitsu Technology Solutions 2012-2013 Page 35 (54)
Benchmark results
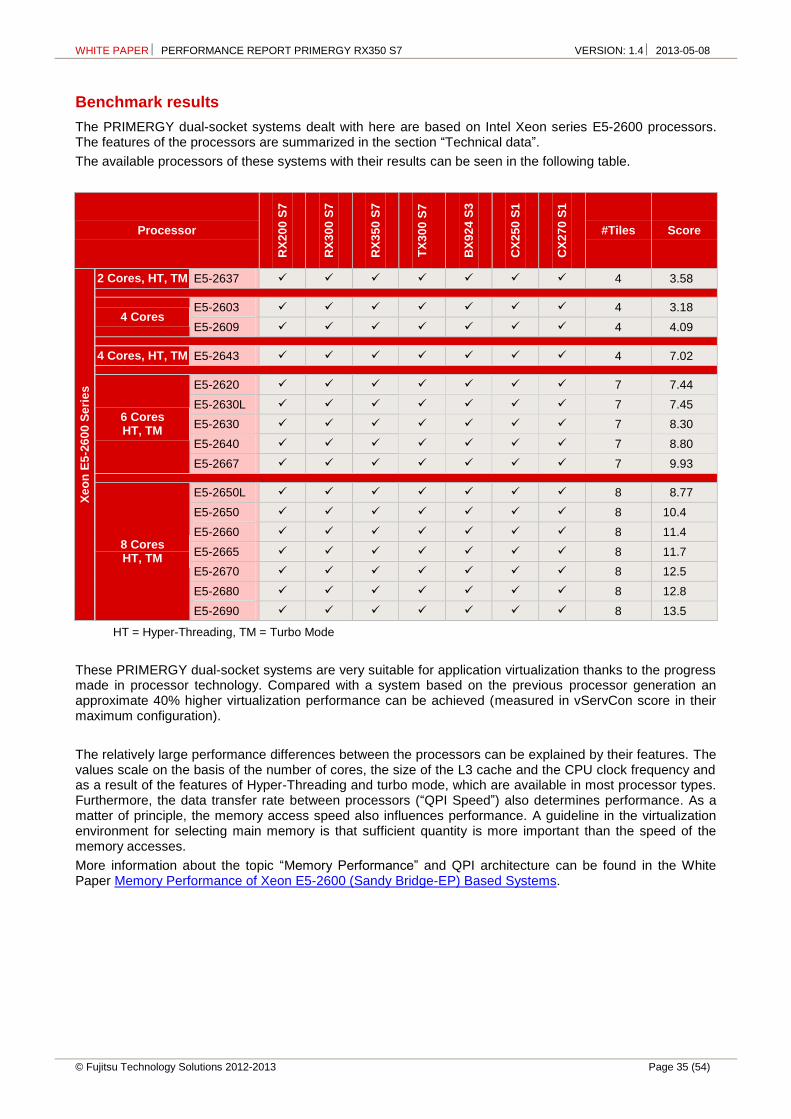
The PRIMERGY dual-socket systems dealt with here are based on Intel Xeon series E5-2600 processors. The features of the processors are summarized in the section “Technical data”.
The available processors of these systems with their results can be seen in the following table.
Processor
RX
20
0 S
7
RX
30
0 S
7
RX
35
0 S
7
TX
30
0 S
7
BX
92
4 S
3
CX
25
0 S
1
CX
27
0 S
1
#Tiles Score
Xe
on
E5
-26
00
Se
rie
s
2 Cores, HT, TM E5-2637 4 3.58
4 Cores E5-2603 4 3.18
E5-2609 4 4.09
4 Cores, HT, TM E5-2643 4 7.02
6 Cores HT, TM
E5-2620 7 7.44
E5-2630L 7 7.45
E5-2630 7 8.30
E5-2640 7 8.80
E5-2667 7 9.93
8 Cores HT, TM
E5-2650L 8 8.77
E5-2650 8 10.4
E5-2660 8 11.4
E5-2665 8 11.7
E5-2670 8 12.5
E5-2680 8 12.8
E5-2690 8 13.5
HT = Hyper-Threading, TM = Turbo Mode
These PRIMERGY dual-socket systems are very suitable for application virtualization thanks to the progress made in processor technology. Compared with a system based on the previous processor generation an approximate 40% higher virtualization performance can be achieved (measured in vServCon score in their maximum configuration).
The relatively large performance differences between the processors can be explained by their features. The values scale on the basis of the number of cores, the size of the L3 cache and the CPU clock frequency and as a result of the features of Hyper-Threading and turbo mode, which are available in most processor types. Furthermore, the data transfer rate between processors (“QPI Speed”) also determines performance. As a matter of principle, the memory access speed also influences performance. A guideline in the virtualization environment for selecting main memory is that sufficient quantity is more important than the speed of the memory accesses.
More information about the topic “Memory Performance” and QPI architecture can be found in the White Paper Memory Performance of Xeon E5-2600 (Sandy Bridge-EP) Based Systems.

WHITE PAPER PERFORMANCE REPORT PRIMERGY RX350 S7 VERSION: 1.4 2013-05-08
Page 36 (54) © Fujitsu Technology Solutions 2012-2013
6.9
5@
4 ti
les
13.5
0@
8 ti
les
0
5
10
15
1 x E5-2690 2 x E5-2690
× 1.94
Fin
al v
Serv
Co
n S
co
re
The first diagram compares the virtualization performance values that can be achieved with the processors reviewed here.
The Xeon E5-2637 as the processor with two cores only makes the start. A similarly low performance can be seen in the Xeon E5-2603 and E5-2609 processors, as they have to manage without Hyper-Threading (HT) and turbo mode (TM). In principle, these weakest processors are only to a limited extent suitable for the virtualization environment.
A further increase in performance is achieved by the processor with four cores, which supports both Hyper-Threading and the turbo mode (Xeon E5-2643).
In addition to the number of cores, the L3 cache and the data transfer rate make a considerable contribution to the respective increase in performance in the 8-core versions compared with the 6-core versions.
Within a group of processors with the same number of cores scaling can be seen via the CPU clock frequency.
Until now we have looked at the virtualization performance of a fully configured system. However, with a server with two sockets the question also arises as to how good performance scaling is from one to two processors. The better the scaling, the lower the overhead usually caused by the shared use of resources within a server. The scaling factor also depends on the application. If the server is used as a virtualization platform for server consolidation, the system scales with a factor of 1.94. When operated with two processors, the system thus almost achieves twice the performance as with one processor, as is illustrated in the diagram opposite using the processor version Xeon E5-2690 as an example.
E5-2
637
E5-2
603
E5-2
609
E5-2
643
E5-2
620
E5-2
630L
E5-2
630
E5-2
640
E5-2
667
E5-2
650L
E5-2
650
E5-2
660
E5-2
665
E5-2
670
E5-2
680
E5-2
690
4 4 4 4 7 7 7 7 7 8 8 8 8 8 8 8
0
2
4
6
8
10
12
14
Fin
al v
Serv
Co
n S
co
re
Xeon E5-2600 Processor Series #Tiles
8 Core 6 Core 4 Core 2 Core

WHITE PAPER PERFORMANCE REPORT PRIMERGY RX350 S7 VERSION: 1.4 2013-05-08
© Fujitsu Technology Solutions 2012-2013 Page 37 (54)
The next diagram illustrates the virtualization performance for increasing numbers of VMs based on the Xeon E5-2620 (6-Core) and E5-2650 (8-Core) processors. The respective CPU loads of the host have also been entered. The number of tiles with optimal CPU load is typically at about 90%; beyond that you have overload, which is where virtualization performance no longer increases, or sinks again.
In addition to the increased number of physical cores, Hyper-Threading, which is supported by almost all Xeon processors of the E5-2600 series, is an additional reason for the high number of VMs that can be operated. As is known, a physical processor core is consequently divided into two logical cores so that the number of cores available for the hypervisor is doubled. This standard feature thus generally increases the virtualization performance of a system.
The scaling curves for the number of tiles as seen in the previous diagram are specifically for systems with Hyper-Threading. 16 physical and thus 32 logical cores are available with the Xeon E5-2650 processors; approximately four of them are used per tile (see Benchmark description). This means that a parallel use of the same physical cores by several VMs is avoided up to a maximum of about four tiles. That is why the performance curve in this range scales almost ideal. For the quantities above the growth is flatter up to CPU full utilization.
The previous diagram examined the total performance of all application VMs of a host. However, studying the performance from an individual application VM viewpoint is also interesting. This information is in the previous diagram. For example, the total optimum is reached in the above Xeon E5-2650 situation with 24 application VMs (eight tiles, not including the idle VMs); the low load case is represented by three application VMs (one tile, not including the idle VM). Remember: the vServCon score for one tile is an average value across the three application scenarios in vServCon. This average performance of one tile drops when changing from the low load case to the total optimum of the vServCon score - from 2.02 to 10.4/8=1.3, i.e. to 64%. The individual types of application VMs can react very differently in the high load situation. It is thus clear that in a specific situation the performance requirements of an individual application must be balanced against the overall requirements regarding the numbers of VMs on a virtualization host.
1.9
7
3.8
3
5.3
5
6.3
9
7.2
0
7.3
8
7.4
4
2.0
2
4.2
2
5.9
6
7.4
6
8.6
4
9.5
9
10.1
10.4
0%
10%
20%
30%
40%
50%
60%
70%
80%
90%
100%E5-2620 E5-2650
0
2
4
6
8
10
12
1 2 3 4 5 6 7 1 2 3 4 5 6 7 8
vS
erv
Co
n s
co
re
#Tiles
---- CPU Util %
WHITE PAPER PERFORMANCE REPORT PRIMERGY RX350 S7 VERSION: 1.4 2013-05-08
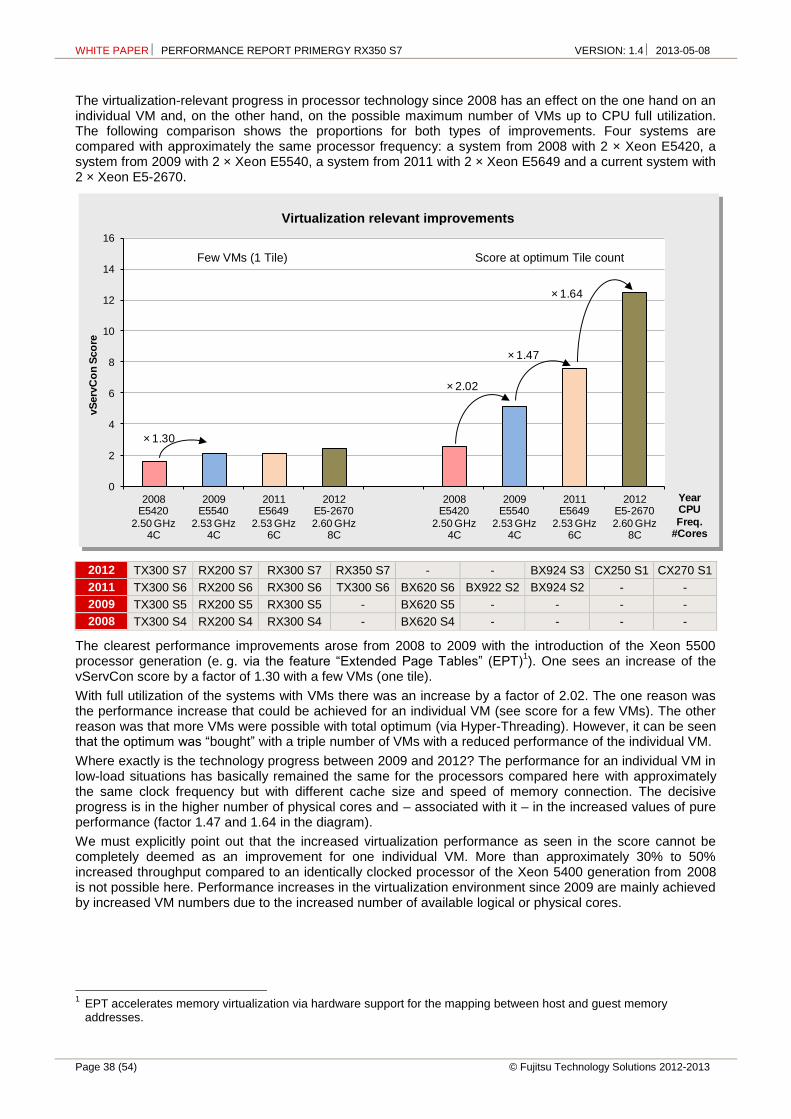
Page 38 (54) © Fujitsu Technology Solutions 2012-2013
0
2
4
6
8
10
12
14
16
2008E5420
2.50 GHz4C
2009E5540
2.53 GHz4C
2011E5649
2.53 GHz6C
2012E5-2670
2.60 GHz8C
2008E5420
2.50 GHz4C
2009E5540
2.53 GHz4C
2011E5649
2.53 GHz6C
2012E5-2670
2.60 GHz8C
vS
erv
Co
n S
co
re
Year CPU
Freq.#Cores
× 2.02
× 1.47
× 1.64
× 1.30
The virtualization-relevant progress in processor technology since 2008 has an effect on the one hand on an individual VM and, on the other hand, on the possible maximum number of VMs up to CPU full utilization. The following comparison shows the proportions for both types of improvements. Four systems are compared with approximately the same processor frequency: a system from 2008 with 2 × Xeon E5420, a system from 2009 with 2 × Xeon E5540, a system from 2011 with 2 × Xeon E5649 and a current system with 2 × Xeon E5-2670.
2012 TX300 S7 RX200 S7 RX300 S7 RX350 S7 - - BX924 S3 CX250 S1 CX270 S1
2011 TX300 S6 RX200 S6 RX300 S6 TX300 S6 BX620 S6 BX922 S2 BX924 S2 - -
2009 TX300 S5 RX200 S5 RX300 S5 - BX620 S5 - - - -
2008 TX300 S4 RX200 S4 RX300 S4 - BX620 S4 - - - -
The clearest performance improvements arose from 2008 to 2009 with the introduction of the Xeon 5500 processor generation (e. g. via the feature “Extended Page Tables” (EPT)
1). One sees an increase of the
vServCon score by a factor of 1.30 with a few VMs (one tile).
With full utilization of the systems with VMs there was an increase by a factor of 2.02. The one reason was the performance increase that could be achieved for an individual VM (see score for a few VMs). The other reason was that more VMs were possible with total optimum (via Hyper-Threading). However, it can be seen that the optimum was “bought” with a triple number of VMs with a reduced performance of the individual VM.
Where exactly is the technology progress between 2009 and 2012? The performance for an individual VM in low-load situations has basically remained the same for the processors compared here with approximately the same clock frequency but with different cache size and speed of memory connection. The decisive progress is in the higher number of physical cores and – associated with it – in the increased values of pure performance (factor 1.47 and 1.64 in the diagram).
We must explicitly point out that the increased virtualization performance as seen in the score cannot be completely deemed as an improvement for one individual VM. More than approximately 30% to 50% increased throughput compared to an identically clocked processor of the Xeon 5400 generation from 2008 is not possible here. Performance increases in the virtualization environment since 2009 are mainly achieved by increased VM numbers due to the increased number of available logical or physical cores.
1 EPT accelerates memory virtualization via hardware support for the mapping between host and guest memory addresses.
Few VMs (1 Tile)
Virtualization relevant improvements
Score at optimum Tile count

WHITE PAPER PERFORMANCE REPORT PRIMERGY RX350 S7 VERSION: 1.4 2013-05-08
© Fujitsu Technology Solutions 2012-2013 Page 39 (54)
VMmark V2
Benchmark description
VMmark V2 is a benchmark developed by VMware to compare server configurations with hypervisor solutions from VMware regarding their suitability for server consolidation. In addition to the software for load generation, the benchmark consists of a defined load profile and binding regulations. The benchmark results can be submitted to VMware and are published on their Internet site after a successful review process. After the discontinuation of the proven benchmark “VMmark V1” in October 2010, it has been succeeded by “VMmark V2”, which requires a cluster of at least two servers and covers data center functions, like Cloning and Deployment of virtual machines (VMs), Load Balancing, as well as the moving of VMs with vMotion and also Storage vMotion.
VMmark V2 is not a new benchmark in the actual sense. It is in fact a framework that consolidates already established benchmarks, as workloads in order to simulate the load of a virtualized consolidated server environment. Three proven benchmarks, which cover the application scenarios mail server, Web 2.0, and e-commerce were integrated in VMmark V2.
Each of the three application scenarios is assigned to a total of seven dedicated virtual machines. Then add to these an eighth VM called the “standby server”. These eight VMs form a “tile”. Because of the performance capability of the underlying server hardware, it is usually necessary to have started several identical tiles in parallel as part of a measurement in order to achieve a maximum overall performance.
A new feature of VMmark V2 is an infrastructure component, which is present once for every two hosts. It measures the efficiency levels of data center consolidation through VM Cloning and Deployment, vMotion and Storage vMotion. The Load Balancing capacity of the data center is also used (DRS, Distributed Resource Scheduler).
The result of VMmark V2 is a number, known as a “score”, which provides information about the performance of the measured virtualization solution. The score reflects the maximum total consolidation benefit of all VMs for a server configuration with hypervisor and is used as a comparison criterion of various hardware platforms.
This score is determined from the individual results of the VMs and an infrastructure result. Each of the five VMmark V2 application or front-end VMs provides a specific benchmark result in the form of application-specific transaction rates for each VM. In order to derive a normalized score the individual benchmark results for one tile are put in relation to the respective results of a reference system. The resulting dimensionless performance values are then averaged geometrically and finally added up for all VMs. This value is included in the overall score with a weighting of 80%. The infrastructure workload is only present in the benchmark once for every two hosts; it determines 20% of the result. The number of transactions per hour and the average duration in seconds respectively are determined for the score of the infrastructure workload components.
In addition to the actual score, the number of VMmark V2 tiles is always specified with each VMmark V2 score. The result is thus as follows: “Score@Number of Tiles”, for example “4.20@5 tiles”.
A detailed description of VMmark V2 is available in the document Benchmark Overview VMmark V2.
Application scenario Load tool # VMs
Mail server LoadGen 1
Web 2.0 Olio client 2
E-commerce DVD Store 2 client 4
Standby server (IdleVMTest) 1
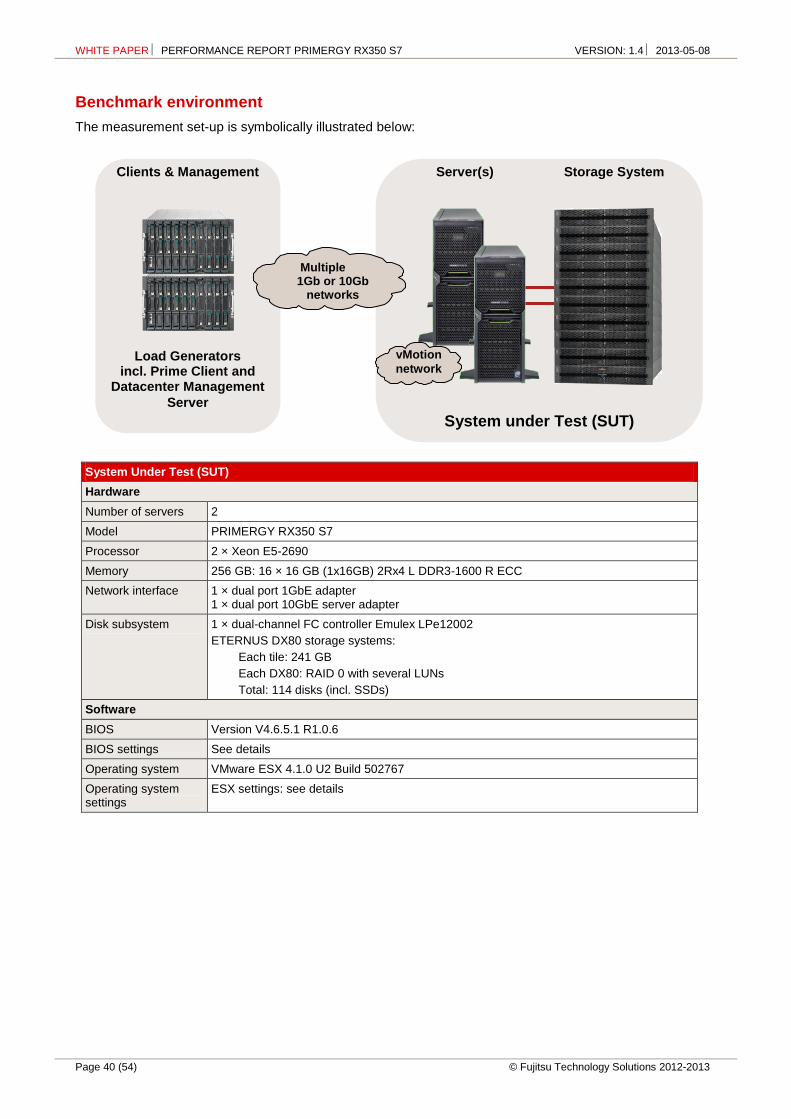
WHITE PAPER PERFORMANCE REPORT PRIMERGY RX350 S7 VERSION: 1.4 2013-05-08
Page 40 (54) © Fujitsu Technology Solutions 2012-2013
Benchmark environment
The measurement set-up is symbolically illustrated below:
System Under Test (SUT)
Hardware
Number of servers 2
Model PRIMERGY RX350 S7
Processor 2 × Xeon E5-2690
Memory 256 GB: 16 × 16 GB (1x16GB) 2Rx4 L DDR3-1600 R ECC
Network interface 1 × dual port 1GbE adapter 1 × dual port 10GbE server adapter
Disk subsystem 1 × dual-channel FC controller Emulex LPe12002
ETERNUS DX80 storage systems:
Each tile: 241 GB
Each DX80: RAID 0 with several LUNs
Total: 114 disks (incl. SSDs)
Software
BIOS Version V4.6.5.1 R1.0.6
BIOS settings See details
Operating system VMware ESX 4.1.0 U2 Build 502767
Operating system settings
ESX settings: see details
Multiple
1Gb or 10Gb networks
Load Generators incl. Prime Client and
Datacenter Management
Server
Server(s) Storage System
System under Test (SUT)
vMotion
network
Clients & Management

WHITE PAPER PERFORMANCE REPORT PRIMERGY RX350 S7 VERSION: 1.4 2013-05-08
© Fujitsu Technology Solutions 2012-2013 Page 41 (54)
Prime Client/Datacenter Management Server (DMS)
Hardware (Shared)
Enclosure PRIMERGY BX600
Network Switch 1 × PRIMERGY BX600 GbE Switch Blade 30/12
Hardware
Model 1 × server blade PRIMERGY BX620 S4
Processor 2 × Xeon X5470
Memory 4 GB
Network interface 2 × 1 Gbit/s LAN
Software
Operating system Prime Client: Microsoft Windows Server 2003 R2 Enterprise Edition SP2, KB955839
DMS: Microsoft Windows Server 2003 R2 Enterprise x64 Edition SP2, KB955839
Load generator
Hardware
Model 1 × PRIMERGY RX600 S6
Processor 4 × Xeon E7-4870
Memory 512 GB
Network interface 1 × 1 Gbit/s LAN 2 × 10 Gbit/s LAN
Software
Operating system VMware ESX 4.1.0 U2 Build 502767
Load generator VM (per tile 1 load generator VM)
Hardware
Processor 4 × logical CPU
Memory 4 GB
Network interface 1 × 1 Gbit/s LAN
Software
Operating system Microsoft Windows Server 2008 Enterprise x64 Edition SP2
Details
See disclosure http://www.vmware.com/a/assets/vmmark/pdf/2012-03-06-Fujitsu-RX350S7.pdf
Some components may not be available in all countries or sales regions.
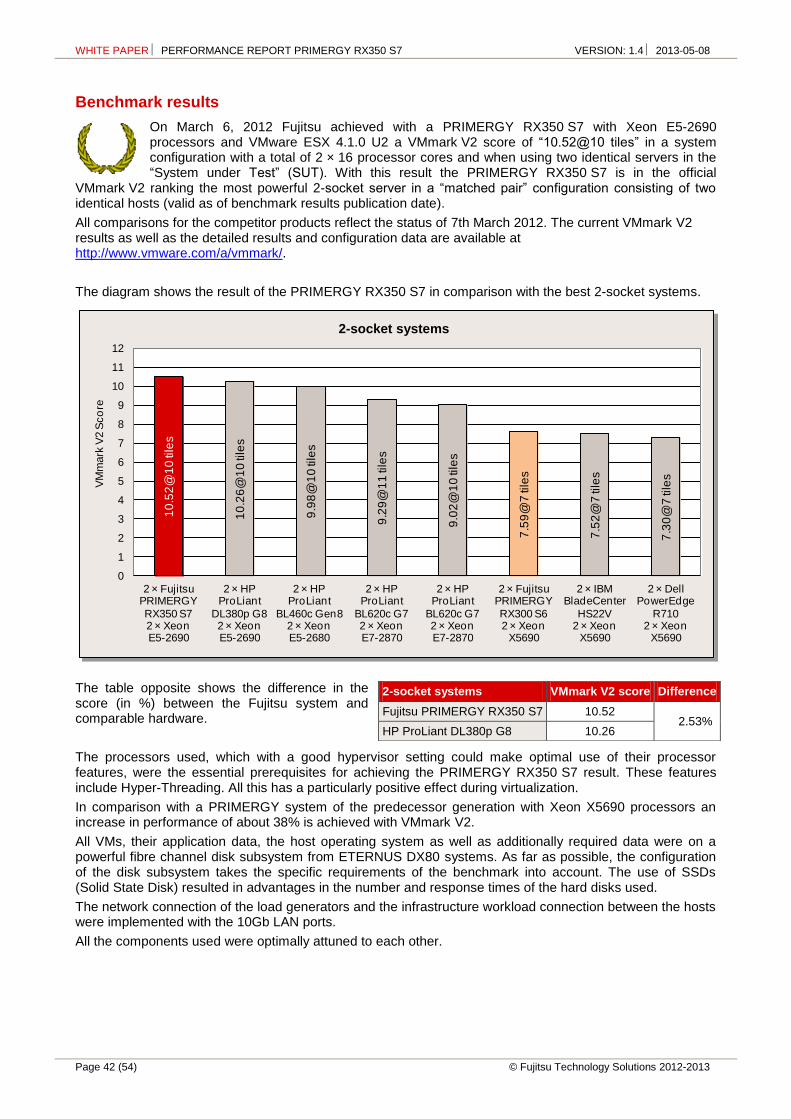
WHITE PAPER PERFORMANCE REPORT PRIMERGY RX350 S7 VERSION: 1.4 2013-05-08
Page 42 (54) © Fujitsu Technology Solutions 2012-2013
10
.52
@1
0 ti
les
10
.26
@1
0 ti
les
9.9
8@
10
tile
s
9.2
9@
11
tile
s
9.0
2@
10
tile
s
7.5
9@
7 ti
les
7.5
2@
7 ti
les
7.3
0@
7 ti
les
0
1
2
3
4
5
6
7
8
9
10
11
12
2 × FujitsuPRIMERGY
RX350 S72 × XeonE5-2690
2 × HPProLiant
DL380p G82 × XeonE5-2690
2 × HPProLiant
BL460c Gen82 × XeonE5-2680
2 × HPProLiant
BL620c G72 × XeonE7-2870
2 × HPProLiant
BL620c G72 × XeonE7-2870
2 × FujitsuPRIMERGY
RX300 S62 × Xeon
X5690
2 × IBMBladeCenter
HS22V2 × Xeon
X5690
2 × DellPowerEdge
R7102 × Xeon
X5690
VM
mark
V2 S
co
reBenchmark results
On March 6, 2012 Fujitsu achieved with a PRIMERGY RX350 S7 with Xeon E5-2690 processors and VMware ESX 4.1.0 U2 a VMmark V2 score of “10.52@10 tiles” in a system configuration with a total of 2 × 16 processor cores and when using two identical servers in the “System under Test” (SUT). With this result the PRIMERGY RX350 S7 is in the official
VMmark V2 ranking the most powerful 2-socket server in a “matched pair” configuration consisting of two identical hosts (valid as of benchmark results publication date).
All comparisons for the competitor products reflect the status of 7th March 2012. The current VMmark V2 results as well as the detailed results and configuration data are available at http://www.vmware.com/a/vmmark/.
The diagram shows the result of the PRIMERGY RX350 S7 in comparison with the best 2-socket systems.
The table opposite shows the difference in the score (in %) between the Fujitsu system and comparable hardware.
The processors used, which with a good hypervisor setting could make optimal use of their processor features, were the essential prerequisites for achieving the PRIMERGY RX350 S7 result. These features include Hyper-Threading. All this has a particularly positive effect during virtualization.
In comparison with a PRIMERGY system of the predecessor generation with Xeon X5690 processors an increase in performance of about 38% is achieved with VMmark V2.
All VMs, their application data, the host operating system as well as additionally required data were on a powerful fibre channel disk subsystem from ETERNUS DX80 systems. As far as possible, the configuration of the disk subsystem takes the specific requirements of the benchmark into account. The use of SSDs (Solid State Disk) resulted in advantages in the number and response times of the hard disks used.
The network connection of the load generators and the infrastructure workload connection between the hosts were implemented with the 10Gb LAN ports.
All the components used were optimally attuned to each other.
2-socket systems VMmark V2 score Difference
Fujitsu PRIMERGY RX350 S7 10.52 2.53%
HP ProLiant DL380p G8 10.26
2-socket systems
WHITE PAPER PERFORMANCE REPORT PRIMERGY RX350 S7 VERSION: 1.4 2013-05-08
© Fujitsu Technology Solutions 2012-2013 Page 43 (54)
STREAM
Benchmark description
STREAM is a synthetic benchmark that has been used for many years to determine memory throughput and which was developed by John McCalpin during his professorship at the University of Delaware. Today STREAM is supported at the University of Virginia, where the source code can be downloaded in either Fortran or C. STREAM continues to play an important role in the HPC environment in particular. It is for example an integral part of the HPC Challenge benchmark suite.
The benchmark is designed in such a way that it can be used both on PCs and on server systems. The unit of measurement of the benchmark is GB/s, i.e. the number of gigabytes that can be read and written per second.
STREAM measures the memory throughput for sequential accesses. These can generally be performed more efficiently than accesses that are randomly distributed on the memory, because the CPU caches are used for sequential access.
Before execution the source code is adapted to the environment to be measured. Therefore, the size of the data area must be at least four times larger than the total of all CPU caches so that these have as little influence as possible on the result. The OpenMP program library is used to enable selected parts of the program to be executed in parallel during the runtime of the benchmark, consequently achieving optimal load distribution to the available processor cores.
During implementation the defined data area, consisting of 8-byte elements, is successively copied to four types, and arithmetic calculations are also performed to some extent.
Type Execution Bytes per step Floating-point calculation per step
COPY a(i) = b(i) 16 0
SCALE a(i) = q × b(i) 16 1
SUM a(i) = b(i) + c(i) 24 1
TRIAD a(i) = b(i) + q × c(i) 24 2
The throughput is output in GB/s for each type of calculation. The differences between the various values are usually only minor on modern systems. In general, only the determined TRIAD value is used as a comparison.
The measured results primarily depend on the clock frequency of the memory modules; the CPUs influence the arithmetic calculations. The accuracy of the results is approximately 5%.
This chapter specifies throughputs on a basis of 10 (1 GB/s = 109 Byte/s).
Benchmark environment
System Under Test (SUT)
Hardware
Model PRIMERGY RX350 S7
Processor 2 processors of Xeon E5-2600 processor series
Memory 16 × 8GB (1x8GB) 2Rx4 L DDR3-1600 R ECC
Software
BIOS settings Processors other than Xeon E5-2603, E5-2609: Hyper-Threading = Disabled
Operating system Red Hat Enterprise Linux Server release 6.2
Operating system settings
echo never > /sys/kernel/mm/redhat_transparent_hugepage/enabled
Compiler Intel C Compiler 12.1
Benchmark Stream.c Version 5.9
Some components may not be available in all countries or sales regions.

WHITE PAPER PERFORMANCE REPORT PRIMERGY RX350 S7 VERSION: 1.4 2013-05-08
Page 44 (54) © Fujitsu Technology Solutions 2012-2013
Benchmark results
Processor Cores Processor Frequency
[Ghz]
Max. Memory Frequency
[MHz]
TRIAD
[GB/s]
2 × Xeon E5-2637 2 3.00 1600 42.4
2 × Xeon E5-2603 4 1.80 1067 47.1
2 × Xeon E5-2609 4 2.40 1067 54.0
2 × Xeon E5-2643 4 3.30 1600 75.6
2 × Xeon E5-2630L 6 2.00 1333 68.7
2 × Xeon E5-2620 6 2.00 1333 67.0
2 × Xeon E5-2630 6 2.30 1333 68.3
2 × Xeon E5-2640 6 2.50 1333 70.3
2 × Xeon E5-2667 6 2.90 1600 81.8
2 × Xeon E5-2650L 8 1.80 1600 71.4
2 × Xeon E5-2650 8 2.00 1600 77.0
2 × Xeon E5-2660 8 2.20 1600 78.0
2 × Xeon E5-2665 8 2.40 1600 79.0
2 × Xeon E5-2670 8 2.60 1600 80.0
2 × Xeon E5-2680 8 2.70 1600 80.0
2 × Xeon E5-2690 8 2.90 1600 80.4
The results depend primarily on the maximum memory frequency. The Xeon E5-2637, which with only 2 cores does not use all 4 channels of the memory controller in the STREAM benchmark, is the exception. The smaller differences with processors with the same maximum memory frequency are a result in arithmetic calculation of the different processor frequencies.
The following diagram illustrates the throughput of the PRIMERGY RX350 S7 in comparison to its predecessor, the PRIMERGY TX300 S6, in their most performant configuration.
0
10
20
30
40
50
60
70
80
90
PRIMERGY TX300 S62 × Xeon X5667
PRIMERGY RX350 S72 × Xeon E5-2667
41.4
81.8
GB/s
STREAM TRIAD: PRIMERGY RX350S7 vs. PRIMERGY TX300S6

WHITE PAPER PERFORMANCE REPORT PRIMERGY RX350 S7 VERSION: 1.4 2013-05-08
© Fujitsu Technology Solutions 2012-2013 Page 45 (54)
LINPACK
Benchmark description
LINPACK was developed in the 1970s by Jack Dongarra and some other people to show the performance of supercomputers. The benchmark consists of a collection of library functions for the analysis and solution of linear system of equations. A description can be found in the document http://www.netlib.org/utk/people/JackDongarra/PAPERS/hplpaper.pdf.
LINPACK can be used to measure the speed of computers when solving a linear equation system. For this purpose, an n × n matrix is set up and filled with random numbers between -2 and +2. The calculation is then performed via LU decomposition with partial pivoting.
A memory of 8n² bytes is required for the matrix. In case of an n × n matrix the number of arithmetic operations required for the solution is
2/3n
3 + 2n
2. Thus, the choice of n determines the duration of the
measurement: a doubling of n results in an approximately eight-fold increase in the duration of the measurement. The size of n also has an influence on the measurement result itself: as n increases, the measured value asymptotically approaches a limit. The size of the matrix is therefore usually adapted to the amount of memory available. Furthermore, the memory bandwidth of the system only plays a minor role for the measurement result, but a role that cannot be fully ignored. The processor performance is the decisive factor for the measurement result. Since the algorithm used permits parallel processing, in particular the number of processors used and their processor cores are - in addition to the clock rate - of outstanding significance.
LINPACK is used to measure how many floating point operations were carried out per second. The result is referred to as Rmax and specified in GFlops (Giga Floating Point Operations per Second).
An upper limit, referred to as Rpeak, for the speed of a computer can be calculated from the maximum number of floating point operations that its processor cores could theoretically carry out in one clock cycle:
Rpeak = Maximum number of floating point operations per clock cycle × Number of processor cores of the computer × Maximum processor frequency[GHz]
LINPACK is classed as one of the leading benchmarks in the field of high performance computing (HPC). LINPACK is one of the seven benchmarks currently included in the HPC Challenge benchmark suite, which takes other performance aspects in the HPC environment into account.
Manufacturer-independent publication of LINPACK results is possible at http://www.top500.org/. The use of a LINPACK version based on HPL is prerequisite for this (see: http://www.netlib.org/benchmark/hpl).
Intel offers a highly optimized LINPACK version (shared memory version) for individual systems with Intel processors. Parallel processes communicate here via "shared memory", i.e. jointly used memory. Another version provided by Intel is based on HPL (High Performance Linpack). Intercommunication of the LINPACK processes here takes place via OpenMP and MPI (Message Passing Interface). This enables communication between the parallel processes - also from one computer to another. Both versions can be downloaded from http://software.intel.com/en-us/articles/intel-math-kernel-library-linpack-download/.
Manufacturer-specific LINPACK versions also come into play when graphics cards for General Purpose Computation on Graphics Processing Unit (GPGPU) are used. These are based on HPL and include extensions which are needed for communication with the graphics cards.

WHITE PAPER PERFORMANCE REPORT PRIMERGY RX350 S7 VERSION: 1.4 2013-05-08
Page 46 (54) © Fujitsu Technology Solutions 2012-2013
Benchmark environment
Measurements with Xeon E5-2600 processor series
System Under Test (SUT)
Hardware
Model PRIMERGY RX350 S7
Processor 2 processors of Xeon E5-2600 processor series
Memory 16 × 8GB (1x8GB) 2Rx4 L DDR3-1600 R ECC
Software
BIOS settings Processors other than Xeon E5-2603, E5-2609: Hyper-Threading = Disabled
Operating system Red Hat Enterprise Linux Server release 6.2
Benchmark Shared memory version: Intel Optimized LINPACK Benchmark 10.3 Update 11 for Linux OS
Measurements with 2 × Xeon E5-2690 and up to 2 × PY NVIDIA Tesla C2075 GPGPU
System Under Test (SUT)
Hardware
Model PRIMERGY RX350 S7
Processor 2 × Xeon E5-2690
Memory 16 × 8GB (1x8GB) 2Rx4 L DDR3-1600 R ECC
GPGPU/Coprocessor 1 / 2 × PY NVIDIA Tesla C2075 GPGPU
Software
BIOS-settings Hyper-Threading = Disabled
Operating system Red Hat Enterprise Linux Server release 6.3
Benchmark
HPL version:
CUDA-enabled version of HPL optimized for Tesla 20-series GPUs version 1.3 Intel MPI Library 4.0 Update 3 for Linux OS Intel Math Kernel Library 10.3 Update 11 for Linux OS CUDA 4.0
Compiler Intel C++ Compiler XE 12.1 Update 5 for Linux
SPECcpu2006: floating-point performance PRIMERGY TX200 S6 vs. predecessor

WHITE PAPER PERFORMANCE REPORT PRIMERGY RX350 S7 VERSION: 1.4 2013-05-08
© Fujitsu Technology Solutions 2012-2013 Page 47 (54)
Measurements with 2 × Xeon E5-2690 and up to 2 × PY NVIDIA Tesla K20 GPGPU
Measurements with 2 × Xeon E5-2690 and up to 2 × PY NVIDIA Tesla K20X GPGPU
System Under Test (SUT)
Hardware
Model PRIMERGY RX350 S7
Processor 2 × Xeon E5-2690
Memory 16 × 8GB (1x8GB) 2Rx4 L DDR3-1600 R ECC
GPGPU/Coprocessor 1 / 2 × PY NVIDIA Tesla K20 GPGPU 1 / 2 × PY NVIDIA Tesla K20X GPGPU
Software
BIOS-settings
Hyper-Threading = Disabled
Turbo Mode = Enabled (default) = Disabled
Operating system Red Hat Enterprise Linux Server release 6.3
Benchmark
HPL version:
CUDA-enabled version of HPL optimized for Tesla 20-series GPUs version 1.5 Intel MPI Library 4.0 Update 3 for Linux OS Intel Math Kernel Library 11.0 Update 2 for Linux OS CUDA 5.0
Compiler Intel C++ Compiler XE 13.1 for Linux
Measurements with 2 × Xeon E5-2690 and up to 2 × Intel Xeon Phi Co-Processor 5110P
System Under Test (SUT)
Hardware
Model PRIMERGY RX350 S7
Processor 2 × Xeon E5-2690
Memory 16 × 8GB (1x8GB) 2Rx4 L DDR3-1600 R ECC
GPGPU/Coprocessor 1 / 2 × Intel Xeon Phi Co-Processor 5110P
Software
BIOS-settings
Hyper-Threading = Disabled
Turbo Mode = Enabled (default) = Disabled
Operating system Red Hat Enterprise Linux Server release 6.3
Benchmark
HPL version:
Intel Optimized LINPACK Benchmark 11.0 Update 3 for Linux OS Intel MPI Library 4.1.0 for Linux OS Intel Math Kernel Library 11.0 Update 3 for Linux OS
Compiler Intel C++ Compiler XE 13.1 for Linux
Some components may not be available in all countries or sales regions.
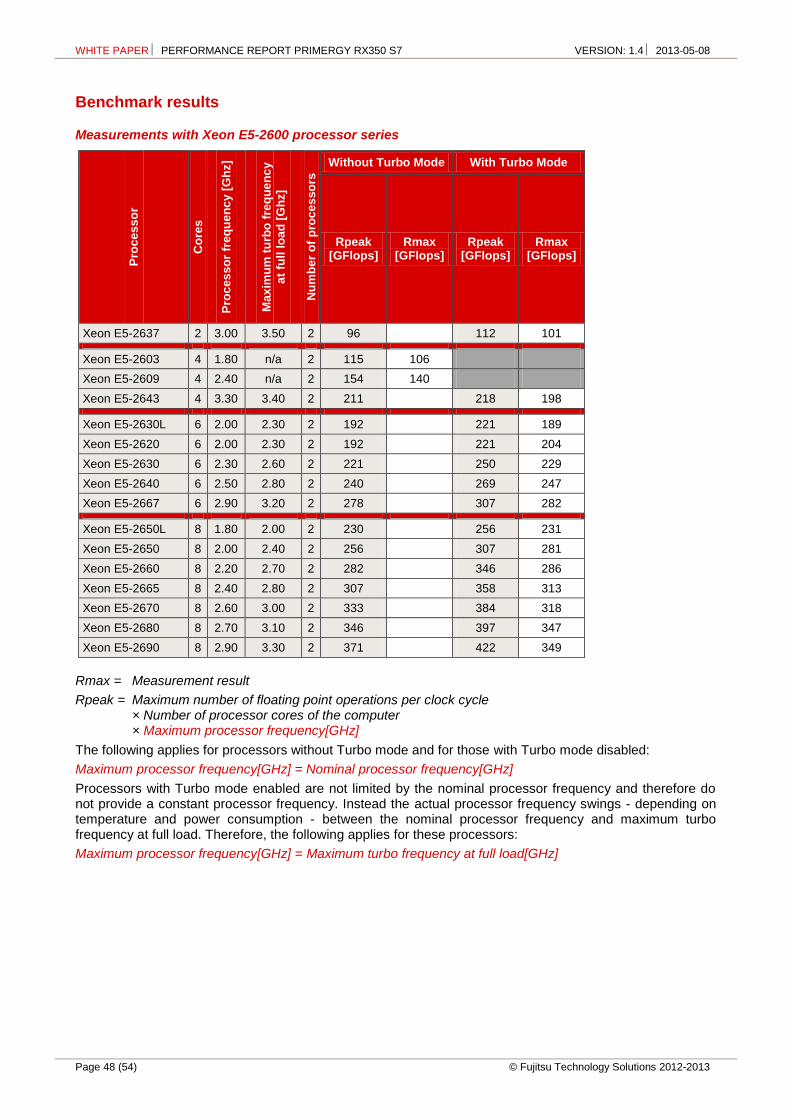
WHITE PAPER PERFORMANCE REPORT PRIMERGY RX350 S7 VERSION: 1.4 2013-05-08
Page 48 (54) © Fujitsu Technology Solutions 2012-2013
Benchmark results
Measurements with Xeon E5-2600 processor series P
roc
es
so
r
Co
res
Pro
ce
ss
or
freq
ue
nc
y [
Gh
z]
Ma
xim
um
tu
rbo
fre
qu
en
cy
at
full
lo
ad
[G
hz]
Nu
mb
er
of
pro
ce
sso
rs
Without Turbo Mode With Turbo Mode
Rpeak [GFlops]
Rmax [GFlops]
Rpeak [GFlops]
Rmax [GFlops]
Xeon E5-2637 2 3.00 3.50 2 96 112 101
Xeon E5-2603 4 1.80 n/a 2 115 106
Xeon E5-2609 4 2.40 n/a 2 154 140
Xeon E5-2643 4 3.30 3.40 2 211 218 198
Xeon E5-2630L 6 2.00 2.30 2 192 221 189
Xeon E5-2620 6 2.00 2.30 2 192 221 204
Xeon E5-2630 6 2.30 2.60 2 221 250 229
Xeon E5-2640 6 2.50 2.80 2 240 269 247
Xeon E5-2667 6 2.90 3.20 2 278 307 282
Xeon E5-2650L 8 1.80 2.00 2 230 256 231
Xeon E5-2650 8 2.00 2.40 2 256 307 281
Xeon E5-2660 8 2.20 2.70 2 282 346 286
Xeon E5-2665 8 2.40 2.80 2 307 358 313
Xeon E5-2670 8 2.60 3.00 2 333 384 318
Xeon E5-2680 8 2.70 3.10 2 346 397 347
Xeon E5-2690 8 2.90 3.30 2 371 422 349
Rmax = Measurement result
Rpeak = Maximum number of floating point operations per clock cycle × Number of processor cores of the computer × Maximum processor frequency[GHz]
The following applies for processors without Turbo mode and for those with Turbo mode disabled:
Maximum processor frequency[GHz] = Nominal processor frequency[GHz]
Processors with Turbo mode enabled are not limited by the nominal processor frequency and therefore do not provide a constant processor frequency. Instead the actual processor frequency swings - depending on temperature and power consumption - between the nominal processor frequency and maximum turbo frequency at full load. Therefore, the following applies for these processors:
Maximum processor frequency[GHz] = Maximum turbo frequency at full load[GHz]
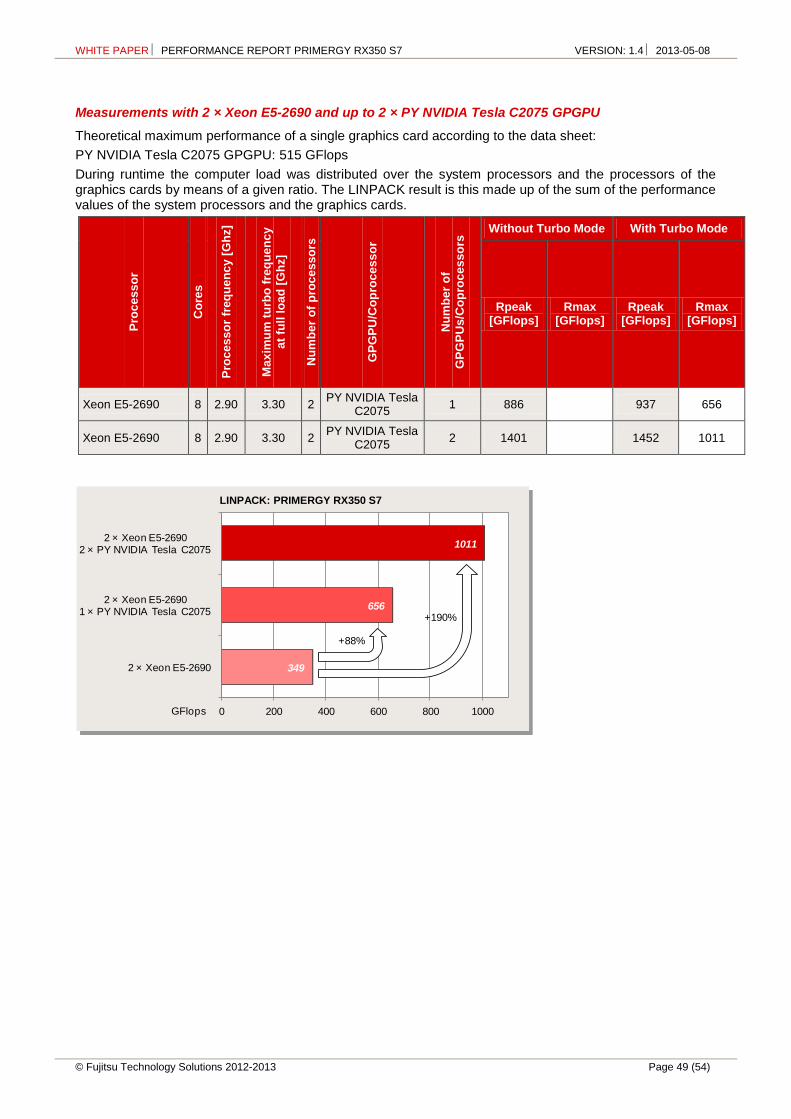
WHITE PAPER PERFORMANCE REPORT PRIMERGY RX350 S7 VERSION: 1.4 2013-05-08
© Fujitsu Technology Solutions 2012-2013 Page 49 (54)
Measurements with 2 × Xeon E5-2690 and up to 2 × PY NVIDIA Tesla C2075 GPGPU
Theoretical maximum performance of a single graphics card according to the data sheet:
PY NVIDIA Tesla C2075 GPGPU: 515 GFlops
During runtime the computer load was distributed over the system processors and the processors of the graphics cards by means of a given ratio. The LINPACK result is this made up of the sum of the performance values of the system processors and the graphics cards.
Pro
ce
ss
or
Co
res
Pro
ce
ss
or
freq
ue
nc
y [
Gh
z]
Ma
xim
um
tu
rbo
fre
qu
en
cy
at
full
lo
ad
[G
hz]
Nu
mb
er
of
pro
ce
sso
rs
GP
GP
U/C
op
roc
es
so
r
Nu
mb
er
of
GP
GP
Us
/Co
pro
ce
ss
ors
Without Turbo Mode With Turbo Mode
Rpeak [GFlops]
Rmax [GFlops]
Rpeak [GFlops]
Rmax [GFlops]
Xeon E5-2690 8 2.90 3.30 2 PY NVIDIA Tesla
C2075 1 886 937 656
Xeon E5-2690 8 2.90 3.30 2 PY NVIDIA Tesla
C2075 2 1401 1452 1011
349
656
1011
0 200 400 600 800 1000
2 × Xeon E5-2690
2 × Xeon E5-26901 × PY NVIDIA Tesla C2075
2 × Xeon E5-26902 × PY NVIDIA Tesla C2075
GFlops
+88%
+190%
LINPACK: PRIMERGY RX350 S7

WHITE PAPER PERFORMANCE REPORT PRIMERGY RX350 S7 VERSION: 1.4 2013-05-08
Page 50 (54) © Fujitsu Technology Solutions 2012-2013
Measurements with 2 × Xeon E5-2690 and up to 2 × PY NVIDIA Tesla K20 GPGPU
Measurements with 2 × Xeon E5-2690 and up to 2 × PY NVIDIA Tesla K20X GPGPU
Theoretical maximum performance of a single graphics card according to the data sheet:
PY NVIDIA Tesla K20 GPGPU: 1170 GFlops
PY NVIDIA Tesla K20X GPGPU: 1310 GFlops
During runtime the computer load was distributed over the system processors and the processors of the graphics cards by means of a given ratio. The LINPACK result is this made up of the sum of the performance values of the system processors and the graphics cards.
Pro
ce
ss
or
Co
res
Pro
ce
ss
or
freq
ue
nc
y [
Gh
z]
Ma
xim
um
tu
rbo
fre
qu
en
cy
at
full
lo
ad
[G
hz]
Nu
mb
er
of
pro
ce
sso
rs
GP
GP
U/C
op
roc
es
so
r
Nu
mb
er
of
GP
GP
Us
/Co
pro
ce
ss
ors
Without Turbo Mode With Turbo Mode
Rpeak [GFlops]
Rmax [GFlops]
Rpeak [GFlops]
Rmax [GFlops]
Xeon E5-2690 8 2.90 3.30 2 PY NVIDIA Tesla
K20 1 1541 1156 1592 1181
Xeon E5-2690 8 2.90 3.30 2 PY NVIDIA Tesla
K20 2 2711 1991 2762 2028
Xeon E5-2690 8 2.90 3.30 2 PY NVIDIA Tesla
K20X 1 1681 1202 1732 1223
Xeon E5-2690 8 2.90 3.30 2 PY NVIDIA Tesla
K20X 2 2991 2143 3042 2180
349
1181
1223
2028
2180
0 500 1000 1500 2000
2 × Xeon E5-2690
2 × Xeon E5-26901 × PY NVIDIA Tesla K20
2 × Xeon E5-26901 × PY NVIDIA Tesla K20X
2 × Xeon E5-26902 × PY NVIDIA Tesla K20
2 × Xeon E5-26902 × PY NVIDIA Tesla K20X
GFlops
LINPACK: PRIMERGY RX350 S7

WHITE PAPER PERFORMANCE REPORT PRIMERGY RX350 S7 VERSION: 1.4 2013-05-08
© Fujitsu Technology Solutions 2012-2013 Page 51 (54)
Measurements with 2 × Xeon E5-2690 and up to 2 × Intel Xeon Phi Co-Processor 5110P
Theoretical maximum performance of a single coprocessor according to the data sheet:
Intel Xeon Phi Co-Processor 5110P: 1011 GFlops
During runtime the computer load was distributed over the system processors and the coprocessors by the benchmark. The LINPACK result is this made up of the sum of the performance values of the system processors and the coprocessors.
Pro
ce
ss
or
Co
res
Pro
ce
ss
or
freq
ue
nc
y [
Gh
z]
Ma
xim
um
tu
rbo
fre
qu
en
cy
at
full
lo
ad
[G
hz]
Nu
mb
er
of
pro
ce
sso
rs
GP
GP
U/C
op
roc
es
so
r
Nu
mb
er
of
GP
GP
Us
/Co
pro
ce
ss
ors
Without Turbo Mode With Turbo Mode
Rpeak [GFlops]
Rmax [GFlops]
Rpeak [GFlops]
Rmax [GFlops]
Xeon E5-2690 8 2.90 3.30 2 371 350 422 363
Xeon E5-2690 8 2.90 3.30 2 Intel Xeon Phi Co-Processor
5110P 1 1382 1116 1433 1126
Xeon E5-2690 8 2.90 3.30 2 Intel Xeon Phi Co-Processor
5110P 2 2393 1849 2444 1873
363
1126
1873
0 500 1000 1500 2000
2 × Xeon E5-2690
2 × Xeon E5-26901 × Intel Xeon Phi Co-Processor 5110P
2 × Xeon E5-26902 × Intel Xeon Phi Co-Processor 5110P
GFlops
LINPACK: PRIMERGY RX350 S7

WHITE PAPER PERFORMANCE REPORT PRIMERGY RX350 S7 VERSION: 1.4 2013-05-08
Page 52 (54) © Fujitsu Technology Solutions 2012-2013
System comparison
The following diagram illustrates the throughput of the PRIMERGY RX350 S7 in comparison to its predecessor, the PRIMERGY TX300 S6, in their most performant configuration.
0
500
1000
1500
2000
PRIMERGY TX300 S62 × Xeon X5690
PRIMERGY RX350 S72 × Xeon E5-2690
160
363
1223
2180
GFlops
w/o GPU
+1 GPU
+2 GPUs
+1263%
+664%
+127%
LINPACK: PRIMERGY RX350 S7 vs. PRIMERGY TX300 S6
WHITE PAPER PERFORMANCE REPORT PRIMERGY RX350 S7 VERSION: 1.4 2013-05-08
© Fujitsu Technology Solutions 2012-2013 Page 53 (54)
Literature
PRIMERGY Systems
http://primergy.com/
PRIMERGY RX350 S7
Data sheet http://docs.ts.fujitsu.com/dl.aspx?id=eeb55450-bd39-4f46-8299-76cac3f48e7c
Memory performance of Xeon E5-2600/4600 (Sandy Bridge-EP)-based systems http://docs.ts.fujitsu.com/dl.aspx?id=a17dbb55-c43f-4ac8-886a-7950cb27ec2a
PRIMERGY Performance
http://www.fujitsu.com/fts/products/computing/servers/primergy/benchmarks/
Disk I/O
Basics of Disk I/O Performance http://docs.ts.fujitsu.com/dl.aspx?id=65781a00-556f-4a98-90a7-7022feacc602
Single Disk Performance http://docs.ts.fujitsu.com/dl.aspx?id=0e30cb69-44db-4cd5-92a7-d38bacec6a99
RAID Controller Performance http://docs.ts.fujitsu.com/dl.aspx?id=e2489893-cab7-44f6-bff2-7aeea97c5aef
Information about Iometer http://www.iometer.org
LINPACK
The LINPACK Benchmark: Past, Present, and Future http://www.netlib.org/utk/people/JackDongarra/PAPERS/hplpaper.pdf
TOP500 http://www.top500.org/
HPL - A Portable Implementation of the High-Performance Linpack Benchmark for Distributed-Memory Computers http://www.netlib.org/benchmark/hpl
Intel Math Kernel Library – LINPACK Download http://software.intel.com/en-us/articles/intel-math-kernel-library-linpack-download/
OLTP-2
Benchmark Overview OLTP-2 http://docs.ts.fujitsu.com/dl.aspx?id=e6f7a4c9-aff6-4598-b199-836053214d3f
SPECcpu2006
http://www.spec.org/osg/cpu2006
Benchmark overview SPECcpu2006 http://docs.ts.fujitsu.com/dl.aspx?id=1a427c16-12bf-41b0-9ca3-4cc360ef14ce
SPECjbb2005
http://www.spec.org/jbb2005
Benchmark overview SPECjbb2005 http://docs.ts.fujitsu.com/dl.aspx?id=5411e8f9-8c56-4ee9-9b3b-98981ab3e820
SPECpower_ssj2008
http://www.spec.org/power_ssj2008
Benchmark Overview SPECpower_ssj2008 http://docs.ts.fujitsu.com/dl.aspx?id=166f8497-4bf0-4190-91a1-884b90850ee0
STREAM
http://www.cs.virginia.edu/stream/

WHITE PAPER PERFORMANCE REPORT PRIMERGY RX350 S7 VERSION: 1.4 2013-05-08
Page 54 (54) © Fujitsu Technology Solutions 2012-2013
VMmark V2
Benchmark Overview VMmark V2 http://docs.ts.fujitsu.com/dl.aspx?id=2b61a08f-52f4-4067-bbbf-dc0b58bee1bd
VMmark V2 http://www.vmmark.com
VMmark V2 Results http://www.vmware.com/a/vmmark/
vServCon
Benchmark Overview vServCon http://docs.ts.fujitsu.com/dl.aspx?id=b953d1f3-6f98-4b93-95f5-8c8ba3db4e59
Contact
FUJITSU
Website: http://www.fujitsu.com/
PRIMERGY Product Marketing
mailto:[email protected]
PRIMERGY Performance and Benchmarks
mailto:[email protected]
All rights reserved, including intellectual property rights. Technical data subject to modifications and delivery subject to availability. Any liability that the data and illustrations are complete, actual or correct is excluded. Designations may be trademarks and/or copyrights of the respective manufacturer, the use of which by third parties for their own purposes may infringe the rights of such owner. For further information see http://www.fujitsu.com/fts/resources/navigation/terms-of-use.html
2013-05-08 WW EN Copyright © Fujitsu Technology Solutions 2012-2013