Embed Size (px)
Citation preview
Frank D Lanterman Regional Center Melinda Sullivan Director
REGIONAL CENTER FRANK D LANTERMAN 3303 Wilshire Boulevard Suite 700 Los Angeles CA 90010 Phone (213) 383-1300 Fax (213) 383-6526 E-mail kyrclantermanorg wwwlantermanorg
Spring 2015
Performance Report for Frank D Lanterman Regional Center
Every year the Department of Developmental Services (DDS) contracts with regional centers in California to serve consumers and families And every year DDS looks at how well the regional centers are doing This report will give you information about our regional center
Last year at Frank D Lanterman Regional Center (FDLRC) we served about 8800 consumers The charts on page 2 tell you about the consumers we serve Youll also see how well we are doing in meeting our goals and in fulfilling our contract with DDS
At FDLRC we want to improve every year do better than the state average and meet or exceed the DDS standard As you can see in this report weve reduced the number of people living in a developmental center mostly due to our efforts to help 23 individuals move out of Lanterman Developmental Center before it closed in December 2014
We continue to support children in their family home and have no children living in a large facility We continue to help adults live in small home-like settings either in their own apartment or in a licensed home that serves less than 6 people
We hope this report helps you learn more about FDLRC If you have any questions or comments please contact us
This report is a summary To see the complete report go to wwwlantermanorg
Or contact Lanterman Regional Center at (213) 383-1300
-17-MnetV a~~ Director Frank D Lanterman Regional Center
Summary Performance Report for Frank D Lanterman Regional Center Spring 2015 1
Who uses FDLRC These charts tell you about who FDLRC consumers are and where they live
WHERE FOLRC CONSUMERS LIVE PRIMARY DIAGNOSIS OF FOLRC CONSUMERS
Epilepsy I 11487Family
Foster Home ILSSLS Agency SevereProfound I
ln1ellectual Disability 110514 other 1
CCFICF 1 MildModerate Intellectual I
Disability 138 06
ParenV Guardian Autism I 14713
84
Cerebral Palsy I 11149
AGE OF FDLRC CONSUMERS ETHNICITY OF FDLRC CONSUMERS
52+ yrs 0-2 yrs Asian African8 White15 8 American22-51 yrs 28 626 3-5 yrs
11 oo
Hispanic 456-21 yrs
40
How well is FDLRC performing This chart tells you about 5 areas where DDS wants each regional center to keep improving
The first column tells you how FDLRC was doing at the beginning of 2014 And the second column shows how FDLRC was doing at the end of 2014
To see how FDLRC compares to the other regional centers in the state compare the numbers to the state averages (in the shaded columns)
Regional Center Goals December 2013 December 2014
(based on Lanterman Act) State Average
FDLRC State
Average FDLRC
Less consumers live in developmental centers 051 038 042 021
More children live with families 9898 9972 9904 9965
More adults live in home settings 7649 74 64 7730 7550
Less children live in large facilities (more than 6 people) 007 002 007 0
Less adults live in large facilities (more than 6 people) 312 902 296 829
Home settings include independent living supported living Adult Family Home Agency homes and consumers family homes
Summary Performance Report for Frank D Lanterman Regional Center Spring 2015 2
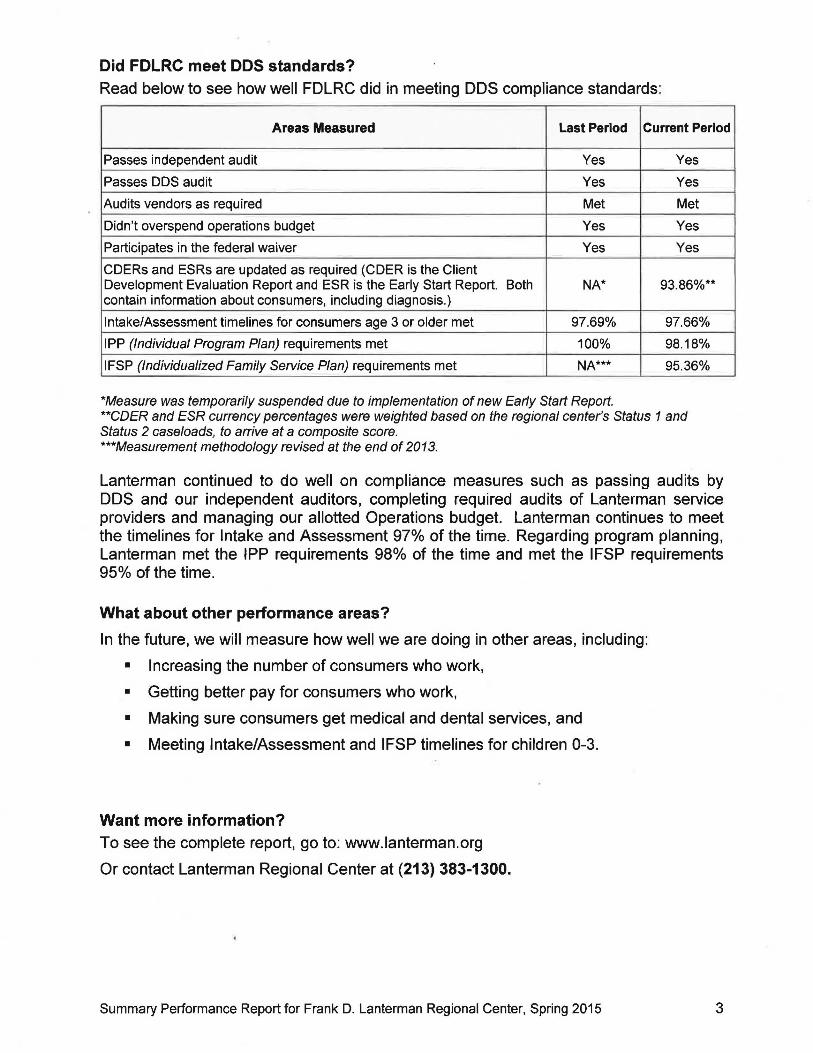
Did FDLRC meet DDS standards Read below to see how well FDLRC did in meeting DDS compliance standards
Areas Measured Last Period Current Period
Passes independent audit Yes Yes
Passes DDS audit Yes Yes
Audits vendors as required Met Met
Didnt overspend operations budget Yes Yes
Participates in the federal waiver Yes Yes
CDERs and ESRs are updated as required (COER is the Client Development Evaluation Report and ESR is the Early Start Report Both contain information about consumers including diagnosis)
NA 9386
IntakeAssessment timelines for consumers age 3 or older met 97 69 9766
IPP (Individual Program Plan) requirements met 100 9818
IFSP (Individualized Family Service Plan) requirements met NA 9536
Measure was temporarily suspended due to implementation of new Early Start Report COER and ESR currency percentages were weighted based on the regional centers Status 1 and Status 2 caseloads to arrive at a composite score Measurement methodology revised at the end of 2013
Lanterman continued to do well on compliance measures such as passing audits by DDS and our independent auditors completing required audits of Lanterman service providers and managing our allotted Operations budget Lanterman continues to meet the timelines for Intake and Assessment 97 of the time Regarding program planning Lanterman met the IPP requirements 98 of the time and met the IFSP requirements 95 ofthe time
What about other performance areas
In the future we will measure how well we are doing in other areas including
bull Increasing the number of consumers who work
bull Getting better pay for consumers who work
bull Making sure consumers get medical and dental services and
bull Meeting IntakeAssessment and IFSP timelines for children 0-3
Want more information To see the complete report go to wwwlantermanorg
Or contact Lanterman Regional Center at (213) 383-1300
Summary Performance Report for Frank D Lanterman Regional Center Spring 2015 3

Who uses FDLRC These charts tell you about who FDLRC consumers are and where they live
WHERE FOLRC CONSUMERS LIVE PRIMARY DIAGNOSIS OF FOLRC CONSUMERS
Epilepsy I 11487Family
Foster Home ILSSLS Agency SevereProfound I
ln1ellectual Disability 110514 other 1
CCFICF 1 MildModerate Intellectual I
Disability 138 06
ParenV Guardian Autism I 14713
84
Cerebral Palsy I 11149
AGE OF FDLRC CONSUMERS ETHNICITY OF FDLRC CONSUMERS
52+ yrs 0-2 yrs Asian African8 White15 8 American22-51 yrs 28 626 3-5 yrs
11 oo
Hispanic 456-21 yrs
40
How well is FDLRC performing This chart tells you about 5 areas where DDS wants each regional center to keep improving
The first column tells you how FDLRC was doing at the beginning of 2014 And the second column shows how FDLRC was doing at the end of 2014
To see how FDLRC compares to the other regional centers in the state compare the numbers to the state averages (in the shaded columns)
Regional Center Goals December 2013 December 2014
(based on Lanterman Act) State Average
FDLRC State
Average FDLRC
Less consumers live in developmental centers 051 038 042 021
More children live with families 9898 9972 9904 9965
More adults live in home settings 7649 74 64 7730 7550
Less children live in large facilities (more than 6 people) 007 002 007 0
Less adults live in large facilities (more than 6 people) 312 902 296 829
Home settings include independent living supported living Adult Family Home Agency homes and consumers family homes
Summary Performance Report for Frank D Lanterman Regional Center Spring 2015 2
Did FDLRC meet DDS standards Read below to see how well FDLRC did in meeting DDS compliance standards
Areas Measured Last Period Current Period
Passes independent audit Yes Yes
Passes DDS audit Yes Yes
Audits vendors as required Met Met
Didnt overspend operations budget Yes Yes
Participates in the federal waiver Yes Yes
CDERs and ESRs are updated as required (COER is the Client Development Evaluation Report and ESR is the Early Start Report Both contain information about consumers including diagnosis)
NA 9386
IntakeAssessment timelines for consumers age 3 or older met 97 69 9766
IPP (Individual Program Plan) requirements met 100 9818
IFSP (Individualized Family Service Plan) requirements met NA 9536
Measure was temporarily suspended due to implementation of new Early Start Report COER and ESR currency percentages were weighted based on the regional centers Status 1 and Status 2 caseloads to arrive at a composite score Measurement methodology revised at the end of 2013
Lanterman continued to do well on compliance measures such as passing audits by DDS and our independent auditors completing required audits of Lanterman service providers and managing our allotted Operations budget Lanterman continues to meet the timelines for Intake and Assessment 97 of the time Regarding program planning Lanterman met the IPP requirements 98 of the time and met the IFSP requirements 95 ofthe time
What about other performance areas
In the future we will measure how well we are doing in other areas including
bull Increasing the number of consumers who work
bull Getting better pay for consumers who work
bull Making sure consumers get medical and dental services and
bull Meeting IntakeAssessment and IFSP timelines for children 0-3
Want more information To see the complete report go to wwwlantermanorg
Or contact Lanterman Regional Center at (213) 383-1300
Summary Performance Report for Frank D Lanterman Regional Center Spring 2015 3