Embed Size (px)
Citation preview

Performance Rating of De-icing Chemicals for Winter Operations
Nebraska Department of Roads
Project No. SPR-P1(10) P328
August 2011

i
Performance Rating of De-icing
Chemicals for Winter Operations
NDOR Project Number: SPR-P1(10) P328
Project Duration: July 1, 2009 – June 30, 2011
Principal Investigator
Christopher Y. Tuan, Ph.D., P.E. Professor of Civil Engineering
University of Nebraska-Lincoln 1110 South 67th Street
Omaha, Nebraska 68182-0178 Telephone: (402) 554-3867, Fax: (402) 554-3288
E-Mail: [email protected]
Graduate Research Assistant
Barbara M. Gerbino-Bevins, M.S. University of Nebraska-Lincoln
Department of Civil Engineering 1110 South 67th Street
Omaha, Nebraska 68182-0178
August 2011

ii
Technical Report Documentation Page 1. Report No
SPR-P1(10) P328
2. Government Accession No. 3. Recipient’s Catalog No.
4. Title and Subtitle
Performance Rating of De-icing Chemicals for Winter Operations
5. Report Date
August 19, 2011 6. Performing Organization Code
7. Author/s
Gerbino-Bevins, B.M., and Tuan, C.Y. 8. Performing Organization Report No.
9. Performing Organization Name and Address
University of Nebraska- Lincoln, Department of Civil Engineering, Peter Kiewit Institute, 1110 South 67th Street,
10. Work Unit No. (TRAIS)
Omaha, NE 68182-0178 11. Contract or Grant No.
26-1120-0054-001 12. Sponsoring Organization Name and Address
Nebraska Department of Roads, Materials & Research
Division, P. O. Box 94759, Lincoln, NE 68509-4759
13. Type of Report and Period Covered
Final Report
15. Supplementary Notes 14. Sponsoring Agency Code
16. Abstract The cost of deicing chemicals is a significant part of the Nebraska Department of Road’s winter maintenance budget. Many products are available for use in highway and bridge deicing and new products are introduced each year. The objectives of this research are to develop a laboratory test to evaluate the performance of chemical deicers, to investigate national, state, and local standards, and to develop best maintenance practices to optimize the use of chemical deicers.
Samples of sodium chloride, magnesium chloride, calcium chloride, potassium acetate, and beet juice based chemical deicers were selected for evaluation. The deicers were tested for ice melting performance, resulting pavement friction, the effect from direct sunlight, and the time to refreeze after application. Correlations between the laboratory test results with field data during winter storms were studied.
The field data was collected by the Nebraska Department of Roads using Automatic Vehicle Location (AVL) systems installed on plow trucks in concert with the Maintenance Decision Support System (MDSS). The MDSS is a computerized system that collects weather data from area weather stations and gives maintenance crews recommended application rates for different weather events.
The Shaker Test was developed to evaluate the ice melting capacities of chemical deicers. The test works well for assessing the ice melting capacities of liquid and solid deicers, but more research is needed for prewet solids. The beet juice based deicers were found to perform well at temperatures as low as 14°F when exposed to direct sunlight. A summary was compiled to outline the recommended standards of practice for anti-icing and de-icing operations using the selected deicing chemicals for particular types of winter storms. 17. Key Words
Winter Maintenance, Deicing Chemicals, Ice Melting Capacities, Friction Tests, Refreeze Time, Field Data, Automatic Vehicle Locator (AVL), Maintenance Decision Support System (MDSS) 19. Security Classification (of this report)
Unclassified
18. Distribution Statement
This document is available to the general public via Nebraska Department of Roads.
21. No. of Pages 129
22. Price
Form DOT F 1700.7 (8-72) Reproduction of form and completed page is authorized

iii
DISCLAIMER
The contents of this report merely reflect the views of the author, who is responsible
for the facts and the accuracy of the data presented herein. The contents do not necessarily
reflect the official views or policies of the Nebraska Department of Roads, nor of the
University of Nebraska-Lincoln. This report does not constitute a standard, specification or
regulation. Trade or manufacturers’ names, which may appear in this report, are cited only
because they are considered essential to the completeness of the report. The United States
government and the State of Nebraska do not endorse products or manufacturers.

iv
ACKNOWLEDGEMENTS
This project was sponsored by the Materials & Research Division of Nebraska
Department of Roads (NDOR), and the Mid-America Transportation Center (MATC) of the
University of Nebraska-Lincoln. The authors wish to thank Matt Beran, Jasmine Dondlinger,
Jodi Gibson, Lieska Halsey, Wally Heyen, Mike Mattison, Dalyce Ronnau, and Amy Starr of
the NDOR and Gary Story of the City of Kearny for their collaborations and feedback. The
authors also wish to thank Ray Branstiter, Dale Butler, Kelly Doyle, Chris Ford, Allen
Horak, Roger Kalkwarf, and Roger Klasna of NDOR and Scott McIntyre of Omaha Public
Works for providing their common practices of using deicing chemicals for winter roadway
maintenance.

v
Table of Contents
TECHNICAL REPORT DOCUMENTATION........................................................................ii
DISCLAIMER..........................................................................................................................iii
ACKNOWLEDGEMENTS..................................................................................................... iv
TABLE OF CONTENTS......................................................................................................... v
LIST OF FIGURES................................................................................................................. x
LIST OF TABLES................................................................................................................. xiv
CHAPTER 1: INTRODUCTION.......................................................................................... 1
1.1 Background Information......................................................................................... 1
1.2 Research Objectives................................................................................................ 1
1.3 Organization of the Report...................................................................................... 3
CHAPTER 2: LITERATURE REVIEW............................................................................. 4
2.1 Laboratory Tests..................................................................................................... 4
2.1.1 Ice Melting Capacity................................................................................ 5
2.1.2 Ice Penetration......................................................................................... 6
2.1.3 Ice Debonding.......................................................................................... 8
2.1.4 Thermal Properties................................................................................. 10
2.1.5 Resulting Surface Friction Coefficient.................................................. 12
2.1.6 Viscosity and Specific Gravity.............................................................. 16
2.2 Standards of Practice............................................................................................ 17

vi
2.2.1 Solid Deicers.......................................................................................... 17
2.2.2 Liquid Deicers........................................................................................ 18
2.2.3 Prewet Solid Deicers.............................................................................. 20
2.2.4 Abrasives................................................................................................ 21
2.2.5 Application Rates................................................................................... 22
CHAPTER 3: DEICING CHEMICALS PERFORMANCE TESTS.............................. 26
3.1 SHRP Ice Melting Capacity Test.......................................................................... 27
3.1.1 Equipment.............................................................................................. 28
3.1.2 Procedure............................................................................................... 29
3.1.2.1 Preparation of Test Samples................................................... 29
3.1.2.2 Testing Procedure................................................................... 30
3.1.3 Data Processing...................................................................................... 31
3.2 Shaker Test............................................................................................................ 32
3.2.1 Equipment.............................................................................................. 33
3.2.2 Procedure............................................................................................... 35
3.2.3 Data Processing...................................................................................... 37
3.3 Friction Test.......................................................................................................... 38
3.3.1 Equipment.............................................................................................. 40
3.3.2 Procedure............................................................................................... 42
3.3.2.1 Preparation of the Steel Angle................................................ 42
3.3.2.2 Preparation of the Concrete Slab............................................ 43

vii
3.3.2.3 Testing Procedure................................................................... 44
3.3.3 Data Processing...................................................................................... 46
3.4 Sunlight Test......................................................................................................... 47
3.4.1 Equipment.............................................................................................. 47
3.4.2 Procedure............................................................................................... 48
3.4.2.1 Sample Preparation................................................................. 48
3.4.2.2 Testing Procedure................................................................... 49
3.4.3 Data Processing...................................................................................... 50
3.5 Refreeze Test........................................................................................................ 51
3.5.1 Equipment.............................................................................................. 52
3.5.2 Procedure............................................................................................... 53
3.5.3 Data Processing...................................................................................... 54
CHAPTER 4: TEST RESULTS AND EVALUATION.................................................... 55
4.1 SHRP Ice Melting Capacity Test.......................................................................... 55
4.1.1 Test Results............................................................................................ 55
4.1.2 Sources of Error..................................................................................... 60
4.1.3 Test Evaluation...................................................................................... 62
4.2 Shaker Test............................................................................................................ 67
4.2.1 Test Results............................................................................................ 68
4.2.1.1 Liquid Test Results................................................................. 68
4.2.1.2 Solid Test Results................................................................... 72

viii
4.2.1.3 Prewet Road Salt Test Results................................................ 74
4.2.1.4 Beet Juice Results................................................................... 77
4.2.2 Sources of Error..................................................................................... 78
4.2.3 Test Evaluation...................................................................................... 79
4.3 Friction Test.......................................................................................................... 81
4.3.1 Test Results............................................................................................ 82
4.3.2 Sources of Error..................................................................................... 83
4.3.3 Test Evaluation...................................................................................... 83
4.4 Sunlight Test......................................................................................................... 84
4.5 Refreeze Test........................................................................................................ 85
4.5.1 Test Results............................................................................................ 85
4.5.1.1 Liquid Test Results................................................................. 85
4.5.1.2 Solid Test Results................................................................... 88
4.5.2 Sources of Error..................................................................................... 90
4.5.3 Test Evaluation...................................................................................... 90
CHAPTER 5: FIELD DATA RESULTS AND CORRELATION................................... 91
CHAPTER 6: CONCLUSIONS AND RECOMMENDATIONS................................... 106
6.1 Sodium Chloride................................................................................................. 106
6.2 Magnesium Chloride........................................................................................... 107
6.3 Calcium Chloride................................................................................................ 108
6.4 Potassium Acetate............................................................................................... 109

ix
6.5 Calcium-Magnesium Acetate.............................................................................. 110
6.6 Carbohydrate or “Beet Juice” Solutions............................................................. 111
6.7 Solid Chemical Deicers....................................................................................... 114
6.8 Standards of Practice........................................................................................... 115
6.8.1 Solid Deicers........................................................................................ 117
6.8.2 Liquid Deicers...................................................................................... 117
6.8.3 Prewet Solid Deicers............................................................................ 118
6.8.4 Abrasives.............................................................................................. 118
6.8.5 Other Observations.............................................................................. 119
6.9 Evaluation of Performance Tests........................................................................ 119
REFERENCES................................................................................................................... 121
APPENDIX A: REFREEZE TEST RESULTS................................................................ 125

x
List of Figures
FIGURE 2.1: Ice Melting Capacity Dish................................................................................. 5
FIGURE 2.2: Ice Penetration Test Apparatus (Nixon et al., 2007).......................................... 6
FIGURE 2.3: Ice Debonding Test Results (Shi et al., 2009).................................................... 9
FIGURE 2.4: Heating-Cycle Thermogram Example (Shi et al., 2009).................................. 11
FIGURE 2.5: British Pendulum Tester................................................................................... 13
FIGURE 2.6: Results for SAAB Friction Tester (Alger et al., 1994)..................................... 14
FIGURE 2.7: A Tribometer.................................................................................................... 15
FIGURE 2.8: Friction Test Results (Shi et al., 2009)............................................................. 16
FIGURE 2.9: Sand Prewet with Hot Water on a Roadway (Transportation Research Circular,
2004)....................................................................................................................................... 22
FIGURE 3.1: SHRP Ice Melting Capacity Test Setup inside Freezer.................................... 29
FIGURE 3.2: Collecting Brine............................................................................................... 31
FIGURE 3.3: Martini Shaker with Insulation......................................................................... 33
FIGURE 3.4: Thermocouple Wire.......................................................................................... 34
FIGURE 3.5: Shaking Angle.................................................................................................. 36
FIGURE 3.6: Remaining Ice in Strainer Section of Lid......................................................... 37
FIGURE 3.7: Details of Liquid Pooling Issue........................................................................ 40
FIGURE 3.8: Rubber Contact Points...................................................................................... 41
FIGURE 3.9: Equipment and Setup to Drag Sled.................................................................. 42

xi
FIGURE 3.10: Applying Acrylic Sealant on Concrete Slab................................................... 43
FIGURE 3.11: Making Ice Layer........................................................................................... 44
FIGURE 3.12: Friction Test Setup......................................................................................... 45
FIGURE 3.13: Sunlight Test Surface..................................................................................... 48
FIGURE 3.14: Sunlight Test Sample Preparation.................................................................. 49
FIGURE 3.15: Deicing Samples in Shaded and Sunlit Areas................................................ 50
FIGURE 3.16: Refreeze Test Liquid Measurement............................................................... 53
FIGURE 4.1: SHRP Ice Melting Capacity Test Results at 0°F for 60 Minutes..................... 56
FIGURE 4.2: SHRP Ice Melting Capacity Test Results at 10°F for 60 Minutes................... 56
FIGURE 4.3: SHRP Ice Melting Capacity Test Rates at 0°F for 100% of Indicated
Deicer...................................................................................................................................... 57
FIGURE 4.4: SHRP Ice Melting Capacity Test Rates at 0°F for 50/50 Mixes of Indicated
Deicer and Sodium Chloride................................................................................................... 57
FIGURE 4.5: SHRP Ice Melting Capacity Test Rates at 0°F for 40/60 Mixes of Indicated
Deicer and Sodium Chloride................................................................................................... 58
FIGURE 4.6: SHRP Ice Melting Capacity Test Rates at 0°F for 25/75 Mixes of Indicated
Deicer and Sodium Chloride................................................................................................... 58
FIGURE 4.7: SHRP Ice Melting Capacity Test Rates at 10°F for 50/50 Mixes of Indicated
Deicer and Sodium Chloride................................................................................................... 58
FIGURE 4.8: SHRP Ice Melting Capacity Test Rates at 10°F for 25/75 Mixes of Indicated
Deicer and Sodium Chloride................................................................................................... 59
FIGURE 4.9: SHRP Ice Melting Capacity Test Rates at 20°F for 50/50 Mixes of Indicated
Deicer and Sodium Chloride................................................................................................... 59
xii
FIGURE 4.10: (Left) Clear Deicers in Separate Syringes, (Middle) Precipitate Formed After
Mixing Deicers, (Right) Settled Precipitate............................................................................ 61
FIGURE 4.11: SHRP Ice Melting Capacity Test Results (Alger and Haase, 2006).............. 62
FIGURE 4.12: Modified SHRP Ice Melting Capacity 60-Minute Test Results at 15°F
(Akin and Shi, 2010)............................................................................................................... 64
FIGURE 4.13: Modified SHRP Ice Melting Capacity 60-Minute Test Results at 30°F
(Akin and Shi, 2010)............................................................................................................... 64
FIGURE 4.14: Modified SHRP Ice Melting Capacity Test Results at 60 Minutes
(Shi et al., 2009)...................................................................................................................... 65
FIGURE 4.15: SHRP Ice Melting Capacity Test Results at 60 Minutes (Nixon et al.,
2007)....................................................................................................................................... 66
FIGURE 4.16: Temperature Change inside the Shaker during the Shaker Test.................... 68
FIGURE 4.17: Shaker Test Liquid Results at 20°F................................................................ 69
FIGURE 4.18: Shaker Test Liquid Results at 10°F................................................................ 70
FIGURE 4.19: Shaker Test Liquid Results at 0°F.................................................................. 70
FIGURE 4.20: Shaker Test Solid Results............................................................................... 73
FIGURE 4.21: Shaker Test Results for Prewet Road Salt at 10°F......................................... 75
FIGURE 4.22: Shaker Test Results for Prewet Road Salt at 0°F........................................... 75
FIGURE 4.23: Potassium Acetate Reacted with Road Salt.................................................... 76
FIGURE 4.24: Shaker Test Results for Beet Juice Mixes at 20°F......................................... 78
FIGURE 4.25: Repeatability of Shaker Test using Liquid Deicers........................................ 80
FIGURE 4.26: Friction Force vs. Time.................................................................................. 81

xiii
FIGURE 4.27: Sunlight Test Results...................................................................................... 84
FIGURE 4.28: Refreeze Test Results for Agricultural Byproduct or “Beet Juice”
Deicers.................................................................................................................................... 86
FIGURE 4.29: Refreeze Test Results for Magnesium Chloride Deicers............................... 87
FIGURE 4.30: Refreeze Test Results for Calcium Chloride Deicer...................................... 88
FIGURE 4.31: Refreeze Test Results for Solid Deicers......................................................... 89
FIGURE 6.1: Sunlight Test Results...................................................................................... 113

xiv
List of Tables
TABLE 2.1: Comparison of Ice Penetration (mm) at 60 Minutes............................................ 7
TABLE 2.2: Method for Estimating Application Rates (Peterson et al., 2010)..................... 24
TABLE 2.3: Standard of Practice Summary........................................................................... 25
TABLE 3.1: Liquid Deicers used in SHRP Ice Melting Capacity Test.................................. 28
TABLE 3.2: Liquid Deicers used in Shaker Test................................................................... 33
TABLE 3.3: Liquid Deicers used in Friction Test.................................................................. 39
TABLE 3.4: Liquid and Solid Deicers used in Sunlight Test................................................. 47
TABLE 3.5: Chemical Deicers used in Refreeze Test........................................................... 51
TABLE 4.1: SHRP Ice Melting Capacity Test Results Comparison at 20°F (mL/g)............ 63
TABLE 4.2: Variances in Shaker Test Liquid Results (%).................................................... 72
TABLE 4.3: Variances in Shaker Test Solid Results (%)...................................................... 74
TABLE 4.4: Variances in Shaker Test Prewet Results (%).................................................... 77
TABLE 4.5: Friction Test Results.......................................................................................... 82
TABLE 4.6: Friction Results Comparison.............................................................................. 83
TABLE 5.1: Rating System for Roadway Level of Service................................................... 92
TABLE 5.2: Magnesium Chloride and Beet Juice Comparison............................................. 94
TABLE 5.3: Beet Juice Comparison...................................................................................... 96
TABLE 5.4: Road Salt Comparison: High Winds.................................................................. 96
TABLE 5.5: 10/90 Beet Juice/NaCl Mix: High Winds.......................................................... 98

xv
TABLE 5.6: Liquid Sodium Chloride Comparison at Low Temperatures........................... 100
TABLE 5.7: Liquid Sodium Chloride Comparison.............................................................. 102
TABLE 5.8: Road Salt Prewet with 5gal/ton MgCl2 Comparison....................................... 102
TABLE 5.9: A Storm producing High Volume of Snow......................................................104
TABLE 6.1: Shaker Test Results for Liquids (Grams of Ice Melted per mL of Deicer)..... 106
TABLE 6.2: Recommendations for Deicer Usage............................................................... 116

1
Chapter 1
Introduction
1.1 Background Information
The cost of deicing chemicals is a significant part of the Nebraska Department of
Road’s winter maintenance budget. The use of deicing chemicals is increasing every year to
improve a Level of Service (LOS) and the price of the chemicals is also going up every year.
The use of Maintenance Decision Support Systems (MDSS) allows users to be more precise
in the selection of chemicals and the application rate for specified weather and pavement
conditions.
Many products are available for use in highway and bridge deicing and new products
are introduced each year. Data from the manufacturer provides theoretical performance under
specified conditions. A test procedure for acceptance of new commercial deicing chemicals
is needed to confirm the manufacturers’ claims and to compare competing products under the
same controlled conditions.
1.2 Research Objectives
The purpose of this project was to gather information regarding accepted test methods
used to evaluate chemical deicer performance and to develop new test methods if necessary.
The purpose of this project was also to research and generate a best practices summary for
Nebraska Department of Roads. The results of this research will help the State of Nebraska to
use deicing chemicals more effectively.

2
This research consists of a literature review and the documentation of the
development of new testing procedures used to evaluate the performance of selected
chemical deicers. After conducting a test standardized by the Strategic Highway Research
Program, it was decided a new, simple and repeatable test needed to be developed to evaluate
the performance of chemical deicers. The performance test developed by this project has
been termed as the Shaker Test.
Other performance tests developed by this research include the Friction Test, the
Sunlight Test, and the Refreeze Test. The purpose of the Friction Test was to confirm if a
particular liquid deicer would cause roadways to become slick. The Sunlight Test was used
to determine if darker colored chemical deicers have a significant advantage over lighter
colored chemical deicers in direct sunlight. The purpose of the Refreeze Test is to determine
when a deicing product will cease to function and the mixture with melted ice begins to
refreeze on the roadway.
The field data used in this project was collected by the MDSS and plow trucks
equipped with the automated vehicle locator (AVL). The MDSS collected real-time weather
data including temperature, wind speed, and type and amount of precipitation. The field data
collected by the AVL includes real time information of the vehicle location, type and amount
of material being used per lane-mile, and pictures of the roadway conditions taken from the
cab of the truck. The main purpose of collecting field data was to document the effect
different chemical deicers had on the LOS of the roadway. The field data and observations
were then compared against the data from the ice melting capacity tests conducted in the
laboratory. Strong correlations between the field data and the laboratory test results would

3
validate the laboratory tests developed in this research. Further, the deicing performance of
the different deicers will be ranked based on both the laboratory tests and the field data. The
findings from this study can then be used to fine tune the current practices suggested by the
MDSS.
1.3 Organization of the Report
There are 6 chapters in this report: Chapter 1 contains the introduction. Chapter 2
provides a summary of the literature review. Chapter 3 details the equipment required and the
procedures for the tests conducted in this project. Chapter 4 presents the test results and an
evaluation of each test. Chapter 5 summarizes field data from selected truck routes in a
number of winter storms from the MDSS and a correlation with results from the Shaker Test
was studied. Chapter 6 presents the findings and provides recommendations for the effective
use of chemical deicers and further research needs.

4
Chapter 2
Literature Review
The objectives of the literature review were to survey accepted or standardized
performance tests for chemical deicers and to research general standards of practice for
chemical deicers. Several lab tests have been developed and published by the Strategic
Highway Research Program (SHRP) in the Handbook of Test Methods for Evaluating
Chemical Deicers (Chappelow et al., 1992). Many researchers used a number of these lab
tests in their studies, but some also utilized different tests for various properties of chemical
deicers.
2.1 Laboratory Tests
Each lab test used to quantify chemical deicer properties was evaluated to determine
its effectiveness. Many tests were found to be useful, but some produced unreliable results or
were found to be nonessential. This section will discuss some of the tests and their
effectiveness in the evaluation of chemical deicers.
Performance properties of chemical deicers include: ice melting capacity, ice
penetration, ice debonding, thermal properties, and the resulting friction coefficient of a de-
iced roadway. Other deicer properties, such as viscosity and specific gravity, are more related
to its applicability rather than performances.

5
2.1.1 Ice Melting Capacity
Two tests were found pertaining to ice melting capacity, one test for solid chemicals
and the other test for liquid chemicals. These tests are in the SHRP Handbook (Chappelow et
al., 1992). The designation for the solid chemical test is SHRP H-205.1 and the designation
for the liquid chemical test is SHRP H-205.2.
The tests have a similar procedure and require a freezer or cold-room, some
measuring equipment, and three square 11in by 11in Plexiglas dishes as seen in Figure 2.1.
Ice is formed in the dish, deicer is applied, and the resulting brine is measured at
intervals over a 60 minute period. This test can be utilized at different temperatures and will
provide the total volume of melted ice and the melting rate.
At this time, there is no set standard for what volumes of ice should be melted to
confirm an acceptable performance. This test is best used when doing a comparison with a
Figure 2.1: Ice Melting Capacity Dish

6
chemical deicer known to have acceptable field performance. The results of this test from
other research will be discussed in chapter 4.
2.1.2 Ice Penetration
Two tests were found pertaining to ice penetration, one test for solid chemicals and
the other test for liquid chemicals. These tests are also in the SHRP Handbook. The
designation for the solid chemical test is SHRP H-205.3 and the designation for the liquid
chemical test is SHRP H-205.4.
The tests have a similar procedure to the ice melting capacity tests and require a
freezer or cold-room, some measuring equipment, and a rectangular 8in by 2in Plexiglas
plate with 35mm depressions in the plate as seen in Figure 2.2.
Ice is formed in the depressions, a few drops or grains of deicer are applied, and the
resulting penetration is measured at intervals over a 60 minute period. This test can be
utilized at different temperatures and will provide the total ice penetration and the rate of
penetration.
Figure 2.2:
Ice Penetration Test Apparatus (Nixon
et al., 2007)

7
The 60-minute test results from Nixon et al. (2007), Shi et al. (2009), and Akin and Shi
(2010) are compared in Table 2.1. The results from different sources do not correlate, which
suggests that this test produces inconsistent data and appears not repeatable. It is also not
advisable to use solid deicing chemicals for this test because the grains would often become
physically wedged in the narrow depression of the test apparatus.
Table 2.1: Comparison of Ice Penetration (mm) at 60 Minutes
Deicer Nixon et al. (2007) Shi et al. (2009) Akin and Shi (2010)
Temperature 30°F 10°F 0°F 30°F 10°F 0°F 30°F 15°F
NaCl (liquid) 3.5 1 1.5 -- -- -- 9.5 1
NaCl (solid) -- -- -- 10 2.1 2 20 5.9
MgCl2 (liquid)
5.6 3.5 0 30 18 3 10 2
MgCl2 (solid) -- -- -- -- -- -- 8 3.4
CaCl2 (liquid)
4.1 3 2.5 -- -- -- 11 1.1
CaCl2 (solid) -- -- -- -- -- -- 10.5 4.2
KAc 5.4 2 1 30 15 3 -- --
This test requires further development to produce more usable results. However, the
depth at which a chemical deicer can penetrate may be of little importance. Many states do
not put liquid deicing chemicals on accumulated ice as part of their standard of practice.
Also, roadway traffic would help to fragment an ice sheet making the penetration ability of a
chemical deicer less crucial.

8
2.1.3 Ice Debonding
Two tests were found pertaining to ice debonding or undercutting, one test for solid
chemicals and the other test for liquid chemicals. These tests are also in the SHRP
Handbook. The designation for the solid chemical test is SHRP H-205.5 and the designation
for the liquid chemical test is SHRP H-205.6.
The tests have a similar procedure to the SHRP tests described above and require a
freezer or cold-room, some measuring equipment, colored dye such as bromcresol green, a
concrete substrate, a camera, and a dish or apparatus capable of molding 1/8-inch thick sheet
of ice.
Large drops of dye are placed on the ice sheet, a drop or grain of deicer is placed in
the middle of the dye, and pictures are taken at intervals over a 60 minute period. The
pictures are used to determine the debonded area. Shi et al. (2009) used Adobe Photoshop to
measure the debonded area, but other techniques could also have been used. When using
liquid deicer, a hole through the ice to the substrate is needed to prevent the deicer from
dispersing across the ice surface.
In Shi et al. (2009) and Akin and Shi (2010) this test produced unreliable and
inconsistent results. The debonded area has an irregular shape and the dye tends to disperse
on the ice surface, making the debonded area difficult to distinguish. The results from Shi et
al. (2009) are shown in Figure 2.3.

9
This test requires further development to produce more usable results. However, the
area a chemical deicer can debond an ice sheet from a substrate may be of little importance.
This test cannot be used to compare solid and liquid deicers because they function differently
in the field. And again, roadway traffic would help to fragment an ice sheet making the
debonding ability of a chemical deicer less crucial.
Several different test methods have been developed (Chappelow et al., 1992; Cuelho
et al., 2010) to measure the bond strength between snow and ice and the roadway surface, but
no standardized method exists. The purpose of these tests is to determine when a deicer will
break this interfacial bond at a particular temperature. The common variables for the
different test methods are temperature, type of chemical deicer, and application rate for the
chemical deicer. Snow or ice and chemical deicer is applied to a substrate and then scraped
off. The tests measure the amount of force needed to remove the snow or ice at different
temperatures and time intervals.
Figure 2.3:
Ice Debonding Test Results
(Shi et al., 2009)

10
The differences between the test methods are the type of substrate, snow compaction
methods, and scraping methods. The substrate is usually mortar, concrete, or asphalt mix, but
some tests used aluminum with different surface treatments to increase the bond strength.
Each test method uses a different technique or apparatus for scraping the surface of the
substrate, but it usually consists of some type of blade that imitates a plow. The force needed
for scraping was recorded by load cells.
Similar to the SHRP ice debonding tests, data obtained from these tests had very large
scatter due to irregular debonding interface. All of these test methods require a cold room and
expensive equipment for the testing. Measuring the force needed to break the interfacial
bond seems to be an inefficient way to determine when the deicing chemicals have become
effective.
2.1.4 Thermal Properties
Two tests were found pertaining to the thermal properties or, more specifically, the
eutectic points of chemical deicers. There is no test in the SHRP Handbook pertaining to
thermal properties.
The two tests have very different procedures, but both result in a heating-cycle
thermogram for the tested deicing chemical. An example is shown in Figure 2.4. The
chemicals must be in liquid form for the test. Solid chemicals are mixed with de-ionized
water to form a saturated solution.

11
The test conducted by Shi et al. (2009) uses a differential scanning calorimeter (DSC)
to create the thermograms. A sample of deicer at a chosen concentration is positioned in the
DSC and is exposed to temperatures ranging from 77 to -76°F to determine its freezing point.
The temperature at which the deicer begins to freeze is marked by a sharp peak on the
thermogram. This peak strongly correlates to the temperature at which this particular
concentration of deicer remains effective.
The test conducted by Nixon et al. (2007) uses a procedure to manually perform the
same analysis as the DSC. It requires a cold room, an ethylene glycol bath capable of
reaching -76°F, a thermistor, and some sort of stirring unit. A sample of deicer at a chosen
concentration is positioned in the bath and is exposed to temperatures ranging from the
temperature of the cold room to -76°F to determine its freezing point. The thermistor is used
Figure 2.4:
Heating‐Cycle
Thermogram Example
(Shi et al., 2009)

12
during the test to record the temperature of the sample. The presence of forming ice crystals
is determined visually and that particular temperature is recorded as the freezing point.
In Nixon et al. (2007), Shi et al. (2009), and Akin and Shi (2010) these tests produced
very reliable data and can be used to determine if a deicing solution with a known freezing
point has the correct chemical concentration. The results also show some correlation with the
ice melting capacity test results.
The equipment needed for this test is relatively expensive and can be difficult to
locate. Many existing differential scanning calorimeters cannot achieve temperatures below
the room temperature. Also, it seems much of the data from this test can be determined more
economically by using the ice melting capacity test and the specific gravity test, which will
be discussed later.
2.1.5 Resulting Surface Friction Coefficient
Four different methods have been used to determine the resulting friction coefficient
of a de-iced roadway. One of the tests has been standardized by the Pacific Northwest
Snowfighters (PNS). Another test has been standardized by the SHRP under the designation
SHRP H-205.10.
The test developed by the PNS (Specifications and Test Protocols, 2008) requires the
friction analysis to be performed on a pavement surface within a controlled humidity
chamber. The PNS is not specific as to what apparatus is used when determining the friction
coefficient, just that it be calibrated and certified prior to the analysis. The PNS has used
dragged sleds or tires for this test. A deicing chemical is applied to the pavement surface at
13
the recommended amount and the friction coefficient is measured while the humidity is
raised and lowered over a period of time.
This test, if done properly, can generate a friction coefficient that is comparative to
the “real life” friction coefficient between vehicle tires and pavement. This test may be
helpful for areas with a high relative humidity because a deicing chemical will take longer to
dry in higher humidity. But, this test does not take into account the effect of sunlight or wind
on the drying time. A controlled humidity chamber may be difficult to obtain and one may
question how significant humidity is to the friction coefficient when other important factors
are ignored.
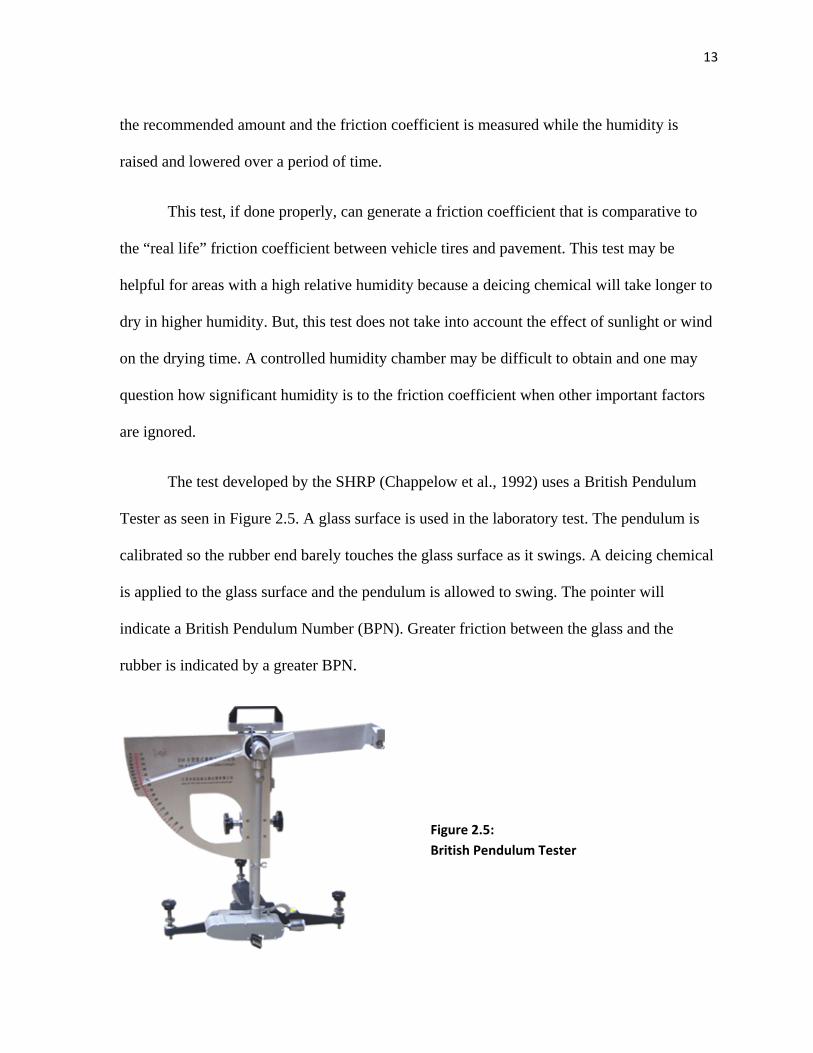
The test developed by the SHRP (Chappelow et al., 1992) uses a British Pendulum
Tester as seen in Figure 2.5. A glass surface is used in the laboratory test. The pendulum is
calibrated so the rubber end barely touches the glass surface as it swings. A deicing chemical
is applied to the glass surface and the pendulum is allowed to swing. The pointer will
indicate a British Pendulum Number (BPN). Greater friction between the glass and the
rubber is indicated by a greater BPN.
Figure 2.5:
British Pendulum Tester

14
This test can also be done on concrete or asphalt surfaces. The testing apparatus is
quite small and can be taken to perform testing on-site. Because this test does not yield an
actual friction coefficient, it is best used by comparing the results to a known outcome. The
findings from Lu and Steven (2006) suggest the results of this test do not correlate with the
real-world friction between a tire and the roadway. The test apparatus is expensive and rather
delicate. It would also be difficult and time consuming for a maintenance worker driving a
snowplow to stop and perform a test.
An alternative to the British Pendulum Tester for collecting real-time, on-site surface
friction data is a piece of equipment called a Friction Wheel, also known as a Mu-Meter or a
SAAB friction tester. The Friction Wheel can be attached to a snowplow or other vehicle as a
fifth wheel or removable trailer. It measures the roadway friction as the vehicle travels and
outputs the data to a read-out or computer inside the vehicle. Figure 2.6 shows the results
from SAAB friction tests by Alger et al. (1994).
Figure 2.6: Results for SAAB Friction Tester (Alger et al., 1994)

15
Collecting data in this fashion is much more workable for the maintenance workers
and can be used in concert with global positioning systems (GPS) to determine exact
locations of problem areas. This equipment can be especially useful for locating “black ice”
or other hard to see slippery areas. Although the Friction Wheel can yield invaluable
information, the current cost for this equipment is too high to justify in a state budget.
However, the costs of systems such as GPS and mixing tanks have been declining over the
recent years. This may also be true for the Friction Wheel and other similar systems.
A tribometer was used by Shi et al. (2009) to test the resulting surface friction
coefficient. The test apparatus is shown in Figure 2.7.
A tribometer is a piece of laboratory equipment used to test friction or surface wear
between two surfaces. Very often a single tribometer is designed to test specific surfaces. The
test surfaces were rubber and ice frozen on a small concrete sample. A liquid deicer was
applied to the ice surface and then the tribometer ran 100 cycles over 200 seconds.
Figure 2.7: A Tribometer

16
The results from Shi et al. (2009) are shown in Figure 2.8. Shi et al. (2009) stated that
the test was in need of modification. The results showed no clear differences between liquids,
fragmented solids, or chemical bases. The test equipment is expensive and requires very
specific surfaces to test. Since this apparatus was only designed for rubber and ice surfaces, it
may not be useful for other surfaces.
2.1.6 Viscosity and Specific Gravity
Testing the viscosity and specific gravity of a liquid chemical deicer helps to
determine the workability of the product. Both tests are relatively inexpensive and simple to
perform. Determining the specific gravity of a liquid deicer with a hydrometer test is the best
way to determine that product’s quality. A deviation in specific gravity could indicate a
manufacturing error or fermentation in some products.
Figure 2.8:
Friction Test Results
(Shi et al., 2009)

17
Testing the viscosity of a liquid deicer can be done with a viscometer, a timed falling
ball, or a timed rising bubble. A high viscosity liquid could lead to problems with clogging
spray nozzles or failing pumps in the field. Any time spent unclogging or repairing
equipment is time taken away from servicing the roadways.
2.2 Standards of Practice
Standards of practice concerning chemical deicers were researched to determine
which techniques should be used under certain circumstances. Recommended application
rates were also researched to determine how much should be used for certain types and
amounts of precipitation.
Chemical deicers are typically not used when roadway temperatures are below 12°F
due to a lack of performance (BlackBurn et al., 2004; Shi et al., 2004; Ketcham et al., 1996).
Circumstances under which solid deicers, liquid deicers, prewet solids, and abrasives are best
used are discussed in this section.
2.2.1 Solid Deicers
Solid deicers have been widely used in winter maintenance operations for several
decades. In the studies by Blackburn et al. (2004) and Cuelho et al. (2010) solid deicers work
the best for penetrating thick accumulations of snow or ice. Blackburn et al. (2004) also
states the best time to apply solid deicers is early in a storm event. Applying at this time
allows brine to form before the ice-pavement bond can strengthen.
One critical characteristic of solid deicers is the gradation of the particles. Blackburn
et al. (2004) states finer gradations can work faster, but do not last as long as more coarse

18
gradations of deicers. The study also states finer gradations should not be used for large
amounts of precipitation because they are quickly diluted and washed away. CTC &
Associates LLC. (2009) recommends the use of coarse grained deicers for precipitation rates
greater than 0.5 inches per hour because they will not dilute as quickly.
The most significant problem with solid deicers is the amount of chlorides and
acetates needed to achieve the desired level of service. The residue from the deicers damages
the roadway infrastructure and has a negative impact on the environment. As a result of the
cumulative effect of chlorides being released into the environment, some bodies of surface
water and groundwater have become undrinkable (Canada, Parks and Outdoor Recreation,
2010).
2.2.2 Liquid Deicers
Liquid deicers are used in winter maintenance operations because smaller amounts of
chlorides or acetates can be used to achieve the desired level of service (Peterson et al.,
2010). Blackburn et al. (2004) and Peterson et al. (2010) state liquid deicers work very well
in temperatures above 28°F, but have a high potential to refreeze in temperatures below
20°F. They recommend that the area be retreated every 1-1/2 hours to prevent refreezing, if
liquids are used in lower temperatures. Blackburn et al., (2004) also state that liquids are not
readily able to penetrate ice or compacted snow layers. Liquids work well for treating the
thin layers of snow or ice that remain after plowing (Alger et al., 1994).
Anti-icing is a relatively new technique that agencies have begun to use over the past
10 years. Anti-icing is a proactive deicing technique used to prevent the ice-pavement bond

19
from forming. Liquids are the best choice for anti-icing operations (Alger et al., 1994). A
liquid deicer is placed on the roadway 24 hours before a storm. The liquids evaporate leaving
a stratum of crystallized chlorides or acetates on the roadway. The most significant obstacles
for the use of anti-icing are the up-front costs of new equipment, training, and reliable
weather forecasts. A survey done by Shi et al. (2005) found the anti-icing practice can lead to
significant long-term savings.
Cuelho et al. (2010) estimate that 5 times the amount of energy is needed to break the
ice-pavement bond when anti-icing is not used. Shi et al. (2005) state that anti-icing can lead
to less use of abrasives and the Colorado, Kansas, Oregon, and Washington Departments of
Transportation reported significant savings in material and labor when using the anti-icing
technique.
The best time to perform anti-icing operations recommended by Blackburn et al.
(2004) and the CTC & Associates LLC. (2009) is to treat for frost and black ice, and before a
snow event in temperatures above 20°F. Lower temperatures could cause the deicer to freeze.
Anti-icing should not be used before rain or freezing rain events because the material will be
washed off from the road. Wind speeds above 15mph could also inhibit anti-icing operations
(Blackburn et al., 2004; CTC & Associates LLC., 2009; Ketcham et al., 1996).
Calcium chloride and magnesium chloride are both hydroscopic materials, meaning
they absorb water from the air. Because of this trait, those materials do not require prewet for
high moisture storms, but they can cause slick roadways under certain conditions. Shi et al.
(2004) found calcium chloride and magnesium chloride residues can attract more moisture
than sodium chloride, causing slippery conditions. CTC & Associates LLC. (2009) found

20
calcium chloride and magnesium chloride can cause slick roads when used in temperatures
above 28°F and with humidity greater than 40%. Kuhl et al. (1999) found liquid magnesium
chloride can cause slick conditions if applied to snowpack greater than 1/4-inch thick.
Donahey and Burkheimer (1996) found calcium chloride can leave a roadway wet for several
days after use while sodium chloride will dry a few hours after the end of a storm.
2.2.3 Prewet Solid Deicers
Prewetting solid deicers is also a relatively new technique that agencies have begun to
use over the past 10 years. Prewet is most often used to help solid deicers adhere to the
roadway. Shi and O’Keefe (2005) found that prewet road salt had a 96% material retention
on a roadway while dry road salt had a 70% material retention. Donahey and Burkheimer
(1996) also found that after 100 vehicles passed through the roadway, 30% of prewet
material remained on the roadway while only 5% of dry material remained on the roadway.
This can result in significant material savings. Blackburn et al. (2004) state a prewet of 10-12
gallons per ton is sufficient to minimize bounce and scatter of the solids.
Roosevelt (1997) and Donahey and Burkheimer (1996) state the prewet helps the salt
go into solution faster, or work faster. Many agencies prewet the stockpile to prevent freezing
or caking of the solids. The Michigan State Department of Transportation found small
quantities of solid calcium chloride can be mixed into the stockpile to keep it from freezing
(Public Sector Consultants, 1993).
Shi et al. (2005) cautioned that prewet material is typically discouraged for use on
unpaved roadways because it may cause the roads to thaw and become unstable. Prewet is

21
not needed if snow events are preceded by rain or for use on wet snow at about 32°F
(Roosevelt, 1997). Use of prewet results in additional cleaning of the application equipment,
but the amount of cleaning can be reduced if the prewet is performed at the spinner just
before landing on the roadway.
2.2.4 Abrasives
Abrasives or sand are used at low temperatures, typically below 12°F (Shi et al., 2004
and Blackburn et al., 2004), to create traction on a roadway covered in snow or ice. Shi et al.
(2005) and Fuller (2011) discovered dry sand does not stick to the roadway and can be swept
off by as few as 50 passing vehicles. This problem can be minimized by prewetting the sand
with salt brine or by mixing in a small amount of a solid hydroscopic material like calcium
chloride. The salt brine helps the sand take root to the snow or ice on the roadway, keeping it
on the road and creating more traction (Shi and O’Keefe, 2005).
The gradation of the sand can affect the friction performance of the sand. Al-Qadi et
al. (2002) found coarse graded sands worked best at temperatures below 14°F and fine
graded sands worked best above 27°F. Sands with gradation between 0.04 and 0.08 inches
worked well at all temperatures.
Vaa (2004) found that sand prewet with water heated to a temperature of 194-203°F
helped the sand stay on the roadway after as many as 2000 passing vehicles. The sand is
prewet with hot water at the chute or spinner leaving a film of hot water on the sand. The
water has a brief melting effect and then the sand/water mix freezes to the roadways in small
lumps. Figure 2.9 shows an example of the end product of this practice.

22
The amount of water needed to achieve this kind of effect is 30% by weight of the
sand. This practice requires a sand gradation of 0.08 inches or smaller with an application
rate of 2600 pounds per lane-mile. The geographical areas that would benefit most from this
practice are places with large amounts of snowfall with steep roads, like mountain ranges.
For the most part, the State of Nebraska probably would not benefit from this practice.
2.2.5 Application Rates
A method to estimate the deicer application rate for particular situations was
developed by Blackburn et al. (2004). The method accounts for several variables including
precipitation rate, type of precipitation, traffic, cycle times, and type of deicing chemical.
This method is complicated and requires the use of 6 different tables. Defining the
precipitation rate is the most significant source of difficulty with this procedure because the
rate is defined visually as light, moderate, heavy, and unknown. The technology exists to
determine the real-time rate of precipitation. One way to improve the effectiveness of this
procedure would be to replace the light, medium, and heavy precipitation rates with actual
numbers.
Figure 2.9: Sand Prewet with Hot Water on
a Roadway (Transportation Research
Circular, 2004)

23
The Federal Highway Administration (Ketcham et al., 1996) also has
recommendations and suggestions for chemical application rates for liquids, solids, and
prewet solids. The document addresses what should be used before and after light snow
storms, light snow with periods and moderate to heavy snow, moderate to heavy snow
storms, frost or black ice, freezing rain, and sleet.
CTC & Associates LLC. (2009) compiled the standards of practice for application
rates, anti-icing, and other winter maintenance considerations from 12 different states. Most
standards of practice are the same from state to state, but differences emerge about
application rates.
Peterson et al. (2010) presents a simple estimation table, shown in Table 2.2, utilized
by the Iowa Department of Transportation. In this method, application rates are based on
temperature, cycle times, storm type, and precipitation rates. Some of the current practices
adopted by many agencies referenced in the Ketcham et al. (1996), CTC & Associates LLC.
(2009), Peterson et al. (2010), and Blackburn et al. (2004) are summarized in Table 2.3.

24
DLA = Direct Liquid Application
Table 2.2: Method for Estimating Application Rates (Peterson et al., 2010)

25
Table 2.3: Standard of Practice Summary
Temperature Range, °F
Weather/Road Conditions Above 32 32-20 20-12 Below 12
Rain Use little to no treatment unless the temperature is expected to drop. In that case pre-treat with road salt less than 100 lbs/lane-mile.
Pre-treat with road salt prewet with 8-10 gal/ton NaCl at less than 100 lbs/lane-mile.
During event, prewet is not necessary.
Not Applicable
Use abrasives prewet with 8-10 gal/ton of NaCl to help “root” the abrasives.
Using MgCl2 or CaCl2 could cause slippery conditions.
Freezing Rain Use Road Salt prewet with 8-10gal/ton NaCl.
Using MgCl2 or CaCl2 could cause slippery conditions.
If liquids must be used, retreat every 1.5-2hrs to prevent refreeze
Sleet
Ice If not preceded by any of the above, pre-treat with liquid NaCl 20-50 gal/lane-mile. Post-treat with road salt prewet with 8-10gal/ton NaCl.
Light Snow (less than 0.5 in/hr)
If not preceded by rain, freezing rain, or sleet liquid NaCl can be used for pre and post-treatment and during the event.
Use Road Salt prewet with 8-10 gal/ton. Use MgCl2 or CaCl2 if humidity is low.
If liquids must be used, patrol every 1.5-2hrs to prevent refreeze
Moderate to Heavy Snow (greater than 0.5 in/hr)
Pre-treat with liquid NaCl 20-50 gal/lane-mile. Use road salt during and after the event.
Prewet is not necessary during the event.
Compacted Snow Use Road Salt if Necessary
Use Road Salt prewet with 8-10 gal/ton NaCl
Use Road Salt prewet with 8-10 gal/ton. Use MgCl2 or CaCl2 if humidity is low.
Winds Greater than 15mph Treatment may cause blowing snow to stick to roadway. No Treatment
25

26
Chapter 3
Deicing Chemicals Performance Tests
This chapter describes the purpose and procedures of the five performance tests for
chemical deicers that were studied or developed as a result of this project. The five tests are:
SHRP Ice Melting Capacity Test (Chappelow et al., 1992), Shaker Test, Friction Test,
Sunlight Test, and Refreeze Test.
The SHRP Ice Melting Capacity Test has been used by several state departments of
transportation including the Iowa and Colorado DOTs. It has also been used in several
research studies by Nixon et al. (2007), Shi et al. (2009), and Akin and Shi (2010). It is a
frequently cited test, but its results do not necessarily correlate with what has been observed
in the field and the test is known not repeatable between laboratories. This test was
conducted in this research as a starting point.
The Shaker Test was developed by this research as a performance test for chemical
deicers. Its purpose was to determine the ice melting capacity of a deicer while simulating the
stirring effect of traffic. Current data shows consistent results and the test is repeatable.
The Friction Test is used to determine if a liquid deicer will have a detrimental effect
on roadway friction. It is possible for a deicer to have a high ice melting capacity but cause
slippery roadways. Many tests have been developed to test roadway friction. The test used in
this research uses a weighted sled with rubber contact points. This test most closely
resembles the friction test used by the Pacific Northwest Snowfighters (2008).

27
The Sunlight Test was developed to determine if a dark color is an advantage to a
chemical deicer when exposed to direct sunlight. The decision was made to develop this test
after processing some data from both the SHRP Ice Melting Capacity Test and the Shaker
Test. A very dark colored chemical deicer that is known to do well in the field did poorly in
both performance tests. The results of the sunlight test helped to understand how certain
chemical deicers work in the field.
The Refreeze Test was developed to determine when roadway that has been treated
with a chemical deicer will begin to refreeze. This test was also used to evaluate the effect of
particle size on the refreeze time for solid chemical deicers.
3.1 SHRP Ice Melting Capacity Test
This test was developed by the Strategic Highway Research Program (Chappelow et
al., 1992) and is used to analyze the ice melting capacity of both liquid and solid chemical
deicers. The current research suggests this test is not repeatable between different
laboratories.
The tests were conducted using the SHRP H205.1 and H205.2 test methods
(Chappelow et al., 1992). Testing was performed at 20°, 10°, and 0° F. The samples of
deicers consisted of 3 grams of road salt that passed through a #4 sieve, and are prewetted
with 1mL of liquid deicer. The variables in these tests were the environmental temperature
and the prewetting liquid. The prewetting liquid deicers used are given in Table 3.1.

28
Table 3.1: Liquid Deicers used in SHRP Ice Melting Capacity TestDeicer Composition
Salt Brine 23% NaCl Mg-A 29%MgCl2
Mg-B 30%MgCl2
K Ace 50% Potassium Acetate Beet Juice-A Carbohydrate Byproduct
Because Salt Brine is much less expensive than all other liquid deicers, in the field it
is often mixed with other liquid deicers to help lower the cost of roadway treatment.
Different Salt Brine/liquid deicer ratios were used in the SHRP Ice Melting Capacity Test to
study the effect mixing ratios has on the end product. The ratios used were 100% of liquid
deicer, 50/50 Salt Brine/liquid deicer, 60/40 Salt Brine/liquid deicer, and 85/15 Salt
Brine/liquid deicer. These ratios are commonly used in the field.
3.1.1 Equipment
The following equipment is required for the SHRP Ice Melting Capacity Test:
a. 19.7 ft3 Chest Freezer with Temperature Controls
b. 3 Circular Plexiglas Test Dishes, 9 inches in Diameter and ¾ inches Deep
c. 3 Thermocouple Wires
d. A Scale Capable of Measuring to the Nearest 0.0001 Gram
e. A #4 Sieve
f. Other Equipment: Timer, Syringes, Graduated Cylinders, and Containers
The use of a 19.7 ft3 chest freezer was a deviation from SHRP, which recommended
the test be performed in a walk-in freezer or a modified upright freezer. The chest freezer
was chosen as a less expensive alternative. The obvious problem with using a chest freezer is
fluctuations in temperature in the chest due to opening the door. Hence, thermocouple wires

29
were embedded in the ice strata to monitor the ice temperature. The test setup is shown in
Figure 3.1.
3.1.2 Procedure:
Each test is conducted in triplicate.
3.1.2.1 Preparation of Test Samples
1. Pass the solid deicer through a #4 sieve. The passing solids are used for testing.
2. Dry the solid deicer in an oven for 24 hours and then store it in a desiccator.
3. Weigh and record the empty container.
4. Place 3 grams of solid deicer in the small container with a lid.
5. Use a syringe to dribble 1mL of liquid deicer or liquid deicer/salt brine mix onto the 3
grams of solid deicer.
6. Place the lid on the container to prevent any losses or water vapor absorption.
Figure 3.1:
SHRP Ice Melting Capacity Test Setup inside Freezer

30
7. Weigh and record the container and deicer sample. Subtract the weight of the empty
container to get the weight of the deicer sample.
8. Place the container in the freezer set at the desired temperature. Allow the deicer
sample to cool and equilibrate for 5-6 hours.
3.1.2.2 Testing Procedure
1. Place the three test dishes within the freezer set at the desired temperature and allow
to cool overnight. The dishes should rest on spacers to insure airflow underneath the
dishes and to assist the leveling process.
2. Place 130mL of distilled water in each test dish. This amount of water will create a
1/8 inch thick ice sheet in the dish.
3. Place thermocouple wires in the water within the test dish.
4. Give the water at least 5-6 hours to freeze.
5. Take a temperature reading of the ice surfaces using the thermocouple reader.
6. Take the deicer samples from the containers and apply to the ice sheets. The deicer
should be as evenly distributed as possible. Inevitably, some liquid deicer will remain
in the containers.
7. Record the surface temperatures after application.
8. Temperature readings of the ice surfaces should be taken before and after each brine
measurement. The temperature should not be allowed to deviate more than 3 degrees.
9. Allow the deicer samples to melt the ice. Brine measurement should be done one dish
at a time. As shown in Figure 3.2, at a specific time interval the test dish is tipped so
the brine can collect at one end and be decanted using a syringe. The brine is weighed
using a scale and returned to the test dish. The weight is recorded to the nearest

31
0.0001 gram. The actual removal, weighing, and return of the brine should be done in
less than 2 minutes.
10. Step 9 should be performed at 10, 20, 30, 45, and 60 minutes from the time of
application. Different time intervals can be used if needed or preferred.
11. The test is complete after 60 minutes unless specified otherwise. The test dishes can
be removed from the freezer, rinsed clean with distilled water, towel dried as much as
possible, and placed back in the freezer.
3.1.3 Data Processing:
There are two ways to present the data from this test. The data can be presented as
melting rates for the different chemical deicers or as melting totals for a particular time
interval, usually 60 minutes. The melting capacity is commonly presented as the amount of
ice melted per amount of deicer. In the case of this research the measured amounts are
divided by approximately 4 grams. The number is a little different for each liquid chemical
deicer.
Figure 3.2: Collecting Brine

32
3.2 Shaker Test
Due to the inaccuracies of the SHRP Ice Melting Capacity Test, there is a need to
develop a simple and repeatable test that can be used to accurately determine the ice melting
capacity of a deicer. It can be used to test liquid and solid deicers, but more modifications
may be needed for testing prewetted solids. The idea behind this test was to use a modified
martini shaker to simulate the effect of traffic on the roadway while evaluating the ice
melting capacity of a deicer. This research utilized four modified martini shakers. The four
shakers are made from similar materials and are of similar construction. The four shakers
also produced very similar test results.
The primary advantage of the Shaker Test is the ability to perform the test without a
large freezer. Current data also suggests this test yields consistent results between
laboratories. The test can be performed inside a small freezer in which the shaker can set in
an upright position. The shaker has enough insulation to maintain its internal temperature
when taken out of the freezer. When the lid is taken off, it will maintain its temperature for
several seconds. With the lid on it will maintain its temperature for about 2 ½ minutes. The
retention of steady temperature allows the shaking to be done outside the freezer.
Testing was performed at 20°, 10°, and 0° F. Deicer samples consisted of 7 mL of
liquid deicer, 5 grams of dry solid deicer, or 5grams of solid deicer soaked in a liquid deicer
to simulate prewetting at a stockpile. The liquid deicers evaluated are listed in Table 3.2. As
was done in the SHRP Ice Melting Capacity Test, pure deicing chemicals and different
deicer/brine ratios were evaluated using the shaker test. The most commonly used

33
brine/deicer ratios were 85/15 and 50/50, though one of the chemicals was extensively
evaluated for various ratios.
Table 3.2: Liquid Deicers used in Shaker TestDeicer Composition
Salt Brine 23% NaCl Mg-A 29% MgCl2
Mg-B 30% MgCl2
K Ace 50% Potassium Acetate Beet Juice-A Carbohydrate Byproduct
Mg-C Carbohydrate Byproduct and 26.9% MgCl2 Mg-D Carbohydrate Byproduct and 25% MgCl2
Beet Juice-B Carbohydrate Byproduct Calcium Chloride Carbohydrate Byproduct and 30% CaCl2
3.2.1 Equipment:
a. Modified Martini Shaker
As shown in Figure 3.3(a), plastic martini shakers were used for this research
because many chemical deicers will quickly corrode steel, even stainless steel.
The type of insulation material used on the shakers is commonly used to
insulate copper water pipes and can be obtained at a hardware store, as shown
in Figure 3.3(b).
Figure 3.3:
(a) Martini Shaker
(b) with Insulation
“Cup” Part of Lid
“Strainer” Part of Lid
“Body” of Shaker
(a) (b)
34
b. Freezer
The freezer attached to an upright refrigerator is large enough for testing. A
thermostat may be needed to set the temperature in the freezer.
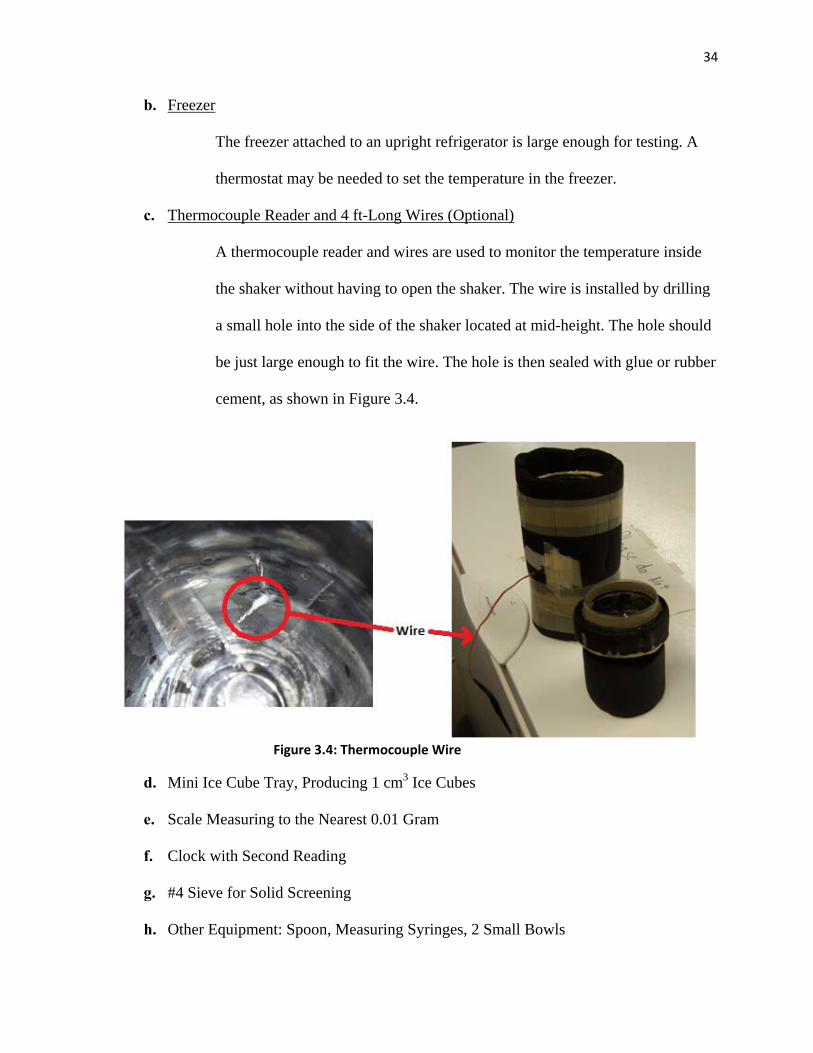
c. Thermocouple Reader and 4 ft-Long Wires (Optional)
A thermocouple reader and wires are used to monitor the temperature inside
the shaker without having to open the shaker. The wire is installed by drilling
a small hole into the side of the shaker located at mid-height. The hole should
be just large enough to fit the wire. The hole is then sealed with glue or rubber
cement, as shown in Figure 3.4.
d. Mini Ice Cube Tray, Producing 1 cm3 Ice Cubes
e. Scale Measuring to the Nearest 0.01 Gram
f. Clock with Second Reading
g. #4 Sieve for Solid Screening
h. Other Equipment: Spoon, Measuring Syringes, 2 Small Bowls
Figure 3.4: Thermocouple Wire

35
3.2.2 Procedure:
Each test is conducted in triplicate.
1. Prepare Ice Cubes. Use a syringe to measure 1 mL of distilled water into each
aperture of the ice cube tray.
2. Prepare Deicer Sample. If using a pure sample of liquid chemical deicer, use a
syringe to measure 7 mL and discharge into the shaker. If using a liquid deicer/brine
mix, measure the needed amounts of deicer and brine and discharge separately into
the shaker. The liquids will mix together in the shaker.
If using solid deicer, pass the deicer through a #4 sieve. The solid that remains on the
sieve is used for testing. This gradation size is used because smaller gradations tend
to stick to the sides of the shaker, disrupting the test. Weigh 5.00±0.03 grams of the
solid and place the sample in the shaker.
3. Weigh and record the weight of small bowl #1.
4. Place the shaker with the chemical deicer sample, the shaker lid, the filled ice cube
tray, and small bowl #1 in the freezer set at the desired temperature. The shaker lid is
placed next to the shaker, not on the shaker.
5. Let the ice freeze. Once frozen, remove 10 ice cubes from the tray and place them in
small bowl #1.
6. Weigh and record the weight of small bowl #1 with the ice cubes. Put the bowl with
the ice cubes back in the freezer. Once the ice cubes have been weighed they must be
used within 2 days. Otherwise, the ice cubes will evaporate.
7. Let the shaker and the ice acclimate in the freezer for 5-6 hours or overnight. Plug in
the thermocouple wire to monitor the internal temperature of the shaker.

36
8. Take a temperature reading immediately before testing.
9. Open the freezer door and dump the 10 ice cubes from small bowl #1 into the shaker.
Place the lid on the shaker. This step must be done quickly as to maintain the internal
temperature of the shaker.
10. Begin Shaking. Shaking must be done at 2 cycles a second for liquids and 3 cycles a
second for solids and prewet solids. The shaker must be held at an upward angle of
about 30°, as shown in Figure 3.5. Holding the shaker at this angle will prevent
separation of the liquids from the solids.
11. Shake for 5 minutes while setting the shaker down after every minute to quickly take
a temperature reading.
12. After 5 minutes, turn the shaker upside-down and return it to the freezer in that
position. Keep the plug-in end of the thermocouple wire outside the freezer. The
liquids will drain into the cap portion of the lid while the remaining ice stays in the
strainer portion of the lid. The ice will stop melting.
13. Let the shaker set in the inverted position inside the freezer for 5 minutes. Take a
temperature reading every minute.
14. Weigh and record small bowl #2 with the spoon setting in the bowl.
15. Remove the shaker from the freezer while keeping it in an inverted position.
Figure 3.5: Shaking Angle

37
16. Remove the body of the shaker from the lid. Most of the remaining ice will be in the
accessible portion of the lid, as shown in Figure 3.6.
17. Quickly use the spoon to move the remaining ice from the lid to small bowl #2. Once
in the bowl the ice is allowed to melt.
18. Move any remaining ice from the body of the shaker to small bowl #2, if any.
19. Weigh and record small bowl #2 with the spoon and the remaining ice.
3.2.3 Data Processing:
The total amount of melted ice is determined using the following equation:
Ice melting capacities data from the Shaker Tests are presented as the amount of melted ice
per amount of deicer. For liquids, data is presented as grams of melted ice per milliliter of
Figure 3.6:
Remaining Ice in Strainer
Section of Lid
(1)

38
deicer. For solids and prewet solids, data is presented as grams of ice melted per gram of
deicer. The standard deviation and variance are calculated for each data point.
3.3 Friction Test
The purpose of this test was to determine if liquid chemical deicers could cause
slippery conditions when applied to an ice covered roadway. It is important to test if a liquid
deicer will create a slippery roadway because the deicer may have an acceptable ice melting
capacity, but still have a negative effect on the level of service of the roadway. Many liquid
chemical deicers, especially those with organic components, have been known to ferment and
cause slippery roadways. Many tests can be used to determine whether fermentation has
occurred, the easiest is to smell the liquid for fermentation odor. The test described in this
section measures the actual friction coefficients of a surface during and after a chemical
deicer has been used to remove a given amount of ice. This test closely represents one tire of
a small car whose brakes has locked and is sliding across a concrete surface covered by a thin
layer of ice at about 20°F. These conditions are described in detail as follows.
This test was meant to emulate reality as much as possible, but the surface of a
roadway is not uniform. A roadway surface will probably not have the same friction
coefficients at different locations. The best ways to utilize this test are to compare the
performances of different liquid deicers to each other and to have a baseline performance for
comparison. The baseline performance used in this test was a concrete surface saturated with
water. When the data from this test is processed in this manner, the composition of the
roadway becomes a much less significant variable.

39
These tests were done in a walk-in freezer at 20 ± 4°F. Only liquid deicers were used
because the varying shape, size, and hardness of solid deicers would have caused
considerable variance in the results. The liquid deicers evaluated by the Friction Test are
given in Table 3.3.
Table 3.3: Liquid Deicers used in Friction TestDeicer Composition
Salt Brine 23% NaCl Mg-A 29% MgCl2
Mg-B 30% MgCl2
K Ace 50% Potassium Acetate Beet Juice-A Carbohydrate Byproduct
Mg-C Carbohydrate Byproduct and 26.9% MgCl2 Mg-D Carbohydrate Byproduct and 25% MgCl2
Calcium Chloride Carbohydrate Byproduct and 30% CaCl2
This test used a weighted sled with rubber contact points pulled across a concrete
surface to determine the static and kinetic friction coefficients while a chemical deicer was
being used to remove a thin ice layer from that surface. The total surface area of the rubber
contact points is 9in2 and the total weight of the sled is 270 lbs. The values of surface area
and total weight were chosen to accommodate the laboratory’s existing resources. The
weight creates 30 psi of pressure on the roadway, similar to the pressure of a small car. A
load cell and data acquisition system was also used in this test to continuously sample the
force needed to pull the weighted sled. This test was intended to simulate the sudden braking
of a vehicle.
The ice layer was created by spraying a fine mist of 25 mL of distilled water on a 2.5
ft2 area of the concrete slab. The water instantly freezes on contact with the slab creating an
uneven ice layer. This technique produces an ice layer similar to the way light sleet would
form on a roadway surface.

40
Many State Departments of Transportation make it a policy not to use liquid deicers
on ice layers due to runoff. During this test, the problem was rectified by limiting the flow of
the liquids using acrylic based sealant. This caused the liquid deicer and melted ice to pool in
the location and the path of the rubber contact points on the sled, as shown in Figure 3.7. The
depth of the pooling was not consistent, but could be as much as 1/8-inch.
3.3.1 Equipment:
a. Walk-in Freezer with Temperature Controls
b. Steel Sled with Rubber Contact Points
As shown in Figure 3.8, the sled is made of 1-inch steel tubing and four 3-inch
square steel plates welded together to produce a stiff frame. The stiff frame helps
to insure evenly distributed load. The purpose of the steel plates is to transfer load
to the rubber contact points as evenly as possible. The rubber contact points are
cut from the tread of a tire and are oriented symmetrically to mimic the common
position of a tire on a roadway, with the tread parallel to the roadway. The rubber
contact points were glued to the steel plates. The shape of the sled was dictated by
the shape of the available weights.
Figure 3.7: Details of Liquid Pooling Issue
Pulled
Direction
Position of Sled on the Slab Position of Liquid Pools on the Slab

41
c. Weights
The sled was built to accommodate 1-ft square weights. The total weight of
the sled needed to be 270 lbs. Several weights were used to approach the
target weight of 270 lbs. A bucket of sand was used to attain the exact weight
of 270 lbs.
d. Small Load Cell and Data Acquisition System
e. Spray Bottle Capable of Producing a Fine Mist
f. Graduated Cylinder
g. Squeegee
The squeegee is used to spread the liquid deicer and to clean the concrete
surface after testing.
h. 1-inch Diameter Threaded Bar, 2 Nuts, 1 washer, ¼ inch thick Modified Steel Angle,
and Grease
The threaded bar, nuts and washer, and steel angle are used to pull the sled.
The Friction Test details and setup are shown in Figure 3.9. One nut is welded
to the sled and is used to secure the threaded bar to the sled. When the other
Figure 3.8: Rubber Contact Points
Rubber Contact Points on Sled
Front
Rubber Contact Points Cut from Center of Tread

42
nut is tightened, the sled is dragged forward. The load cell records the amount
of force used to pull the sled. The threaded bar and all contact points must be
very well greased.
3.3.2 Procedure:
Tests are repeated at least twice for each chemical.
3.3.2.1 Preparation of the Steel Angle
The purpose of the steel angle is to provide a stiff segment to place the load cell
against when the sled is being dragged across the slab. Ideally, when one side of the steel
angle is placed under the slab, the other side will fit around the side of the slab and stick up
over the surface of the slab. A hole was drilled in one leg of the steel angle sticking up over
the surface of the slab so the threaded rod attached to the sled could fit through the hole
without touching the sides of the hole.
Load Cell
WasherModified Angle Nut
Attached to Sled
Threaded Bar
Tightening Nut
Figure 3.9: Equipment and Setup to Drag Sled
C‐Clamp Keeps Load Cell from Rotating

43
3.3.2.2 Preparation of the Concrete Slab
1. Make a 2-foot square, 2-in thick concrete slab. There is no specified composition of
the concrete to be used for this test, but it is recommended to use a mix common to
the local area. There is no required concrete thickness to be used for the test, but a
thinner slab will cool more quickly.
2. Let the concrete slab set for 7 days before testing.
3. Clean the concrete slab surface thoroughly with distilled water and remove all stray
granules.
4. Move the slab to the walk-in freezer and place the modified steel angle. This allows
the sled to brace against the slab when the sled is pulled.
5. Level the concrete slab as much as possible.
6. If needed, place the acrylic based sealant on the concrete surface. The best way to do
this is to place the sled on the slab in the location needed for testing and trace around
it with the sealant, as depicted in Figure 3.10.
Figure 3.10:
Applying Acrylic Sealant on
Concrete Slab

44
3.3.2.3 Testing Procedure
1. Activate the walk-in freezer set at the desired temperature.
2. Allow the slab, sled, weights, and other mechanical equipment to equilibrate for 5-6
hours inside the freezer.
3. Put 25 mL of distilled water in the spray bottle and spray the concrete surface area
within the sealant. Spray the water as evenly as possible, as shown in Figure 3.11.
The water will freeze almost instantly.
.
The following steps (steps 4-9) must be done in 5 to 6 minutes:
4. Put 25 mL of liquid deicer in a graduated cylinder and deposit the deicer within the
frozen area on the slab. Use the squeegee to spread the deicer across the ice. The
deicer should be moved to cover the ice with the majority of the deicer remaining in
the center to distribute naturally.
5. Place the sled and weights on the frozen area and place the load cell as seen in Figure
3.12.
Figure 3.11: Making Ice Layer

45
6. Begin data sampling with the computer and load cell. The data acquisition system
should be set to sample 3 times a second.
7. Set the load cell in place so the threaded bar is not in contact with the washer.
8. Tighten the nut using a slow, smooth motion. When the load cell is bearing against
the washer, force is exerted on the load cell and the sled is moving forward. Continue
motion for several seconds.
9. Loosen the nut. Halt sampling on the computer and save the data. Reset the computer
for the next sampling.
10. Look at the data and determine the magnitude of the force needed to move the sled.
11. Remove the weights from the sled and move it back to its original position.
12. Repeat steps 5-11 every 5 to 10 minutes until 3 consecutive tests yield similar
magnitudes of force. The target time intervals are 5, 10, 15, 20, 25, and 30 minutes
from the time the deicer is placed on the slab.
Figure 3.12: Friction Test Setup

46
13. When testing is complete, rinse off the rubber contact points on the sled and flush the
concrete surface with warm water. Use the squeegee to remove excess liquid from the
surface of the slab.
14. Rinse the squeegee.
3.3.3 Data Processing:
The data from testing consists of a time series of the magnitudes of force being
exerted on the sled at 1/3 second interval.
No force is applied when the load cell is initially activated. This occurs just before
tightening and just after loosening the nut. The applied force will increase as tightening
begins. The peak magnitude force occurs when static friction has been reached and the sled
has begun to move. The peak force is the value used to calculate the static friction
coefficient. The forces gradually decrease after the peak force as the sled is moving. The
average of these values is used to calculate the kinetic friction coefficient. The following
equations are used to calculate the static and kinetic friction coefficients:
The static and kinetic friction coefficients are calculated for every time interval. This
test should be run at least twice for each liquid deicer to obtain an average performance.
(2)
(3)

47
3.4 Sunlight Test
The purpose of this test is to determine if darker colored chemical deicers have a
significant advantage over lighter colored chemical deicers in direct sunlight. The prewet and
application rates used in this test are much higher than those used in practice. The results of
this test are presented by photos to show how the different samples of deicers compare to
each other in direct sunlight and in shaded areas.
Samples of solid chemical deicers are prewet with a liquid chemical deicer with the
intention of darkening the color of the solids. The same amount of liquid and solid is used for
each sample and the solids all have a similar gradation. The chemical deicers used in this test
are given in Table 3.4. The samples are applied to separate plots of ice that are 1/8 inches
thick. Pictures are taken of the plots at the same time intervals. The performance of the
deicers is evaluated visually.
Table 3.4: Liquid and Solid Deicers used in Sunlight Test Deicer Composition
Salt Brine Liquid-23% NaCl 50/50 Mix of Beet Juice-A/Salt Brine Liquid-Carbohydrate Byproduct/ 23% NaCl 15/85 Mix of Beet Juice-A/Salt Brine Liquid-Carbohydrate Byproduct/ 23% NaCl
Road Salt Solid-NaCl Pink Salt Solid-Complex Chloride NaCl, MgCl2, KCl
3.4.1 Equipment:
a. Sample Containers with Lids
b. Measuring Syringes
c. #4 and #8 Sieves
d. Camera
e. Thermometer

48
f. Scale Measuring to the Nearest 0.01 Gram
g. Acrylic Based Sealant
h. Test Plots
Any substrate can be used for this test. As shown in Figure 3.13, the test plots
used in this research were constructed of an 18-inch by 13-inch concrete slab
divided into 8 plots using acrylic based sealant.
3.4.2 Procedure:
3.4.2.1 Sample Preparation
1. Pass the solid deicers through a #4 and #8 sieve. The solids caught on the #8 sieve are
used for testing.
2. Measure 2.0±0.03 grams of solid and place in sample container with lid. Tip the
sample container to one side so all the sample is in the same area of the container.
3. Measure ½ mL of liquid deicer using a syringe. The deicer can be a pure sample or a
sample mixed with salt brine.
4. Dribble the ½ mL of liquid deicer on the sample of solid deicer in the sample
container.
Figure 3.13: Sunlight Test Surface

49
5. Steps 2-4 must be done twice for each solid/liquid deicer combination so a test can be
done in a sunlit area and a shaded area. Figure 3.14 shows some deicer samples.
6. Place the lids on the sample containers to prevent any losses.
3.4.2.2 Testing Procedure
1. Take deicer samples and test plots outside and let them acclimate overnight.
2. Select a day for testing. The weather must be clear and sunny with air temperature
less than or equal to 20°F. The testing must also be done in an area with little to no
wind.
3. Place the test plots on a shaded, level area. Fill the test plots with distilled water to
create a 1/8-inch thick ice sheet on each plot. Each plot may require a different
amount of water.
4. Let the water freeze for 3-4 hours.
5. Use the thermometer to determine the air temperature in the shaded and sunlit areas.
6. Spread the deicer samples on separate test plots. Distribute the deicers as evenly as
possible. Place the test plots in the sunlight with the appropriate plots remaining in
the shade. Take pictures of the test plots immediately before and after application, as
shown in Figure 3.15.
Figure 3.14: Sunlight Test Sample
P Preparation

50
7. Take pictures every 3 to 5 minutes for 60 minutes.
8. When the test is complete, thoroughly rinse the test plots with warm water. Dry the
test plots as much as possible. Leave the test plots outside for future tests.
3.4.3 Data Processing:
The pictures taken during the test are visually evaluated to determine if a particular
solid/liquid deicer combination shows a clear advantage over other combinations. The
pictures taken during the test can be used to reveal certain deicers having better deicing
performance under sunlight. The picture taken at 60 minutes or the final picture is used to
make the comparison. The area affected by the deicer in the separate plots can be determined
by using a grid of areas, but obvious visual differences are preferred.
Figure 3.15:
Deicing Samples in Shaded and Sunlit
Areas

51
3.5 Refreeze Test
The purpose of the refreeze test is to determine when a deicing product will cease to
function and the mixture with melted ice begins to refreeze on the roadway. Estimating when
a treated roadway will begin to refreeze helps to determine when trucks should be sent out to
treat the roadway again. This test can be used for liquid deicers and solid deicers. Prewet
solid deicers were used for testing, but did not yield useful results. The chemical deicers used
for this test are given in Table 3.5.
Table 3.5: Chemical Deicers used in Refreeze Test Deicer Composition
Liquids Salt Brine 23% NaCl
Mg-A 29% MgCl2
Mg-B 30% MgCl2
K Ace 50% Potassium Acetate Beet Juice-A Carbohydrate Byproduct
Mg-C Carbohydrate Byproduct and 26.9% MgCl2 Mg-D Carbohydrate Byproduct and 25% MgCl2
Beet Juice-B Carbohydrate Byproduct Calcium Chloride Carbohydrate Byproduct and 30% CaCl2
Solids Road Salt Solid-NaCl Pink Salt Solid-Complex Chloride: NaCl, MgCl2, KCl
This test is based the SHRP Ice Melting Capacity Test. It consists of placing a sample
of deicer on an ice sheet and measuring the amount of liquid that can be removed from the
ice surface at particular time intervals over several hours. As time elapses, the amounts of
liquid that can be removed will increase as melting occurs and then decrease as the liquid
begins to refreeze. The thickness of the ice sheet for these tests was 1/8-inch, but a particular
thickness is not required as long as the same is used for all the tests.

52
The amount of deicer used for this test depended partially on what is used in the field.
For liquid deicers, an amount corresponding to 109 gallons per lane-mile was used for testing
because it was the smallest amount that could be measured with reasonable accuracy. For
solid deicers, an amount corresponding to 910 pounds per lane-mile was used for testing
because smaller amounts would not produce measurable results. These are considered large
application rates in the state of Nebraska but are not uncommon.
The tests were performed in a walk-in freezer, but it could be adapted for use in a
smaller freezer. The temperature during the tests was 14±2°F. As was done for the SHRP Ice
Melting Capacity Test and the Shaker Test, pure deicing chemicals and different deicer/brine
ratios were evaluated using the Refreeze Test. The deicer/NaCl ratios evaluated were 15/85
and 50/50. The solid deicers were used specifically to study the effect of the particle
gradation on the refreeze time. The solids were passed through#4, #8, #20, and #40 sieves.
The solids retained on the #8, #20, and #40 sieves were used separately for testing.
3.5.1 Equipment:
a. Containers, with and without Lids
b. Syringes Capable of Measuring to the Nearest 0.1 mL
c. Graduated Cylinder
d. Walk-in Freezer with Temperature Controls
e. Scale Measuring to the Nearest 0.01 Gram
f. #4, #8, #20, and #40 sieves

53
3.5.2 Procedure:
Each test is conducted in triplicate.
1. Pass solid deicers through #4, #8, #20, and #40 sieves. The solids retained on the #8,
#20, and #40 sieves are used separately for testing.
2. If needed, pre-mix the liquid deicers at the desired ratios. Place several milliliters of
the liquid deicers in containers and place the lids. The deicers are now pre-mixed for
all needed testing.
3. Place containers, syringes, and all chemical deicers in the freezer.
4. Set the freezer to the desired temperature.
5. Use the graduated cylinder to place 25 mL of distilled water in each container. This
will create a 1/8-inch thick ice sheet in the containers.
6. Let the temperature of the ice, equipment, and deicers equilibrate for 4-5 hours.
7. Apply a sample of deicer to the ice sheet. For liquids, use ½ mL. For solids, use
0.5±0.03 grams.
8. Use a syringe to remove and measure the liquid from the ice surface, as shown in
Figure 3.16. Take measurements at 1-hour intervals for 5 hours.
Figure 3.16: Refreeze Test Liquid Measurement

54
9. Clean the containers with the leftover ice by thoroughly rinsing with distilled water.
10. Clean the syringes with distilled water.
11. All equipment and deicers may be left in the freezer for later testing.
3.5.3 Data Processing:
The refreeze time was determined for the deicers based on the data over a 5-hour test
period. The results from the three tests for each deicer are presented in the next chapter.

55
Chapter 4
Test Results and Evaluation
4.1 SHRP Ice Melting Capacity Test
This test was developed by the Strategic Highway Research Program and can be
found in the Handbook of Test Methods for Evaluating Chemical Deicers (Chappelow et al.,
1992). It served as the starting point for test development in this project. Testing was
performed at 20°, 10°, and 0° F. The test samples consisted of 3 grams of road salt with 1mL
of liquid prewet. Different liquid deicer/sodium chloride ratios were used as a prewet to
study the effect mixing ratios has on the end product. The ratios used were 100% of liquid
deicer, 50/50 liquid deicer/ sodium chloride, 40/60 liquid deicer/sodium chloride, and 25/75
liquid deicer/sodium chloride.
4.1.1 Test Results
The results of the SHRP Ice Melting Capacity Test can be presented as melting rates
for the different chemical deicers or as melting totals for a particular time interval, usually 60
minutes. The 60 minute totals for 0°F and 10°F are shown in Figures 4.1 and 4.2,
respectively. The colored bars represent the different deicer/NaCl ratios. The percentages
stand for the percent of the specified deicer used in the prewet. For example, the red colored
bar represents 25%. This means a mix of 25% deicer and 75% of sodium chloride was used
to prewet the road salt, or, the prewet consisted of a 25/75 mix of deicer/NaCl. The
performance of 100% salt brine is used as the reference for comparison. The performance of
100% Beet Juice-A is not shown because the high viscosity of this product disrupted the test.
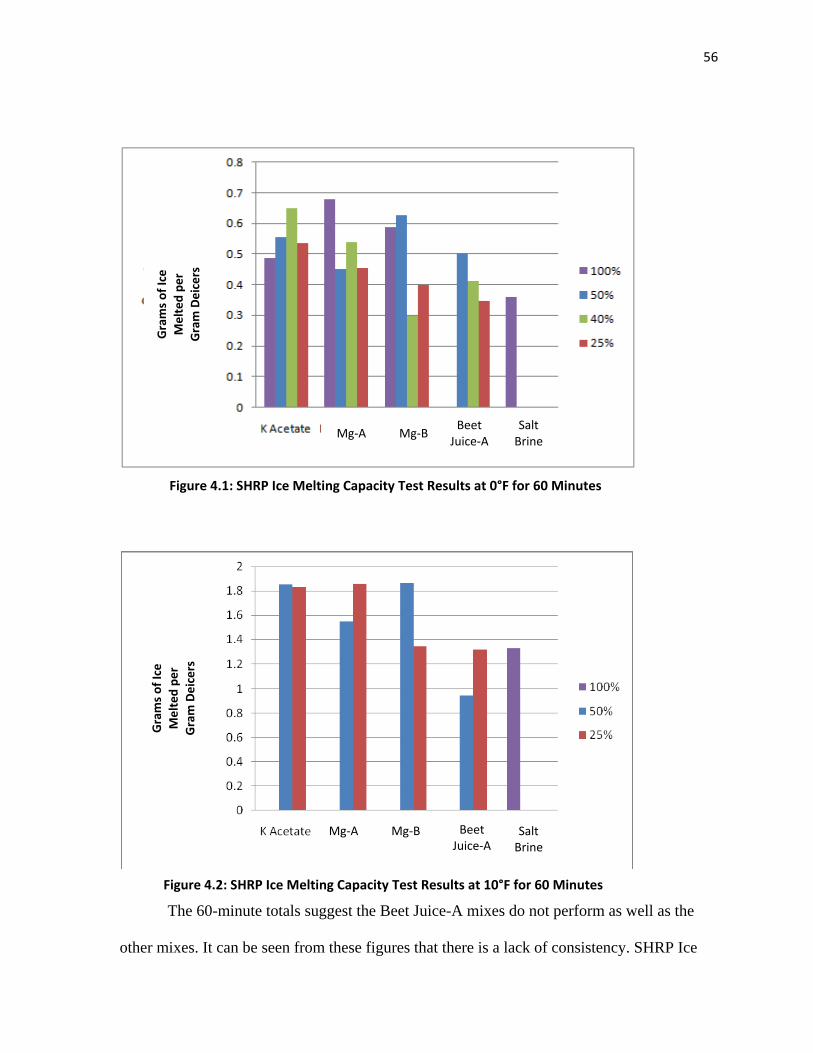
56
The 60-minute totals suggest the Beet Juice-A mixes do not perform as well as the
other mixes. It can be seen from these figures that there is a lack of consistency. SHRP Ice
Figure 4.1: SHRP Ice Melting Capacity Test Results at 0°F for 60 Minutes
Figure 4.2: SHRP Ice Melting Capacity Test Results at 10°F for 60 Minutes
Salt Brine
Salt Brine
Grams of Ice
Melted per
Gram Deicers
Grams of Ice
Melted per
Gram Deicers
Mg‐A Mg‐BBeet Juice‐A
Mg‐A Mg‐B Beet Juice‐A

57
Melting Capacity Tests were not performed at 20°F because it was decided the test was too
inconsistent to continue. Figures 4.3-4.9 depict the melting rates for each temperature and
mix ratio.
Figure 4.3:
SHRP Ice Melting Capacity
Test Rates at 0°F for 100%
of Indicated Deicer
Figure 4.4:
SHRP Ice Melting Capacity
Test Rates at 0°F for 50/50
Mixes of Indicated Deicer
and Sodium Chloride
Grams of Ice
Melted per
Gram Deicers
Grams of Ice
Melted per
Gram Deicers
Mg‐A
Mg‐B
Mg‐A
Mg‐B
Beet Juice‐A

58
Figure 4.5:
SHRP Ice Melting Capacity
Test Rates at 0°F for 40/60
Mixes of Indicated Deicer
and Sodium Chloride
Figure 4.6:
SHRP Ice Melting Capacity
Test Rates at 0°F for 25/75
Mixes of Indicated Deicer
and Sodium Chloride
Figure 4.7:
SHRP Ice Melting Capacity
Test Rates at 10°F for 50/50
Mixes of Indicated Deicer
and Sodium Chloride
Grams of Ice
Melted per
Gram Deicers
Grams of Ice
Melted per
Gram Deicers
Grams of Ice
Melted per
Gram Deicers
Mg‐A
Mg‐B
Beet Juice‐A
Mg‐A
Mg‐B
Beet Juice‐A
Mg‐A
Mg‐B
Beet Juice‐A

59
The melting rates are fairly close for the various deicers. At 0°F, it takes at least 30
minutes for the deicers to start melting the ice. At 10°F, the deicers do not start working until
after 15 minutes of exposure. Potassium acetate and Mg-A consistently perform better than
sodium chloride. The results for the Mg-B do not show any consistency. Beet Juice-A
consistently performs the same as or worse than sodium chloride. However, the data in
Figure 4.4 shows a 50/50 mix of Beet Juice-A/NaCl performs better than sodium chloride
Figure 4.8:
SHRP Ice Melting Capacity
Test Rates at 10°F for 25/75
Mixes of Indicated Deicer
and Sodium Chloride
Figure 4.9:
SHRP Ice Melting Capacity
Test Rates at 20°F for 50/50
Mixes of Indicated Deicer
and Sodium Chloride Grams of Ice
Melted per
Gram Deicers
Grams of Ice
Melted per
Gram Deicers
Mg‐A
Mg‐B
Beet Juice‐A
Mg‐A
Mg‐B
Beet Juice‐A

60
alone at 0°F which correlates with what has been reported by roadway maintenance
personnel in the State of Nebraska.
At 20°F, all the deicers are producing identical results suggesting a 50/50 ratio of
deicer/NaCl will perform the same as sodium chloride alone. The accuracy of these results is
questionable because they do not correlate with the observations that sodium chloride
becomes much less effective than other deicers below about 20°F. This data also does not
correlate with field reports in the State of Nebraska.
4.1.2 Sources of Error
Many sources of error exist in this test. The variances for these tests at 45 and 60
minutes vary from 5% to 25%. About half of these variances are greater than 10%. Prevalent
sources of error include the use of a chest freezer for testing and the testing of prewet solids.
Others sources include liquid retention from cavities formed in the melting ice and problems
that come from mixing deicers.
Opening the door of the chest freezer caused the temperature to increase during
testing. The temperature of the ice did not increase by more than 3°F, but the air temperature
could increase by as much as 10°F. This could result in less consistent ice melting capacities.
Road salt is a much less homogeneous material than the liquid deicers because road
salt contains small amounts of gravel. This physical attribute could cause significant error in
test results if some samples contain more gravel than others. The granules also created
cavities in the ice sheet that retained some liquid even when the test dish is tipped. A research
project (Goyal et al., 1989) using the SHRP Ice Melting Capacity Test tried using different
types of blotter paper to absorb all the liquids. This method resulted in needing many more

61
tests to determine ice melting capacities of a deicer in 60 minutes because the liquids could
not be adequately returned to the test dish.
Problems with mixing the liquid deicers are believed to cause the most inconsistency
in the results between different mix ratios. The problem comes from mixing the liquids in
separate graduated cylinders. Any deicer/NaCl mixes with deicer amounts greater than 40%
produce a solid precipitate. This did not occur with the Beet Juice-A or Beet Juice-B mixes.
As seen in Figure 4.10, this precipitate quickly settles and sticks to the inside of the
graduated cylinder. There was always residue left in the graduated cylinder after the liquids
had been poured for use as a prewet. The precipitate is most likely solid chlorides and/or
acetates that can become separated from the prewet liquid, thus reducing the liquid’s ice
melting capacity. The precipitate has also been reported to clog deicer distribution systems
on trucks in the State of Nebraska.
Figure 4.10: (Left) Clear Deicers in Separate Syringes, (Middle) Precipitate Formed
After Mixing Deicers, (Right) Settled Precipitate

62
4.1.3 Test Evaluation
The results of this test were found to be too inconsistent to justify the expense of its
use. Some research papers (Akin and Shi, 2010; Shi et al., 2009; Nixon et al., 2007; Alger
and Haase, 2006) have produced more consistent results, but those projects conducted the
SHRP Ice Melting Capacity Tests in a walk-in freezer. Each of these research projects used a
slightly different procedure from the SHRP Ice Melting Capacity Test, usually having to do
with the size of the ice sheet or deicer sample. The results from Akin and Shi (2010), Shi et
al. (2009), and Nixon et al. (2007) cannot be compared with the SHRP test results from this
study because those studies did not use prewet solids. However, the results from Alger and
Haase (2006) are compared with the results from this study in Table 4.1.
Some of the SHRP Ice Melting Capacity test results from Alger and Haase (2006) are
shown in Figure 4.11. This research tested samples of prewet road salt. The purpose of their
research was to determine how the prewetting rate, at 6, 8, or 10 gal/ton, would improve the
ice melting capacity.
Figure 4.11:
SHRP Ice Melting Capacity Test
Results (Alger and Haase,
2006)
Beet Juice‐AMg‐B
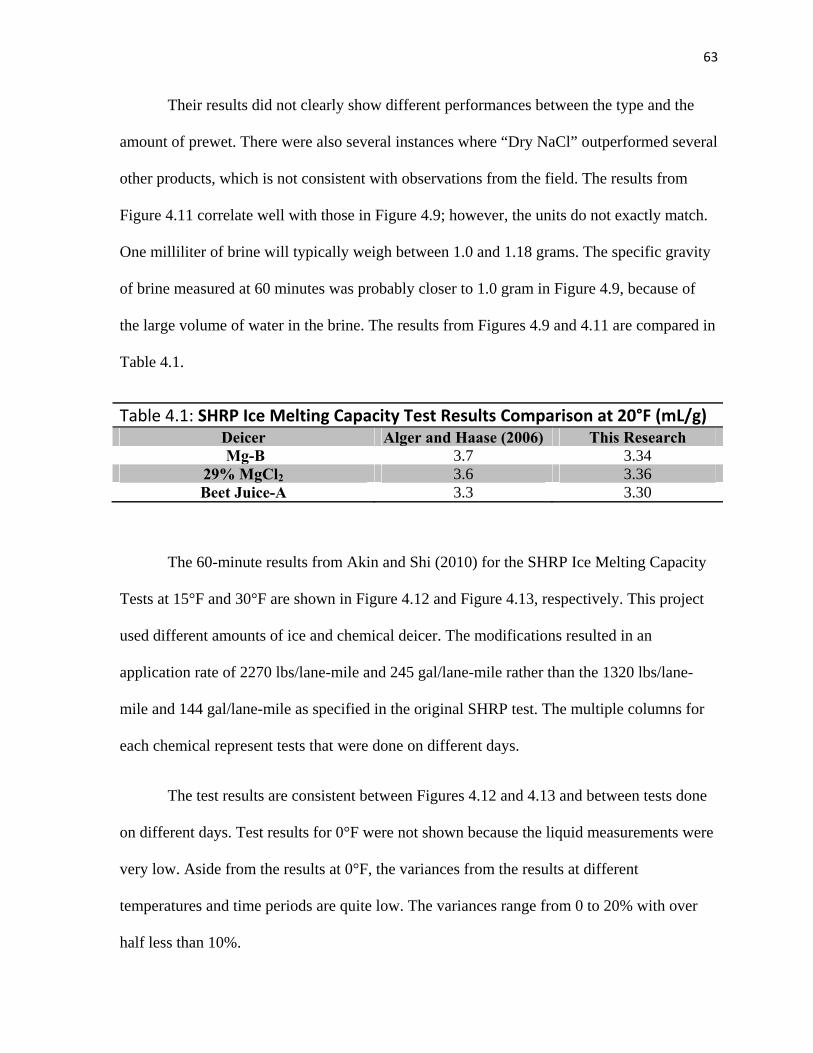
63
Their results did not clearly show different performances between the type and the
amount of prewet. There were also several instances where “Dry NaCl” outperformed several
other products, which is not consistent with observations from the field. The results from
Figure 4.11 correlate well with those in Figure 4.9; however, the units do not exactly match.
One milliliter of brine will typically weigh between 1.0 and 1.18 grams. The specific gravity
of brine measured at 60 minutes was probably closer to 1.0 gram in Figure 4.9, because of
the large volume of water in the brine. The results from Figures 4.9 and 4.11 are compared in
Table 4.1.
Table 4.1: SHRP Ice Melting Capacity Test Results Comparison at 20°F (mL/g)Deicer Alger and Haase (2006) This Research Mg-B 3.7 3.34
29% MgCl2 3.6 3.36 Beet Juice-A 3.3 3.30
The 60-minute results from Akin and Shi (2010) for the SHRP Ice Melting Capacity
Tests at 15°F and 30°F are shown in Figure 4.12 and Figure 4.13, respectively. This project
used different amounts of ice and chemical deicer. The modifications resulted in an
application rate of 2270 lbs/lane-mile and 245 gal/lane-mile rather than the 1320 lbs/lane-
mile and 144 gal/lane-mile as specified in the original SHRP test. The multiple columns for
each chemical represent tests that were done on different days.
The test results are consistent between Figures 4.12 and 4.13 and between tests done
on different days. Test results for 0°F were not shown because the liquid measurements were
very low. Aside from the results at 0°F, the variances from the results at different
temperatures and time periods are quite low. The variances range from 0 to 20% with over
half less than 10%.

64
One notable inconsistency between the data in Figure 4.12 and known outcomes from
the field is the performance of the solid sodium chloride at 15°F. Figure 4.12 shows the solid
sodium chloride to have better performance at 15°F than calcium chloride and magnesium
chloride, but reports from the field show sodium chloride to have lesser performance at this
temperature than the other two chemical deicers. Akin and Shi (2010) commented that the
test results for the solids at 15°F after 20 minutes of exposure correlated much better with
results from the field than the results at 60 minutes of exposure.
Figure 4.12: Modified SHRP Ice Melting Capacity 60‐Minute Test Results at 15°F (Akin
and Shi, 2010)
Figure 4.13: Modified SHRP Ice Melting Capacity 60‐Minute Test Results at 30°F (Akin
and Shi, 2010)

65
The 60-minute results from Shi et al. (2009) for the SHRP Ice Melting Capacity Tests
are shown in Figure 4.14. The sodium acetate (NAAC), Peak SF (sodium formate), Pink Salt,
and sodium chloride are all solid deicers. The magnesium chloride and IceBan are liquids.
These tests were performed in the same manner as the tests from Akin and Shi (2010).
The error bars show the variances to be reasonable for most of these tests. Figure 4.14
compares the ice melting capacities of solid sodium based products with liquid magnesium
chloride mixes. However, liquid and solid deicers should not be compared to each other in a
laboratory setting as they work differently in the field.
Figure 4.14: Modified SHRP Ice Melting Capacity Test Results at 60 Minutes (Shi et al., 2009)

66
The 60-minute results from Nixon et al. (2007) for the SHRP Ice Melting Capacity
Tests are shown in Figure 4.15, where several liquid deicers’ performances are compared.
“MB” represents mineral brine, a mix of different chloride bases. “IBU” represents IceBan
Ultra, a 25% magnesium chloride mix. They used 80mL of distilled water to form the ice
sheet and 5mL of liquid deicer per test, but the size of the Plexiglas test dish was not
reported.
One inconsistency shown in the data is that the performance at 0°F was better than
that at 10°F. In the field, sodium chloride is expected to become ineffective at 0°F and no
deicers are expected to perform better at lower temperatures. Another inconsistency is the
performance of the IceBan Ultra. The IceBan and the Mg-B have similar magnesium chloride
concentrations, but data showed they performed quite differently. Since IceBan is bio-
degradable, it is possible that the sample used for testing could have been a bad batch.
Figure 4.15: SHRP Ice Melting Capacity Test Results at 60 Minutes (Nixon et al., 2007)

67
Due to the many sources of error, it is evident that the SHRP Ice Melting Capacity
Test is not repeatable between different laboratories. Furthermore, the results from this test
often do not correlate with field observations.
4.2 Shaker Test
The Shaker Test has several advantages over the SHRP Ice Melting Capacity Test.
One advantage is that the test results are not affected by the size of the freezer. The freezer in
an upright refrigerator is large enough for testing. Another advantage is the Shaker Test is
able to produce repeatable results between laboratories. The use of this test by other
researchers will further confirm this observation. Also, the error caused by mixing liquid
deicers in the SHRP Test does not exist in the Shaker Test, as the deicers mix inside the
shaker and none of the precipitate is lost. Lastly, the procedure for the Shaker Test is simpler
and more flexible than that of the SHRP Ice Melting Capacity Test. The Shaker Test takes 10
minutes whereas the SHRP Ice Melting Capacity Test takes at least 20 minutes to produce
results. Many elements in a SHRP Ice Melting Capacity Test can be easily mishandled and
disrupt the results.
As part of the evaluation, several actions were taken during the procedure in an
attempt to disrupt the Shaker Test. These actions included: dropping the shaker and having
the lid fall off, shaking at different frequencies throughout the procedure, having the shaker
in different positions while shaking, and using different amounts of ice between tests. If the
lid is replaced quickly after its removal, it will not affect the results. The shaking frequency
does not have to be exact as long as it is close to the recommended frequency. The shaking
position does not seem to have an effect as long as the liquids do not become separated from

68
the solids. Always use the recommended number of ice cubes, however, the results will not
be significantly affected if the amounts of ice differ by less than 1 gram.
The test results for liquid deicers, solid deicers, and prewet road salt are presented
separately herein.
4.2.1 Test Results
One observation that pertained to all the tests was how the temperature inside the
shaker changed during the procedure. As shown in Figure 4.16, the temperature in the shaker
drops sharply while shaking and then rebounds to its original temperature. The temperature
drop is due to the ice melting reaction which absorbs the heat energy in the shaker. When the
ice stops melting, the temperature gradually returns to its original state.
4.2.1.1 Liquid Test Results
Nine different liquid deicers were evaluated at 20°F, 10°F, and 0°F. The effect of
mixing liquid deicers with salt brine was also evaluated for deicer/brine ratios of 15/85 and
Figure 4.16:
Temperature Change inside the
Shaker during the Shaker Test

69
50/50, although the effect of ratio was extensively evaluated for Beet Juice-A. The chemical
bases of the liquid deicers tested are sodium chloride, magnesium chloride, calcium chloride,
potassium acetate, and carbohydrate or “beet juice” mixes.
The results for liquid deicers are shown in Figures 4.17, 4.18, and 4.19. The
percentages at the top of each column represent the ratio of the indicated chemical deicer in
that particular mix. The standard deviation and variance are presented as a range on top of
each bar.
Figure 4.17: Shaker Test Liquid Results at 20°F
% Represents Deicer Mix Ratio, Each Bar Represents 3 Tests
K Ace Mg‐B Mg‐A Mg‐D Mg‐C CaCl2 Beet Beet Juice‐A Juice‐B

70
Figure 4.19: Shaker Test Liquid Results at 0°F
Figure 4.18: Shaker Test Liquid Results at 10°F
% Represents Deicer Mix Ratio, Each Bar Represents 3 Tests
% Represents Deicer Mix Ratio, Each Bar Represents 3 Tests
K Ace Mg‐B Mg‐A Mg‐D Mg‐C CaCl2 Beet Beet Juice‐A Juice‐B
K Ace Mg‐B Mg‐A Mg‐D Mg‐C CaCl2 Beet Beet
Juice‐A Juice‐B
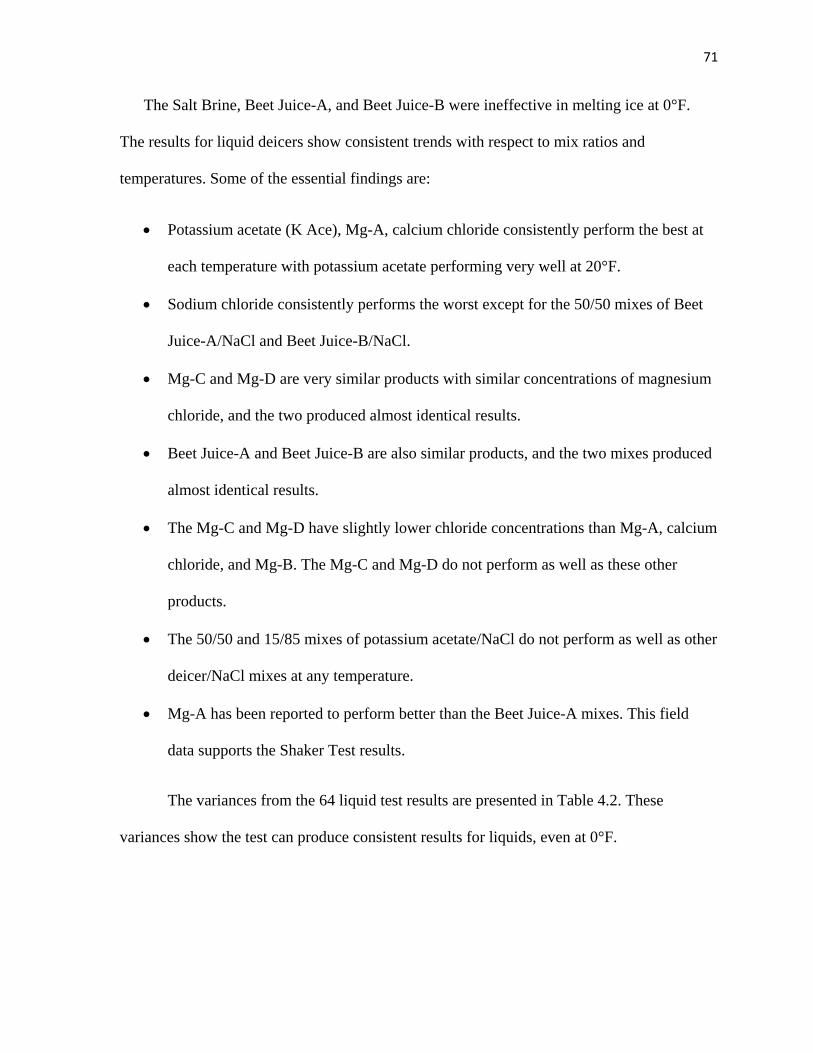
71
The Salt Brine, Beet Juice-A, and Beet Juice-B were ineffective in melting ice at 0°F.
The results for liquid deicers show consistent trends with respect to mix ratios and
temperatures. Some of the essential findings are:
Potassium acetate (K Ace), Mg-A, calcium chloride consistently perform the best at
each temperature with potassium acetate performing very well at 20°F.
Sodium chloride consistently performs the worst except for the 50/50 mixes of Beet
Juice-A/NaCl and Beet Juice-B/NaCl.
Mg-C and Mg-D are very similar products with similar concentrations of magnesium
chloride, and the two produced almost identical results.
Beet Juice-A and Beet Juice-B are also similar products, and the two mixes produced
almost identical results.
The Mg-C and Mg-D have slightly lower chloride concentrations than Mg-A, calcium
chloride, and Mg-B. The Mg-C and Mg-D do not perform as well as these other
products.
The 50/50 and 15/85 mixes of potassium acetate/NaCl do not perform as well as other
deicer/NaCl mixes at any temperature.
Mg-A has been reported to perform better than the Beet Juice-A mixes. This field
data supports the Shaker Test results.
The variances from the 64 liquid test results are presented in Table 4.2. These
variances show the test can produce consistent results for liquids, even at 0°F.

72
Table 4.2: Variances in Shaker Test Liquid Results (%) Deicer 20°F 10°F 0°F Sodium Chloride 1.77 3.27 NA 15/85 K Acetate/NaCl 1.15 3.75 11.21 50/50 K Acetate/NaCl 0.37 5.75 12.60 Potassium Acetate 1.56 3.40 3.19 15/85 Mg-B/NaCl 1.41 4.97 24.34 50/50 Mg-B/NaCl 5.67 4.29 3.88 Mg-B 2.09 3.17 3.11 15/85 Mg-A/NaCl 8.78 4.93 8.86 50/50 Mg-A/NaCl 2.79 4.07 1.93 Mg-A 4.86 1.41 5.56 15/85 Beet Juice-A/NaCl 3.38 3.28 NA 50/50 Beet Juice-A/NaCl 4.75 13.28 NA 15/85 Mg-D/NaCl 11.11 2.47 7.04 50/50 Mg-D/NaCl 1.09 2.91 13.78 Mg-D 4.46 1.71 4.17 15/85 Mg-C/NaCl 3.22 4.15 19.78 50/50 Mg-C/NaCl 1.47 2.11 1.70 Mg-C 6.62 2.62 0.99 15/85 CaCl2/NaCl 5.63 5.73 12.10 50/50 CaCl2/NaCl 2.63 4.88 5.29 Calcium Chloride 3.10 0.46 4.06 15/85 Beet Juice-B/NaCl 5.41 4.86 NA 50/50 Beet Juice-B/NaCl 1.37 5.38 NA
NA = Not Applicable
4.2.1.2 Solid Test Results
Only two solid chemical deicers, road salt and Pink Salt, were tested. Road salt is
solid sodium chloride and Pink Salt is an orange colored, finely graded solid made up mostly
of sodium chloride with small amounts of magnesium chloride, calcium chloride, and other
chemicals. Of the samples used for testing, the road salt had a gradation greater than 4.75
mm (#4 sieve) and the Pink Salt had a gradation smaller than 4.75 mm (#4 sieve). The results
are shown in Figure 4.20. Field observations have shown that Pink Salt performs better than
road salt. Both solids were passed through sieves so they have similar gradations before
testing.

73
Results from the Shaker Test showed the rock salt and the Pink Salt to have almost
identical ice melting capacities at 20°F and 10°F. The rock salt did not melt ice at 0°F, but
the Pink Salt did. It is unclear if this contrast at 0°F is a result of the different chemical
compositions or of the gradation of the Pink Salt. Similar gradations were used for both
chemicals, but while larger granules of road salt tend to be solid pieces, the larger granules of
Pink Salt tend to be smaller granules pressed together. These granules break apart during the
Shaker Test and finer particles make it more effective to melt ice at 0°F.
The results suggest smaller gradations melted ice more quickly than larger gradations.
Samples measuring 4 grams with a gradation of 2.38mm (#8 sieve) melted about 0.10 grams
of ice more than samples measuring 5 grams with a gradation of 4.75 mm (#4 sieve).
The variances from the solid test results are given in Table 4.3. These variances are
higher than those from the liquid results because of the variability of the solid materials.
Figure 4.20: Shaker Test Solid Results
Pink Salt
74
Table 4.3: Variances in Shaker Test Solid Results (%) Deicer 20°F 10°F 0°F Road Salt 11.06 6.72 NA Pink Salt 5.97 7.80 14.0
4.2.1.3 Prewet Road Salt Test Results
The results for the prewet road salt are not as consistent as the results for liquids or
dry solids. These inconsistencies are most likely caused by the preparation of the deicer
samples. For serviceability reasons, the samples of road salt were prewetted by placing them
in containers filled with a liquid deicer. The road salt could have stayed soaking in these
containers for several days. When the road salt was moved from the prewetting liquid to the
shaker, care was taken to leave as much liquid as possible in the container. This resulted in
road salt samples coated with an amount of liquid deicer that can be estimated, but cannot be
measured with certainty.
A better way to prepare the samples is to take a larger amount of road salt and prewet
with the equivalent of 8 gal/ton to mimic wetting at the stockpile. Once prewetting is
complete, smaller samples can be used for testing. This was not done because the amount of
road salt required was not available.
The results for prewet road salt are shown in Figures 4.21, and 4.22. The standard
deviation and variance are presented as a range on top of each bar. The potassium acetate (K
Ace) results are not shown in Figure 4.22 because a problem occurred during the prewet
process. The potassium acetate reacted with the road salt forming a pudding-like substance
shown in Figure 4.23.

75
Beet Juice-A and Beet Juice-B mixes showed different ice melting performance
between the prewet results and the liquid results. The data shows those mixes work much
better as a prewet than as a straight liquid deicer. The performance of the Beet Juice-A as a
Figure 4.21: Shaker Test Results for Prewet Road Salt at 10°F; each Bar Represents 3 Tests
Figure 4.22: Shaker Test Results for Prewet Road Salt at 0°F; each Bar Represents 3 Tests
Salt Brine K Ace Mg‐B Mg‐A Mg‐D Mg‐C CaCl2 Beet Beet Beet Juice‐B/
100% 100% 100% 100% 100% 100% 100% Juice‐A/ Juice‐A/ NaCl 15/85
NaCl NaCl
15/85 50/50
Salt Brine K Ace Mg‐B Mg‐A Mg‐D Mg‐C CaCl2 Beet Beet Beet Juice‐B/
100% 100% 100% 100% 100% 100% 100% Juice‐A/ Juice‐A/ NaCl 15/85
NaCl NaCl
15/85 50/50

76
prewet correlates with reports from the field in the State of Nebraska. Specifically, the prewet
results for the 50/50 mix of Beet Juice-A/NaCl outperforming the results for the 15/85 mix
correlates well with field reports. The performance of Beet Juice-A as a liquid mix does not
correlate with field reports, but it does correlate with data collected from the MDSS in the
State of Nebraska.
The prewet results at 10°F correlate well with the liquid results except for the Beet
Juice-A and Beet Juice-B mixes. The prewet results at 0°F do not correlate well with the
liquid results. Specifically, that the Mg-B performed better than the Mg-A is contrary to the
liquid results. Mg-C and Mg-D performed better than the Mg-A and the Mg-B, also being
contrary to the liquid results.
The variances from the 19 prewet test results are given in Table 4.4. These variances
and test results show the test can produce consistent results for prewet road salt at 10°F,
however, further development is needed to improve the results at 0°F.
Figure 4.23:
Potassium Acetate Reacted with Road Salt

77
Table 4.4: Variances in Shaker Test Prewet Results (%) Deicer 10°F 0°F Sodium Chloride 7.84 4.71 Potassium Acetate 3.68 NA Mg-B 9.07 3.36 Mg-A 4.60 6.52 15/85 Beet Juice-A/NaCl 7.63 12.39 50/50 Beet Juice-A/NaCl 6.98 13.89 Mg-D 4.76 4.44 Mg-C 22.55 19.77 Calcium Chloride 5.15 4.44 15/85 Beet Juice-B/NaCl 4.05 6.34
4.2.1.4 Beet Juice Results
Beet Juice-A mix ratios were extensively evaluated at 20°F. The results in Figure
4.24 show that the best results occurred at a ratio of 15/85 Beet Juice-A/NaCl. All other
chemical deicers used in this study produced the best results when not mixed with anything.
The best results of Beet Juice-A occurred at a ratio of 15/85 because of the stickiness of the
material. The Beet Juice-A and Beet Juice-B help the sodium chloride effectively stick to the
ice resulting in a greater ice melting capacity. Mixes with a higher ratio of Beet Juice-A or
Beet Juice-B do not perform as well because the advantage from the stickiness can no longer
compensate for the smaller amount of sodium chloride in the mix.

78
4.2.2 Sources of Error
The most significant error that affected the liquid, solid, and prewet road salt results is
the size of the ice cubes used for testing. The weight of a group of 10 ice cubes was different
from one test to the next. Tests that had very similar ice weights had very small variances.
The best way to minimize this error is to measure the water for the ice cubes as accurately as
possible and to use the cubes less than 24 hours after freezing.
The higher variances associated with the solid and the prewet road salt results are
likely a result of the solids themselves. Some samples of solid deicers, though equal in
Figure 4.24: Shaker Test Results for Beet Juice‐A Mixes at 20°F; Each Bar Represents 3 Tests
Salt Brine Beet Juice/ Beet Juice/ Beet Juice/ Beet Juice/ Beet Juice/ Beet Juice/
NaCl 10/90 NaCl 15/85 NaCl 20/80 NaCl 25/75 NaCl 50/50 NaCl 60/40

79
weight, may not contain the same amount of sodium chloride material. The angularity of the
solid granules may also contribute to the variance.
A source of error unique to the prewet road salt results is the effect of soaking the
solids in the prewet. The solids may have absorbed some prewet causing some samples to
have more prewet than others. The best way to minimize this error is to use a measured
amount of prewet similar to the application rate used in the field.
4.2.3 Test Evaluation
The results of the Shaker Test are promising. Liquid deicers were evaluated
extensively at different deicer/NaCl ratios. The liquid and solid deicers produced consistent
results with reasonable variances. More types of solids should be used in this test to further
confirm the solid results. The results for the prewet road salt were not as consistent at 0°F.
The prewet part of this test requires further study using a standardized prewetting procedure.
Limited testing with liquid deicers was performed at an auxiliary location to verify if
the results were reproducible. The freezer used at the auxiliary location was part of an upright
refrigerator. The freezer at the auxiliary location could not provide a temperature higher than
-2°F. The results from the two locations are compared in Figure 4.25.
Sodium chloride did not melt ice at either location. The results for the potassium
acetate are very similar. The results for the Mg-B and Mg-C were slightly lower at the
auxiliary location, probably due to the lower temperature in the freezer. Overall, the results
for these liquids from the different locations are similar. More tests should be performed at
different locations to further confirm the repeatability of the Shaker Test.

80
Much of the data from the Shaker Test correlates with reports from the field,
observations from the field, and with some of the data from the SHRP Ice Melting Capacity
Test. One example is how the magnesium chloride and the IceBan compare to each other in
Figure 4.14. Another example is how the calcium chloride, potassium acetate, and the Mg-B
compare to each other in Figure 4.15. These results correlate closely with the way how
similar liquid deicers performed in the Shaker Test. These results also correlate closely with
the way the Mg-C and Mg-D products compare to the other magnesium chloride products
from the Shaker Test.
The Shaker Test appears to produce results similar to that of the SHRP Ice Melting
Capacity Test without the need of a walk-in freezer. The results from the Shaker Test also
appear to correlate better with reports from the field in the State of Nebraska.
Figure 4.25: Repeatability of Shaker Test using Liquid Deicers
Salt Brine K Ace Mg‐B Mg‐C

81
4.3 Friction Test
The purpose of this test was to determine if liquid chemical deicers could cause
slippery conditions when applied to an ice covered roadway. These tests were done in a
walk-in freezer at 20±4°F. Only liquid deicers were used because the varying shape, size, and
hardness of solid deicers would have caused considerable variance in the results.
Figure 4.26 describes how the static and kinetic friction coefficients are determined
from the data. No force is applied when the load cell is initially activated. This occurs just
before tightening and just after loosening the nut. The applied force will increase as
tightening begins. The peak magnitude force occurs when static friction has been reached and
the sled has begun to move. The peak force is the value used to calculate the static friction
coefficient. The forces gradually decrease after the peak force as the sled is moving. The
average of these values is used to calculate the kinetic friction coefficient. The results of the
Friction Test are given in Table 4.5. Each value represents the average result of two tests.
Figure 4.26: Friction Force vs. Time

82
4.3.1 Test Results
The kinetic friction coefficient for rubber on wet concrete is published in many
engineering statics textbooks. The range is slightly lower than the coefficients measured in
testing. One probable cause is that the friction in the moving mechanical parts of the test
setup could have artificially increased the measured friction coefficients.
Table 4.5: Friction Test Results Static Friction Coef. (μs) Kinetic Friction Coef. (μk) Wet Concrete - Researched -- 0.45 - 0.75 Wet Concrete - Measured 0.873 ± 0.017 0.817 ± 0.028
Liquid Deicers: Final Results Sodium Chloride 0.755 ± 0.035 0.702 ± 0.022
Potassium Acetate 0.730 ± 0.056 0.654 ± 0.043 Mg-B 0.685 ± 0.007 0.647 ± 0.031Mg-A 0.845 ± 0.091 0.801 ± 0.067
Beet Juice/NaCl 15/85 0.705 ± 0.021 0.653 ± 0.040Mg-C 0.805 ± 0.049 0.740 ± 0.049Mg-D 0.740 ± 0.014 0.702 ± 0.050
Calcium Chloride 0.795 ± 0.007 0.753 ± 0.007
The results for the deicers are generally lower than the measured results for wet
concrete. None of the deicers produced slippery pavement conditions. Mg-A performed the
best, but also had the largest standard deviation. A mix of 50/50 Beet Juice-A/NaCl was used
in testing but produced relatively poor results because the mix was unable to melt all the ice.
The friction test results from Shi et al. (2009) using a tribometer and those from Alger
et al. (1994) using a SAAB friction tester are compared with results from this study in Table
4.6. The results from this research compare well with the results from the SAAB friction
tester.

83
Table 4.6: Friction Results ComparisonDeicer SAAB Tribometer Sled (This Research) Ice 0.3 0.5 0.45 NaCl NA 0.65 0.702 MgCl2 0.65 0.5 0.647 ( Mg-B) KAc 0.7 0.55 0.654 MgCl2 NA 0.2 0.702 (Mg-D)
4.3.2 Sources of Error
The primary source of error in this test was temperature changes. The temperature
stayed steady during the test, but could change as much as 8°F between tests. Other sources
include the friction that exists in the moving mechanical parts and the human error from
turning the nut.
The friction between the moving parts was probably consistent in all the tests because
the parts were well greased. This would still cause the deviation from the known values
shown in Table 4.5. The human error could be minimized by using an air ratchet or other
mechanism to turn the nut.
4.3.3 Test Evaluation
This version of the friction test has a complicated procedure and requires a walk-in
freezer. It may be more prudent to test a liquid deicer for potential fermentation, which can
produce slippery roadways. The easiest way to test for fermentation is to smell the liquid
deicer. If a product is suspected to cause slippery roadways without fermentation, it would be
more practical to use a British Pendulum Tester to confirm the friction coefficient. The
British Pendulum Tester is described in Chapter 2-Literature Review. It has a simpler
procedure, does not require electricity, and is designed for use in the field.

84
4.4 Sunlight Test
The purpose of this test was to confirm that the darker color of the Beet Juice and the
solid Pink Salt would enhance ice melting when exposed to direct sunlight. A typical result is
shown in Figure 4.27. The test was performed at 15°F and the photos illustrate the effects of
the deicers after 60 minutes. The labels along the side indicate the solid deicer used in that
row. The labels along the top represent the liquid deicer used in that column. The areas of
melted ice are circled in red.
The 50/50 mixes are darker than the 85/15 mixes. The shaded results do not show any
obvious differences between melted areas. The sunlit results show the melted area of the
50/50 mix + road salt is larger than that of the 85/15 mix + road salt. The sunlit results also
show the melted area of the 85/15 mix + Pink Salt is larger than that of the 85/15 mix + road
salt. These results were consistent with the results from another Sunlight Test performed at
20°F.
Figure 4.27:
Sunlight Test
Results

85
4.5 Refreeze Test
The purpose of the refreeze test was to determine the time elapsed between the
applications and refreezing for particular deicers. A sample of deicer is applied on an ice
sheet for a period of time. The resulting liquids are decanted from the ice surface for
measurement and then returned to the ice surface to continue testing. As the liquids begin to
refreeze, less liquid is able to be decanted and measured. This test can be used for liquid
deicers and solid deicers. Prewet solid deicers were used for testing, but did not yield useful
results.
4.5.1 Test Results
The same 9 deicers and mix ratios that were used in the Shaker Test were used in the
Refreeze Test. The temperature during the tests was 14 ± 2°F. Three tests were performed for
each deicer. The graphs of the Refreeze Test results are compiled in Appendix A.
4.5.1.1 Liquid Test Results
The results for the beet juice, 2 examples of magnesium chloride, and calcium
chloride are shown in Figures 4.28, 4.29, and 4.30. The percentage in each figure’s caption
represents the amount deicer is present in the deicer/salt brine mix. For example, a caption
“Beet Juice-B 15%” indicates a 15/85 mix of Beet Juice-B/salt brine. The data labeled “1st
Test” does not have a data point for 2 hours.
The results from three tests are presented in one graph and evaluated visually. It is
essential to look for the time instant where the peak amount of liquid was collected. The
refreeze time is estimated from the gradual decrease in the amount of liquid versus time.

86
Most of these results indicate the liquids begin to refreeze after 2 to 3 hours. These
results confirm the recommendation from Blackburn et al. (2004) to retreat areas every 1 ½
hours when using liquids below 20°F. This result holds true for all the liquid deicers except
for calcium chloride. The results for 100% calcium chloride do not clearly indicate a point of
refreeze in the 5-hour test period. This means calcium chloride has a refreeze time as long as
5 hours, much longer than the other deicers used in this test.
Figure 4.28: Refreeze Test Results for Agricultural Byproduct or “Beet Juice” Deicers

87
Figure 4.29: Refreeze Test Results for Magnesium Chloride Deicers

88
4.5.1.2 Solid Test Results
Road salt and Pink Salt were the solid deicers used in the Refreeze Test. They were
each used at 3 different gradations: 0.422 mm (#40 sieve), 0.841 mm (#20 sieve), and 2.38
mm (#8 sieve). The particle size is indicated on the graphs shown in Figure 4.31.
Figure 4.30:
Refreeze Test Results for Calcium
Chloride Deicer

89
The results from the refreeze test show the road salt and Pink Salt have almost
identical refreeze profiles at all three different gradation sizes. The results from the refreeze
test also showed the gradation size has a significant effect on the refreeze time. Samples with
Figure 4.31: Refreeze Test Results for Solid Deicers

90
gradations smaller than 0.422 mm (#40 sieve) began to refreeze almost immediately.
Samples with a larger gradation of about 2.38 mm (#8 sieve) began to refreeze after two
hours. The samples with a 0.841 mm (#20 sieve) gradation appear to being refreezing at 2
hours, but begin to rebound at 4 hours. This could be due to the solids begun to dissolve into
smaller particles and then dispersed more evenly onto the ice.
4.5.2 Sources of Error
The primary source of error is from the liquid measurements. It was easy to misread
the measurements by ±0.1 mL. A way to eliminate this error would be to use smaller
syringes, say 2.0 mL, for the liquid measurements. Other errors include conditions inside the
freezer. The inconsistent temperature and humidity between tests is probably what caused
much of the variation. Those errors did not exist for the solid deicer results because they
were all performed at the same time.
4.5.3 Test Evaluation
The Refreeze Test did not produce completely consistent results, but was functional
enough to discover some interesting information about calcium chloride and the gradation of
solid deicers. It is a lengthy test, but much of that time is spent waiting for the ice to melt.
Although the Refreeze Test was performed in a walk-in freezer for this project, the test could
be adapted for use in a smaller freezer. The refreeze test shows the potential to become a
cost-effective screening test for deicers, but further development to produce consistent results
is necessary.

91
Chapter 5
Field Data Results and Correlation
The field data was collected by plow trucks equipped with Automatic Vehicle
Location Systems (AVL) along with the Maintenance Decision Support System (MDSS)
managed by Meridian Environmental Technology. The systems record real time information
including vehicle location, amount of material being used per lane-mile, and pictures of the
roadway condition taken from the cab of the truck. The MDSS collects weather data for
specific routes from different weather stations across several states. Important weather data
includes air temperature, roadway temperature, wind speed, type and amount of precipitation,
and pictures from roadside cameras. This data is used to classify different storms and to
decide roadway maintenance actions.
The maintenance actions performed and results during the storms are analyzed and, if
possible, compared to different maintenance actions performed and results in similar storms.
Different storms are grouped by temperature, wind speed, and type of precipitation. An
analysis consists of confirming the type and amount of chemical deicer used on a particular
route and looking at the pictures from the cab to see how treatment affected the level of
service on that roadway.
A particular route must meet a certain criteria before it can be analyzed. The route can
only have one truck treating the roadway, since not all trucks are equipped with AVL. There
must be several good pictures from the route, either from the cab or a stationary roadside
camera. At the moment, only the storms during daylight hours are used because the quality of
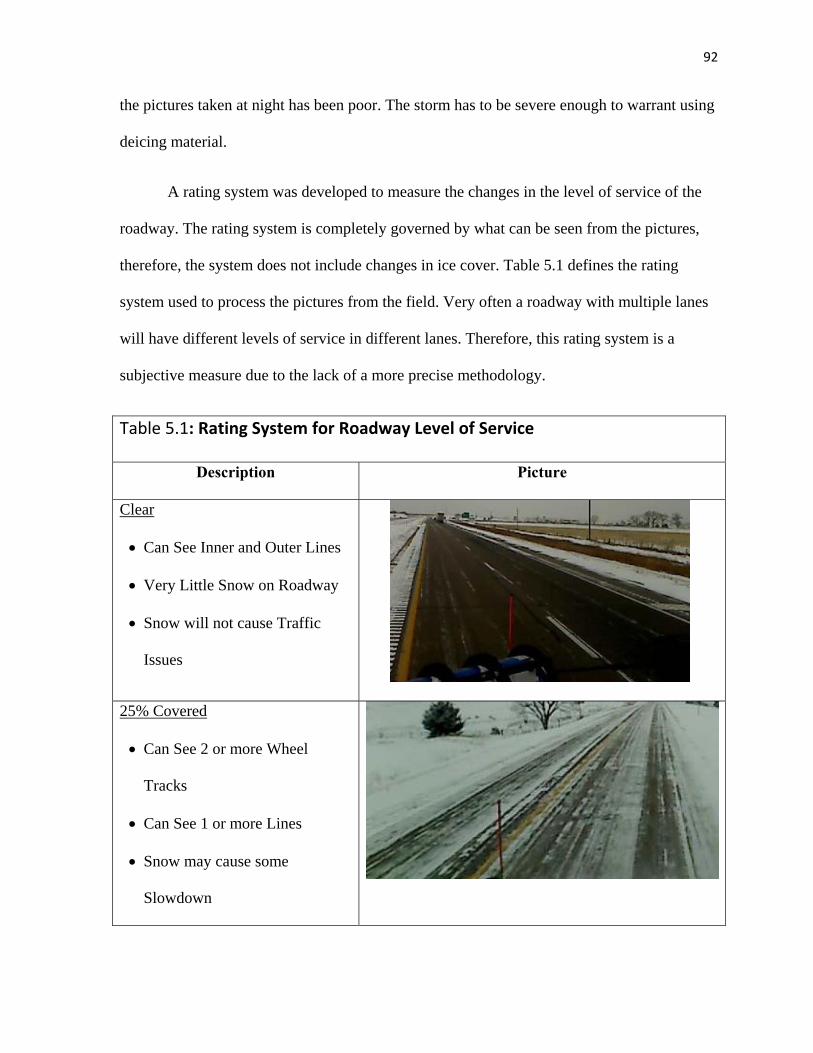
92
the pictures taken at night has been poor. The storm has to be severe enough to warrant using
deicing material.
A rating system was developed to measure the changes in the level of service of the
roadway. The rating system is completely governed by what can be seen from the pictures,
therefore, the system does not include changes in ice cover. Table 5.1 defines the rating
system used to process the pictures from the field. Very often a roadway with multiple lanes
will have different levels of service in different lanes. Therefore, this rating system is a
subjective measure due to the lack of a more precise methodology.
Table 5.1: Rating System for Roadway Level of Service
Description Picture
Clear
Can See Inner and Outer Lines
Very Little Snow on Roadway
Snow will not cause Traffic
Issues
25% Covered
Can See 2 or more Wheel
Tracks
Can See 1 or more Lines
Snow may cause some
Slowdown

93
50% Covered
Can See 2 Wheel Tracks
Cannot See Lines
Snow will cause Difficulty
when Changing Lanes
75% Covered
Can See Some of the Dark
Colored Roadway
Cannot See 2 Defined,
Continuous Wheel Tracks
100% Covered
Cannot See the Roadway

94
Table 5.2: Mg‐A and Beet Juice‐A Comparison7:05am Time 6:15am Mg-A 60 gal/ln-mi
Deicer App. Rate
30/70 Beet Juice-A/NaCl 50 gal/ln-mi
1.4in Snow
Cumulative Precipitation
0.5in Snow
2°F Air Temp. 15°F 7°F Road Temp 21°F 10mph Winds 11mph
02/24/11 Date 01/19/11
US-26 Location US-385
1:35pm Time 1:06pm Mg-A 180 gal/ln-mi
Deicer App. Rate
30/70 Beet Juice-A/NaCl 300 gal/ln-mi
1.9in Snow
Cumulative Precipitation
1.0in Snow
7°F Air Temp. 14°F 16°F Road Temp 20°F 11mph Winds 11mph
02/24/11 Date 01/19/11
US-26 Location US-385
94

95
Table 5.2 is a comparison of the Mg-A deicer (left) and a 30/70 mix of Beet Juice-
A/NaCl (right). The pictures on the left were taken by a stationary camera. The pictures on
the right were taken by a plow truck near the same location marked by the motel sign in both
pictures.
This comparison shows the Mg-A transforming the roadway from 100% covered to 0-
25% covered in 6 ½ hours. The Beet Juice mix does not appear to have melted snow after
about 7 hours. The roadway treated by the Mg-A had an average daily traffic (ADT) count of
4996 for the month of February, much busier than the roadway treated by the Beet Juice mix
which had an ADT count of 1735 for the month of January. Hence, traffic may have played
an important role. The weather seen in the pictures of the Beet Juice treatment is more
overcast than that seen in the pictures of the Mg-A treatment. Nevertheless, this comparison
shows that Mg-A significantly outperformed the 30/70 Beet Juice/NaCl at lower
temperatures and with more snow. The results correlate with the performance comparison
between the two deicers from the Shaker Test.

96
Table 5.3: Beet Juice‐A Comparison8:14am Time 10:32am 30/70 Beet Juice-A/ NaCl 340 gal/ln-mi
Deicer App. Rate
30/70 Beet Juice-A/ NaCl 340 gal/ln-mi
1.1in Snow
Cumulative Precipitation
1.1in Snow
5°F Air Temp. 9°F 10°F Road Temp 14°F 11mph Winds 7mph
01/20/11 Date 01/20/11
US-385 Location US-385
Table 5.4: Road Salt Comparison: High Winds1:06p Time 2:17p Road Salt 141 lbs/ln-mi
Deicer App. Rate
Road Salt 241 lbs/ln-mi
2.3in Snow Cumulative Precipitation
2.6in Snow
14°F Air Temp. 12°F 15°F Road Temp 14°F 25mph Winds 27mph 02/01/11 Date 02/01/11 Hwy-34 Location Hwy-34
96

97
Table 5.3 is a comparison of the 30/70 Beet Juice-A/NaCl just before daylight (left)
and on a sunny day about 2 hours later (right). The pictures are not taken at exactly the same
location, but they are within 2 to 3 miles from each other. The pictures in Table 5.3 are also
within 10 miles of the pictures from the previous day shown in Table 5.2 on the right.
The pictures from Table 5.2 and from the left in Table 5.3 show limited snow melting
was made by the deicer mix when there was little daylight; the roadway went from 100%
covered to 75-100% covered. The picture on the right in Table 5.3 show significant melting
after 2 hours of direct sunlight, even though the temperature was lower than the previous day.
These comparisons suggest direct sunlight can enhance the ice melting capacity of the 30/70
Beet Juice/NaCl mix, which has dark color to absorb heat from solar radiation.
Table 5.4 demonstrates how significant winds can affect the treatment process. These
pictures were taken by a plow truck near the same location marked by the trees that can be
seen in the top right corners of both pictures. The right lane shows little improvement after
71 minutes, but the level of service of the left lane has deteriorated. The road salt is not
effective because of the wind and the melting may cause more snow to stick to the roadway.
This data confirms the findings from Blackburn et al. (2004), Ketcham et al. (1996), and
CTC & Associates LLC (2009) that wind speeds above 15 mph could inhibit winter
maintenance operations.

98
Table 5.5: 10/90 Beet Juice‐A/NaCl Mix: High WindsTime 8:34am
Date 01/31/11 Deicer App. Rate
10/90 Beet Juice-A/NaCl 70gal/ln-mi
Cumulative Precipitation
0.1in Frost
Air Temp. 16°F Road Temp 18°F
Winds 11mph
Location Hwy-275
Time 3:23pm
Date 01/31/11
Deicer App. Rate
10/90 Beet Juice-A/NaCl 140gal/ln-mi
Cumulative Precipitation
0.5in Snow
Air Temp. 9°F
Road Temp 12°F
Winds 22mph
Location Hwy-275
Time 11:08am Date 02/01/11 Deicer App. Rate
10/90 Beet Juice-A/NaCl 140gal/ln-mi
Cumulative Precipitation
2.1in Snow
Air Temp. 3°F Road Temp 8°F Winds 22mph Location Hwy-275
Time 9:56am Date 02/02/11 Deicer App. Rate
10/90 Beet Juice-A/NaCl 140gal/ln-mi
Cumulative Precipitation
2.6in Snow
Air Temp. 0°F Road Temp 8°F Winds 17mph Location Hwy-275

99
Table 5.5 is a comparison of the 10/90 Beet Juice-A/NaCl over a 3-day period. The
top 3 pictures were taken at the same location marked by the tree line in the pictures. The
picture at the bottom was not taken at the same location but within 2 to 3 miles from the
others. The top picture was taken at 8:34am, the beginning of the observation. It shows a
blurry but clear road. The roadway was reported to have a thin layer of frost and a wind
speed of 11mph. The Beet Juice-A/NaCl mix was used to treat the frost.
By 3:23pm, a 1/2-inch of snow has fallen and the wind speed has increased to 22mph.
The picture shows snow blowing across and sticking to the roadway. Snow sticking to the
roadway at this wind speed means the roadway was still wet from the earlier treatment and
was detrimental to the roadway’s level of service.
At 11:08am the next day, a total of 2.1 inches of snow had fallen and roadway was
reportedly clear. The picture shows the snow blowing across the roadway but was not
sticking to the roadway. The roadway dried out sometime between 7 and 14 hours after the
application, even with continuous precipitation. It is possible that the high wind had played a
role in drying the roadway.
At 9:58am on the third day, the storm was over and the roadway was clear and
appeared to be dry. The roadway was at the best level of service because the wind kept snow
from accumulating on the road and the maintenance crews were able to keep snow drifts
under control. The results from Table 5.5 contrast with the results from Table 5.4 because far
less ice melting materials were used on the roadway in Table 5.5 than the roadway in Table
5.4. This comparison indicates using deicers during a blowing snow scenario can cause snow
to stick to the roadway and result in a lower level of

100
service (Blackburn et al., 2004; Ketcham et al., 1996; CTC & Associates LLC, 2009).
Table 5.6: Liquid Sodium Chloride Comparison at Low Temperatures Time 8:08am
Date 01/23/11 Deicer App. Rate
NaCl 150gal/ln-mi
Cumulative Precipitation
2.7in Snow
Air Temp. -9°F Road Temp 0°F
Winds 5mph
Location Hwy-275
Time 9:47am
Date 01/23/11
Deicer App. Rate
NaCl 200gal/ln-mi
Cumulative Precipitation
2.7in Snow
Air Temp. -9°F
Road Temp 3°F
Winds 3mph
Location Hwy-275
Time 12:02pm Date 01/23/11 Deicer App. Rate
NaCl 300gal/ln-mi
Cumulative Precipitation
2.7in Snow
Air Temp. -3°F Road Temp 18°F Winds 4mph Location Hwy-275
Time 1:23pm Date 01/23/11 Deicer App. Rate
NaCl 350gal/ln-mi
Cumulative Precipitation
2.7in Snow
Air Temp. -1°F Road Temp 20°F Winds 5mph Location Hwy-275
101
Table 5.6 is a comparison of the liquid sodium chloride over a single day. The top 2
pictures are taken at the same location. The bottom 2 pictures were not taken at the same
location, but are within 2 to 3 miles of the others. All the snow fell the previous evening and
there is no precipitation during the observation.
The plow began working on this route at 4:30am, so at 8:08am when the top picture
was taken, the roadway has been exposed to the sodium chloride for 3 ½ hours and was still
100% covered. This observation correlates with data from the Shaker Test that shows liquid
sodium chloride melting little to no ice at 0°F.
At 9:47am, the roadway has gone from 100% covered to 75%-100% covered. The
liquid sodium chloride has made little progress after 99 minutes of further treatment even
with total application of 200 gal/lane-mile. This observation correlates with the rule-of-
thumb that sodium chloride does not work well at temperatures lower than 18°F.
The roadway temperature begins to rise quickly between 11am and 12pm because of
sunlight exposure. At 12:02pm, the roadway temperature is 18°F and the roadway has gone
from 75%-100% covered to 50% covered. 81 minutes later, at 1:23pm, the roadway is almost
clear. This observation also correlates with the 18°F rule-of-thumb mentioned above.

102
Table 5.7: Liquid Sodium Chloride Comparison
12:47p Time 3:18p
NaCl 44gal/ln-mi
Deicer App. Rate
NaCl 44gal/ln-mi
0.3in Snow
Cumulative Precipitation
0.4in Snow
25°F Air Temp. 25°F 25°F Road Temp 25°F 13mph Winds 15mph 02/24/11 Date 02/24/11 US-6 Location US-6
Table 5.8: Road Salt Prewet with 5gal/ton MgCl2 Comparison
8:09am Time 10:47am
None Deicer App. Rate
NaCl 200lbs/ln-mi
0.5in Snow
Cumulative Precipitation
0.9in Snow
18°F Air Temp. 20°F 20°F Road Temp 23°F 9mph Winds 11mph 01/09/11 Date 01/09/11 Hwy 2 Location Hwy 2
102

103
Table 5.7 is a before and after comparison of liquid sodium chloride. The pictures are
not taken at exactly the same location, but they are within 2 to 3 miles from each other. Less
than ½-inch of snow falls from this storm, but wind speeds are at or just below 15mph, the
speed indicated by Blackburn et al. (2004), Ketcham et al. (1996), and CTC & Associates
LLC (2009) that begins to cause problems with blowing snow.
The roadway condition went from 25%-50% covered to clear in 2-1/2 hours. It
demonstrates how effective liquid sodium chloride can be at 25°F, even with 15mph wind.
The wind speed at or below 15mph did not cause problems with blowing snow, however,
there was little snowfall in this storm.
Table 5.8 is a before and after comparison of road salt prewet with 5gal/ton of MgCl2.
The pictures were taken from the plow truck at the same location. The roadway condition
went from 100% covered to 25%-50% covered in about 2-1/2 hours. The lane shown in the
pictures was a turning lane, which means it was very likely the snow on that lane had been
compacted. This comparison shows how effective the solid deicer was at penetrating
snowpack, but an observation with a liquid deicer on snowpack is also needed for
confirmation.

104
Table 5.9: A Storm producing High Volume of Snow
Time 5:19 pm
Date 01/09/11 Deicer App. Rate
NaCl 150 gal/ln-mi
Cumulative Precipitation
3.5 in. Snow
Air Temp. 20°F Road Temp 20°F
Winds 13 mph
Location Hwy-32
Time 9:17am
Date 01/10/11
Deicer App. Rate
No Application Since the 9th
Cumulative Precipitation
8.3 in. Snow
Air Temp. 21°F
Road Temp 18°F
Winds 6 mph
Location Hwy-32
Time 4:09 pm Date 01/10/11 Deicer App. Rate
No Application Since the 9th
Cumulative Precipitation
9.1 in. Snow
Air Temp. 23°F Road Temp 20°F Winds 12 mph Location Hwy-32
Time 9:24am Date 01/11/11 Deicer App. Rate
No Application Since the 9th
Cumulative Precipitation
10.0 in. Snow
Air Temp. 4°F Road Temp 4°F Winds 15 mph Location Hwy-32

105
Table 5.9 is an observation of the methods used to remove high volumes of snow
from the roadway. The pictures were taken at different locations within 2 to 3 miles of each
other along the route. The storm produced 10 inches of snow with 6.5 inches falling
throughout the observation. A total of 150 gal/lane-mile of liquid sodium chloride had been
applied on the roadway the morning of January 9th, before the observation was made. Most of
the snow fell between 5:00 pm January 9th and 12:00 pm January 10th. The sodium chloride
was probably diluted by the snow to render ineffective.
The pictures taken at 9:17 am and 4:09 pm on January 10th showed the roadway going
from 100% covered to near 50% covered just with plowing the roadway. The picture taken
the next day at 9:24 am still shows the roadway to be about 50% covered. This observation
shows that plowing can improve the level of service of a roadway from 100% covered to
50% covered, but does not facilitate further improvement. Once part of the pavement is
exposed, direct sunlight can heat the pavement and melt the rest of the snow on the roadway.
In this case, direct sunlight was not available at the critical point on January 10th when the
snow stopped at 12:00 pm and before high wind started at about 5:00 pm. Additional deicing
chemical could have been applied during this timeframe to clear the roadway.
Winter 2010 was the first season the Nebraska Department of Roads used the AVL
and the MDSS to record field data. The system did very well at recording vehicle location
and weather data, but data were missing regarding the type and amount of deicer used during
an event. As a result, large amounts of MDSS data could not be used for the correlation
studies. To address this issue in future operations, the districts should document the deicers’
usage and the application rate manually as a backup for the AVL and MDSS data.

106
Chapter 6
Conclusions and Recommendations
This chapter summarizes the essential findings and proposed practices for each
chemical deicer studied. Table 6.1 shows the results of the Shaker Test for the liquid
chemical deicers used in this research. The numbers shown for each chemical at 20°F, 10°F,
and 0°F are the grams of ice melted per milliliter of deicer. The best way to use these results
is to compare the deicers to each other. The table is only showing the results for the 15/85
optimum ratios for Beet Juice-A and Beet Juice-B. Results for the solid chemical deicers will
be discussed separately.
Table 6.1: Shaker Test Results for Liquids (Grams of Ice Melted per mL of Deicer) Product Chemical Base 20°F 10°F 0°F Mg-A 29% Magnesium Chloride 1.065 0.91 0.667 Calcium Chloride 30% Calcium Chloride and “Beet Juice”
Byproduct 1.051 0.898 0.704
Potassium Acetate 49% Potassium Acetate 1.405 0.868 0.656 Mg-B 30% Magnesium Chloride 1.062 0.781 0.553 Mg-C 26.9% Magnesium Chloride and
Carbohydrate Byproduct 0.978 0.736 0.577
Mg-D 25% Magnesium Chloride and Carbohydrate Byproduct
0.969 0.675 0.546
Beet Juice-B/NaCl 15/85
15/85 Mix of “Beet Juice” Byproduct/23% NaCl
0.652 0.359 0.0
Beet Juice-A/NaCl 15/85
15/85 Mix of “Beet Juice” Byproduct/23% NaCl
0.636 0.326 0.0
Sodium Chloride 23% Sodium Chloride 0.595 0.302 0.0
6.1 Sodium Chloride
Sodium chloride (NaCl) in its liquid and solid forms has been used in roadway winter
maintenance for many decades. It has been used for so long because the material is readily

107
available and relatively inexpensive, but the material is corrosive and has an adverse impact
on the environment. It also becomes much less effective below 18°F when large quantities of
sodium chloride are required at lower temperatures.
Sodium chloride is known to corrode steel on vehicles, bridge components, roadside
signs, and other apparatus. Many industries have found ways around this problem by using
stainless or galvanized steel. Many new bridge designs use concrete girders rather than steel
girders. However, much of the existing infrastructure still deteriorates rapidly due to the
corrosive effects of sodium chloride.
Major environmental concerns include sodium chloride contamination in the soil and
waterways. Sodium chloride build-up in soil can make the soil less cohesive and cause
difficulties for plant growth. High sodium chloride concentrations in the waterways can
destroy the ecosystem by depleting oxygen in the water (Schueler et al., 2009). In Canada,
the sodium chloride build-up in local water supplies has caused heavy metals leaching into
drinking water.
In recent years many winter maintenance organizations have begun to use other
chlorides and acetates in an attempt to reduce the amount of deicing chemicals dispensed.
Learning how to use deicing chemicals more effectively will have positive results for the
environment, the winter maintenance budget, and maintenance assets vulnerable to corrosion.
6.2 Magnesium Chloride
Magnesium chloride mixes are widely used in the State of Nebraska. This research
studied four magnesium chloride mixes: Mg-B, Mg-A, Mg-C, and Mg-D.

108
The Mg-C and Mg-D products are very similar to each other. Both chemicals have
settling solids and are byproducts of the ethanol industry. There have been some problems
reported with similar products in the State of Nebraska and from the Maine Department of
Transportation. It has been reported that these magnesium chloride products may
significantly decrease the roadway friction after treatment, however, the results from the
Friction Test show neither product has a more detrimental effect to roadway friction than the
other chemical deicers tested. Mg-C and Mg-D products are prone to ferment. If the
fermentation was left unchecked, the product could cause slick roadways.
The Mg-C and Mg-D products had a similar performance in the Shaker Test, but were
consistently outperformed by Mg-A and Mg-B at 20°F and 10°F. The magnesium chloride
products did not have more prolonged refreeze times than other chemical deicers. The
Friction Test results showed the Mg-A, Mg-C, and the Mg-D products to have comparable
friction coefficients to the other chemical deicers, while Mg-B had lower roadway friction
than the other chemical deicers.
6.3 Calcium Chloride
Calcium chloride is a liquid chemical deicer. It was the only calcium chloride product
tested in this research. It is a 30% calcium chloride mix in a “beet juice” solution. The “beet
juice” solution makes the product very dark in color and very sticky. These traits will be
discussed more in the section on “beet juice” solutions.
Mg-A, potassium acetate, and calcium chloride had comparable ice melting capacities
in the Shaker Test, with potassium acetate being exceptional at 20°F. The results from the
Friction Test showed calcium chloride would not cause slippery roadway surfaces.

109
The calcium chloride showed a clear advantage over all the other chemical deicers in
the Refreeze Test. While as most of deicers and deicer/NaCl mixes had refreeze times of 2
hours or less, the refreeze time of calcium was longer than the allotted test time of 4-5 hours.
The refreeze results from the Beet Juice products suggest the extraordinary refreeze time of
calcium chloride was due to the calcium chloride, not the “beet juice.”
Observations of calcium chloride during testing suggest this product is corrosive to
stainless steel. It was not an objective of this research to determine the corrosiveness of the
chemical deicers, but the effect was very pronounced. Small spills or incidental drops of
calcium chloride would begin to rust stainless table tops after one or two days, even if they
had been wiped clean.
The results from the Shaker Test show calcium chloride had similar performance to
magnesium chloride chemical deicers. The results from the Refreeze Test show the calcium
chloride has a refreeze time possibly longer than 5 hours. These results suggest using a
calcium chloride product on a roadway just before sunset or temperature drops may prevent
the refreezing of liquids on the roadway
6.4 Potassium Acetate
The Nebraska Department of Roads uses potassium acetate exclusively for the
treatment of bridges because it is believed to have less corrosive effect to the environment. It
is only used on bridges also because of the high cost of the material. Although it is not
usually done in Nebraska, it has been proposed to mix potassium acetate with sodium
chloride or another chemical deicer to reduce the overall cost.

110
This research discovered mixing potassium acetate with sodium chloride was a futile
exercise. When used in the Shaker Test, the potassium acetate melted about twice as much
ice as sodium chloride at 20°F and almost three times as much at 10°F. But, a 50/50 mix of
sodium chloride and potassium acetate would melt an amount ice only slightly higher than
that of the sodium chloride by itself.
The mixing of these two liquid chemicals would also produce large amounts of solid
precipitate. Using potassium chloride as a prewet for road salt also produced a jelly-like
precipitate on the salt. The amount of precipitate produced by mixing with either solid or
liquid sodium chloride could potentially clog the mechanisms on certain distribution systems.
The results from the Refreeze Test did not show the refreeze time of potassium
acetate to have any advantage over the other chemical deicers. The results from the Friction
Test showed potassium acetate to have a slightly more detrimental effect on roadway friction
than the other chemical deicers.
As a result of these findings, potassium acetate should not be mixed with other solid
or liquid chemical deicers.
6.5 Calcium-Magnesium Acetate
Calcium-magnesium acetate (CMA) was not used for this research because of the
known performance issues associated with this chemical deicer (Blackburn et al., 2004; EPA,
1999; Shi et al., 2004). It requires much larger amounts of CMA than sodium chloride to
achieve the same level of service.

111
Many winter maintenance organizations use calcium-magnesium acetate because it is
believed to have very few environmental effects. However, this chemical is commonly
known to have poor performance in the field and test results from Nixon et al. (2007) and Shi
et al. (2009) show CMA to have less performance than sodium chloride and many other
deicers. CMA is more expensive than sodium chloride by a factor of 10-20 (Schueler et al.,
1999).
Many departments attempt to compensate for this chemical’s poor performance by
using much more of the chemical, which causes concern about its unknown environmental
effects.
6.6 Carbohydrate or “Beet Juice” Solutions
Beet Juice-A and Beet Juice-B are byproducts of the beet industry. They are very
dark colored, almost black, and very sticky. These chemicals tend to seep through the small
spaces around the lids and through the plastic seem of the containers.
These kinds of chemicals should be classified as a performance enhancer, rather than
a deicer. The results from the SHRP Ice Melting Capacity Test and the liquid results from the
Shaker Test show these chemicals do not have a significant ice melting capacity when used
alone. Field reports tend to support these test results especially on days without direct
sunlight. The manufacturers recommend mixing this chemical with sodium chloride, usually
at a ratio of 15/85 beet juice solution/sodium chloride.
The liquid results from the Shaker Test show mixes of 15/85 Beet Juice-A/NaCl and
15/85 Beet Juice-B/NaCl performed slightly better than sodium chloride alone. However,
mixes of 50/50 Beet Juice-A/NaCl and 50/50 Beet Juice-B/NaCl performed slightly worse

112
than sodium chloride, as shown in Figure 4.24 in Chapter 4. Although Figure 4.24 only
shows results for liquids at 20°F, the results for 15/85 and 50/50 mixes of Beet Juice-A/NaCl
and Beet Juice-B/NaCl had the same distribution in the liquid tests at 10°F and 0°F.
The liquid test results from the Beet Juice-A and Beet Juice-B show the best results
occurring at a ratio of 15/85 while all other chemical deicers used in this study produced the
best results when not mixed with salt brine. The best results occur at a ratio of 15/85 because
of the optimum concentration of these materials. The Beet Juice-A and Beet Juice-B help the
sodium chloride stick to the ice more efficiently, resulting in a greater ice melting capacity.
Mixes with a higher ratio of Beet Juice-A or Beet Juice-B do not perform as well because the
advantage from the stickiness can no longer compensate for the smaller amount of sodium
chloride in the mix.
The results from the Shaker Test for prewet road salt suggest a prewet of a 50/50 mix
of Beet Juice-A/NaCl produced a better performance than a prewet of a 15/85 mix of Beet
Juice-A/NaCl at a temperature of 10°F. The results from the two mix ratios were about the
same at 0°F. More research is needed to make the prewet results of the Shaker Test more
consistent, but these results do corroborate the field performance of prewet mixes of Beet
Juice-A.
The dark color of these chemicals offers an advantage in direct sunlight. The
performance of Beet Juice-A mixes improves drastically when exposed to sunlight. The
Sunlight Test was developed specifically to study the effect of the darker color. For instance,
a 50/50 mix of Beet Juice-A/NaCl clearly outperformed a 15/85 mix of Beet Juice-A/NaCl,

113
as shown in Figure 6.1. Beet Juice-A and sodium chloride were the only liquid deicers used
in the Sunlight Test.
The area on the left was treated with road salt prewet with a 50/50 mix of Beet Juice-
A/NaCl. The area on the right was treated with road salt prewet with a 15/85 mix of Beet
Juice-A/NaCl. The area encircled in red depicts the sections of ice melted by the deicer. Both
areas had the same amount of road salt and prewet. The encircled area on the left is clearly
larger than the encircled area on the right.
The results of this research suggest Beet Juice-A and similar products are not
chemical deicers but rather chemical performance enhancers. These products must always be
mixed with a chloride, acetate, or another chemical deicer. When used as a liquid treatment
with sodium chloride, the ratio for the best performance is 15/85 chemical/NaCl. This is also
the ratio suggested by the manufacturers of Beet Juice-A.
Results from the Shaker Test and the Sunlight Test suggest liquid mixes used as a
prewet for road salt may have a better performance with greater amounts of Beet Juice-A.
Figure 6.1: Sunlight Test Results

114
Direct sunlight may also give these products an advantage because of their darker color.
Also, the stickiness of these chemicals is advantageous to any anti-icing activities because
they help the deicers stick to the road.
6.7 Solid Chemical Deicers
Two solid chemical deicers, road salt and Pink Salt, were studied in this research.
Road salt is solid sodium chloride and Pink Salt is an orange colored, finely graded solid,
mostly made of sodium chloride with small amounts of magnesium chloride, calcium
chloride, and other chemicals. Field observations have shown Pink Salt to perform better
than road salt. Both solids were used in the Shaker Test, Sunlight Test, and Refreeze Test.
Both solids were passed through sieves so their performance could be compared at the same
gradation.
Results from the Shaker Test showed the rock salt and the Pink Salt to have almost
identical ice melting capacities at 20°F and 10°F. The rock salt was ineffective at 0°F, but the
Pink Salt was effective. It is unclear if this contrast at 0°F is a result of the chemical
composition or due to the gradation of the Pink Salt. Even though similar gradations were
used for both chemicals, larger granules of road salt tend to be solid pieces, while larger
granules of Pink Salt tend to be smaller granules pressed together. These granules broke apart
during the Shaker Test and were able to perform at 0°F.
Smaller gradations may perform more quickly than larger gradations. Samples
measuring 4 grams with a gradation of 2.38 mm (#8 sieve) melted about 0.10 more grams of
ice than samples measuring 5 grams with a gradation of 4.75 mm (#4 sieve).

115
The results from the sunlight test did not show Pink Salt to have an obvious
advantage over road salt when exposed to direct sunlight. However, field observations have
suggested that Pink Salt performs better than road salt when exposed to direct sunlight.
The results from the refreeze test showed road salt and Pink Salt have almost identical
refreeze times at all the different gradation sizes used for testing. The results from the
refreeze test also showed the gradation size has an effect on the refreeze time. Samples with
gradations smaller than 0.422 mm (#40 sieve) began to refreeze almost immediately.
Samples with a larger gradation of about 2.38 mm (#8 sieve) began to refreeze after two
hours.
The results of this research suggest the Pink Salt’s superior performance in the field
over road salt may be due to its much finer gradation. The majority of the Pink Salt sample
used for testing had a gradation smaller than 4.75 mm (#4 sieve). The majority of the road
salt sample used for testing had a gradation larger than 4.75 mm (#4 sieve). The orange color
of the Pink Salt may also be advantageous in direct sunlight.
6.8 Standards of Practice
The following is a list of observations and suggestions for chemical use in the field
based on the findings from this research. Table 6.2 outlines the recommended deicer usage.

116
Table 6.2: Recommendations for Deicer Usage
Temperature Range, °F
Weather/Road Conditions
Above 32 32-20 20-12 Below 12
Rain Use little to no treatment unless the temperature is expected to drop. In that case pre-treat with road salt less than 100 lbs/lane-mile.
Pre-treat with road salt prewet with 8-10 gal/ton NaCl at less than 100 lbs/lane-mile.
During event, prewet is not necessary.
Not Applicable
Reports from the field in NDOR indicate deicers are effective below 12°F, but these findings are not supported by the literature.
NDOR is moving away from using abrasives because of Spring cleanup.
If abrasives are used, prewet with 8-10 gal/ton of NaCl to help “root” the abrasives.
Using MgCl2 or CaCl2 could cause slippery conditions.
Do not use Beet Juice in a liquid application unless it is a sunny day.
Freezing Rain Use Road Salt prewet with 8-10 gal/ton NaCl.
Using MgCl2 or CaCl2 could cause slippery conditions.
If liquids must be used, retreat every 1.5-2hrs to prevent refreeze
Sleet
Ice If not preceded by any of the above, pre-treat with liquid NaCl 20-50 gal/lane-mile. Post-treat with road salt prewet with 8-10 gal/ton NaCl.
Light Snow (less than 0.5 in/hr)
If not preceded by rain, freezing rain, or sleet liquid NaCl can be used for pre and post-treatment and during the event.
Use Road Salt prewet with 8-10 gal/ton. Use MgCl2 or CaCl2 if humidity is low.
If liquids must be used, patrol every 1.5-2hrs to prevent refreeze. Beet Juice can be used in direct sunlight.
Moderate to Heavy Snow (greater than 0.5 in/hr)
Pre-treat with liquid NaCl 20-50 gal/lane-mile. A mix of 15/85 Beet Juice/NaCl can be used.
Use road salt during and after the event.
Prewet is not necessary during the event.
Compacted Snow Use Road Salt if Necessary
Use Road Salt prewet with 8-10 gal/ton NaCl
Use Road Salt prewet with 8-10 gal/ton. Use MgCl2 or CaCl2 if humidity is low.
A prewet mix of 15/85 Beet Juice/NaCl is recommended on sunny days
Winds Greater than 15 mph
Treatment may cause blowing snow to stick to roadway. Beet Juice is NOT recommended on overcast days.
No Treatment
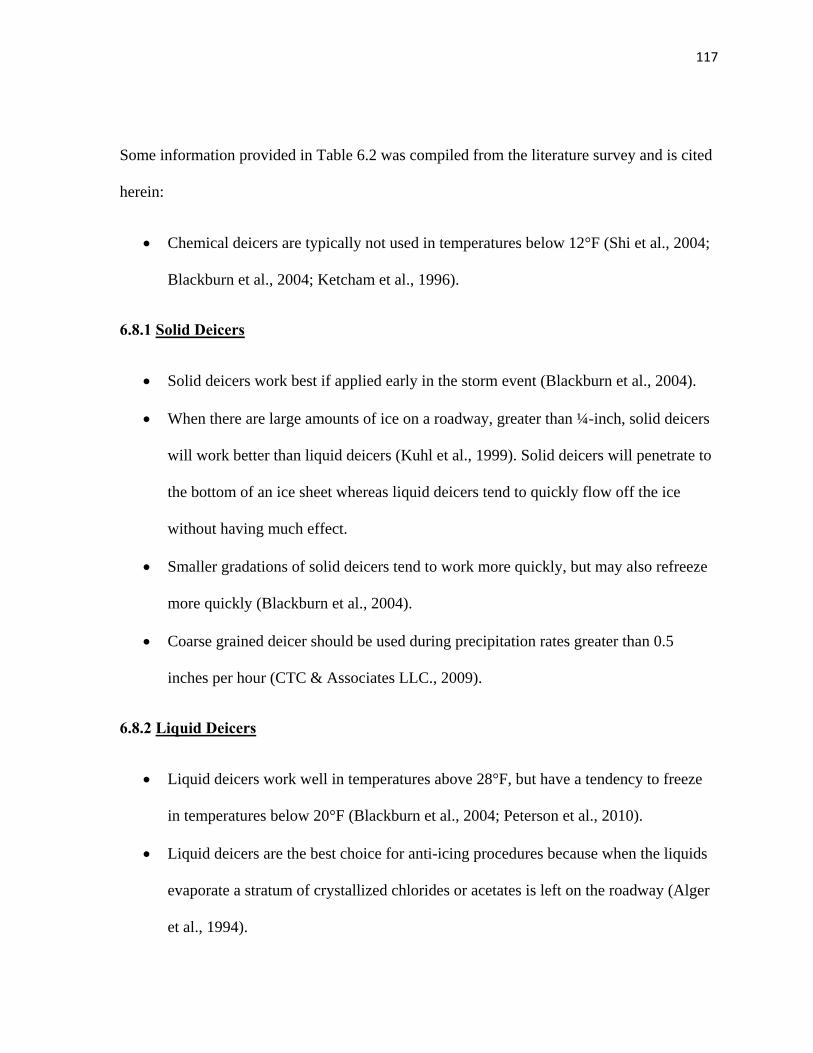
117
Some information provided in Table 6.2 was compiled from the literature survey and is cited
herein:
Chemical deicers are typically not used in temperatures below 12°F (Shi et al., 2004;
Blackburn et al., 2004; Ketcham et al., 1996).
6.8.1 Solid Deicers
Solid deicers work best if applied early in the storm event (Blackburn et al., 2004).
When there are large amounts of ice on a roadway, greater than ¼-inch, solid deicers
will work better than liquid deicers (Kuhl et al., 1999). Solid deicers will penetrate to
the bottom of an ice sheet whereas liquid deicers tend to quickly flow off the ice
without having much effect.
Smaller gradations of solid deicers tend to work more quickly, but may also refreeze
more quickly (Blackburn et al., 2004).
Coarse grained deicer should be used during precipitation rates greater than 0.5
inches per hour (CTC & Associates LLC., 2009).
6.8.2 Liquid Deicers
Liquid deicers work well in temperatures above 28°F, but have a tendency to freeze
in temperatures below 20°F (Blackburn et al., 2004; Peterson et al., 2010).
Liquid deicers are the best choice for anti-icing procedures because when the liquids
evaporate a stratum of crystallized chlorides or acetates is left on the roadway (Alger
et al., 1994).

118
The best time to perform anti-icing procedures is before snow events at temperatures
higher than 20°F (Blackburn et al., 2004; CTC & Associates LLC., 2009).
Anti-icing will not be effective for rain or freezing rain events because the deicers
will be washed off the road.
Wind speeds above 15mph can inhibit anti-icing operations (Blackburn et al., 2004;
Ketcham et al., 1996; CTC & Associates LLC., 2009).
Calcium and magnesium chlorides absorb water from the air and can cause slippery
roadways if the humidity is greater than 40% (CTC & Associates LLC., 2009).
Calcium chloride can leave a roadway wet for several days while sodium chloride
will dry a few hours after a storm (Donahey and Burkheimer, 1996).
6.8.3 Prewet Solid Deicers
Prewet can increase material retention on the roadway by 26% (Shi and O’Keefe,
2005).
A prewet of 10-12 gallon per ton is sufficient to minimize bounce and scatter
(Blackburn et al., 2004).
Prewet is not needed if snow events are preceded by rain or for use on wet snow at
about 32°F (Roosevelt, 1997).
Using prewet results in additional cleaning of the application equipment, but this can
be minimized if prewet is applied at the spinner.
6.8.4 Abrasives
Abrasives or sand are used at temperatures below 12°F (Shi et al., 2004 and
Blackburn et al., 2004)

119
Sand prewet with salt brine is more effective than dry sand (Shi and O’Keefe, 2005).
Sands with gradation between 0.04 and 0.08 inches work well at all temperatures (Al-
Qadi et al., 2002).
6.8.5 Other Observations
Potassium acetate should not be mixed with other deicers or used as a prewet for solid
deicers. This has been confirmed by field observations in the City of Fort Collins,
Colorado to cause large amounts of sludge.
Solutions of “Beet juice” mixed with sodium chloride are best used in sunlit areas. It
may be prudent to use a different deicer in areas with many trees or shaded areas.
It may be prudent to use calcium chloride right before sunset and temperature drops
because it may not refreeze as quickly as other chemical deicers.
6.9 Evaluation of Performance Tests
Due to the many sources of error, it is evident that the SHRP Ice Melting Capacity
Test is not repeatable between different laboratories. Furthermore, the results from this test
often do not correlate with field observations.
The Shaker Test appears to produce results similar to that of the SHRP Ice Melting
Capacity Test without the need of a walk-in freezer. The results from the Shaker Test also
correlate well with reports from the field in the State of Nebraska. The test results are
repeatable between laboratories, but more tests should be performed at different locations to
further confirm this observation.

120
This version of the Friction Test has a complicated procedure and requires a walk-in
freezer. If a product is suspected to cause slippery roadways without fermentation, it would
be more practical to use a British Pendulum Tester to confirm the friction coefficient. It has a
simpler procedure, does not require electricity, and is designed for use in the field.
The Sunlight Test is difficult to perform because it must be conducted outdoors
during specific environmental conditions. Furthermore, field data from the MDSS can be
used to come to the same conclusions as the Sunlight Test concerning the effect of sunlight
exposure on dark colored deicers.
The Refreeze Test did not produce completely consistent results, but was functional
enough to discover some interesting information about calcium chloride and the gradation of
solid deicers. The refreeze test shows the potential to become a cost-effective test for deicer,
but requires further development to produce consistent results.

121
References
1. Cuelho E., Harwood J., Akin M., and Adams E. Establishing Best Practices for Removing Snow and Ice From California Roadways. Publication CA10-1101. Department of Research and Innovation, California Department of Transportation, December 2010.
2. Shi X., Fay L., Gallaway C., Volkening K., Peterson M. M., Pan Y., Creighton A., Lawlor C., Mumma S., Liu Y., and Nguyen T. A. Evaluation of Alternative Anti-Icing and Deicing Compounds Using Sodium Chloride as Baseline Deicers – Phase 1. Publication CDOT-2009-1. DTD Applied Research and Innovation Branch, Colorado Department of Transportation, February 2009.
3. Nixon W. A., Kochumman G., Qiu L., Qiu J., and Xiong J. Evaluation or Deicing Materials and Corrosion Reducing Treatments for Deicing Salts. IIHR Technical Report # 463. Iowa Highway Research Board, Iowa Department of Transportation, May 2007.
4. Blackburn R. R., Bauer K. M., Amsler D. E., Boselly S. E., McElroy A. D. Snow and Ice Control: Materials and Methods. In National Cooperative Highway Research Program, Report 526, Transportation Research Board of the National Academies, Washington D.C., 2004.
5. Pacific Northwest Snow Fighters (PNS), Qualified Product List – PRODUCTS, December 10, 2010.
6. Pacific Northwest Snow Fighters (PNS), Snow and Ice Control Chemical Products Specifications and Test Protocols for the PNS Association of British Columbia, Colorado, Idaho, Montana, Oregon, and Washington, 2008
7. Chappelow C., McElroy A. D., Blackburn R. R., Darwin D., de Noyelles F. G., Locke C. E. Handbook of Test Methods for Evaluating Chemical Deicers. Publication SHRP-H-332. Strategic Highway Research Program, National Research Council, 1992.
8. Nixon W. A., Qiu J., Qiu L., Kochumman G., and Xiong J. Ice Melting Performance for Ice-Control Chemicals. Department of Civil and Environmental Engineering, University of Iowa, Iowa City, 2004.
122
9. Shi X. and Akin M. Development of Standardized Test Procedures for Evaluating Deicing Chemicals. Publication CR07-02. Clear Roads, Wisconsin Department of Transportation and U.S. Department of Transportation, March 2010.
10. Shi X. and O’Keefe K. Synthesis of Information on Anti-icing and Pre-wetting for Winter Highway Maintenance Practices in North America. Pacific Northwest Snowfighters in collaboration with the Washington State Department of Transportation, August 19, 2005.
11. Schueler T., Horan D., Fung C., Flynn L., and Biebel B. Storm Water Management Fact Sheet, Minimizing Effects from Highway Deicing. Publication EPA 832-F-99-016. Office of Water, United States Environmental Protection Agency, September 1999.
12. Public Sector Consultants, Inc. Current Deicing Practices and Alternative Deicing Materials. Michigan Department of Transportation, December 1993.
13. A Review of the Environmental Impacts of Road Salt on Vegetation, Soil, Surface Water and Groundwater. Parks and Outdoor Recreation, Medicine Hat, Alberta, Canada, December 2010.
14. Roosevelt D. S. Final Report, a Survey of Anti-icing Practice in Virginia. Publication VTRC 98-R19. Virginia Transportation Research Council, Virginia Department of Transportation, University of Virginia, FHWA, December 1997.
15. Shi X., Stein O., Staples J. M., and Gamradt L. Recommendation for Winter Traction Materials Management on Roadways Adjacent to Bodies of Water. Publication FHWA/MT-04-008/8117-19. Montana State University, Montana Department of Transportation, December 2004.
16. Kuhl K., Tonkin J., and Richins S. Snow and Ice Control Operations. California Department of Transportation, 1999.
17. Peterson G., Keranen P., and Pletan R. Identifying the Parameter for Effective Implementation of Liquid-Only Plow Routes. Publication Clear Roads 09-02. Clear Roads, Wisconsin Department of Transportation and U.S. Department of Transportation, October 2010.

123
18. Alger R. and Haase J. Analysis of the Benefits of Bulk Pre-Wetting Solid NaCl with Several Different Liquids. Publication RC-1473. Construction and Technology Division, Michigan Department of Transportation, January 2006.
19. CTC & Associates LLC. Anti-icing in Winter Maintenance Operations: Examination of Research and Survey of State Practice. Publication Transportation Research Synthesis 0902. Minnesota Department of Transportation, May 2009.
20. Al-Qadi I. L., Loulizi A., Flintsch G. W., Roosevelt D. S., Decker R., Wambold J. C., and Nixon W. A. Feasibility of using Friction Indicators to Improve Winter Maintenance Operations and Mobility. In National Cooperative Highway Research Program, Web Document 53 (Project 6-14), Transportation Research Board of the National Academies, Washington D.C., November 2002.
21. Fuller G. No accumulation, SDDOT cuts winter tools and remains effective. Roads&Bridges, February 2011, pp. 48-50.
22. Alger R. G., Adams E. E., and Beckwith E. P. Anti-Icing Study: Controlled Chemical Treatments. Publication SHRP-H-683. Strategic Highway Research Program, National Research Council, 1994.
23. Donahey T. J. and Burkheimer D. Prewetting with Salt Brine. Semisequicentennial Transportation Conference Proceedings, Iowa State University, Ames, Iowa, May 1996. http://www.ctre.iastate.edu/PUBS/semisesq/session1/donahey/index.htm
24. Vaa T. Implementation of New Sanding Method in Norway. In Transportation Research Circular, No E-C063, Transportation Research Board of the National Academies, Washington D.C., June 2004, pp. 473-486.
25. Blackburn R. R., Amsler D. E., and Bauer K. M. Guidelines for Snow and Ice Control Materials and Methods. In Transportation Research Circular, No E-C063, Transportation Research Board of the National Academies, Washington D.C., June 2004, pp. 31-49.
26. Lu Q. and Steven B. Friction Testing of Pavement Preservation Treatments: Literature Review. Publication UCPRC-TM-2006-10. University of California, California Department of Transportation, December 2006.

124
27. Ketcham S. A., Minsk L. D., BlackBurn R. R., and Fleege E. J. Manual of Practice for an Effective Anti-Icing Program. FHWA-RD-95-202. Federal Highway Administration, June 1996. http://www.fhwa.dot.gov/reports/mopeap/mop0296a.htm#eaptrdp
28. Goyal, Gopal, Lin J., and McCarthy J. L. Time, Temperature, and Relative Humidity in Deicing of Highways Using Sodium Chloride or Magnesium Chloride with a Metal Corrosion Inhibitor. In Transportation Research Record: Journal of the Transportation Research Board, No. 1246, Transportation Research Board of the National Academies, Washington, D.C., 1989, pp.9-17.

125
Appendix A
Refreeze Test Results
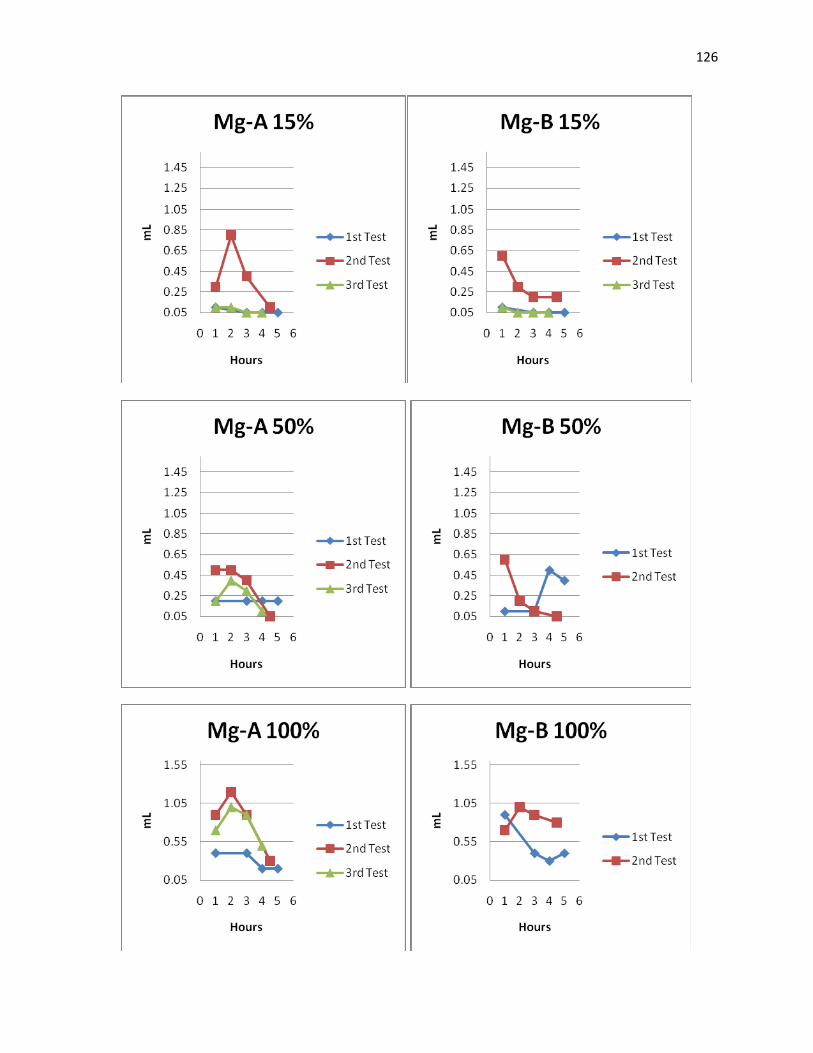
126

127

128

129

130