Embed Size (px)
Citation preview

PERFORMANCE OPTIMIZATION OF ROOFTOP
POWER PLANT IN MALAYSIA CLIMATE BY
LOWERING DOWN THE TEMPERATURE
NGEI CHEE KIT
UNIVERSITI TUNKU ABDUL RAHMAN
PERFORMANCE OPTIMIZATION OF ROOFTOP POWER PLANT IN
MALAYSIA CLIMATE BY LOWERING DOWN THE TEMPERATURE
NGEI CHEE KIT
A project report submitted in partial fulfilment of the
requirements for the award of Bachelor of Engineering
(Hons.) Electrical and Electronic
Faculty of Engineering and Science
Universiti Tunku Abdul Rahman
September 2016
ii
DECLARATION
I hereby declare that this project report is based on my original work except for
citations and quotations which have been duly acknowledged. I also declare that it has
not been previously and concurrently submitted for any other degree or award at
UTAR or other institutions.
Signature :
Name : Ngei Chee Kit
ID No. : 1207564
Date :
iii
APPROVAL FOR SUBMISSION
I certify that this project report entitled “PERFORMANCE OPTIMIZATION OF
ROOFTOP POWER PLANT IN MALAYSIA CLIMATE BY LOWERING
DOWN THE TEMPERATURE” was prepared by NGEI CHEE KIT has met the
required standard for submission in partial fulfilment of the requirements for the award
of Bachelor of Engineering (Hons.) Electrical and Electronic at Universiti Tunku
Abdul Rahman.
Approved by,
Signature :
Supervisor : Dr. Lim Boon Han
Date :
iv
The copyright of this report belongs to the author under the terms of the
copyright Act 1987 as qualified by Intellectual Property Policy of Universiti Tunku
Abdul Rahman. Due acknowledgement shall always be made of the use of any
material contained in, or derived from, this report.
© 2016, Ngei Chee Kit. All right reserved.

v
ACKNOWLEDGEMENTS
I would like to thank everyone who had contributed to the successful completion of
this project. I would like to express my gratitude to my research supervisor, Dr. Lim
Boon Han for his invaluable advice, guidance and his enormous patience throughout
the development of the research.
In addition, I would also like to express my gratitude to my loving parent and
friends who had helped and given me encouragement throughout this whole project.
Furthermore, I also want to express my appreciation to my seniors who are really
helpful during my learning phase in this project.
vi
PERFORMANCE OPTIMIZATION OF ROOFTOP POWER PLANT IN
MALAYSIA CLIMATE BY LOWERING DOWN THE TEMPERATURE
ABSTRACT
Malaysia is hot and humid all year round. This is because that Malaysia is located near
the equator, thus its climate is equatorial. Since Malaysia is hot throughout the year,
this discourages renewable energy such as solar energy. The higher the temperature,
the lower the efficiency. Furthermore, Renewable Energy Act 2011 is an act to
encourage implementation and establishment of a special tariff system. Besides that,
it also promotes feed-in tariff (FiT) scheme. This whole act is to promote renewable
energy by allowing electricity generate from renewable sources like solar energy be
able to sold to power utilities. This project is to construct a hardware model experiment
which consists of two photovoltaic modules and metal deck with various
configurations and water systems. Water systems involved are water spraying and
water dripping system. The project is carried out with a fixed inclination angle of 10o
and air gap of 10cm. Temperature sensors are placed below the solar panel. They are
positioned at top, middle and bottom of the solar panel which are recorded using a data
logger. Total of 4 experiments are conducted initially with 2 additional experiments.
The initial 4 experiments are conducted with various configurations using both water
spraying and water dripping system. This is to determine which configuration is the
best for optimum result. After that, 2 more additional experiments are conducted to
further improve the solar panel efficiency. The results are then collected to determine
which water system is better. Comparison of temperature drop, increase in voltage,
power and efficiency, voltage and power gained are taken into consideration to
compare the cooling performance of the water systems. The initial 4 experiments yield
exceptional cooling performance. However, the power gained of the additional
experiments are similar to the initial 4 experiments. Recommendations are made to
further improve the cooling performance and the efficiency of the solar panel.
vii
TABLE OF CONTENTS
DECLARATION ii
APPROVAL FOR SUBMISSION iii
ACKNOWLEDGEMENTS v
ABSTRACT vi
TABLE OF CONTENTS vii
LIST OF TABLES xi
LIST OF FIGURES xii
LIST OF SYMBOLS / ABBREVIATIONS xvi
LIST OF APPENDICES xvii
CHAPTER
1 INTRODUCTION 1
1.1 Background 1
1.2 Aims and Objectives 2
1.3 Scope 3
1.4 Project Progress Chart 3
2 LITERATURE REVIEW 5
2.1 Photovoltaic Cell 5
2.2 Characteristics of Photovoltaic Cell 5
2.2.1 Current-Voltage Characteristics 6
2.2.2 Power characteristic 6
2.3 Types of Photovoltaic Cell 8
2.3.1 Amorphous Silicon Solar Cell 8
viii
2.3.2 Monocrystalline Silicon Cells (Mono-Si) 9
2.3.3 Multi-Crystalline Silicon (Multi-Si) 10
2.3.4 Thermophotovoltaics 11
2.4 Factors Affecting the Efficiency of Photovoltaic Module 13
2.4.1 Temperature 13
2.4.2 Solar Irradiance 13
2.4.3 Cosine Effect 14
2.5 Air Gap Distance Effect against Temperature of Solar Panel
14
2.6 Heat Transfer 15
2.6.1 Thermal Conduction 15
2.6.2 Radiation 15
2.6.3 Convection 16
3 METHODOLOGY 17
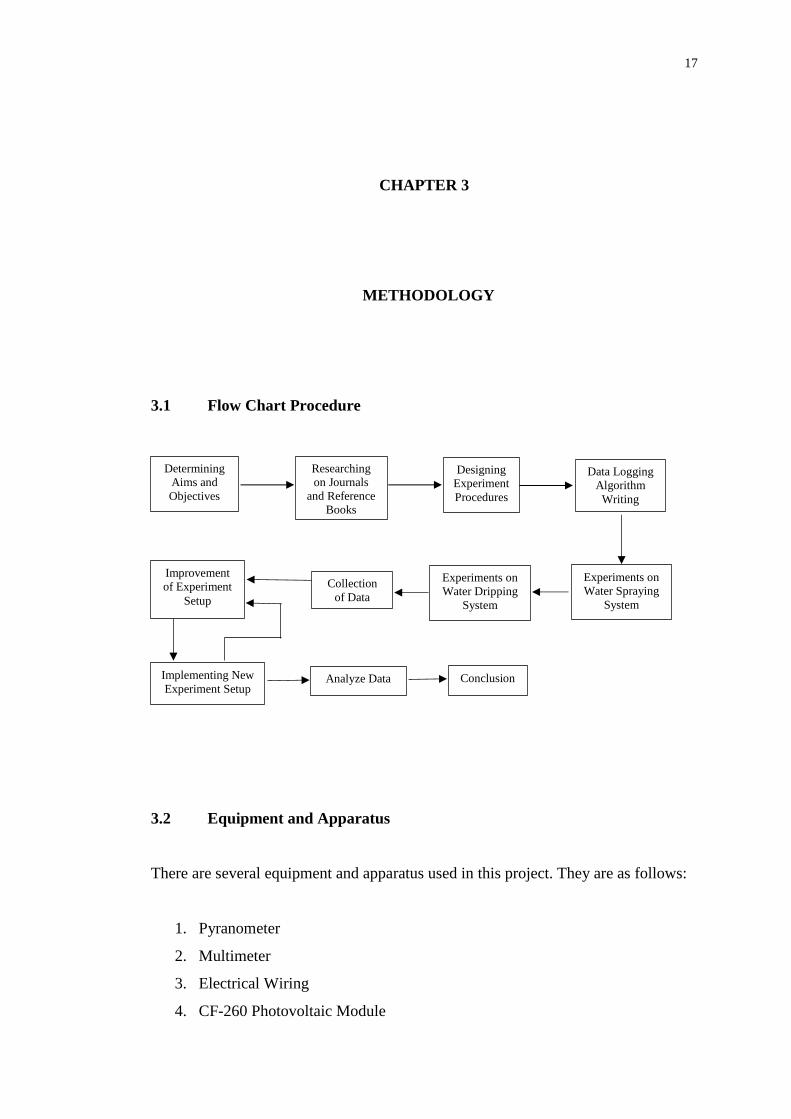
3.1 Flow Chart Procedure 17
3.2 Equipment and Apparatus 17
3.2.1 Pyranometer 18
3.2.2 Multimeter 19
3.2.3 Electrical Wiring 20
3.2.4 Solar Panel 20
3.2.5 Supporting Beams 21
3.2.6 Water Hose 21
3.2.7 Polyvinyl Chloride (PVC) Pipe 22
3.2.8 Data Logger 22
3.2.9 DS18B20 and DHT22 Temperature Sensors 23
3.3 Experiment Setup 24
3.3.1 Water Spraying and Dripping System Setup 26
3.3.2 Data Collection Setup 27
3.3.3 Experiment Layout 30
3.3.4 Experiment 1: Water Spraying System (Spray Solar
Panel) 31
ix
3.3.5 Experiment 2: Water Spraying System (Spray Metal
Deck) 32
3.3.6 Experiment 3: Dripping System (Drip Solar Panel)
33
3.3.7 Experiment 4: Dripping System (Drip Metal Deck)
34
3.4 Additional Experiments 35
3.4.1 Experiment 5: Water Spraying System (Spray Solar
Panel and Metal Deck) 35
3.4.2 Experiment 6: Dripping System (Drip Solar Panel and
Metal Deck) 36
4 RESULTS AND DISCUSSION 37
4.1 Pre-Analysis 37
4.1.1 Water Speed Analysis 37
4.1.2 Reference System Analysis 39
4.1.3 Irradiance Analysis 40
4.2 Experiment Analysis 42
4.2.1 Experiment 1: Water Spraying System (Spray Solar
Panel) 42
4.2.2 Experiment 2: Water Spraying System (Spray Metal
Deck) 44
4.2.3 Experiment 3: Dripping System (Drip Solar Panel)
46
4.2.4 Experiment 4: Dripping System (Drip Metal Deck)
48
4.3 Performance Analysis 50
4.3.1 Cooling Performance of Water Spraying and
Dripping System 50
4.3.2 Power Analysis of Water Spraying and Dripping
System 52
4.3.3 Performance of Water Spraying and Dripping System
56
x
4.4 Additional Experiments Analysis 60
4.4.1 Experiment 5: Water Spraying System (Spray Solar
Panel and Metal Deck) 60
4.4.2 Experiment 6: Dripping System (Drip Solar Panel and
Metal Deck) 62
4.5 Power Analysis of Addition Experiment of Water Spraying
and Dripping System 66
4.6 Performance of Additional Experiments of Water Spraying
and Dripping System 68
5 CONCLUSION AND RECOMMENDATIONS 72
5.1 Conclusion 72
5.2 Recommendations 73
REFERENCES 75
APPENDICES 79
xi
LIST OF TABLES
TABLE TITLE PAGE
4.1: Bucket Method Data for Flow of Water Spraying System 37
4.2: Bucket Method Data for Flow of Dripping System 38
xii
LIST OF FIGURES
FIGURE TITLE PAGE
1.1: Project Overview 4
2.1: Irradiance Dependence of Current-Voltage Characteristic
6
2.2: Power Produced as a Function of Voltage V at the
Terminals 7
2.3: Amorphous Silicon Solar cell 9
2.4: Monocrystalline Silicon Cells 10
2.5: Multi-crystalline Silicon 11
2.6: Thermophotovoltaic System 12
2.7: Temperature Effect on PV module 13
3.1: Pyranometer 19
3.2: Multimeter 20
3.3: Water Hose 21
3.4: PVC Pipe 22
3.5: Data Logger 23
3.6: Structure of the Solar Panels 25
3.7: Water Hose Attached onto the Solar Panel 27
3.8: 10 Temperature Sensors Tested For Consistency 29
3.9: Arduino Mega 2560 29
3.10: DHT22 Position between Both Solar Panels 30
xiii
3.11: 3 DS18B20 Position Top, Middle and Bottom of the Solar
Panel 30
3.12: Experiment Layout 31
3.13: Cross Section View of Water Hose Spray onto the Solar
Panel 32
3.14: Cross Section View of Water Hose Spray onto the Metal
Deck 33
3.15: Cross Section View of PVC Pipe Drip onto the Solar
Panel 34
3.16: Cross Section View of PVC Pipe Drip onto the Solar
Panel 34
3.17: Cross Section View of Water Hoses Spray onto the Solar
Panel and Metal Deck 35
3.18: Cross Section View of PVC Pipe Drip onto the Solar
Panel 36
4.1: Reference System Temperature 39
4.2: (a) (b) (c) (d) Comparison of Solar Irradiance and Average
Temperature of Reference System 41
4.3: Total Average Temperature against Solar Irradiance 42
4.4: Average Temperature against Time 43
4.5: Bottom, Middle and Top Temperature with Reference
against Time 44
4.6: Average Temperature against Time 45
4.7: Bottom, Middle and Top Temperature with Reference
against Time 46
4.8: Average Temperature against Time 47
4.9: Bottom, Middle and Top Temperature with Reference
against Time 48
4.10: Average Temperature against Time 49
4.11: Bottom, Middle and Top Temperature with Reference
against Time 49
xiv
4.12: Graph of Bottom, Middle and Top System of
Temperature Difference, ∆T Against
Temperature of Reference System 52
4.13: Comparison of Voltage and Power with Their Respective
Reference (Spray Solar Panel) 53
4.14: Comparison of Voltage and Power with Their Respective
Reference (Spray Metal Deck) 54
4.15: Comparison of Voltage and Power with Their Respective
Reference (Drip Solar Panel) 55
4.16: Comparison of Voltage and Power with Their Respective
Reference (Drip Metal Deck) 56
4.17: Power Gained against Reference Average Temperature
(Spray Solar Panel) 57
4.18: Voltage Gained against Reference Average Temperature
(Spray Solar Panel) 58
4.19: Power Gained against Reference Average Temperature
(Drip Solar Panel) 59
4.20: Voltage Gained against Reference Average Temperature
(Drip Solar Panel) 59
4.21: Average Temperature against Time 61
4.22: Bottom, Middle and Top Temperature with Reference
against Time 62
4.23: Average Temperature against Time 63
4.24: Bottom, Middle and Top Temperature with Reference
against Time 64
4.25: Graphs of Bottom, Middle and Top System of
Temperature Difference, ∆T Against
Temperature of Reference System 66
4.26: Comparison of Voltage and Power with Their Respective
Reference (Spray Solar Panel and Metal Deck) 67
4.27: Comparison of Voltage and Power with Their Respective
Reference (Drip Solar Panel and Metal Deck) 68
4.28: Power Gained against Reference Average Temperature
(Spray Solar Panel and Metal Deck) 69

xv
4.29: Voltage Gained against Reference Average Temperature
(Spray Solar Panel and Metal Deck) 69
4.30: Power Gained against Reference Average Temperature
(Drip Solar Panel and Metal Deck) 70
4.31: Voltage Gained against Reference Average Temperature
(Drip Solar Panel and Metal Deck) 71
xvi
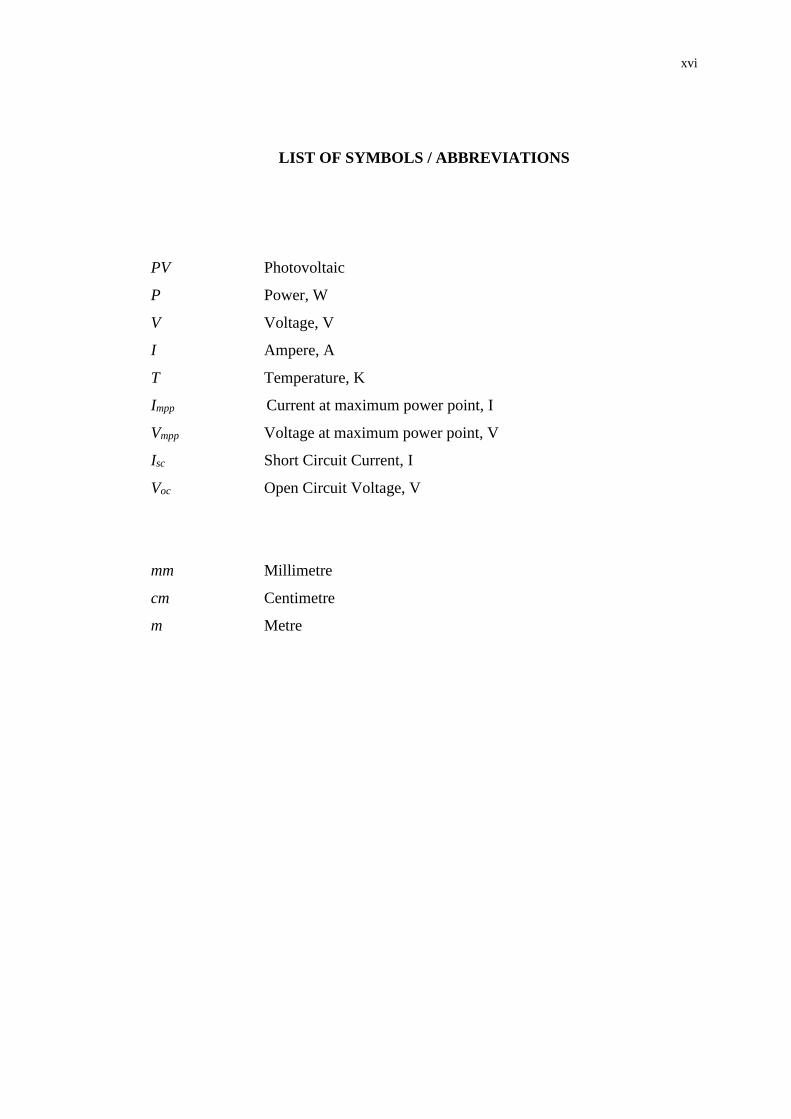
LIST OF SYMBOLS / ABBREVIATIONS
PV Photovoltaic
P Power, W
V Voltage, V
I Ampere, A
T Temperature, K
Impp Current at maximum power point, I
Vmpp Voltage at maximum power point, V
Isc Short Circuit Current, I
Voc Open Circuit Voltage, V
mm Millimetre
cm Centimetre
m Metre
xvii
LIST OF APPENDICES
APPENDIX TITLE PAGE
A: MSR Multi-Crystalline Photovoltaic Module MYS-60 CF-
260 Data Sheet 79
B: Arduino Data Logger Code 82
1
CHAPTER 1
1 INTRODUCTION
1.1 Background
Renewable energy is basically the energy that is obtained from resources which are
naturally regenerated during a human timescale. There are many renewable energy
such as wind, sunlight, waves, tides and geothermal heat. There are also many
application for renewable energy. Some important applications are electricity
generation, transportation, rural energy services and water and air heating/cooling.
Based on REN21’s 2014 report, renewable energy has started to improve as years pass
by. Renewable energy contribute around 19% and 22% to the global energy
consumption in 2012 and 2013 respectively. This is consider a great achievement. This
is because renewable energy is a substitute for non-renewable resources such as fossil
fuels. Fossil fuels is used to generate electricity. However, it will produce carbon
dioxide emission which is bad. Furthermore, nowadays rich and well developed
countries such as United States and China have started to invest heavily into biofuels,
solar, wind and hydro. Besides that, carbon dioxide emission can lead to greenhouse
gases (GHG). GHG is the gas in the atmosphere that will absorb the solar radiation
from the sun. When this happens, the global temperature will continue to increase, thus
causing global warming. Ice, ice bergs and glacier will start to melt due to global
warming. Global warming not only affects the environment but it will affect but also
the flora and fauna. Animals and plants habitat will also change due to the increase in
temperature. Birds will start to migrate from country to country until the temperature
of the environment is suitable for the species. Moreover, some species of animals and
plants will start to extinct due to climate change. This is because the failure of the
2
species to adapt with the global warming. GHG emission also will cause the depletion
of the ozone layer. Therefore, this makes renewable energy very crucial to the
environment. Renewable Energy Act 2011 is a policy or an act that encourage the
implementation of renewable energy. This act specifically provides a special tariff
system for a specific duration. This tariff system will give special premium price or
rate for electricity produced from renewable sources. Most people will install solar
panels to utilize this act. However, once the specific duration finishes, it will return
back to the original rate. Solar panels are famous when this act is introduced. This is
because solar panel can be install on almost anywhere from residential house, company
rooftop and shop lot rooftop to a solar farm. Solar energy should be encourage in
Malaysia. This is because Malaysia is summer throughout the year. This is due to it is
close to the equator which makes Malaysia climate equatorial. Unlike some countries
with have 4 seasons a year, Malaysia can produce solar energy throughout the year.
The act along with the Malaysia climate encourages the installing of solar panel.
Malaysia has 2 monsoon wind seasons. Firstly is the Southwest Monsoon. Its
duration is around late May to September. The second monsoon wind season is the
Northeast Monsoon. It usually occurs around October to March. The second season
usually brings more rainfall. This is because that monsoon originates in the north
Pacific and also in China. The Southwest Monsoon originates from Australia.
Although Malaysia have 2 monsoon wind seasons, wind energy is not popular in
Malaysia. The strongest wind in Malaysia occurs in Cameron Highland or Genting
Highland. Even the strongest wind in Malaysia does not produce enough energy
require for the wind turbine. Therefore, Malaysia cannot harvest wind energy.
1.2 Aims and Objectives
The aim of this project is to investigate the temperature and the air gap distance of the
photovoltaic module. Objectives of the project are
1. To set up a hardware model experiment which consists of two photovoltaic
modules and metal deck roof with different configurations and water system
3
2. To construct water spraying and water dripping set up for solar photovoltaic
system for panel cooling purpose
3. To analyse and compare the effect of water spraying and dripping system on
the performance of the solar panel
1.3 Scope
This project is mainly focus on the relationship between the temperature and efficiency
of the photovoltaic module with a fixed air gap and rooftop material. The rooftop
material used is metal deck. The project is conducted using multicrystalline solar
panels to evaluate its performance by lowering down its temperature. This project is
carried out in Utar Sg. Long Campus rooftop with a height of a ten-storey building.
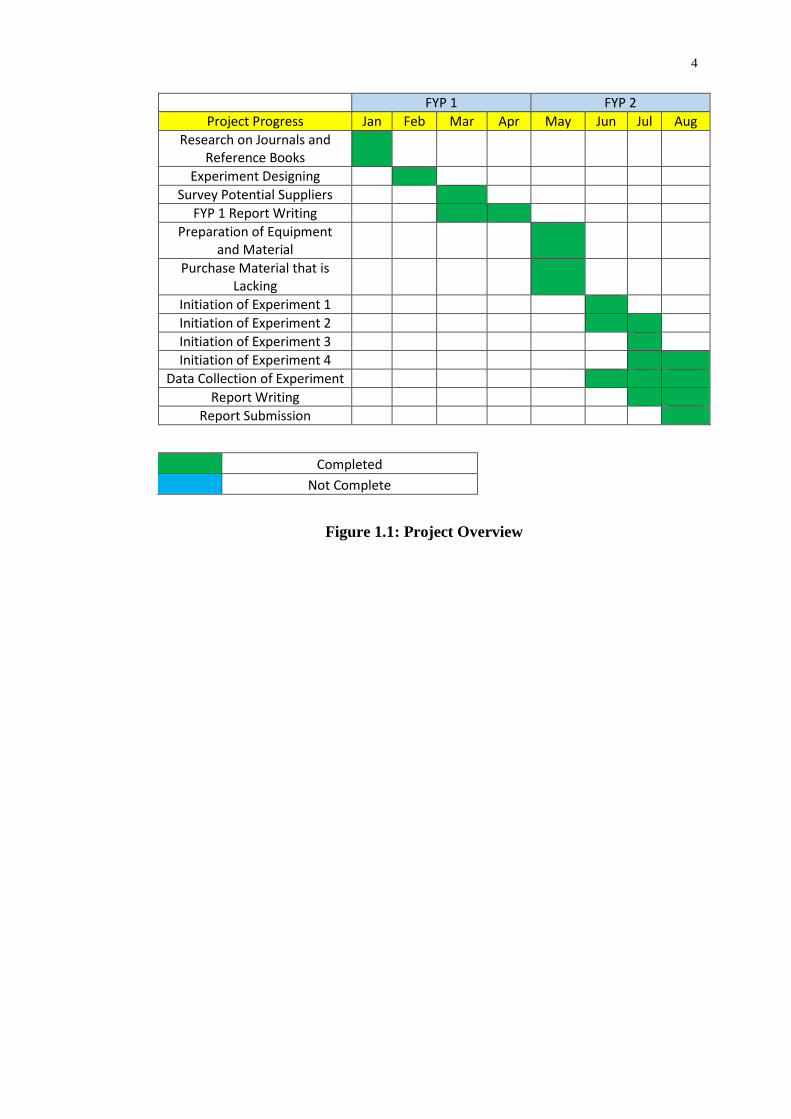
1.4 Project Progress Chart
Gantt chart is very crucial for any project as it shows the progress of the project. It also
keeps the project on track. The progress chart also acts as a schedule.
4
FYP 1 FYP 2
Project Progress Jan Feb Mar Apr May Jun Jul Aug
Research on Journals and Reference Books
Experiment Designing
Survey Potential Suppliers
FYP 1 Report Writing
Preparation of Equipment and Material
Purchase Material that is Lacking
Initiation of Experiment 1
Initiation of Experiment 2
Initiation of Experiment 3
Initiation of Experiment 4
Data Collection of Experiment
Report Writing
Report Submission
Completed
Not Complete
Figure 1.1: Project Overview
5
CHAPTER 2
2 LITERATURE REVIEW
2.1 Photovoltaic Cell
Photovoltaic (PV) cell is basically an electrical device that transforms light energy into
electricity by photovoltaic effect. This is done by using a chemical and physical
phenomenon. Furthermore, it also can be regard as a form of photoelectric cell. It also
can have the electrical characteristics like resistance, current and voltage. These
characteristics can vary when exposed to light. Photovoltaic modules or also known as
solar panels require solar cells which are the fundamental building blocks. Light source
can be obtained from many sources whether it is artificial light or sunlight. Light
source will make solar cells photovoltaic. As long as there is a light source, the solar
cells is photovoltaic. Photovoltaic cell is also known as solar cell. Solar cells can also
be called as photodetector. This is because it can detect electromagnetic radiation that
is near visible range, light or measuring light intensity. Photovoltaic cell requires 3
basic attributes which are the separation of charge carriers of opposite types,
absorption of light, producing electron-hole or excitons and lastly separate extraction
of those carriers to the external circuit.
2.2 Characteristics of Photovoltaic Cell
6
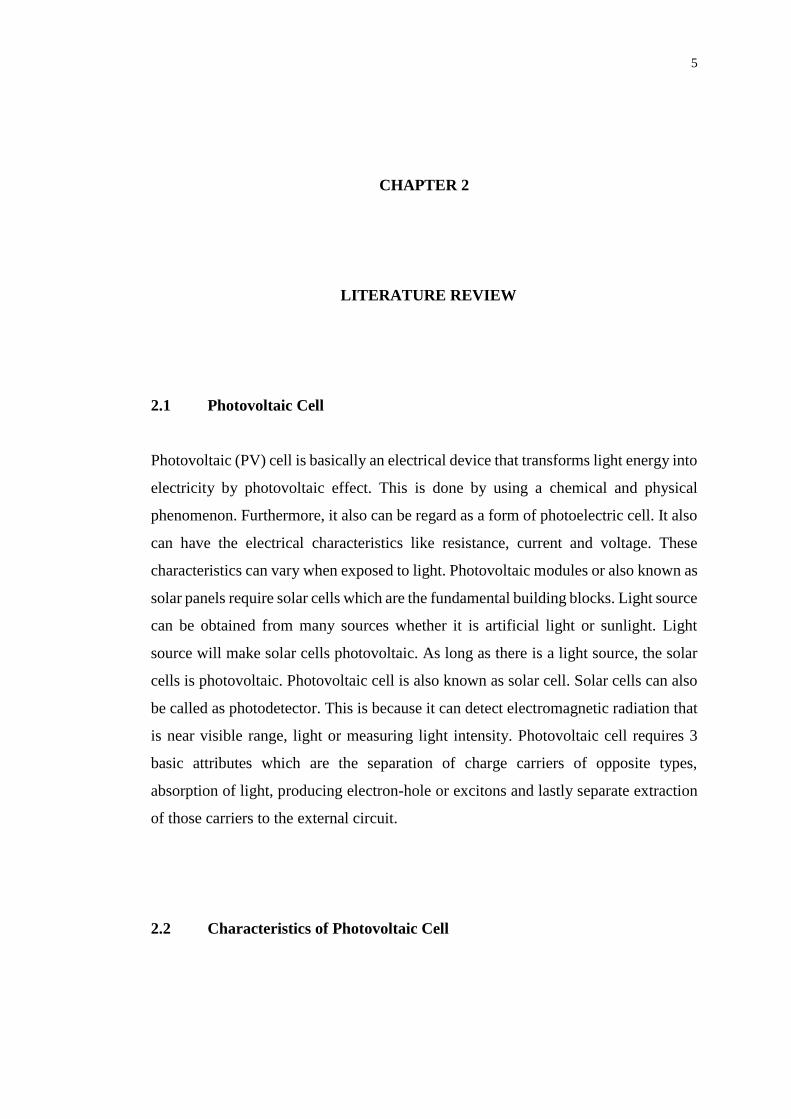
2.2.1 Current-Voltage Characteristics
One of the main factor that affect the current-voltage characteristic is the temperature.
This is because it is one of the crucial factor that affects the maximum power output
from the photovoltaic cell. The most significant is the temperature dependence of the
voltage which decreases with increasing temperature (Markvart, T., 2000).
Furthermore, silicon cell will have the voltage decrease is around 2.3 mV per oC.
Usually the fill factor and the temperature differences of the current are very small
amount, thus it is normally negligible in most of the photovoltaic system design.
Another factor that affect the current-voltage characteristic is the solar irradiance as
shown in Figure 2.1. However, solar irradiance does not affect as much as the
temperature.
Figure 2.1: Irradiance Dependence of Current-Voltage Characteristic
(Enhance Photovoltaics, 2015)
2.2.2 Power characteristic
7
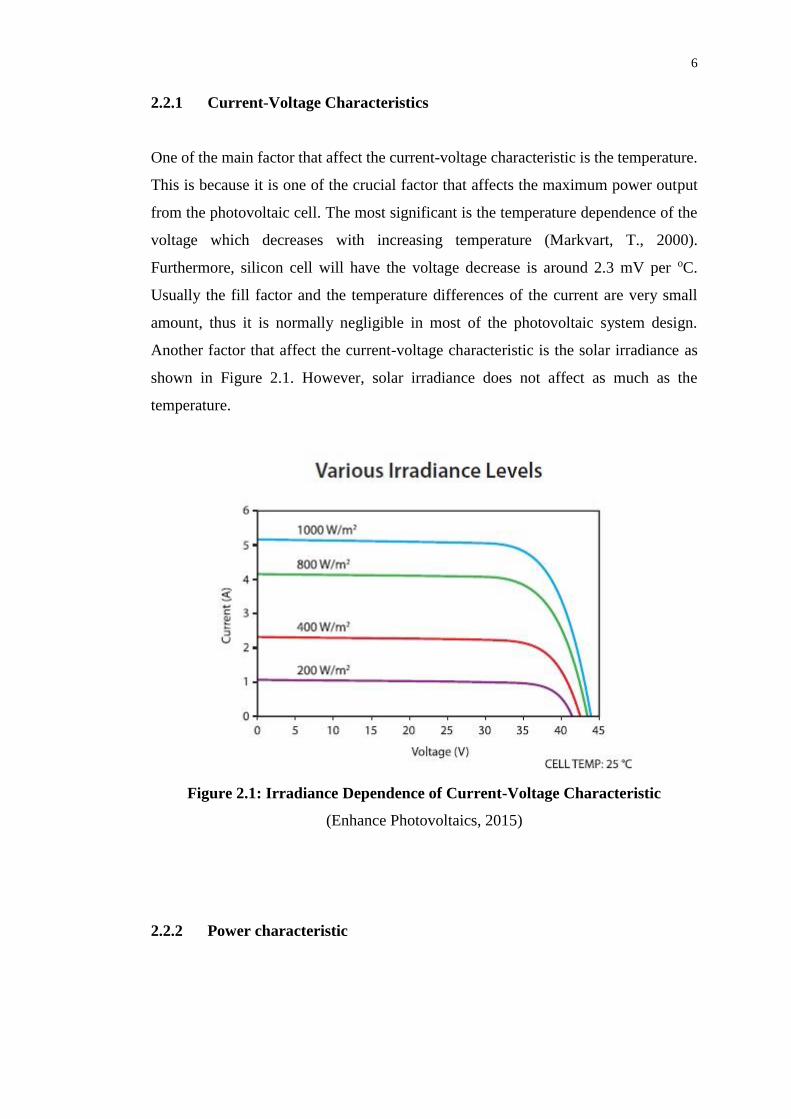
Figure 2.2: Power Produced as a Function of Voltage V at the Terminals
(Dennis L., 2016)
Irradiance must also be taken into consideration for the performance of the
photovoltaic cell. Figure 2.2 shows the photovoltaic-cell characteristics with different
levels of illumination. The flux of photons that is above the bandgap energy is
proportional to the current generated by the solar cell. Based on the research above,
the current generated by the photon flux increases as the irradiance increases. In other
words, it can be said that the irradiance is directly proportional to the short-circuit
current. In real application, usually the voltage variation is a small amount and it is
usually negligible.
By using the formula P = VI, the solar cell produces the power as a function of
voltage V at the cell terminals in Figure 2.2. Besides that, the Figure 2.2 also show
elevated temperature and lower irradiance of the power characteristics. It is common
sense that any solar cell should operate at its maximum power point. However, in real
application it is not that easy. The most ideal way is to make the solar cell operate in
such a way that it is operate at a constant voltage which is slightly below the maximum
power point. However, this is less effective solution. Furthermore, if the voltage is
operating at the linear part of the Current-Voltage characteristics, the temperature will
hardly affect the power output produced by the photovoltaic cell. The short-circuit
8
current and the irradiance will be directly proportional to the power delivered to the
load.
2.3 Types of Photovoltaic Cell
Every solar cell consist of at least two or more thin layers of silicon or any semi-
conducting material. When any silicon or semiconductor is exposed to light, electrical
charges are produced. Once the charges are generated, it can be redirected by using
metal contacts making it a direct current (DC). Usually single cell electrical output is
too small, so many cells are connected together. Once they are connected together, a
“string” will be formed. This will produce a direct current. Besides that, global
company are also competing to research and develop renewable energy such as solar
energy. Many type of solar cells are made. Some of the common type of solar cell are
Multi-crystalline and Monocrystalline. They cover almost all the solar panels produced
globally.
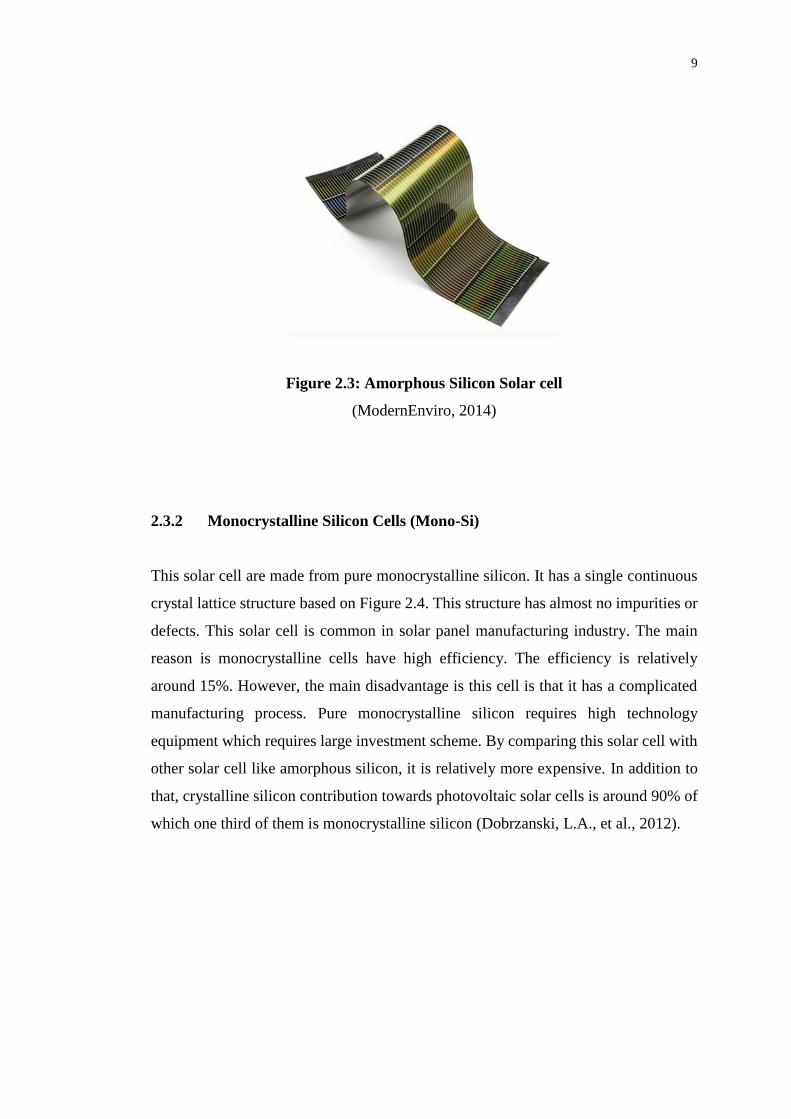
2.3.1 Amorphous Silicon Solar Cell
This solar cell is basically made up of silicon atoms in thin homogenous layer as shown
in Figure 2.3. Furthermore, amorphous silicon tends to absorbs light more effectively
compared to crystalline silicon (Kalogirou, S. A., 2009). This also tends to lead to
thinner cells. This technology is also knows as thin film PV technology. In addition to
this, amorphous silicon best advantage is it can be deposited on a wide range of
substrates. It can be both flexible and rigid. On the other hand, the disadvantage of this
solar cell is that it has low efficiency around the order of 6 %. In this modern generation,
solar panels manufactured from amorphous silicon come in many different types of
shapes. By using this advantage, amorphous silicon can even be made to the shape of
roof tiles. By doing this, roof tiles on houses can replace normal brick tiles.
9
Figure 2.3: Amorphous Silicon Solar cell
(ModernEnviro, 2014)
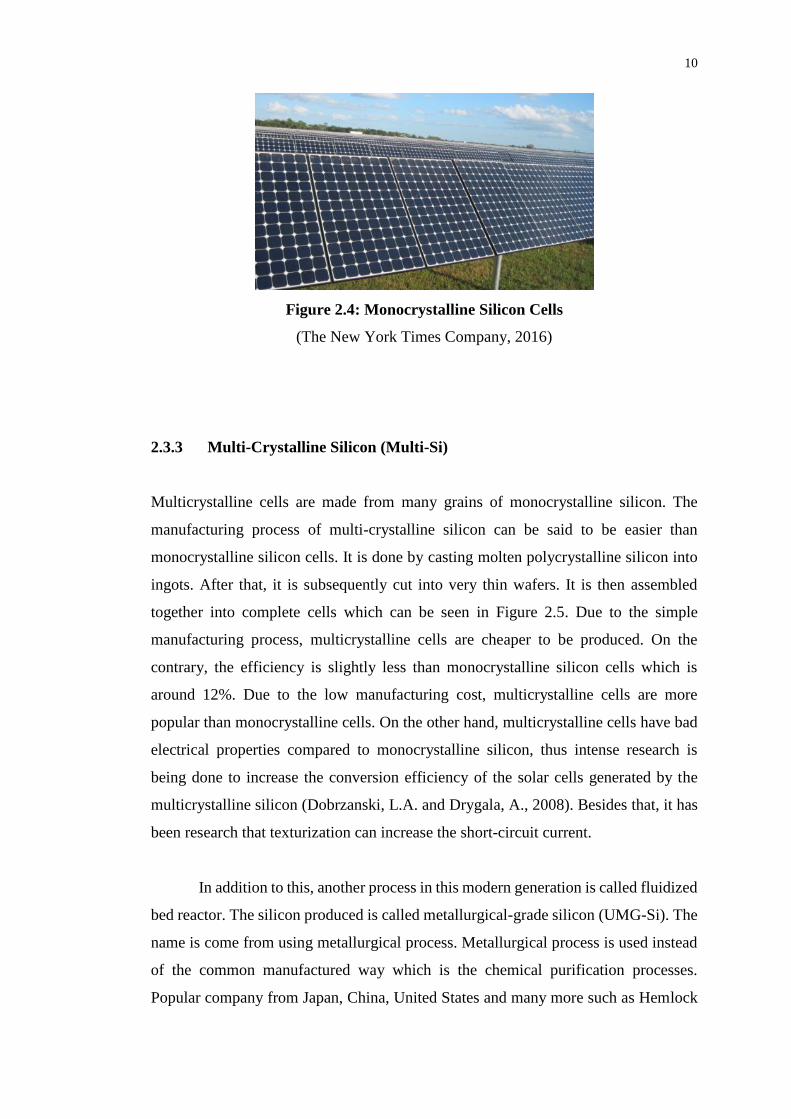
2.3.2 Monocrystalline Silicon Cells (Mono-Si)
This solar cell are made from pure monocrystalline silicon. It has a single continuous
crystal lattice structure based on Figure 2.4. This structure has almost no impurities or
defects. This solar cell is common in solar panel manufacturing industry. The main
reason is monocrystalline cells have high efficiency. The efficiency is relatively
around 15%. However, the main disadvantage is this cell is that it has a complicated
manufacturing process. Pure monocrystalline silicon requires high technology
equipment which requires large investment scheme. By comparing this solar cell with
other solar cell like amorphous silicon, it is relatively more expensive. In addition to
that, crystalline silicon contribution towards photovoltaic solar cells is around 90% of
which one third of them is monocrystalline silicon (Dobrzanski, L.A., et al., 2012).
10
Figure 2.4: Monocrystalline Silicon Cells
(The New York Times Company, 2016)
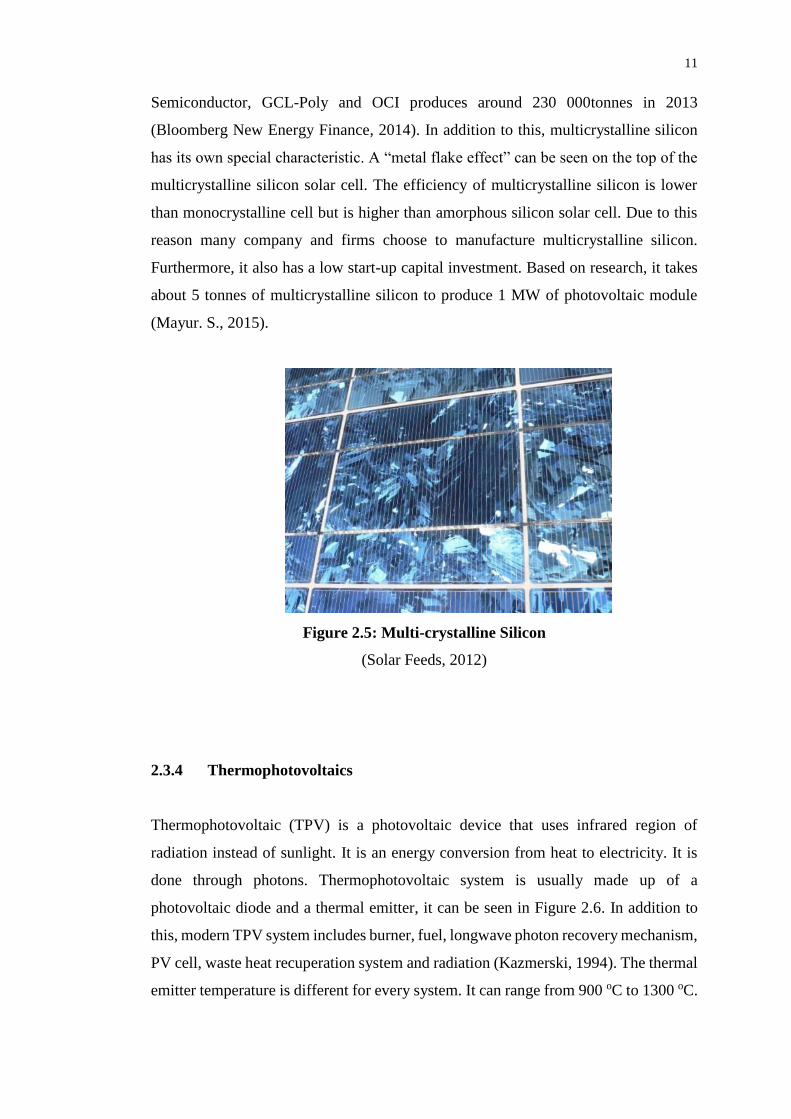
2.3.3 Multi-Crystalline Silicon (Multi-Si)
Multicrystalline cells are made from many grains of monocrystalline silicon. The
manufacturing process of multi-crystalline silicon can be said to be easier than
monocrystalline silicon cells. It is done by casting molten polycrystalline silicon into
ingots. After that, it is subsequently cut into very thin wafers. It is then assembled
together into complete cells which can be seen in Figure 2.5. Due to the simple
manufacturing process, multicrystalline cells are cheaper to be produced. On the
contrary, the efficiency is slightly less than monocrystalline silicon cells which is
around 12%. Due to the low manufacturing cost, multicrystalline cells are more
popular than monocrystalline cells. On the other hand, multicrystalline cells have bad
electrical properties compared to monocrystalline silicon, thus intense research is
being done to increase the conversion efficiency of the solar cells generated by the
multicrystalline silicon (Dobrzanski, L.A. and Drygala, A., 2008). Besides that, it has
been research that texturization can increase the short-circuit current.
In addition to this, another process in this modern generation is called fluidized
bed reactor. The silicon produced is called metallurgical-grade silicon (UMG-Si). The
name is come from using metallurgical process. Metallurgical process is used instead
of the common manufactured way which is the chemical purification processes.
Popular company from Japan, China, United States and many more such as Hemlock
11
Semiconductor, GCL-Poly and OCI produces around 230 000tonnes in 2013
(Bloomberg New Energy Finance, 2014). In addition to this, multicrystalline silicon
has its own special characteristic. A “metal flake effect” can be seen on the top of the
multicrystalline silicon solar cell. The efficiency of multicrystalline silicon is lower
than monocrystalline cell but is higher than amorphous silicon solar cell. Due to this
reason many company and firms choose to manufacture multicrystalline silicon.
Furthermore, it also has a low start-up capital investment. Based on research, it takes
about 5 tonnes of multicrystalline silicon to produce 1 MW of photovoltaic module
(Mayur. S., 2015).
Figure 2.5: Multi-crystalline Silicon
(Solar Feeds, 2012)
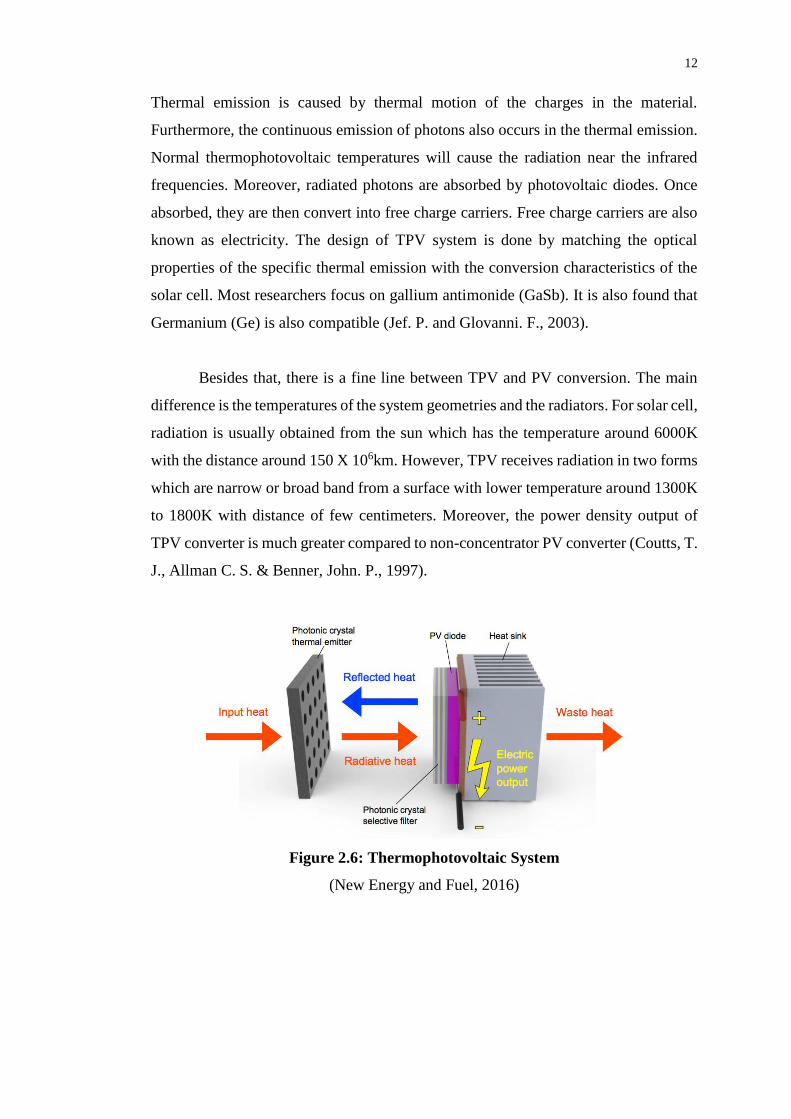
2.3.4 Thermophotovoltaics
Thermophotovoltaic (TPV) is a photovoltaic device that uses infrared region of
radiation instead of sunlight. It is an energy conversion from heat to electricity. It is
done through photons. Thermophotovoltaic system is usually made up of a
photovoltaic diode and a thermal emitter, it can be seen in Figure 2.6. In addition to
this, modern TPV system includes burner, fuel, longwave photon recovery mechanism,
PV cell, waste heat recuperation system and radiation (Kazmerski, 1994). The thermal
emitter temperature is different for every system. It can range from 900 oC to 1300 oC.
12
Thermal emission is caused by thermal motion of the charges in the material.
Furthermore, the continuous emission of photons also occurs in the thermal emission.
Normal thermophotovoltaic temperatures will cause the radiation near the infrared
frequencies. Moreover, radiated photons are absorbed by photovoltaic diodes. Once
absorbed, they are then convert into free charge carriers. Free charge carriers are also
known as electricity. The design of TPV system is done by matching the optical
properties of the specific thermal emission with the conversion characteristics of the
solar cell. Most researchers focus on gallium antimonide (GaSb). It is also found that
Germanium (Ge) is also compatible (Jef. P. and Glovanni. F., 2003).
Besides that, there is a fine line between TPV and PV conversion. The main
difference is the temperatures of the system geometries and the radiators. For solar cell,
radiation is usually obtained from the sun which has the temperature around 6000K
with the distance around 150 X 106km. However, TPV receives radiation in two forms
which are narrow or broad band from a surface with lower temperature around 1300K
to 1800K with distance of few centimeters. Moreover, the power density output of
TPV converter is much greater compared to non-concentrator PV converter (Coutts, T.
J., Allman C. S. & Benner, John. P., 1997).
Figure 2.6: Thermophotovoltaic System
(New Energy and Fuel, 2016)

13
2.4 Factors Affecting the Efficiency of Photovoltaic Module
2.4.1 Temperature
Temperature is one of the major factor that affect the performance of the PV module.
Increase in temperature of the PV module will decrease the voltage, thus lowering the
maximum output power based on Figure 2.7. Any addition increases in temperature
will result in degradation modes of any photovoltaic module. This is because increase
in temperature will increase the stress on the thermal expansion. Furthermore,
degradation rates increase by a factor of two for every increase 10oC in temperature.
The Nominal Operating Cell Temperature (NOCT) of most of the photovoltaic module
is normally 25oC. Furthermore, the current output has minimum changes and it is small
enough to be consider negligible. Furthermore, it also known that solar irradiance
increases when the cell temperature increase (Gail. A. M., 2013).
Figure 2.7: Temperature Effect on PV module
(OPVAP, 2011)
2.4.2 Solar Irradiance
14
Solar irradiance is a form electromagnetic radiation. It is the power per unit area which
is W/m2. It is also the measurement of solar energy that will affect the maximum power
output of any PV cell. Solar irradiance will affect the output current of the PV module.
On the other hand, temperature does not affect the output current. Furthermore, solar
irradiance is a function with respect to the distance from the sun, cross-cycle changes
and the solar cycle (Boxwell, M., 2012). In addition to this, the main factors that affects
the solar irradiance is the sun’s position and the weather conditions.
2.4.3 Cosine Effect
Cosine effect basically means tilting angle. It is the amount of solar energy from the
sun is absorbed by the solar panel. This usually occurs when the sun is not directly
perpendicular to the solar panel. In addition to this, solar irradiance is at its maximum
when the angle between the sun and the surface of the solar panel is 0o.
2.5 Air Gap Distance Effect against Temperature of Solar Panel
One of the important factor that affects the performance of the PV module is the air
gap distance. The air gap can be classify into 2 types which are non-ventilated and
ventilated. Air gap distance is one of the key factor that maintain the temperature of
any solar panel. The gap between the solar panel and the rooftop can determine
whether the heat is trap inside or it is able to escape. In most residential house, heat
enters the house through the rooftop. This concept also applies to solar panel. The gap
must be big enough to regulate the heat between the rooftop and the solar panel.
However, it must not be too large as the pressure of the wind can be too strong and
might blow the solar panel off the roof. If the air gap distance is too small, ventilation
will not occur, thus internal heating of the solar panel will occur. Once internal heating
occur, the temperature of the solar panel will increase, hence making the maximum
output power decrease.
15
2.6 Heat Transfer
2.6.1 Thermal Conduction
Thermal conduction is the microscopic collisions of atoms and particles and the
electrons movement within a body that transfers heat. Conduction can take place in
any matter like plasmas, gases, liquids and solids. Thermal conduction can be also
known as diffusion. The function of temperature difference between the properties of
conductive medium and any two bodies is called temperature gradient. When the
temperature of any body is high, the atoms inside the body move rapidly compared to
the temperature of any body that is low. Furthermore, if any two bodies with different
temperature are put in contact with one another, heat is transfer from the body with the
higher temperature to the body with lower temperature. This is done by the vibration
from the body with higher temperature. The body with higher temperature will
continue to vibrate until it reaches equilibrium. Thermal conduction can also be
applied to solar panel. As the protective glass starts to heat up, it will vibrate causing
the solar cell to increase in temperature.
2.6.2 Radiation
Radiation uses electromagnetic waves to transfer heat. It comes from the word radiate.
Radiate means to spread or send out from a fixed position. Furthermore, radiation
transfer heat by carrying energy from a fixed position to the surrounding space around
it. This energy is carried by electromagnetic waves. It does not involve any interaction
or movement of matter. In addition to this, radiation can also occur through a region
of space or matter such as vacuum. Heat obtained on Earth is from the sun. It is
received by the electromagnetic waves that travels through vacuum between the sun
and the Earth. Solar panel will tend to heat up through the electromagnetic waves from
the sun. Only a partial of the wavelength is able to be convert to electricity by the
photovoltaic cell.
16
2.6.3 Convection
Convection is the movement of fluids that transfer heat from one location to another
location. Gases and liquids are fluids. These fluids will move around the bulk of the
sample of matter. The fluids will carry energy. The movement of the fluid will be from
the high temperature towards the low temperature. Furthermore, convection also
shows how an electric heater in any room warms up the room. The coils of the heater
will warm up the air near it. Heated air will become less dense and start to rise. After
that cold air will tend to move to the bottom of the room as the hot air risen. Once the
cold air reaches the bottom of the room, the coils of the heater will heat it up, making
the air to rise. Convection currents will start to form slowly. These air also carry energy
that is obtained from the electric heater. The same application also applies to the solar
panel. The hot air absorbed by the metal deck will rise and heat up the solar panel, thus
forcing the cold air to fall onto the metal deck. After a while, the sun will then heat up
the cold air forcing it to rise once again to heat up the solar panel. Convection will stop
once it reaches equilibrium. Based on research, equilibrium usually takes around
fifteen minutes (Armstrong, S. and Hurley, W.G., 2010).
17
CHAPTER 3
3 METHODOLOGY
3.1 Flow Chart Procedure
3.2 Equipment and Apparatus
There are several equipment and apparatus used in this project. They are as follows:
1. Pyranometer
2. Multimeter
3. Electrical Wiring
4. CF-260 Photovoltaic Module
Determining
Aims and
Objectives
Researching
on Journals
and Reference
Books
Designing
Experiment
Procedures
Experiments on
Water Spraying
System
Collection
of Data
Improvement
of Experiment
Setup
Implementing New
Experiment Setup Analyze Data Conclusion
Data Logging
Algorithm
Writing
Experiments on
Water Dripping
System
18
5. Supporting Beams
6. Water Hose
7. Polyvinyl Chloride (PVC) Pipe
8. Data Logger
9. DS18B20 and DHT22 Temperature Sensors
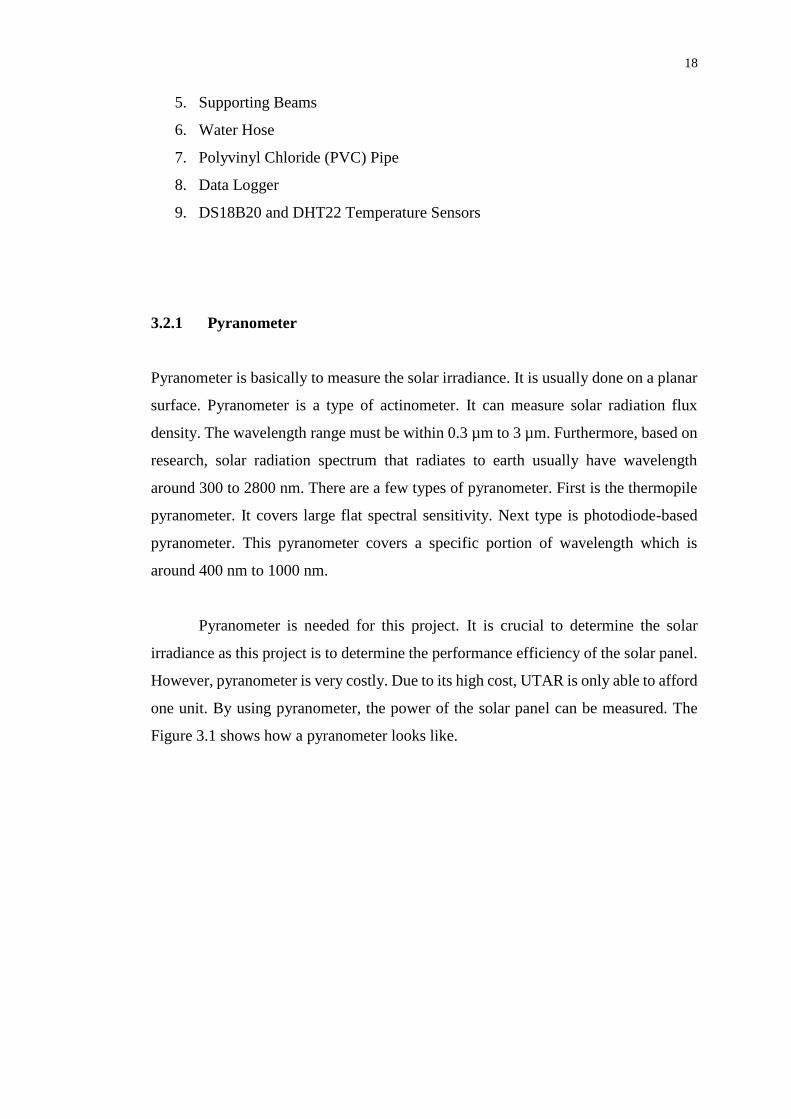
3.2.1 Pyranometer
Pyranometer is basically to measure the solar irradiance. It is usually done on a planar
surface. Pyranometer is a type of actinometer. It can measure solar radiation flux
density. The wavelength range must be within 0.3 µm to 3 µm. Furthermore, based on
research, solar radiation spectrum that radiates to earth usually have wavelength
around 300 to 2800 nm. There are a few types of pyranometer. First is the thermopile
pyranometer. It covers large flat spectral sensitivity. Next type is photodiode-based
pyranometer. This pyranometer covers a specific portion of wavelength which is
around 400 nm to 1000 nm.
Pyranometer is needed for this project. It is crucial to determine the solar
irradiance as this project is to determine the performance efficiency of the solar panel.
However, pyranometer is very costly. Due to its high cost, UTAR is only able to afford
one unit. By using pyranometer, the power of the solar panel can be measured. The
Figure 3.1 shows how a pyranometer looks like.
19
Figure 3.1: Pyranometer
(The Eppley Laboratory, INC., 2016)
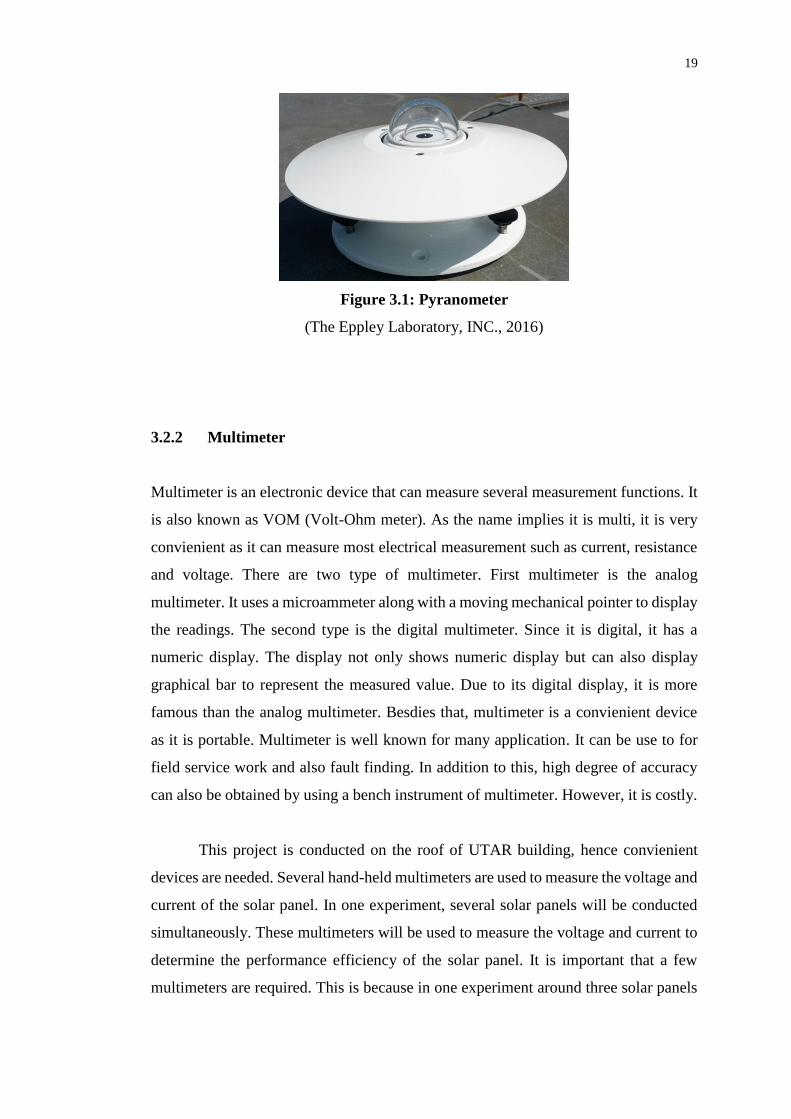
3.2.2 Multimeter
Multimeter is an electronic device that can measure several measurement functions. It
is also known as VOM (Volt-Ohm meter). As the name implies it is multi, it is very
convienient as it can measure most electrical measurement such as current, resistance
and voltage. There are two type of multimeter. First multimeter is the analog
multimeter. It uses a microammeter along with a moving mechanical pointer to display
the readings. The second type is the digital multimeter. Since it is digital, it has a
numeric display. The display not only shows numeric display but can also display
graphical bar to represent the measured value. Due to its digital display, it is more
famous than the analog multimeter. Besdies that, multimeter is a convienient device
as it is portable. Multimeter is well known for many application. It can be use to for
field service work and also fault finding. In addition to this, high degree of accuracy
can also be obtained by using a bench instrument of multimeter. However, it is costly.
This project is conducted on the roof of UTAR building, hence convienient
devices are needed. Several hand-held multimeters are used to measure the voltage and
current of the solar panel. In one experiment, several solar panels will be conducted
simultaneously. These multimeters will be used to measure the voltage and current to
determine the performance efficiency of the solar panel. It is important that a few
multimeters are required. This is because in one experiment around three solar panels
20
are conducted paralelly. It is important that the solar panels are conducted at the same
time. This is because the solar irradiance is not the same during morning and afternoon.
It is not the same even for the next day having the same time. Therefore, multimeters
play an important role for this project. Figure 3.2 shows a multimeter.
Figure 3.2: Multimeter
(Thomas Publishing Company, 2016)
3.2.3 Electrical Wiring
Electrical wiring is also an important process in this project. Electronic devices such
as computer, pyranometer and solar panel have wires and they are connected together.
Once they are connected together, they are simulated to produce a result. The result is
then analyze to produce the performance of the solar panel.
3.2.4 Solar Panel
Solar panel is the main component for this project. As the study and research revolves
around the solar panel. The model of solar panel used is CF-260 Photovoltaic Module
21
from the company Malaysian Solar Resources Sdn Bhd. Solar panels are studied in
this project to increase its efficiency.
3.2.5 Supporting Beams
Supporting Beams are the based structure of the solar panel. It is used to hold the solar
panel in position. Furthermore, supporting beams are also used to hold the rooftop
material below the solar panel such as metal deck and roof tile. In addition to this,
supporting beams can also be used for the study of tilting angle. Inclination of the solar
panel can be done by adjusting the supporting beams in such a way that it is incline in
a specific angle such as 0o, 10o and 20o.
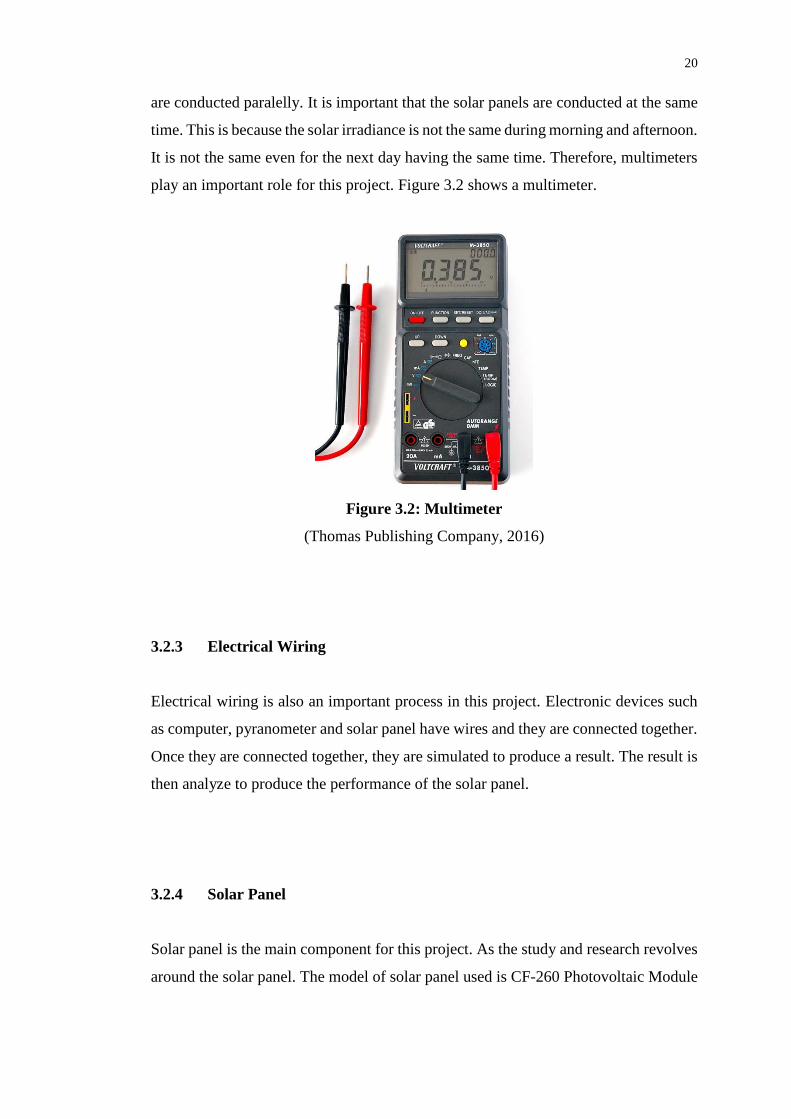
3.2.6 Water Hose
The study of temperature against the performance efficiency of the solar panel are
studied. Water hoses are used to spray the solar panel to lower down its temperature
to increase its effciency. Figure 3.3 shows how a water hose looks like.
Figure 3.3: Water Hose
(Harbor Freight Tools, 2016)
22
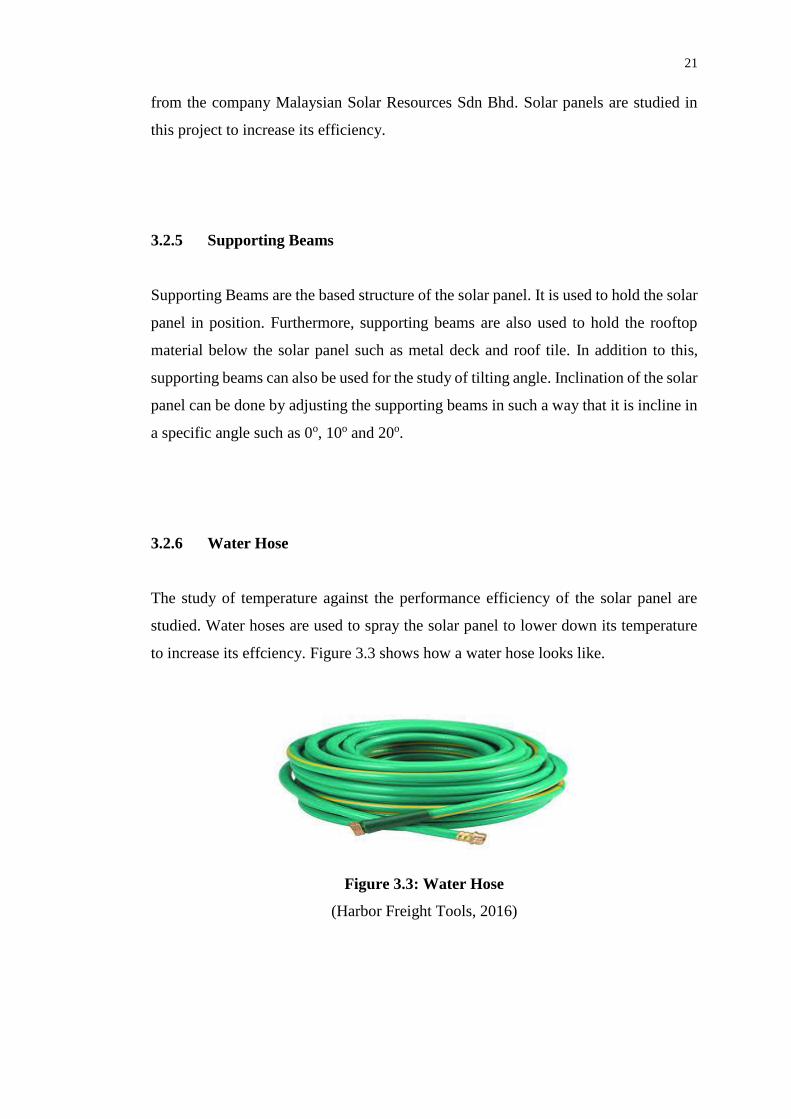
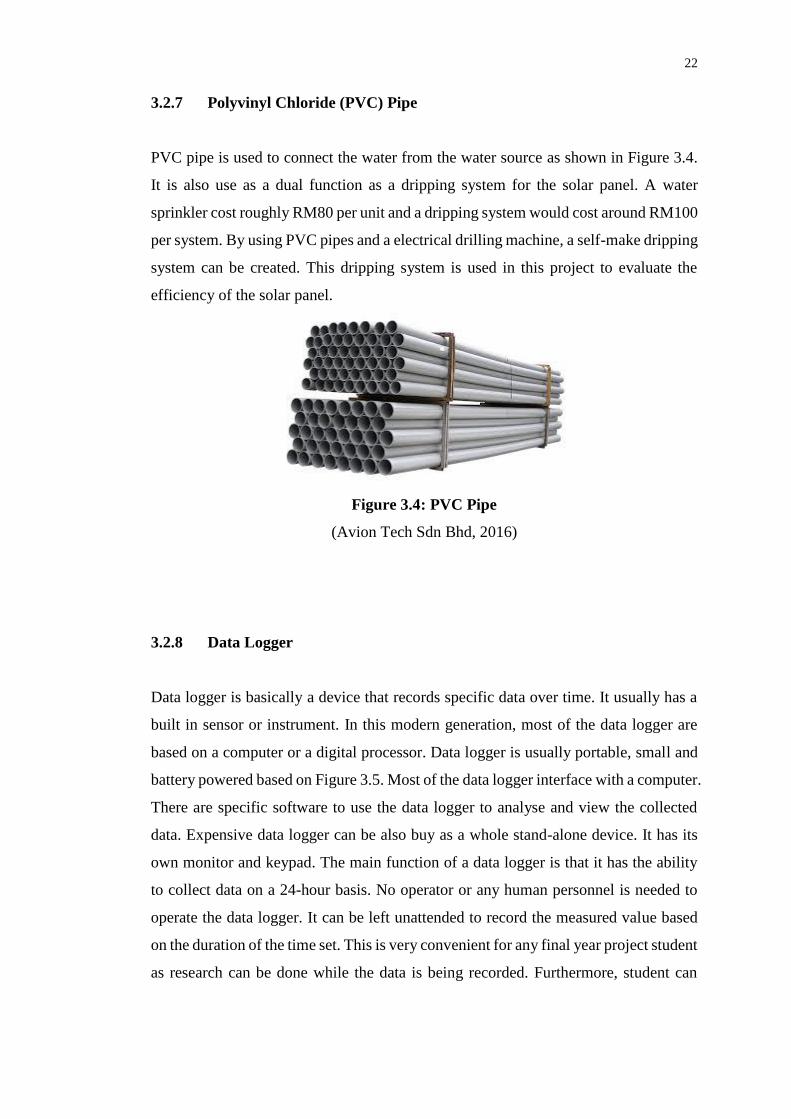
3.2.7 Polyvinyl Chloride (PVC) Pipe
PVC pipe is used to connect the water from the water source as shown in Figure 3.4.
It is also use as a dual function as a dripping system for the solar panel. A water
sprinkler cost roughly RM80 per unit and a dripping system would cost around RM100
per system. By using PVC pipes and a electrical drilling machine, a self-make dripping
system can be created. This dripping system is used in this project to evaluate the
efficiency of the solar panel.
Figure 3.4: PVC Pipe
(Avion Tech Sdn Bhd, 2016)
3.2.8 Data Logger
Data logger is basically a device that records specific data over time. It usually has a
built in sensor or instrument. In this modern generation, most of the data logger are
based on a computer or a digital processor. Data logger is usually portable, small and
battery powered based on Figure 3.5. Most of the data logger interface with a computer.
There are specific software to use the data logger to analyse and view the collected
data. Expensive data logger can be also buy as a whole stand-alone device. It has its
own monitor and keypad. The main function of a data logger is that it has the ability
to collect data on a 24-hour basis. No operator or any human personnel is needed to
operate the data logger. It can be left unattended to record the measured value based
on the duration of the time set. This is very convenient for any final year project student
as research can be done while the data is being recorded. Furthermore, student can
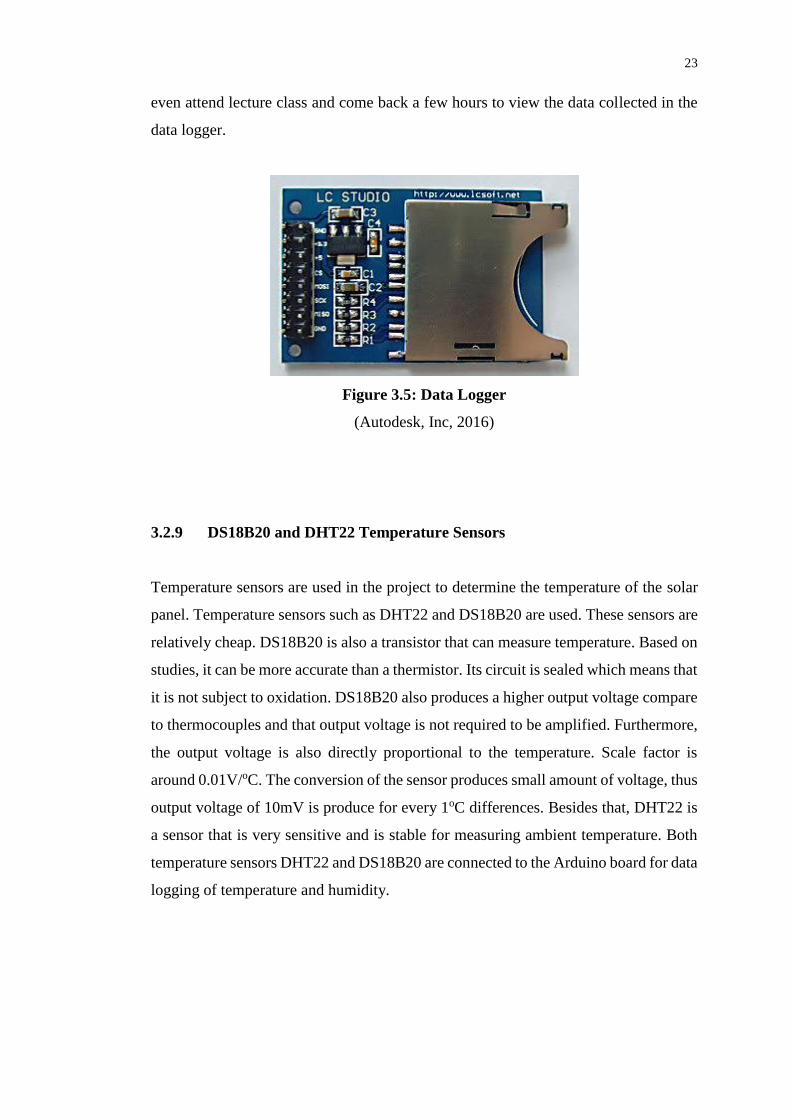
23
even attend lecture class and come back a few hours to view the data collected in the
data logger.
Figure 3.5: Data Logger
(Autodesk, Inc, 2016)
3.2.9 DS18B20 and DHT22 Temperature Sensors
Temperature sensors are used in the project to determine the temperature of the solar
panel. Temperature sensors such as DHT22 and DS18B20 are used. These sensors are
relatively cheap. DS18B20 is also a transistor that can measure temperature. Based on
studies, it can be more accurate than a thermistor. Its circuit is sealed which means that
it is not subject to oxidation. DS18B20 also produces a higher output voltage compare
to thermocouples and that output voltage is not required to be amplified. Furthermore,
the output voltage is also directly proportional to the temperature. Scale factor is
around 0.01V/oC. The conversion of the sensor produces small amount of voltage, thus
output voltage of 10mV is produce for every 1oC differences. Besides that, DHT22 is
a sensor that is very sensitive and is stable for measuring ambient temperature. Both
temperature sensors DHT22 and DS18B20 are connected to the Arduino board for data
logging of temperature and humidity.
24
3.3 Experiment Setup
Experiments are set up to in order to study the efficiency of the solar panel. Supporting
beams are used as the foundation of the solar panel. It is set up with an inclination
angle of 10o and an air gap of 10cm. This project is mainly focus on the temperature
of the solar panel. Furthermore, the project is used to stimulate real life condition and
situation. Metal deck is used as most factory uses metal deck. This is to test the
performance of the solar panel using metal deck as the rooftop material. The
experiment is set up by setting up the supporting beams as the base. Total of 2 solar
panels are set up. Each piece of solar panel is supported by 2 vertical supporting beams
on both ends. The supporting beams are locked with brackets and bolts with nuts. The
metal deck is mount below the solar panel. The inclination angle of 10o is used because
this can improve the results obtained. Furthermore due to its inclination, raindrops or
any water source will roll down the solar panel absorbing the heat. It will also wash
off any dirt, thus increasing its efficiency. Air gap of 10cm is used to make the
ventilation of the solar panel bad. By doing this, the temperature of the solar panel will
increase, thus making it easier to see the comparison between both solar panel. By
having air gap of 10cm it can also increase the internal heating of the solar panel. Since
one of the solar panel is a reference and the other is the variable, various method of
cooling the solar panel is used. This is to study the various cooling performance on the
efficiency of the solar panel. Furthermore, by having such a large air gap, strong wind
can blow off the solar panel easily, thus air gap of 10cm will not be a problem when
strong wind occurs.
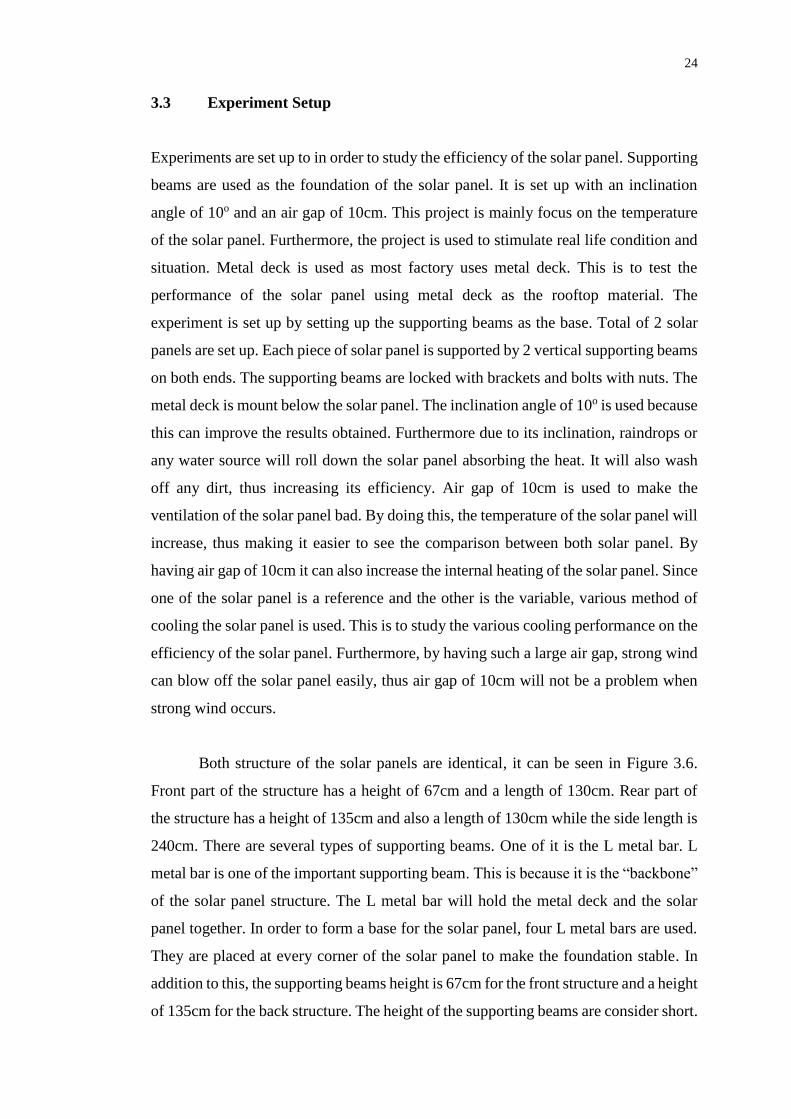
Both structure of the solar panels are identical, it can be seen in Figure 3.6.
Front part of the structure has a height of 67cm and a length of 130cm. Rear part of
the structure has a height of 135cm and also a length of 130cm while the side length is
240cm. There are several types of supporting beams. One of it is the L metal bar. L
metal bar is one of the important supporting beam. This is because it is the “backbone”
of the solar panel structure. The L metal bar will hold the metal deck and the solar
panel together. In order to form a base for the solar panel, four L metal bars are used.
They are placed at every corner of the solar panel to make the foundation stable. In
addition to this, the supporting beams height is 67cm for the front structure and a height
of 135cm for the back structure. The height of the supporting beams are consider short.
25
By doing this it will lower the center of gravity of the solar panel, increasing its
stability. Rainy days will have a very strong wind pressure that can blow off the solar
panel. Therefore, it is important to have a solid foundation. Metal deck is installed
below the solar panel.
Installation of the metal deck must be properly install. The metal deck must be
placed at the center of the solar panel. The distance between every corner and edge
must be identical. Sunlight will produce two type of energies which are heat energy
and light energy. The heat energy will be absorbed by the metal deck, thus it is
important that the metal deck is at the middle of the solar panel when it is placed below
the solar panel. The heat energy absorbed from the sun will be evenly distributed by
the metal deck and some of the heat is absorbed by the solar panel. The evenly
distributed heat to the solar panel is important because this project is mainly focus on
the effects of external water source to increase the efficiency of the solar panel.
Figure 3.6: Structure of the Solar Panels
26
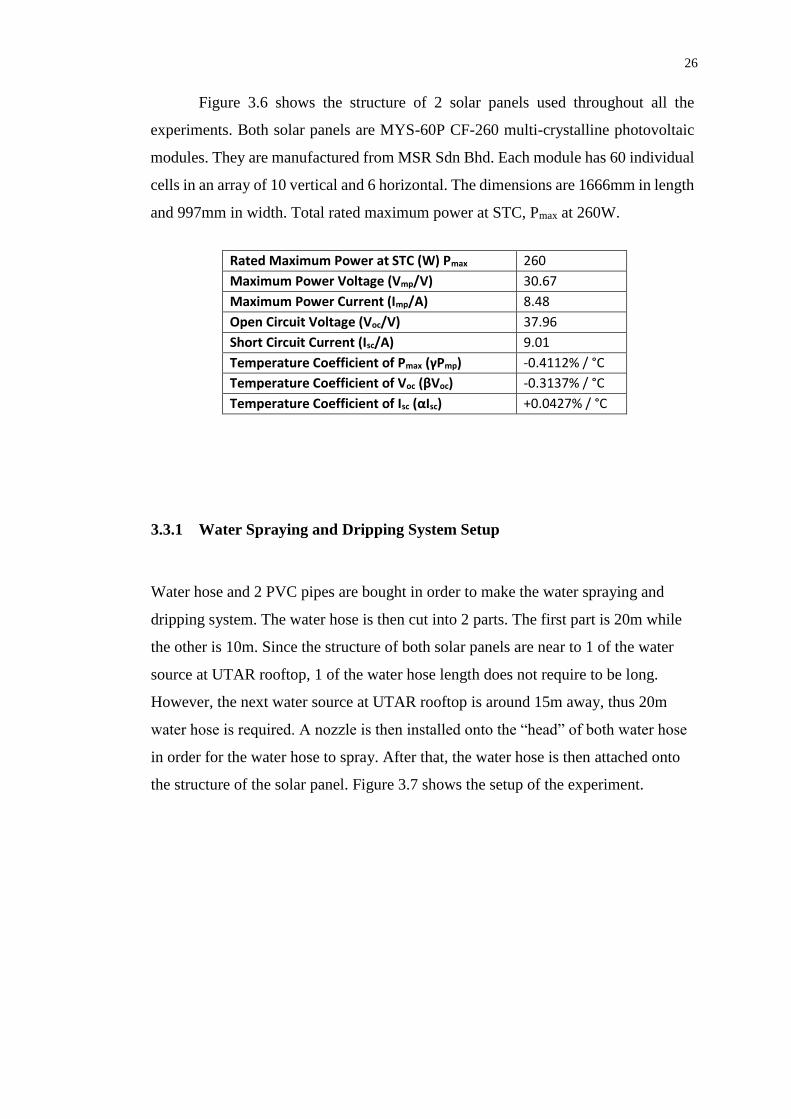
Figure 3.6 shows the structure of 2 solar panels used throughout all the
experiments. Both solar panels are MYS-60P CF-260 multi-crystalline photovoltaic
modules. They are manufactured from MSR Sdn Bhd. Each module has 60 individual
cells in an array of 10 vertical and 6 horizontal. The dimensions are 1666mm in length
and 997mm in width. Total rated maximum power at STC, Pmax at 260W.
Rated Maximum Power at STC (W) Pmax 260
Maximum Power Voltage (Vmp/V) 30.67
Maximum Power Current (Imp/A) 8.48
Open Circuit Voltage (Voc/V) 37.96
Short Circuit Current (Isc/A) 9.01
Temperature Coefficient of Pmax (γPmp) -0.4112% / °C
Temperature Coefficient of Voc (βVoc) -0.3137% / °C
Temperature Coefficient of Isc (αIsc) +0.0427% / °C
3.3.1 Water Spraying and Dripping System Setup
Water hose and 2 PVC pipes are bought in order to make the water spraying and
dripping system. The water hose is then cut into 2 parts. The first part is 20m while
the other is 10m. Since the structure of both solar panels are near to 1 of the water
source at UTAR rooftop, 1 of the water hose length does not require to be long.
However, the next water source at UTAR rooftop is around 15m away, thus 20m
water hose is required. A nozzle is then installed onto the “head” of both water hose
in order for the water hose to spray. After that, the water hose is then attached onto
the structure of the solar panel. Figure 3.7 shows the setup of the experiment.
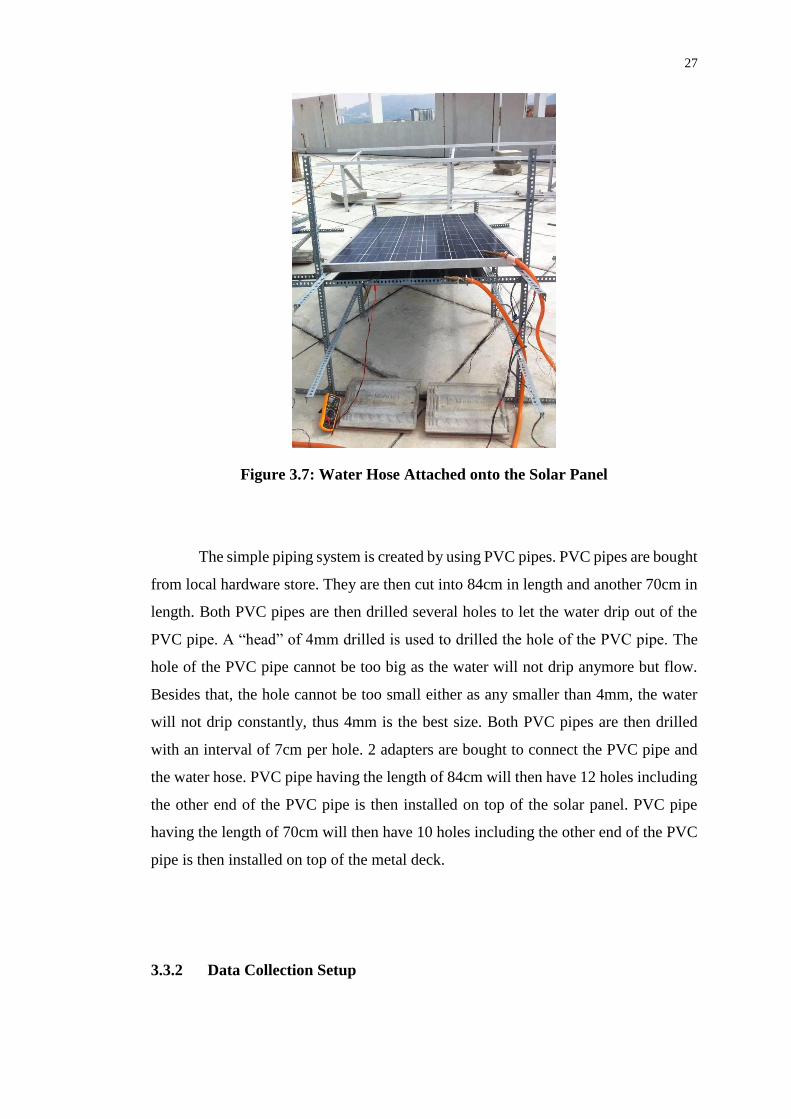
27
Figure 3.7: Water Hose Attached onto the Solar Panel
The simple piping system is created by using PVC pipes. PVC pipes are bought
from local hardware store. They are then cut into 84cm in length and another 70cm in
length. Both PVC pipes are then drilled several holes to let the water drip out of the
PVC pipe. A “head” of 4mm drilled is used to drilled the hole of the PVC pipe. The
hole of the PVC pipe cannot be too big as the water will not drip anymore but flow.
Besides that, the hole cannot be too small either as any smaller than 4mm, the water
will not drip constantly, thus 4mm is the best size. Both PVC pipes are then drilled
with an interval of 7cm per hole. 2 adapters are bought to connect the PVC pipe and
the water hose. PVC pipe having the length of 84cm will then have 12 holes including
the other end of the PVC pipe is then installed on top of the solar panel. PVC pipe
having the length of 70cm will then have 10 holes including the other end of the PVC
pipe is then installed on top of the metal deck.
3.3.2 Data Collection Setup
28
Data collection setup has two main parts. They are automated collection and manual
collection. Manual collection involves reading on multimeters. Multimeters are
connected to the solar panels in order to measure the current and voltage. Pyranometer
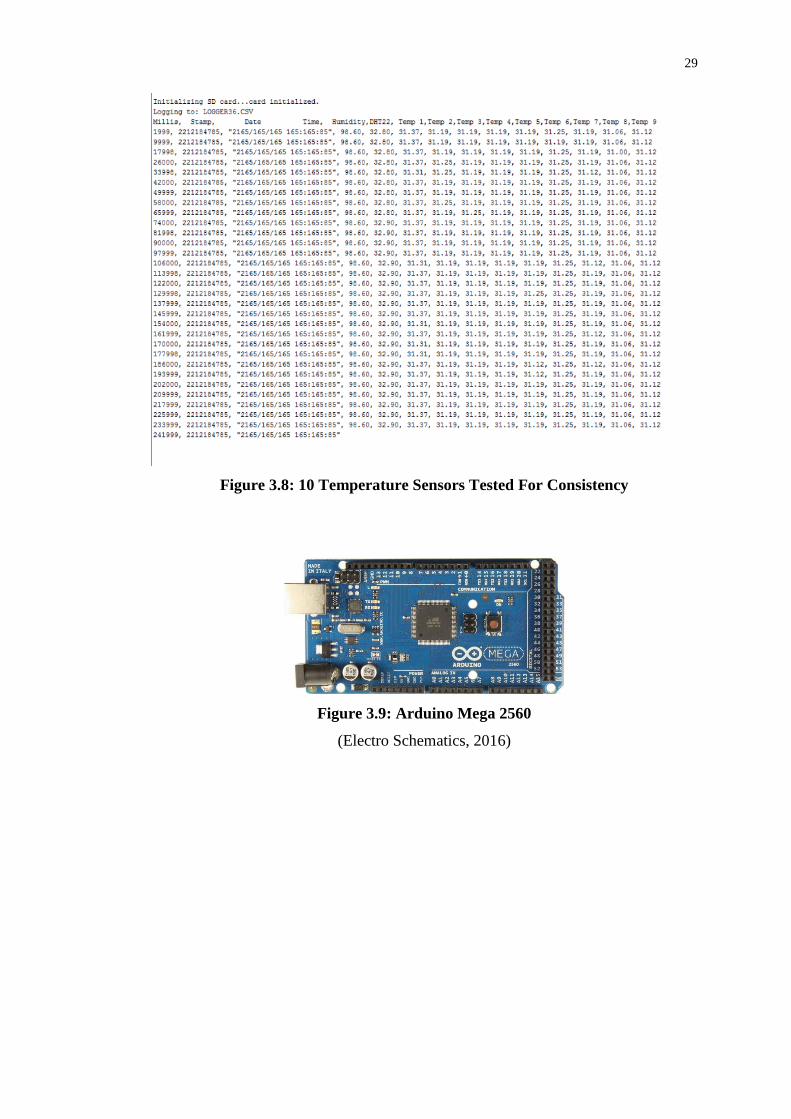
is used to measure the power of the solar irradiance. Automated collection is done by
using Arduino as shown in Figure 3.9. They are total of 10 temperature sensors in this
experiment to measure the temperature. However only 7 temperature sensors are used
while the other 3 served as a backup temperature sensor. 1 DHT22 and 6 DS18B20 are
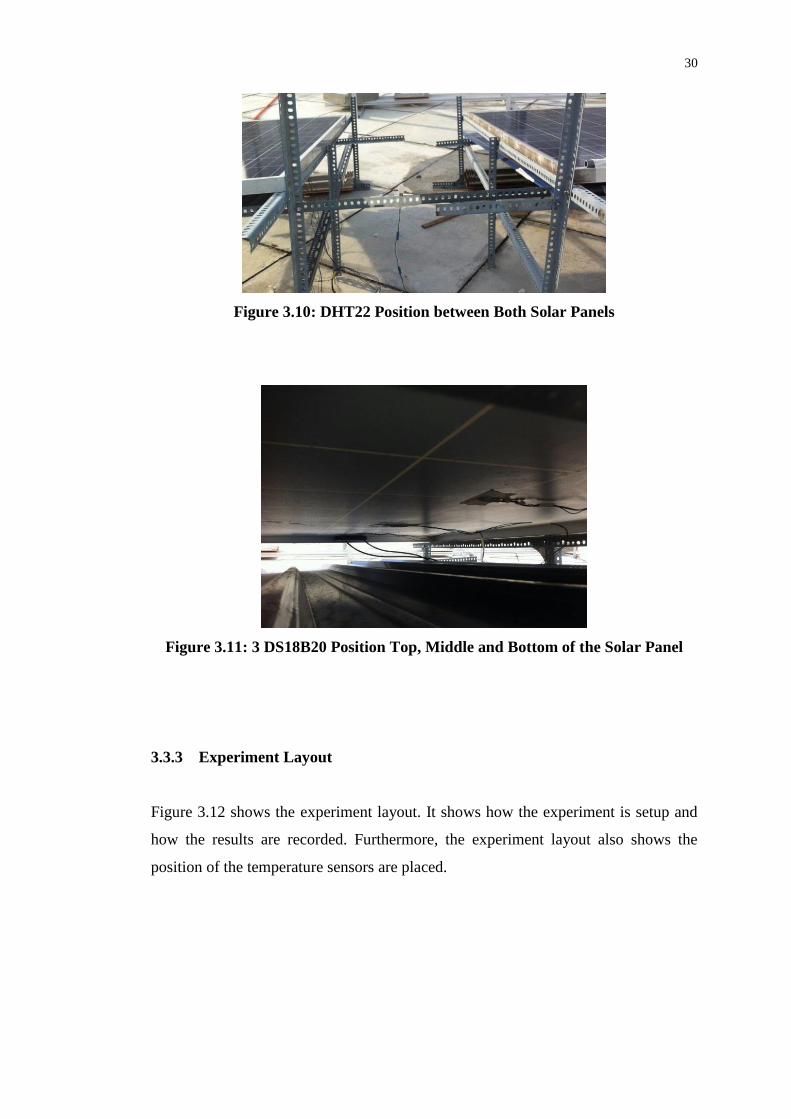
used to measure the temperature. DHT22 is used to measure the ambient temperature
and the humidity. The DHT 22 is placed between both of the solar panels based on
Figure 3.10. By doing this, the ambient temperature and the humidity is more accurate
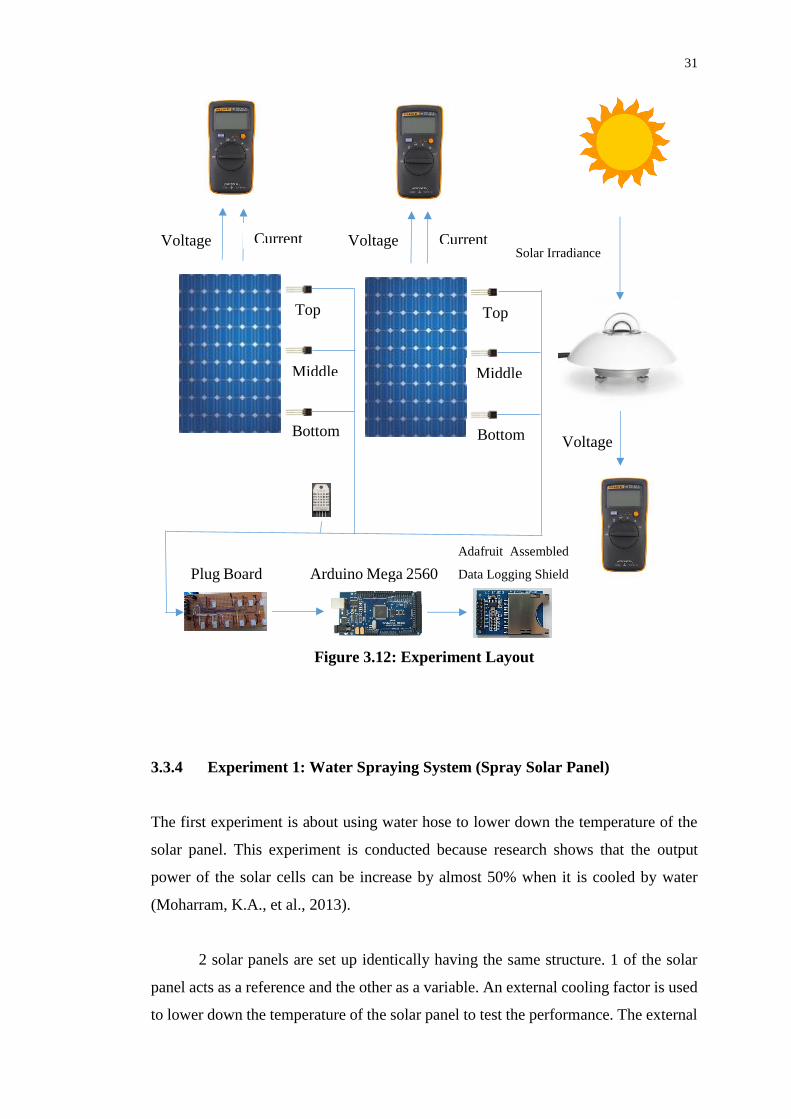
and not bias. DS18B20 is used to measure the temperature of the solar panels. They
are install underneath the solar panel. 3 DS18B20 is installed for each solar panel.
They are position top, middle and bottom of the solar panel as shown in Figure 3.11.
The sensors are connected to a plug board that is specially design for the sensors. The
special advantage of the plug board is that it is very convenient as it is very portable.
It can be remove and install easily. This plug board is then connected to the Arduino.
The Arduino then convert and stores the data onto the data logger that was installed on
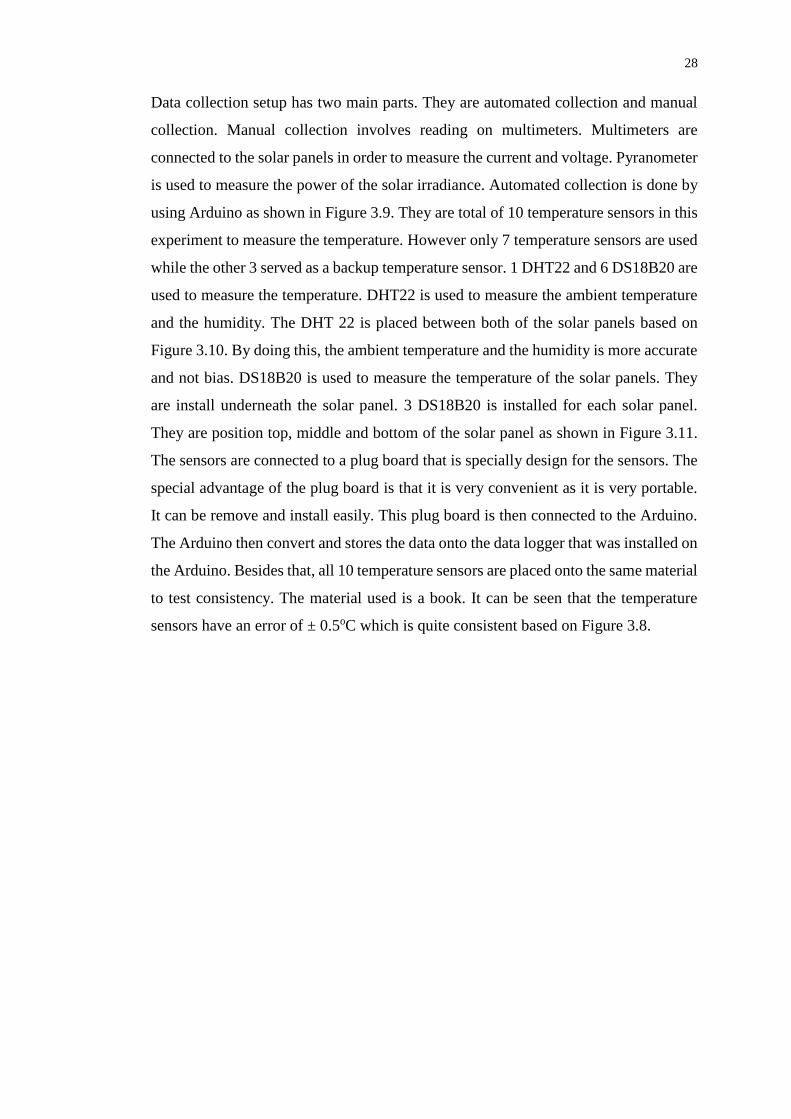
the Arduino. Besides that, all 10 temperature sensors are placed onto the same material
to test consistency. The material used is a book. It can be seen that the temperature
sensors have an error of ± 0.5oC which is quite consistent based on Figure 3.8.
29
Figure 3.8: 10 Temperature Sensors Tested For Consistency
Figure 3.9: Arduino Mega 2560
(Electro Schematics, 2016)
30
Figure 3.10: DHT22 Position between Both Solar Panels
Figure 3.11: 3 DS18B20 Position Top, Middle and Bottom of the Solar Panel
3.3.3 Experiment Layout
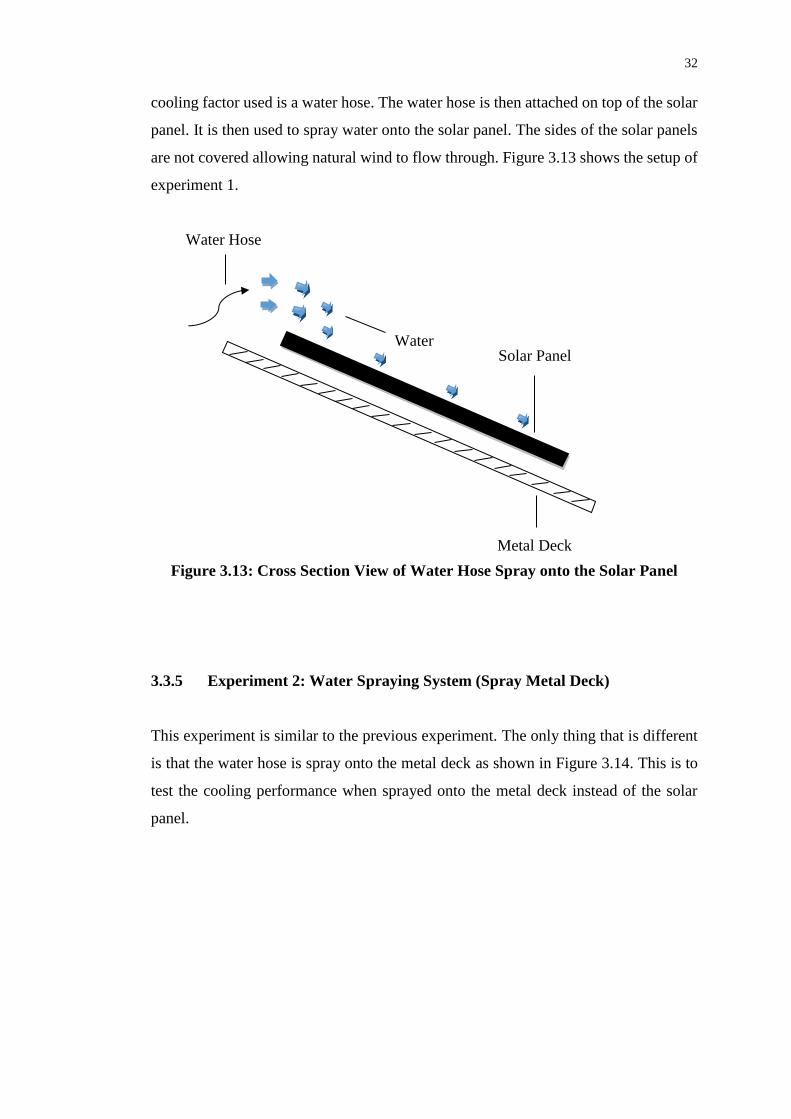
Figure 3.12 shows the experiment layout. It shows how the experiment is setup and
how the results are recorded. Furthermore, the experiment layout also shows the
position of the temperature sensors are placed.
31
Figure 3.12: Experiment Layout
3.3.4 Experiment 1: Water Spraying System (Spray Solar Panel)
The first experiment is about using water hose to lower down the temperature of the
solar panel. This experiment is conducted because research shows that the output
power of the solar cells can be increase by almost 50% when it is cooled by water
(Moharram, K.A., et al., 2013).
2 solar panels are set up identically having the same structure. 1 of the solar
panel acts as a reference and the other as a variable. An external cooling factor is used
to lower down the temperature of the solar panel to test the performance. The external
Top Top
Middle Middle
Bottom Bottom
Current Current Voltage Voltage Solar Irradiance
Arduino Mega 2560 Plug Board
Voltage
Adafruit Assembled
Data Logging Shield
32
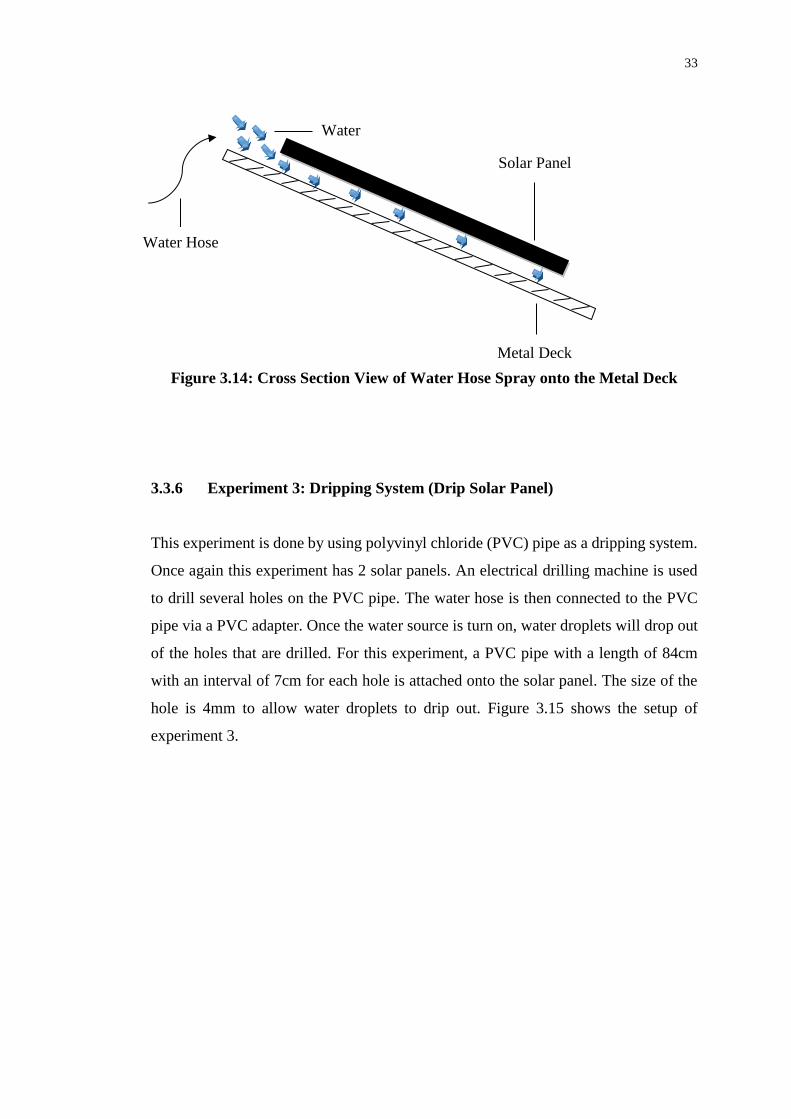
cooling factor used is a water hose. The water hose is then attached on top of the solar
panel. It is then used to spray water onto the solar panel. The sides of the solar panels
are not covered allowing natural wind to flow through. Figure 3.13 shows the setup of
experiment 1.
Figure 3.13: Cross Section View of Water Hose Spray onto the Solar Panel
3.3.5 Experiment 2: Water Spraying System (Spray Metal Deck)
This experiment is similar to the previous experiment. The only thing that is different
is that the water hose is spray onto the metal deck as shown in Figure 3.14. This is to
test the cooling performance when sprayed onto the metal deck instead of the solar
panel.
Metal Deck
Water
Water Hose
Solar Panel
33
Figure 3.14: Cross Section View of Water Hose Spray onto the Metal Deck
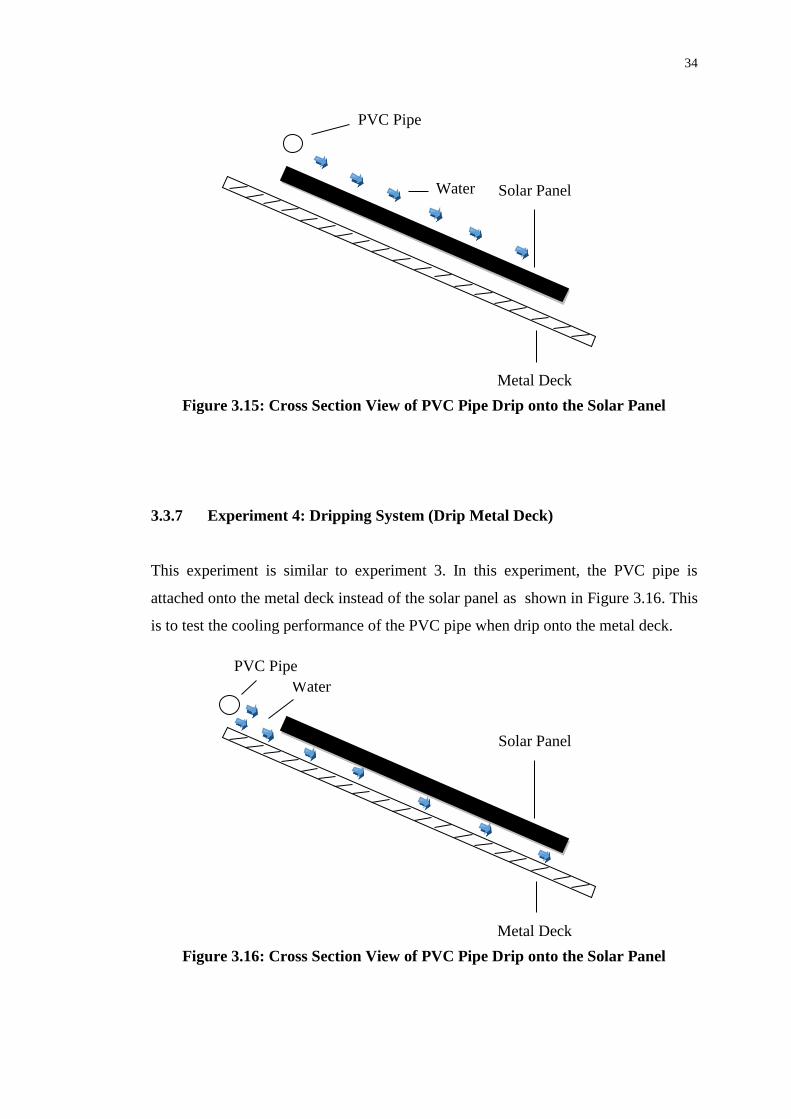
3.3.6 Experiment 3: Dripping System (Drip Solar Panel)
This experiment is done by using polyvinyl chloride (PVC) pipe as a dripping system.
Once again this experiment has 2 solar panels. An electrical drilling machine is used
to drill several holes on the PVC pipe. The water hose is then connected to the PVC
pipe via a PVC adapter. Once the water source is turn on, water droplets will drop out
of the holes that are drilled. For this experiment, a PVC pipe with a length of 84cm
with an interval of 7cm for each hole is attached onto the solar panel. The size of the
hole is 4mm to allow water droplets to drip out. Figure 3.15 shows the setup of
experiment 3.
Metal Deck
Water
Water Hose
Solar Panel
34
Figure 3.15: Cross Section View of PVC Pipe Drip onto the Solar Panel
3.3.7 Experiment 4: Dripping System (Drip Metal Deck)
This experiment is similar to experiment 3. In this experiment, the PVC pipe is
attached onto the metal deck instead of the solar panel as shown in Figure 3.16. This
is to test the cooling performance of the PVC pipe when drip onto the metal deck.
Figure 3.16: Cross Section View of PVC Pipe Drip onto the Solar Panel
Water
Metal Deck
Solar Panel
PVC Pipe
Water
Metal Deck
Solar Panel
PVC Pipe
35
3.4 Additional Experiments
Another 2 more extra experiments are conducted to further improve the performance
of the solar panel. There is a potential to increase the efficiency of the solar panel by
using the spraying system and the dripping system to lower down the temperature of
both solar panel and metal deck at the same time.
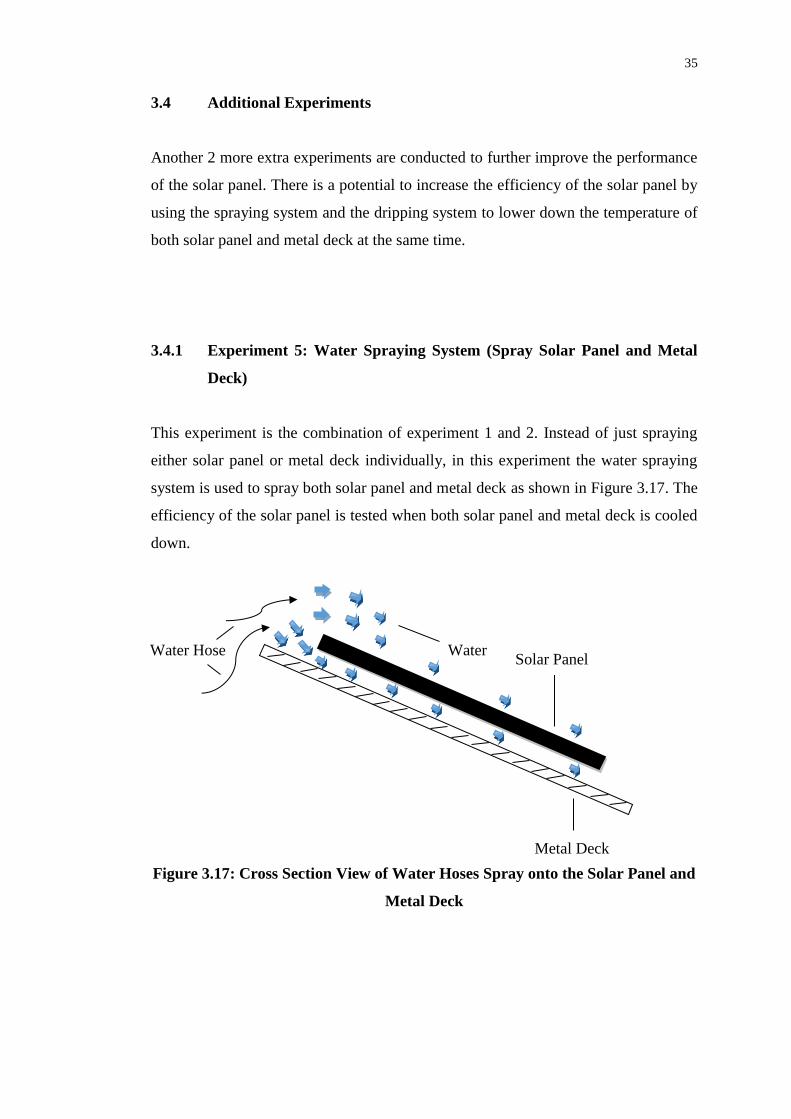
3.4.1 Experiment 5: Water Spraying System (Spray Solar Panel and Metal
Deck)
This experiment is the combination of experiment 1 and 2. Instead of just spraying
either solar panel or metal deck individually, in this experiment the water spraying
system is used to spray both solar panel and metal deck as shown in Figure 3.17. The
efficiency of the solar panel is tested when both solar panel and metal deck is cooled
down.
Figure 3.17: Cross Section View of Water Hoses Spray onto the Solar Panel and
Metal Deck
Metal Deck
Water Hose Solar Panel
Water
36
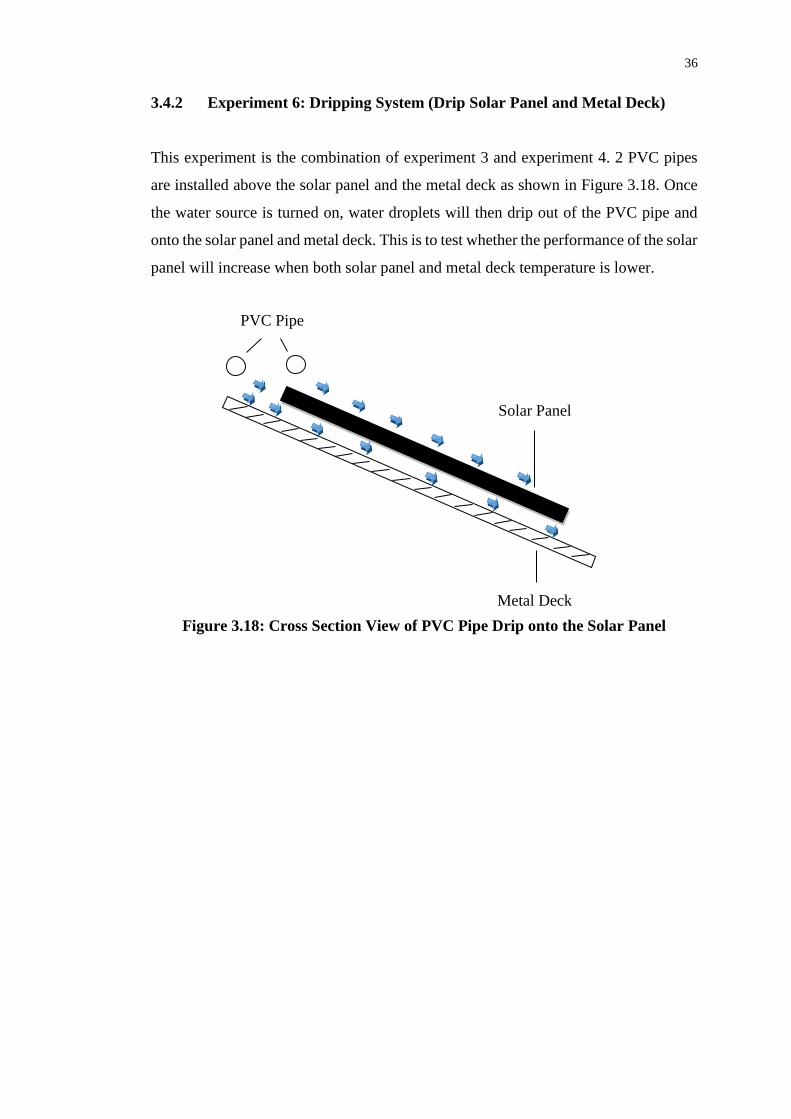
3.4.2 Experiment 6: Dripping System (Drip Solar Panel and Metal Deck)
This experiment is the combination of experiment 3 and experiment 4. 2 PVC pipes
are installed above the solar panel and the metal deck as shown in Figure 3.18. Once
the water source is turned on, water droplets will then drip out of the PVC pipe and
onto the solar panel and metal deck. This is to test whether the performance of the solar
panel will increase when both solar panel and metal deck temperature is lower.
Figure 3.18: Cross Section View of PVC Pipe Drip onto the Solar Panel
Metal Deck
Solar Panel
PVC Pipe
37
CHAPTER 4
4 RESULTS AND DISCUSSION
4.1 Pre-Analysis
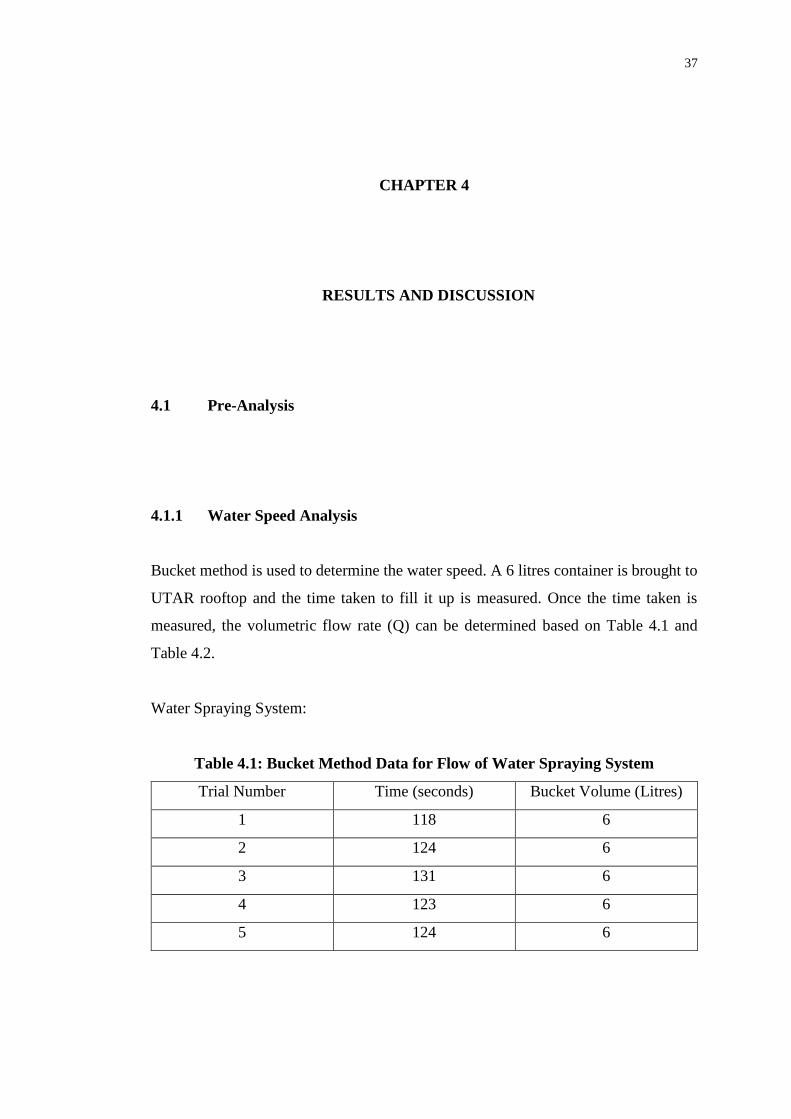
4.1.1 Water Speed Analysis
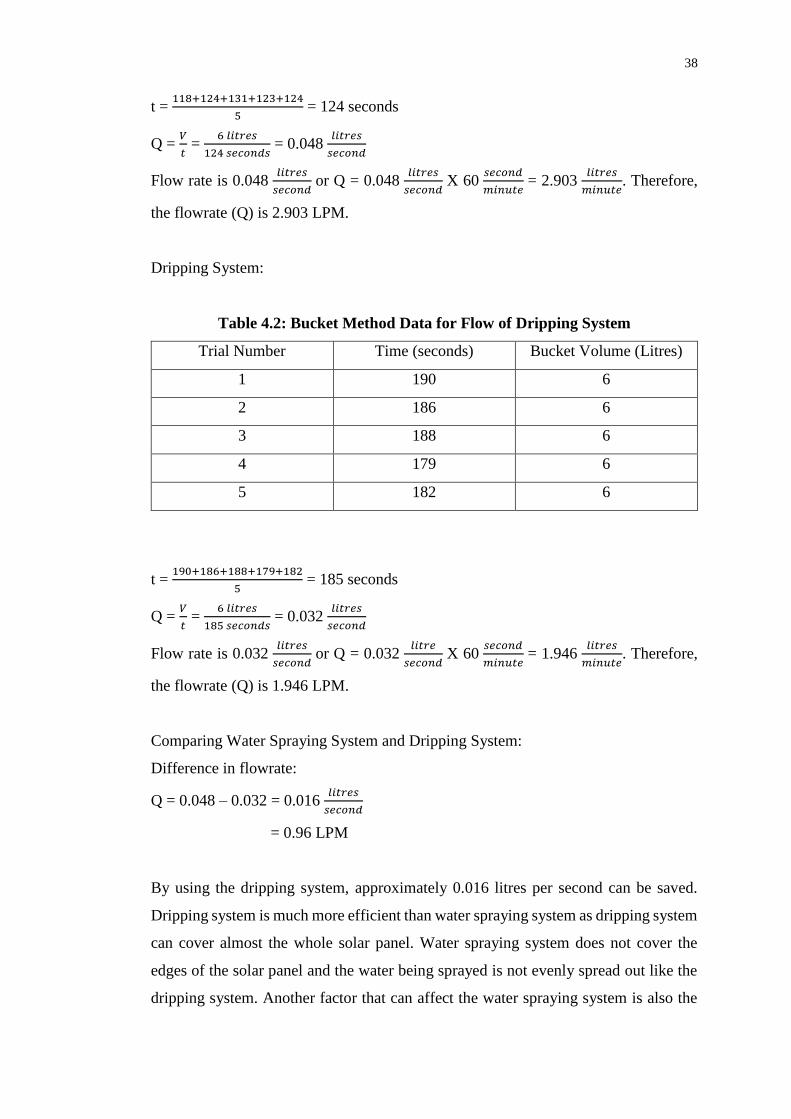
Bucket method is used to determine the water speed. A 6 litres container is brought to
UTAR rooftop and the time taken to fill it up is measured. Once the time taken is
measured, the volumetric flow rate (Q) can be determined based on Table 4.1 and
Table 4.2.
Water Spraying System:
Table 4.1: Bucket Method Data for Flow of Water Spraying System
Trial Number Time (seconds) Bucket Volume (Litres)
1 118 6
2 124 6
3 131 6
4 123 6
5 124 6
38
t = 118+124+131+123+124
5 = 124 seconds
Q = 𝑉
𝑡 =
6 𝑙𝑖𝑡𝑟𝑒𝑠
124 𝑠𝑒𝑐𝑜𝑛𝑑𝑠 = 0.048
𝑙𝑖𝑡𝑟𝑒𝑠
𝑠𝑒𝑐𝑜𝑛𝑑
Flow rate is 0.048 𝑙𝑖𝑡𝑟𝑒𝑠
𝑠𝑒𝑐𝑜𝑛𝑑 or Q = 0.048
𝑙𝑖𝑡𝑟𝑒𝑠
𝑠𝑒𝑐𝑜𝑛𝑑 X 60
𝑠𝑒𝑐𝑜𝑛𝑑
𝑚𝑖𝑛𝑢𝑡𝑒 = 2.903
𝑙𝑖𝑡𝑟𝑒𝑠
𝑚𝑖𝑛𝑢𝑡𝑒. Therefore,
the flowrate (Q) is 2.903 LPM.
Dripping System:
Table 4.2: Bucket Method Data for Flow of Dripping System
Trial Number Time (seconds) Bucket Volume (Litres)
1 190 6
2 186 6
3 188 6
4 179 6
5 182 6
t = 190+186+188+179+182
5 = 185 seconds
Q = 𝑉
𝑡 =
6 𝑙𝑖𝑡𝑟𝑒𝑠
185 𝑠𝑒𝑐𝑜𝑛𝑑𝑠 = 0.032
𝑙𝑖𝑡𝑟𝑒𝑠
𝑠𝑒𝑐𝑜𝑛𝑑
Flow rate is 0.032 𝑙𝑖𝑡𝑟𝑒𝑠
𝑠𝑒𝑐𝑜𝑛𝑑 or Q = 0.032
𝑙𝑖𝑡𝑟𝑒
𝑠𝑒𝑐𝑜𝑛𝑑 X 60
𝑠𝑒𝑐𝑜𝑛𝑑
𝑚𝑖𝑛𝑢𝑡𝑒 = 1.946
𝑙𝑖𝑡𝑟𝑒𝑠
𝑚𝑖𝑛𝑢𝑡𝑒. Therefore,
the flowrate (Q) is 1.946 LPM.
Comparing Water Spraying System and Dripping System:
Difference in flowrate:
Q = 0.048 – 0.032 = 0.016 𝑙𝑖𝑡𝑟𝑒𝑠
𝑠𝑒𝑐𝑜𝑛𝑑
= 0.96 LPM
By using the dripping system, approximately 0.016 litres per second can be saved.
Dripping system is much more efficient than water spraying system as dripping system
can cover almost the whole solar panel. Water spraying system does not cover the
edges of the solar panel and the water being sprayed is not evenly spread out like the
dripping system. Another factor that can affect the water spraying system is also the
39
wind. When strong wind occurs, it will also change the direction of the water being
sprayed onto the solar panel, making the water sprayed off the solar panel. On the other
hand, dripping system is not affected by the strong wind as the water droplets are
already on the solar panel the moment it drip out of the PVC pipe.
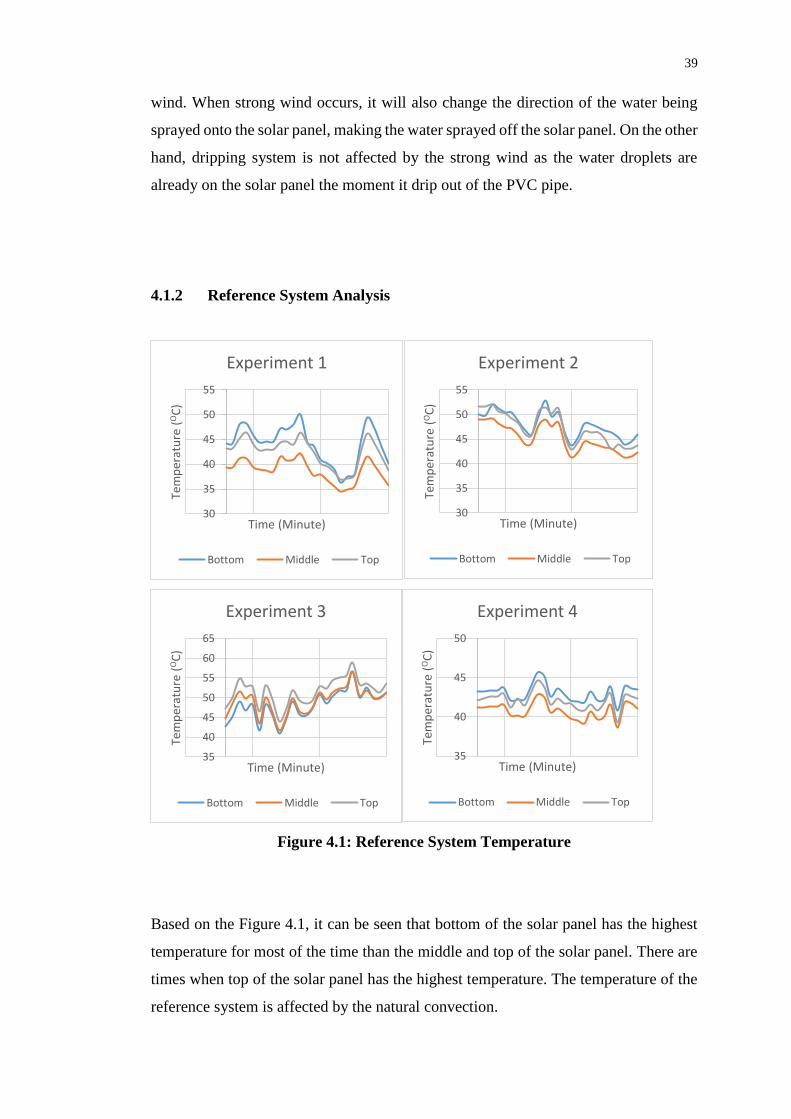
4.1.2 Reference System Analysis
Figure 4.1: Reference System Temperature
Based on the Figure 4.1, it can be seen that bottom of the solar panel has the highest
temperature for most of the time than the middle and top of the solar panel. There are
times when top of the solar panel has the highest temperature. The temperature of the
reference system is affected by the natural convection.
30
35
40
45
50
55
Tem
per
atu
re (
OC
)
Time (Minute)
Experiment 1
Bottom Middle Top
30
35
40
45
50
55
Tem
per
atu
re (
OC
)
Time (Minute)
Experiment 2
Bottom Middle Top
35
40
45
50
55
60
65
Tem
per
atu
re (
OC
)
Time (Minute)
Experiment 3
Bottom Middle Top
35
40
45
50
Tem
per
atu
re (
OC
)
Time (Minute)
Experiment 4
Bottom Middle Top
40
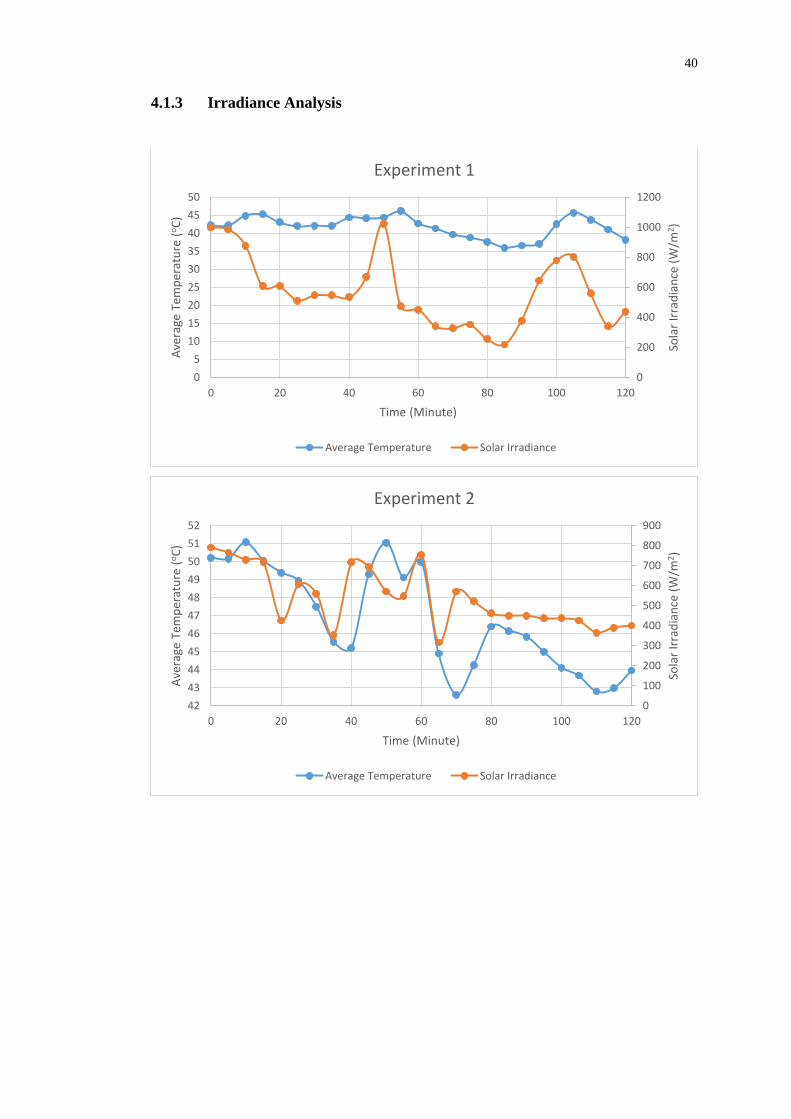
4.1.3 Irradiance Analysis
0
200
400
600
800
1000
1200
0
5
10
15
20
25
30
35
40
45
50
0 20 40 60 80 100 120
Sola
r Ir
rad
ian
ce (
W/m
2 )
Ave
rage
Tem
per
atu
re (
oC
)
Time (Minute)
Experiment 1
Average Temperature Solar Irradiance
0
100
200
300
400
500
600
700
800
900
42
43
44
45
46
47
48
49
50
51
52
0 20 40 60 80 100 120
Sola
r Ir
rad
ian
ce (
W/m
2)
Ave
rage
Tem
per
atu
re (
oC
)
Time (Minute)
Experiment 2
Average Temperature Solar Irradiance
41
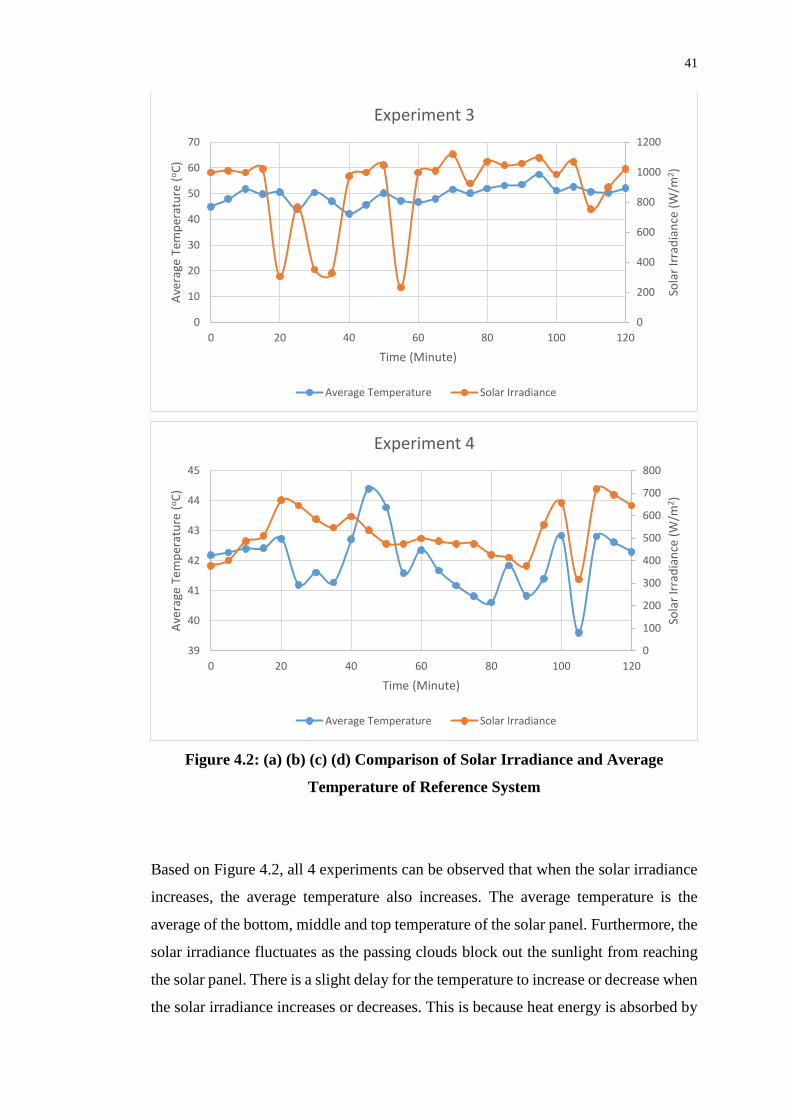
Figure 4.2: (a) (b) (c) (d) Comparison of Solar Irradiance and Average
Temperature of Reference System
Based on Figure 4.2, all 4 experiments can be observed that when the solar irradiance
increases, the average temperature also increases. The average temperature is the
average of the bottom, middle and top temperature of the solar panel. Furthermore, the
solar irradiance fluctuates as the passing clouds block out the sunlight from reaching
the solar panel. There is a slight delay for the temperature to increase or decrease when
the solar irradiance increases or decreases. This is because heat energy is absorbed by
0
200
400
600
800
1000
1200
0
10
20
30
40
50
60
70
0 20 40 60 80 100 120
Sola
r Ir
rad
ian
ce (
W/m
2)
Ave
rage
Tem
per
atu
re (
oC
)
Time (Minute)
Experiment 3
Average Temperature Solar Irradiance
0
100
200
300
400
500
600
700
800
39
40
41
42
43
44
45
0 20 40 60 80 100 120So
lar
Irra
dia
nce
(W
/m2)
Ave
rage
Tem
per
atu
re (
oC
)
Time (Minute)
Experiment 4
Average Temperature Solar Irradiance
42
the solar panel for it to increase by 1oC. Besides that, when a big cloud pass by fast
enough, it will not affect the temperature.
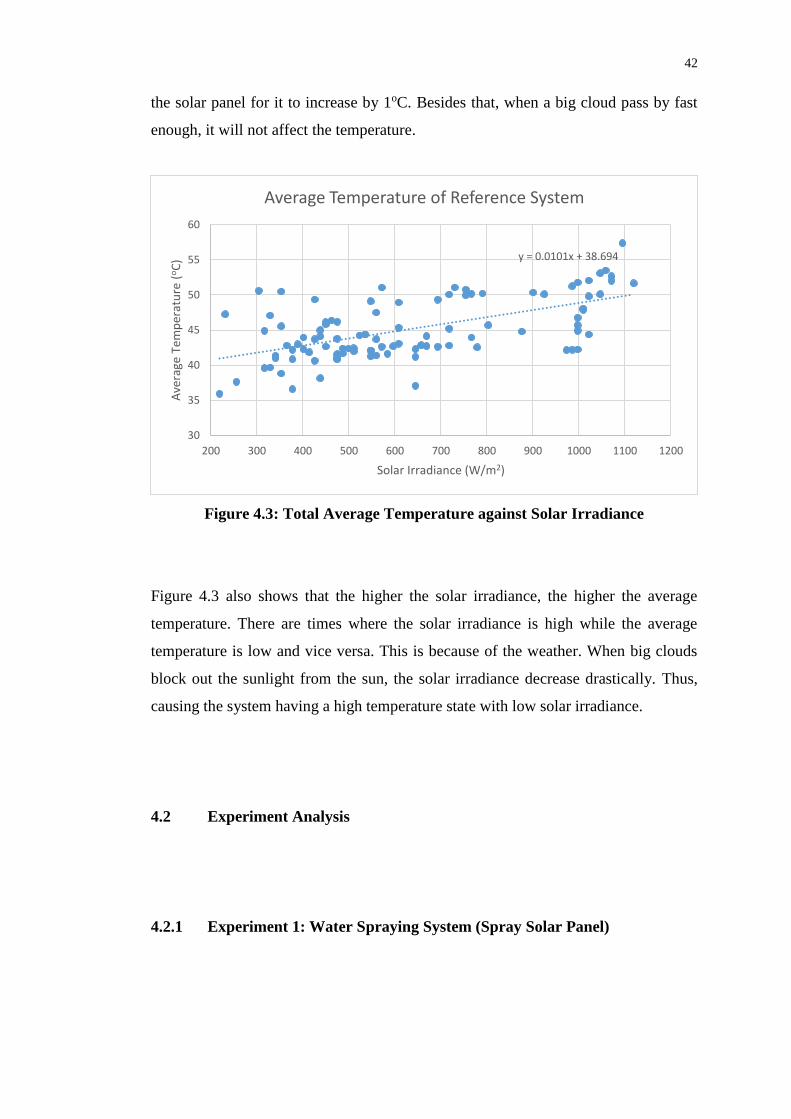
Figure 4.3: Total Average Temperature against Solar Irradiance
Figure 4.3 also shows that the higher the solar irradiance, the higher the average
temperature. There are times where the solar irradiance is high while the average
temperature is low and vice versa. This is because of the weather. When big clouds
block out the sunlight from the sun, the solar irradiance decrease drastically. Thus,
causing the system having a high temperature state with low solar irradiance.
4.2 Experiment Analysis
4.2.1 Experiment 1: Water Spraying System (Spray Solar Panel)
y = 0.0101x + 38.694
30
35
40
45
50
55
60
200 300 400 500 600 700 800 900 1000 1100 1200
Ave
rage
Tem
per
atu
re (
oC
)
Solar Irradiance (W/m2)
Average Temperature of Reference System
43
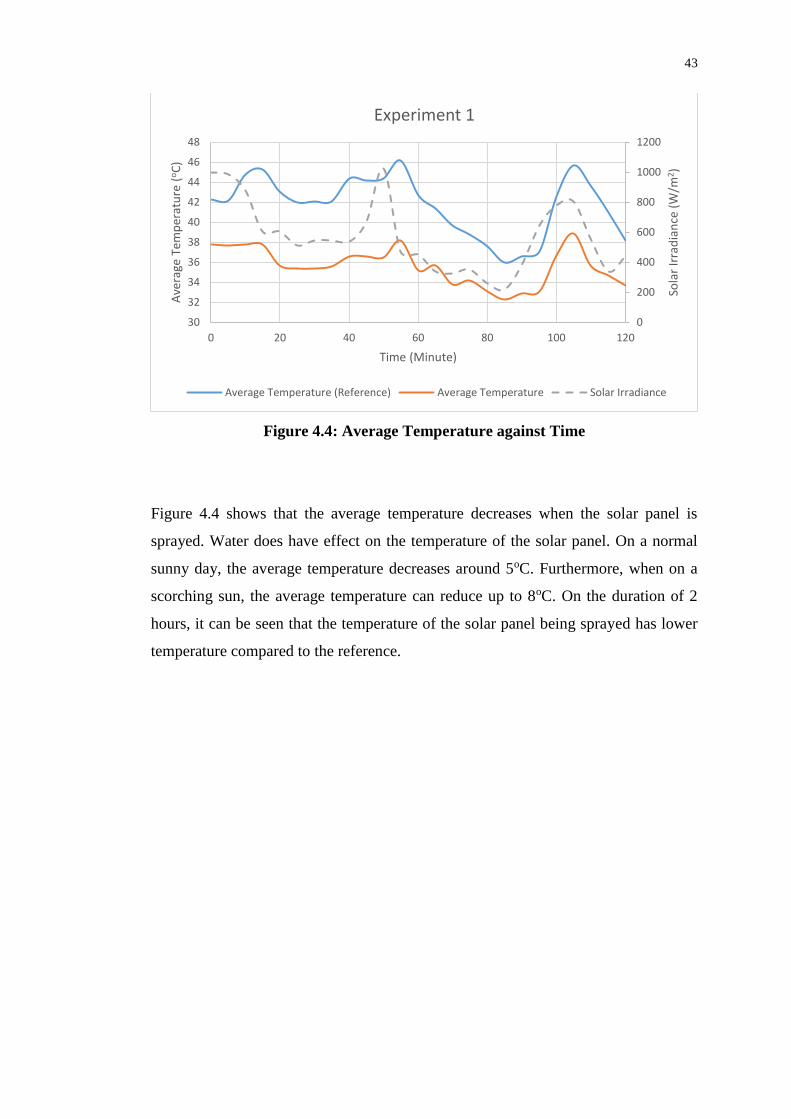
Figure 4.4: Average Temperature against Time
Figure 4.4 shows that the average temperature decreases when the solar panel is
sprayed. Water does have effect on the temperature of the solar panel. On a normal
sunny day, the average temperature decreases around 5oC. Furthermore, when on a
scorching sun, the average temperature can reduce up to 8oC. On the duration of 2
hours, it can be seen that the temperature of the solar panel being sprayed has lower
temperature compared to the reference.
0
200
400
600
800
1000
1200
30
32
34
36
38
40
42
44
46
48
0 20 40 60 80 100 120
Sola
r Ir
rad
ian
ce (
W/m
2)
Ave
rage
Tem
per
atu
re (
oC
)
Time (Minute)
Experiment 1
Average Temperature (Reference) Average Temperature Solar Irradiance
44
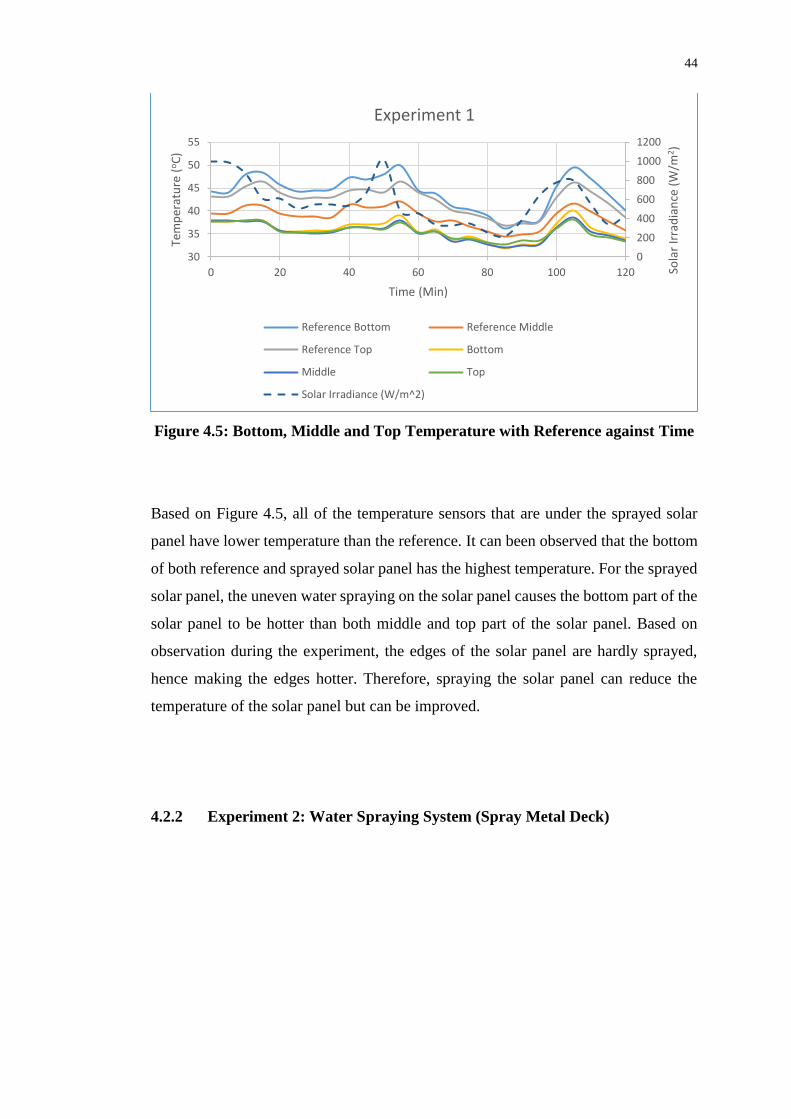
Figure 4.5: Bottom, Middle and Top Temperature with Reference against Time
Based on Figure 4.5, all of the temperature sensors that are under the sprayed solar
panel have lower temperature than the reference. It can been observed that the bottom
of both reference and sprayed solar panel has the highest temperature. For the sprayed
solar panel, the uneven water spraying on the solar panel causes the bottom part of the
solar panel to be hotter than both middle and top part of the solar panel. Based on
observation during the experiment, the edges of the solar panel are hardly sprayed,
hence making the edges hotter. Therefore, spraying the solar panel can reduce the
temperature of the solar panel but can be improved.
4.2.2 Experiment 2: Water Spraying System (Spray Metal Deck)
0
200
400
600
800
1000
1200
30
35
40
45
50
55
0 20 40 60 80 100 120 Sola
r Ir
rad
ian
ce (
W/m
2 )
Tem
per
atu
re (
oC
)
Time (Min)
Experiment 1
Reference Bottom Reference Middle
Reference Top Bottom
Middle Top
Solar Irradiance (W/m^2)
45
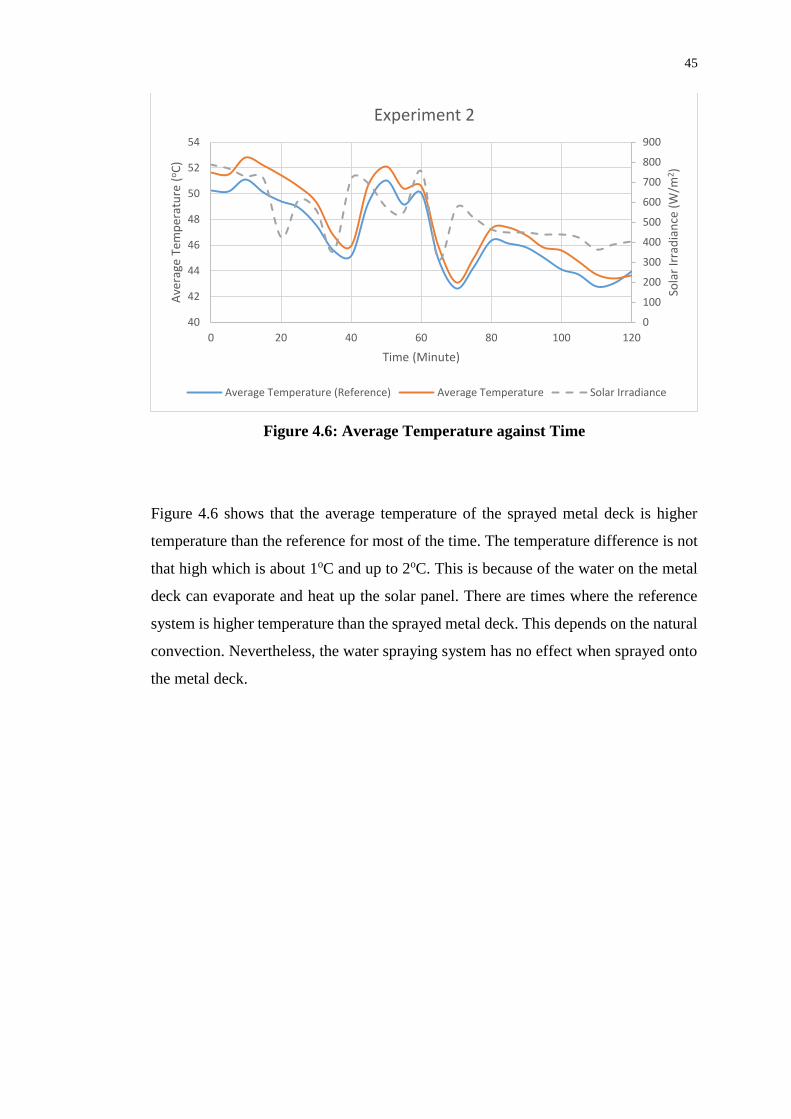
Figure 4.6: Average Temperature against Time
Figure 4.6 shows that the average temperature of the sprayed metal deck is higher
temperature than the reference for most of the time. The temperature difference is not
that high which is about 1oC and up to 2oC. This is because of the water on the metal
deck can evaporate and heat up the solar panel. There are times where the reference
system is higher temperature than the sprayed metal deck. This depends on the natural
convection. Nevertheless, the water spraying system has no effect when sprayed onto
the metal deck.
0
100
200
300
400
500
600
700
800
900
40
42
44
46
48
50
52
54
0 20 40 60 80 100 120
Sola
r Ir
rad
ian
ce (
W/m
2)
Ave
rage
Tem
per
atu
re (
oC
)
Time (Minute)
Experiment 2
Average Temperature (Reference) Average Temperature Solar Irradiance
46
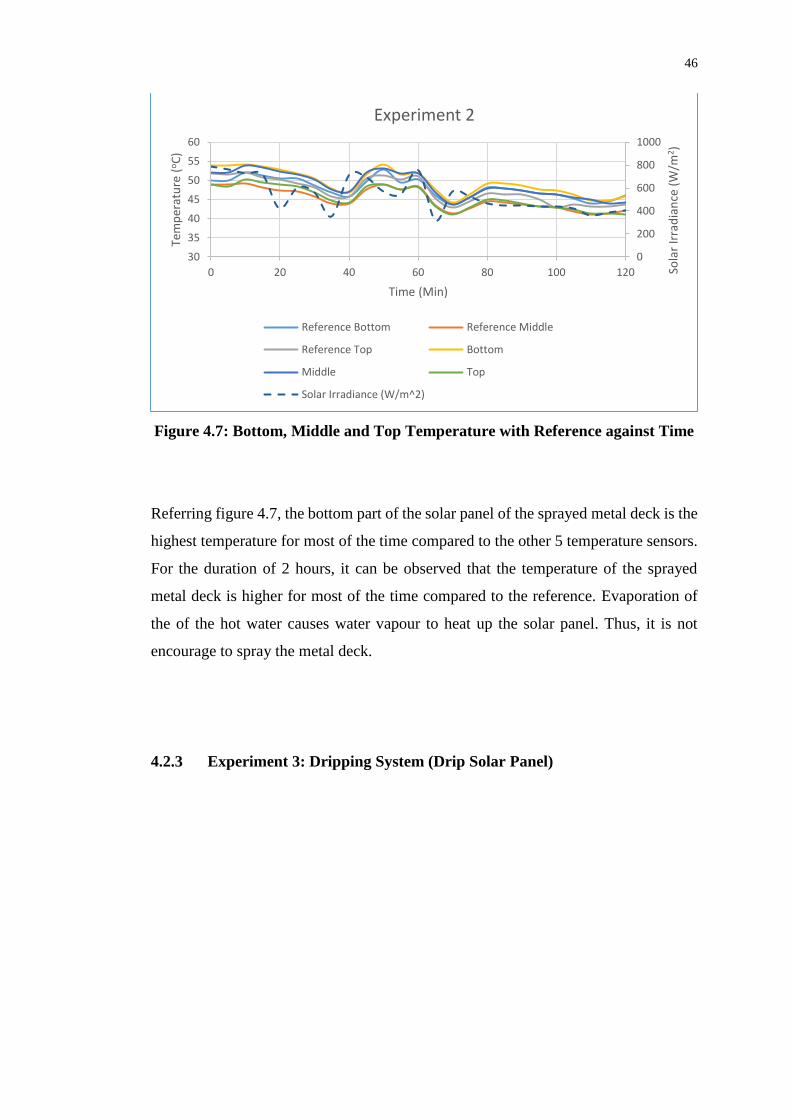
Figure 4.7: Bottom, Middle and Top Temperature with Reference against Time
Referring figure 4.7, the bottom part of the solar panel of the sprayed metal deck is the
highest temperature for most of the time compared to the other 5 temperature sensors.
For the duration of 2 hours, it can be observed that the temperature of the sprayed
metal deck is higher for most of the time compared to the reference. Evaporation of
the of the hot water causes water vapour to heat up the solar panel. Thus, it is not
encourage to spray the metal deck.
4.2.3 Experiment 3: Dripping System (Drip Solar Panel)
0
200
400
600
800
1000
30
35
40
45
50
55
60
0 20 40 60 80 100 120 Sola
r Ir
rad
ian
ce (
W/m
2 )
Tem
per
atu
re (
oC
)
Time (Min)
Experiment 2
Reference Bottom Reference Middle
Reference Top Bottom
Middle Top
Solar Irradiance (W/m^2)
47
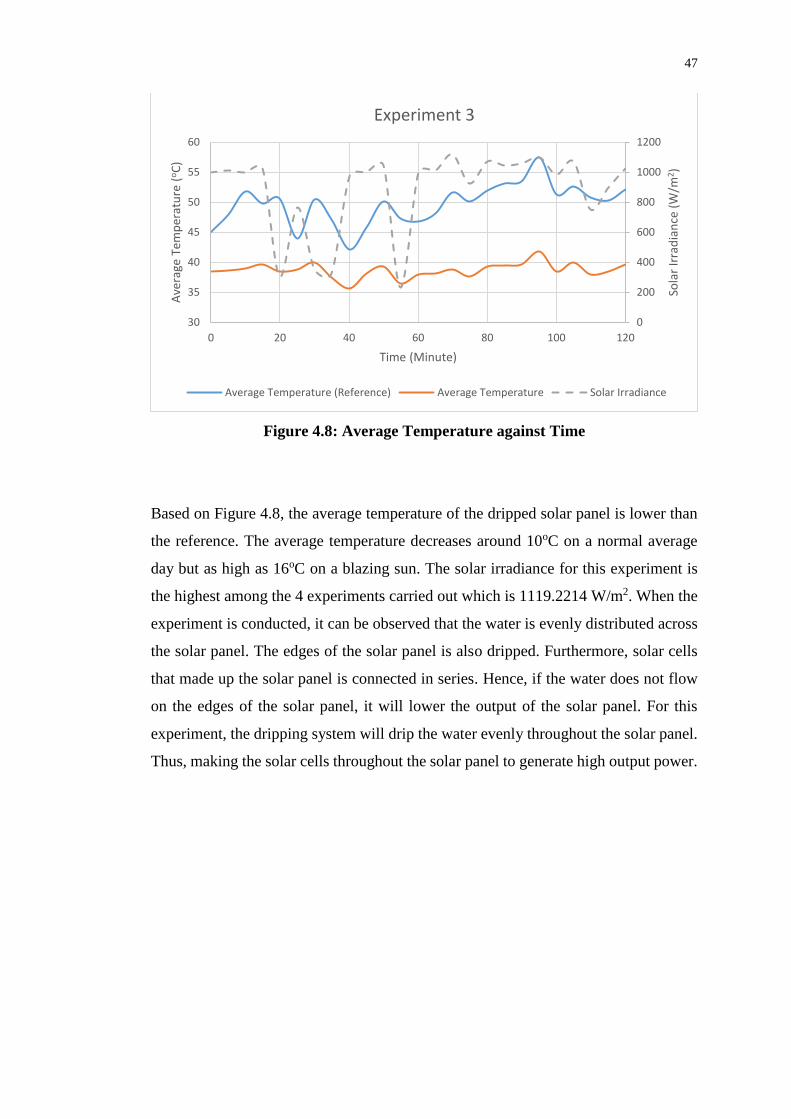
Figure 4.8: Average Temperature against Time
Based on Figure 4.8, the average temperature of the dripped solar panel is lower than
the reference. The average temperature decreases around 10oC on a normal average
day but as high as 16oC on a blazing sun. The solar irradiance for this experiment is
the highest among the 4 experiments carried out which is 1119.2214 W/m2. When the
experiment is conducted, it can be observed that the water is evenly distributed across
the solar panel. The edges of the solar panel is also dripped. Furthermore, solar cells
that made up the solar panel is connected in series. Hence, if the water does not flow
on the edges of the solar panel, it will lower the output of the solar panel. For this
experiment, the dripping system will drip the water evenly throughout the solar panel.
Thus, making the solar cells throughout the solar panel to generate high output power.
0
200
400
600
800
1000
1200
30
35
40
45
50
55
60
0 20 40 60 80 100 120
Sola
r Ir
rad
ian
ce (
W/m
2)
Ave
rage
Tem
per
atu
re (
oC
)
Time (Minute)
Experiment 3
Average Temperature (Reference) Average Temperature Solar Irradiance
48
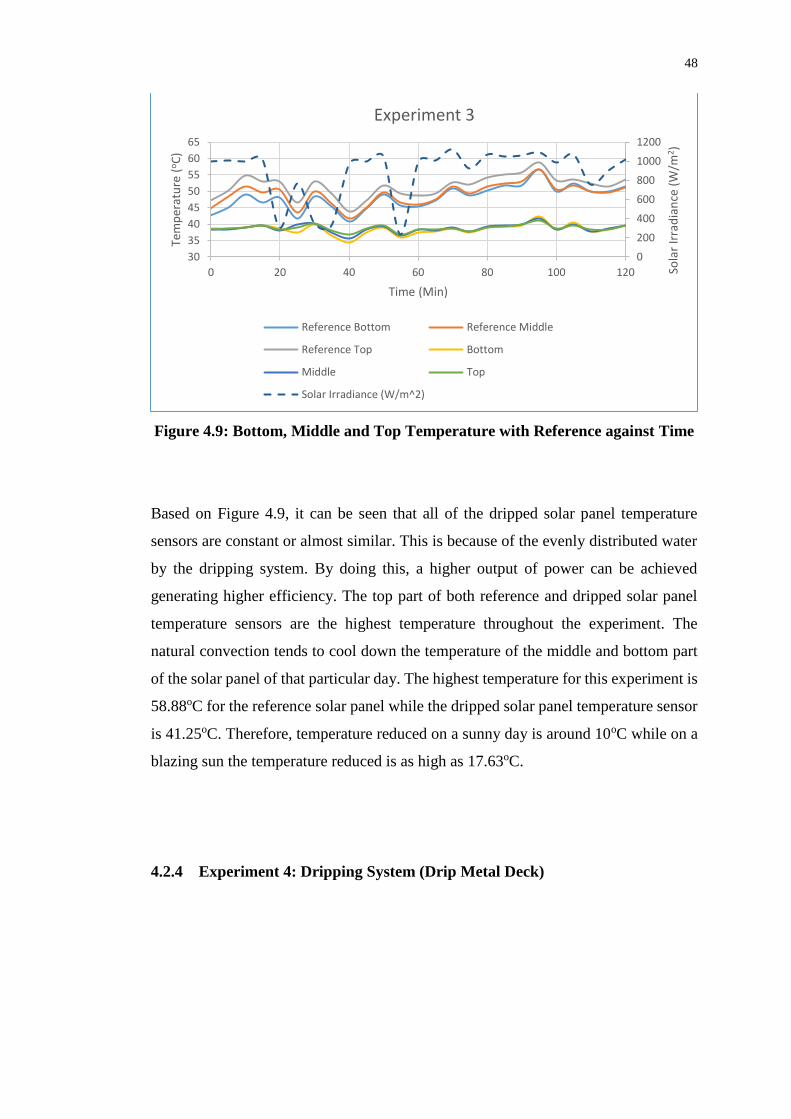
Figure 4.9: Bottom, Middle and Top Temperature with Reference against Time
Based on Figure 4.9, it can be seen that all of the dripped solar panel temperature
sensors are constant or almost similar. This is because of the evenly distributed water
by the dripping system. By doing this, a higher output of power can be achieved
generating higher efficiency. The top part of both reference and dripped solar panel
temperature sensors are the highest temperature throughout the experiment. The
natural convection tends to cool down the temperature of the middle and bottom part
of the solar panel of that particular day. The highest temperature for this experiment is
58.88oC for the reference solar panel while the dripped solar panel temperature sensor
is 41.25oC. Therefore, temperature reduced on a sunny day is around 10oC while on a
blazing sun the temperature reduced is as high as 17.63oC.
4.2.4 Experiment 4: Dripping System (Drip Metal Deck)
0
200
400
600
800
1000
1200
30
35
40
45
50
55
60
65
0 20 40 60 80 100 120 Sola
r Ir
rad
ian
ce (
W/m
2 )
Tem
per
atu
re (
oC
)
Time (Min)
Experiment 3
Reference Bottom Reference Middle
Reference Top Bottom
Middle Top
Solar Irradiance (W/m^2)
49
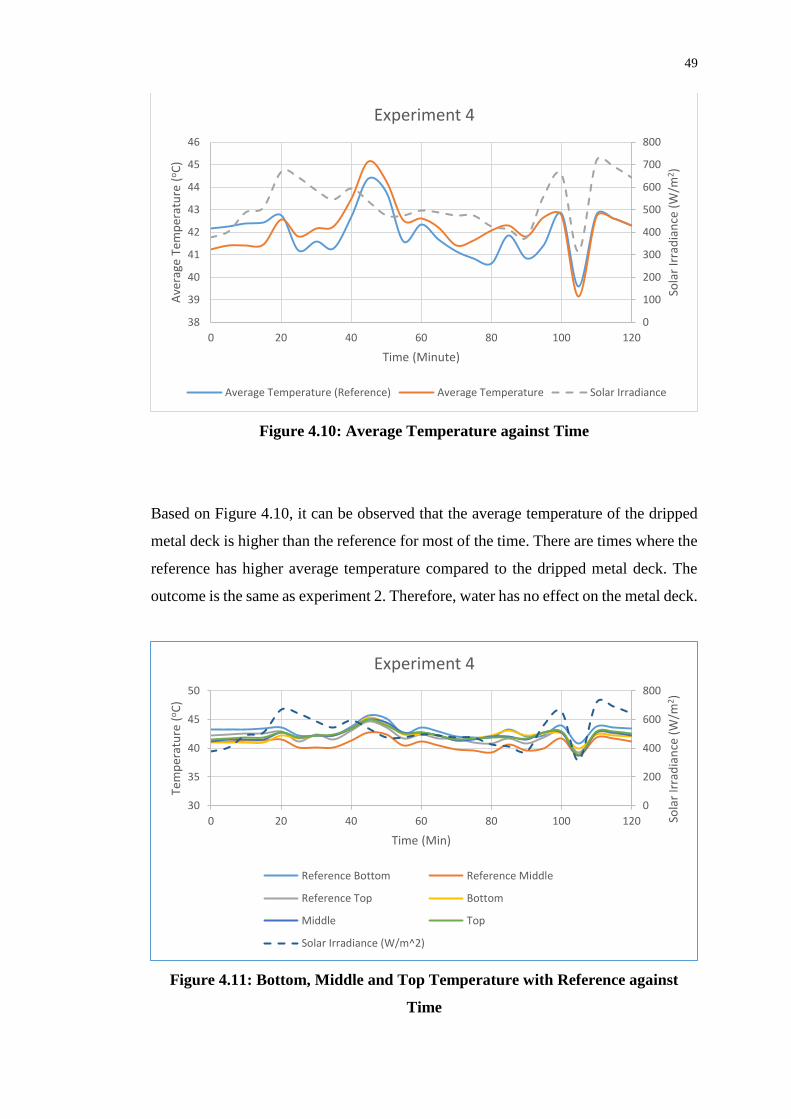
Figure 4.10: Average Temperature against Time
Based on Figure 4.10, it can be observed that the average temperature of the dripped
metal deck is higher than the reference for most of the time. There are times where the
reference has higher average temperature compared to the dripped metal deck. The
outcome is the same as experiment 2. Therefore, water has no effect on the metal deck.
Figure 4.11: Bottom, Middle and Top Temperature with Reference against
Time
0
100
200
300
400
500
600
700
800
38
39
40
41
42
43
44
45
46
0 20 40 60 80 100 120
Sola
r Ir
rad
ian
ce (
W/m
2)
Ave
rage
Tem
per
atu
re (
oC
)
Time (Minute)
Experiment 4
Average Temperature (Reference) Average Temperature Solar Irradiance
0
200
400
600
800
30
35
40
45
50
0 20 40 60 80 100 120 Sola
r Ir
rad
ian
ce (
W/m
2)
Tem
per
atu
re (
oC
)
Time (Min)
Experiment 4
Reference Bottom Reference Middle
Reference Top Bottom
Middle Top
Solar Irradiance (W/m^2)
50
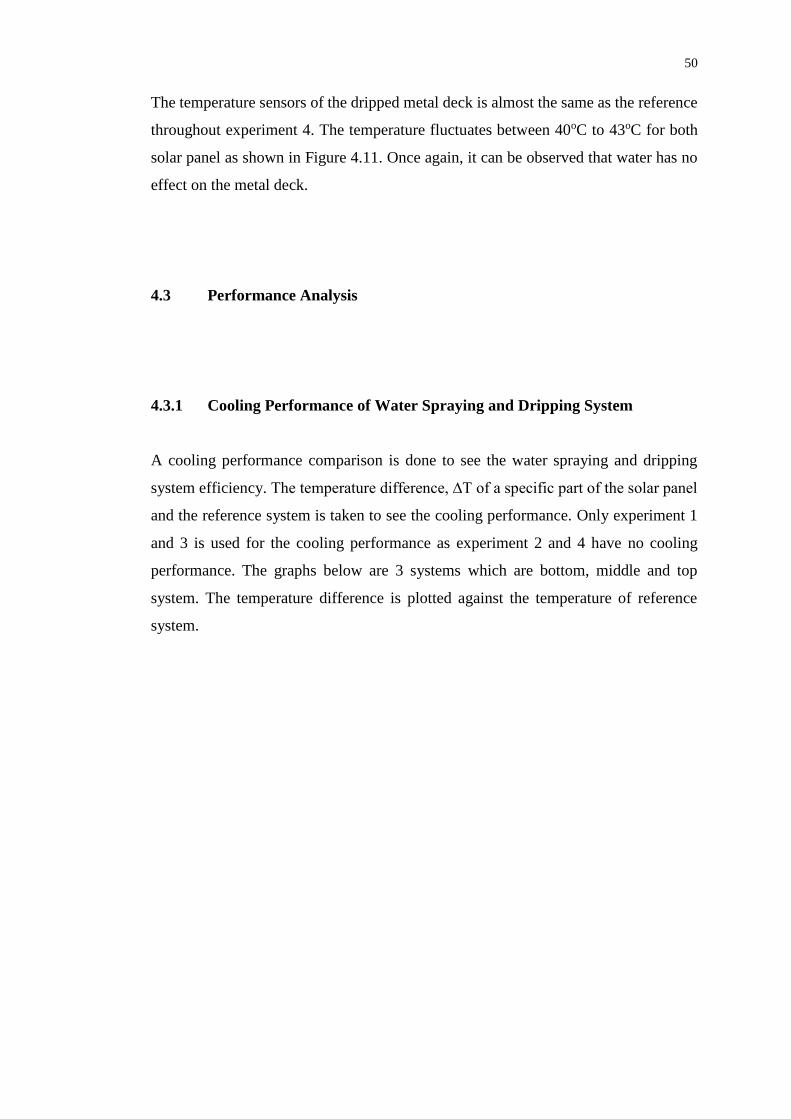
The temperature sensors of the dripped metal deck is almost the same as the reference
throughout experiment 4. The temperature fluctuates between 40oC to 43oC for both
solar panel as shown in Figure 4.11. Once again, it can be observed that water has no
effect on the metal deck.
4.3 Performance Analysis
4.3.1 Cooling Performance of Water Spraying and Dripping System
A cooling performance comparison is done to see the water spraying and dripping
system efficiency. The temperature difference, ∆T of a specific part of the solar panel
and the reference system is taken to see the cooling performance. Only experiment 1
and 3 is used for the cooling performance as experiment 2 and 4 have no cooling
performance. The graphs below are 3 systems which are bottom, middle and top
system. The temperature difference is plotted against the temperature of reference
system.
51
y = 0.5319x - 15.598R² = 0.8301
0
2
4
6
8
10
12
14
16
35 40 45 50 55 60
Tem
per
atu
re D
iffe
ren
ce, ∆T
(oC
)
Temperature of Reference System (oC)
Bottom System
y = 0.6615x - 22.227R² = 0.9269
0
2
4
6
8
10
12
14
16
33 38 43 48 53 58
Tem
per
atu
re D
iffe
ren
ce, ∆T
(oC
)
Temperature of Reference System (oC)
Middle System
52
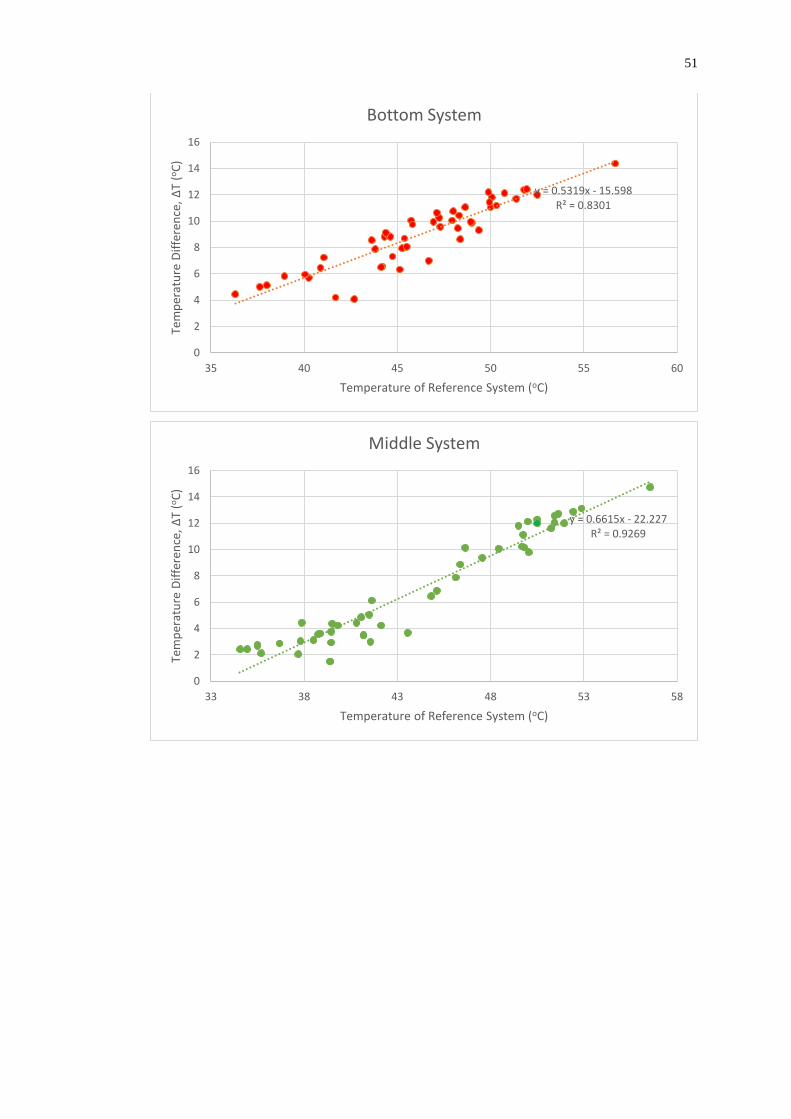
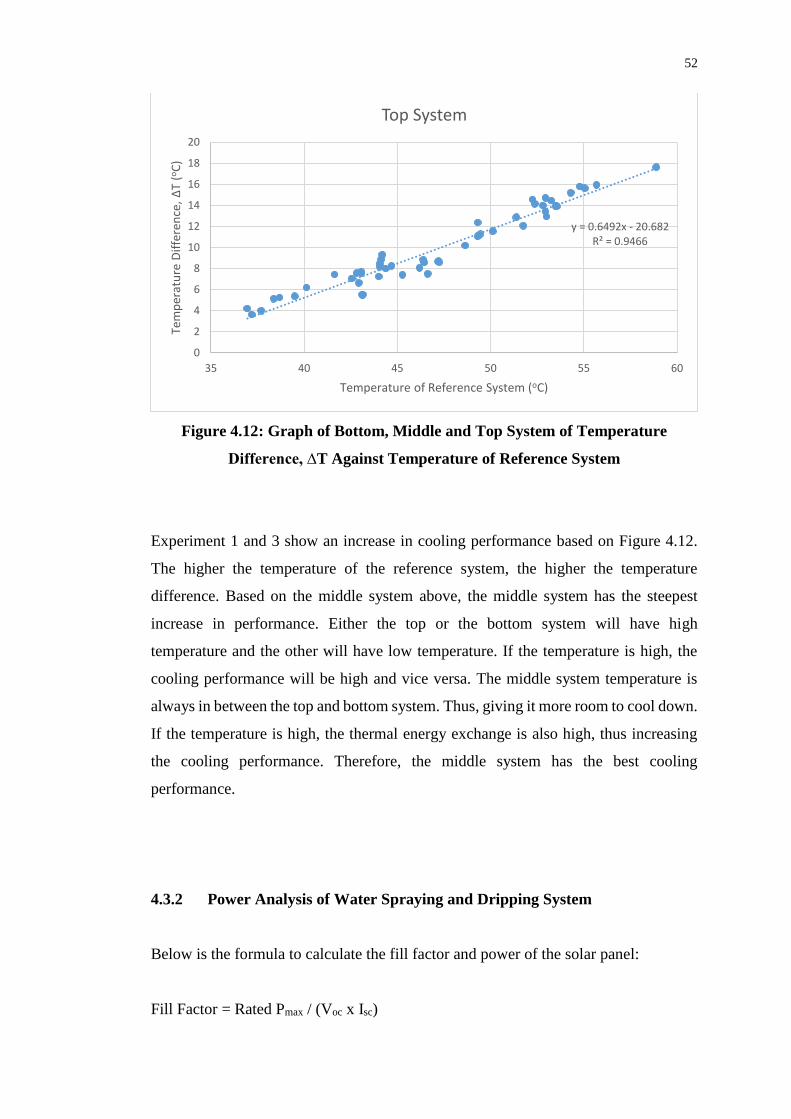
Figure 4.12: Graph of Bottom, Middle and Top System of Temperature
Difference, ∆T Against Temperature of Reference System
Experiment 1 and 3 show an increase in cooling performance based on Figure 4.12.
The higher the temperature of the reference system, the higher the temperature
difference. Based on the middle system above, the middle system has the steepest
increase in performance. Either the top or the bottom system will have high
temperature and the other will have low temperature. If the temperature is high, the
cooling performance will be high and vice versa. The middle system temperature is
always in between the top and bottom system. Thus, giving it more room to cool down.
If the temperature is high, the thermal energy exchange is also high, thus increasing
the cooling performance. Therefore, the middle system has the best cooling
performance.
4.3.2 Power Analysis of Water Spraying and Dripping System
Below is the formula to calculate the fill factor and power of the solar panel:
Fill Factor = Rated Pmax / (Voc x Isc)
y = 0.6492x - 20.682R² = 0.9466
0
2
4
6
8
10
12
14
16
18
20
35 40 45 50 55 60
Tem
per
atu
re D
iffe
ren
ce, ∆T
(oC
)
Temperature of Reference System (oC)
Top System
53
= 260 / (37.96 x 9.01)
= 0.7602
Power = Fill Factor x Voc (measured) x Isc (measured)
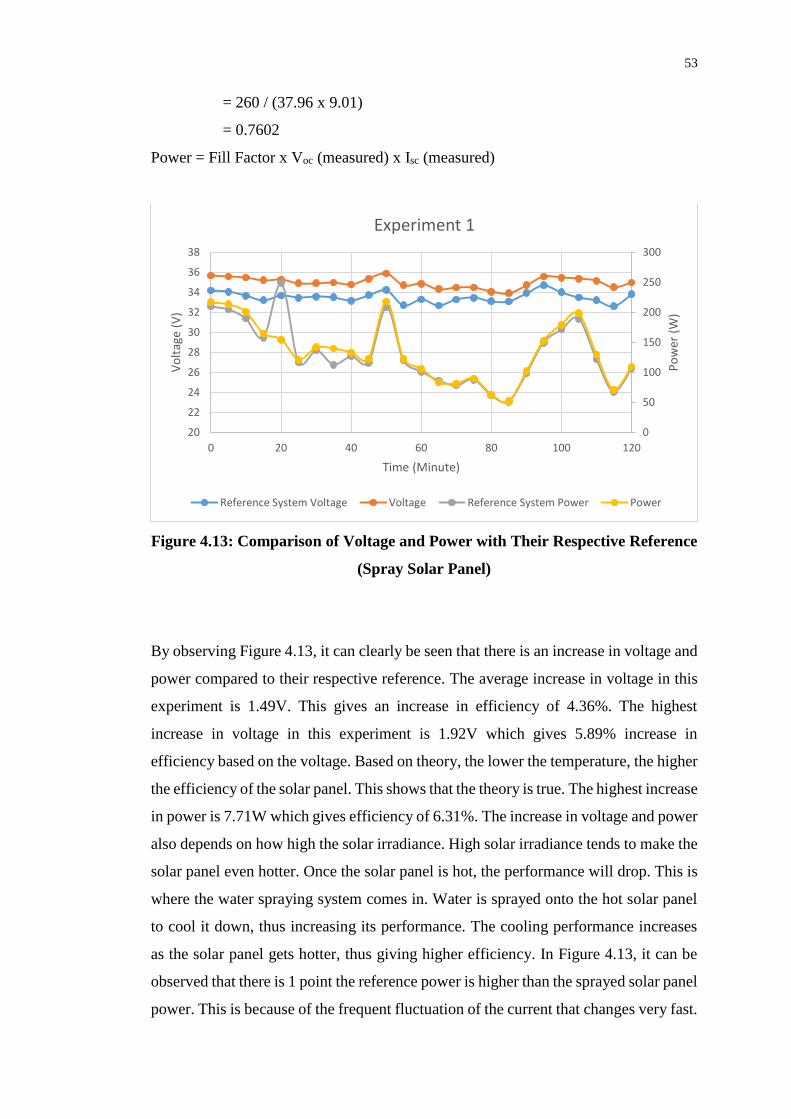
Figure 4.13: Comparison of Voltage and Power with Their Respective Reference
(Spray Solar Panel)
By observing Figure 4.13, it can clearly be seen that there is an increase in voltage and
power compared to their respective reference. The average increase in voltage in this
experiment is 1.49V. This gives an increase in efficiency of 4.36%. The highest
increase in voltage in this experiment is 1.92V which gives 5.89% increase in
efficiency based on the voltage. Based on theory, the lower the temperature, the higher
the efficiency of the solar panel. This shows that the theory is true. The highest increase
in power is 7.71W which gives efficiency of 6.31%. The increase in voltage and power
also depends on how high the solar irradiance. High solar irradiance tends to make the
solar panel even hotter. Once the solar panel is hot, the performance will drop. This is
where the water spraying system comes in. Water is sprayed onto the hot solar panel
to cool it down, thus increasing its performance. The cooling performance increases
as the solar panel gets hotter, thus giving higher efficiency. In Figure 4.13, it can be
observed that there is 1 point the reference power is higher than the sprayed solar panel
power. This is because of the frequent fluctuation of the current that changes very fast.
0
50
100
150
200
250
300
20
22
24
26
28
30
32
34
36
38
0 20 40 60 80 100 120
Po
wer
(W
)
Vo
ltag
e (V
)
Time (Minute)
Experiment 1
Reference System Voltage Voltage Reference System Power Power
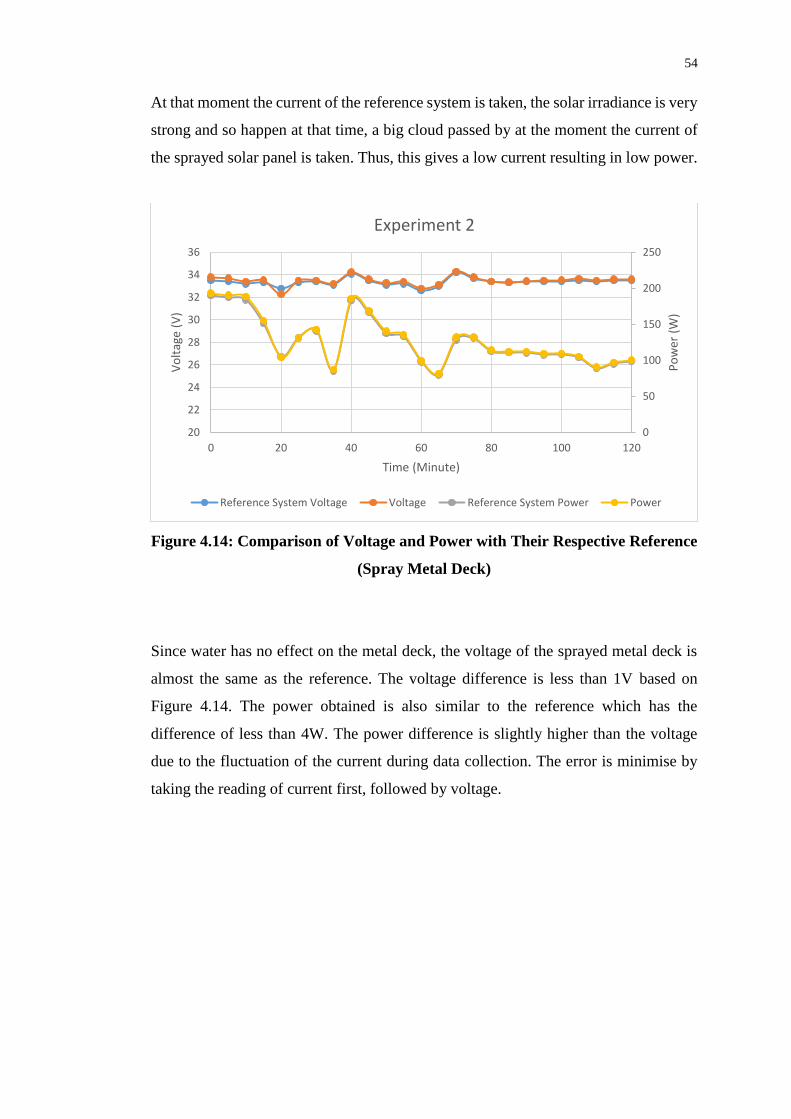
54
At that moment the current of the reference system is taken, the solar irradiance is very
strong and so happen at that time, a big cloud passed by at the moment the current of
the sprayed solar panel is taken. Thus, this gives a low current resulting in low power.
Figure 4.14: Comparison of Voltage and Power with Their Respective Reference
(Spray Metal Deck)
Since water has no effect on the metal deck, the voltage of the sprayed metal deck is
almost the same as the reference. The voltage difference is less than 1V based on
Figure 4.14. The power obtained is also similar to the reference which has the
difference of less than 4W. The power difference is slightly higher than the voltage
due to the fluctuation of the current during data collection. The error is minimise by
taking the reading of current first, followed by voltage.
0
50
100
150
200
250
20
22
24
26
28
30
32
34
36
0 20 40 60 80 100 120
Po
wer
(W
)
Vo
ltag
e (V
)
Time (Minute)
Experiment 2
Reference System Voltage Voltage Reference System Power Power
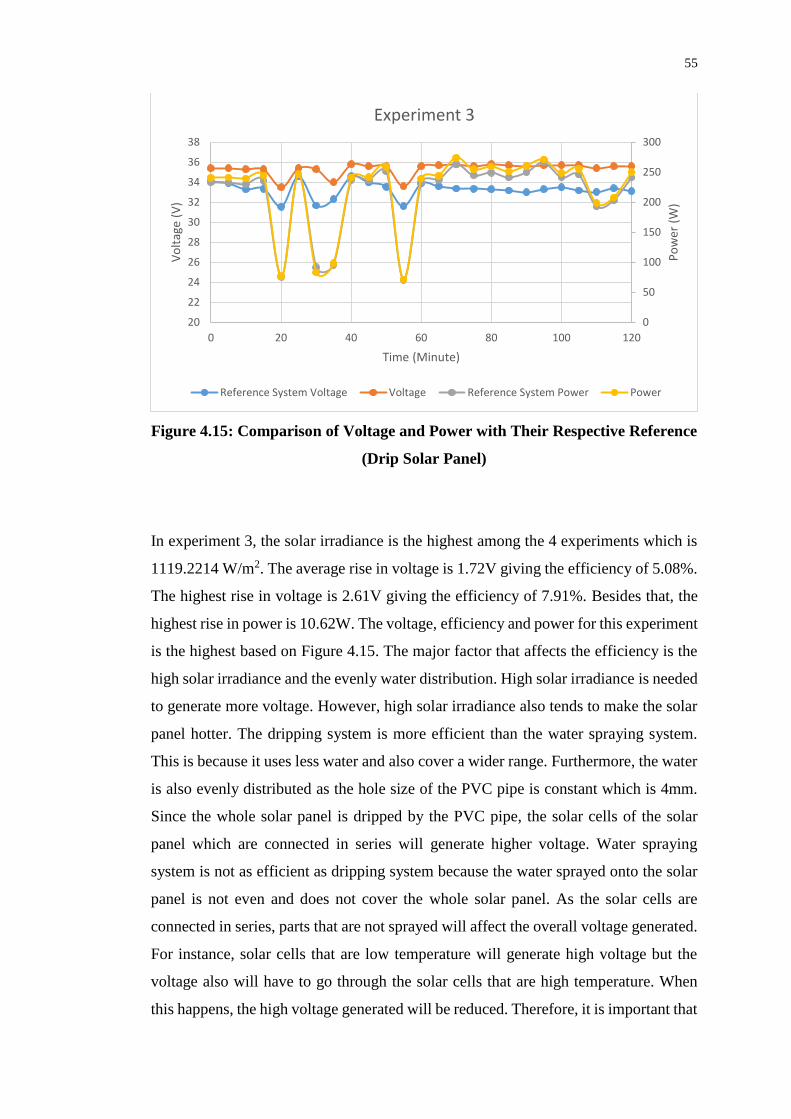
55
Figure 4.15: Comparison of Voltage and Power with Their Respective Reference
(Drip Solar Panel)
In experiment 3, the solar irradiance is the highest among the 4 experiments which is
1119.2214 W/m2. The average rise in voltage is 1.72V giving the efficiency of 5.08%.
The highest rise in voltage is 2.61V giving the efficiency of 7.91%. Besides that, the
highest rise in power is 10.62W. The voltage, efficiency and power for this experiment
is the highest based on Figure 4.15. The major factor that affects the efficiency is the
high solar irradiance and the evenly water distribution. High solar irradiance is needed
to generate more voltage. However, high solar irradiance also tends to make the solar
panel hotter. The dripping system is more efficient than the water spraying system.
This is because it uses less water and also cover a wider range. Furthermore, the water
is also evenly distributed as the hole size of the PVC pipe is constant which is 4mm.
Since the whole solar panel is dripped by the PVC pipe, the solar cells of the solar
panel which are connected in series will generate higher voltage. Water spraying
system is not as efficient as dripping system because the water sprayed onto the solar
panel is not even and does not cover the whole solar panel. As the solar cells are
connected in series, parts that are not sprayed will affect the overall voltage generated.
For instance, solar cells that are low temperature will generate high voltage but the
voltage also will have to go through the solar cells that are high temperature. When
this happens, the high voltage generated will be reduced. Therefore, it is important that
0
50
100
150
200
250
300
20
22
24
26
28
30
32
34
36
38
0 20 40 60 80 100 120
Po
wer
(W
)
Vo
ltag
e (V
)
Time (Minute)
Experiment 3
Reference System Voltage Voltage Reference System Power Power
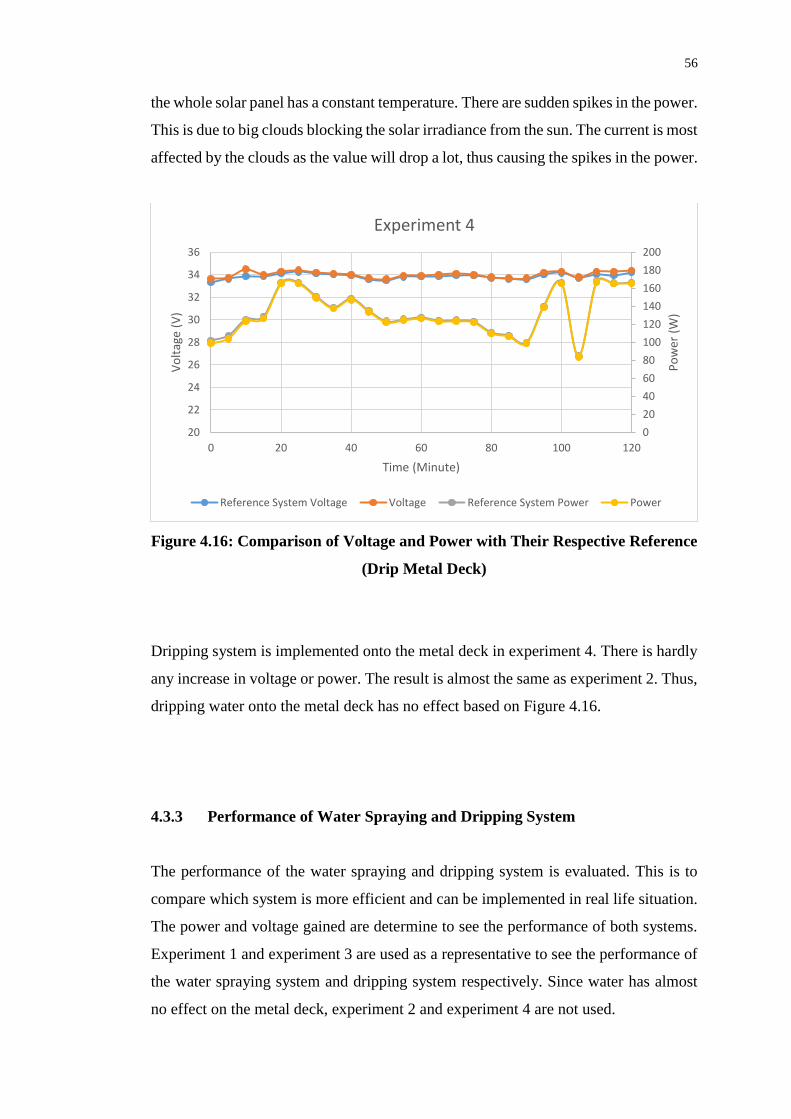
56
the whole solar panel has a constant temperature. There are sudden spikes in the power.
This is due to big clouds blocking the solar irradiance from the sun. The current is most
affected by the clouds as the value will drop a lot, thus causing the spikes in the power.
Figure 4.16: Comparison of Voltage and Power with Their Respective Reference
(Drip Metal Deck)
Dripping system is implemented onto the metal deck in experiment 4. There is hardly
any increase in voltage or power. The result is almost the same as experiment 2. Thus,
dripping water onto the metal deck has no effect based on Figure 4.16.
4.3.3 Performance of Water Spraying and Dripping System
The performance of the water spraying and dripping system is evaluated. This is to
compare which system is more efficient and can be implemented in real life situation.
The power and voltage gained are determine to see the performance of both systems.
Experiment 1 and experiment 3 are used as a representative to see the performance of
the water spraying system and dripping system respectively. Since water has almost
no effect on the metal deck, experiment 2 and experiment 4 are not used.
0
20
40
60
80
100
120
140
160
180
200
20
22
24
26
28
30
32
34
36
0 20 40 60 80 100 120
Po
wer
(W
)
Vo
ltag
e (V
)
Time (Minute)
Experiment 4
Reference System Voltage Voltage Reference System Power Power
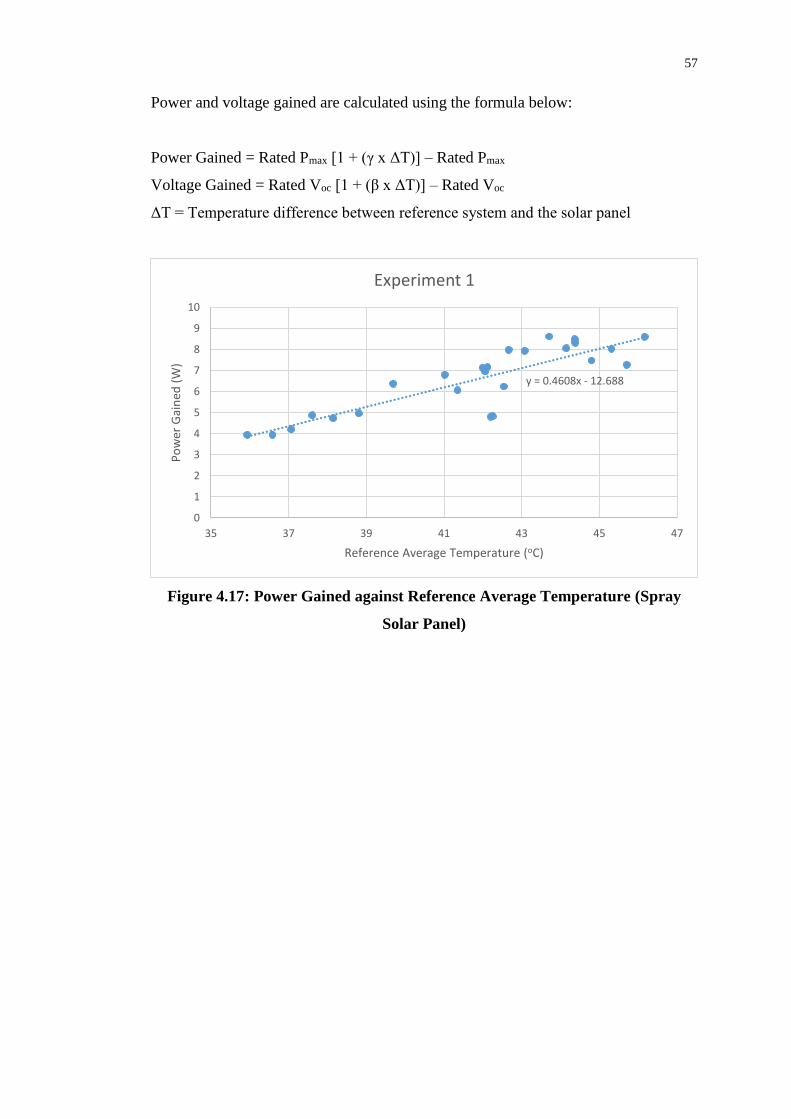
57
Power and voltage gained are calculated using the formula below:
Power Gained = Rated Pmax [1 + (γ x ΔT)] – Rated Pmax
Voltage Gained = Rated Voc [1 + (β x ΔT)] – Rated Voc
ΔT = Temperature difference between reference system and the solar panel
Figure 4.17: Power Gained against Reference Average Temperature (Spray
Solar Panel)
y = 0.4608x - 12.688
0
1
2
3
4
5
6
7
8
9
10
35 37 39 41 43 45 47
Po
wer
Gai
ned
(W
)
Reference Average Temperature (oC)
Experiment 1
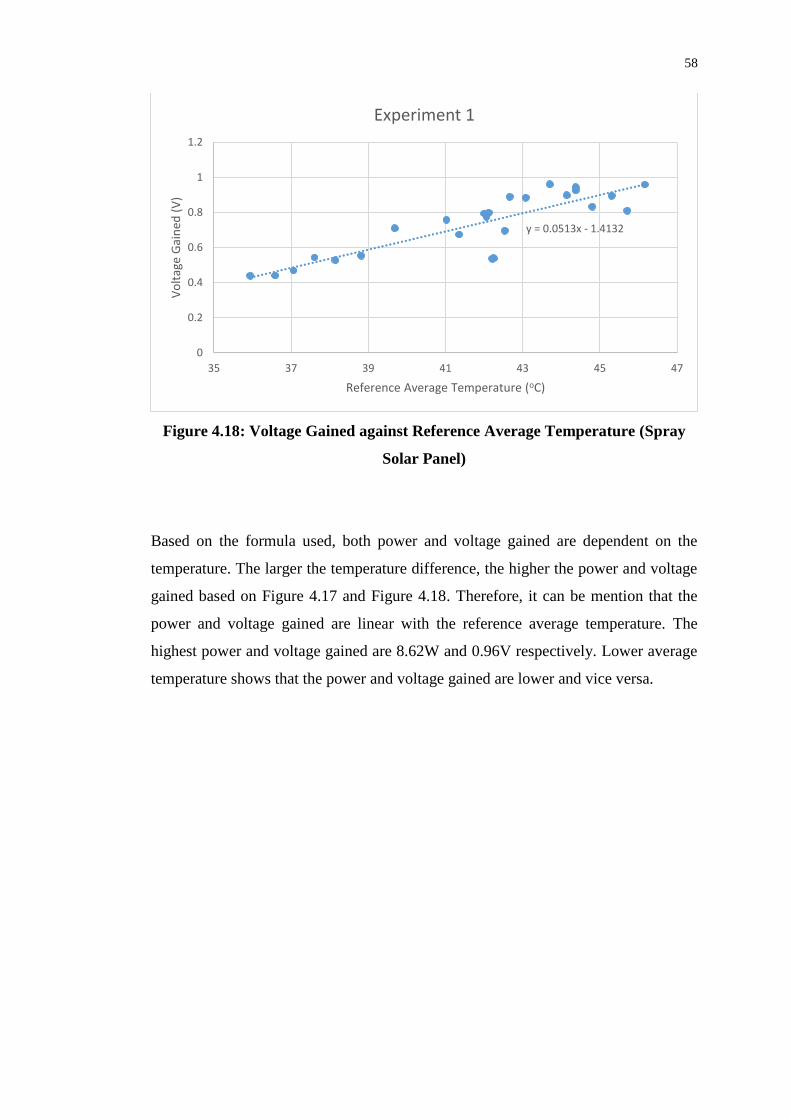
58
Figure 4.18: Voltage Gained against Reference Average Temperature (Spray
Solar Panel)
Based on the formula used, both power and voltage gained are dependent on the
temperature. The larger the temperature difference, the higher the power and voltage
gained based on Figure 4.17 and Figure 4.18. Therefore, it can be mention that the
power and voltage gained are linear with the reference average temperature. The
highest power and voltage gained are 8.62W and 0.96V respectively. Lower average
temperature shows that the power and voltage gained are lower and vice versa.
y = 0.0513x - 1.4132
0
0.2
0.4
0.6
0.8
1
1.2
35 37 39 41 43 45 47
Vo
ltag
e G
ain
ed (
V)
Reference Average Temperature (oC)
Experiment 1
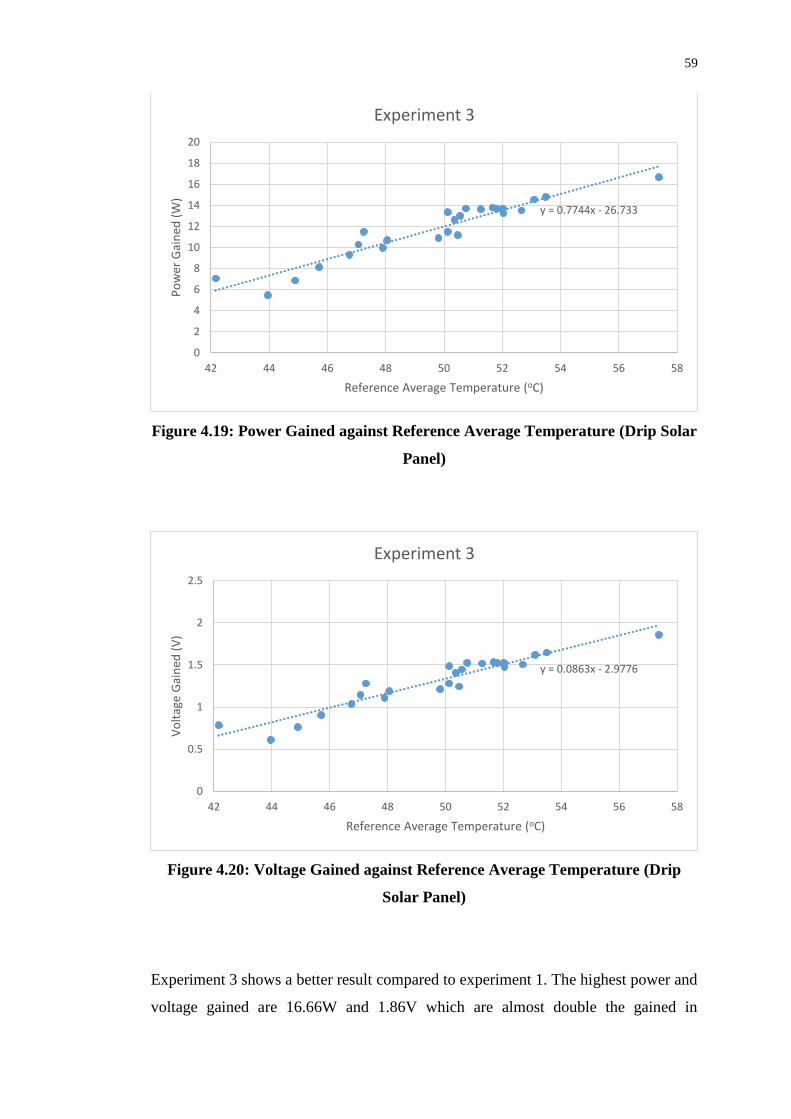
59
Figure 4.19: Power Gained against Reference Average Temperature (Drip Solar
Panel)
Figure 4.20: Voltage Gained against Reference Average Temperature (Drip
Solar Panel)
Experiment 3 shows a better result compared to experiment 1. The highest power and
voltage gained are 16.66W and 1.86V which are almost double the gained in
y = 0.7744x - 26.733
0
2
4
6
8
10
12
14
16
18
20
42 44 46 48 50 52 54 56 58
Po
wer
Gai
ned
(W
)
Reference Average Temperature (oC)
Experiment 3
y = 0.0863x - 2.9776
0
0.5
1
1.5
2
2.5
42 44 46 48 50 52 54 56 58
Vo
ltag
e G
ain
ed (
V)
Reference Average Temperature (oC)
Experiment 3
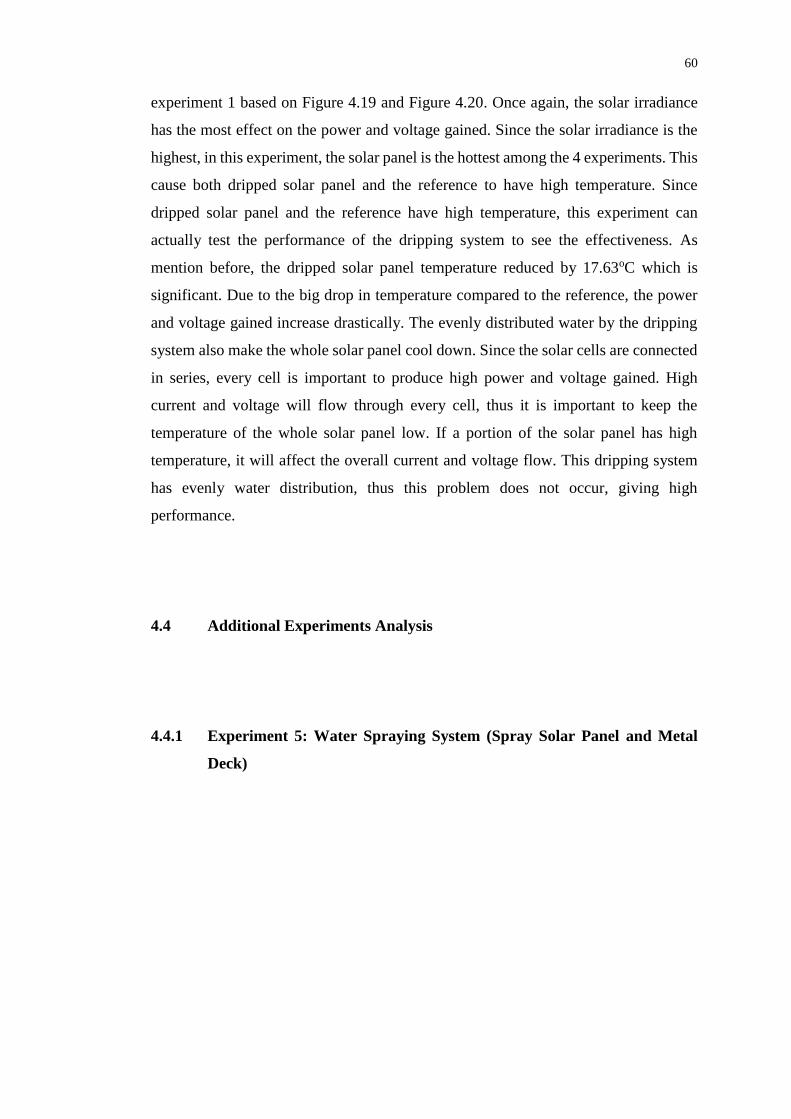
60
experiment 1 based on Figure 4.19 and Figure 4.20. Once again, the solar irradiance
has the most effect on the power and voltage gained. Since the solar irradiance is the
highest, in this experiment, the solar panel is the hottest among the 4 experiments. This
cause both dripped solar panel and the reference to have high temperature. Since
dripped solar panel and the reference have high temperature, this experiment can
actually test the performance of the dripping system to see the effectiveness. As
mention before, the dripped solar panel temperature reduced by 17.63oC which is
significant. Due to the big drop in temperature compared to the reference, the power
and voltage gained increase drastically. The evenly distributed water by the dripping
system also make the whole solar panel cool down. Since the solar cells are connected
in series, every cell is important to produce high power and voltage gained. High
current and voltage will flow through every cell, thus it is important to keep the
temperature of the whole solar panel low. If a portion of the solar panel has high
temperature, it will affect the overall current and voltage flow. This dripping system
has evenly water distribution, thus this problem does not occur, giving high
performance.
4.4 Additional Experiments Analysis
4.4.1 Experiment 5: Water Spraying System (Spray Solar Panel and Metal
Deck)
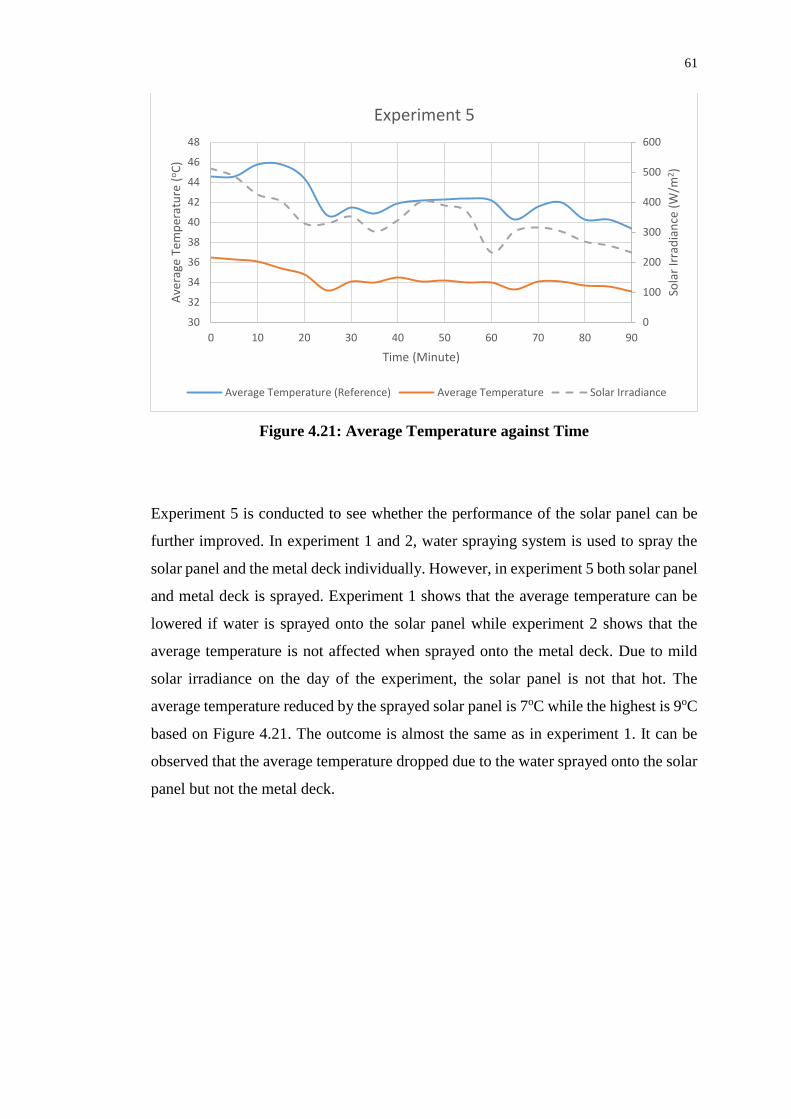
61
Figure 4.21: Average Temperature against Time
Experiment 5 is conducted to see whether the performance of the solar panel can be
further improved. In experiment 1 and 2, water spraying system is used to spray the
solar panel and the metal deck individually. However, in experiment 5 both solar panel
and metal deck is sprayed. Experiment 1 shows that the average temperature can be
lowered if water is sprayed onto the solar panel while experiment 2 shows that the
average temperature is not affected when sprayed onto the metal deck. Due to mild
solar irradiance on the day of the experiment, the solar panel is not that hot. The
average temperature reduced by the sprayed solar panel is 7oC while the highest is 9oC
based on Figure 4.21. The outcome is almost the same as in experiment 1. It can be
observed that the average temperature dropped due to the water sprayed onto the solar
panel but not the metal deck.
0
100
200
300
400
500
600
30
32
34
36
38
40
42
44
46
48
0 10 20 30 40 50 60 70 80 90
Sola
r Ir
rad
ian
ce (
W/m
2)
Ave
rage
Tem
per
atu
re (
oC
)
Time (Minute)
Experiment 5
Average Temperature (Reference) Average Temperature Solar Irradiance
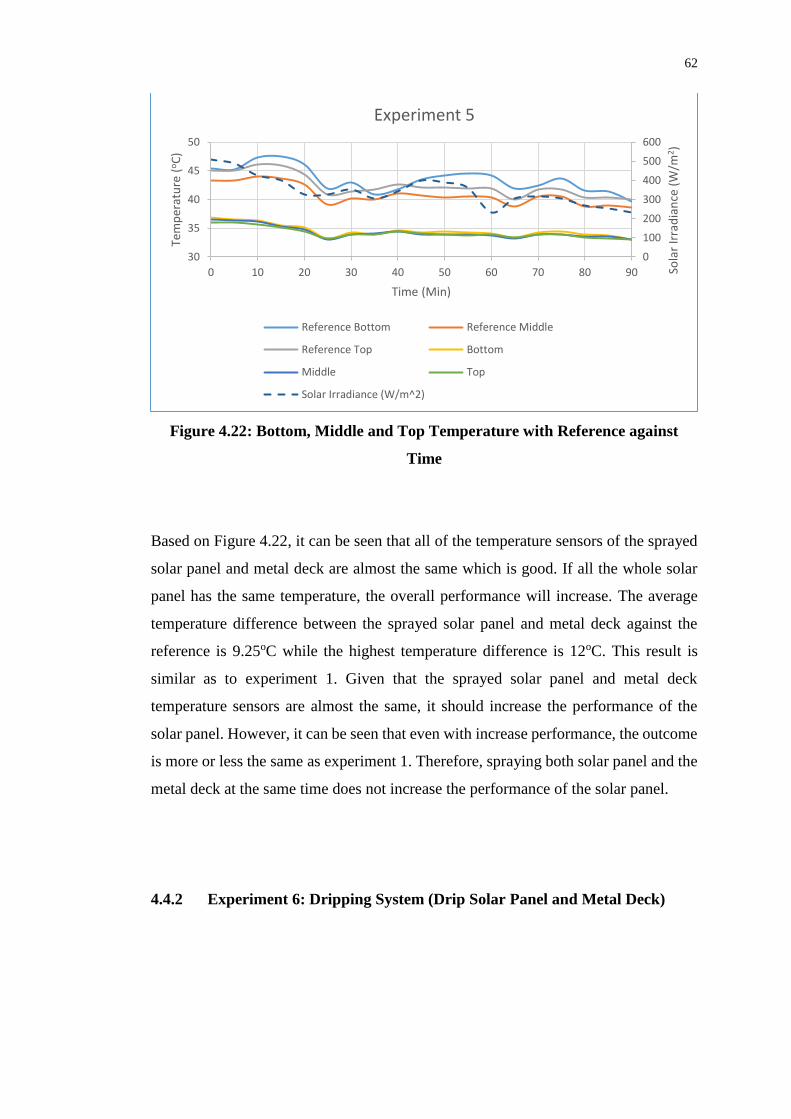
62
Figure 4.22: Bottom, Middle and Top Temperature with Reference against
Time
Based on Figure 4.22, it can be seen that all of the temperature sensors of the sprayed
solar panel and metal deck are almost the same which is good. If all the whole solar
panel has the same temperature, the overall performance will increase. The average
temperature difference between the sprayed solar panel and metal deck against the
reference is 9.25oC while the highest temperature difference is 12oC. This result is
similar as to experiment 1. Given that the sprayed solar panel and metal deck
temperature sensors are almost the same, it should increase the performance of the
solar panel. However, it can be seen that even with increase performance, the outcome
is more or less the same as experiment 1. Therefore, spraying both solar panel and the
metal deck at the same time does not increase the performance of the solar panel.
4.4.2 Experiment 6: Dripping System (Drip Solar Panel and Metal Deck)
0
100
200
300
400
500
600
30
35
40
45
50
0 10 20 30 40 50 60 70 80 90 Sola
r Ir
rad
ian
ce (
W/m
2 )
Tem
per
atu
re (
oC
)
Time (Min)
Experiment 5
Reference Bottom Reference Middle
Reference Top Bottom
Middle Top
Solar Irradiance (W/m^2)
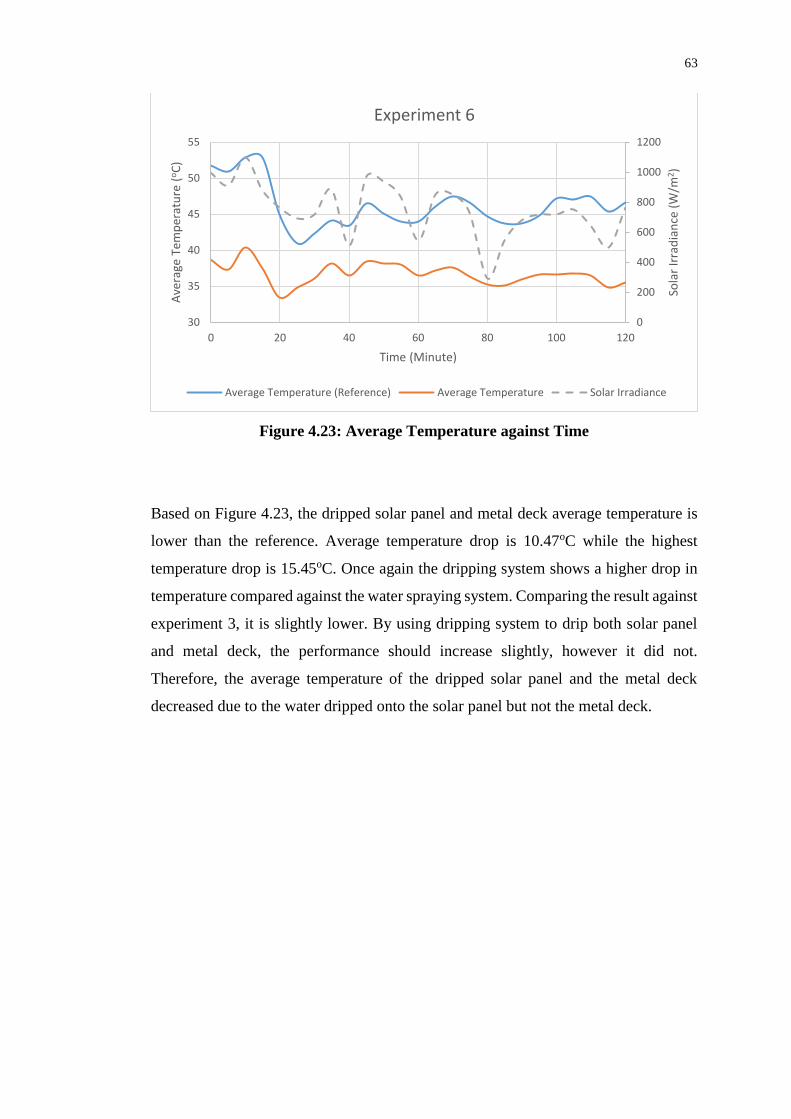
63
Figure 4.23: Average Temperature against Time
Based on Figure 4.23, the dripped solar panel and metal deck average temperature is
lower than the reference. Average temperature drop is 10.47oC while the highest
temperature drop is 15.45oC. Once again the dripping system shows a higher drop in
temperature compared against the water spraying system. Comparing the result against
experiment 3, it is slightly lower. By using dripping system to drip both solar panel
and metal deck, the performance should increase slightly, however it did not.
Therefore, the average temperature of the dripped solar panel and the metal deck
decreased due to the water dripped onto the solar panel but not the metal deck.
0
200
400
600
800
1000
1200
30
35
40
45
50
55
0 20 40 60 80 100 120
Sola
r Ir
rad
ian
ce (
W/m
2)
Ave
rage
Tem
per
atu
re (
oC
)
Time (Minute)
Experiment 6
Average Temperature (Reference) Average Temperature Solar Irradiance
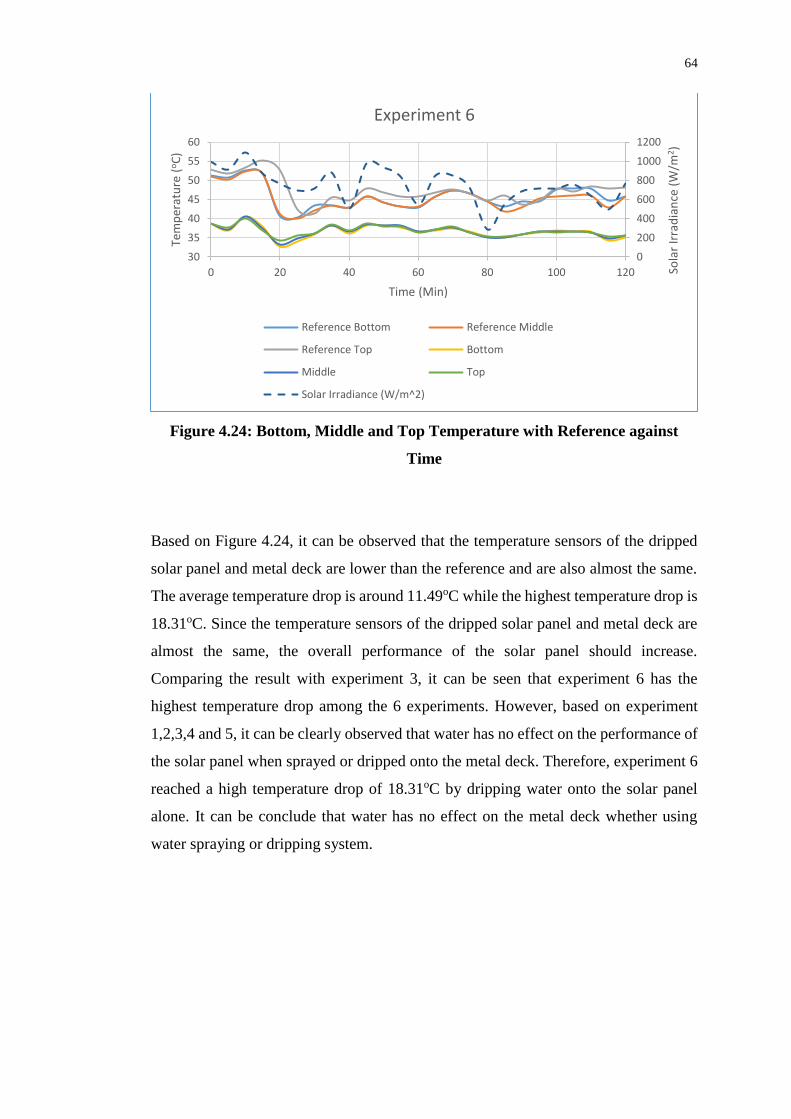
64
Figure 4.24: Bottom, Middle and Top Temperature with Reference against
Time
Based on Figure 4.24, it can be observed that the temperature sensors of the dripped
solar panel and metal deck are lower than the reference and are also almost the same.
The average temperature drop is around 11.49oC while the highest temperature drop is
18.31oC. Since the temperature sensors of the dripped solar panel and metal deck are
almost the same, the overall performance of the solar panel should increase.
Comparing the result with experiment 3, it can be seen that experiment 6 has the
highest temperature drop among the 6 experiments. However, based on experiment
1,2,3,4 and 5, it can be clearly observed that water has no effect on the performance of
the solar panel when sprayed or dripped onto the metal deck. Therefore, experiment 6
reached a high temperature drop of 18.31oC by dripping water onto the solar panel
alone. It can be conclude that water has no effect on the metal deck whether using
water spraying or dripping system.
0
200
400
600
800
1000
1200
30
35
40
45
50
55
60
0 20 40 60 80 100 120 Sola
r Ir
rad
ian
ce (
W/m
2 )
Tem
per
atu
re (
oC
)
Time (Min)
Experiment 6
Reference Bottom Reference Middle
Reference Top Bottom
Middle Top
Solar Irradiance (W/m^2)
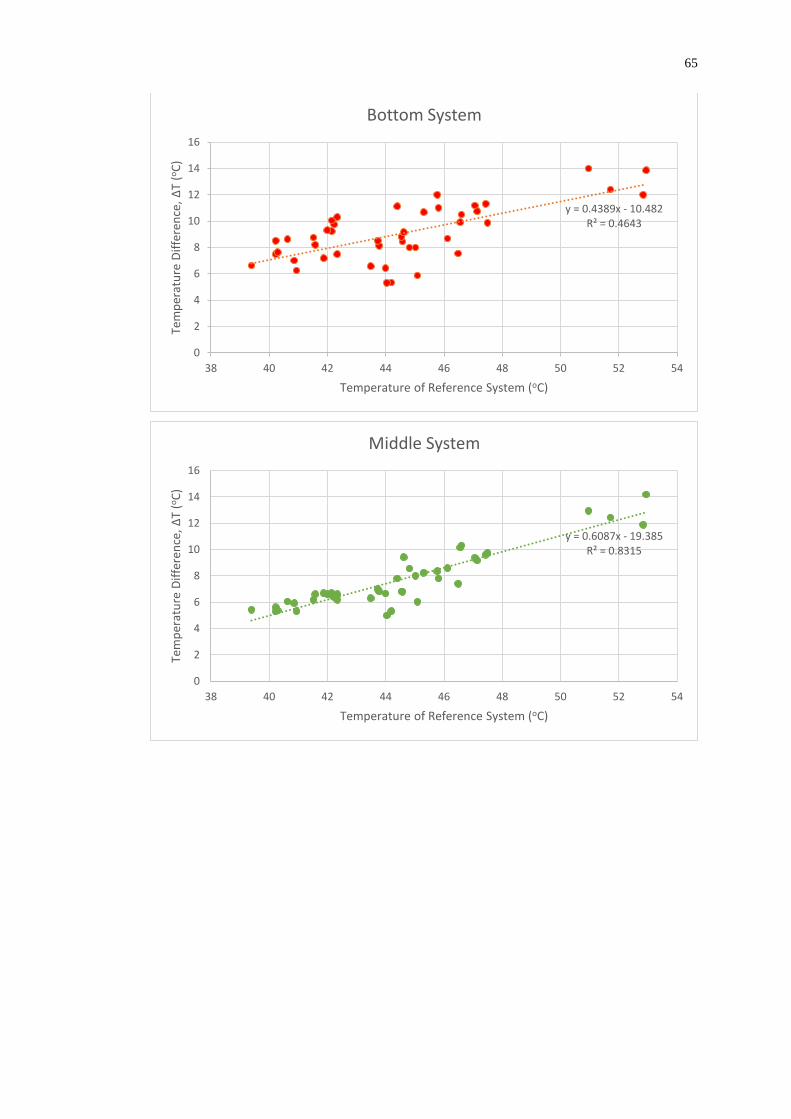
65
y = 0.4389x - 10.482R² = 0.4643
0
2
4
6
8
10
12
14
16
38 40 42 44 46 48 50 52 54
Tem
per
atu
re D
iffe
ren
ce, ∆T
(oC
)
Temperature of Reference System (oC)
Bottom System
y = 0.6087x - 19.385R² = 0.8315
0
2
4
6
8
10
12
14
16
38 40 42 44 46 48 50 52 54
Tem
per
atu
re D
iffe
ren
ce, ∆T
(oC
)
Temperature of Reference System (oC)
Middle System
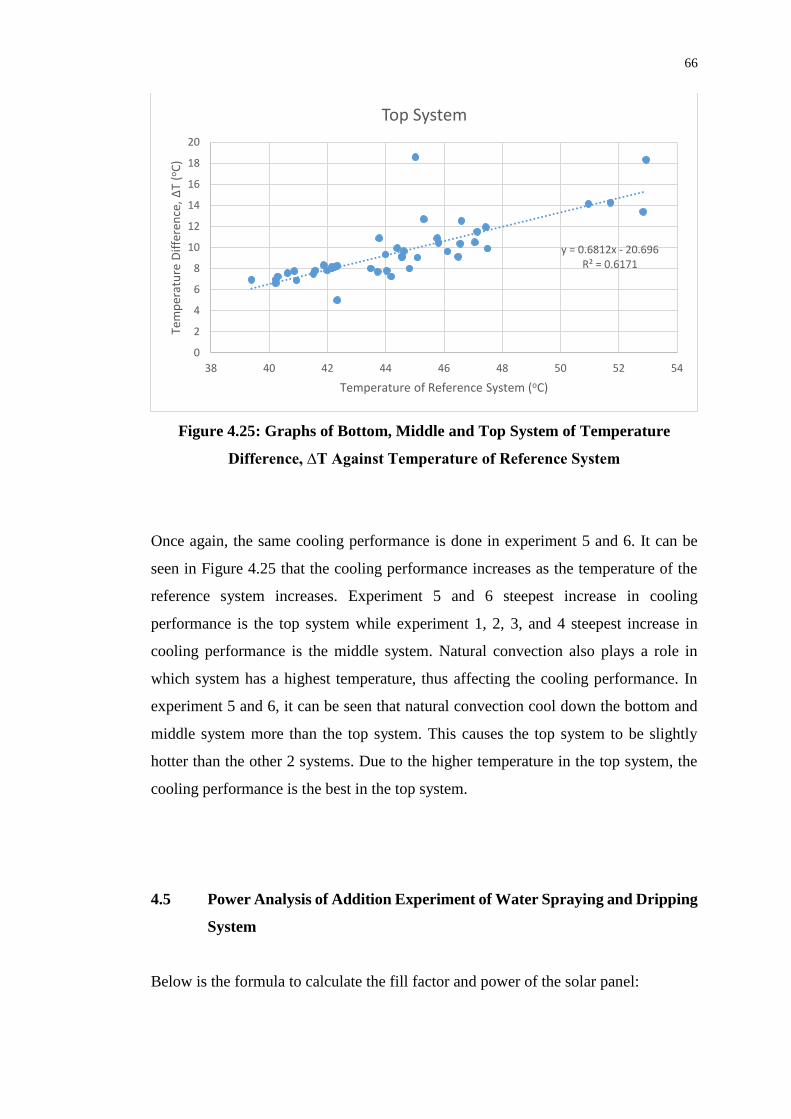
66
Figure 4.25: Graphs of Bottom, Middle and Top System of Temperature
Difference, ∆T Against Temperature of Reference System
Once again, the same cooling performance is done in experiment 5 and 6. It can be
seen in Figure 4.25 that the cooling performance increases as the temperature of the
reference system increases. Experiment 5 and 6 steepest increase in cooling
performance is the top system while experiment 1, 2, 3, and 4 steepest increase in
cooling performance is the middle system. Natural convection also plays a role in
which system has a highest temperature, thus affecting the cooling performance. In
experiment 5 and 6, it can be seen that natural convection cool down the bottom and
middle system more than the top system. This causes the top system to be slightly
hotter than the other 2 systems. Due to the higher temperature in the top system, the
cooling performance is the best in the top system.
4.5 Power Analysis of Addition Experiment of Water Spraying and Dripping
System
Below is the formula to calculate the fill factor and power of the solar panel:
y = 0.6812x - 20.696R² = 0.6171
0
2
4
6
8
10
12
14
16
18
20
38 40 42 44 46 48 50 52 54
Tem
per
atu
re D
iffe
ren
ce, ∆T
(oC
)
Temperature of Reference System (oC)
Top System
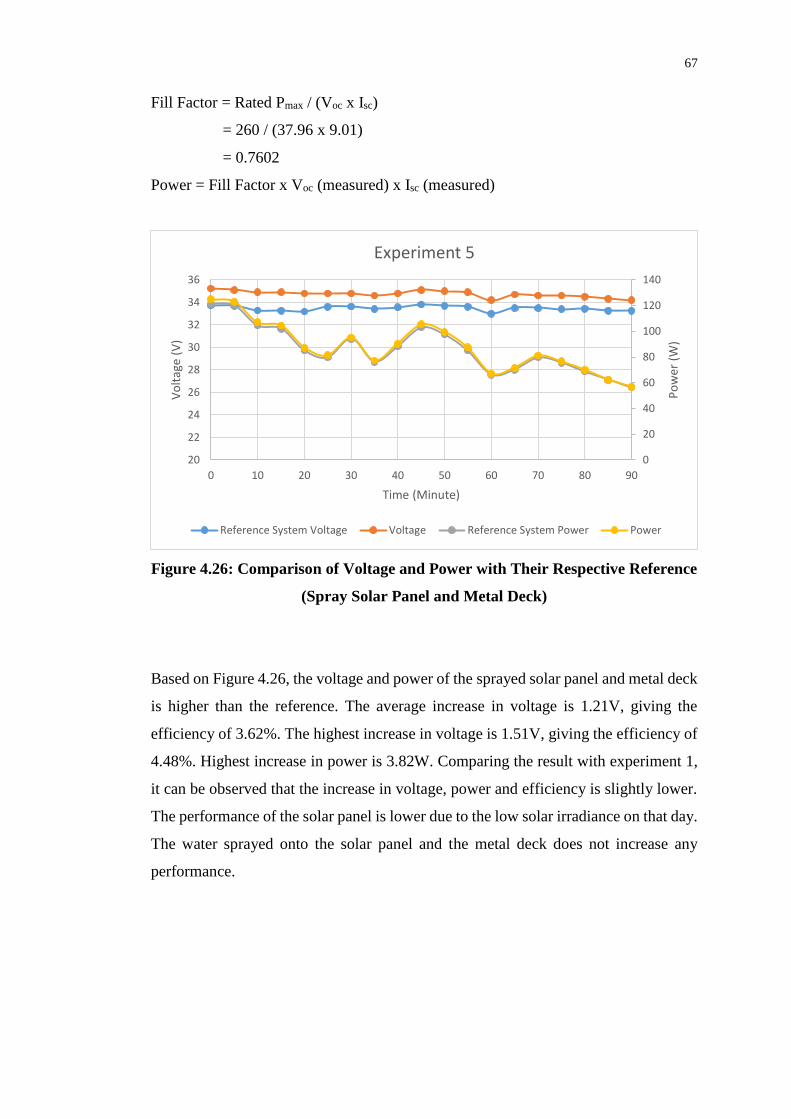
67
Fill Factor = Rated Pmax / (Voc x Isc)
= 260 / (37.96 x 9.01)
= 0.7602
Power = Fill Factor x Voc (measured) x Isc (measured)
Figure 4.26: Comparison of Voltage and Power with Their Respective Reference
(Spray Solar Panel and Metal Deck)
Based on Figure 4.26, the voltage and power of the sprayed solar panel and metal deck
is higher than the reference. The average increase in voltage is 1.21V, giving the
efficiency of 3.62%. The highest increase in voltage is 1.51V, giving the efficiency of
4.48%. Highest increase in power is 3.82W. Comparing the result with experiment 1,
it can be observed that the increase in voltage, power and efficiency is slightly lower.
The performance of the solar panel is lower due to the low solar irradiance on that day.
The water sprayed onto the solar panel and the metal deck does not increase any
performance.
0
20
40
60
80
100
120
140
20
22
24
26
28
30
32
34
36
0 10 20 30 40 50 60 70 80 90
Po
wer
(W
)
Vo
ltag
e (V
)
Time (Minute)
Experiment 5
Reference System Voltage Voltage Reference System Power Power
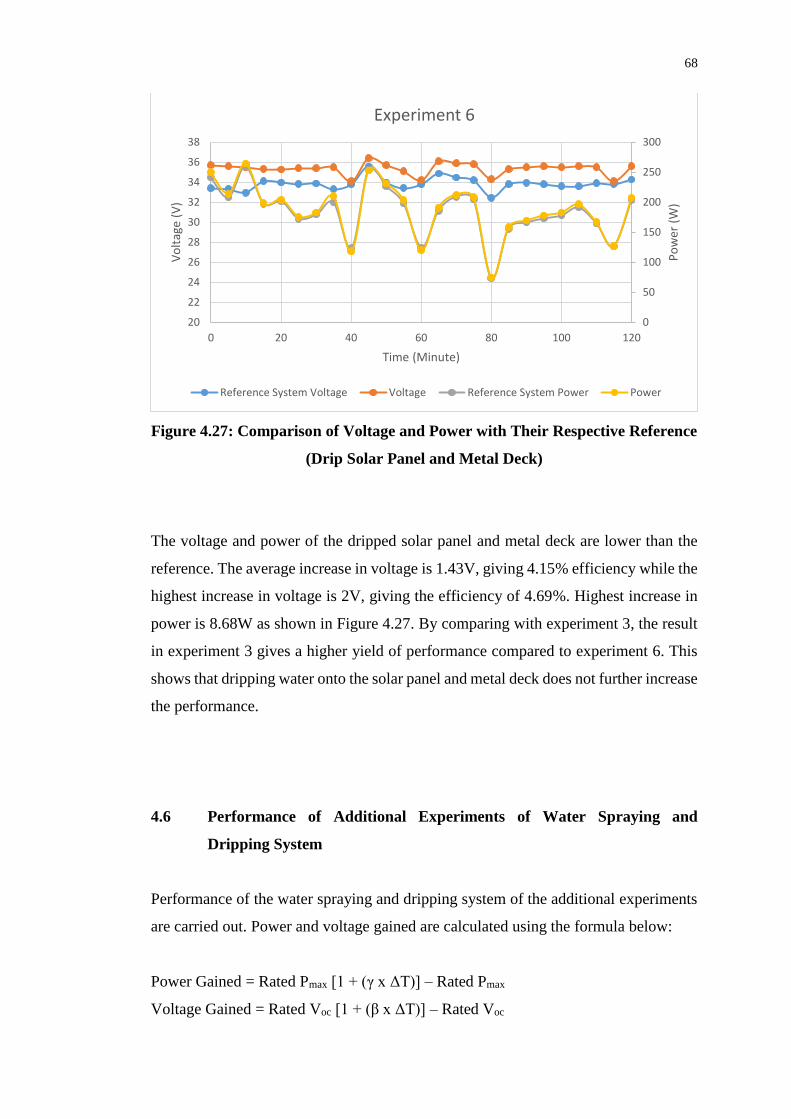
68
Figure 4.27: Comparison of Voltage and Power with Their Respective Reference
(Drip Solar Panel and Metal Deck)
The voltage and power of the dripped solar panel and metal deck are lower than the
reference. The average increase in voltage is 1.43V, giving 4.15% efficiency while the
highest increase in voltage is 2V, giving the efficiency of 4.69%. Highest increase in
power is 8.68W as shown in Figure 4.27. By comparing with experiment 3, the result
in experiment 3 gives a higher yield of performance compared to experiment 6. This
shows that dripping water onto the solar panel and metal deck does not further increase
the performance.
4.6 Performance of Additional Experiments of Water Spraying and
Dripping System
Performance of the water spraying and dripping system of the additional experiments
are carried out. Power and voltage gained are calculated using the formula below:
Power Gained = Rated Pmax [1 + (γ x ΔT)] – Rated Pmax
Voltage Gained = Rated Voc [1 + (β x ΔT)] – Rated Voc
0
50
100
150
200
250
300
20
22
24
26
28
30
32
34
36
38
0 20 40 60 80 100 120
Po
wer
(W
)
Vo
ltag
e (V
)
Time (Minute)
Experiment 6
Reference System Voltage Voltage Reference System Power Power
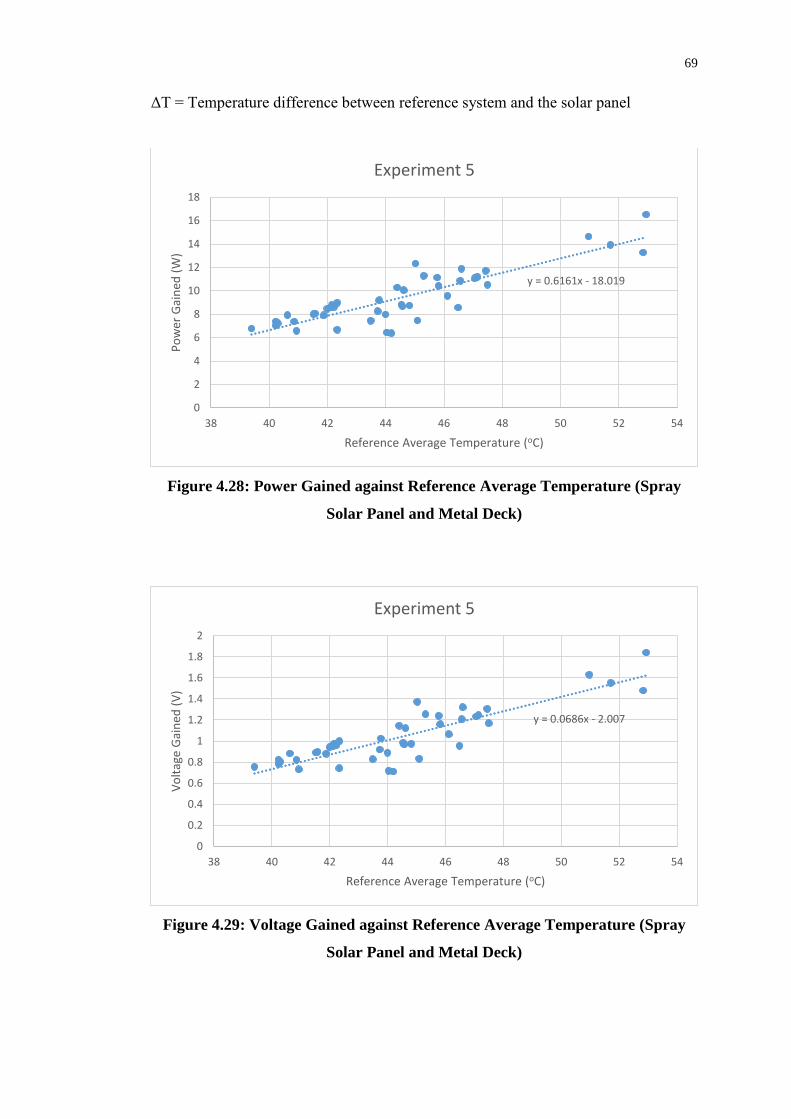
69
ΔT = Temperature difference between reference system and the solar panel
Figure 4.28: Power Gained against Reference Average Temperature (Spray
Solar Panel and Metal Deck)
Figure 4.29: Voltage Gained against Reference Average Temperature (Spray
Solar Panel and Metal Deck)
y = 0.6161x - 18.019
0
2
4
6
8
10
12
14
16
18
38 40 42 44 46 48 50 52 54
Po
wer
Gai
ned
(W
)
Reference Average Temperature (oC)
Experiment 5
y = 0.0686x - 2.007
0
0.2
0.4
0.6
0.8
1
1.2
1.4
1.6
1.8
2
38 40 42 44 46 48 50 52 54
Vo
ltag
e G
ain
ed (
V)
Reference Average Temperature (oC)
Experiment 5
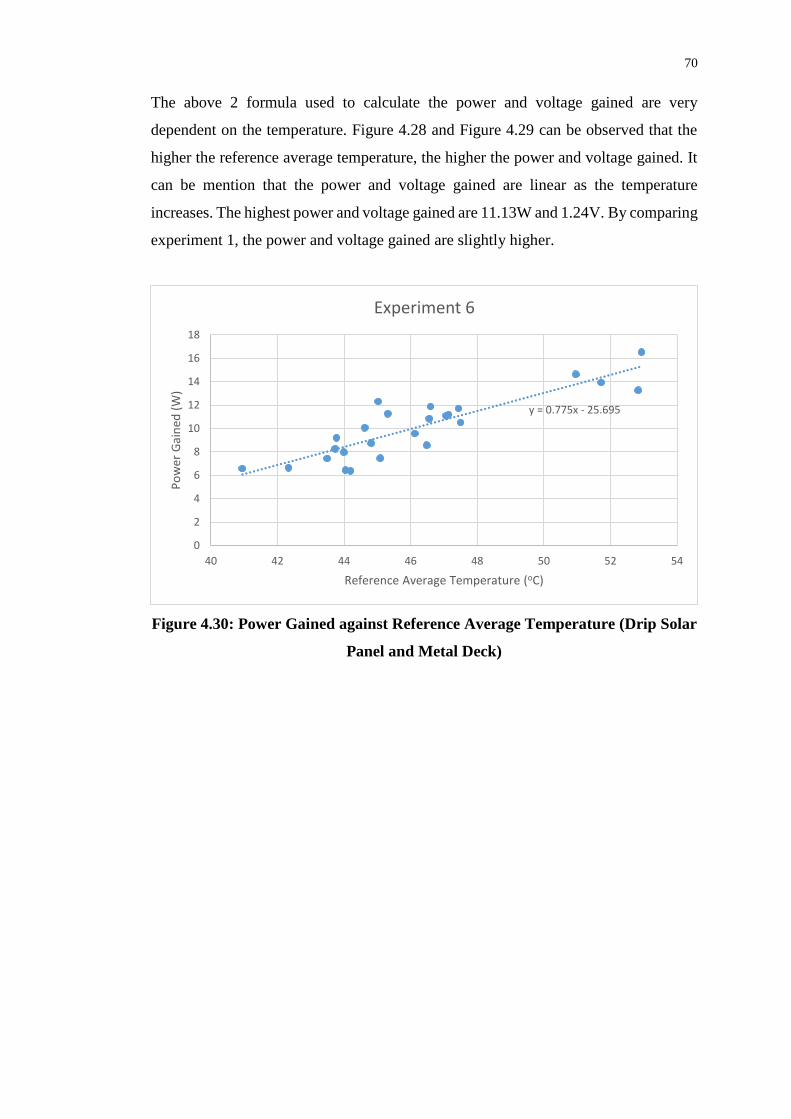
70
The above 2 formula used to calculate the power and voltage gained are very
dependent on the temperature. Figure 4.28 and Figure 4.29 can be observed that the
higher the reference average temperature, the higher the power and voltage gained. It
can be mention that the power and voltage gained are linear as the temperature
increases. The highest power and voltage gained are 11.13W and 1.24V. By comparing
experiment 1, the power and voltage gained are slightly higher.
Figure 4.30: Power Gained against Reference Average Temperature (Drip Solar
Panel and Metal Deck)
y = 0.775x - 25.695
0
2
4
6
8
10
12
14
16
18
40 42 44 46 48 50 52 54
Po
wer
Gai
ned
(W
)
Reference Average Temperature (oC)
Experiment 6
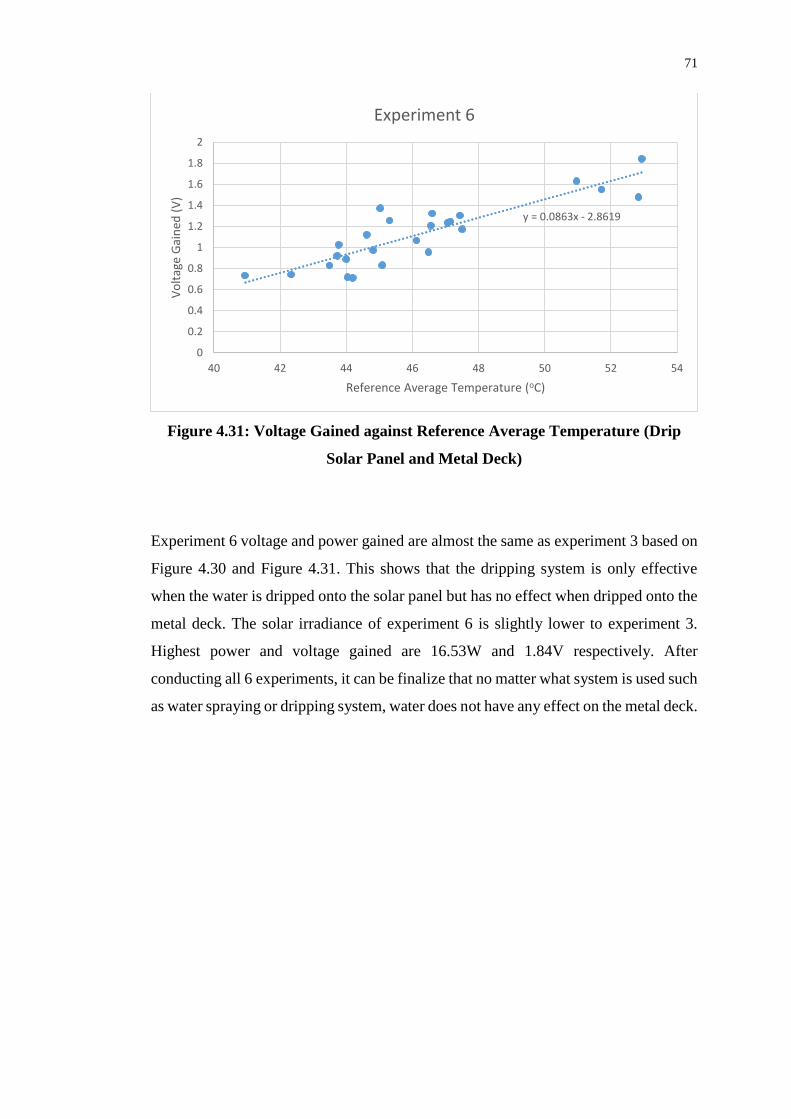
71
Figure 4.31: Voltage Gained against Reference Average Temperature (Drip
Solar Panel and Metal Deck)
Experiment 6 voltage and power gained are almost the same as experiment 3 based on
Figure 4.30 and Figure 4.31. This shows that the dripping system is only effective
when the water is dripped onto the solar panel but has no effect when dripped onto the
metal deck. The solar irradiance of experiment 6 is slightly lower to experiment 3.
Highest power and voltage gained are 16.53W and 1.84V respectively. After
conducting all 6 experiments, it can be finalize that no matter what system is used such
as water spraying or dripping system, water does not have any effect on the metal deck.
y = 0.0863x - 2.8619
0
0.2
0.4
0.6
0.8
1
1.2
1.4
1.6
1.8
2
40 42 44 46 48 50 52 54
Vo
ltag
e G
ain
ed (
V)
Reference Average Temperature (oC)
Experiment 6
72
CHAPTER 5
5 CONCLUSION AND RECOMMENDATIONS
5.1 Conclusion
There are 2 systems that are used for this project which are the water spraying and
dripping system. Total of 3 experiments were conducted for each system. Each
experiment has a different configuration to evaluate the performance of the solar panel.
Throughout all the experiments, it can be conclude that water has no effect on the metal
deck. Furthermore, in this project, water is used as an external cooling factor to cool
down the solar panel. When the solar panel temperature drops, the performance of the
solar panel increases. Based on all of the experiments, the average temperature drop is
around 7oC on a normal sunny day but decreases as high as 18.31oC on a scorching
sun based on experiment 6.
Cooling performance of the solar panel increases as the solar irradiance
increases. This is because the solar irradiance will cause the average temperature of
the solar panel to increase giving more room for water to cool it down. Besides that
both water spraying and dripping system use different amount of water to cool down
the solar panel. Based on the result, dripping system uses around 0.0032 litres per
second which is 0.016 litres per second less than the water spraying system. The
dripping system uses less water and also gives better performance compared to the
water spraying system.
In all of the 6 experiments, dripping system yield a better performance when
compared to the water spraying system. Experiment 3 has the best result among the 6
73
experiments. The average rise in voltage is 1.72V, giving an efficiency of 5.08% while
the highest rise in voltage is 2.61V with the efficiency of 7.91%. In addition to this,
the highest rise in power obtained is 10.62W. The average power generated for every
hour is around 2.522 kWh. Water bill is estimated by using the highest rate which is
the most expensive which gives around RM168 per month. The electricity bill that can
be saved per month is estimated to be RM113, this does not include overcharge for
peak hour. This will result in a loss. However, if the water bill is calculated using the
medium rate, it will cost around RM87. This will result in a profit. Therefore, profit or
loss of the electricity bill is depend on the usage of both water and electricity. There
are a few major factors that contribute to the high efficiency. Firstly, the solar
irradiance is the highest in experiment 3 which is 1119.22 W/m2. The next factor is the
dripping system which drips water on the whole solar panel unlike the water spraying
system which focuses on the center part of the solar panel. The following factor is the
evenly distribution of water by the dripping system. All of the solar cells of the solar
panel have low temperature giving better performance since they are connected in
series. It can be observed that in experiment 5 and 6, spraying or dripping water on the
solar panel and metal deck does not increase the performance of the solar panel. In a
nutshell, the dripping system is better than the water spraying system because it uses
less water and gives better performance.
5.2 Recommendations
After conducting 6 experiments regarding optimization of the performance of the solar
panel, it can be seen that they are rooms for improvement. It is recommended that a
piping system is installed to the dripping system. By doing this, the water used by the
dripping system can be reused, thus saving more water. When the piping system is
enclosed, it will also increase the pressure of the water inside, hence it can cool down
the temperature of the solar panel further. Furthermore, in a large solar farm, there are
many solar panels. Therefore, installing a piping system will not have enough pressure
to circulate the water back to the solar panel for recycle. A small piping system with a
water pump can be installed within the solar farm. The power used by the water pump
74
is small and does not use up a lot of energy generated by the solar farm. Thus, piping
system with a water pump is essential to a dripping system.
Another potential area of study is a misting system. An average misting system
costs around RM2000. Misting system is basically a piping system with a pump
connected with several nozzle to spray mist. By using mist instead of water, more
water can be save if compared to the dripping system. However, misting system can
only be used if the total area of the solar panel is wide enough. This is due to the
minimum installation cost of RM2000.
Lastly, there is another potential area of study which is the feedback of solar
cell voltage. The feedback of solar cell voltage can be used to control the flow of water.
By using a simple circuit with a feedback of solar cell voltage, the water valve can be
controlled based on the voltage obtained. If the voltage obtained is high, the water
valve will be close, hence saving water. On the other hand, if the voltage obtained is
low, this indicates that the solar panel is very hot, thus the water valve will be open.
This simple feedback of solar cell voltage circuit can be installed easily onto any
system such as dripping system or the misting system.
75
REFERENCES
Armstrong, S. & Hurley, W. G., 2010. A Thermal Model for Photovoltaic Panels under
Varying Atmospheric Conditions. [Online] Available at:
http://www.nuigalway.ie/power_electronics/documents/applied_thermal_engineer
ing_2010.pdf
[Accessed 12 March 2010].
Autodesk, Inc, 2016. Arduino DIY SD Card Logging Sheild. [Online] Available at:
http://www.instructables.com/id/Arduino-DIY-SD-Card-Logging-Shield/
[Accessed 3 May 2016].
Avion Tech Sdn Bhd, 2016. PVC Pipe. [Online] Available at:
http://buildingmaterials.com.my/polyvinyl-chloride/pvc-pipe/
[Accessed 13 April 2015].
Bloomberg New Energy Finance, 2014. Solar Insight – Research Note. [Online]
Available at: http://about.bnef.com/content/uploads/sites/4/2014/04/2014-04-16-
PV-production-2013-an-all-Asian-affair.pdf
[Accessed 16 April 2014].
Boxwell, M., 2006. Solar Electricity Handbook: A Simple, Practical Guide to Solar
Energy. U.K.: Greenstream Pub.
Coutts, T. J., Allman C. S. & Benner, John. P., 1997. Thermophotovoltaic Generation
of Electricity. Woodbury, N.Y.: AIP Press.
76
Dennis, L., 2016. Solar Cells. [Online] Available at:
http://www.pvresources.com/en/solarcells/solarcells.php
[Accessed 10 September 2016].
Dobrzanski, L. A. & Drygala, A., 2008. Surface Texturing of Multicrystalline Silicon
Solar Cells. Journal of Achievements in Materials and Manufacturing Engineering,
Vol. 31, pp. 77-82. [Online] Available at:
http://www.journalamme.org/papers_vol31_1/31111.pdf
[Accessed 1 November 2008].
Dobrzanski, L. A., et al., 2012. Monocrystalline Silicon Solar Cells Applied in
Photovoltaic System. Journal of Achievements in Materials and Manufacturing
Engineering, Vol. 53, pp. 7-13. [Online] Available at:
http://www.journalamme.org/papers_vol53_1/5311.pdf
[Accessed 1 July 2015].
Enhance Photovoltaics, 2015. Enhance Photovoltaic Modules. [Online] Available at:
http://enhance-photovoltaics.com/
[Accessed 10 March 2016].
Electro Schematics, 2016. Arduino Mega 2560 Pinout. [Online] Available at:
http://www.electroschematics.com/7963/arduino-mega-2560-pinout/
[Accessed 2 November 2014].
Gail, A. M., 2013. Study of The Operating Temperature of a PV Module. [Online]
Available at:
http://www.ht.energy.lth.se/fileadmin/ht/Kurser/MVK160/2012/Gail-
Angee_Migan.pdf
[Accessed 16 May 2013].
Harbor Freight Tools, 2016. 5/8 in. x 100 ft. Heavy Duty Garden Hose. [Online]
Available http://www.harborfreight.com/5-8-eighth-inch-x-100-ft-heavy-duty-
garden-hose-67018.html [Accessed 26 May 2015].
77
Jef, P. & Giovanni, F., 2003. Photovoltaic Stacks. [Online] Available at:
http://web.archive.org/web/20071013061056/http://www.imec.be/wwwinter/energ
y/space_main.shtml
[Accessed 23 December 2003].
Kalogirou, S. A., 2013. Solar Energy Engineering Processes and Systems. 2nd ed.
Burington, MA: Elsevier/Academic Press.
Kazmerski, L., 1994. The First NREL Conference on Thermophotovoltaic Generation
of Electricity. [Online] Available at:
http://webapp1.dlib.indiana.edu/virtual_disk_library/index.cgi/4298428/FID2471/
m94011831.pdf
[Accessed 27 July 1994].
Markvart, T., 2000. Solar Electricity. 2nd ed. Chichester: Wiley.
Mayur, S., 2015. China: The New Silicon Valley. [Online] Available at:
http://marketrealist.com/2015/02/china-new-silicon-valley/
[Accessed 2 February 2015].
ModernEnviro, 2014. Home Solar Energy Guide: Part III. [Online] Available at:
http://www.modernenviro.com/home-solar-energy-guide-part-3/
[Accessed 25 May 2016].
Moharram, K. A., et al., 2013. Enhancing The Performance of Photovoltaic Panels by
Water Cooling. [Online] Available at:
http://www.sciencedirect.com/science/article/pii/S2090447913000403
[Accessed 16 May 2013].
78
New Energy and Fuel, 2016. A New Thermal Energy to Electricity Device. [Online]
Available at:
http://newenergyandfuel.com/http:/newenergyandfuel/com/2011/07/28/a-new-
thermal-energy-to-electricity-device/
[Accessed 28 July 2011].
OPVAP, 2011. I-V Curve. [Online] Available at: http://opvap.com/jsc.php
[Accessed 15 March 2016].
Solar Feeds, 2012. Polycrystalline vs Monocrystalline Solar Modules. [Online]
Available at: http://www.solarfeeds.com/polycrystalline-vs-monocrystalline-solar-
modules/
[Accessed 1 June 2012].
The Eppley Laboratory, INC., 2016. Standard Precision Pyranometer. [Online]
Available at:
http://www.eppleylab.com/instrumentation/standard_precision_pyranometer.htm
[Accessed 13 May 2016].
The New York Times Company, 2016. Is Solar Power Expensive or Competitive?.
[Online] Available at: http://green.blogs.nytimes.com/2009/11/13/is-solar-power-
expensive-or-competitive/
[Accessed 13 November 2009].
Thomas Publishing Company, 2016. Digital Multimeters. [Online] Available at:
http://www.thomasnet.com/articles/engineering-consulting/digital-multimeters
[Accessed 10 September 2016].

79
APPENDICES
APPENDIX A: MSR Multi-Crystalline Photovoltaic Module MYS-60 CF-260
Data Sheet
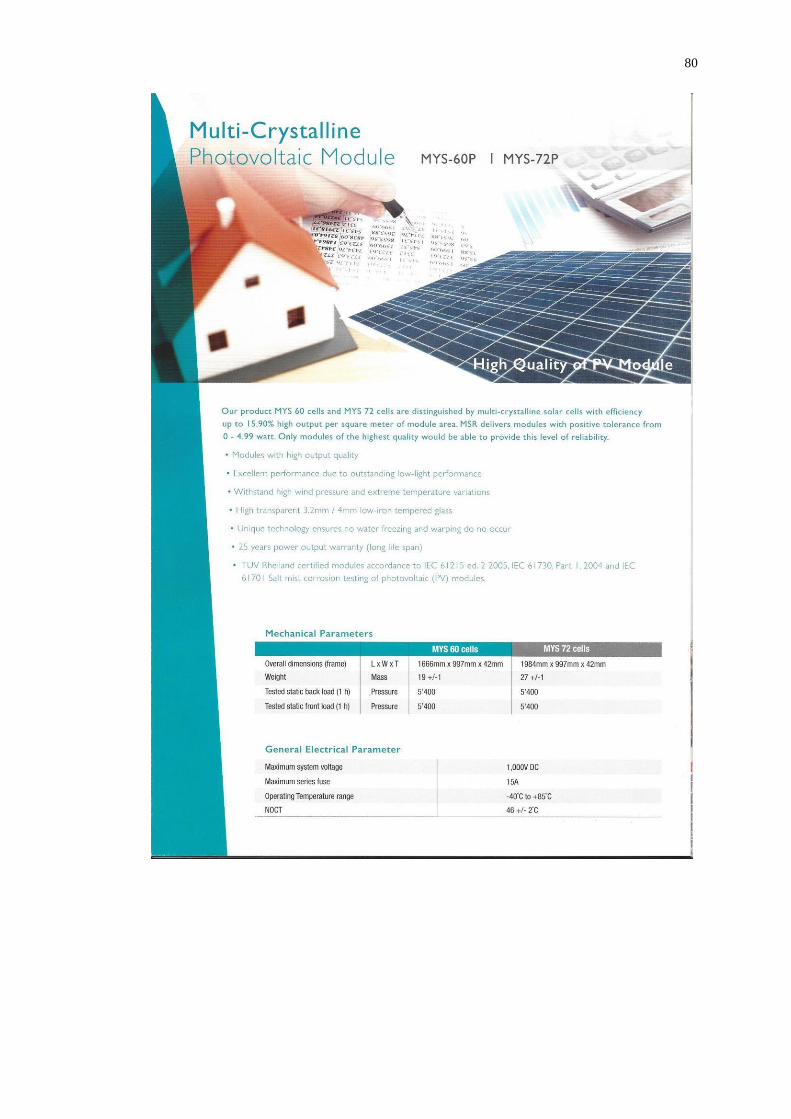
80
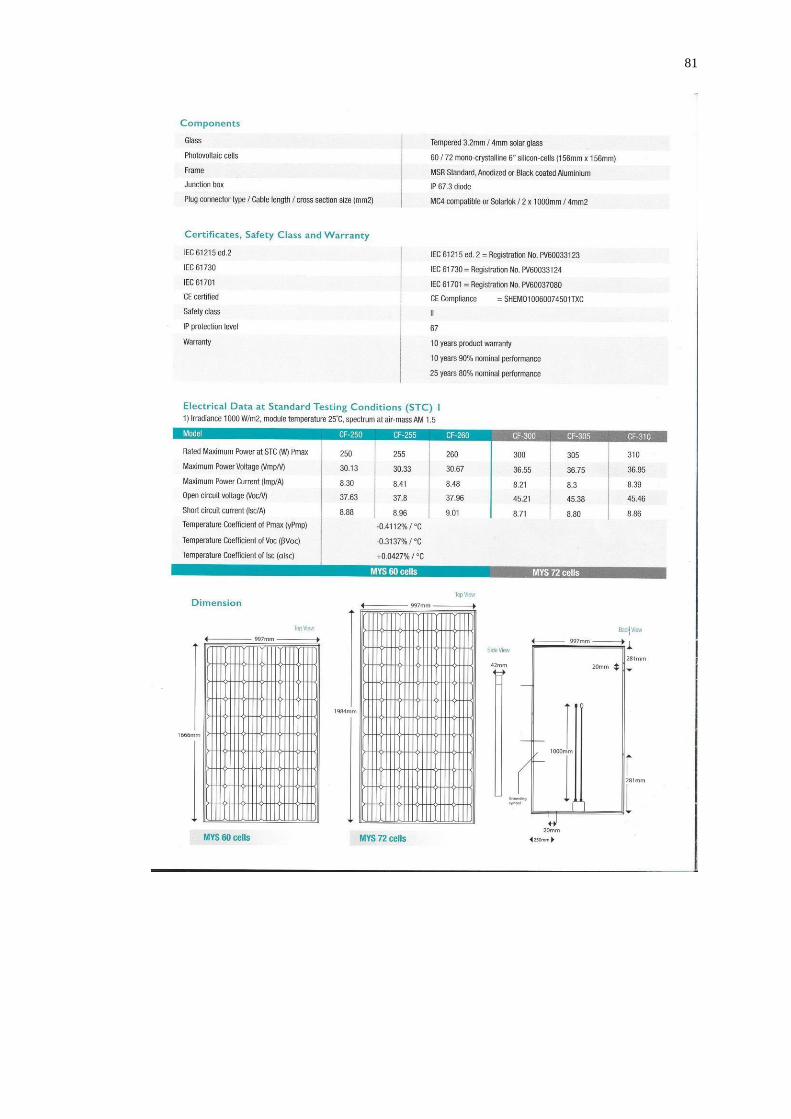
81
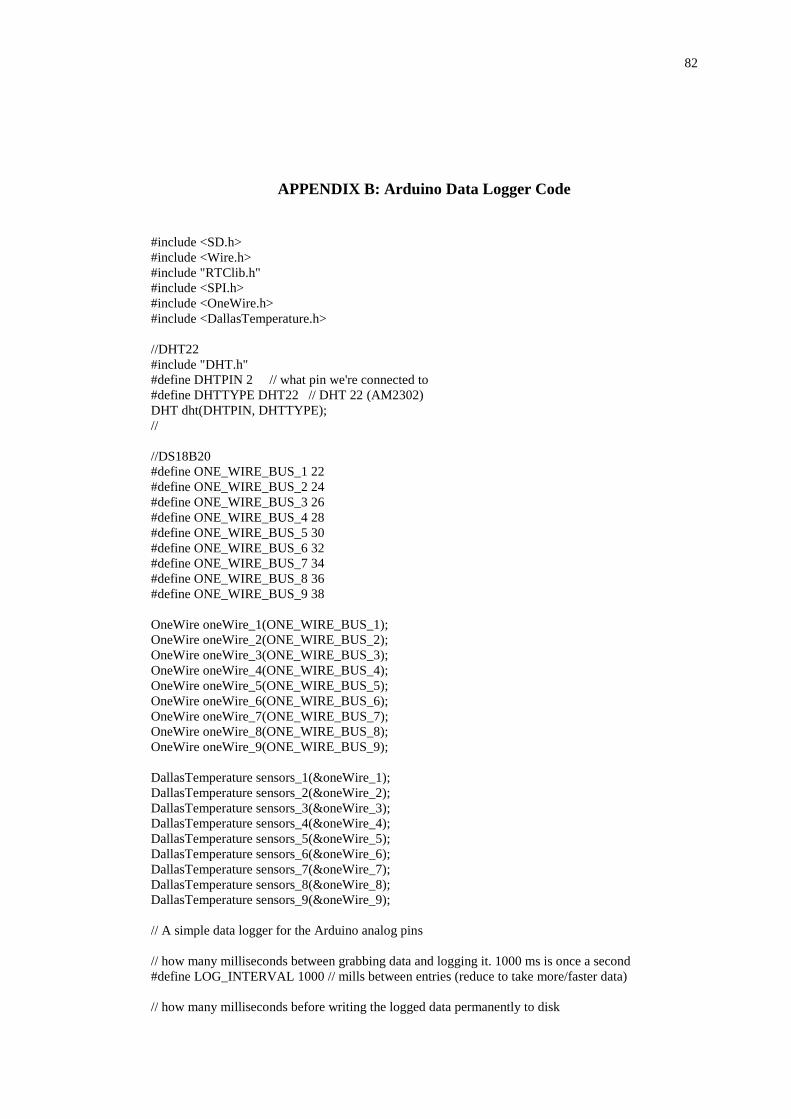
82
APPENDIX B: Arduino Data Logger Code
#include <SD.h>
#include <Wire.h>
#include "RTClib.h"
#include <SPI.h>
#include <OneWire.h>
#include <DallasTemperature.h>
//DHT22
#include "DHT.h"
#define DHTPIN 2 // what pin we're connected to
#define DHTTYPE DHT22 // DHT 22 (AM2302)
DHT dht(DHTPIN, DHTTYPE);
//
//DS18B20
#define ONE_WIRE_BUS_1 22
#define ONE_WIRE_BUS_2 24
#define ONE_WIRE_BUS_3 26
#define ONE_WIRE_BUS_4 28
#define ONE_WIRE_BUS_5 30
#define ONE_WIRE_BUS_6 32
#define ONE_WIRE_BUS_7 34
#define ONE_WIRE_BUS_8 36
#define ONE_WIRE_BUS_9 38
OneWire oneWire_1(ONE_WIRE_BUS_1);
OneWire oneWire_2(ONE_WIRE_BUS_2);
OneWire oneWire_3(ONE_WIRE_BUS_3);
OneWire oneWire_4(ONE_WIRE_BUS_4);
OneWire oneWire_5(ONE_WIRE_BUS_5);
OneWire oneWire_6(ONE_WIRE_BUS_6);
OneWire oneWire_7(ONE_WIRE_BUS_7);
OneWire oneWire_8(ONE_WIRE_BUS_8);
OneWire oneWire_9(ONE_WIRE_BUS_9);
DallasTemperature sensors_1(&oneWire_1);
DallasTemperature sensors_2(&oneWire_2);
DallasTemperature sensors_3(&oneWire_3);
DallasTemperature sensors_4(&oneWire_4);
DallasTemperature sensors_5(&oneWire_5);
DallasTemperature sensors_6(&oneWire_6);
DallasTemperature sensors_7(&oneWire_7);
DallasTemperature sensors_8(&oneWire_8);
DallasTemperature sensors_9(&oneWire_9);
// A simple data logger for the Arduino analog pins
// how many milliseconds between grabbing data and logging it. 1000 ms is once a second
#define LOG_INTERVAL 1000 // mills between entries (reduce to take more/faster data)
// how many milliseconds before writing the logged data permanently to disk
83
// set it to the LOG_INTERVAL to write each time (safest)
// set it to 10*LOG_INTERVAL to write all data every 10 datareads, you could lose up to
// the last 10 reads if power is lost but it uses less power and is much faster!
#define SYNC_INTERVAL 1000 // mills between calls to flush() - to write data to the card
uint32_t syncTime = 0; // time of last sync()
#define ECHO_TO_SERIAL 1 // echo data to serial port
#define WAIT_TO_START 0 // Wait for serial input in setup()
// the digital pins that connect to the LEDs
#define redLEDpin 2
#define greenLEDpin 3
// The analog pins that connect to the sensors
//#define photocellPin 0 // analog 0
//#define tempPin 1 // analog 1
//#define BANDGAPREF 14 // special indicator that we want to measure the bandgap
//#define aref_voltage 3.3 // we tie 3.3V to ARef and measure it with a multimeter!
//#define bandgap_voltage 1.1 // this is not super guaranteed but its not -too- off
RTC_DS1307 RTC; // define the Real Time Clock object
// for the data logging shield, we use digital pin 10 for the SD cs line
const int chipSelect = 10;
// the logging file
File logfile;
void error(char *str)
{
Serial.print("error: ");
Serial.println(str);
// red LED indicates error
digitalWrite(redLEDpin, HIGH);
while(1);
}
void setup(void)
{
Serial.begin(9600);
Serial.println();
dht.begin();
// use debugging LEDs
pinMode(redLEDpin, OUTPUT);
pinMode(greenLEDpin, OUTPUT);
#if WAIT_TO_START
Serial.println("Type any character to start");
while (!Serial.available());
#endif //WAIT_TO_START
// initialize the SD card
Serial.print("Initializing SD card...");
// make sure that the default chip select pin is set to
// output, even if you don't use it:
pinMode(10, OUTPUT);
84
// see if the card is present and can be initialized:
if (!SD.begin(53, 51, 50, 52)) {
error("Card failed, or not present");
}
Serial.println("card initialized.");
// create a new file
char filename[] = "LOGGER00.CSV";
for (uint8_t i = 0; i < 100; i++) {
filename[6] = i/10 + '0';
filename[7] = i%10 + '0';
if (! SD.exists(filename)) {
// only open a new file if it doesn't exist
logfile = SD.open(filename, FILE_WRITE);
break; // leave the loop!
}
}
if (! logfile) {
error("couldnt create file");
}
Serial.print("Logging to: ");
Serial.println(filename);
// connect to RTC
Wire.begin();
if (!RTC.begin()) {
logfile.println("RTC failed");
#if ECHO_TO_SERIAL
Serial.println("RTC failed");
#endif //ECHO_TO_SERIAL
}
logfile.println("Millis, Stamp, Date Time, Humidity,DHT22, Temp 1,Temp 2,Temp 3,Temp
4,Temp 5,Temp 6,Temp 7,Temp 8,Temp 9");
#if ECHO_TO_SERIAL
Serial.println ("Millis, Stamp, Date Time, Humidity,DHT22, Temp 1,Temp 2,Temp 3,Temp
4,Temp 5,Temp 6,Temp 7,Temp 8,Temp 9");
#endif //ECHO_TO_SERIAL
sensors_1.begin();
sensors_2.begin();
sensors_3.begin();
sensors_4.begin();
sensors_5.begin();
sensors_6.begin();
sensors_7.begin();
sensors_8.begin();
sensors_9.begin();
}
void loop(void)
{
DateTime now;
// delay for the amount of time we want between readings
delay((LOG_INTERVAL -1) - (millis() % LOG_INTERVAL));
85
digitalWrite(greenLEDpin, HIGH);
// log milliseconds since starting
uint32_t m = millis();
logfile.print(m); // milliseconds since start
logfile.print(", ");
#if ECHO_TO_SERIAL
Serial.print(m); // milliseconds since start
Serial.print(", ");
#endif
// fetch the time
now = RTC.now();
// log time
logfile.print(now.unixtime()); // seconds since 1/1/1970
logfile.print(", ");
logfile.print('"');
logfile.print(now.year(), DEC);
logfile.print("/");
logfile.print(now.month(), DEC);
logfile.print("/");
logfile.print(now.day(), DEC);
logfile.print(" ");
logfile.print(now.hour(), DEC);
logfile.print(":");
logfile.print(now.minute(), DEC);
logfile.print(":");
logfile.print(now.second(), DEC);
logfile.print('"');
#if ECHO_TO_SERIAL
Serial.print(now.unixtime()); // seconds since 1/1/1970
Serial.print(", ");
Serial.print('"');
Serial.print(now.year(), DEC);
Serial.print("/");
Serial.print(now.month(), DEC);
Serial.print("/");
Serial.print(now.day(), DEC);
Serial.print(" ");
Serial.print(now.hour(), DEC);
Serial.print(":");
Serial.print(now.minute(), DEC);
Serial.print(":");
Serial.print(now.second(), DEC);
Serial.print('"');
#endif //ECHO_TO_SERIAL
//DHT22
float h = dht.readHumidity();
// Read temperature as Celsius
float t = dht.readTemperature();
// Read temperature as Fahrenheit
float f = dht.readTemperature(true);
// Check if any reads failed and exit early (to try again).
if (isnan(h) || isnan(t) || isnan(f)) {
Serial.println("Failed to read from DHT sensor!");
}
sensors_1.requestTemperatures(); // Send the command to get temperatures
86
sensors_2.requestTemperatures();
sensors_3.requestTemperatures();
sensors_4.requestTemperatures();
sensors_5.requestTemperatures();
sensors_6.requestTemperatures();
sensors_7.requestTemperatures();
sensors_8.requestTemperatures();
sensors_9.requestTemperatures();
logfile.print(", ");
logfile.print(h);
logfile.print(", ");
logfile.print(t);
logfile.print(", ");
logfile.print(sensors_1.getTempCByIndex(0));
logfile.print(", ");
logfile.print(sensors_2.getTempCByIndex(0));
logfile.print(", ");
logfile.print(sensors_3.getTempCByIndex(0));
logfile.print(", ");
logfile.print(sensors_4.getTempCByIndex(0));
logfile.print(", ");
logfile.print(sensors_5.getTempCByIndex(0));
logfile.print(", ");
logfile.print(sensors_6.getTempCByIndex(0));
logfile.print(", ");
logfile.print(sensors_7.getTempCByIndex(0));
logfile.print(", ");
logfile.print(sensors_8.getTempCByIndex(0));
logfile.print(", ");
logfile.print(sensors_9.getTempCByIndex(0));
#if ECHO_TO_SERIAL
Serial.print(", ");
Serial.print(h);
Serial.print(", ");
Serial.print(t);
Serial.print(", ");
Serial.print(sensors_1.getTempCByIndex(0));
Serial.print(", ");
Serial.print(sensors_2.getTempCByIndex(0));
Serial.print(", ");
Serial.print(sensors_3.getTempCByIndex(0));
Serial.print(", ");
Serial.print(sensors_4.getTempCByIndex(0));
Serial.print(", ");
Serial.print(sensors_5.getTempCByIndex(0));
Serial.print(", ");
Serial.print(sensors_6.getTempCByIndex(0));
Serial.print(", ");
Serial.print(sensors_7.getTempCByIndex(0));
Serial.print(", ");
Serial.print(sensors_8.getTempCByIndex(0));
Serial.print(", ");
Serial.print(sensors_9.getTempCByIndex(0));
#endif //ECHO_TO_SERIAL
logfile.println();
#if ECHO_TO_SERIAL

87
Serial.println();
#endif // ECHO_TO_SERIAL
digitalWrite(greenLEDpin, LOW);
// Now we write data to disk! Don't sync too often - requires 2048 bytes of I/O to SD card
// which uses a bunch of power and takes time
if ((millis() - syncTime) < SYNC_INTERVAL) return;
syncTime = millis();
// blink LED to show we are syncing data to the card & updating FAT!
digitalWrite(redLEDpin, HIGH);
logfile.flush();
digitalWrite(redLEDpin, LOW);
}