Embed Size (px)
Citation preview
Performance of U.S. 15-Year-Old Students in Science, Reading, and Mathematics Literacy in an International ContextFirst Look at PISA 2015
NCES 2017-048U.S. DEPARTMENT OF EDUCATION

This page intentionally left blank
Performance of U.S. 15-Year-Old Students in Science, Reading, and Mathematics Literacy in an International ContextFirst Look at PISA 2015
DECEMBER 2016
David KastbergJessica Ying ChanGordon MurrayWestat
Patrick GonzalesProject OfficerNational Center for Education Statistics
U.S. DEPARTMENT OF EDUCATIONNCES 2017-048
U.S. Department of Education John B. King, Jr. Secretary
Institute of Education Sciences Ruth Neild Deputy Director for Policy and Research Delegated Duties of the Director
National Center for Education Statistics Peggy G. Carr Acting Commissioner
The National Center for Education Statistics (NCES) is the primary federal entity for collecting, analyzing, and re-porting data related to education in the United States and other nations. It fulfills a congressional mandate to collect, collate, analyze, and report full and complete statistics on the condition of education in the United States; conduct and publish reports and specialized analyses of the meaning and significance of such statistics; assist state and local education agencies in improving their statistical systems; and review and report on education activities in foreign countries.
NCES activities are designed to address high-priority education data needs; provide consistent, reliable, complete, and accurate indicators of education status and trends; and report timely, useful, and high-quality data to the U.S. Department of Education, the Congress, the states, other education policymakers, practitioners, data users, and the general public. Unless specifically noted, all information contained herein is in the public domain.
We strive to make our products available in a variety of formats and in language that is appropriate to a variety of audiences. You, as our customer, are the best judge of our success in communicating information effectively. If you have any comments or suggestions about this or any other NCES product or report, we would like to hear from you. Please direct your comments to:
NCES, IES, U.S. Department of Education Potomac Center Plaza (PCP), 550 12th Street SW Washington, DC 20202
December 2016
The NCES Home Page address is http://nces.ed.gov. The NCES Publications and Products address is http://nces.ed.gov/pubsearch.
This publication is only available online. To download, view, and print the report as a PDF file, go to the NCES Publications and Products address shown above.
This report was prepared for the National Center for Education Statistics under Contract No. ED-IES-13-C-0006 with Westat. Mention of trade names, commercial products, or organizations does not imply endorsement by the U.S. Government.
Suggested Citation Kastberg, D., Chan, J.Y., and Murray, G. (2016). Performance of U.S. 15-Year-Old Students in Science, Reading, and Mathematics Literacy in an International Context: First Look at PISA 2015 (NCES 2017-048). U.S. Department of Education. Washington, DC: National Center for Education Statistics. Retrieved [date] from http://nces.ed.gov/pubsearch.
Content Contact Patrick Gonzales (415) 920-9229 [email protected]
iii
AcknowledgmentsThe authors wish to thank the students, teachers, and school officials who participated in PISA 2015. Without their assistance and cooperation, this study would not be possible. The uthors also wish to thank all those who contributed to the PISA design, implementation, and data collection as well as the writing, production, and review of this report.

This page intentionally left blank
v
ContentsAcknowledgments ........................................................................................................ iii
Introduction ............................................................................................................. 1
What is PISA? .......................................................................................................... 1
What PISA Measures ............................................................................................... 1
Science Literacy .............................................................................................................. 2
Reading Literacy ............................................................................................................... 5
Mathematics Literacy ................................................................................................ 7
Computer-Based Assessment .......................................................................................... 9
Reporting PISA 2015 Results ..................................................................................... 10
Selected Findings ........................................................................................................ 13
Figures and Tables ....................................................................................................... 17
References ................................................................................................................... 27
Technical Notes ........................................................................................................... 29
Page
vi
List of Tables Page
Table 1. Average scores of 15-year-old students on the PISA science literacy scale, by education system: 2015 ............................................................................... 17
Table 2. Average scores of 15-year-old students on the PISA reading literacy scale, by education system: 2015 ............................................................................... 20
Table 3. Average scores of 15-year-old students on the PISA mathematics literacy scale, by education system: 2015 ...................................................................... 23
Table 4. Average scores and changes in average scores of U.S. 15-year-old students on the PISA science, reading and mathematics literacy scales: 2003, 2006, 2009, 2012, and 2015 ..................................................................................... 26
List of FiguresFigure 1. Average scores and 10th and 90th percentile cut scores of 15-year-old
students on the PISA science literacy scale, by education system: 2015 ............. 18
Figure 2. Percentage of 15-year-old students performing at PISA science literacy proficiency levels below level 2 and levels 5 and above, by education system: 2015 ................................................................................................... 19
Figure 3. Average scores and 10th and 90th percentile cut scores of 15-year-old students on the PISA reading literacy scale, by education system: 2015 ............ 21
Figure 4. Percentage of 15-year-old students performing at PISA reading literacy proficiency levels below level 2 and levels 5 and above, by education system: 2015 ................................................................................................... 22
Figure 5. Average scores and 10th and 90th percentile cut scores of 15-year-old students on the PISA mathematics literacy scale, by education system: 2015 ...... 24
Figure 6. Percentage of 15-year-old students performing at PISA mathematics literacy proficiency levels below level 2 and levels 5 and above, by education system: 2015 ........................................................................................................... 25
List of ExhibitsExhibit 1. Description of PISA proficiency levels on the science literacy scale: 2015 ........... 4
Exhibit 2. Description of PISA proficiency levels on reading literacy scale: 2015 ................ 6
Exhibit 3. Description of PISA proficiency levels on the mathematics literacy scale: 2015 ..... 8
1
Introduction
What is PISA?The Program for International Student Assessment (PISA) is a system of international assessments that allows countries to compare outcomes of learning as students near the end of compulsory schooling. PISA core assessments measure the performance of 15-year-old students in science, reading, and mathematics literacy every 3 years. Coordinated by the Organization for Economic Cooperation and Development (OECD), PISA was first implemented in 2000 in 32 countries. It has since grown to 73 education systems in 2015.1 The United States has participated in every cycle of PISA since its inception in 2000. In 2015, Massachusetts, North Carolina, and Puerto Rico also participated separately from the nation. Of these three, Massachusetts previously participated in PISA 2012.
What PISA MeasuresPISA’s goal is to assess students’ preparation for the challenges of life as young adults. The study assesses the application of knowledge in science, reading, and mathematics literacy to problems within a real-life context (OECD 1999). PISA does not focus explicitly on curricular outcomes and uses the term “literacy” in each subject area to indicate its broad focus on the application of knowledge and skills learned both in and outside of school. For example, when assessing science, PISA examines how well 15-year-old students can understand, use, and reflect on science for a variety of real-life problems and settings that they may encounter in and out of school.
Each PISA data collection cycle assesses one of the three core subject areas in depth (considered the major subject area), although all three core subjects are assessed in each cycle (the other two subjects are considered minor subject areas for that assessment year). Assessing all three subjects every 3 years allows countries to have a consistent source of achievement data in each of the three subjects while rotating one area as the primary focus over the years. Each subject is a major area once every three cycles. Science was the major subject area in 2015, as it was in 2006. In 2015, science, reading, and mathematics literacy were assessed through a computer-based assessment in the majority of countries, including the United States.
In addition to these core assessments, education systems could participate in two optional assessment components: collaborative problem solving and financial literacy. The United States, Massachusetts, and North Carolina administered the computer-based assessment with both optional assessments while Puerto Rico administered the paper-based core assessment without the optional assessments. This report addresses results only of the science,
1 Of the 73 education systems that participated in PISA 2015, results for three of these—Argentina, Kazakhstan, and Malaysia—are not included due to technical issues with their samples that prevent results from being discussed in this report. For more information, see OECD (2016d).
2
mathematics, and reading literacy assessments. Results of the collaborative problem solving and financial literacy assessments will be released separately at a later date.
PISA includes questionnaires that provide contextual information for interpreting student achievement. In 2015, the United States administered student, school, and teacher questionnaires. Students answered questions about their background, attitudes towards science, and learning strategies, among other topics. The principal of each participating school completed a school questionnaire that provided information on the school’s demographics and learning environment. Lastly, up to 10 science teachers and 15 nonscience teachers per school completed questionnaires on teaching practices, beliefs about teaching, and their qualifications and backgrounds. Massachusetts and North Carolina administered all three questionnaires while Puerto Rico administered the student and school questionnaires only.
Visit http://nces.ed.gov/surveys/pisa for more information on the PISA assessments, including information on how the assessments were designed and examples of PISA test items and questionnaires. PISA questions from the current and previous cycles can also be found at https://www.oecd.org/pisa/pisaproducts/pisa-test-questions.htm.
Science LiteracyIn PISA 2015, the major subject was science literacy, defined as
the ability to engage with science-related issues, and with the ideas of science, as a reflective citizen. A scientifically literate person, therefore, is willing to engage in reasoned discourse about science and technology which requires the competencies to:
1. Explain phenomena scientifically: Recognize, offer, and evaluate explanations for a range of natural and technological phenomena.
2. Evaluate and design scientific inquiry: Describe and appraise scientific investigations and propose ways of addressing questions scientifically.
3. Interpret data and evidence scientifically: Analyze and evaluate data, claims and arguments in a variety of representations and draw appropriate scientific conclusions (OECD 2016a, p. 7).
3
More specifically, the PISA science assessment measures three science content categories and three science process categories:
Science content categories (OECD 2016a, p. 18):
• Physical systems: Are students able to understand the structures, properties, and chemical changes of matter, motion and forces, and energy and interactions between energy and matter?
• Living systems: Do students have knowledge of cells, the concept of an organism, human systems, populations, ecosystems, and biospheres?
• Earth and space systems: Are 15-year-olds able to comprehend the history and scale of the Universe and the Earth system’s structures, energy, and changes?
Science process categories (OECD 2016a, pp. 8–16):
• Explain phenomena scientifically: Can 15-year-olds recall appropriate scientific knowledge, identify explanatory models, make and justify predictions and hypotheses, and explain the potential implications of scientific knowledge for society?
• Evaluate and design scientific enquiry: Can students identify the questions explored in a given scientific study, propose and evaluate ways of exploring such questions, and describe and evaluate the methods scientists use to ensure data quality?
• Interpret data and evidence scientifically: Are 15-year-olds able to analyze and interpret data to draw appropriate conclusions, identify the assumptions in science-related texts, recognize when arguments are based on scientific evidence and theory, and evaluate scientific arguments from different sources?
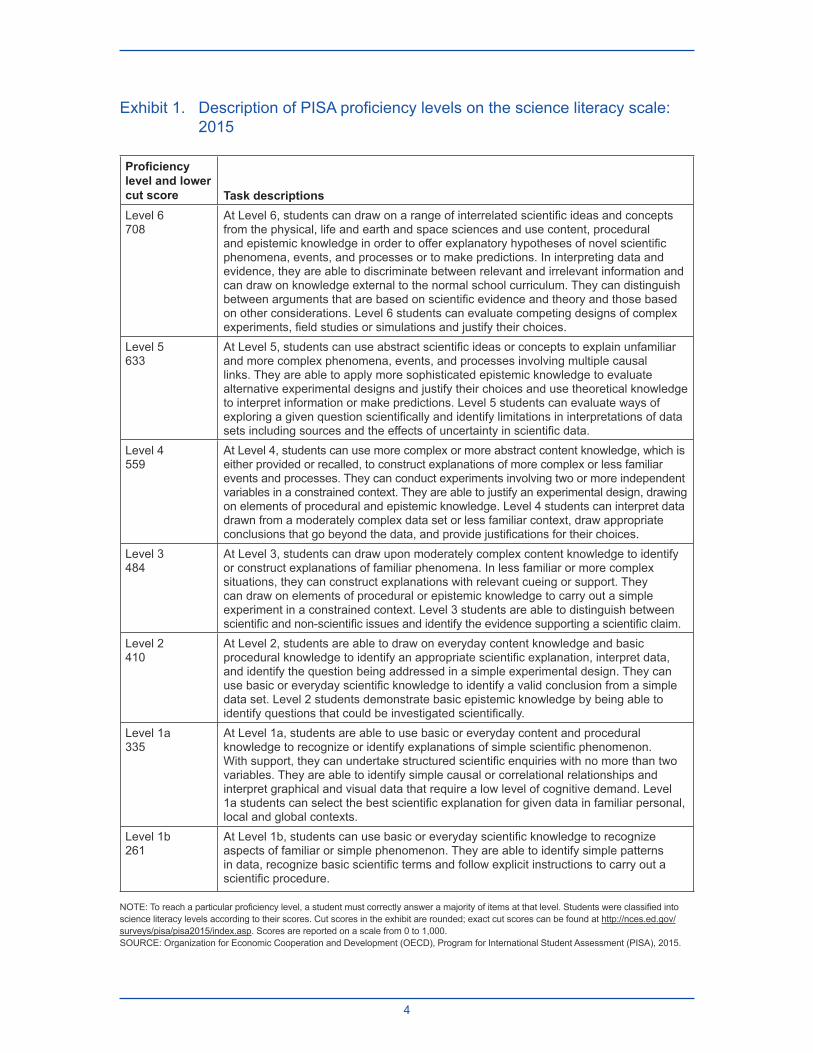
Science literacy is reported in terms of an overall scale score and seven subscale scores (all of which are on a scale of 0-1,000).2 For the overall science literacy scale, results are reported also in terms of the percentage of students performing at each of seven proficiency levels. Exhibit 1 describes the seven science literacy proficiency levels and the cut scores associated with each proficiency level.
2 Science literacy subscale score results by content and process categories can be found online at http://nces.ed.gov/surveys/pisa/pisa2015/index.asp.
4
Exhibit 1. Description of PISA proficiency levels on the science literacy scale: 2015
Proficiency level and lower cut score Task descriptionsLevel 6708
At Level 6, students can draw on a range of interrelated scientific ideas and concepts from the physical, life and earth and space sciences and use content, procedural and epistemic knowledge in order to offer explanatory hypotheses of novel scientific phenomena, events, and processes or to make predictions. In interpreting data and evidence, they are able to discriminate between relevant and irrelevant information and can draw on knowledge external to the normal school curriculum. They can distinguish between arguments that are based on scientific evidence and theory and those based on other considerations. Level 6 students can evaluate competing designs of complex experiments, field studies or simulations and justify their choices.
Level 5633
At Level 5, students can use abstract scientific ideas or concepts to explain unfamiliar and more complex phenomena, events, and processes involving multiple causal links. They are able to apply more sophisticated epistemic knowledge to evaluate alternative experimental designs and justify their choices and use theoretical knowledge to interpret information or make predictions. Level 5 students can evaluate ways of exploring a given question scientifically and identify limitations in interpretations of data sets including sources and the effects of uncertainty in scientific data.
Level 4559
At Level 4, students can use more complex or more abstract content knowledge, which is either provided or recalled, to construct explanations of more complex or less familiar events and processes. They can conduct experiments involving two or more independent variables in a constrained context. They are able to justify an experimental design, drawing on elements of procedural and epistemic knowledge. Level 4 students can interpret data drawn from a moderately complex data set or less familiar context, draw appropriate conclusions that go beyond the data, and provide justifications for their choices.
Level 3484
At Level 3, students can draw upon moderately complex content knowledge to identify or construct explanations of familiar phenomena. In less familiar or more complex situations, they can construct explanations with relevant cueing or support. They can draw on elements of procedural or epistemic knowledge to carry out a simple experiment in a constrained context. Level 3 students are able to distinguish between scientific and non-scientific issues and identify the evidence supporting a scientific claim.
Level 2410
At Level 2, students are able to draw on everyday content knowledge and basic procedural knowledge to identify an appropriate scientific explanation, interpret data, and identify the question being addressed in a simple experimental design. They can use basic or everyday scientific knowledge to identify a valid conclusion from a simple data set. Level 2 students demonstrate basic epistemic knowledge by being able to identify questions that could be investigated scientifically.
Level 1a335
At Level 1a, students are able to use basic or everyday content and procedural knowledge to recognize or identify explanations of simple scientific phenomenon. With support, they can undertake structured scientific enquiries with no more than two variables. They are able to identify simple causal or correlational relationships and interpret graphical and visual data that require a low level of cognitive demand. Level 1a students can select the best scientific explanation for given data in familiar personal, local and global contexts.
Level 1b261
At Level 1b, students can use basic or everyday scientific knowledge to recognize aspects of familiar or simple phenomenon. They are able to identify simple patterns in data, recognize basic scientific terms and follow explicit instructions to carry out a scientific procedure.
NOTE: To reach a particular proficiency level, a student must correctly answer a majority of items at that level. Students were classified into science literacy levels according to their scores. Cut scores in the exhibit are rounded; exact cut scores can be found at http://nces.ed.gov/surveys/pisa/pisa2015/index.asp. Scores are reported on a scale from 0 to 1,000. SOURCE: Organization for Economic Cooperation and Development (OECD), Program for International Student Assessment (PISA), 2015.
5
Reading LiteracyIn PISA 2015, reading literacy is defined as
understanding, using, reflecting on and engaging with written texts, in order to achieve one’s goals, to develop one’s knowledge and potential, and to participate in society (OECD 2016b, p. 9).
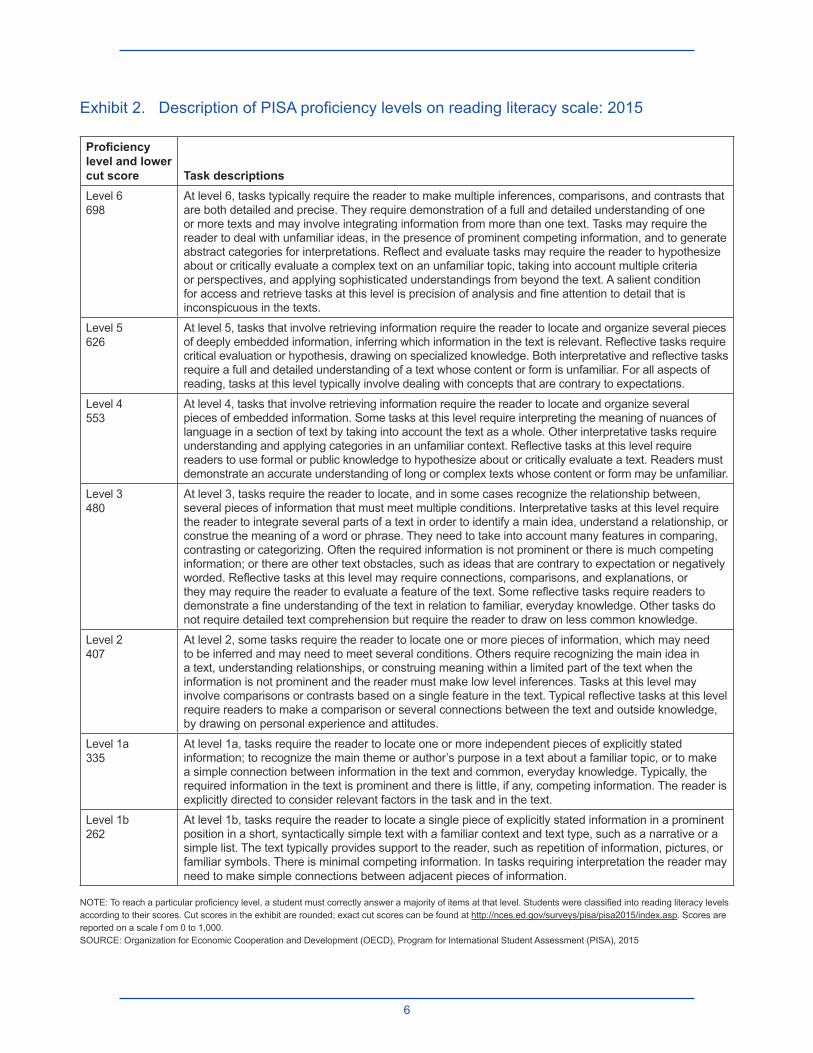
Reading literacy is also reported both in terms of proficiency levels and an overall scale score (on a scale of 0–1,000). Exhibit 2 describes the seven reading literacy proficiency levels and their respective cut scores. Since reading literacy was a minor domain in 2015, no subscale scores are reported.3
3 For readers interested in reading literacy subscale scores produced in previous cycles, please see the PISA 2009 results at http://nces.ed.gov/surveys/pisa/.
6
Exhibit 2. Description of PISA proficiency levels on reading literacy scale: 2015
Proficiency level and lower cut score Task descriptionsLevel 6698
At level 6, tasks typically require the reader to make multiple inferences, comparisons, and contrasts that are both detailed and precise. They require demonstration of a full and detailed understanding of one or more texts and may involve integrating information from more than one text. Tasks may require the reader to deal with unfamiliar ideas, in the presence of prominent competing information, and to generate abstract categories for interpretations. Reflect and evaluate tasks may require the reader to hypothesize about or critically evaluate a complex text on an unfamiliar topic, taking into account multiple criteria or perspectives, and applying sophisticated understandings from beyond the text. A salient condition for access and retrieve tasks at this level is precision of analysis and fine attention to detail that is inconspicuous in the texts.
Level 5626
At level 5, tasks that involve retrieving information require the reader to locate and organize several pieces of deeply embedded information, inferring which information in the text is relevant. Reflective tasks require critical evaluation or hypothesis, drawing on specialized knowledge. Both interpretative and reflective tasks require a full and detailed understanding of a text whose content or form is unfamiliar. For all aspects of reading, tasks at this level typically involve dealing with concepts that are contrary to expectations.
Level 4553
At level 4, tasks that involve retrieving information require the reader to locate and organize several pieces of embedded information. Some tasks at this level require interpreting the meaning of nuances of language in a section of text by taking into account the text as a whole. Other interpretative tasks require understanding and applying categories in an unfamiliar context. Reflective tasks at this level require readers to use formal or public knowledge to hypothesize about or critically evaluate a text. Readers must demonstrate an accurate understanding of long or complex texts whose content or form may be unfamiliar.
Level 3480
At level 3, tasks require the reader to locate, and in some cases recognize the relationship between, several pieces of information that must meet multiple conditions. Interpretative tasks at this level require the reader to integrate several parts of a text in order to identify a main idea, understand a relationship, or construe the meaning of a word or phrase. They need to take into account many features in comparing, contrasting or categorizing. Often the required information is not prominent or there is much competing information; or there are other text obstacles, such as ideas that are contrary to expectation or negatively worded. Reflective tasks at this level may require connections, comparisons, and explanations, or they may require the reader to evaluate a feature of the text. Some reflective tasks require readers to demonstrate a fine understanding of the text in relation to familiar, everyday knowledge. Other tasks do not require detailed text comprehension but require the reader to draw on less common knowledge.
Level 2407
At level 2, some tasks require the reader to locate one or more pieces of information, which may need to be inferred and may need to meet several conditions. Others require recognizing the main idea in a text, understanding relationships, or construing meaning within a limited part of the text when the information is not prominent and the reader must make low level inferences. Tasks at this level may involve comparisons or contrasts based on a single feature in the text. Typical reflective tasks at this level require readers to make a comparison or several connections between the text and outside knowledge, by drawing on personal experience and attitudes.
Level 1a335
At level 1a, tasks require the reader to locate one or more independent pieces of explicitly stated information; to recognize the main theme or author’s purpose in a text about a familiar topic, or to make a simple connection between information in the text and common, everyday knowledge. Typically, the required information in the text is prominent and there is little, if any, competing information. The reader is explicitly directed to consider relevant factors in the task and in the text.
Level 1b262
At level 1b, tasks require the reader to locate a single piece of explicitly stated information in a prominent position in a short, syntactically simple text with a familiar context and text type, such as a narrative or a simple list. The text typically provides support to the reader, such as repetition of information, pictures, or familiar symbols. There is minimal competing information. In tasks requiring interpretation the reader may need to make simple connections between adjacent pieces of information.
NOTE: To reach a particular proficiency level, a student must correctly answer a majority of items at that level. Students were classified into reading literacy levels according to their scores. Cut scores in the exhibit are rounded; exact cut scores can be found at http://nces.ed.gov/surveys/pisa/pisa2015/index.asp. Scores are reported on a scale f om 0 to 1,000.SOURCE: Organization for Economic Cooperation and Development (OECD), Program for International Student Assessment (PISA), 2015
7
Mathematics LiteracyIn PISA 2015 mathematics literacy is defined as
an individual’s capacity to formulate, employ, and interpret mathematics in a variety of contexts. It includes reasoning mathematically and using mathematical concepts, procedures, facts and tools to describe, explain and predict phenomena. It assists individuals to recognize the role that mathematics plays in the world and to make the well-founded judgments and decisions needed by constructive, engaged and reflective citizens (OECD 2016c, p. 5).
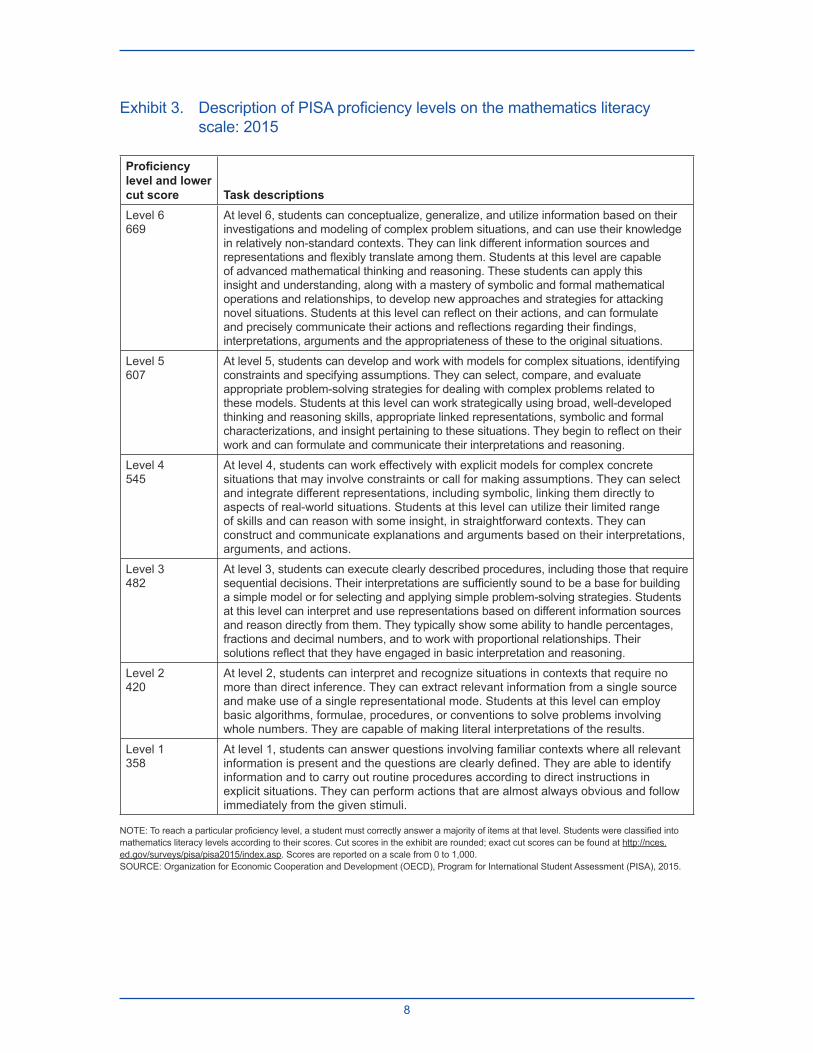
As with other subject areas, mathematics literacy is reported both in terms of proficiency levels and an overall scale score (on a scale of 0–1,000). Exhibit 3 describes the six mathematics literacy proficiency levels and their respective cut scores. Since mathematics literacy was a minor subject in 2015, no subscale scores are reported.4
4 For readers interested in mathematics literacy subscale scores produced in previous cycles, please see the PISA 2012 results at http://nces.ed.gov/surveys/pisa/pisa2012/index.asp.
8
Exhibit 3. Description of PISA proficiency levels on the mathematics literacy scale: 2015
Proficiency level and lower cut score Task descriptionsLevel 6669
At level 6, students can conceptualize, generalize, and utilize information based on their investigations and modeling of complex problem situations, and can use their knowledge in relatively non-standard contexts. They can link different information sources and representations and flexibly translate among them. Students at this level are capable of advanced mathematical thinking and reasoning. These students can apply this insight and understanding, along with a mastery of symbolic and formal mathematical operations and relationships, to develop new approaches and strategies for attacking novel situations. Students at this level can reflect on their actions, and can formulate and precisely communicate their actions and reflections regarding their findings, interpretations, arguments and the appropriateness of these to the original situations.
Level 5607
At level 5, students can develop and work with models for complex situations, identifying constraints and specifying assumptions. They can select, compare, and evaluate appropriate problem-solving strategies for dealing with complex problems related to these models. Students at this level can work strategically using broad, well-developed thinking and reasoning skills, appropriate linked representations, symbolic and formal characterizations, and insight pertaining to these situations. They begin to reflect on their work and can formulate and communicate their interpretations and reasoning.
Level 4545
At level 4, students can work effectively with explicit models for complex concrete situations that may involve constraints or call for making assumptions. They can select and integrate different representations, including symbolic, linking them directly to aspects of real-world situations. Students at this level can utilize their limited range of skills and can reason with some insight, in straightforward contexts. They can construct and communicate explanations and arguments based on their interpretations, arguments, and actions.
Level 3482
At level 3, students can execute clearly described procedures, including those that require sequential decisions. Their interpretations are sufficiently sound to be a base for building a simple model or for selecting and applying simple problem-solving strategies. Students at this level can interpret and use representations based on different information sources and reason directly from them. They typically show some ability to handle percentages, fractions and decimal numbers, and to work with proportional relationships. Their solutions reflect that they have engaged in basic interpretation and reasoning.
Level 2420
At level 2, students can interpret and recognize situations in contexts that require no more than direct inference. They can extract relevant information from a single source and make use of a single representational mode. Students at this level can employ basic algorithms, formulae, procedures, or conventions to solve problems involving whole numbers. They are capable of making literal interpretations of the results.
Level 1358
At level 1, students can answer questions involving familiar contexts where all relevant information is present and the questions are clearly defined. They are able to identify information and to carry out routine procedures according to direct instructions in explicit situations. They can perform actions that are almost always obvious and follow immediately from the given stimuli.
NOTE: To reach a particular proficiency level, a student must correctly answer a majority of items at that level. Students were classified into mathematics literacy levels according to their scores. Cut scores in the exhibit are rounded; exact cut scores can be found at http://nces.ed.gov/surveys/pisa/pisa2015/index.asp. Scores are reported on a scale from 0 to 1,000.SOURCE: Organization for Economic Cooperation and Development (OECD), Program for International Student Assessment (PISA), 2015.
9
Computer-Based AssessmentIn 2012, PISA began offering parts of the assessment through a computer-based system. For those countries, like the United States, that wanted to start the transition to a computer-based assessment, the 2012 assessment cycle included both paper-based and computer-based components. All sampled students took the paper-and-pencil based version of the reading, mathematics, and science literacy assessment. In addition, some countries (including the United States), chose to administer separate optional computer-based reading and mathematics literacy assessments to a subsample of students. For the 2015 cycle, all parts of the PISA assessment moved to a completely computer-based assessment platform (although some participating education systems chose to administer PISA in the traditional paper-and-pencil format).
The 2015 field trial included a mode effect study to determine whether or not the paper-based assessment and the fully computer-based assessment were psychometrically comparable and could be reported on the same scale. To do this, the mode effect study pooled data from all the participating education systems to examine whether differences in the delivery mode could be detected in the student outcomes. The study found few systematic differences between computer-based and paper-based student achievement at the international level. Although some differences between the computer-based and paper-based results were found among students who used computers infrequently or not at all, this group accounted for about 10 percent of students across countries. Overall, the mode effect portion of the field trial study found that paper-based items were comparable to their computer-based counterparts and the level of difficulty of items varied little between paper-based and computer-based modes (OECD 2016d; see also OECD forthcoming). This finding provided reasonable assurance that scores from prior cycles could be compared with those from the 2015 cycle without the need for any adjustments or recalculations, and that scores derived from the paper-based version of PISA and the computer-based version can be reported on the same scale.
For education systems that administered the computer-based assessment in the 2015 cycle, all parts of the study were computer-based, including the school, teacher, and student questionnaires. In 2015, some 57 out of 70 education systems, including the United States, chose to administer the computer-based assessment.5 Although Massachusetts and North Carolina also administered the computer-based assessment, Puerto Rico opted to administer the paper-based assessment.
5 A list of education systems that administered PISA 2015 on computer and on paper is available in the OECD’s PISA 2015 International Report: Volume 1 (OECD 2016d).
10
Reporting PISA 2015 ResultsThis report presents performance on PISA 2015 in science, reading, and mathematics literacy from a U.S. perspective. Results are presented for the 70 education systems that participated in PISA 2015 as well as Massachusetts, North Carolina, and Puerto Rico. The U.S. national results include both public and private schools. Massachusetts and North Carolina chose to sample public schools only. Puerto Rico sampled both public and private schools. To maintain the trend with previous administrations, PISA U.S. national results do not include Puerto Rico.
In this report, results for each participating education system are presented in terms of average scale scores, percentile scores, and the percentage of 15-year-old students reaching selected proficiency levels, comparing the United States with other participating education systems. For percentile scores, the threshold (or cut) scores for the 10th percentile of the distribution of student performance (i.e., the bottom 10 percent of students) and the 90th percentile (i.e., the top 10 percent of students) are shown, providing a view of student performance that goes beyond the average score. The percentile ranges are specific to each education system’s distribution of scores, enabling users to compare cut scores across education systems. For proficiency levels, results are reported in terms of the percentage reaching levels 5 and above and the percentage below level 2. Higher proficiency levels represent the knowledge, skills, and capabilities needed to perform tasks of greater complexity. At levels 5 and 6, students demonstrate higher-level skills and may be referred to as “top performers” in the subject (see exhibits 1–3 for descriptions of the PISA proficiency levels). Conversely, students performing below level 2 are below what the OECD calls “a baseline level of proficiency that all young adults should be expected to attain in order to take advantage of further learning opportunities and participate fully in the social, economic and civic life of modern societies in a globalized world” (OECD 2016d, p. 16).6 This report also presents U.S. trends over time in science, reading, and mathematics literacy. Results for the collaborative problem solving and financial literacy assessments will be released in 2017.
In reporting PISA results, the OECD differentiates between OECD member countries, of which there are 35, and all other participating education systems, some of which are countries and some of which are subnational entities (i.e., cities, states, provinces, and territories). In the OECD’s PISA reports, OECD member countries and other participating education systems are reported in the tables and figures in the main body of the report, along with the average for the OECD countries (the average of the 35 OECD member country averages with each country weighted equally) and are discussed in the accompanying text. Also, for some participating education systems, results for subnational entities—including, in 2015, Massachusetts, North Carolina, and Puerto Rico—are reported in appendices of the OECD PISA reports, but are not discussed in the report text.
6 The data in this report focus on the highest- and lowest-level skills and knowledge along the science, reading, and mathematics literacy proficiency scales. For a full description of the percentage of students at every proficiency level, please see the data tables and figures at http://nces.ed.gov/surveys/pisa/pisa2015/index.asp.
11
To facilitate readers moving between the OECD and U.S. national PISA reports, this report’s tables and figures follow the OECD convention of placing OECD member countries and all other participating education systems in the main part of the tables and figures. These are all referred to as education systems in this report, of which there are 70 total. Massachusetts, North Carolina, and Puerto Rico are presented in a separate part of the tables and figures; results for these three education systems are discussed in the text but are not included in counts of education systems performing above, below, or not measurably different from the United States.
This report is merely a first look at the PISA 2015 results and is by no means comprehensive. For in-depth results using PISA 2015 data, please see http://nces.ed.gov/surveys/pisa/pisa2015/index.asp, which includes additional findings from the science, reading, and mathematics literacy assessments, science subscales, proficiency levels, percentile cut-scores, trends in performance, performance by students’ gender, race and ethnicity, and socioeconomic status, as well as more detailed results for Massachusetts, North Carolina, and Puerto Rico. Detailed notes on technical aspects of PISA 2015, including sample design, test design, and scoring, with an emphasis on the U.S. implementation, can be found on the NCES website at http://nces.ed.gov/surveys/pisa/pisa2015/index.asp. In addition, PISA results are available through the PISA International Data Explorer (IDE) at https://nces.ed.gov/surveys/pisa/idepisa/. The PISA IDE provides anyone with an internet connection the opportunity to create statistical tables and charts and conduct regression analyses. These analyses can be performed on student performance as well as contextual data, including student demographics, instructional experiences, and school characteristics, across all participating education systems.
All statistically significant differences described in this report were tested at the .05 level of statistical significance. Differences that are statistically significant are discussed using comparative terms such as “higher” and “lower.” Differences that are not statistically significant are either not discussed or referred to as “not measurably different.” In almost all instances, the tests for significance used were standard t tests (see the technical notes at http://nces.ed.gov/surveys/pisa/pisa2015/index.asp for additional details on interpreting statistical significance). No adjustments were made for multiple comparisons.

This page intentionally left blank
13
Selected Findings
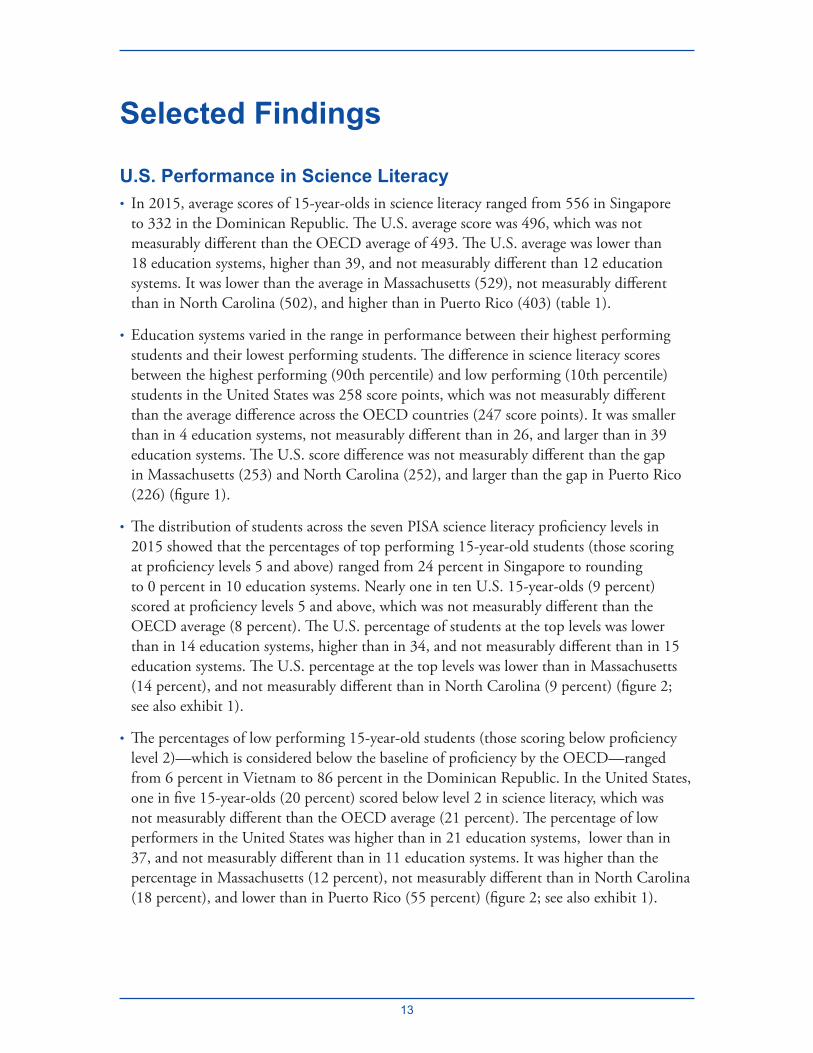
U.S. Performance in Science Literacy• In 2015, average scores of 15-year-olds in science literacy ranged from 556 in Singapore
to 332 in the Dominican Republic. The U.S. average score was 496, which was not measurably different than the OECD average of 493. The U.S. average was lower than 18 education systems, higher than 39, and not measurably different than 12 education systems. It was lower than the average in Massachusetts (529), not measurably different than in North Carolina (502), and higher than in Puerto Rico (403) (table 1).
• Education systems varied in the range in performance between their highest performing students and their lowest performing students. The difference in science literacy scores between the highest performing (90th percentile) and low performing (10th percentile) students in the United States was 258 score points, which was not measurably different than the average difference across the OECD countries (247 score points). It was smaller than in 4 education systems, not measurably different than in 26, and larger than in 39 education systems. The U.S. score difference was not measurably different than the gap in Massachusetts (253) and North Carolina (252), and larger than the gap in Puerto Rico (226) (figure 1).
• The distribution of students across the seven PISA science literacy proficiency levels in 2015 showed that the percentages of top performing 15-year-old students (those scoring at proficiency levels 5 and above) ranged from 24 percent in Singapore to rounding to 0 percent in 10 education systems. Nearly one in ten U.S. 15-year-olds (9 percent) scored at proficiency levels 5 and above, which was not measurably different than the OECD average (8 percent). The U.S. percentage of students at the top levels was lower than in 14 education systems, higher than in 34, and not measurably different than in 15 education systems. The U.S. percentage at the top levels was lower than in Massachusetts (14 percent), and not measurably different than in North Carolina (9 percent) (figure 2; see also exhibit 1).
• The percentages of low performing 15-year-old students (those scoring below proficiency level 2)—which is considered below the baseline of proficiency by the OECD—ranged from 6 percent in Vietnam to 86 percent in the Dominican Republic. In the United States, one in five 15-year-olds (20 percent) scored below level 2 in science literacy, which was not measurably different than the OECD average (21 percent). The percentage of low performers in the United States was higher than in 21 education systems, lower than in 37, and not measurably different than in 11 education systems. It was higher than the percentage in Massachusetts (12 percent), not measurably different than in North Carolina (18 percent), and lower than in Puerto Rico (55 percent) (figure 2; see also exhibit 1).
14
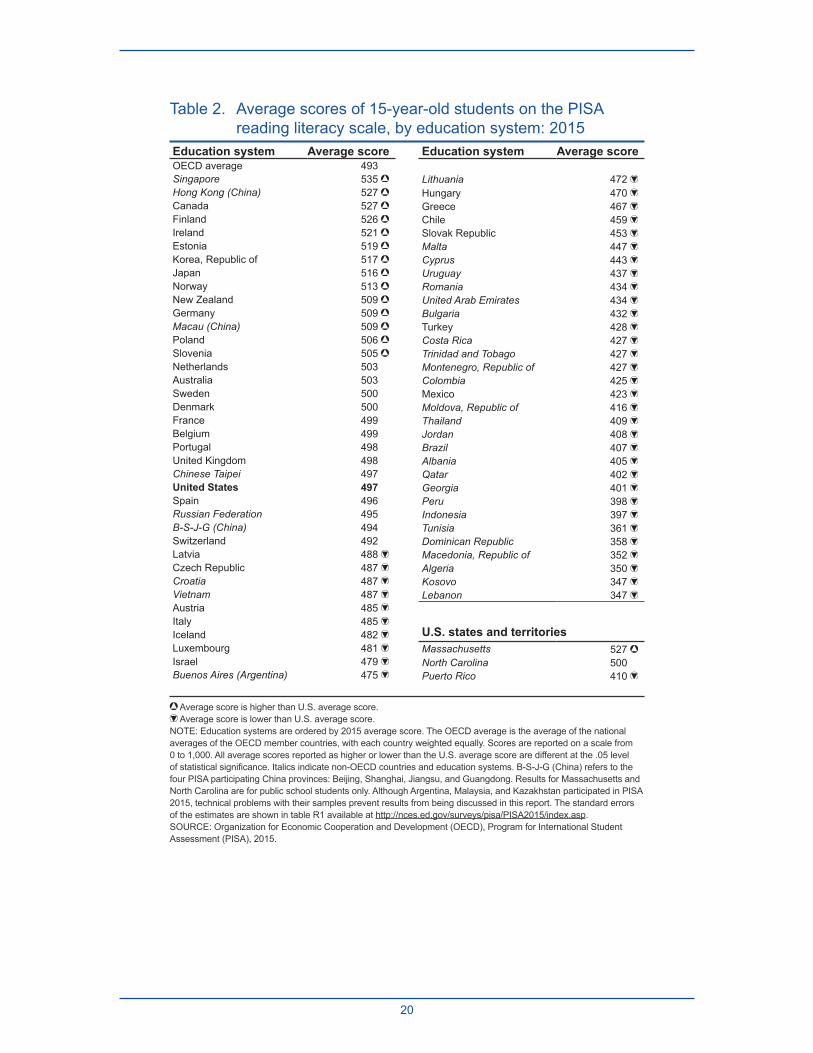
U.S. Performance in Reading Literacy• In 2015, the average scores of U.S. 15-year-olds in reading literacy was 497, and ranged
among the other education systems from 535 in Singapore to 347 in Lebanon. The U.S. average was lower than the averages in 14 education systems, higher than in 42, and not measurably different than in 13 education systems and the OECD average. The overall U.S. average was lower than the average in Massachusetts (527), not measurably different than in North Carolina (500), and higher than in Puerto Rico (410) (table 2).
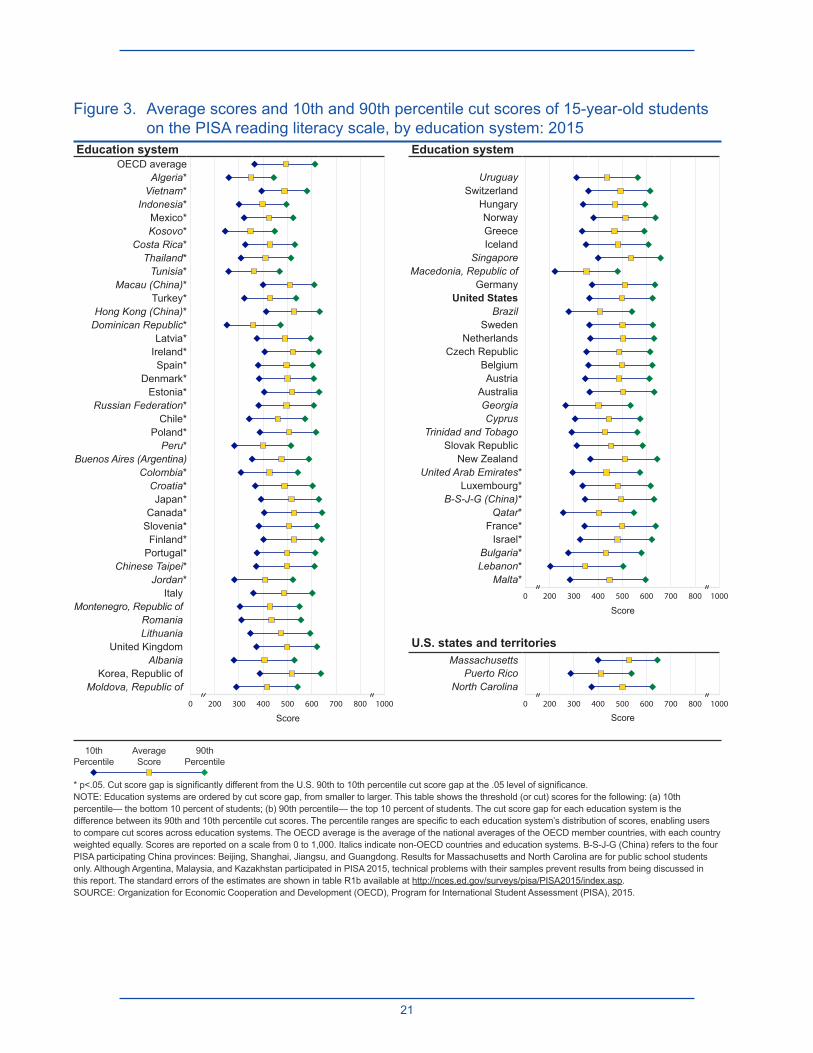
• The distribution of student scores in reading literacy showed that the U.S. score difference between the 90th and 10th percentiles (259 points) was larger than the difference in 30 education systems, not measurably different than in 30 other systems, and smaller than in 9. The U.S. difference between the 90th and 10th percentiles was not measurably different than in Massachusetts (243), North Carolina (251), and Puerto Rico (250) (figure 3).
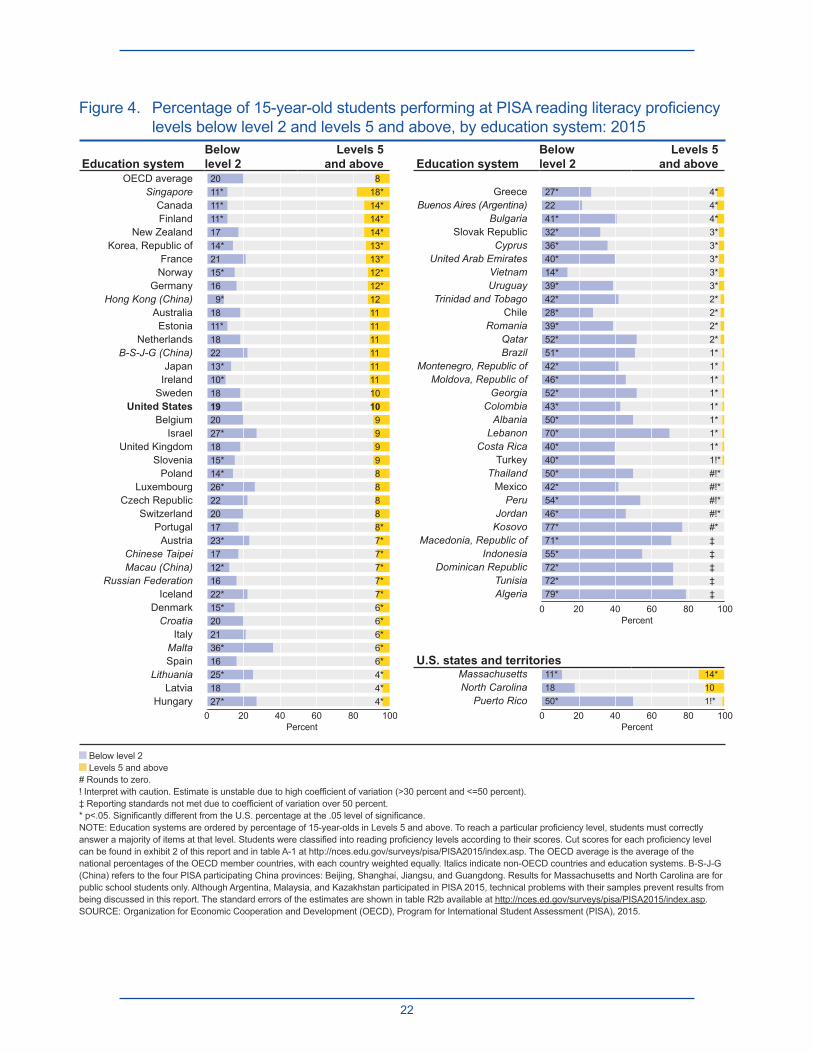
• In reading literacy, the percentage of top performing students (those scoring at proficiency levels 5 and above) ranged from 18 percent in Singapore to rounding to 0 percent in 5 education systems. One in ten U.S. 15-year-olds (10 percent) scored at proficiency levels 5 and above in reading literacy in 2015. The percentage of U.S. top performers was higher than in more than half of the other educations systems (40 of 69), not measurably different than in 16 systems and the OECD average, and lower than in 8 systems. The percentage of top performers in the United States overall was lower than the percentage in Massachusetts (14 percent), not measurably different than in North Carolina (10 percent), and higher than in Puerto Rico (1 percent) (figure 4; see also exhibit 2).
• The percentages of low performing 15-year-old students (those scoring below proficiency level 2) ranged from 9 percent in Hong Kong (China) to 79 percent in Algeria. Nearly one in five U.S. 15-year-olds (19 percent) scored below level 2, which was not measurably different than the OECD average (20 percent). This percentage was higher than in 14 education systems, lower than in 36, and not measurably different than in 19 education systems. The percentage of low performers in in the United States overall was higher than the percentage in Massachusetts (11 percent), not measurably different than North Carolina (18 percent) and lower than in Puerto Rico (50 percent) (figure 4; see also exhibit 2).
U.S. Performance in Mathematics Literacy• Average mathematics literacy scores in 2015 ranged from 564 in Singapore to 328 in the
Dominican Republic, with the U.S. average score at 470. The U.S. average was lower than in more than half of the other education systems (36 of 69) as well as the OECD average, higher than in 28 education systems, and not measurably different than in 5. It was lower than the average in Massachusetts (500), not measurably different than in North Carolina (471), and higher than in Puerto Rico (378) (table 3).
15
• The difference in mathematics literacy scores between students at the 90th percentile of performance and those at the 10th percentile in the United States was 230 points, which was larger than the difference in 15 education systems, smaller than in 20, and not measurably different than in 34 education systems. The U.S. difference was not measurably different than the difference between the highest and lowest performers in Massachusetts (218) and North Carolina (225) and was larger than in Puerto Rico (197) (figure 5).
• In 2015, the percentage of top performing students in mathematics literacy (those scoring at levels 5 and above) ranged from 35 percent in Singapore to rounding to 0 percent in five education systems. Six percent of U.S. 15-year-olds scored at proficiency levels 5 and above, which was lower than the percentages in 36 educations and the OECD average, higher than in 24 education systems, and not measurably different than in 6 systems. The overall U.S. percentage of top performers was lower than the percentage in Massachusetts (10 percent) and was not measurably different than in North Carolina (6 percent) (figure 6; see also exhibit 3).
• The percentage of low performing students in PISA mathematics literacy (below proficiency level 2) ranged from 7 percent in Macau (China) to 91 percent in the Dominican Republic. In the United States, nearly three out of ten of 15-year-old students (29 percent) scored below proficiency level 2, which was higher than the OECD average of 23 percent. The percentage of U.S. low performers was higher than in more than half of the other education systems (35 of 69), lower than in 28 education systems, and not measurably different than in 6 systems. The percentage of low performers in mathematics literacy in the United States overall was larger than in Massachusetts (17 percent), was not measurably different than in North Carolina (29 percent), and smaller than in Puerto Rico (73 percent) (figure 6; see also exhibit 3).
Looking across student performance in science, reading, and mathematics literacy, 15-year-olds in 11 education systems demonstrated higher average scores in all three subjects than students in the United States: Canada, Estonia, Finland, Germany, Hong Kong (China), Japan, Macau (China), New Zealand, Republic of Korea, Singapore, and Slovenia. In addition, 15-year-olds in Massachusetts had higher average scores in all three subjects than 15-year-olds in the United States overall (tables 1, 2, and 3).
U.S. Performance Over Time• The U.S. average scores in science and reading literacy in 2015 were not measurably
different than the average scores observed in previous PISA assessment years with which comparisons can be made (2006, 2009, and 2012 for science literacy; 2000, 2003, 2009, and 2012 for reading literacy). The U.S. average score in mathematics literacy in 2015 was 12 score points lower than the average score in 2012 and 18 score points lower than the average in 2009, but was not measurably different than the average mathematics literacy scores in 2003 and 2006 (table 4).

This page intentionally left blank
17
Figures and Tables
Table 1. Average scores of 15-year-old students on the PISA science literacy scale, by education system: 2015
Education system Average scoreOECD average 493Singapore 556 Japan 538 Estonia 534 Chinese Taipei 532 Finland 531 Macau (China) 529 Canada 528 Vietnam 525 Hong Kong (China) 523 B-S-J-G (China) 518 Korea, Republic of 516 New Zealand 513 Slovenia 513 Australia 510 United Kingdom 509 Germany 509 Netherlands 509 Switzerland 506 Ireland 503Belgium 502Denmark 502Poland 501Portugal 501Norway 498United States 496Austria 495France 495Sweden 493Czech Republic 493Spain 493Latvia 490Russian Federation 487 Luxembourg 483 Italy 481 Hungary 477 Lithuania 475 Croatia 475 Buenos Aires (Argentina) 475
Education system Average score
Iceland 473 Israel 467 Malta 465 Slovak Republic 461 Greece 455 Chile 447 Bulgaria 446 United Arab Emirates 437 Uruguay 435 Romania 435 Cyprus 433 Moldova, Republic of 428 Albania 427 Turkey 425 Trinidad and Tobago 425 Thailand 421 Costa Rica 420 Qatar 418 Colombia 416 Mexico 416 Montenegro, Republic of 411 Georgia 411 Jordan 409 Indonesia 403 Brazil 401 Peru 397 Lebanon 386 Tunisia 386 Macedonia, Republic of 384 Kosovo 378 Algeria 376 Dominican Republic 332
U.S. states and territoriesMassachusetts 529 North Carolina 502 Puerto Rico 403
Average score is higher than U.S. average score. Average score is lower than U.S. average score.
NOTE: Education systems are ordered by 2015 average score. The OECD average is the average of the national averages of the OECD member countries, with each country weighted equally. Scores are reported on a scale from 0 to 1,000. All average scores reported as higher or lower than the U.S. average score are different at the .05 level of statistical significance. Italics indicate non-OECD countries and education systems. B-S-J-G (China) refers to the four PISA participating China provinces: Beijing, Shanghai, Jiangsu, and Guangdong. Results for Massachusetts and North Carolina are for public school students only. Although Argentina, Malaysia, and Kazakhstan participated in PISA 2015, technical problems with their samples prevent results from being discussed in this report. The standard errors of the estimates are shown in table S1 available at http://nces.ed.gov/surveys/pisa/PISA2015/index.asp.SOURCE: Organization for Economic Cooperation and Development (OECD), Program for International Student Assessment (PISA), 2015.
18
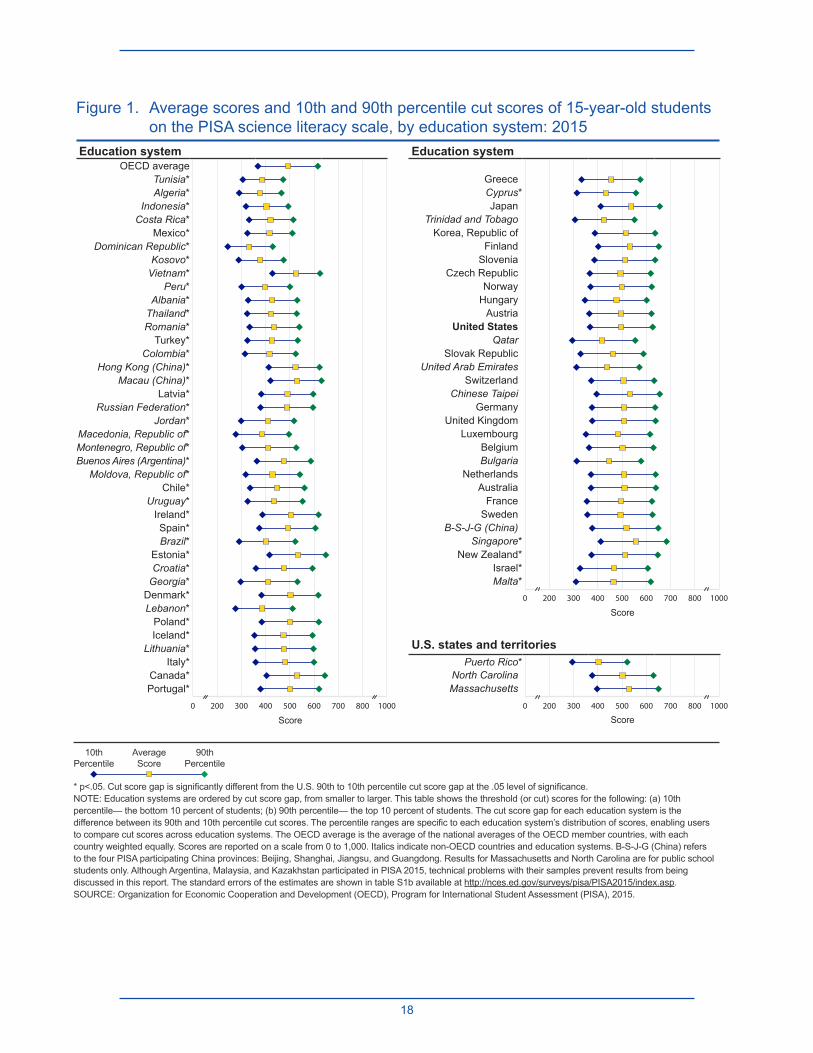
Figure 1. Average scores and 10th and 90th percentile cut scores of 15-year-old students on the PISA science literacy scale, by education system: 2015
Education system 10th percentile Mean 90th percentile
OECD average 368 493 615
Tunisia* 306 386 472
Algeria* 291 376 465
Indonesia* 319 403 493
Costa Rica* 332 420 514
Mexico* 325 416 510
Dominican Republic* 244 332 429
Kosovo* 289 378 474
Vietnam* 428 525 624
Peru* 301 397 500
Albania* 328 427 530
Thailand* 324 421 528
Romania* 334 435 539
Turkey* 325 425 532
Colombia* 315 416 524
Hong Kong (China)* 413 523 622
Macau (China)* 420 529 630
Latvia* 382 490 596
Russian Federation* 379 487 595
Jordan* 299 409 517
Macedonia, Republic of* 277 384 496
Montenegro, Republic of* 304 411 526
Buenos Aires (Argentina)* 364 475 586
Moldova, Republic of* 318 428 541
Chile* 336 447 560
Uruguay* 326 435 552
Ireland* 387 503 618
Spain* 374 493 605
Brazil* 291 401 522
Estonia* 416 534 648
Croatia* 360 475 593
Georgia* 297 411 531
Denmark* 383 502 617
Lebanon* 276 386 511
Poland* 384 501 619
Iceland* 354 473 593
Lithuania* 357 475 597
Italy* 359 481 599
Canada* 404 528 644
Portugal* 379 501 620
Education system 10th percentile Mean 90th percentile
Greece 333 455 575
Cyprus* 314 433 557
Japan 412 538 655
Trinidad and Tobago 306 425 551
Korea, Republic of 388 516 636
Finland 402 531 651
Slovenia 386 513 636
Czech Republic 367 493 618
Norway 370 498 622
Hungary 347 477 601
Austria 365 495 621
United States 368 496 626
Qatar 295 418 554
Slovak Republic 329 461 588
United Arab Emirates 312 437 571
Switzerland 373 506 632
Chinese Taipei 395 532 655
Germany 376 509 636
United Kingdom 377 509 638
Luxembourg 351 483 615
Belgium 364 502 629
Bulgaria 313 446 578
Netherlands 372 509 638
Australia 372 510 639
France 355 495 623
Sweden 357 493 625
B-S-J-G (China) 377 518 649
Singapore* 412 556 683
New Zealand* 374 513 647
Israel* 327 467 606
Malta* 310 465 618
U.S. states and territoriesPuerto Rico* 295 403 521
North Carolina 377 502 629
Massachusetts 397 529 650
10thPercentile
AverageScore
90thPercentile
* p<.05. Cut score gap is significantly different from the U.S. 90th to 10th percentile cut score gap at the .05 level of significance.NOTE: Education systems are ordered by cut score gap, from smaller to larger. This table shows the threshold (or cut) scores for the following: (a) 10th percentile— the bottom 10 percent of students; (b) 90th percentile— the top 10 percent of students. The cut score gap for each education system is the difference between its 90th and 10th percentile cut scores. The percentile ranges are specific to each education system’s distribution of scores, enabling users to compare cut scores across education systems. The OECD average is the average of the national averages of the OECD member countries, with each country weighted equally. Scores are reported on a scale from 0 to 1,000. Italics indicate non-OECD countries and education systems. B-S-J-G (China) refers to the four PISA participating China provinces: Beijing, Shanghai, Jiangsu, and Guangdong. Results for Massachusetts and North Carolina are for public school students only. Although Argentina, Malaysia, and Kazakhstan participated in PISA 2015, technical problems with their samples prevent results from being discussed in this report. The standard errors of the estimates are shown in table S1b available at http://nces.ed.gov/surveys/pisa/PISA2015/index.asp.SOURCE: Organization for Economic Cooperation and Development (OECD), Program for International Student Assessment (PISA), 2015.
2000 300 400 500 600 700 800 1000
2000 300 400 500 600 700 800 1000
2000 300 400 500 600 700 800 1000
Score
Score
Score

19
Percent0 20 40 60 80 100
Percent0 20 40 60 80 100
Percent0 20 40 60 80 100
Figure 2. Percentage of 15-year-old students performing at PISA science literacy proficiency levels below level 2 and levels 5 and above, by education system: 2015
Education systemBelow level 2
Levels 5 and above
OECD average 21 8Singapore 10* 24*
Chinese Taipei 12* 15*Japan 10* 15*
Finland 11* 14*B-S-J-G (China) 16* 14*
Estonia 9* 14*New Zealand 17* 13*
Canada 11* 12*Australia 18* 11*
Netherlands 19 11*United Kingdom 17* 11*
Korea, Republic of 14* 11*Slovenia 15* 11*Germany 17* 11*
Switzerland 18 10Macau (China) 8* 9
Belgium 20 9United States 20 9
Sweden 22 9Vietnam 6* 8France 22 8Norway 19 8Austria 21 8
Malta 33* 8Portugal 17* 7
Hong Kong (China) 9* 7Poland 16* 7
Czech Republic 21 7Ireland 15* 7
Denmark 16* 7Luxembourg 26* 7*
Israel 31* 6*Spain 18 5*
Hungary 26* 5*Lithuania 25* 4*
Italy 23* 4*Croatia 25* 4*Latvia 17* 4*
Iceland 25* 4*
Education systemBelow level 2
Levels 5 and above
Russian Federation 18 4*Slovak Republic 31* 4*
Bulgaria 38* 3*United Arab Emirates 42* 3*
Buenos Aires (Argentina) 23 3*Greece 33* 2*
Qatar 50* 2*Cyprus 42* 2*
Trinidad and Tobago 46* 1*Uruguay 41* 1*
Chile 35* 1*Georgia 51* 1*
Moldova, Republic of 42* 1*Romania 39* 1*
Brazil 57* 1*Montenegro, Republic of 51* #*
Thailand 47* #!*Lebanon 63* #!*
Albania 42* #!*Colombia 49* #*
Turkey 44* #!*Macedonia, Republic of 63* #!*
Jordan 50* #!*Peru 58* #!*
Mexico 48* #!*Costa Rica 46* ‡Indonesia 56* ‡
Tunisia 66* ‡Algeria 71* ‡
Dominican Republic 86* ‡Kosovo 68* ‡
U.S. states and territoriesMassachusetts 12* 14*North Carolina 18 9
Puerto Rico 55* ‡
Below level 2 Levels 5 and above
# Rounds to zero.! Interpret with caution. Estimate is unstable due to high coefficient of variation (>30 percent and <=50 percent).‡ Reporting standards not met due to coefficient of variation over 50 percent.* p<.05. Significantly different from the U.S. percentage at the .05 level of significance.NOTE: Education systems are ordered by percentage of 15-year-olds in Levels 5 and above. To reach a particular proficiency level, students must correctly answer a majority of items at that level. Students were classified into science proficiency levels according to their scores. Cut scores for each proficiency level can be found in exhibit 1 of this report and in table A-1 available at http://nces.ed.gov/surveys/pisa/PISA2015/index.asp. The OECD average is the average of the national percentages of the OECD member countries, with each country weighted equally. Italics indicate non-OECD countries and education systems. B-S-J-G (China) refers to the four PISA participating China provinces: Beijing, Shanghai, Jiangsu, and Guangdong. Results for Massachusetts and North Carolina are for public school students only. Although Argentina, Malaysia, and Kazakhstan participated in PISA 2015, technical problems with their samples prevent results from being discussed in this report. The standard errors of the estimates are shown in table S2b available at http://nces.ed.gov/surveys/pisa/PISA2015/index.asp.SOURCE: Organization for Economic Cooperation and Development (OECD), Program for International Student Assessment (PISA), 2015.
20
Table 2. Average scores of 15-year-old students on the PISA reading literacy scale, by education system: 2015
Education system Average scoreOECD average 493Singapore 535 Hong Kong (China) 527 Canada 527 Finland 526 Ireland 521 Estonia 519 Korea, Republic of 517 Japan 516 Norway 513 New Zealand 509 Germany 509 Macau (China) 509 Poland 506 Slovenia 505 Netherlands 503Australia 503Sweden 500Denmark 500France 499Belgium 499Portugal 498United Kingdom 498Chinese Taipei 497United States 497Spain 496Russian Federation 495B-S-J-G (China) 494Switzerland 492Latvia 488 Czech Republic 487 Croatia 487 Vietnam 487 Austria 485 Italy 485 Iceland 482 Luxembourg 481 Israel 479 Buenos Aires (Argentina) 475
Education system Average score
Lithuania 472 Hungary 470 Greece 467 Chile 459 Slovak Republic 453 Malta 447 Cyprus 443 Uruguay 437 Romania 434 United Arab Emirates 434 Bulgaria 432 Turkey 428 Costa Rica 427 Trinidad and Tobago 427 Montenegro, Republic of 427 Colombia 425 Mexico 423 Moldova, Republic of 416 Thailand 409 Jordan 408 Brazil 407 Albania 405 Qatar 402 Georgia 401 Peru 398 Indonesia 397 Tunisia 361 Dominican Republic 358 Macedonia, Republic of 352 Algeria 350 Kosovo 347 Lebanon 347
U.S. states and territoriesMassachusetts 527 North Carolina 500Puerto Rico 410
Average score is higher than U.S. average score. Average score is lower than U.S. average score.
NOTE: Education systems are ordered by 2015 average score. The OECD average is the average of the national averages of the OECD member countries, with each country weighted equally. Scores are reported on a scale from 0 to 1,000. All average scores reported as higher or lower than the U.S. average score are different at the .05 level of statistical significance. Italics indicate non-OECD countries and education systems. B-S-J-G (China) refers to the four PISA participating China provinces: Beijing, Shanghai, Jiangsu, and Guangdong. Results for Massachusetts and North Carolina are for public school students only. Although Argentina, Malaysia, and Kazakhstan participated in PISA 2015, technical problems with their samples prevent results from being discussed in this report. The standard errors of the estimates are shown in table R1 available at http://nces.ed.gov/surveys/pisa/PISA2015/index.asp.SOURCE: Organization for Economic Cooperation and Development (OECD), Program for International Student Assessment (PISA), 2015.
21
Figure 3. Average scores and 10th and 90th percentile cut scores of 15-year-old students on the PISA reading literacy scale, by education system: 2015
Education system 10th percentile Mean 90th percentile
OECD average 364 493 613
Algeria* 258 350 443
Vietnam* 393 487 580
Indonesia* 300 397 49
Mexico* 321 423 523
Kosovo* 243 347 447
Costa Rica* 326 427 530
Thailand* 308 409 514
Tunisia* 257 361 467
Macau (China)* 399 509 610
Turkey* 322 428 535
Hong Kong (China)* 412 527 632
Dominican Republic* 250 358 471
Latvia* 374 488 595
Ireland* 406 521 629
Spain* 379 496 603
Denmark* 383 500 608
Estonia* 404 519 630
Russian Federation* 381 495 608
Chile* 342 459 572
Poland* 386 506 617
Peru* 281 398 514
Buenos Aires (Argentina) 354 475 588
Colombia* 308 425 542
Croatia* 367 487 603
Japan* 391 516 629
Canada* 404 527 642
Slovenia* 382 505 621
Finland* 401 526 640
Portugal* 374 498 614
Chinese Taipei* 371 497 611
Jordan* 281 408 522
Italy 359 485 602
Montenegro, Republic of 304 427 549
Romania 310 434 555
Lithuania 347 472 593
United Kingdom 372 498 621
Albania 279 405 528
Korea, Republic of 386 517 637
Moldova, Republic of 289 416 541
Education system 10th percentile Mean 90th percentile
Uruguay 311 437 563
Switzerland 360 492 614
Hungary 338 470 593
Norway 381 513 636
Greece 334 467 590
Iceland 350 482 607
Singapore 400 535 657
Macedonia, Republic of 222 352 480
Germany 375 509 634
United States 364 497 624
Brazil 279 407 539
Sweden 364 500 625
Netherlands 368 503 630
Czech Republic 352 487 614
Belgium 360 499 623
Austria 347 485 611
Australia 365 503 631
Georgia 266 401 533
Cyprus 305 443 573
Trinidad and Tobago 291 427 561
Slovak Republic 312 453 583
New Zealand 368 509 643
United Arab Emirates* 295 434 572
Luxembourg* 336 481 616
B-S-J-G (China)* 346 494 630
Qatar* 256 402 547
France* 344 499 637
Israel* 326 479 621
Bulgaria* 277 432 578
Lebanon* 203 347 503
Malta* 284 447 595
U.S. states and territoriesMassachusetts 400 527 644
Puerto Rico 287 410 537
North Carolina 373 500 624
10thPercentile
AverageScore
90thPercentile
* p<.05. Cut score gap is significantly different from the U.S. 90th to 10th percentile cut score gap at the .05 level of significance.NOTE: Education systems are ordered by cut score gap, from smaller to larger. This table shows the threshold (or cut) scores for the following: (a) 10th percentile— the bottom 10 percent of students; (b) 90th percentile— the top 10 percent of students. The cut score gap for each education system is the difference between its 90th and 10th percentile cut scores. The percentile ranges are specific to each education system’s distribution of scores, enabling users to compare cut scores across education systems. The OECD average is the average of the national averages of the OECD member countries, with each country weighted equally. Scores are reported on a scale from 0 to 1,000. Italics indicate non-OECD countries and education systems. B-S-J-G (China) refers to the four PISA participating China provinces: Beijing, Shanghai, Jiangsu, and Guangdong. Results for Massachusetts and North Carolina are for public school students only. Although Argentina, Malaysia, and Kazakhstan participated in PISA 2015, technical problems with their samples prevent results from being discussed in this report. The standard errors of the estimates are shown in table R1b available at http://nces.ed.gov/surveys/pisa/PISA2015/index.asp.SOURCE: Organization for Economic Cooperation and Development (OECD), Program for International Student Assessment (PISA), 2015.
2000 300 400 500 600 700 800 1000
2000 300 400 500 600 700 800 1000
2000 300 400 500 600 700 800 1000
Score
Score
Score
22
Figure 4. Percentage of 15-year-old students performing at PISA reading literacy proficiency levels below level 2 and levels 5 and above, by education system: 2015
Percent0 20 40 60 80 100
Percent0 20 40 60 80 100
Percent0 20 40 60 80 100
Education systemBelow level 2
Levels 5 and above
OECD average 20 8Singapore 11* 18*
Canada 11* 14*Finland 11* 14*
New Zealand 17 14*Korea, Republic of 14* 13*
France 21 13*Norway 15* 12*
Germany 16 12*Hong Kong (China) 9* 12
Australia 18 11Estonia 11* 11
Netherlands 18 11B-S-J-G (China) 22 11
Japan 13* 11Ireland 10* 11
Sweden 18 10United States 19 10
Belgium 20 9Israel 27* 9
United Kingdom 18 9Slovenia 15* 9
Poland 14* 8Luxembourg 26* 8
Czech Republic 22 8Switzerland 20 8
Portugal 17 8*Austria 23* 7*
Chinese Taipei 17 7*Macau (China) 12* 7*
Russian Federation 16 7*Iceland 22* 7*
Denmark 15* 6*Croatia 20 6*
Italy 21 6*Malta 36* 6*Spain 16 6*
Lithuania 25* 4*Latvia 18 4*
Hungary 27* 4*
Education systemBelow level 2
Levels 5 and above
Greece 27* 4*Buenos Aires (Argentina) 22 4*
Bulgaria 41* 4*Slovak Republic 32* 3*
Cyprus 36* 3*United Arab Emirates 40* 3*
Vietnam 14* 3*Uruguay 39* 3*
Trinidad and Tobago 42* 2*Chile 28* 2*
Romania 39* 2*Qatar 52* 2*Brazil 51* 1*
Montenegro, Republic of 42* 1*Moldova, Republic of 46* 1*
Georgia 52* 1*Colombia 43* 1*
Albania 50* 1*Lebanon 70* 1*
Costa Rica 40* 1*Turkey 40* 1!*
Thailand 50* #!*Mexico 42* #!*
Peru 54* #!*Jordan 46* #!*Kosovo 77* #*
Macedonia, Republic of 71* ‡Indonesia 55* ‡
Dominican Republic 72* ‡Tunisia 72* ‡Algeria 79* ‡
U.S. states and territoriesMassachusetts 11* 14*North Carolina 18 10
Puerto Rico 50* 1!*
Below level 2 Levels 5 and above
# Rounds to zero.! Interpret with caution. Estimate is unstable due to high coefficient of variation (>30 percent and <=50 percent).‡ Reporting standards not met due to coefficient of variation over 50 percent.* p<.05. Significantly different from the U.S. percentage at the .05 level of significance.NOTE: Education systems are ordered by percentage of 15-year-olds in Levels 5 and above. To reach a particular proficiency level, students must correctly answer a majority of items at that level. Students were classified into reading proficiency levels according to their scores. Cut scores for each proficiency level can be found in exhibit 2 of this report and in table A-1 at http://nces.edu.gov/surveys/pisa/PISA2015/index.asp. The OECD average is the average of the national percentages of the OECD member countries, with each country weighted equally. Italics indicate non-OECD countries and education systems. B-S-J-G (China) refers to the four PISA participating China provinces: Beijing, Shanghai, Jiangsu, and Guangdong. Results for Massachusetts and North Carolina are for public school students only. Although Argentina, Malaysia, and Kazakhstan participated in PISA 2015, technical problems with their samples prevent results from being discussed in this report. The standard errors of the estimates are shown in table R2b available at http://nces.ed.gov/surveys/pisa/PISA2015/index.asp.SOURCE: Organization for Economic Cooperation and Development (OECD), Program for International Student Assessment (PISA), 2015.
23
Table 3. Average scores of 15-year-old students on the PISA mathematics literacy scale, by education system: 2015
Education system Average scoreOECD average 490 Singapore 564 Hong Kong (China) 548 Macau (China) 544 Chinese Taipei 542 Japan 532 B-S-J-G (China) 531 Korea, Republic of 524 Switzerland 521 Estonia 520 Canada 516 Netherlands 512 Denmark 511 Finland 511 Slovenia 510 Belgium 507 Germany 506 Poland 504 Ireland 504 Norway 502 Austria 497 New Zealand 495 Vietnam 495 Russian Federation 494 Sweden 494 Australia 494 France 493 United Kingdom 492 Czech Republic 492 Portugal 492 Italy 490 Iceland 488 Spain 486 Luxembourg 486 Latvia 482 Malta 479 Lithuania 478 Hungary 477Slovak Republic 475
Education system Average score
Israel 470United States 470Croatia 464Buenos Aires (Argentina) 456Greece 454 Romania 444 Bulgaria 441 Cyprus 437 United Arab Emirates 427 Chile 423 Turkey 420 Moldova, Republic of 420 Uruguay 418 Montenegro, Republic of 418 Trinidad and Tobago 417 Thailand 415 Albania 413 Mexico 408 Georgia 404 Qatar 402 Costa Rica 400 Lebanon 396 Colombia 390 Peru 387 Indonesia 386 Jordan 380 Brazil 377 Macedonia, Republic of 371 Tunisia 367 Kosovo 362 Algeria 360 Dominican Republic 328
U.S. states and territoriesMassachusetts 500 North Carolina 471 Puerto Rico 378
Average score is higher than U.S. average score. Average score is lower than U.S. average score.
NOTE: Education systems are ordered by 2015 average score. The OECD average is the average of the national averages of the OECD member countries, with each country weighted equally. Scores are reported on a scale from 0 to 1,000. All average scores reported as higher or lower than the U.S. average score are different at the .05 level of statistical significance. Italics indicate non-OECD countries and education systems. B-S-J-G (China) refers to the four PISA participating China provinces: Beijing, Shanghai, Jiangsu, and Guangdong. Results for Massachusetts and North Carolina are for public school students only. Although Argentina, Malaysia, and Kazakhstan participated in PISA 2015, technical problems with their samples prevent results from being discussed in this report. The standard errors of the estimates are shown in table M1 available at http://nces.ed.gov/surveys/pisa/PISA2015/index.asp.SOURCE: Organization for Economic Cooperation and Development (OECD), Program for International Student Assessment (PISA), 2015.
24
Figure 5. Average scores and 10th and 90th percentile cut scores of 15-year-old students on the PISA mathematics literacy scale, by education system: 2015
Education system 10th percentile Mean 90th percentile
OECD average 373 490 605
Costa Rica* 315 400 489
Dominican Republic* 243 328 418
Algeria* 271 360 452
Mexico* 312 408 505
Kosovo* 265 362 460
Colombia* 293 390 492
Latvia* 382 482 582
Indonesia* 289 386 492
Macau (China)* 439 544 643
Ireland* 400 504 606
Thailand* 313 415 521
Estonia* 415 520 623
Denmark* 405 511 614
Finland* 404 511 614
Peru* 283 387 495
Turkey 317 420 529
Tunisia 263 367 476
Russian Federation 387 494 601
Vietnam 388 495 604
Jordan 271 380 489
Norway 391 502 610
Spain 374 486 593
Chile 313 423 534
Albania 303 413 525
Romania 334 444 557
Montenegro, Republic of 308 418 531
Uruguay 309 418 532
Lithuania 365 478 590
Poland 391 504 617
Japan 416 532 643
Canada 400 516 627
Slovenia 394 510 622
Brazil 267 377 496
Croatia 351 464 580
United States 355 470 585
Germany 389 506 620
Buenos Aires (Argentina) 340 456 571
Hong Kong (China) 426 548 659
Sweden 376 494 609
Education system 10th percentile Mean 90th percentile
Moldova, Republic of 303 420 536
Greece 336 454 570
Czech Republic 373 492 608
Netherlands 390 512 627
New Zealand 375 495 613
United Kingdom 371 492 610
Georgia 285 404 525
Cyprus 317 437 558
Italy 368 490 610
Iceland 367 488 608
Australia 371 494 613
Luxembourg* 363 486 607
Macedonia, Republic of* 251 371 496
Hungary* 351 477 598
Singapore* 436 564 682
Austria* 370 497 618
Slovak Republic* 349 475 596
Switzerland* 394 521 641
Portugal* 365 492 614
France* 364 493 613
United Arab Emirates* 306 427 557
Trinidad and Tobago* 294 417 545
Bulgaria* 315 441 568
Belgium* 374 507 630
Korea, Republic of* 391 524 649
Qatar* 278 402 536
Lebanon* 268 396 531
Chinese Taipei* 404 542 670
Israel* 332 470 601
B-S-J-G (China)* 388 531 664
Malta* 331 479 616
U.S. states and territoriesPuerto Rico* 284 378 481
Massachusetts 389 500 607
North Carolina 358 471 583
10thPercentile
AverageScore
90thPercentile
* p<.05. Cut score gap is significantly different from the U.S. 90th to 10th percentile cut score gap at the .05 level of significance.NOTE: Education systems are ordered by cut score gap, from smaller to larger. This table shows the threshold (or cut) scores for the following: (a) 10th percentile— the bottom 10 percent of students; (b) 90th percentile— the top 10 percent of students. The cut score gap for each education system is the difference between its 90th and 10th percentile cut scores. The percentile ranges are specific to each education system’s distribution of scores, enabling users to compare cut scores across education systems. The OECD average is the average of the national averages of the OECD member countries, with each country weighted equally. Scores are reported on a scale from 0 to 1,000. Italics indicate non-OECD countries and education systems. B-S-J-G (China) refers to the four PISA participating China provinces: Beijing, Shanghai, Jiangsu, and Guangdong. Results for Massachusetts and North Carolina are for public school students only. Although Argentina, Malaysia, and Kazakhstan participated in PISA 2015, technical problems with their samples prevent results from being discussed in this report. The standard errors of the estimates are shown in table M1b available at http://nces.ed.gov/surveys/pisa/PISA2015/index.asp.SOURCE: Organization for Economic Cooperation and Development (OECD), Program for International Student Assessment (PISA), 2015.
2000 300 400 500 600 700 800 1000
2000 300 400 500 600 700 800 1000
2000 300 400 500 600 700 800 1000
Score
Score
Score
25
Figure 6. Percentage of 15-year-old students performing at PISA mathematics literacy proficiency levels below level 2 and levels 5 and above, by education system: 2015
Percent0 20 40 60 80 100
Percent0 20 40 60 80 100
Percent0 20 40 60 80 100
Education systemBelow level 2
Levels 5 and above
OECD average 23* 11*Singapore 8* 35*
Chinese Taipei 13* 28*Hong Kong (China) 9* 27*
B-S-J-G (China) 16* 26*Macau (China) 7* 22*
Korea, Republic of 15* 21*Japan 11* 20*
Switzerland 16* 19*Belgium 20* 16*
Netherlands 17* 16*Canada 14* 15*Estonia 11* 14*
Slovenia 16* 13*Germany 17* 13*
Austria 22* 12*Poland 17* 12*
Malta 29 12*Finland 14* 12*
Denmark 14* 12*France 23* 11*
Portugal 24* 11*New Zealand 22* 11*
Australia 22* 11*Norway 17* 11*
United Kingdom 22* 11*Italy 23* 11*
Sweden 21* 10*Czech Republic 22* 10*
Iceland 24* 10*Luxembourg 26* 10*
Ireland 15* 10*Vietnam 19* 9*
Israel 32 9*Russian Federation 19* 9*
Hungary 28 8*Slovak Republic 28 8*
Spain 22* 7Lithuania 25* 7
United States 29 6
Education systemBelow level 2
Levels 5 and above
Croatia 32 6Latvia 21* 5
Bulgaria 42* 4Buenos Aires (Argentina) 34 4
Greece 36* 4*United Arab Emirates 49* 4*
Romania 40* 3*Cyprus 43* 3*
Trinidad and Tobago 52* 3*Qatar 59* 2*
Lebanon 60* 2*Moldova, Republic of 50* 2*
Uruguay 52* 2*Georgia 57* 2*
Montenegro, Republic of 52* 2*Thailand 54* 1*
Chile 49* 1*Turkey 51* 1!*
Albania 53* 1*Brazil 70* 1*
Macedonia, Republic of 70* 1*Indonesia 69* 1*
Tunisia 75* 1!*Peru 66* #*
Mexico 57* #!*Colombia 66* #!*
Costa Rica 62* #!*Jordan 68* #!*Algeria 81* ‡Kosovo 78* ‡
Dominican Republic 91* ‡
U.S. states and territoriesMassachusetts 17* 10*North Carolina 29 6
Puerto Rico 73* ‡
Below level 2 Levels 5 and above
# Rounds to zero.! Interpret with caution. Estimate is unstable due to high coefficient of variation (>30 percent and <=50 percent).‡ Reporting standards not met due to coefficient of variation over 50 percent.* p<.05. Significantly different from the U.S. percentage at the .05 level of significance.NOTE: Education systems are ordered by percentage of 15-year-olds in Levels 5 and above. To reach a particular proficiency level, students must correctly answer a majority of items at that level. Students were classified into mathematics proficiency levels according to their scores. Cut scores for each proficiency level can be found in exhibit 3 of this report and in table A-1 at http://nces.edu.gov/surveys/pisa/PISA2015/index.asp. The OECD average is the average of the national percentages of the OECD member countries, with each country weighted equally. Italics indicate non-OECD countries and education systems. B-S-J-G (China) refers to the four PISA participating China provinces: Beijing, Shanghai, Jiangsu, and Guangdong. Results for Massachusetts and North Carolina are for public school students only. Although Argentina, Malaysia, and Kazakhstan participated in PISA 2015, technical problems with their samples prevent results from being discussed in this report. The standard errors of the estimates are shown in table M2b available at http://nces.ed.gov/surveys/pisa/PISA2015/index.asp.SOURCE: Organization for Economic Cooperation and Development (OECD), Program for International Student Assessment (PISA), 2015.
26
Table 4. Average scores and changes in average scores of U.S. 15-year-old students on the PISA science, reading, and mathematics literacy scales: 2003, 2006, 2009, 2012, and 2015
Average score Change in average score
Subject 2003 2006 2009 2012 2015 2015–2003 2015–2006 2015–2009 2015–2012
Science † 489 502 497 496 †
Reading † † 500 498 497 † †
Mathematics 483 474 487 481 470
Average score in 2015 is higher than the average score in the comparison year at the .05 level of statistical significance. Average score in 2015 is not measurably different from average score in comparison year. Average score in 2015 is lower than the average score in the comparison year at the .05 level of statistical significance.
† Not applicable. Although science was assessed in 2000 and 2003, because the science framework was revised for 2006, it is possible to look at changes in science only from 2006 forward. Similarly, although reading was assessed in 2000, 2003, and 2006, and mathematics was assessed in 2000, because the reading framework was revised for PISA 2009 and mathematics framework was revised for PISA 2003, it is possible to look at changes in reading only from 2009 forward and in mathematics only from 2003 forward.NOTE: All average scores reported as higher or lower than the comparison year are different at the .05 level of statistical significance. For information on the results for these three countries, see OECD (2016d). The standard errors of the estimates are shown in table T1 available at http://nces.ed.gov/surveys/pisa/PISA2015/index.asp. SOURCE: Organization for Economic Cooperation and Development (OECD), Program for International Student Assessment (PISA), 2003, 2006, 2009, 2012, and 2015.
27
ReferencesFleischman, H.L., Hopstock, P.J., Pelczar, M.P., and Shelley, B.E. (2010). Highlights
From PISA 2009: Performance of U.S. 15-Year-Old Students in Reading, Mathematics, and Science Literacy in an International Context (NCES 2011-004). U.S. Department of Education, National Center for Education Statistics. Washington, DC: U.S. Government Printing Office.
Organization for Economic Cooperation and Development (OECD). (1999). Measuring Student Knowledge and Skills: A New Framework for Assessment. Paris: Author.
Organization for Economic Cooperation and Development (OECD). (2016a). PISA 2015 Science Framework. Paris: Author.
Organization for Economic Cooperation and Development (OECD). (2016b). PISA 2015 Reading Framework. Paris: Author.
Organization for Economic Cooperation and Development (OECD). (2016c). PISA 2015 Mathematics Framework. Paris: Author.
Organization for Economic Cooperation and Development (OECD). (2016d). PISA 2015 Results (Volume 1): Excellence and Equity in Education. Paris: Author.
Organization for Economic Cooperation and Development (OECD). (forthcoming). PISA 2015 Technical Report. Paris: Author.

This page intentionally left blank
29
Technical NotesThis section briefly describes features of the PISA 2015 assessment, with a particular focus on implementation in the United States. For further details about the assessment and any of the topics discussed here, see the fuller description of technical notes on the NCES PISA website at http://nces.ed.gov/surveys/pisa/pisa2015/index.asp as well as the OECD’s PISA 2015 Technical Report (forthcoming).
Sampling and Response RatesThe OECD required all participating education systems to adhere to the PISA 2015 technical standards (OECD forthcoming), which provided detailed specifications for the required target population, sampling, response rates, translation, assessment administration, and data submission. According to the standards, the international desired population in each education system consisted of 15-year-olds attending either publicly or privately controlled schools in grade 7 and higher. More specifically, the technical standards required that students in the sample be 15 years and 3 months to 16 years and 2 months at the beginning of the testing period (referred to as “15-year-olds” or “15-year-old students”). The maximum length of the testing period was 42 consecutive days. Most education systems conducted testing from March through August 2015.1 The sample design for PISA 2015 was a stratified systematic sample, with sampling probabilities proportional to the estimated number of 15-year-old students in the school based on grade enrollments.
The U.S. PISA 2015 national school sample consisted of 240 schools, which was higher than the international sampling minimum of 150 to offset anticipated school nonresponse and ineligibility. The samples for Massachusetts and North Carolina consisted of 59 schools each; the sample for Puerto Rico consisted of 55 schools. The U.S. national and Puerto Rico samples included both public and private schools; the Massachusetts and North Carolina samples included public schools only. As with the PISA national sample, the samples for Massachusetts, North Carolina, and Puerto Rico were also increased from the international minimum of 50 schools for subnational entities to offset anticipated school nonresponse and ineligibility. In the U.S. national, Massachusetts, and North Carolina samples, 42 students in each school took the core PISA assessment in mathematics literacy, science literacy, reading literacy, and collaborative problem solving. Eleven of the 42 students in the U.S. national, Massachusetts, and North Carolina samples were also subsampled to take the financial literacy assessment, which was held in a separate session after the main PISA assessment. The financial literacy assessment was not administered to the 42 students in each school in Puerto Rico.
1 The United States and the United Kingdom were given permission to move the testing dates to September through November in an effort to improve response rates.
30
A total of 177 schools participated in the administration of national PISA, including 142 participating schools sampled as part of the original sample and 35 schools sampled as replacements for nonparticipating “original” schools. The overall weighted school response rate after replacements was 83 percent. For the United States as a whole, the weighted student response rate was 90 percent and the student exclusion rate was 3 percent. In Massachusetts, there were 48 participating schools (out of 53 eligible schools), resulting in an overall weighted school response rate of 92 percent. The overall weighted student response rate was 90 percent and the overall student exclusion rate was 4 percent. All eligible schools (54) participated in North Carolina, yielding an overall weighted school response rate of 100 percent with an overall weighted student response rate of 92 percent and an exclusion rate of 5 percent. All of Puerto Rico’s 47 eligible schools participated (100 percent). The weighted student response and exclusion rates in Puerto Rico were 93 percent and 3 percent, respectively.
See http://nces.ed.gov/surveys/pisa/pisa2015/index.asp for PISA international sampling guidelines and requirements regarding accommodations, exclusions, and response rate requirements, as well as response rates of all participating education systems.
Assessment and QuestionnairesThe 2015 assessment instruments were developed by international experts and PISA international consortium test developers and included items submitted by participating education systems. In addition to the core subject areas of science, mathematics and reading literacy, PISA also offered two optional assessment components: financial literacy and collaborative problem solving. The United States administered both the core subject areas and the two optional assessment components. Massachusetts, North Carolina, and Puerto Rico administered the core PISA assessment components. In addition, Massachusetts and North Carolina administered the financial literacy and collaborative problem solving components.
All mathematics and reading items in the 2015 assessment instrument were trend items from previous assessments. Science items included both trend items and new items developed for 2015. Items were reviewed by representatives of each country for possible bias and relevance to PISA’s goals and by PISA subject-matter expert groups. To further examine potential biases and design issues in the PISA assessment, all participating education systems field tested the assessment items in spring 2014. After the field trial, items that did not meet the established measurement criteria or were otherwise found to include intrinsic biases were dropped from the main assessment.
The final 2015 main study computer-based assessment included six clusters from each of the trend domains of science, reading, and mathematics literacy, six clusters of new science literacy test items, and three clusters of new collaborative problem solving materials. The clusters were allocated in a rotated design to create six groups of test forms. Every student taking the assessment answered science items, and at least one but up to two of the other
31
subjects of mathematics literacy, reading literacy, and/or collaborative problem solving. Students who were subsampled for the financial literacy assessment returned for a second session in which the focus was only on financial literacy and the accompanying student questionnaire. For education systems administering the paper-based version of PISA, as in the case of Puerto Rico, the assessment included six clusters from each of the trend domains of science, reading, and mathematics literacy only. Every student taking the paper-based assessment answered science items, but not all students answered mathematics literacy or reading literacy items. In order to keep PISA as inclusive as possible and to keep the exclusion rate down, the United States, Massachusetts, and North Carolina used the UH (‘Une Heure’) instrument designed for students with special education needs (Puerto Rico did not use the UH instrument).
Approximately 65 percent of science items were multiple-choice and 35 percent of science items were open response. For reading and mathematics items, approximately 40 percent were multiple choice and 60 percent open response. Open response items were graded by trained scorers following international coding guidelines.
After the cognitive assessment, students also completed a questionnaire designed to provide information about their backgrounds, attitudes, and experiences in school. Principals in schools where PISA was administered also completed a questionnaire designed to provide information on their school’s structure, resources, instruction, climate, and policies. In addition, in the U.S. national school sample, Massachusetts school sample, and North Carolina school sample, a sample of teachers within each school were selected to complete a computer-based questionnaire. (Puerto Rico did not administer the teacher questionnaire.)
See http://nces.ed.gov/surveys/pisa/pisa2015/index.asp for more information about the PISA 2015 assessment design and questionnaires.
Reporting ResultsIn PISA, results are generally reported in two ways: scale scores (on a scale of 0 to 1,000) and the percentage of students reaching each proficiency level. Scale scores are reported in terms of both average scores and the threshold (or cut) scores at certain percentiles. In addition to scale scores as the basic form of measurement, PISA describes student performance in terms of levels of proficiency. Higher levels represent the knowledge, skills, and capabilities needed to perform tasks of increasing complexity. Proficiency level results are reported in terms of percentages of the student population at each of the predefined levels. In some displays, comparisons are made to the OECD average, which is the average of the 35 OECD member country averages with each country weighted equally. See http://nces.ed.gov/surveys/pisa/pisa2015/index.asp for more information about PISA scaling and proficiency levels.
32
Sampling Weights and Standard ErrorsThe use of sampling weights is necessary to compute statistically sound estimates. Adjusted survey weights adjust for the probabilities of selection for individual schools and students, for school or student nonresponse, and for errors in estimating the size of the school or the number of 15-year-olds in the school at the time of sampling.
As with any study, there are limitations to PISA 2015 that should be taken into consideration. Estimates produced using data from PISA 2015 are subject to two types of error: nonsampling errors and sampling errors. The sources of nonsampling errors are typically problems such as unit and item nonresponse, the differences in respondents’ interpretations of the meaning of survey questions, and mistakes in data preparation. Sampling errors arise when a sample of the population, rather than the whole population, is used to estimate some statistic. Different samples from the same population would likely produce somewhat different estimates of the statistic in question. This uncertainty is referred to as sampling variance and is usually expressed as the standard error of a statistic estimated from sample data. Standard errors for all statistics reported in this report are available online at http://nces.ed.gov/surveys/pisa/pisa2015/index.asp.
Statistical ComparisonsComparisons made in this report have been tested for statistical significance. For example, in the commonly made comparison of OECD averages to U.S. averages, tests of statistical significance were used to establish whether or not the observed differences from the U.S. average were statistically significant. In almost all instances, the tests for significance used were standard t tests. These fell into three categories according to the nature of the comparison being made: comparisons of independent samples, comparisons of nonindependent samples, and comparisons of performance over time. A difference is “significant” if the probability associated with the t test is less than .05. If a test is significant this implies that difference in the observed means in the sample represents a real difference in the population. When analyzing change in performance over time, the test for significance includes the addition of a standard error term. This is because the uncertainty that results from link item sampling, referred to as a “linking error,” must be taken into account when making certain comparisons between previous rounds of PISA (2003, 2006, 2009, and 2012) and PISA 2015 results. No adjustments were made for multiple comparisons.
More detailed information on the implementation of PISA in the United States is available on the NCES website at http://nces.ed.gov/surveys/pisa/pisa2015/index.asp.

This page intentionally left blank