Embed Size (px)
Citation preview
OPTCL
(Approved by OERC vide Letter No. OERC-Engg-5/98 (Vol.XV)/ 1364 dt. 08.10.2014)
PERFORMANCE OF THETRANSMISSION SYSTEM
OF OPTCLFOR 2013-2014
[This report is prepared in pursuance of Licence Condition 16.7 & Clause 13.7 ofAppendix-4B of the OERC (Conduct of Business) Regulations, 2004]

PERFORMANCE OF TRANSMISSION SYSTEM OF OPTCL (AS REPORTED) DURING THE YEAR 2013-14.
1. Procurement of Power:
Source Commission’sApproval
( MU)
Actual Drawl for theState Consumption
(MU)
Remarks
OHPC 5881.74 7014.53 State’s Maximumand Minimum
demand was 3705MW and 1383 MW
respectively
Thermal(TTPS+OPGC) 5878.18 5967.79
CGP including Co-generation 1102 779.519Renewable Generation 485.76 433.913IPP 3073.51 3329.17EREB 7637.23 7537,979
Total 24058.422 25062.89Net Banking +IEX+STOA -1740.187
24058.42 23322.712
2. Voltages profile of Major Grid Sub-stations
Allowable Range (245-198 KV) Allowable Range (145 -122 KV)Sl.No.
Name of the220/132 kV Grid
Sub-station
MaximumVoltage in
kV
MinimumVoltage in
kV
Sl.No.
Name of the132/33 kV Grid
Sub-station
MaximumVoltage in
kV
MinimumVoltage in
kV1 Jaynagar 254 229 1 Cuttack 142 1042 Duburi 245 210 2 Puri 133 953 Joda 243 205 3 Khurda 144 88
4 Tarkera 242 223 4 Berhampur 144 1065 Budhipadar 249 218
6 Balasore 245 210
7 Narendrapur 254 187
8 Chandaka 239 196
9 Bhanjanagar 272 210
10 Theruvali 261 220
11 Meramundali 240 213
12 Bidanasi 238 204
13 Katapalli 258 216
14 Bhadrak 250 194
15 Paradeep 250 205
16 Bolangir 256 210
17 Mendhasal 240 207
3. System Interruptions due to Major Incident:
INTERRUPTION DUE TO MAJOR INCIDENTIncident Duration ofInterruption No. ofInterruption
Duration ofInterruption
(Hrs:Min:Sec)
No. ofInterruption
Remarks
Snapping of Jumper /Conductor / Earth wire
64:30:00 73 The duration of interruptionindicated above is the sum total
of interruptions occurred atdifferent areas(S/s) during the
year. However there was no totalblackout experienced for the
State during the year 2013-14.
Insulator Failure 52:16:00 55Bursting of CT / PT 3:44:00 9Breaker Problem 5:49:00 11System Disturbance 6:19:00 14Failure of LA 9:19:00 35Others 854:33:00 98
Note: Issued in the Public interest. Detailed report on Performance of Transmission System of OPTCL is available in SLDC website i.e.,www.sldcorissa.org.

COMMISSION’S OBSERVATION ON THE PERFORMANCE OF THETRANSMISSION SYSTEM OF OPTCL FOR 2013-14
The salient features of the performance of transmission system of OPTCL for the year
2013-14 is given below and the detail information in support to that is available in SLDC
website i.e., www.sldcorissa.org
A. Procurement of Power:
The Commission had approved the purchase of power by GRIDCO from various
sources in the ARR & Tariff order for 2013-14 against which the actual performance have
been indicated in the following table:
Source Commission’sApproval
( MU)
Actual Drawl forthe State
Consumption (MU)
Remarks
OHPC 5881.74 7014.53 State’sMaximum
andMinimum
demand was3705 MWand 1383
MWrespectively
Thermal(TTPS+OPGC) 5878.18 5967.79CGP including Co-generation 1102 779.519Renewable Generation 485.76 433.913IPP 3073.51 3329.17EREB 7637.23 7537,979
Total 24058.422 25062.89Net Banking +IEX+STOA -1740.187
24058.42 23322.712
There is an import of 128.759 MU through power banking, open access, trading &
IEX) and export of 1868.946 MU (200.33 through trading, STOA, banking & IEX export and
1668.616 MU EREB export) during the FY 2013-14. Hence, in the said financial year
GRIDCO has an export of 1740.187 MU on this account.
2. During FY 2013-14 the daily peak demand touched at 3705 MW maximum on
dt.27.03.2014 and a minimum of 1383 MW on dt.12.10.2013. The peak demand of 3705 MW
in 2013-14 is about 125 MW above the peak demand experienced during the previous year
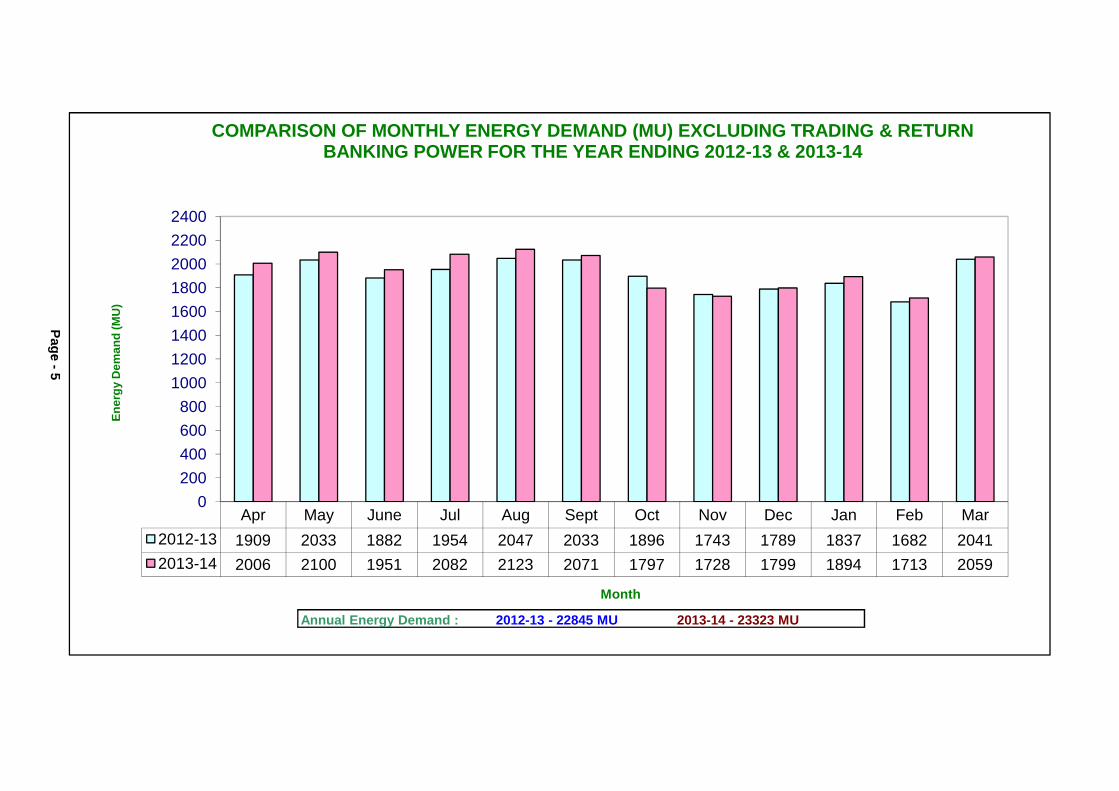
2012-13 (of 3580 MW). But the total energy drawl is 23323 MU in FY 2013-14 against 22845
MU in 2012-13, which indicates a growth in electricity consumption of around 478 MU in the
state.

B. Line Interruption:
3. OPTCL’s system has faced aggregated Annual interruptions varying from 3 hour to 854
hours at different locations on account of conductor/jumper snapping, insulator failure,
bursting of Current Transformer/Potential Transformer, breaker problem, system disturbance,
Lightening Arrester failures and others. However, OPTCL has claimed that it has arranged to
maintain power supply (without resorting to total power failure due to non-availability of
transmission capacity) from other nearby transmission facilities. The same effort has been
made by OPTCL in maintaining uninterrupted power supply even in the event of generation
failures. OPTCL claimed that there was no black out experienced in the State during the FY
2013-14.
C. Frequency Profile:
4. As per Regulations 3(1)(a) of Central Electricity Authority(Grid Standards)
Regulations, 2010, the frequency should not be allowed to go beyond the range 49.2 to 50.3
Hz, except during the transient period following tripping. As per the provisions in Indian
Electricity Grid Code Regulations, 2010, all users, SEBs, SLDCs, distribution licensee & bulk
consumer shall take all possible measures to ensure that grid frequency always remains within
49.7 to 50.2 Hz band. Orissa Grid Code also provides that restriction of drawl should start at
49.5HZ and generators should back down after 50.5 HZ. OPTCL, in 2013-14, has experienced
frequency as low as 49.04 Hz and as high as 50.98 Hz during 1st quarter. However, OPTCL
does not have much control over the frequency parameter since it is dependant upon the
National Grid. OPTCL hopes that DISCOMs should adhere to their schedule drawl and for the
interest of themselves as well as for state shall reduce their drawl during low frequency from
the grid.
D. Voltage Profile:
5. The EHT voltage, as per Regulations 3(1)(b) of Central Electricity Authority(Grid
Standards) Regulations, 2010 should be in the range 122-145 kV for voltage at 132 kV, 198-
245 kV for voltage at 220 KV and 380-420 kV for 400 kV level. OPTCL has however
experienced 187 kV minimum and 272 kV maximum in its 220 KV system and 88 KV
minimum and 144 KV maximum in its 132 KV system. OPTCL is advised to take suitable
remedial measures to improve the voltage profile. OPTCL should also monitor the reactive
drawl of DISCOMs from its grid S/s and wherever DISCOM draw excessive reactive load at
low voltage condition in grid S/S, it shall take up with them for remedial measure. OPTCL
should keep its on-line Tap Changer of the Power Transformers in healthy condition and all the
field engineers should be trained to operate OLTC during peak and low load condition of the
day.

E. Load Restriction:
6. M/s. OPTCL has claimed that the load restriction due to non-availability of the
transmission and transformation capacity as ‘NIL’ which in turn indicates that during FY
2013-14 and OPTCL system availability was 100%. OPTCL and DISCOM authorities should
discuss and take action on augmentation of transformer and line capacity of the problematic
area of the transmission system. DISCOMs should be intimated as regards to commissioning of
new s/s and up-gradation etc. so that no investment of OPTCL shall remain idle due to non-
availability of downward evacuation arrangement.
7. Due to non-availability of generation/failure of generating stations, OPTCL, however,
has resorted of load restriction in 2013-14 totaling only 13.33 hours in the year. Further, during
the said period load restriction was imposed on rotational basis in the state to curtail demand
due to non-availability of generation/failure of generating stations. OPTCL is required to
develop appropriate ring system so that power supply to the affected areas can be easily made
available from the neighboring areas fed from other generating stations of the state and Orissa
share from Inter State Generating Station of Eastern Region.
F. Efficient Operation of Transmission System:
OPTCL should complete the SCADA provision work in all 220 kV and above S/S for
proper monitoring and efficient functioning of the power system. Energy Accounting and
Settlement Service Centre (EASSC) should be fully functional under the control of SLDC.
OPTCL is advised to take action to comply the above directions.
****
Baripada
Kendrapara
Parlakhemundi
NABARANGPUR
KORAPUT
BALASORE
Pattamundai
Polasponga
Padwa
Narendrapur
Therubali
MAYURBHANJ
BHADRAKJajpur Town
KENDRAPARA
JAGATSINGHPUR
PURI
KHURDA
CUTTACK
NAYAGARH
DEOGARH
SAMBALPUR
SONEPUR
BOUDH
KANDHAMAL
GANJAMRAYAGADA
KALAHANDI
GAJAPATI
SUNDARGARH
KEONJHAR
DHENKANALANGUL
BAY OF BENGAL
CHILIKALAKE
Bhubaneswar
Chandaka
Indravati
KolaghatBisra PGTarkera
Jharsuguda
Budhipadar
B.Nagar
IB
Bargarh
Burla
Chiplima
Bolangir
Korba (II & III)
Sambalpur
Joda
Jaleswar
Paradeep
Bhanjanagar
Digapahandi
Bidanasi
Nimapara
Puri
Chhatrapur
Berhampur
Aska
Sonepur
Patnagarh
H
1
E
2 3
D
C
B
A
1 2 3 4
6 7 8
H
G
F
E
5 6 7
D
C
B
8
A
Dhenkanal
Choudwar
Jagatsinghpur
Rayagada
MachhkundMachhkund
Sunabeda
DamanjodiU-Kolab
Balimela
Manbar
MALKANGIRI
Akhusingh
Kesinga
Saintala
Junagarh
Sundargarh
Rairangpur
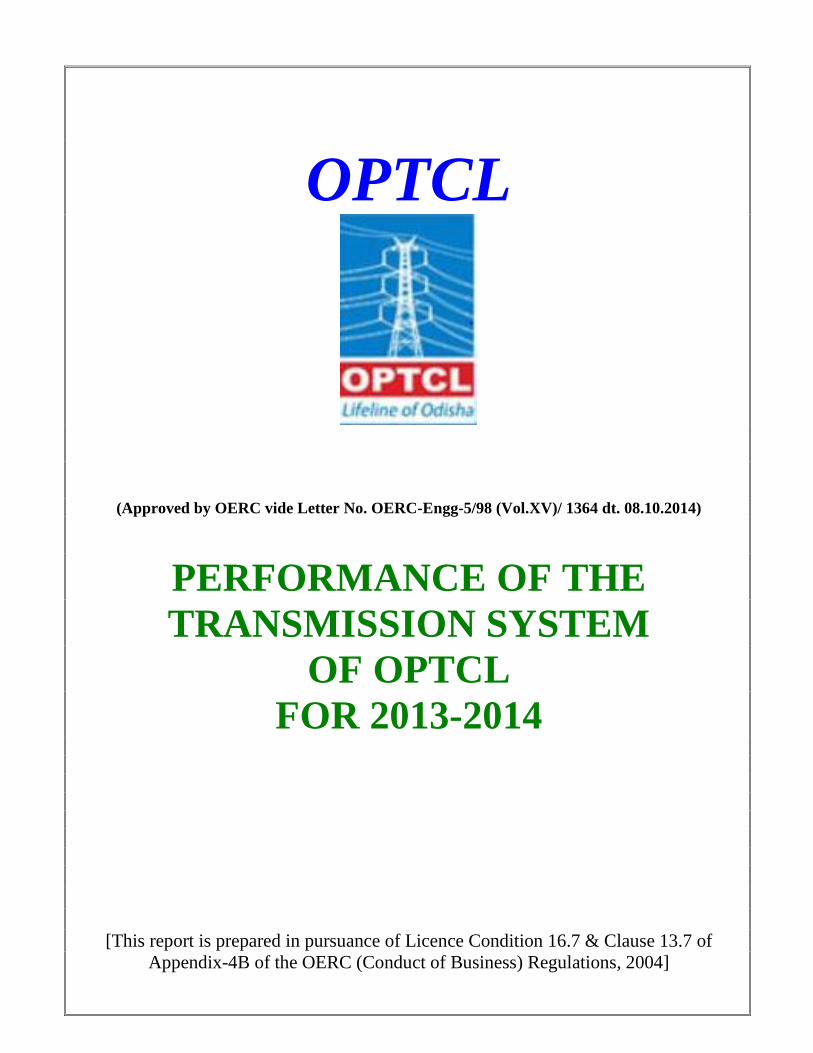
OF OPTCL
DETAILS OF LINE
400KV TRANSMISSION LINE220KV TRANSMISSION LINE132KV TRANSMISSION LINE
Existing Proposed /U/C
Cuttack
ICCL
Jams
hedp
ur P
G
Soro
Upper Sileru
Bhalulata
BARGARH
BOLANGIRPhulbani
Kaniha
Rengali Rengali PH
ChainpalTTPS
Meramundali
Anugul
NALCO
Ranasinghpur
Nayagarh
Balasore
Bhadrak
Balugaon
Nuapatna
ACC
Barkote
RairakholBoinda
Tentulikhunti
JT
Ch. Kusumi
Kalarangi
Kantabanji
Jamsh
edpu
r (DVC
)
R.C.
Pur
Kend
upos
hiVizag
Katapali
Hindal
Rajgangpur
Goelkera
Birla Tyres
FACOR
PPL
IFFCO
Duburi
Kamakhyanagar
Mesco
TISCO
Rengali PG
NBVL
IRE
MohanaGanjam
2x149.09
ANDHRA PRADESH
SCHEMATIC TRANSMISSION MAP
J.K.Paper
IMFAMukhigudaPG
Jeypore PG
Gajuwaka
Maliguda
MCL
NUAPARA
C H H
A T
T I S
G A
R H
J H A R K H A N D
WEST BENGAL
HYDRO POWER STATIONTHERMAL POWER STATIONGRID S/S & TRACTION S/SSWITCHING STATION / CGP/ IPPBULK CONSUMERSTATE BOUNDARYDISTRICT BOUNDARYZONE BOUNDARY
Traction OCL
148
93.46
2x92
.072
43
6
40
45.272
13
56.4
PGCIL
110
20
9.68
2
120 (Rayagada - Mohana)
70
123
86.148196.07
171.46
33.9643.825
12.65.8
13.2
82
33.72
86.5
54.19
68.56
630
24.78
36.5
5.5
19.8
35.11252
.548
58.5
14.532
106.425
33.2
39.9
8
39.80553.845
79.7
2x2.8754.920
129.7
235
60
7
6.93
11.745
22
109.838
2x81(DC)
Bamra158.7
3
RSP11.04
15.335
6.165
20
83.29
116.1
76.386
57.30
55.77
2
6.45
2.598
2x137.894
74.19
5
4.564
44.932
10.5
19
19.5
34.774
7.1716.205
20.9742x86.842.52
37.116
2x100.451
139.
175
34.5
8.63
7
62.7
241.5 (Orissa Portion)
NORTH ZONE
SOUTH ZONE
WEST ZONE
CENTRAL ZONE
FCI
PPT
NINL
Traction
Chandikhole
L&TTraction
Raipur
Traction
4 5
KOLA
R(Ka
rnatak
a)
500KV TRANSMISSION LINE
Kuchei
15.5
3249.9
7.73
29.5
51
10.826
Balasore
58.0
10.91
0.54
Traction
8.086
29.92
2x63.11
28.904
Adhunik
19.3
45
Joranda
2x6.65
2.34
0.5
2.15
3
9.135
154
627.659
JAJPUR
91
FAP
Maheswari
7.88
Duburi
VBC Ferro
Rawmet
Bhusan
Shyam DRI
Nuagaon
Bhusan
Traction
Jakhapura
TSIL
Salipur
Basundhara
SPS
HAL
Jindal
7.3
6.384
5.58
0.06
20
9
15.7
0.386
61.7
16
14.9
2
12.8
56
5.517
1.17
F
G
11.46514.93116
7
2
New
1.882
14.5
0.3
12.403
2.71
1.9
38.5
1.2
PGCIL
Jagannathpur
Rambha
Solari
Powmax
Vedant Alumina
New Bolangir
Charged at 132kVI
IIII I
I II
I II
Rohit Ferro
(UptoJayanagar)
174
I
II
2x29(SC)
Rourkela
Chhend
(Burla PH - Boinda)
35
21
(Burl
a - Rou
rkela)
(Chiplima-Bargarh)
(Rairangpur - Baripada)
(Jajpur Road - Bhadrak)
0.7
0.15
3.565
(Bha
drak -
Bala
sore)
1.01
(Duburi New
- Bala
sore)
13.02
1
Total Length - 3
76 km.
Visa
7.1
96
PGCIL
113.433
2.4
Kharagprasad
BRGML Rungta
7.468
3.55
I II
1.1
I
III
117.847
III
I & II
II
I
III 2x10.991
2x7.26
1.33
1.63
25.815
34.2
35
15.414
85.9(Chainpal-Choudwar)
91.08(Chainpal-CDR)
4.888
8.78
Arati 11.01
1
2x76.859
11.15
5
57.3
31
P G C I L
95.556
2x151.68
(Rengali - Tarkera)
I II0.896
III & IV
I & II
III
0.2
Raigarh (I)
P G C I L
APTR
AN
SCO
Length in kms. NOT TO SCALE
III
1.73
5
I
III
40.753
Dabugaon
72.288
Nuapara
6.61
Bhawanipatna
45.532
Padampur50.732
Boudh
Purushottampur2.5
29.358 Kuchinda
Kalunga2.942
Barbil
Keonjhar
Anandapur
30
10.42
56.073
5.2
Chandiposh
Bonai 2.926
Kaipadar
11.25
9
57.57
13.2
JajpurRoad
Mendhashal
Chandpur
2.31
Banki19.69
1.8
Atri11
P G C I L
P G C I L
PGCIL
P G C I L
P G C I L
P G C I L
PGCIL
P G
C I
L
Basta 0.536
23.514
Karanjia
Barpali5
(Joda-Rairangpur)
1.432
6.04
11.798
Kesura15.87
14.71
EMAMI
8.57
1
MSP
25.28
4.6
0.59
2
OCL
15.8
69
Vedant
16.67
18
76.9
Udala39.73
Jamshedpur
4.5
Kuanrmunda14.912
(Pro
pose
d for
Mult
i
Circu
it Li
ne)
J.mayee0.738
Jayanagar
Meenakshi
4.7844.75210.550
Lapanga
16.5
3
Gorakhnath
Keonjhargarh
19.433
2.99
B.pani
8.471
8
3
Dhamra
Shamuka
11
Uttara
25
60
60
10
11
ArugulKhurda
Phulnakhara
0.47 Aryan Ispat
23
OPCL
64.7
I & II
19.4
35.2
93
(Bala
sore
-Jales
war)
(Therubali - Kesinga)
(Up t
o LIL
O Point
)
(Bhanjanagar - Chandaka)
JSPL4.8
(Joda
- Lo
c. No
. 316
)
Samal
1.03
JSPL
37.9
16
(Chandaka - Nimapara)
0.577
33.61
4.5
Maithan
S.Pur
ShreeGanesh
Steels
P G C I L
P G C I L
P G C I L
B.C.Mohanty
Sterlite
Tomka11.86
Marshaghai1.5
Olavar
30
Khajuriakata
16.19
8
III
5.742
Konark
3.008 Narasinghpur
79.282
Baliguda
8.608
Pratapsasan
Nisa
Chendipada
Umerkote
Khuntuni
30
30
40
MCL
23
J.mayeeJ.mayee
BRPL
2.78
Shalivahana
Gopinathpur
21.848
79.3
786
IOCL
39.7
Port
DhamraTraction
35.7
Dhamra
52.486
14.75
Muniguda2
Khariar
35
CDA
Patangi
32
Alloys
Tangi
Arati
Infocity-II
Bangiriposi1.0
Podagada
10
18.322
110
Road
Bhograi
R. Udaygiri
40
Malkangiri
Champua
8.823
Ghatagaon
35
1.368
Bee KayNalda
Arya
Bolani
(Joda - Rourkela)
Satasankha
53.2
ActionIspat
1.6
Essar 8.868
26
AdityaAl.
19.238
0.492
10
0.5
I II
IIII & II
Laxmipur
53.2
SMC Power
GKEL
8.239
26.087
A.AluminaU.Alumina14.109
16.9
31

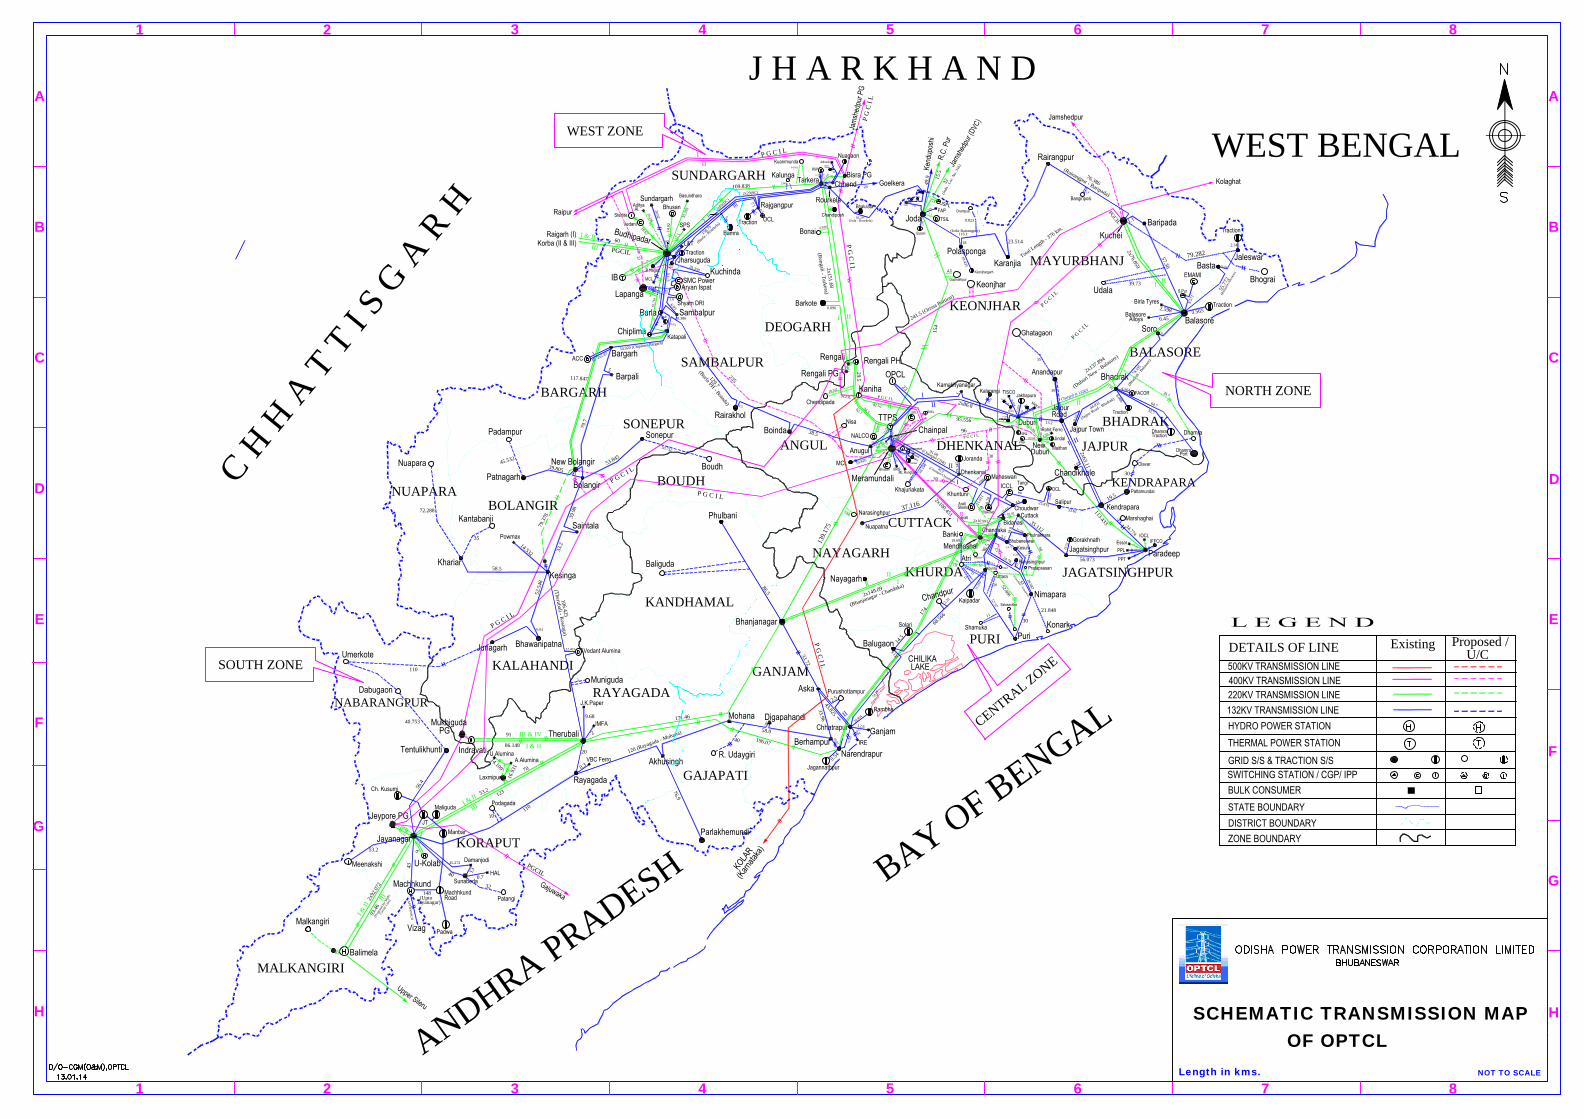
7337.647
779.519 -1539.857
433.913
GRID DEMAND FOR THE YEAR 2013-14[Total Drawal 23322.707 MU ]
Page-2
7014.5309296.954
Net EREB Total Hydro Total Thermal (OPGC + TTPS+IPP) CPP Net BankingPower+IEX+STOA Renewable Energy
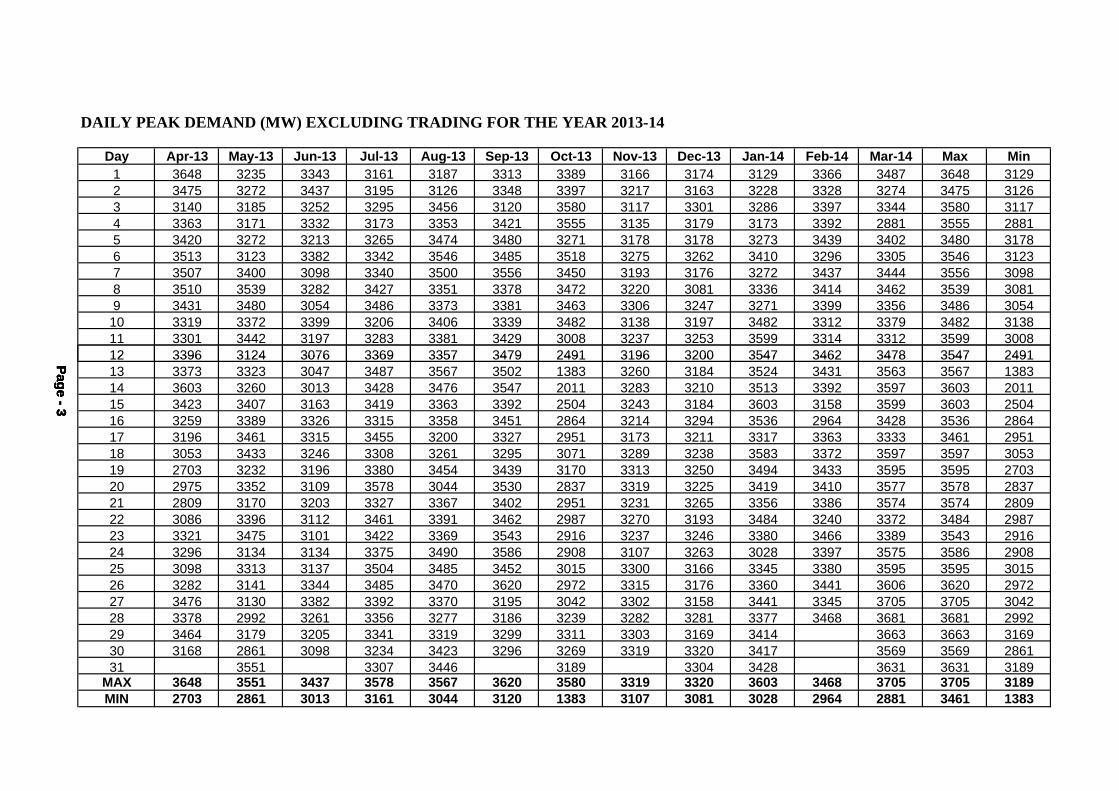
DAILY PEAK DEMAND (MW) EXCLUDING TRADING FOR THE YEAR 2013-14
Day Apr-13 May-13 Jun-13 Jul-13 Aug-13 Sep-13 Oct-13 Nov-13 Dec-13 Jan-14 Feb-14 Mar-14 Max Min1 3648 3235 3343 3161 3187 3313 3389 3166 3174 3129 3366 3487 3648 31292 3475 3272 3437 3195 3126 3348 3397 3217 3163 3228 3328 3274 3475 31263 3140 3185 3252 3295 3456 3120 3580 3117 3301 3286 3397 3344 3580 31174 3363 3171 3332 3173 3353 3421 3555 3135 3179 3173 3392 2881 3555 28815 3420 3272 3213 3265 3474 3480 3271 3178 3178 3273 3439 3402 3480 31786 3513 3123 3382 3342 3546 3485 3518 3275 3262 3410 3296 3305 3546 31237 3507 3400 3098 3340 3500 3556 3450 3193 3176 3272 3437 3444 3556 30988 3510 3539 3282 3427 3351 3378 3472 3220 3081 3336 3414 3462 3539 30819 3431 3480 3054 3486 3373 3381 3463 3306 3247 3271 3399 3356 3486 305410 3319 3372 3399 3206 3406 3339 3482 3138 3197 3482 3312 3379 3482 313811 3301 3442 3197 3283 3381 3429 3008 3237 3253 3599 3314 3312 3599 300812 3396 3124 3076 3369 3357 3479 2491 3196 3200 3547 3462 3478 3547 249112 3396 3124 3076 3369 3357 3479 2491 3196 3200 3547 3462 3478 3547 249113 3373 3323 3047 3487 3567 3502 1383 3260 3184 3524 3431 3563 3567 138314 3603 3260 3013 3428 3476 3547 2011 3283 3210 3513 3392 3597 3603 201115 3423 3407 3163 3419 3363 3392 2504 3243 3184 3603 3158 3599 3603 250416 3259 3389 3326 3315 3358 3451 2864 3214 3294 3536 2964 3428 3536 286417 3196 3461 3315 3455 3200 3327 2951 3173 3211 3317 3363 3333 3461 295118 3053 3433 3246 3308 3261 3295 3071 3289 3238 3583 3372 3597 3597 305319 2703 3232 3196 3380 3454 3439 3170 3313 3250 3494 3433 3595 3595 270320 2975 3352 3109 3578 3044 3530 2837 3319 3225 3419 3410 3577 3578 283721 2809 3170 3203 3327 3367 3402 2951 3231 3265 3356 3386 3574 3574 280922 3086 3396 3112 3461 3391 3462 2987 3270 3193 3484 3240 3372 3484 298723 3321 3475 3101 3422 3369 3543 2916 3237 3246 3380 3466 3389 3543 291624 3296 3134 3134 3375 3490 3586 2908 3107 3263 3028 3397 3575 3586 290825 3098 3313 3137 3504 3485 3452 3015 3300 3166 3345 3380 3595 3595 301526 3282 3141 3344 3485 3470 3620 2972 3315 3176 3360 3441 3606 3620 297227 3476 3130 3382 3392 3370 3195 3042 3302 3158 3441 3345 3705 3705 304228 3378 2992 3261 3356 3277 3186 3239 3282 3281 3377 3468 3681 3681 299229 3464 3179 3205 3341 3319 3299 3311 3303 3169 3414 3663 3663 316930 3168 2861 3098 3234 3423 3296 3269 3319 3320 3417 3569 3569 286131 3551 3307 3446 3189 3304 3428 3631 3631 3189
MAX 3648 3551 3437 3578 3567 3620 3580 3319 3320 3603 3468 3705 3705 3189MIN 2703 2861 3013 3161 3044 3120 1383 3107 3081 3028 2964 2881 3461 1383
Page-3
Page-3
Page-3
Page-3

Page - 4
-300-200-1000100200300400500600700800900100011001200130014001500160017001800190020002100
Dem
and
(MW
)
HoursHOURLY DEMAND CURVE FOR 25.11.2000 (MAX PEAK DEMAND OF THE YEAR 2000-01)Grid Demand Hydro Thermal CPP Central Sector Export to APTRANSCO
18002000220024002600280030003200340036003800
Dem
and
(MW
)
COMPARISON OF MONTHLY PEAK DEMAND (MW) EXCLUDING TRADING FOR THEYEAR ENDING 2012-13 & 2013-14
Page - 4
-300-200-1000100200300400500600700800900100011001200130014001500160017001800190020002100
Dem
and
(MW
)
HoursHOURLY DEMAND CURVE FOR 25.11.2000 (MAX PEAK DEMAND OF THE YEAR 2000-01)Grid Demand Hydro Thermal CPP Central Sector Export to APTRANSCO
Apr May June Jul Aug Sept Oct Nov Dec Jan Feb Mar2012-13 3167 3170 3233 3094 3411 3430 3351 3100 3233 3306 3372 35802013-14 3648 3551 3437 3578 3567 3620 3580 3319 3320 3603 3468 3705
0200400600800
10001200140016001800
Dem
and
(MW
)
Month
2012-13 2013-14
Annual Peak Demand : 2012-13 - 3580 MW 2013-14 - 3705 MW
Page - 5
-300-200-1000100200300400500600700800900100011001200130014001500160017001800190020002100
Dem
and
(MW
)
HoursHOURLY DEMAND CURVE FOR 25.11.2000 (MAX PEAK DEMAND OF THE YEAR 2000-01)Grid Demand Hydro Thermal CPP Central Sector Export to APTRANSCO
-300-200-1000100200300400500600700800900100011001200130014001500160017001800190020002100
Dem
and
(MW
)
HoursHOURLY DEMAND CURVE FOR 25.11.2000 (MAX PEAK DEMAND OF THE YEAR 2000-01)Grid Demand Hydro Thermal CPP Central Sector Export to APTRANSCO
-300-200-1000100200300400500600700800900100011001200130014001500160017001800190020002100
Dem
and
(MW
)
HoursHOURLY DEMAND CURVE FOR 25.11.2000 (MAX PEAK DEMAND OF THE YEAR 2000-01)Grid Demand Hydro Thermal CPP Central Sector Export to APTRANSCO
1200140016001800200022002400
Ener
gy D
eman
d (M
U)
COMPARISON OF MONTHLY ENERGY DEMAND (MU) EXCLUDING TRADING & RETURNBANKING POWER FOR THE YEAR ENDING 2012-13 & 2013-14
Page - 5
-300-200-1000100200300400500600700800900100011001200130014001500160017001800190020002100
Dem
and
(MW
)
HoursHOURLY DEMAND CURVE FOR 25.11.2000 (MAX PEAK DEMAND OF THE YEAR 2000-01)Grid Demand Hydro Thermal CPP Central Sector Export to APTRANSCO
-300-200-1000100200300400500600700800900100011001200130014001500160017001800190020002100
Dem
and
(MW
)
HoursHOURLY DEMAND CURVE FOR 25.11.2000 (MAX PEAK DEMAND OF THE YEAR 2000-01)Grid Demand Hydro Thermal CPP Central Sector Export to APTRANSCO
-300-200-1000100200300400500600700800900100011001200130014001500160017001800190020002100
Dem
and
(MW
)
HoursHOURLY DEMAND CURVE FOR 25.11.2000 (MAX PEAK DEMAND OF THE YEAR 2000-01)Grid Demand Hydro Thermal CPP Central Sector Export to APTRANSCO
Apr May June Jul Aug Sept Oct Nov Dec Jan Feb Mar2012-13 1909 2033 1882 1954 2047 2033 1896 1743 1789 1837 1682 20412013-14 2006 2100 1951 2082 2123 2071 1797 1728 1799 1894 1713 2059
0200400600800
10001200
Ener
gy D
eman
d (M
U)
Month
Annual Energy Demand : 2012-13 - 22845 MU 2013-14 - 23323 MU

19002000210022002300240025002600270028002900300031003200330034003500
Dem
and
(MW
)
DEMAND CURVE FOR HOURLY AVERAGE DEMAND EXCLUDING TRADING FOR YEAR ENDING MARCH 2014
Page - 6
1 2 3 4 5 6 7 8 9 10 11 12 13 14 15 16 17 18 19 20 21 22 23 24
Avg Demand 2588 2528 2497 2503 2593 2703 2635 2667 2684 2707 2725 2694 2609 2463 2447 2550 2625 2684 3019 3248 3247 3123 2907 2716
0100200300400500600700800900
1000110012001300140015001600170018001900
Dem
and
(MW
)
Hours
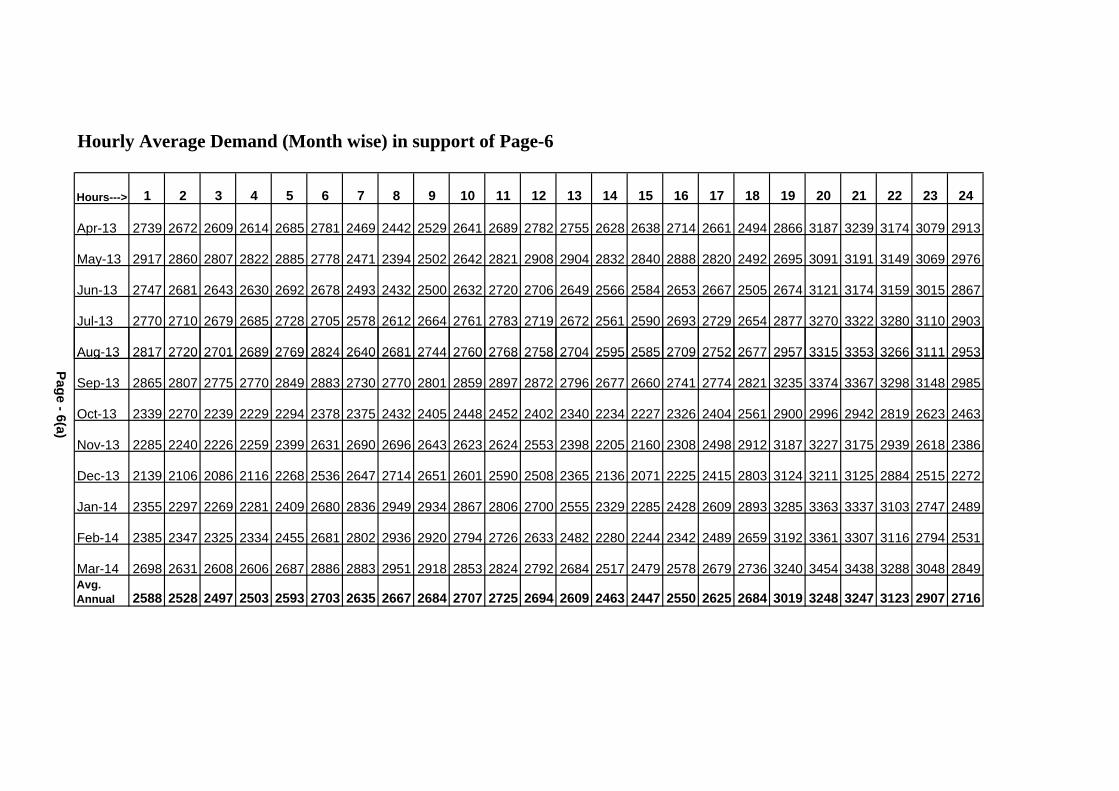
Hourly Average Demand (Month wise) in support of Page-6
Hours---> 1 2 3 4 5 6 7 8 9 10 11 12 13 14 15 16 17 18 19 20 21 22 23 24
Apr-13 2739 2672 2609 2614 2685 2781 2469 2442 2529 2641 2689 2782 2755 2628 2638 2714 2661 2494 2866 3187 3239 3174 3079 2913
May-13 2917 2860 2807 2822 2885 2778 2471 2394 2502 2642 2821 2908 2904 2832 2840 2888 2820 2492 2695 3091 3191 3149 3069 2976
Jun-13 2747 2681 2643 2630 2692 2678 2493 2432 2500 2632 2720 2706 2649 2566 2584 2653 2667 2505 2674 3121 3174 3159 3015 2867
Jul-13 2770 2710 2679 2685 2728 2705 2578 2612 2664 2761 2783 2719 2672 2561 2590 2693 2729 2654 2877 3270 3322 3280 3110 2903
Aug-13 2817 2720 2701 2689 2769 2824 2640 2681 2744 2760 2768 2758 2704 2595 2585 2709 2752 2677 2957 3315 3353 3266 3111 2953
Page - 6(a)
Aug-13 2817 2720 2701 2689 2769 2824 2640 2681 2744 2760 2768 2758 2704 2595 2585 2709 2752 2677 2957 3315 3353 3266 3111 2953
Sep-13 2865 2807 2775 2770 2849 2883 2730 2770 2801 2859 2897 2872 2796 2677 2660 2741 2774 2821 3235 3374 3367 3298 3148 2985
Oct-13 2339 2270 2239 2229 2294 2378 2375 2432 2405 2448 2452 2402 2340 2234 2227 2326 2404 2561 2900 2996 2942 2819 2623 2463
Nov-13 2285 2240 2226 2259 2399 2631 2690 2696 2643 2623 2624 2553 2398 2205 2160 2308 2498 2912 3187 3227 3175 2939 2618 2386
Dec-13 2139 2106 2086 2116 2268 2536 2647 2714 2651 2601 2590 2508 2365 2136 2071 2225 2415 2803 3124 3211 3125 2884 2515 2272
Jan-14 2355 2297 2269 2281 2409 2680 2836 2949 2934 2867 2806 2700 2555 2329 2285 2428 2609 2893 3285 3363 3337 3103 2747 2489
Feb-14 2385 2347 2325 2334 2455 2681 2802 2936 2920 2794 2726 2633 2482 2280 2244 2342 2489 2659 3192 3361 3307 3116 2794 2531
Mar-14 2698 2631 2608 2606 2687 2886 2883 2951 2918 2853 2824 2792 2684 2517 2479 2578 2679 2736 3240 3454 3438 3288 3048 2849Avg.Annual 2588 2528 2497 2503 2593 2703 2635 2667 2684 2707 2725 2694 2609 2463 2447 2550 2625 2684 3019 3248 3247 3123 2907 2716
Page - 6(a)

Page-7
1400160018002000220024002600280030003200340036003800
Dem
and
(MW
)HOURLY DEMAND CURVE FOR 27.03.2014 (MAX PEAK DEMAND OF THE YEAR (2013-14)
Page-7
Page-7
1 2 3 4 5 6 7 8 9 10 11 12 13 14 15 16 17 18 19 20 21 22 23 24
Grid Demand (Excluding Trading) 3058 2921 2974 3001 3024 3154 3080 3098 2956 2960 2927 3011 3024 2785 2752 2924 2921 2867 3485 3705 3667 3540 3354 3153
Hydro 732 873 949 937 834 915 982 942 858 813 899 948 739 553 432 612 644 455 982 1292 1252 1082 932 697
Thermal 806 802 804 805 803 795 800 794 798 798 772 774 794 751 776 752 735 752 748 767 753 749 755 778
CPP 869 739 548 572 559 601 611 556 536 569 559 570 701 724 830 891 882 840 860 919 912 917 929 797
Central Sector 651 508 673 687 828 843 687 806 764 779 696 719 790 758 714 670 660 820 896 728 750 791 738 882
Bilateral 199 117 111 110 112 111 270 182 200 245 244 231 286 244 268 326 258 210 202 273 274 278 253 147
0200400600800
100012001400D
eman
d (M
W)
Hours
Grid Demand (Excluding Trading) Hydro Thermal CPP Central Sector Bilateral
Page-7

Page
-8
10001200140016001800200022002400260028003000
Dem
and
(MW
)
HOURLY DEMAND CURVE FOR 19.04.2013 (MIN PEAK DEMAND OF THE YEAR 2013-14)
Page
-8
1 2 3 4 5 6 7 8 9 10 11 12 13 14 15 16 17 18 19 20 21 22 23 24
Grid Demand (Excluding Trading) 2561 2528 2488 2524 2630 2647 2403 2384 2703 2647 2498 2521 2399 2221 2208 2255 2110 1850 1995 1969 2091 2295 2354 2234
Hydro 1137 952 891 900 1027 1295 850 640 832 1139 1024 1010 905 875 805 877 697 547 482 631 515 586 572 544
Thermal 621 636 635 652 637 654 670 671 666 681 678 670 664 671 660 672 662 669 675 666 666 664 676 665
CPP 780 818 800 833 785 788 799 757 778 754 769 808 770 629 670 589 369 328 452 597 622 668 748 736
Central 22.60 122.3 162.3 139.3 181.2 -89.8 84.15 316.1 427.5 73.42 27.69 34.01 60.06 46.06 73.50 116.7 382.5 305.5 385.1 74.95 287.6 376.2 358.0 289.0
Bilateral 227 223 223 223 223 476 476 476 476 476 223 223 223 223 223 223 223 223 223 494 499 480 480 499
-600-400-200
0200400600800
1000
Dem
and
(MW
)
Hours
Grid Demand (Excluding Trading) Hydro Thermal CPP Central Bilateral

1
Installed Energy Energy Drawalcapacity Generation (incl. Aux) by GRIDCO
(MW) (MU) (MU)A. STATE SECTOROHPC(Hydro)* 2084.875 7209.791 7014.530OPGC (Thermal) 420 2855.902 2544.841TTPS (Thermal) 460 3828.813 3406.497TTPS (UI-OD) 16.448IPPs 3329.167CPP (Synchronised to OPTCL System) 779.519Renewable Energy Including Co-gen - 433.913B. CENTRAL SECTOR
Orissa Share Hydro
Thermal199.00884.60 - 7537.977
C. Banking Power+OA+Trading+IEX (Import) 128.759
TOTAL DRAWAL 25191.653D. Banking Power+OA+Trading+IEX (Export) 1668.616
E. Export to EREB 200.330 Net GRIDCO demand 23322.707
Export to ICCL 0.000 Export to NALCO 3.297
INSTALLED CAPACITY (AS ON 31.3.2014) ENERGY GENERATION / ENERGYDRAWAL BY OPTCL
Page - 9
Export to NALCO 3.297
* Includes Orissa share from Machhkund.
2 TRANSMISSION LINES AND SUBSTATIONSAs on Capacity Addition As on
31.03.2013 in 2013-2014 1.4.2014
A. 400 kV line (ckt.km) 518.234 0.000 518.234B. 220kV line (ckt.km) 5585.988 144.346 5730.334C. 132kV line (ckt.km) 5281.856 174.055 5455.911
D. Substations 400 / 220 /132kV (nos.) 2 0 2 220/132/33kV (nos.) 16 1 17
220/33kV (nos.) 4 1 5
132/33/11kV (nos.) 63 4 67
132kV Switching Stations (OPTCL) 3 0 3 132kV LILO Switching Stations of Industries
13 1 14
Total 101 7 108
Note: 1. 220/132kV Lapanga Grid S/s has been newly added.2. 220/33kV Laxmipur Grid S/s has been newly added.3. 132/33kV Kuchinda,Purusottampur,Chandpur,Barbil Grid S/ss have been newly added.4. 132kV LILO Switching station "Maheswari Ispat" has been disconnected and "B.C.Mohanty & Sons" newly added.Note: 1. (The above data in (2) are received from O & M branch of OPTCL system.)
Page - 9

3 PERFORMANCE OF OPTCL DURING 2013 - 14
3 A. POWER SUPPLY SECURITY3 A.1 Load Restriction due to non-availability of Generation / Failure of generating Stations.
Duration 1st Qtr. 2nd Qtr. 3rd Qtr. 4th Qtr. Annual(In Hrs) 3.00 0.00 10.33 0.00 13.33Percentage(%) 0.14 0.00 0.47 0.00 0.15
* Load restriction imposed in the State on rotation basis to curtail the demand.3 B. TRANSMISSION SECURITY3 B.1 Load Restriction due to non-availability of Transmission capacity
Duration 1st Qtr. 2nd Qtr. 3rd Qtr. 4th Qtr. Annual(In Hrs) 0 0 0.00 0 0Percentage(%) 0.00 0.00 0.00 0.00 0.00
3 B.2 Rescheduling of Generation due to non- availability of Transmission capacity
Duration 1st Qtr. 2nd Qtr. 3rd Qtr. 4th Qtr. Annual(In Hrs) 0 0 0 0 0Percentage(%) 0 0 0 0 0
3 C OVERALL PERFORMANCE3 C-1 FREQUENCY
(i) Above 50.2 Hz
Page-10
(i) Above 50.2 HzDuration 1st Qtr. 2nd Qtr. 3rd Qtr. 4th Qtr. Annual(In Hrs) 280.42 435.70 209.42 198.48 1124.02Percentage(%) 12.84 19.73 9.48 9.19 12.83
(ii) Maximum continous period beyond 50.2 HzDuration 1st Qtr. 2nd Qtr. 3rd Qtr. 4th Qtr. Annual(In Hrs) 4.25 5.55 4.47 4.85 5.55Percentage(%) 0.19 0.25 0.20 0.22 0.06
(iii) Maximum Frequency occurrence
Duration 1st Qtr. 2nd Qtr. 3rd Qtr. 4th Qtr. AnnualHz 50.98 50.74 50.61 50.72 50.98Date/Time 12.05.13 15.08.13 11.10.13 18.01.14 12.05.13
17:39hr 08:02hr 8:03hr 03:03hr 17:39hr
(iv) Below 49.7 HzDuration 1st Qtr. 2nd Qtr. 3rd Qtr. 4th Qtr. Annual(In Hrs) 37.48 18.17 28.75 2.57 86.97Percentage(%) 1.72 0.82 1.30 0.12 0.99
(v) Maxm. Continous period below 49.7 HzDuration 1st Qtr. 2nd Qtr. 3rd Qtr. 4th Qtr. Annual(In Hrs) 0.78 0.47 0.45 0.35 0.78Percentage(%) 0.04 0.02 0.02 0.02 0.01
(vi) Lowest Frequency OccurrenceDuration 1st Qtr. 2nd Qtr. 3rd Qtr. 4th Qtr. AnnualHz 49.04 49.04 49.28 49.32 49.04Date/Time 18.06.13 05.07.13 14.10.13 12.03.14 18.06.13
21:19 hr 19:46 hr 18:11hr 19:26hr 21:19 hr
Page-10

3. C - 2 VOLTAGE PROFILE ( 2013-2014 )MAXIMUM VOLTAGES OF MAJOR GRID SUB-STATIONS. ( 220kV )
Quarter - 1 Quarter - 2 Quarter - 3 Quarter - 4 ANNUAL
Voltagein kV Date Time in
Hrs.Voltage
in kV Date Time inHrs.
Voltagein kV Date Time in
Hrs.Voltage
in kV Date Time inHrs.
Voltagein kV Date Time in
Hrs.
1 Jaynagar 250 13.06.13 06:00 252 21.08.13 04:00 254 12.10.13 07:00 250 27.01.14 24:00 254 12.10.13 07:002 Duburi 242 07.05.13 06:00 240 19.09.13 01:00 245 13.10.13 12:00 240 01.01.14 01:00 245 13.10.13 12:003 Joda 237 31.05.13 08:00 240 21.09.13 14:00 243 13.10.13 11:00 236 14.01.14 05:00 243 13.10.13 11:004 Tarkera 242 14.04.13 02:00 237 01.07.13 07:00 240 13.10.13 06:00 237 12.01.14 24:00 242 14.04.13 02:005 Budhipadar 248 14.04.13 02:00 241 18.07.13 08:00 249 13.10.13 07:00 239 23.02.14 24:00 249 13.10.13 07:006 Balasore 245 03.05.13 18:00 240 21.08.13 06:00 245 13.10.13 09:00 240 24.01.14 11:00 245 03.05.13 18:007 Narendrapur 242 22.04.13 07:00 244 29.09.13 06:00 254 05.11.13 14:00 246 03.01.14 11:00 254 05.11.13 14:008 Chandaka 239 08.05.13 07:00 233 20.09.13 06:00 237 11.10.13 17:00 234 01.01.14 24:00 239 08.05.13 07:009 Bhanjanagar 237 21.04.13 15:00 240 21.09.13 06:00 272 12.10.13 06:00 236 06.01.14 16:00 272 12.10.13 06:00
10 Theruvali 248 20.04.13 01:00 248 21.09.13 07:00 261 12.10.13 07:00 247 05.01.14 14:00 261 12.10.13 07:0011 Meramundali 234 21.04.13 15:00 234 30.07.13 17:00 240 12.10.13 16:00 233 06.01.14 23:00 240 12.10.13 16:0012 Bidanasi 238 07.05.13 06:00 236 16.09.13 14:00 238 01.12.13 14:00 237 08.01.14 03:00 238 07.05.13 06:0013 Katapalli 258 14.04.13 01:00 241 17.09.13 07:00 253 13.10.13 08:00 239 16.02.14 07:00 258 14.04.13 01:0014 Bhadrak 244 07.05.13 06:00 245 27.09.13 15:00 250 13.10.13 24:00 243 09.01.14 14:00 250 13.10.13 24:0015 Paradeep 250 21.04.13 16:00 244 11.08.13 08:00 244 25.11.13 03:00 239 10.01.14 24:00 250 21.04.13 16:00
Sl.No.
Name of the Sub-station
15 Paradeep 250 21.04.13 16:00 244 11.08.13 08:00 244 25.11.13 03:00 239 10.01.14 24:00 250 21.04.13 16:0016 Bolangir 256 14.04.13 15:00 244 30.09.13 19:00 251 13.10.13 14:00 244 23.02.14 22:00 256 14.04.13 15:0017 Mendhasal 240 21.04.13 16:00 238 21.09.13 01:00 240 21.10.13 16:00 238 12.01.14 01:00 240 21.04.13 16:00
MINIMUM VOLTAGES OF MAJOR GRID SUB-STATIONS. ( 220kV )
Quarter - 1 Quarter - 2 Quarter - 3 Quarter - 4 ANNUAL
Voltagein kV Date Time in
Hrs.Voltage
in kV Date Time inHrs.
Voltagein kV Date Time in
Hrs.Voltage
in kV Date Time inHrs.
Voltagein kV Date Time in
Hrs.
1 Jaynagar 231 06.05.13 20:00 229 09.07.13 09:00 232 11.12.13 19:00 232 19.01.14 18:00 229 09.07.13 09:002 Duburi 216 24.05.13 19:00 213 10.09.13 21:00 220 01.10.13 19:00 210 20.03.14 21:00 210 20.03.14 21:003 Joda 215 29.04.13 21:00 216 26.09.13 19:00 220 04.10.13 21:00 205 29.03.14 20:00 205 29.03.14 20:004 Tarkera 223 25.05.13 20:00 227 03.08.13 22:00 227 06.10.13 20:00 225 14.02.14 20:00 223 25.05.13 20:005 Budhipadar 227 08.05.13 16:00 225 27.09.13 11:00 218 12.11.13 20:00 219 07.03.14 02:00 218 12.11.13 20:006 Balasore 212 10.06.13 20:00 210 02.08.13 19:00 217 04.10.13 20:00 212 20.03.14 20:00 210 02.08.13 19:007 Narendrapur 187 24.05.13 20:00 207 03.09.13 11:00 200 25.12.13 19:00 200 02.01.14 18:00 187 24.05.13 20:008 Chandaka 196 07.05.13 04:00 207 14.09.13 21:00 209 24.11.13 10:00 208 28.03.14 19:00 196 07.05.13 04:009 Bhanjanagar 210 07.05.13 21:00 210 14.09.13 19:00 211 24.11.13 19:00 212 06.01.14 19:00 210 07.05.13 21:00
10 Theruvali 220 08.05.13 20:00 221 02.08.13 19:00 228 05.10.13 20:00 227 26.02.14 20:00 220 08.05.13 20:0011 Meramundali 220 29.04.13 21:00 216 26.09.13 21:00 213 09.10.13 18:00 214 28.03.14 20:00 213 09.10.13 18:0012 Bidanasi 209 11.05.13 20:00 208 05.09.13 19:00 211 29.10.13 21:00 204 29.03.14 20:00 204 29.03.14 20:0013 Katapalli 221 13.04.13 16:00 224 25.08.13 20:00 220 19.10.13 20:00 216 24.03.14 21:00 216 24.03.14 21:0014 Bhadrak 205 10.06.13 20:00 210 04.07.13 17:00 217 04.10.13 20:00 194 31.03.14 19:00 194 31.03.14 19:0015 Paradeep 205 01.06.13 19:00 206 26.08.13 21:00 209 04.10.13 18:00 209 19.01.14 18:00 205 01.06.13 19:00
Page - 11 Sl.
No.Name of the Sub-station
15 Paradeep 205 01.06.13 19:00 206 26.08.13 21:00 209 04.10.13 18:00 209 19.01.14 18:00 205 01.06.13 19:0016 Bolangir 210 12.04.13 19:00 214 20.08.13 20:00 210 21.12.13 20:00 211 06.02.14 19:00 210 12.04.13 19:0017 Mendhasal 211 02.05.13 22:00 207 24.09.13 19:00 215 13.10.13 21:00 213 28.03.14 20:00 207 24.09.13 19:00
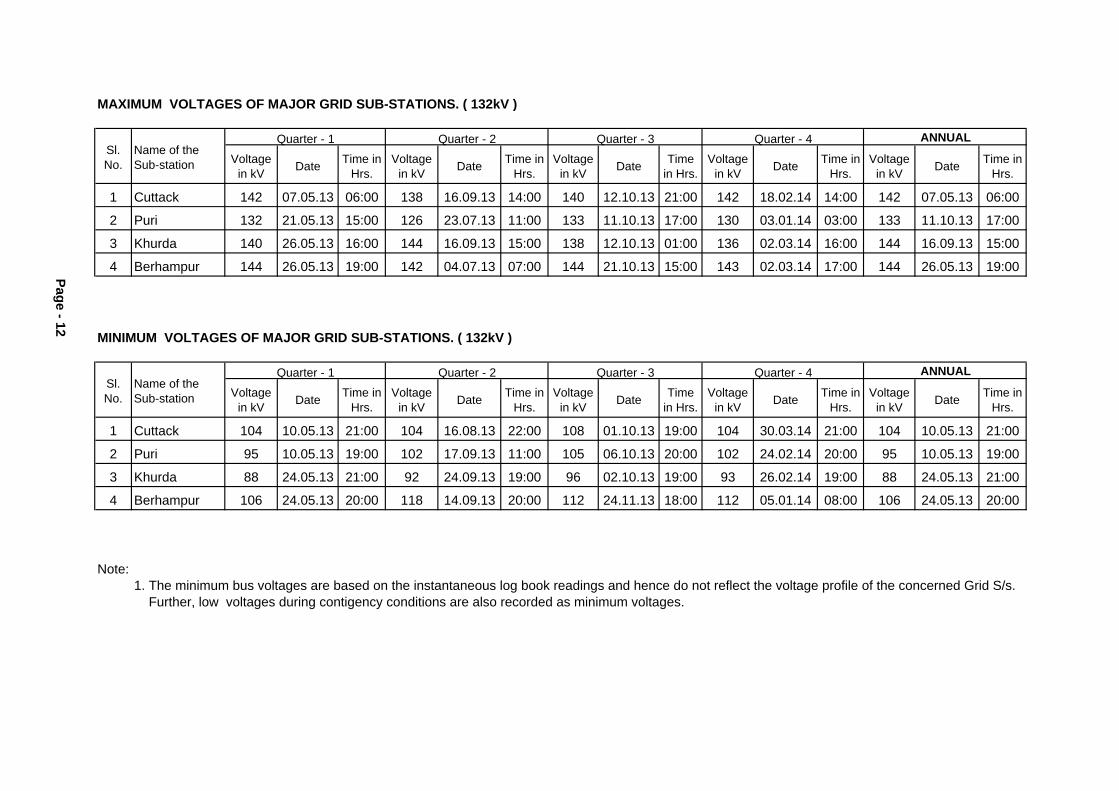
MAXIMUM VOLTAGES OF MAJOR GRID SUB-STATIONS. ( 132kV )
Quarter - 1 Quarter - 2 Quarter - 3 Quarter - 4
Voltagein kV Date Time in
Hrs.Voltage
in kV Date Time inHrs.
Voltagein kV Date Time
in Hrs.Voltage
in kV Date Time inHrs.
Voltagein kV Date Time in
Hrs.
1 Cuttack 142 07.05.13 06:00 138 16.09.13 14:00 140 12.10.13 21:00 142 18.02.14 14:00 142 07.05.13 06:00
2 Puri 132 21.05.13 15:00 126 23.07.13 11:00 133 11.10.13 17:00 130 03.01.14 03:00 133 11.10.13 17:00
3 Khurda 140 26.05.13 16:00 144 16.09.13 15:00 138 12.10.13 01:00 136 02.03.14 16:00 144 16.09.13 15:00
4 Berhampur 144 26.05.13 19:00 142 04.07.13 07:00 144 21.10.13 15:00 143 02.03.14 17:00 144 26.05.13 19:00
MINIMUM VOLTAGES OF MAJOR GRID SUB-STATIONS. ( 132kV )
Page - 12
Sl.No.
Name of theSub-station
ANNUAL
ANNUAL
Sl.No.
Name of theSub-station
Quarter - 1 Quarter - 2 Quarter - 3 Quarter - 4
Voltagein kV Date Time in
Hrs.Voltage
in kV Date Time inHrs.
Voltagein kV Date Time
in Hrs.Voltage
in kV Date Time inHrs.
Voltagein kV Date Time in
Hrs.
1 Cuttack 104 10.05.13 21:00 104 16.08.13 22:00 108 01.10.13 19:00 104 30.03.14 21:00 104 10.05.13 21:00
2 Puri 95 10.05.13 19:00 102 17.09.13 11:00 105 06.10.13 20:00 102 24.02.14 20:00 95 10.05.13 19:00
3 Khurda 88 24.05.13 21:00 92 24.09.13 19:00 96 02.10.13 19:00 93 26.02.14 19:00 88 24.05.13 21:00
4 Berhampur 106 24.05.13 20:00 118 14.09.13 20:00 112 24.11.13 18:00 112 05.01.14 08:00 106 24.05.13 20:00
Note:1. The minimum bus voltages are based on the instantaneous log book readings and hence do not reflect the voltage profile of the concerned Grid S/s. Further, low voltages during contigency conditions are also recorded as minimum voltages.
Sl.No.
Name of theSub-station
ANNUAL

Page - 13
258 252
272
250
272
187
206
200 194 187200
250
300
OVERALL PERFORMANCE VOLTAGE AT 220kV
Maximum (kV)
Minimum (kV)(123.6%) (123.6%)
(114.5%) (113.6%)
(93.6%)(90.9%) (88.2%)(85%)
(117.3 %)
(85%)
Page - 13
187
0
50
100
150
200
1st Qtr. 2nd Qtr. 3rd Qtr. 4th Qtr. Annual
kV

Page-14
144 144 144 143 144
8892
96 9388
100
120
140
160
OVERALL PERFORMANCE VOLTAGE AT 132 kV
Maximum (kV)
Minimum (kV)
(109.1%)
(69.7%)(66.7%)
(108.3%)(109.1%)(109.1%) (109.1%)
(72.7%) (70.5%)(66.7%)
Page-14
8892 93
88
0
20
40
60
80
100
1st Qtr. 2nd Qtr. 3rd Qtr. 4th Qtr. Annual
kV

Page-15 25%
30%35%40%45%50%55%60%65%70%75%80%85%90%95%
100%
Perc
enta
ge ti
me
occu
renc
e
Frequency Performance
>=51.0Hz
50.20 - 51.00Hz
Page-15
0%5%
10%15%20%25%
Perc
enta
ge ti
me
occu
renc
e
Months
Apr-13 May-13 Jun-13 Jul-13 Aug-13 Sep-13 Oct-13 Nov-13 Dec-13 Jan-14 Feb-14 Mar-14
>=51.0Hz 0.00 0.00 0.00 0.00 0.00 0.00 0.00 0.00 0.00 0.00 0.00 0.0050.20 - 51.00Hz 6.40 13.38 18.72 16.90 32.43 9.54 10.39 8.23 9.79 14.24 10.69 3.3549.70 - 50.00Hz 52.12 37.09 33.45 27.91 16.41 42.81 36.45 44.81 45.28 33.89 40.50 48.8749.00 - 49.70Hz 3.14 0.69 1.36 0.45 0.45 1.58 0.89 1.14 1.88 0.34 0.35 0.2848.5 - 49.0Hz 0.00 0.00 0.00 0.00 0.00 0.00 0.00 0.00 0.00 0.00 0.00 0.00<48.5Hz 0.00 0.00 0.00 0.00 0.00 0.00 0.00 0.00 0.00 0.00 0.00 0.00
49.70 - 50.00Hz
49.00 - 49.70Hz
48.5 - 49.0Hz
<48.5Hz

INTERRUPTION DUE TO MAJOR INCIDENTIncident Duration of Interruption No. of InterruptionSnapping of Jumper /Conductor / Earth wire 64:30:00 73
Insulator Failure 52:16:00 55
Bursting of CT / PT 3:44:00 9
Breaker Problem 5:49:00 11
System Disturbance 6:19:00 14
Failure of LA 9:19:00 35
Others 854:33:00 98The duration of interruption indicated above is the sum total of interruptionsoccurred at different areas(S/s) during the year. However there was no totalblackout experienced for the State during the year 2013-14.
Page - 16
The duration of interruption indicated above is the sum total of interruptionsoccurred at different areas(S/s) during the year. However there was no totalblackout experienced for the State during the year 2013-14.
Page - 16
INTERRUPTION (HRS) DUE TO MAJOR INCIDENT DURING 2013-14
Snapping of Jumper / Conductor /Earth wire
Insulator Failure
Bursting of CT / PT
Breaker Problem
System Disturbance
Failure of LA
OthersOthers