Embed Size (px)
Citation preview
Performance of Sustainable Self-Compacting FiberReinforced Concrete with Substitution of MarbleWaste (MW) and Coconut �bers (CFs)jawad Ahmad ( [email protected] )
National University of Sciences and TechnologyFahad Aslam
Department of Civil Engineering, College of Engineering in Al-Kharj, Prince Sattam BinAbdulaziz,University, Al-Kharj 11942, Saudi Arabia
Research Article
Keywords: Rheological properties, Statistical analysis (RSM), Coconut �ber, Filing and passing ability,compressive Strength
Posted Date: August 23rd, 2021
DOI: https://doi.org/10.21203/rs.3.rs-820873/v1
License: This work is licensed under a Creative Commons Attribution 4.0 International License. Read Full License
Version of Record: A version of this preprint was published at Scienti�c Reports on November 30th, 2021.See the published version at https://doi.org/10.1038/s41598-021-01931-x.
Performance of Sustainable Self-Compacting Fiber Reinforced Concrete with
Substitution of Marble Waste (MW) and Coconut fibers (CFs)
Jawad Ahmad*1, Fahad Aslam1.
1 Department of Civil Engineering, Military College of Engineering, Risalpur, Pakistan.
Corresponding author mail: [email protected]
Abstract: - Self compacting concrete (SSC) is also brittle nature, resulting in abrupt failure without giving
any warning, which is unacceptable for any construction materials. Therefore, SCC requires tensile
reinforcement to increase tensile capacity and avoid the undesirable brittle failure of SCC. However, fiber
improved tensile capacity more efficiently than compressive strength. Therefore, it important add pozzolanic
material to fiber reinforced concrete to obtain high strength, durable and ductile concrete. This research is
carried out to evaluate the qualities of concrete with addition of waste marble and coconut fiber in concrete.
Marble waste used as binding (pozzolanic) materials in proportion of 5.0 to 30% by weight of cement in
increment of 5.0% and concrete is reinforced with coconut fiber in proportion of 0.5% to 3.0% by weight of
cement in increment of 0.5 %. Rheological properties were assessed through its passing ability and
flowability by using Slump flow, Slump T50, L-Box, and V-funnel tests while mechanical performance were
evaluated through compressive, split tensile, flexure and pull out tests. Tests results indicate that marble
waste and coconut fiber decrease the passing ability and filling ability of SCC. Furthermore, tests results
indicate that marble waste up to 20% and coconut fiber addition 2.0% by weight of cement have a tendency
to enhance the mechanical strength of SCC. Finally, Statistical analysis (RSM) was used to optimize the
combined substitution of marble waste and coconut fiber to obtain high strength concrete.
Keywords: - Rheological properties, Statistical analysis (RSM), Coconut fiber, Filing and passing ability,
compressive Strength.
1 Introduction
Self compacting concrete is particular types of concrete which is flowable , non segregated and by its own
mass spread into place and fill the formwork even in the presence of congested reinforcement. [1]. In 1986,
the concept about SSC was proposed [2]. But 1988 Japan was first country which was successfully able to
develop the prototype of self compacting concrete (SCC).
The concept of environmental development believes that environmental reserves must be considered as
restricted goods and the wastes must be reasonably controlled. Growing quantities of accumulated
garbage, up to 2500 million tons per year over the world [3] which promote the scholar to a built modern
technique of dumping. In the cement production industry, there are several opportunities to utilized waste
raw material in concrete [4]. Waste can be utilized as fine or coarse aggregate or cement in concrete.
For a good quality concrete mix, fine aggregates must be clean, hard, strong, and free of immersed
chemicals and more fine materials that may possibly produce the weakening of concrete. Unluckily, the
majority of the natural sand utilized is either rolled sand, sand of river, dune sand, and sea sand is chosen
for the economy and the accessibility [5]. Properties of sand disturb the strength performance of concrete,
as sand is an important ingredient of concrete.
Various productions are the cause of waste which are created as a byproduct during the production
procedure. It is recommended that Marble be able to be utilized in the building production to make Cement
Concrete [6]. The aim of this article is to utilized waste marble as a partially substitution of sand which takes
from the marble factory. Real estimate about the amount of waste generated in Pakistan from the marble
industry are unavailable since it is not analyzed or supervised by the government or any other political party.
More references assess that 20 to 25% of the marble delivered in the form of slurry through the cut off
procedure [7]. These marble wastes are present in the environment and cause to pollution.
Subsequently ancient occasions marble has been commonly utilized as a cementitious material in cement
concrete. The factories disposing of the marble residue material, which contain of a extremely fine ash,
currently comprises one of the ecological problem throughout the world [8]. Management of the marble
powder in various factories regions particularly the paper, agriculture, glass, and building factories would
assist to care for the environment [9]. Through the quarrying procedure and in the cleaning of marble dust,
marble powder is seen as a rubbish material [10].
Numerous established nations have set in action permissible rules about the recovery of factories l waste
trying to decrease the quantity of rubbish and to guarantee rubbish reprocessing [11]. Let consider the
sample of Japan in visible of us, a nation that effectively improved the reprocessing rate of concrete waste
up to 98% utilizing waste material as aggregate [12]. It has been identified that the Marble powder delivered
through treating corresponds to almost 40 percent of the finishing product from the marble factory [13].
They also described that workability of concrete reduce with the supplement of marble powder. Katuwal et
al also suggest that marble as a fine aggregate reduce workability of concrete [14]. They detected that
compressive strength is enhanced up to 50 percent substitute of fine aggregate with marble dust which is
almost 12 percent greater than from reference concrete [15]. Compressive strength and flexural strength
of concrete are improved almost 28 percent and 13 percent correspondingly at 50 percent substitution and
then steadily decline with the supplement of marble dust [16]. Opposition to the acid of concrete including
marble dust was slightly less in comparison to reference concrete [17]. It has been Indicated that Marble
dust can be easily utilized in the cement concrete production [6]. Although marble increase mechanical
performance of concrete considerably, but still concrete has less tensile strength which result brittle failure.
Therefore, concrete still some of tensile reinforcement to improve tensile capacity. Fibers is one of the most
prevalent method to enhance tensile capacity of concrete.
Through extensive research, it has been determined that the performance of concrete were significantly
increased because of the addition of fibers to concrete [18–21]. Improving the production technique of SCC
is increasing day by day in concrete production [22]. ACI 544.5R-10 stated that thick fibers are lower
efficient in reducing the plastic shrinkage cracks width as compare to thin fibers [23]. Most thin diameter
microfibers are particularly effective in reducing plastic shrinkage cracking of concrete because larger
surface area of fibers [24]. Moreover, the use of fibers helps in reducing the porosity and bleeding of
concrete [25–28].
Various kinds of fibers are utilized to reinforce concrete such organic and inorganic fibers [29]. The choice
of the kind of fibers is depends on different aspects such area, length, tensile strength modulus of elasticity
and the material from which it is made. Furthermore the amount to which these fibers effect the
performance of concrete [30]. Mostly fibers are classified into two types, one is metallic and the other one
is nonmetallic. Metallic fibers are mainly steel fibers whereas nonmetallic are glass fiber, propylene fiber,
carbon fibers [31].
Research Significance
In existing literature shows that the fibers increased mechanical performance of concrete particular tensile
strength more effectively than compressive strength. Ahmad et [32] used steel fiber in concrete and reported
steel fiber increased tensile strength more effectively than compressive strength. Further research was
recommended [32] that pozzolanic materials must be added to fiber reinforced concrete to achieved high
strength , durable and ductile concrete. Also reported that steel fibers are too costly as well as easily
corroded. Therefore, the primary objective of this research is to utilize marble waste in SCC. Secondary
objective of this research is utilizing coconut fibers instead of steel fibers which are costly as well as easily
corroded. Third objective of this is research was to optimized substitution ratio of marble waste and coconut
fibers with help of statistical analysis (RSM) to achieved high strength self-compacting concrete. Finally
experimental results and predicted results from statistical analysis (RSM) will be compared.
2.1 Materials
2.1.1 Cement
Normal setting time cement as per according to ASTM C150 [33], were used as binding material throughout
in this study. Furthermore, different its aspects were given Table 1.
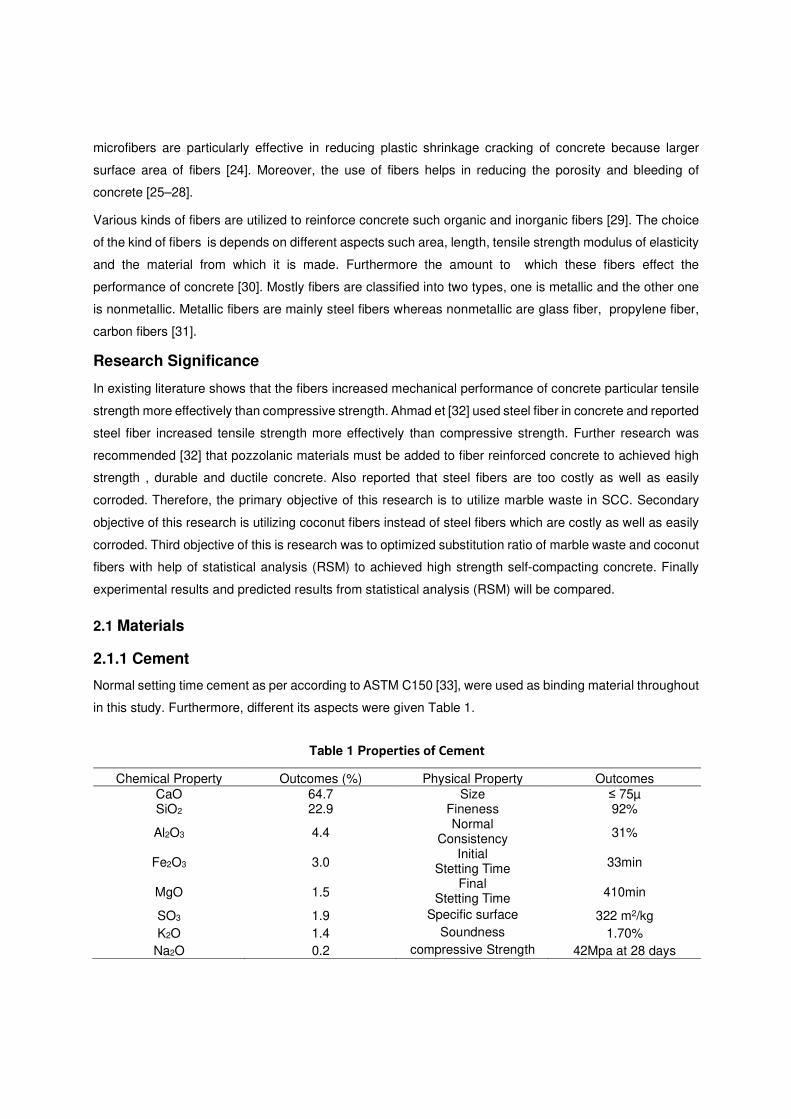
Table 1 Properties of Cement
Chemical Property Outcomes (%) Physical Property Outcomes CaO 64.7 Size ≤ 75µ SiO2 22.9 Fineness 92%
Al2O3 4.4 Normal
Consistency 31%
Fe2O3 3.0 Initial
Stetting Time 33min
MgO 1.5 Final
Stetting Time 410min
SO3 1.9 Specific surface 322 m2/kg K2O 1.4 Soundness 1.70%
Na2O 0.2 compressive Strength 42Mpa at 28 days
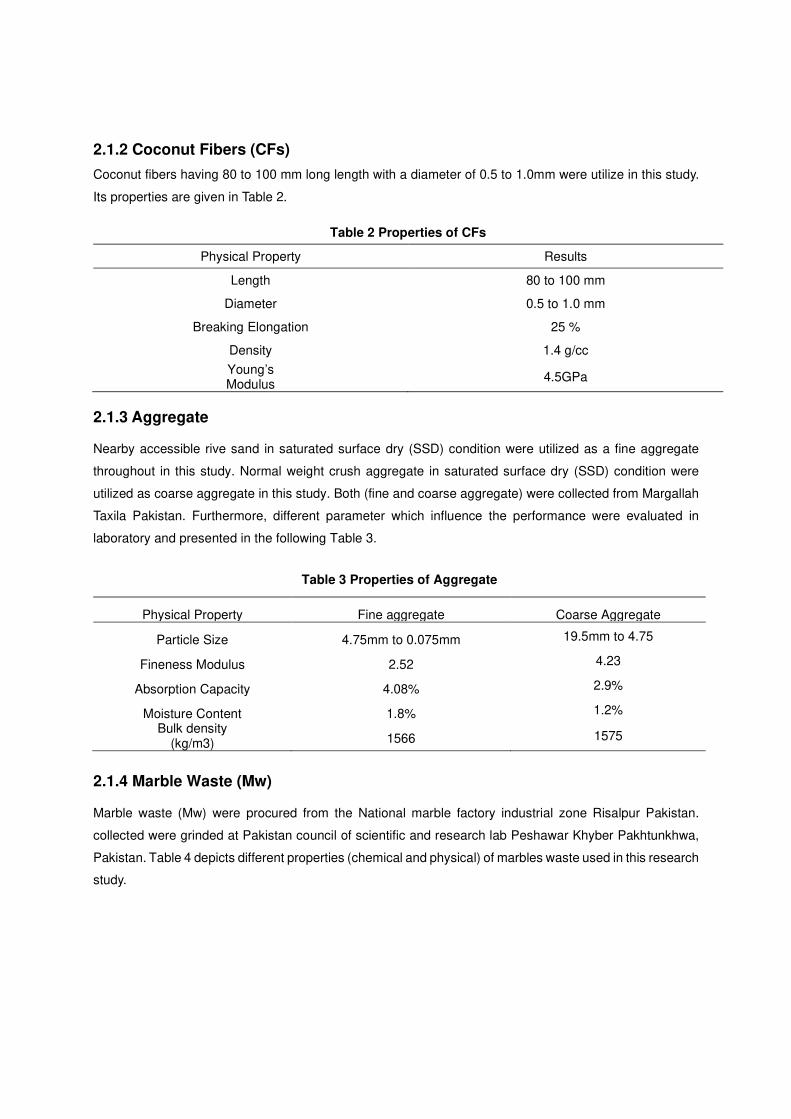
2.1.2 Coconut Fibers (CFs)
Coconut fibers having 80 to 100 mm long length with a diameter of 0.5 to 1.0mm were utilize in this study.
Its properties are given in Table 2.
2.1.3 Aggregate
Nearby accessible rive sand in saturated surface dry (SSD) condition were utilized as a fine aggregate
throughout in this study. Normal weight crush aggregate in saturated surface dry (SSD) condition were
utilized as coarse aggregate in this study. Both (fine and coarse aggregate) were collected from Margallah
Taxila Pakistan. Furthermore, different parameter which influence the performance were evaluated in
laboratory and presented in the following Table 3.
2.1.4 Marble Waste (Mw)
Marble waste (Mw) were procured from the National marble factory industrial zone Risalpur Pakistan.
collected were grinded at Pakistan council of scientific and research lab Peshawar Khyber Pakhtunkhwa,
Pakistan. Table 4 depicts different properties (chemical and physical) of marbles waste used in this research
study.
Table 2 Properties of CFs
Physical Property Results
Length 80 to 100 mm
Diameter 0.5 to 1.0 mm
Breaking Elongation 25 %
Density 1.4 g/cc
Young’s Modulus
4.5GPa
Table 3 Properties of Aggregate
Physical Property Fine aggregate Coarse Aggregate
Particle Size 4.75mm to 0.075mm 19.5mm to 4.75
Fineness Modulus 2.52 4.23
Absorption Capacity 4.08% 2.9%
Moisture Content 1.8% 1.2%
Bulk density (kg/m3) 1566 1575
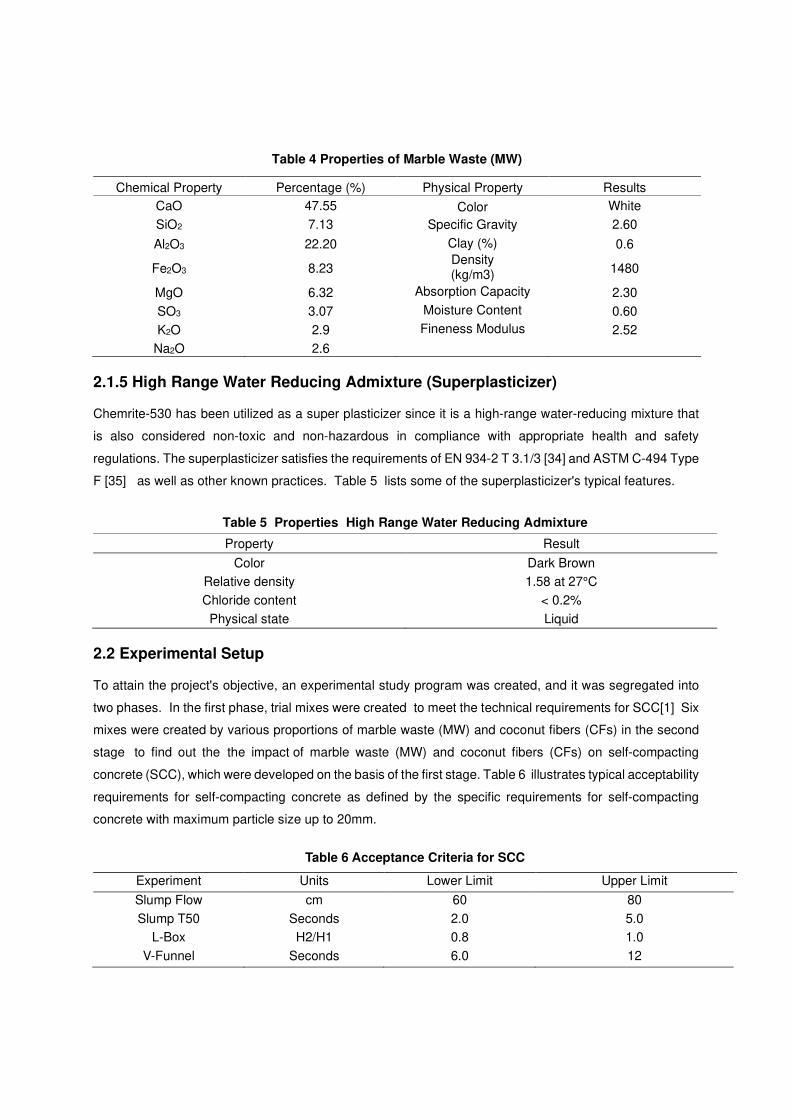
2.1.5 High Range Water Reducing Admixture (Superplasticizer)
Chemrite-530 has been utilized as a super plasticizer since it is a high-range water-reducing mixture that
is also considered non-toxic and non-hazardous in compliance with appropriate health and safety
regulations. The superplasticizer satisfies the requirements of EN 934-2 T 3.1/3 [34] and ASTM C-494 Type
F [35] as well as other known practices. Table 5 lists some of the superplasticizer's typical features.
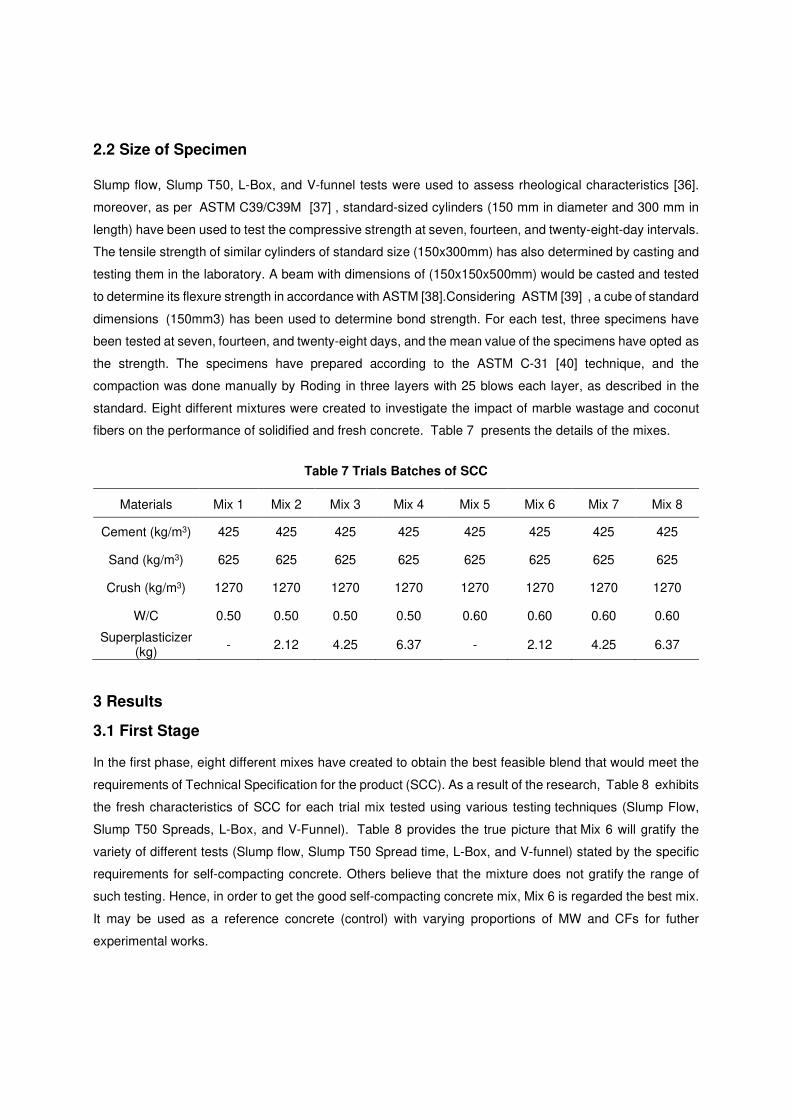
2.2 Experimental Setup
To attain the project's objective, an experimental study program was created, and it was segregated into
two phases. In the first phase, trial mixes were created to meet the technical requirements for SCC[1] Six
mixes were created by various proportions of marble waste (MW) and coconut fibers (CFs) in the second
stage to find out the the impact of marble waste (MW) and coconut fibers (CFs) on self-compacting
concrete (SCC), which were developed on the basis of the first stage. Table 6 illustrates typical acceptability
requirements for self-compacting concrete as defined by the specific requirements for self-compacting
concrete with maximum particle size up to 20mm.
Table 4 Properties of Marble Waste (MW)
Chemical Property Percentage (%) Physical Property Results CaO 47.55 Color White
SiO2 7.13 Specific Gravity 2.60
Al2O3 22.20 Clay (%) 0.6
Fe2O3 8.23 Density (kg/m3) 1480
MgO 6.32 Absorption Capacity 2.30
SO3 3.07 Moisture Content 0.60
K2O 2.9 Fineness Modulus 2.52
Na2O 2.6
Table 5 Properties High Range Water Reducing Admixture
Property Result
Color Dark Brown
Relative density 1.58 at 27°C
Chloride content < 0.2%
Physical state Liquid
Table 6 Acceptance Criteria for SCC
Experiment Units Lower Limit Upper Limit
Slump Flow cm 60 80
Slump T50 Seconds 2.0 5.0
L-Box H2/H1 0.8 1.0
V-Funnel Seconds 6.0 12
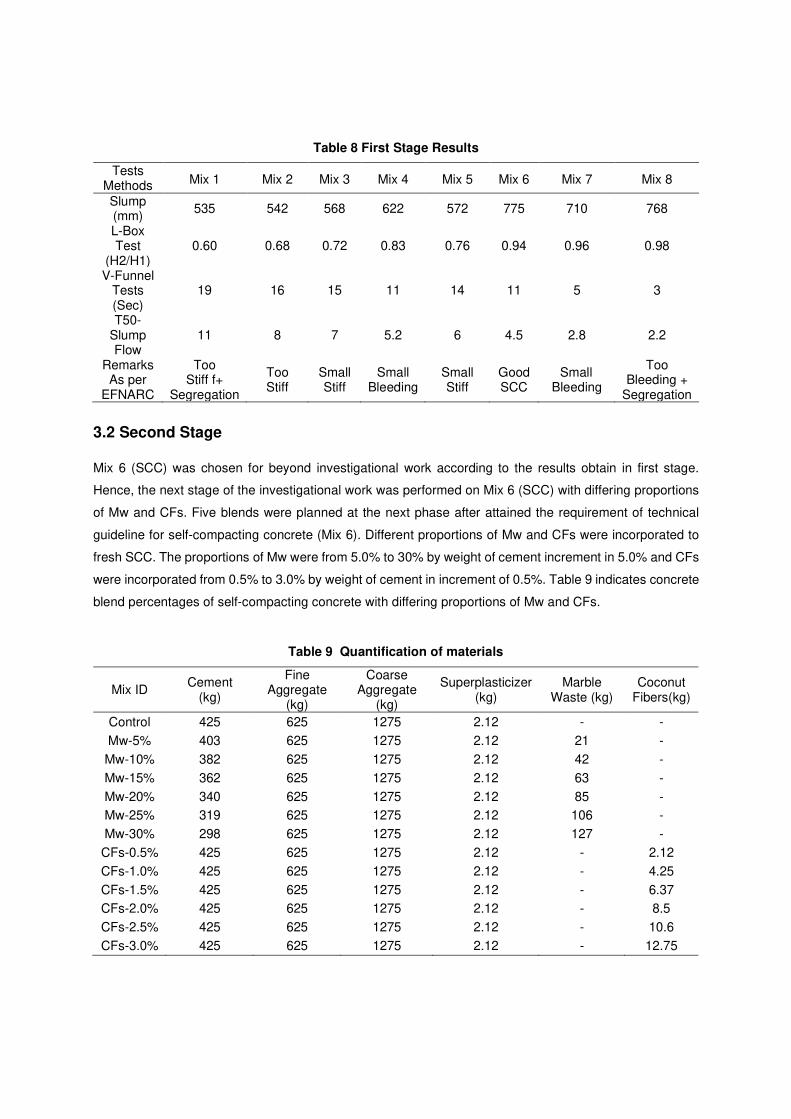
2.2 Size of Specimen
Slump flow, Slump T50, L-Box, and V-funnel tests were used to assess rheological characteristics [36].
moreover, as per ASTM C39/C39M [37] , standard-sized cylinders (150 mm in diameter and 300 mm in
length) have been used to test the compressive strength at seven, fourteen, and twenty-eight-day intervals.
The tensile strength of similar cylinders of standard size (150x300mm) has also determined by casting and
testing them in the laboratory. A beam with dimensions of (150x150x500mm) would be casted and tested
to determine its flexure strength in accordance with ASTM [38].Considering ASTM [39] , a cube of standard
dimensions (150mm3) has been used to determine bond strength. For each test, three specimens have
been tested at seven, fourteen, and twenty-eight days, and the mean value of the specimens have opted as
the strength. The specimens have prepared according to the ASTM C-31 [40] technique, and the
compaction was done manually by Roding in three layers with 25 blows each layer, as described in the
standard. Eight different mixtures were created to investigate the impact of marble wastage and coconut
fibers on the performance of solidified and fresh concrete. Table 7 presents the details of the mixes.
3 Results
3.1 First Stage
In the first phase, eight different mixes have created to obtain the best feasible blend that would meet the
requirements of Technical Specification for the product (SCC). As a result of the research, Table 8 exhibits
the fresh characteristics of SCC for each trial mix tested using various testing techniques (Slump Flow,
Slump T50 Spreads, L-Box, and V-Funnel). Table 8 provides the true picture that Mix 6 will gratify the
variety of different tests (Slump flow, Slump T50 Spread time, L-Box, and V-funnel) stated by the specific
requirements for self-compacting concrete. Others believe that the mixture does not gratify the range of
such testing. Hence, in order to get the good self-compacting concrete mix, Mix 6 is regarded the best mix.
It may be used as a reference concrete (control) with varying proportions of MW and CFs for futher
experimental works.
Table 7 Trials Batches of SCC
Materials Mix 1 Mix 2 Mix 3 Mix 4 Mix 5 Mix 6 Mix 7 Mix 8
Cement (kg/m3) 425 425 425 425 425 425 425 425
Sand (kg/m3) 625 625 625 625 625 625 625 625
Crush (kg/m3) 1270 1270 1270 1270 1270 1270 1270 1270
W/C 0.50 0.50 0.50 0.50 0.60 0.60 0.60 0.60
Superplasticizer (kg) - 2.12 4.25 6.37 - 2.12 4.25 6.37
3.2 Second Stage
Mix 6 (SCC) was chosen for beyond investigational work according to the results obtain in first stage.
Hence, the next stage of the investigational work was performed on Mix 6 (SCC) with differing proportions
of Mw and CFs. Five blends were planned at the next phase after attained the requirement of technical
guideline for self-compacting concrete (Mix 6). Different proportions of Mw and CFs were incorporated to
fresh SCC. The proportions of Mw were from 5.0% to 30% by weight of cement increment in 5.0% and CFs
were incorporated from 0.5% to 3.0% by weight of cement in increment of 0.5%. Table 9 indicates concrete
blend percentages of self-compacting concrete with differing proportions of Mw and CFs.
Table 8 First Stage Results
Tests Methods Mix 1 Mix 2 Mix 3 Mix 4 Mix 5 Mix 6 Mix 7 Mix 8
Slump (mm)
535 542 568 622 572 775 710 768
L-Box Test
(H2/H1) 0.60 0.68 0.72 0.83 0.76 0.94 0.96 0.98
V-Funnel Tests (Sec)
19 16 15 11 14 11 5 3
T50-Slump Flow
11 8 7 5.2 6 4.5 2.8 2.2
Remarks As per
EFNARC
Too Stiff f+
Segregation
Too Stiff
Small Stiff
Small Bleeding
Small Stiff
Good SCC
Small Bleeding
Too Bleeding +
Segregation
Table 9 Quantification of materials
Mix ID Cement
(kg)
Fine Aggregate
(kg)
Coarse Aggregate
(kg)
Superplasticizer (kg)
Marble Waste (kg)
Coconut Fibers(kg)
Control 425 625 1275 2.12 - -
Mw-5% 403 625 1275 2.12 21 -
Mw-10% 382 625 1275 2.12 42 -
Mw-15% 362 625 1275 2.12 63 -
Mw-20% 340 625 1275 2.12 85 -
Mw-25% 319 625 1275 2.12 106 -
Mw-30% 298 625 1275 2.12 127 -
CFs-0.5% 425 625 1275 2.12 - 2.12
CFs-1.0% 425 625 1275 2.12 - 4.25
CFs-1.5% 425 625 1275 2.12 - 6.37
CFs-2.0% 425 625 1275 2.12 - 8.5
CFs-2.5% 425 625 1275 2.12 - 10.6
CFs-3.0% 425 625 1275 2.12 - 12.75
3 Results and Discussion (Second Stage)
3.2.1 Rheological Performance
3.2.1.1 Slump Cone and SlumpT50
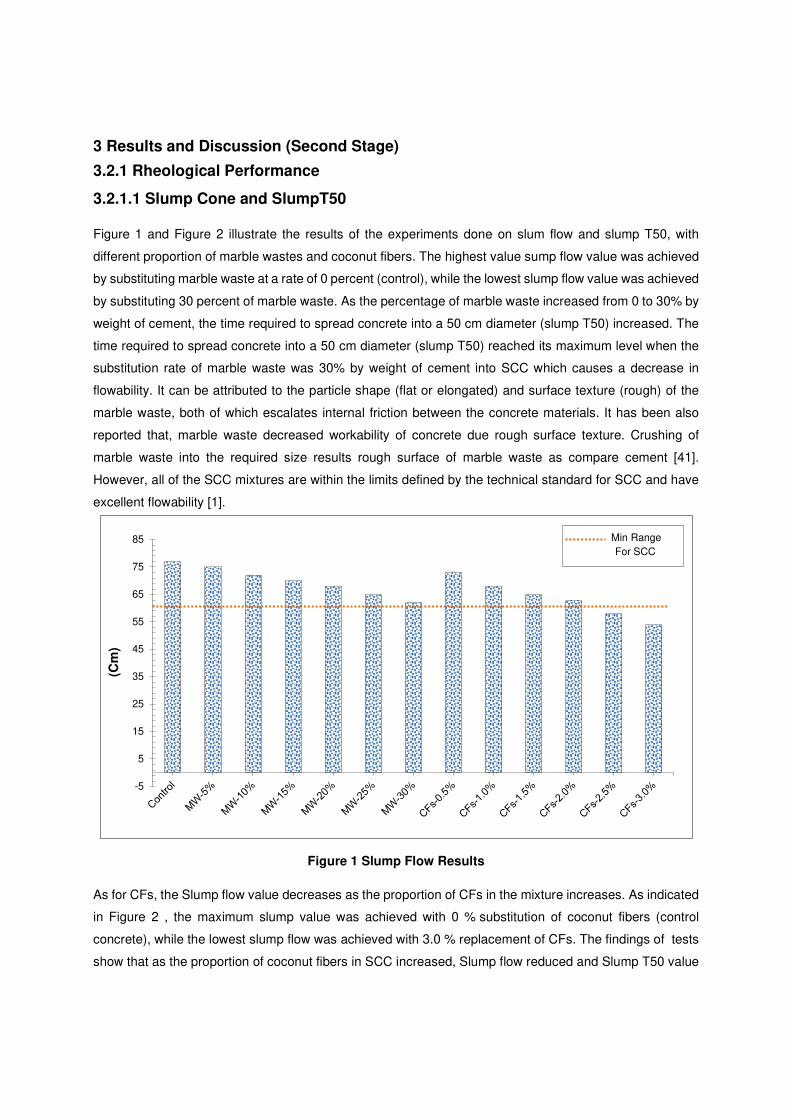
Figure 1 and Figure 2 illustrate the results of the experiments done on slum flow and slump T50, with
different proportion of marble wastes and coconut fibers. The highest value sump flow value was achieved
by substituting marble waste at a rate of 0 percent (control), while the lowest slump flow value was achieved
by substituting 30 percent of marble waste. As the percentage of marble waste increased from 0 to 30% by
weight of cement, the time required to spread concrete into a 50 cm diameter (slump T50) increased. The
time required to spread concrete into a 50 cm diameter (slump T50) reached its maximum level when the
substitution rate of marble waste was 30% by weight of cement into SCC which causes a decrease in
flowability. It can be attributed to the particle shape (flat or elongated) and surface texture (rough) of the
marble waste, both of which escalates internal friction between the concrete materials. It has been also
reported that, marble waste decreased workability of concrete due rough surface texture. Crushing of
marble waste into the required size results rough surface of marble waste as compare cement [41].
However, all of the SCC mixtures are within the limits defined by the technical standard for SCC and have
excellent flowability [1].
As for CFs, the Slump flow value decreases as the proportion of CFs in the mixture increases. As indicated
in Figure 2 , the maximum slump value was achieved with 0 % substitution of coconut fibers (control
concrete), while the lowest slump flow was achieved with 3.0 % replacement of CFs. The findings of tests
show that as the proportion of coconut fibers in SCC increased, Slump flow reduced and Slump T50 value
Figure 1 Slump Flow Results
-5
5
15
25
35
45
55
65
75
85
(Cm
)
Min RangeFor SCC
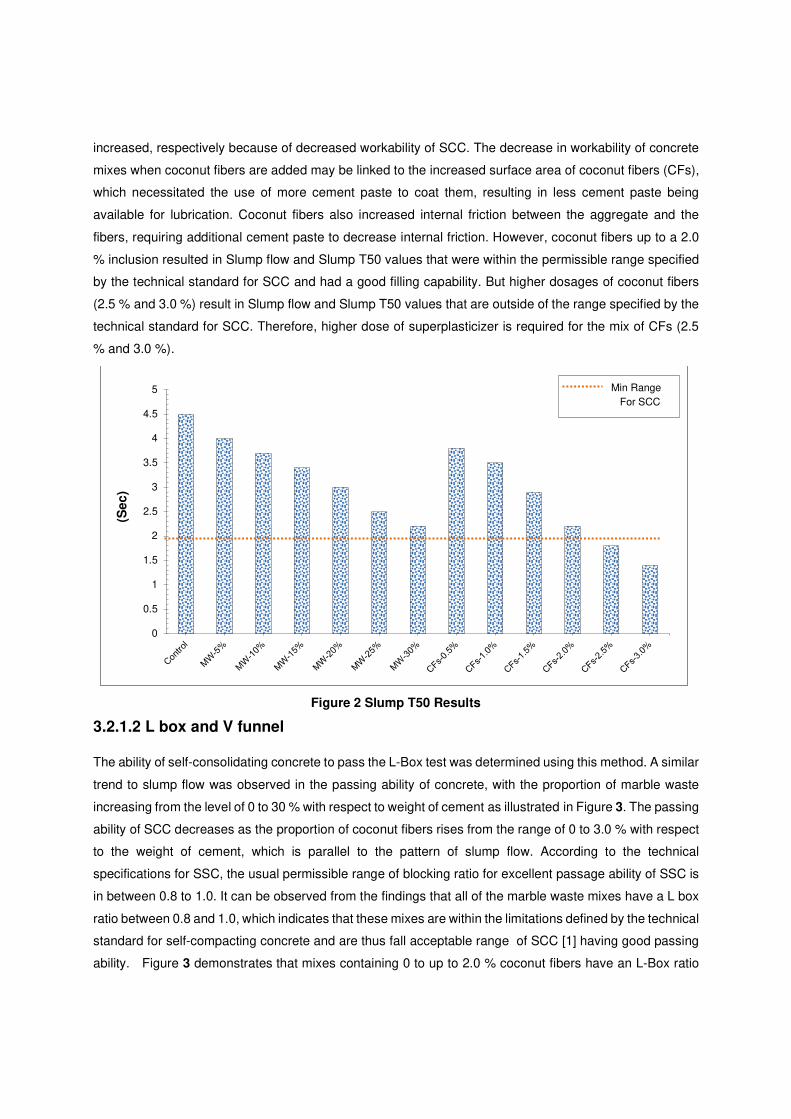
increased, respectively because of decreased workability of SCC. The decrease in workability of concrete
mixes when coconut fibers are added may be linked to the increased surface area of coconut fibers (CFs),
which necessitated the use of more cement paste to coat them, resulting in less cement paste being
available for lubrication. Coconut fibers also increased internal friction between the aggregate and the
fibers, requiring additional cement paste to decrease internal friction. However, coconut fibers up to a 2.0
% inclusion resulted in Slump flow and Slump T50 values that were within the permissible range specified
by the technical standard for SCC and had a good filling capability. But higher dosages of coconut fibers
(2.5 % and 3.0 %) result in Slump flow and Slump T50 values that are outside of the range specified by the
technical standard for SCC. Therefore, higher dose of superplasticizer is required for the mix of CFs (2.5
% and 3.0 %).
Figure 2 Slump T50 Results
3.2.1.2 L box and V funnel
The ability of self-consolidating concrete to pass the L-Box test was determined using this method. A similar
trend to slump flow was observed in the passing ability of concrete, with the proportion of marble waste
increasing from the level of 0 to 30 % with respect to weight of cement as illustrated in Figure 3. The passing
ability of SCC decreases as the proportion of coconut fibers rises from the range of 0 to 3.0 % with respect
to the weight of cement, which is parallel to the pattern of slump flow. According to the technical
specifications for SSC, the usual permissible range of blocking ratio for excellent passage ability of SSC is
in between 0.8 to 1.0. It can be observed from the findings that all of the marble waste mixes have a L box
ratio between 0.8 and 1.0, which indicates that these mixes are within the limitations defined by the technical
standard for self-compacting concrete and are thus fall acceptable range of SCC [1] having good passing
ability. Figure 3 demonstrates that mixes containing 0 to up to 2.0 % coconut fibers have an L-Box ratio
0
0.5
1
1.5
2
2.5
3
3.5
4
4.5
5
(Se
c)
Min RangeFor SCC
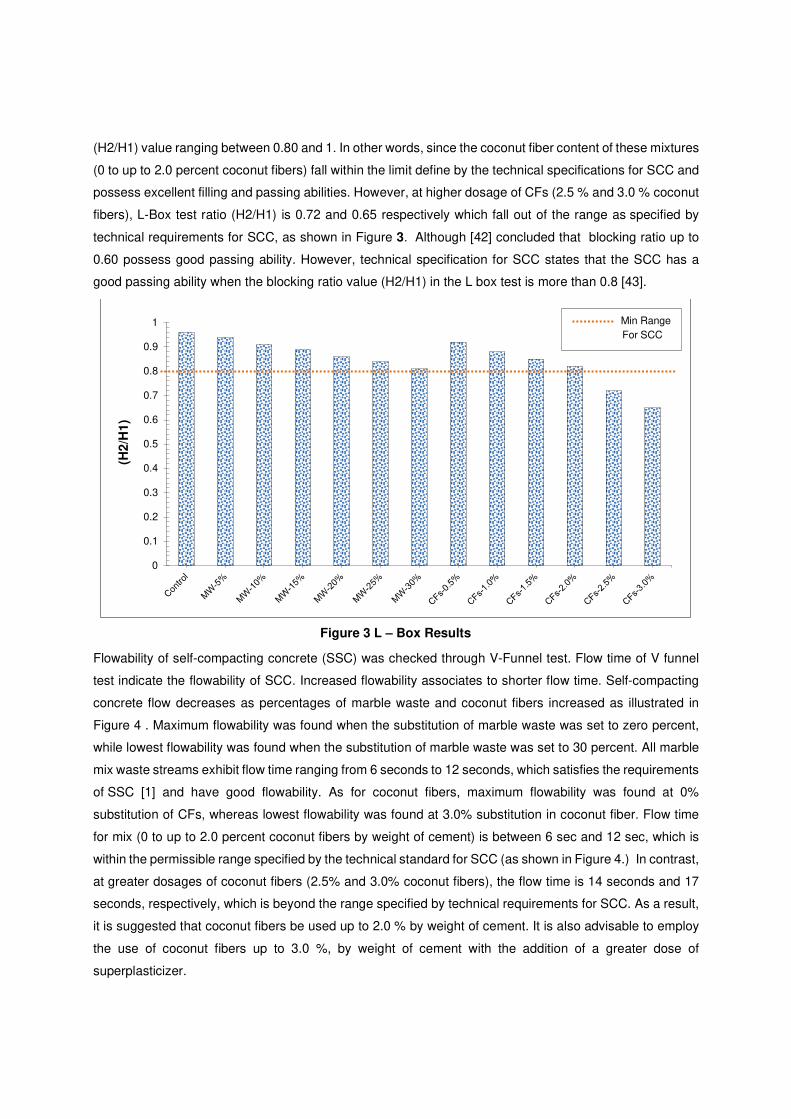
(H2/H1) value ranging between 0.80 and 1. In other words, since the coconut fiber content of these mixtures
(0 to up to 2.0 percent coconut fibers) fall within the limit define by the technical specifications for SCC and
possess excellent filling and passing abilities. However, at higher dosage of CFs (2.5 % and 3.0 % coconut
fibers), L-Box test ratio (H2/H1) is 0.72 and 0.65 respectively which fall out of the range as specified by
technical requirements for SCC, as shown in Figure 3. Although [42] concluded that blocking ratio up to
0.60 possess good passing ability. However, technical specification for SCC states that the SCC has a
good passing ability when the blocking ratio value (H2/H1) in the L box test is more than 0.8 [43].
Figure 3 L – Box Results
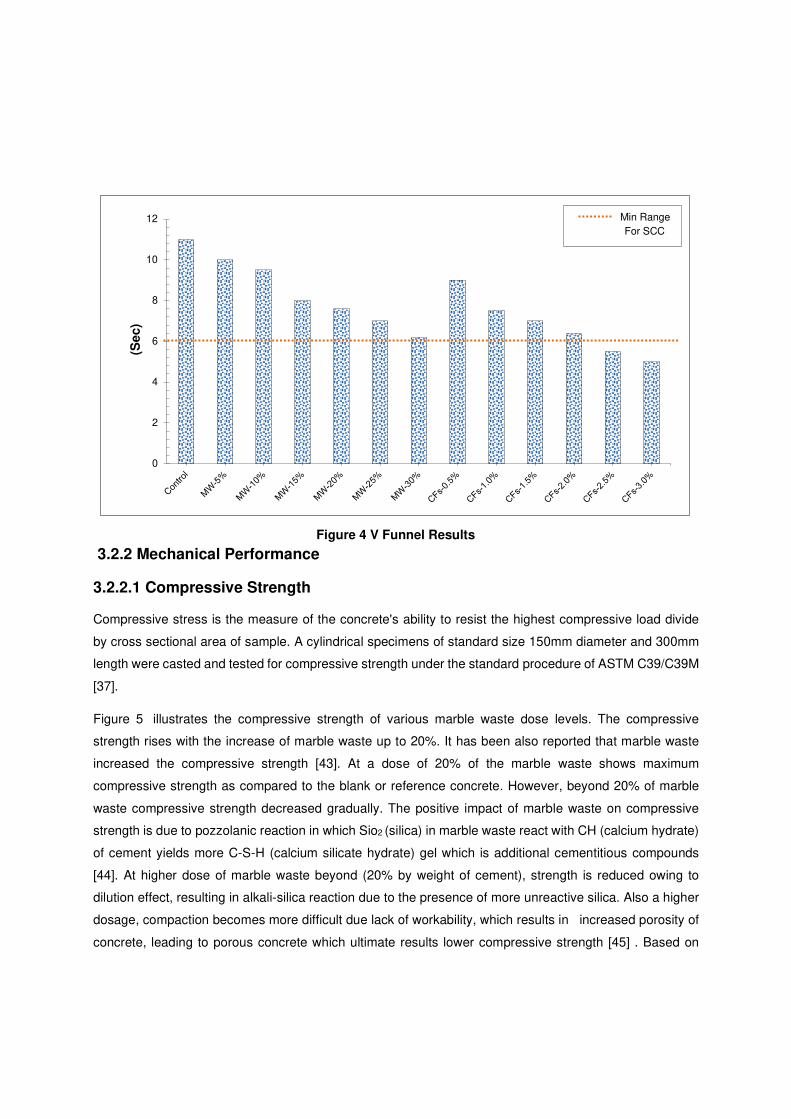
Flowability of self-compacting concrete (SSC) was checked through V-Funnel test. Flow time of V funnel
test indicate the flowability of SCC. Increased flowability associates to shorter flow time. Self-compacting
concrete flow decreases as percentages of marble waste and coconut fibers increased as illustrated in
Figure 4 . Maximum flowability was found when the substitution of marble waste was set to zero percent,
while lowest flowability was found when the substitution of marble waste was set to 30 percent. All marble
mix waste streams exhibit flow time ranging from 6 seconds to 12 seconds, which satisfies the requirements
of SSC [1] and have good flowability. As for coconut fibers, maximum flowability was found at 0%
substitution of CFs, whereas lowest flowability was found at 3.0% substitution in coconut fiber. Flow time
for mix (0 to up to 2.0 percent coconut fibers by weight of cement) is between 6 sec and 12 sec, which is
within the permissible range specified by the technical standard for SCC (as shown in Figure 4.) In contrast,
at greater dosages of coconut fibers (2.5% and 3.0% coconut fibers), the flow time is 14 seconds and 17
seconds, respectively, which is beyond the range specified by technical requirements for SCC. As a result,
it is suggested that coconut fibers be used up to 2.0 % by weight of cement. It is also advisable to employ
the use of coconut fibers up to 3.0 %, by weight of cement with the addition of a greater dose of
superplasticizer.
0
0.1
0.2
0.3
0.4
0.5
0.6
0.7
0.8
0.9
1
(H2
/H1
)
Min RangeFor SCC
3.2.2 Mechanical Performance
3.2.2.1 Compressive Strength
Compressive stress is the measure of the concrete's ability to resist the highest compressive load divide
by cross sectional area of sample. A cylindrical specimens of standard size 150mm diameter and 300mm
length were casted and tested for compressive strength under the standard procedure of ASTM C39/C39M
[37].
Figure 5 illustrates the compressive strength of various marble waste dose levels. The compressive
strength rises with the increase of marble waste up to 20%. It has been also reported that marble waste
increased the compressive strength [43]. At a dose of 20% of the marble waste shows maximum
compressive strength as compared to the blank or reference concrete. However, beyond 20% of marble
waste compressive strength decreased gradually. The positive impact of marble waste on compressive
strength is due to pozzolanic reaction in which Sio2 (silica) in marble waste react with CH (calcium hydrate)
of cement yields more C-S-H (calcium silicate hydrate) gel which is additional cementitious compounds
[44]. At higher dose of marble waste beyond (20% by weight of cement), strength is reduced owing to
dilution effect, resulting in alkali-silica reaction due to the presence of more unreactive silica. Also a higher
dosage, compaction becomes more difficult due lack of workability, which results in increased porosity of
concrete, leading to porous concrete which ultimate results lower compressive strength [45] . Based on
Figure 4 V Funnel Results
0
2
4
6
8
10
12
(Se
c)
Min RangeFor SCC
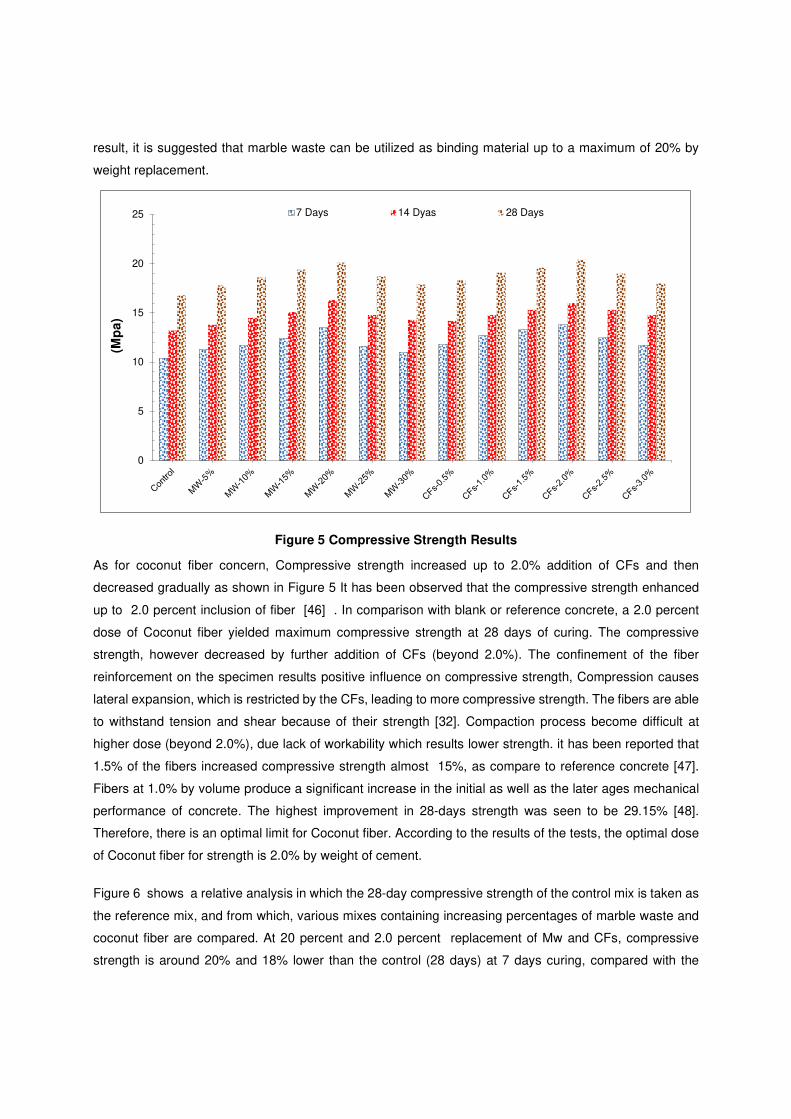
result, it is suggested that marble waste can be utilized as binding material up to a maximum of 20% by
weight replacement.
As for coconut fiber concern, Compressive strength increased up to 2.0% addition of CFs and then
decreased gradually as shown in Figure 5 It has been observed that the compressive strength enhanced
up to 2.0 percent inclusion of fiber [46] . In comparison with blank or reference concrete, a 2.0 percent
dose of Coconut fiber yielded maximum compressive strength at 28 days of curing. The compressive
strength, however decreased by further addition of CFs (beyond 2.0%). The confinement of the fiber
reinforcement on the specimen results positive influence on compressive strength, Compression causes
lateral expansion, which is restricted by the CFs, leading to more compressive strength. The fibers are able
to withstand tension and shear because of their strength [32]. Compaction process become difficult at
higher dose (beyond 2.0%), due lack of workability which results lower strength. it has been reported that
1.5% of the fibers increased compressive strength almost 15%, as compare to reference concrete [47].
Fibers at 1.0% by volume produce a significant increase in the initial as well as the later ages mechanical
performance of concrete. The highest improvement in 28-days strength was seen to be 29.15% [48].
Therefore, there is an optimal limit for Coconut fiber. According to the results of the tests, the optimal dose
of Coconut fiber for strength is 2.0% by weight of cement.
Figure 6 shows a relative analysis in which the 28-day compressive strength of the control mix is taken as
the reference mix, and from which, various mixes containing increasing percentages of marble waste and
coconut fiber are compared. At 20 percent and 2.0 percent replacement of Mw and CFs, compressive
strength is around 20% and 18% lower than the control (28 days) at 7 days curing, compared with the
Figure 5 Compressive Strength Results
0
5
10
15
20
25
(Mp
a)
7 Days 14 Dyas 28 Days
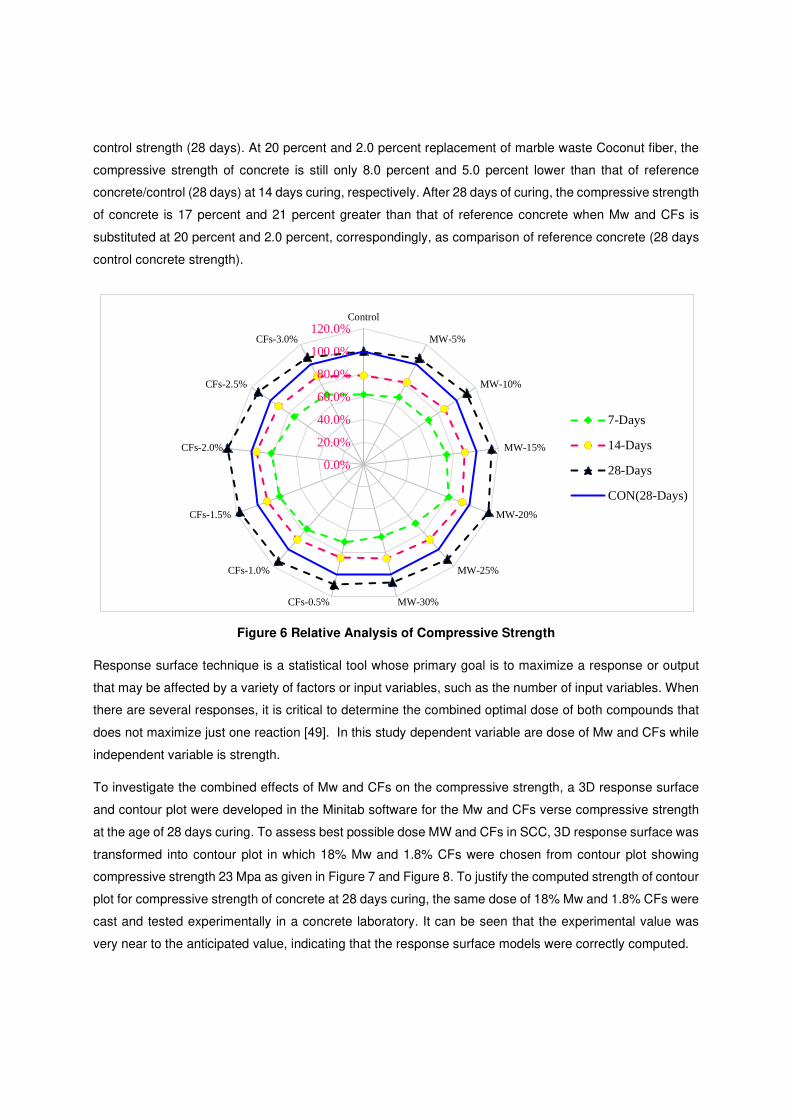
control strength (28 days). At 20 percent and 2.0 percent replacement of marble waste Coconut fiber, the
compressive strength of concrete is still only 8.0 percent and 5.0 percent lower than that of reference
concrete/control (28 days) at 14 days curing, respectively. After 28 days of curing, the compressive strength
of concrete is 17 percent and 21 percent greater than that of reference concrete when Mw and CFs is
substituted at 20 percent and 2.0 percent, correspondingly, as comparison of reference concrete (28 days
control concrete strength).
Figure 6 Relative Analysis of Compressive Strength
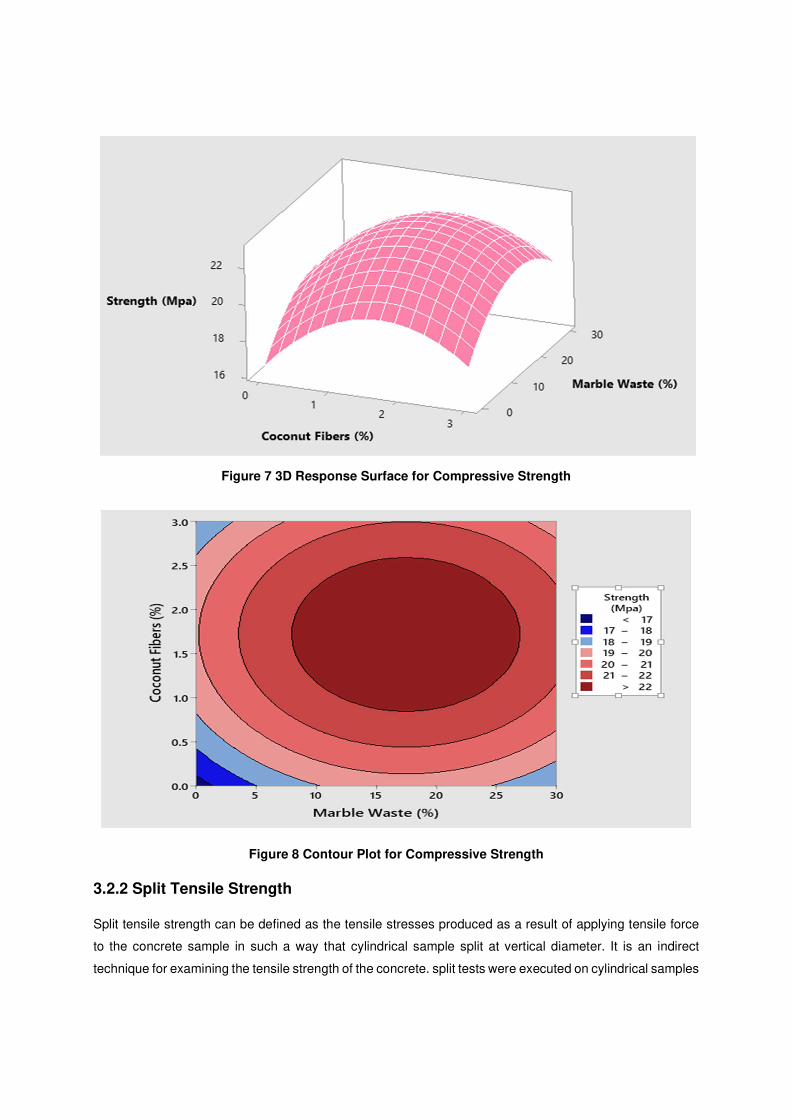
Response surface technique is a statistical tool whose primary goal is to maximize a response or output
that may be affected by a variety of factors or input variables, such as the number of input variables. When
there are several responses, it is critical to determine the combined optimal dose of both compounds that
does not maximize just one reaction [49]. In this study dependent variable are dose of Mw and CFs while
independent variable is strength.
To investigate the combined effects of Mw and CFs on the compressive strength, a 3D response surface
and contour plot were developed in the Minitab software for the Mw and CFs verse compressive strength
at the age of 28 days curing. To assess best possible dose MW and CFs in SCC, 3D response surface was
transformed into contour plot in which 18% Mw and 1.8% CFs were chosen from contour plot showing
compressive strength 23 Mpa as given in Figure 7 and Figure 8. To justify the computed strength of contour
plot for compressive strength of concrete at 28 days curing, the same dose of 18% Mw and 1.8% CFs were
cast and tested experimentally in a concrete laboratory. It can be seen that the experimental value was
very near to the anticipated value, indicating that the response surface models were correctly computed.
0.0%
20.0%
40.0%
60.0%
80.0%
100.0%
120.0%Control
MW-5%
MW-10%
MW-15%
MW-20%
MW-25%
MW-30%CFs-0.5%
CFs-1.0%
CFs-1.5%
CFs-2.0%
CFs-2.5%
CFs-3.0%
7-Days
14-Days
28-Days
CON(28-Days)
3.2.2 Split Tensile Strength
Split tensile strength can be defined as the tensile stresses produced as a result of applying tensile force
to the concrete sample in such a way that cylindrical sample split at vertical diameter. It is an indirect
technique for examining the tensile strength of the concrete. split tests were executed on cylindrical samples
Figure 7 3D Response Surface for Compressive Strength
Figure 8 Contour Plot for Compressive Strength
of 150 mm diameter and 300 mm height in accordance with ASTM C496-71 [50], at the ages of 7, 14 and
28 days of curing.
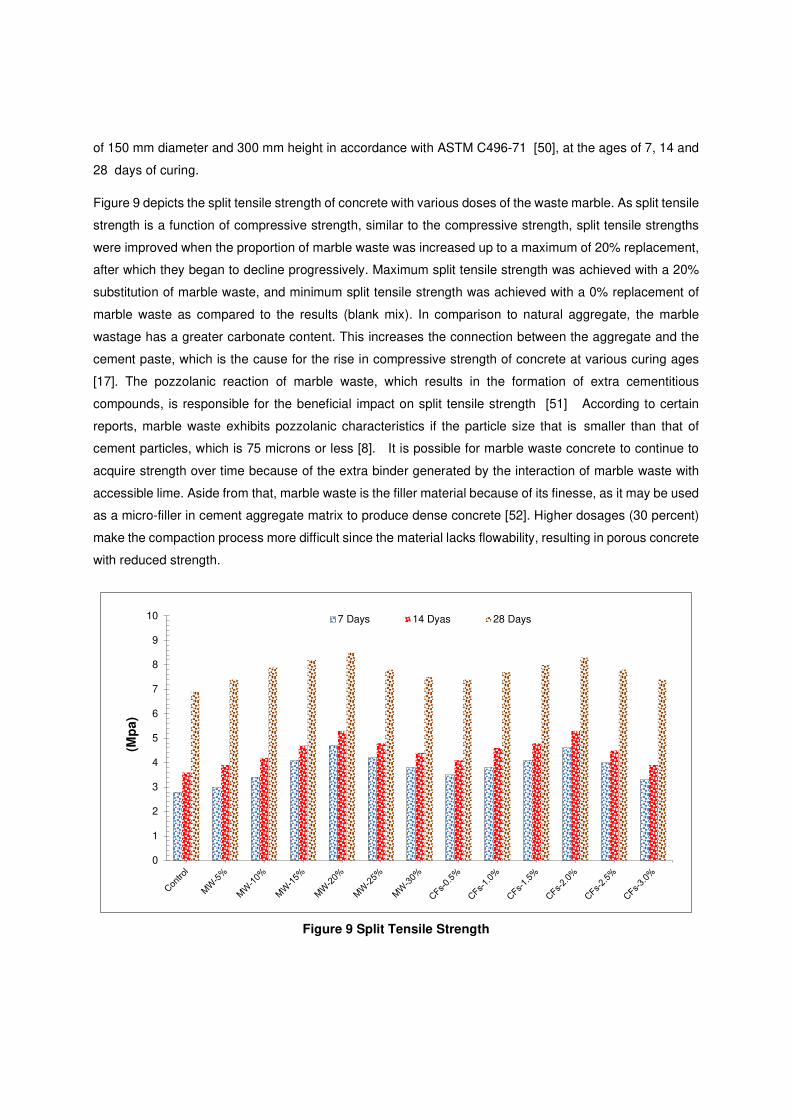
Figure 9 depicts the split tensile strength of concrete with various doses of the waste marble. As split tensile
strength is a function of compressive strength, similar to the compressive strength, split tensile strengths
were improved when the proportion of marble waste was increased up to a maximum of 20% replacement,
after which they began to decline progressively. Maximum split tensile strength was achieved with a 20%
substitution of marble waste, and minimum split tensile strength was achieved with a 0% replacement of
marble waste as compared to the results (blank mix). In comparison to natural aggregate, the marble
wastage has a greater carbonate content. This increases the connection between the aggregate and the
cement paste, which is the cause for the rise in compressive strength of concrete at various curing ages
[17]. The pozzolanic reaction of marble waste, which results in the formation of extra cementitious
compounds, is responsible for the beneficial impact on split tensile strength [51] According to certain
reports, marble waste exhibits pozzolanic characteristics if the particle size that is smaller than that of
cement particles, which is 75 microns or less [8]. It is possible for marble waste concrete to continue to
acquire strength over time because of the extra binder generated by the interaction of marble waste with
accessible lime. Aside from that, marble waste is the filler material because of its finesse, as it may be used
as a micro-filler in cement aggregate matrix to produce dense concrete [52]. Higher dosages (30 percent)
make the compaction process more difficult since the material lacks flowability, resulting in porous concrete
with reduced strength.
Figure 9 Split Tensile Strength
0
1
2
3
4
5
6
7
8
9
10
(Mp
a)
7 Days 14 Dyas 28 Days
As for coconut fibers (CFs), similar to the compressive strength split, tensile strength was also enhanced
as the proportion of CFs rose up to 2.0 percent and subsequently decreased, as shown in Figure 9. When
comparing the split tensile strength of 2.0 percent CFs to blank or reference concrete after 28 days of
curing, the greatest split tensile was achieved at 2.0 percent CFs dose. It has also been observed that the
addition of 2.0 percent fibers by volume may increase the tensile strength of concrete by around 40% [53].
The strength, however, was decreased when the 2.0 percent dose was exceeded. In concrete, fibers are
used to improve the flexibility of the concrete by delaying the appearance of tension fractures or avoiding
the formation of cracks in such a way that the tensile strength of (SFRC) steel fiber reinforced concrete is
greater to that of ordinary concrete. Fibers have a crack-stopping effect rather than a crack-prevention
effect. It is important to note that CFs have a greater impact on tensile strength than they do on compressive
strength when compared to other materials. Several studies have shown that fibers increase the tensile
capacity of post-cracking behavior [54]. Fibers have been found to have more substantial impacts on
flexural tensile strength at volume fractions ranging from 0.5 to 2.0 percent, which were involved in this
study [55].
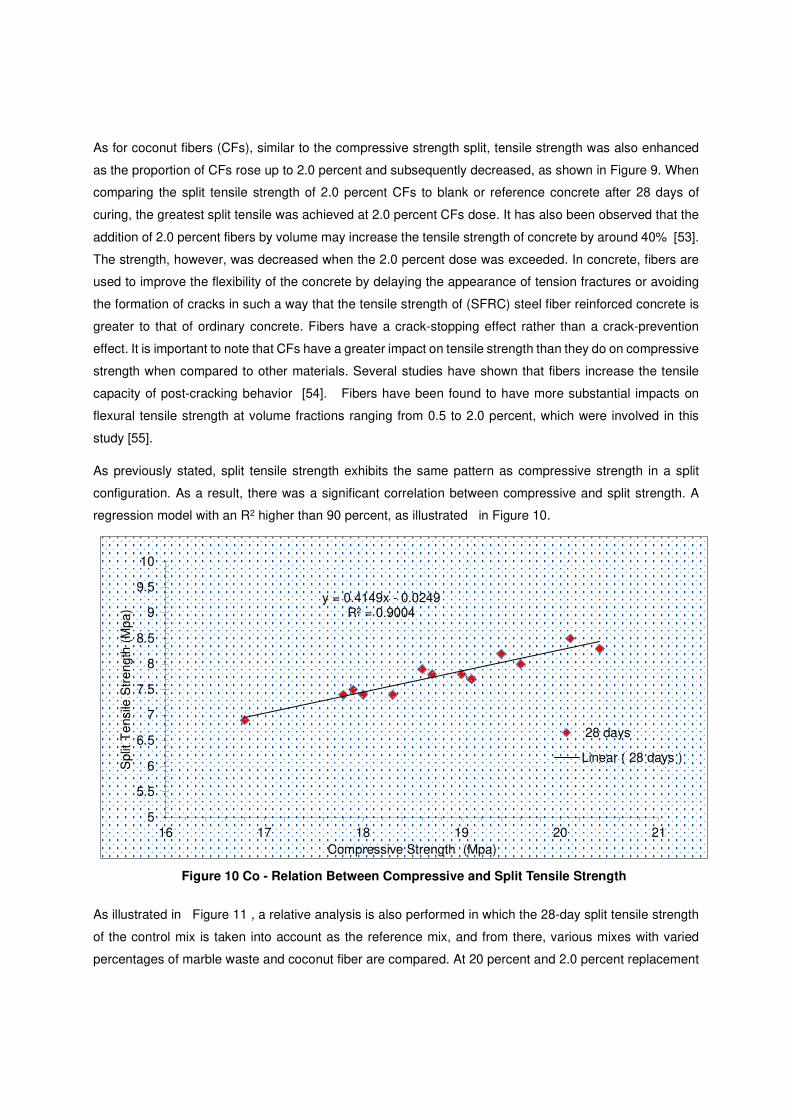
As previously stated, split tensile strength exhibits the same pattern as compressive strength in a split
configuration. As a result, there was a significant correlation between compressive and split strength. A
regression model with an R2 higher than 90 percent, as illustrated in Figure 10.
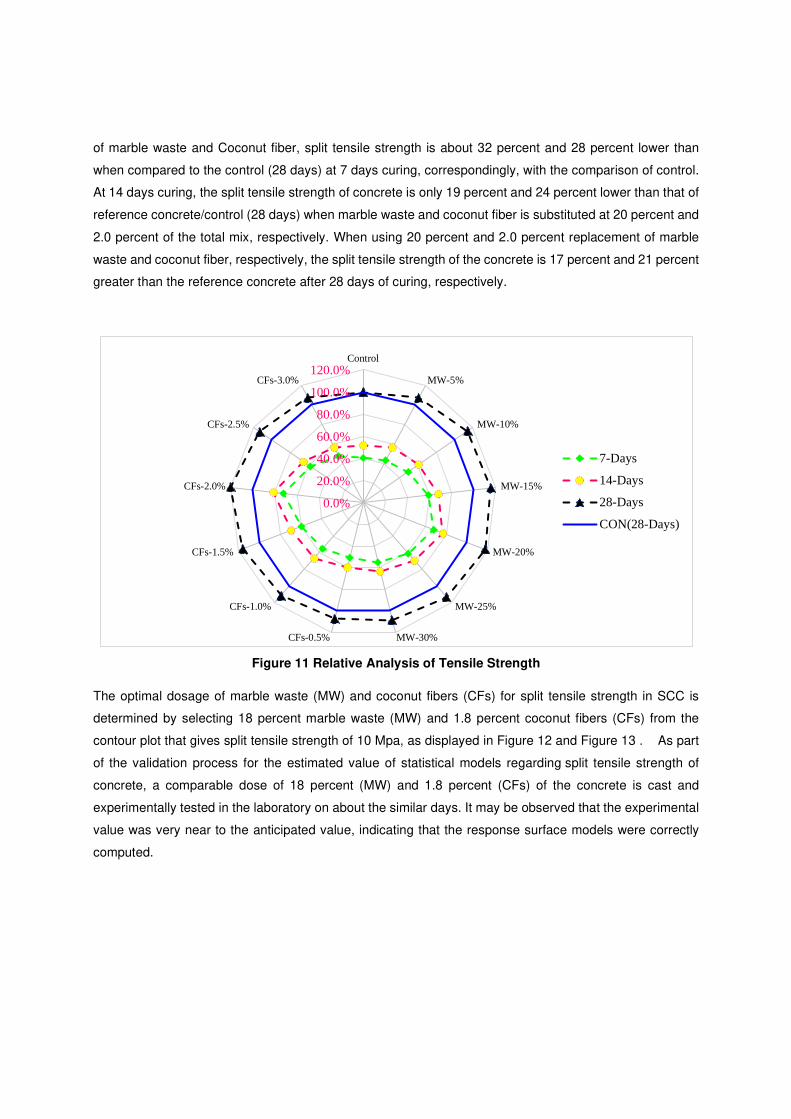
As illustrated in Figure 11 , a relative analysis is also performed in which the 28-day split tensile strength
of the control mix is taken into account as the reference mix, and from there, various mixes with varied
percentages of marble waste and coconut fiber are compared. At 20 percent and 2.0 percent replacement
Figure 10 Co - Relation Between Compressive and Split Tensile Strength
y = 0.4149x - 0.0249R² = 0.9004
5
5.5
6
6.5
7
7.5
8
8.5
9
9.5
10
16 17 18 19 20 21
Spl
it T
ensi
le S
tren
gth
(Mpa
)
Compressive Strength (Mpa)
28 days
Linear ( 28 days )
of marble waste and Coconut fiber, split tensile strength is about 32 percent and 28 percent lower than
when compared to the control (28 days) at 7 days curing, correspondingly, with the comparison of control.
At 14 days curing, the split tensile strength of concrete is only 19 percent and 24 percent lower than that of
reference concrete/control (28 days) when marble waste and coconut fiber is substituted at 20 percent and
2.0 percent of the total mix, respectively. When using 20 percent and 2.0 percent replacement of marble
waste and coconut fiber, respectively, the split tensile strength of the concrete is 17 percent and 21 percent
greater than the reference concrete after 28 days of curing, respectively.
Figure 11 Relative Analysis of Tensile Strength
The optimal dosage of marble waste (MW) and coconut fibers (CFs) for split tensile strength in SCC is
determined by selecting 18 percent marble waste (MW) and 1.8 percent coconut fibers (CFs) from the
contour plot that gives split tensile strength of 10 Mpa, as displayed in Figure 12 and Figure 13 . As part
of the validation process for the estimated value of statistical models regarding split tensile strength of
concrete, a comparable dose of 18 percent (MW) and 1.8 percent (CFs) of the concrete is cast and
experimentally tested in the laboratory on about the similar days. It may be observed that the experimental
value was very near to the anticipated value, indicating that the response surface models were correctly
computed.
0.0%
20.0%
40.0%
60.0%
80.0%
100.0%
120.0%Control
MW-5%
MW-10%
MW-15%
MW-20%
MW-25%
MW-30%CFs-0.5%
CFs-1.0%
CFs-1.5%
CFs-2.0%
CFs-2.5%
CFs-3.0%
7-Days
14-Days
28-Days
CON(28-Days)
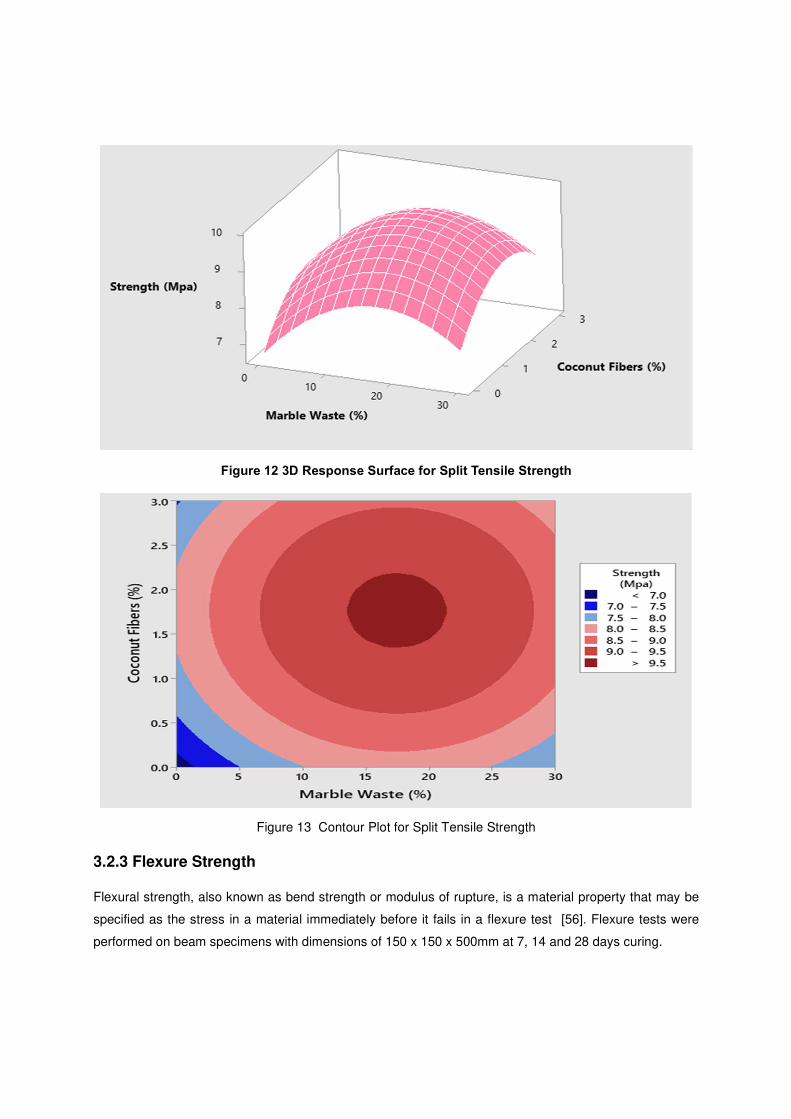
Figure 12 3D Response Surface for Split Tensile Strength
3.2.3 Flexure Strength
Flexural strength, also known as bend strength or modulus of rupture, is a material property that may be
specified as the stress in a material immediately before it fails in a flexure test [56]. Flexure tests were
performed on beam specimens with dimensions of 150 x 150 x 500mm at 7, 14 and 28 days curing.
Figure 13 Contour Plot for Split Tensile Strength
Figure 14 depicts the flexural strength of marble waste and coconut fibers at various doses. Flexure strength
rise in a similar way to compressive strength as the proportion of marble waste climbed up to 20 percent
replacement and then dropped progressively, similar to compressive strength. The greatest Flexure
strength was achieved with a 20 percent substitution of marble waste, and the lowest Flexure strength was
achieved with a 0 percent replacement of marble waste, as compared to reference concrete (blank mix). It
has also been observed that the inclusion of marble powder increases the flexure strength of the concrete
[8]. It is due to pozzolanic reaction of marble waste. The pozzolanic reaction of Sio2 in marble waste with
CH of cement results in the formation of extra cementitious compounds (C-S-H), which has a beneficial
impact on flexure strength [44].Increased dosages of marble waste (more than 20 percent by weight of
cement) result in a reduction in strength owing to dilution effect, which cause to an alkali-silica reaction due
to a greater amount of unreactive silica accessible due to the increased quantity of marble waste used in
the mix. A greater dose also makes the curing process more problematic owing to a lack of workability,
which results in porous concrete with a lower strength [45].
Considering Coconut fiber (CFs), flexure strength rises as the proportion of Coconut fiber grew up to 2.0
percent and subsequently dropped, as shown in Figure 14. It has been claimed that the flexure strength
may be enhanced by as much as up to 2.0 percent fiber is added [46]. When flexure strength was measured
after 28 days of curing, the greatest value was achieved with a 2.0 percent dose of Coconut fiber when
compared to blank or reference concrete. The strength, however, was decreased when the CFs exceed
2.0 percent dose. The confinement of the fiber reinforcement on the specimen has a beneficial impact on
flexure strength. Compression causes lateral expansion, which results in tension and shear as a result of
the expansion. The fibers are able to withstand tension and shear due to their strength. This confinement
has the potential to decrease the specimen's transverse deformation while simultaneously increasing its
flexural strength. When the percentage of coconut fiber is increased, particularly at a greater dose, the
process of compaction becomes more difficult, resulting in porous concrete and a reduction in flexural
strength, as previously stated. It has been observed that increasing the flexure strength by up to 1.5 percent
of the total volume of fibers increases it from 20 percent to 25 percent [47]. Steel fibers, at a concentration
of 1.0 percent by volume, produce a significant increase in both the early and long-term strength of concrete.
The highest increase in 28-day strength was found to be 29.15 percent with the maximum increase being
29.15 percent [48].
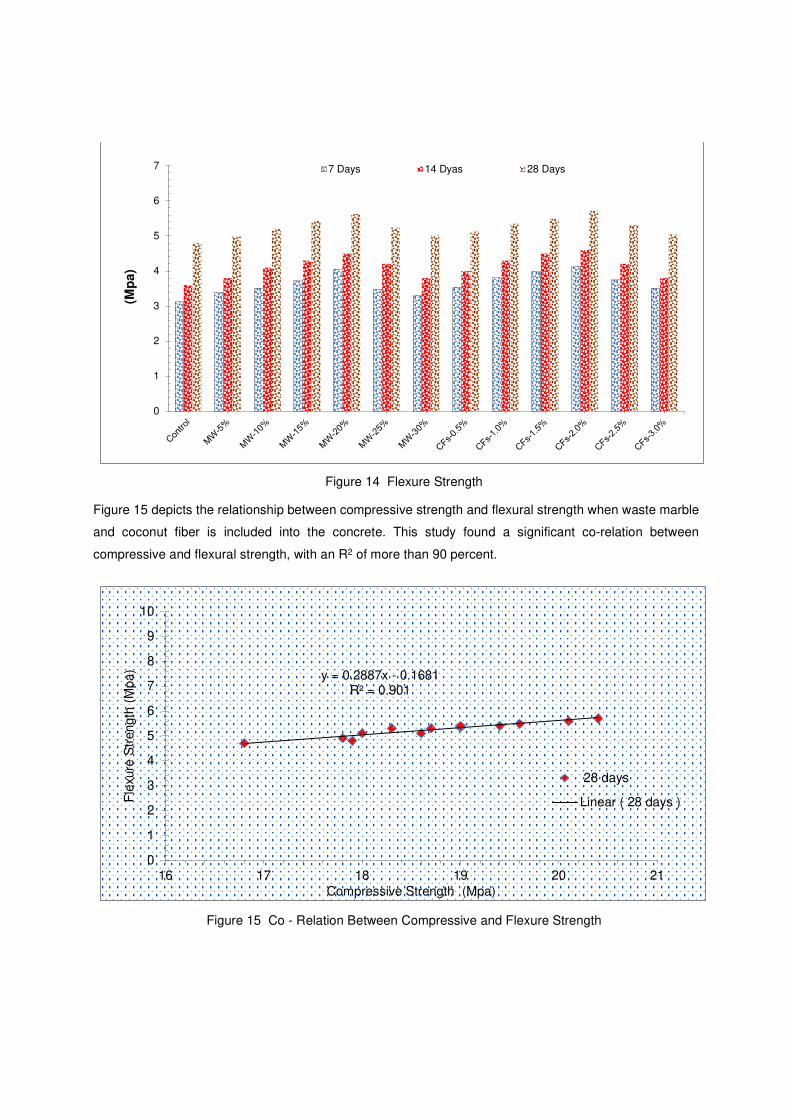
Figure 15 depicts the relationship between compressive strength and flexural strength when waste marble
and coconut fiber is included into the concrete. This study found a significant co-relation between
compressive and flexural strength, with an R2 of more than 90 percent.
Figure 14 Flexure Strength
Figure 15 Co - Relation Between Compressive and Flexure Strength
0
1
2
3
4
5
6
7
(Mp
a)
7 Days 14 Dyas 28 Days
y = 0.2887x - 0.1681R² = 0.901
0
1
2
3
4
5
6
7
8
9
10
16 17 18 19 20 21
Fle
xure
Str
engt
h (M
pa)
Compressive Strength (Mpa)
28 days
Linear ( 28 days )
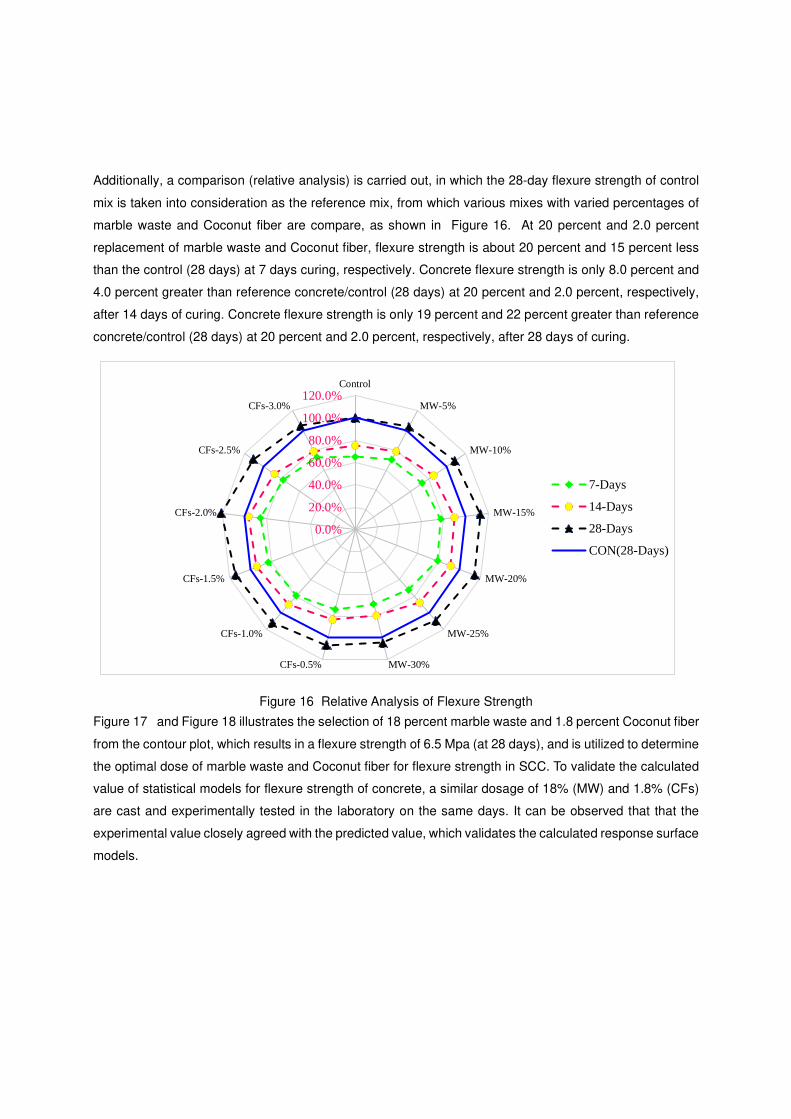
Additionally, a comparison (relative analysis) is carried out, in which the 28-day flexure strength of control
mix is taken into consideration as the reference mix, from which various mixes with varied percentages of
marble waste and Coconut fiber are compare, as shown in Figure 16. At 20 percent and 2.0 percent
replacement of marble waste and Coconut fiber, flexure strength is about 20 percent and 15 percent less
than the control (28 days) at 7 days curing, respectively. Concrete flexure strength is only 8.0 percent and
4.0 percent greater than reference concrete/control (28 days) at 20 percent and 2.0 percent, respectively,
after 14 days of curing. Concrete flexure strength is only 19 percent and 22 percent greater than reference
concrete/control (28 days) at 20 percent and 2.0 percent, respectively, after 28 days of curing.
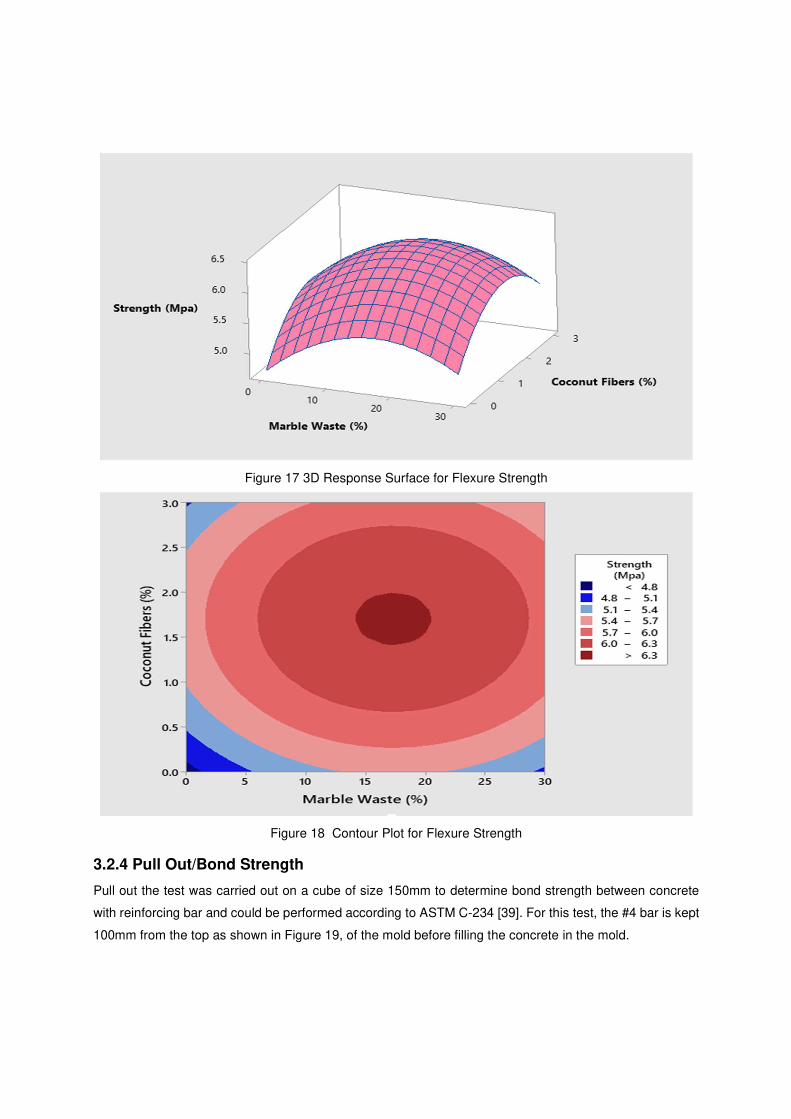
Figure 17 and Figure 18 illustrates the selection of 18 percent marble waste and 1.8 percent Coconut fiber
from the contour plot, which results in a flexure strength of 6.5 Mpa (at 28 days), and is utilized to determine
the optimal dose of marble waste and Coconut fiber for flexure strength in SCC. To validate the calculated
value of statistical models for flexure strength of concrete, a similar dosage of 18% (MW) and 1.8% (CFs)
are cast and experimentally tested in the laboratory on the same days. It can be observed that that the
experimental value closely agreed with the predicted value, which validates the calculated response surface
models.
Figure 16 Relative Analysis of Flexure Strength
0.0%
20.0%
40.0%
60.0%
80.0%
100.0%
120.0%Control
MW-5%
MW-10%
MW-15%
MW-20%
MW-25%
MW-30%CFs-0.5%
CFs-1.0%
CFs-1.5%
CFs-2.0%
CFs-2.5%
CFs-3.0%
7-Days
14-Days
28-Days
CON(28-Days)
3.2.4 Pull Out/Bond Strength
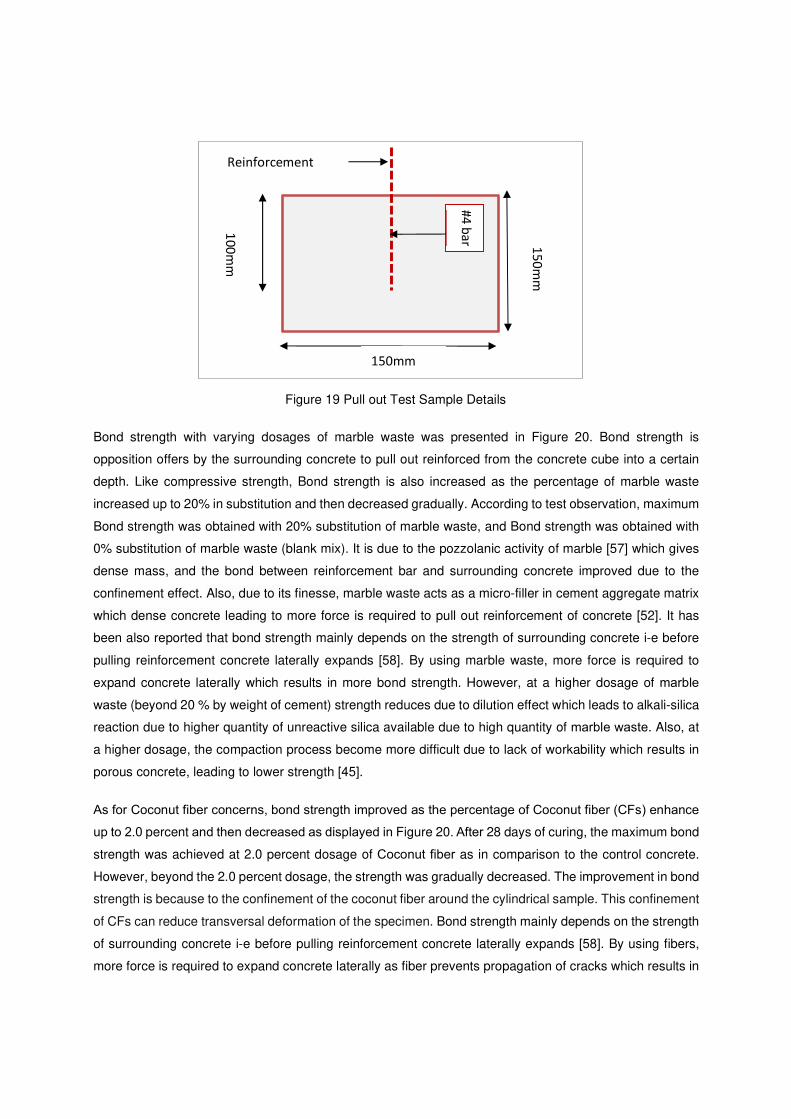
Pull out the test was carried out on a cube of size 150mm to determine bond strength between concrete
with reinforcing bar and could be performed according to ASTM C-234 [39]. For this test, the #4 bar is kept
100mm from the top as shown in Figure 19, of the mold before filling the concrete in the mold.
Figure 17 3D Response Surface for Flexure Strength
Figure 18 Contour Plot for Flexure Strength
Bond strength with varying dosages of marble waste was presented in Figure 20. Bond strength is
opposition offers by the surrounding concrete to pull out reinforced from the concrete cube into a certain
depth. Like compressive strength, Bond strength is also increased as the percentage of marble waste
increased up to 20% in substitution and then decreased gradually. According to test observation, maximum
Bond strength was obtained with 20% substitution of marble waste, and Bond strength was obtained with
0% substitution of marble waste (blank mix). It is due to the pozzolanic activity of marble [57] which gives
dense mass, and the bond between reinforcement bar and surrounding concrete improved due to the
confinement effect. Also, due to its finesse, marble waste acts as a micro-filler in cement aggregate matrix
which dense concrete leading to more force is required to pull out reinforcement of concrete [52]. It has
been also reported that bond strength mainly depends on the strength of surrounding concrete i-e before
pulling reinforcement concrete laterally expands [58]. By using marble waste, more force is required to
expand concrete laterally which results in more bond strength. However, at a higher dosage of marble
waste (beyond 20 % by weight of cement) strength reduces due to dilution effect which leads to alkali-silica
reaction due to higher quantity of unreactive silica available due to high quantity of marble waste. Also, at
a higher dosage, the compaction process become more difficult due to lack of workability which results in
porous concrete, leading to lower strength [45].
As for Coconut fiber concerns, bond strength improved as the percentage of Coconut fiber (CFs) enhance
up to 2.0 percent and then decreased as displayed in Figure 20. After 28 days of curing, the maximum bond
strength was achieved at 2.0 percent dosage of Coconut fiber as in comparison to the control concrete.
However, beyond the 2.0 percent dosage, the strength was gradually decreased. The improvement in bond
strength is because to the confinement of the coconut fiber around the cylindrical sample. This confinement
of CFs can reduce transversal deformation of the specimen. Bond strength mainly depends on the strength
of surrounding concrete i-e before pulling reinforcement concrete laterally expands [58]. By using fibers,
more force is required to expand concrete laterally as fiber prevents propagation of cracks which results in
Figure 19 Pull out Test Sample Details
15
0m
m
150mm
10
0m
m
#4
ba
r
Reinforcement
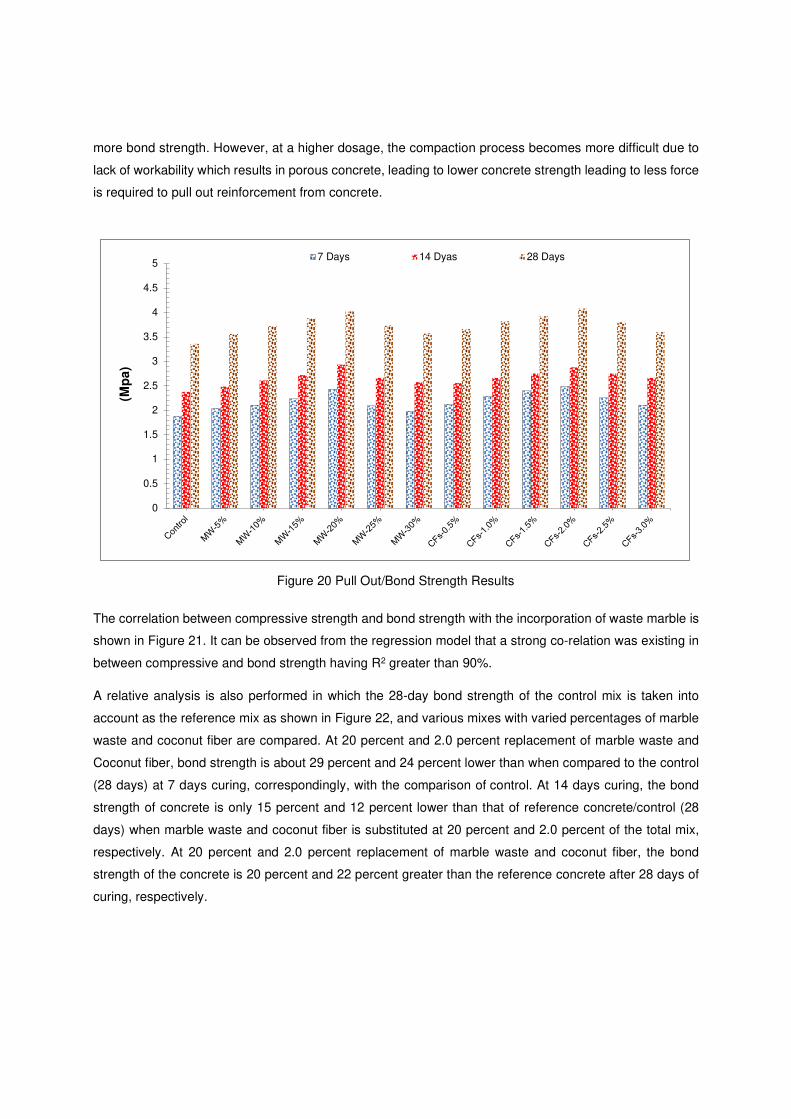
more bond strength. However, at a higher dosage, the compaction process becomes more difficult due to
lack of workability which results in porous concrete, leading to lower concrete strength leading to less force
is required to pull out reinforcement from concrete.
Figure 20 Pull Out/Bond Strength Results
The correlation between compressive strength and bond strength with the incorporation of waste marble is
shown in Figure 21. It can be observed from the regression model that a strong co-relation was existing in
between compressive and bond strength having R2 greater than 90%.
A relative analysis is also performed in which the 28-day bond strength of the control mix is taken into
account as the reference mix as shown in Figure 22, and various mixes with varied percentages of marble
waste and coconut fiber are compared. At 20 percent and 2.0 percent replacement of marble waste and
Coconut fiber, bond strength is about 29 percent and 24 percent lower than when compared to the control
(28 days) at 7 days curing, correspondingly, with the comparison of control. At 14 days curing, the bond
strength of concrete is only 15 percent and 12 percent lower than that of reference concrete/control (28
days) when marble waste and coconut fiber is substituted at 20 percent and 2.0 percent of the total mix,
respectively. At 20 percent and 2.0 percent replacement of marble waste and coconut fiber, the bond
strength of the concrete is 20 percent and 22 percent greater than the reference concrete after 28 days of
curing, respectively.
0
0.5
1
1.5
2
2.5
3
3.5
4
4.5
5
(Mp
a)
7 Days 14 Dyas 28 Days
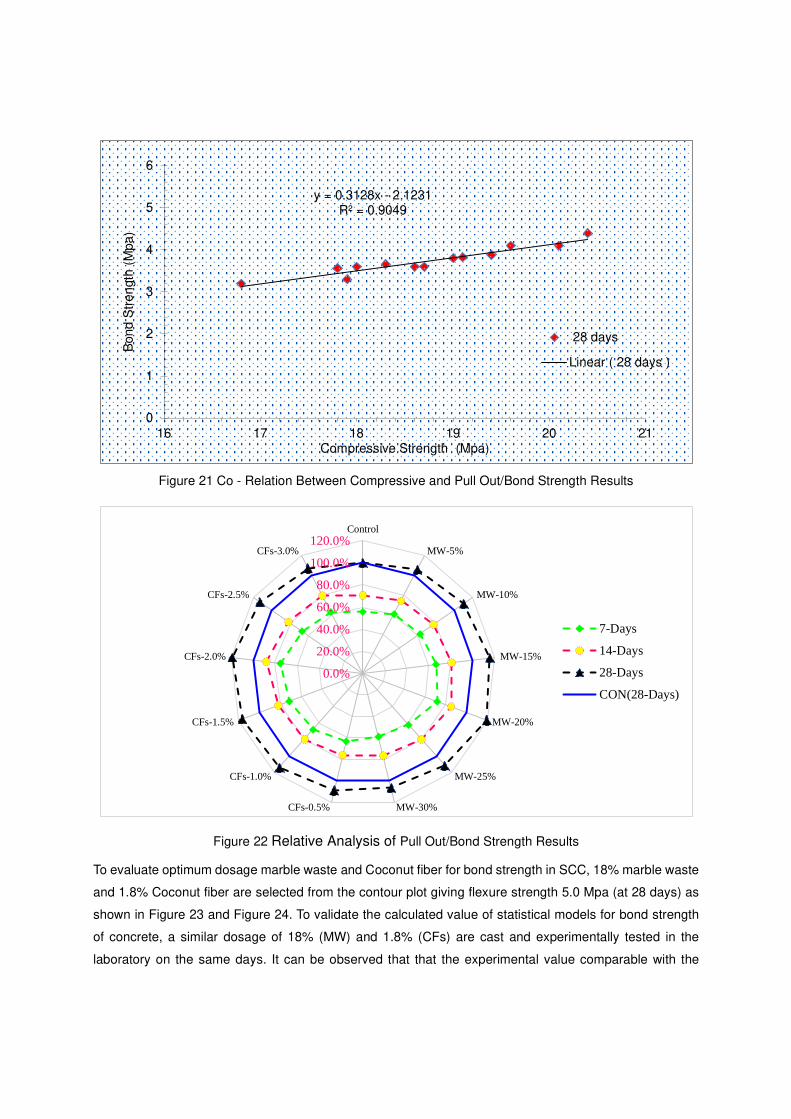
Figure 21 Co - Relation Between Compressive and Pull Out/Bond Strength Results
Figure 22 Relative Analysis of Pull Out/Bond Strength Results
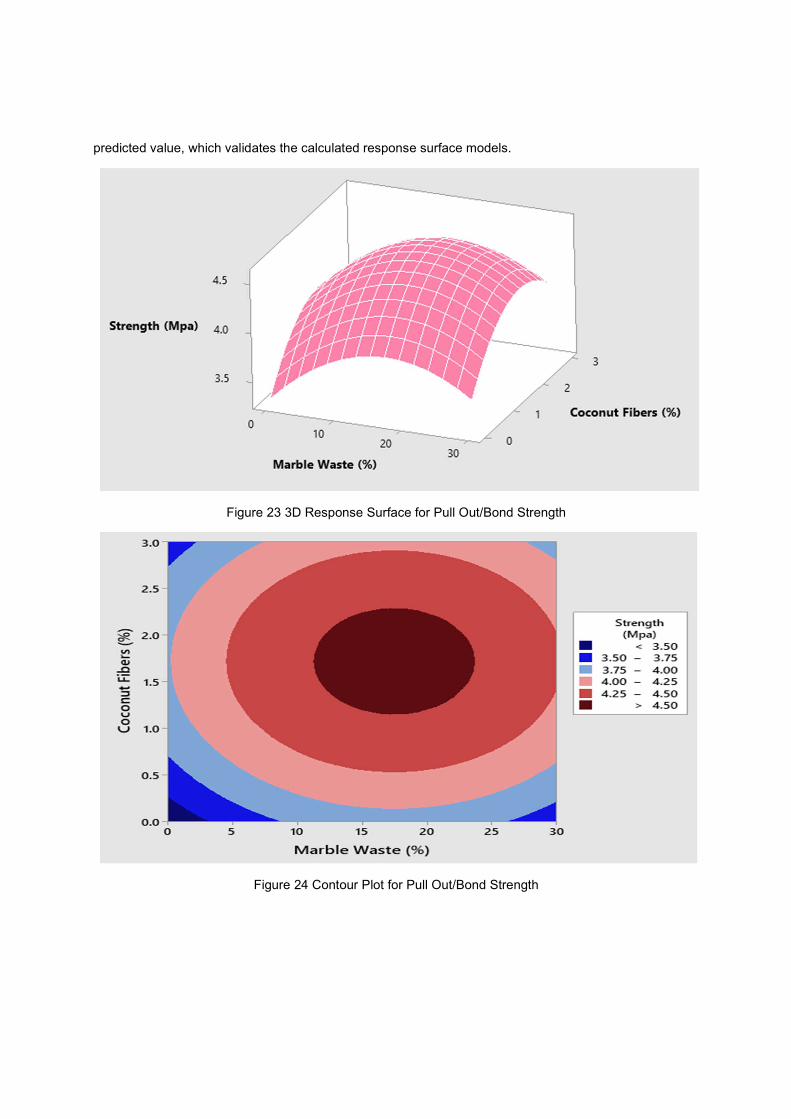
To evaluate optimum dosage marble waste and Coconut fiber for bond strength in SCC, 18% marble waste
and 1.8% Coconut fiber are selected from the contour plot giving flexure strength 5.0 Mpa (at 28 days) as
shown in Figure 23 and Figure 24. To validate the calculated value of statistical models for bond strength
of concrete, a similar dosage of 18% (MW) and 1.8% (CFs) are cast and experimentally tested in the
laboratory on the same days. It can be observed that that the experimental value comparable with the
y = 0.3128x - 2.1231R² = 0.9049
0
1
2
3
4
5
6
16 17 18 19 20 21
Bon
d S
tren
gth
(Mpa
)
Compressive Strength (Mpa)
28 days
Linear ( 28 days )
0.0%
20.0%
40.0%
60.0%
80.0%
100.0%
120.0%Control
MW-5%
MW-10%
MW-15%
MW-20%
MW-25%
MW-30%CFs-0.5%
CFs-1.0%
CFs-1.5%
CFs-2.0%
CFs-2.5%
CFs-3.0%
7-Days
14-Days
28-Days
CON(28-Days)
predicted value, which validates the calculated response surface models.
Figure 23 3D Response Surface for Pull Out/Bond Strength
Figure 24 Contour Plot for Pull Out/Bond Strength
4 Conclusion
In this study, a step towards utilization of marble waste (from 0% to 30% by weight of cement) and
coconut fibers (from 0% to 3.0% by weight of cement) has been made in the manufacturing of
sustainable self-fiber compacting concrete. The following conclusion has been drawn based on
experimental work:
• When the proportion of marble waste (Mw) and coconut fibers (CFs) is raised, the flowability and
passing ability of the concrete decreased. However, all the mixes, except for the 2.5 percent and
3.0 percent CFs, demonstrate excellent filling and passing capabilities within the limits specified by
the practical requirement for SCC.
• Mechanical performance improved as the proportion of Mw was increase up to 20 percent addition
and then reduce as compared to the reference concrete. It is because of micro-filling voids in
concrete ingredients as well as pozzolanic reaction of Mw.
• Coconut fibers (CFs) improved mechanical performance up to 2.0 percent addition by weight of
cement and then declines gradually as compared to the reference concrete. The positive influence
on mechanical performance is because of confinement coconut fibers (CFs) around the sample.
However, at higher dosage (beyond 2.0% substitution), the compaction of concrete become more
difficult due lack flowability, resulting pore in harden concrete which decreased mechanical
performance od SCC.
• Based on work results, the predicted value from statistical analysis and the experimental value
were comparable.
• The maximum mechanical performance was achieved at the substitution ratio of 18 percent Mw
and 1.8 percent CFs respectively, having a maximum compressive strength of 23 Mpa which was
almost 37 percent greater than from control mix. Hence 18 percent marble waste (Mw) and 1.8
percent coconut fibers (CFs) were optimal dosage for combined substitution.
Finally, the current research indicates that marble wastes and coconut fibers (CFs) are excellent, abundant,
local eco-materials that are low-cost and may be utilized for SCC manufacturing when viewed from the
viewpoint of both economic and environmental limitations.
Conflicts of Interest: The authors have no conflict of interest to declare.
References
1. EFNARC S (2002) Guidelines for self-compacting concrete. London, UK Assoc House 32:34
2. Okamura H (1997) Self-compacting high-performance concrete. Concr Int 19:50–54
3. Agrawal D, Hinge P, Waghe UP, Raut SP (2014) Utilization of industrial waste in construction
material–A review. Int J Innov Res Sci Eng Technol 3:8390–8397
4. Saikia N, de Brito J (2009) Use of industrial waste and municipality solid waste as aggregate, filler
or fiber in cement mortar and concrete. Adv Mater Sci Res 3:65–116
5. Bederina M, Makhloufi Z, Bounoua A, et al (2013) Effect of partial and total replacement of siliceous
river sand with limestone crushed sand on the durability of mortars exposed to chemical solutions.
Constr Build Mater 47:146–158
6. Raj E P. Singh Kuswah, Prof (Dr.) Ishwar Chand Sharma and Prof (Dr.) PBL Chaurasia
(2015),“Utilization of Marble Slurry in Cement Concrete Replacing Fine Aggregate.” Am J Eng Res
4:55–58
7. El Haggar S (2010) Sustainable industrial design and waste management: cradle-to-cradle for
sustainable development. Academic Press
8. Corinaldesi V, Moriconi G, Naik TR (2010) Characterization of marble powder for its use in mortar
and concrete. Constr Build Mater 24:113–117
9. Karaşahin M, Terzi S (2007) Evaluation of marble waste dust in the mixture of asphaltic concrete.
Constr Build Mater 21:616–620
10. Hebhoub H, Aoun H, Belachia M, et al (2011) Use of waste marble aggregates in concrete. Constr
Build Mater 25:1167–1171
11. Ismail S, Ramli M (2013) Engineering properties of treated recycled concrete aggregate (RCA) for
structural applications. Constr Build Mater 44:464–476
12. Dosho Y (2007) Development of a sustainable concrete waste recycling system. J Adv Concr
Technol 5:27–42
13. Shirulea PA (2012) AtaurRahmanb, and Rakesh D. Guptac." Partial Replacement of Cement with
Marble Dust Powder.". Int J Adv Eng Res Stud ISSN2249 8974:
14. Katuwal K, Duarah A, Sarma MK, et al Comparative Study of M35 Concrete using Marble Dust as
Partial Replacement of Cement and Fine Aggregate
15. Latha G, Reddy AS, Mounika K (2015) Experimental investigation on strength characteristics of
concrete using waste marble powder as cementitious material. Growth 4:
16. Vigneshpandian G V, Shruthi EA, Venkatasubramanian C, Muthu D (2017) Utilisation of Waste
Marble Dust as Fine Aggregate in Concrete. In: IOP Conference Series: Earth and Environmental
Science. IOP Publishing, p 12007
17. Kore SD, Vyas AK (2016) Impact of marble waste as coarse aggregate on properties of lean cement
concrete. Case Stud Constr Mater 4:85–92
18. Kumar P (2006) Self-compacting concrete: methods of testing and design. J Inst Eng India Civ Eng
Div 86:145–150
19. Ahmadi MA, Alidoust O, Sadrinejad I, Nayeri M (2007) Development of mechanical properties of
self compacting concrete contain rice husk ash. Int J Comput Information, Syst Sci Eng 1:259–262
20. Şahmaran M, Christianto HA, Yaman İÖ (2006) The effect of chemical admixtures and mineral
additives on the properties of self-compacting mortars. Cem Concr Compos 28:432–440
21. Coppola L, Cerulli T, Salvioni D (2004) Sustainable development and durability of self-compacting
concretes. In: 8th CANMET/ACI Int. Conf. on Fly Ash, Silica Fume, Slag and Natural Pozzolans in
Concrete. pp 29–50
22. Felekoğlu B, Türkel S, Baradan B (2007) Effect of water/cement ratio on the fresh and hardened
properties of self-compacting concrete. Build Environ 42:1795–1802
23. Banthia N (2010) Report on the physical properties and durability of fiber-reinforced concrete
24. Vandewalle L, Nemegeer D, Balazs L, et al (2003) RILEM TC 162-TDF: Test and design methods
for steel fibre reinforced concrete’-sigma-epsilon-design method-Final Recommendation. Mater
Struct 36:560–567
25. Khaleel OR, Al-Mishhadani SA, Razak HA (2011) The effect of coarse aggregate on fresh and
hardened properties of self-compacting concrete (SCC). Procedia Eng 14:805–813
26. Zhu W (2020) Permeation properties of self-compaction concrete. In: Self-Compacting Concrete:
Materials, Properties and Applications. Elsevier, pp 117–130
27. Pereira ENB, Barros JAO, Ribeiro AF, Camões A (2004) Post-cracking behaviour of selfcompacting
steel fibre reinforced concrete
28. Islam GMS, Gupta S Das (2016) Evaluating plastic shrinkage and permeability of polypropylene
fiber reinforced concrete. Int J Sustain Built Environ 5:345–354
29. Bentur A (2000) Role of interfaces in controlling durability of fiber-reinforced cements. J Mater Civ
Eng 12:2–7
30. Hossain MA, Rahman MM, Morshed AZ, Haque SKM INVESTIGATION OF THE EFFECT OF
NYLON FIBER IN CONCRETE REHABILITATION
31. Singh AP (2013) Strength and permeability characteristics of steel fibre reinforced concrete. Int J
Civil, Archit Sci Eng 7:211–216
32. Ahmad J, Manan A, Ali A, et al A Study on Mechanical and Durability Aspects of Concrete Modified
with Steel Fibers (SFs)
33. Cement AP ASTM C150 of the following type: 1. Concr which will be contact with Sew Type II,
Moderate Sulfate Resist 2:
34. EN TS (2009) 934-2 “Admixtures For Concrete, Mortar and Grout-Part 2: Concrete Admixtures;
Definitions, Requirements, Conformity, Marking and Labelling.” Br Stand Inst
35. High-Range W-RA, Admixture R ASTM C 494/C 494M. Type F
36. Grout F ASTM C 476, except with a maximum slump of 4 inches, as measured according to ASTM
C 143. C 143M
37. C39/C39M A (2003) Standard test method for compressive strength of cylindrical concrete
specimens. Annu B ASTM Stand
38. Standard A (2010) C78. 2010. Stand Test Method Flexural Strength Concr (Using Simple Beam
with Third-Point Load (ASTM C78-10) West Conshohocken, PA ASTM Int
39. Shannag MJ, Brincker R, Hansen W (1997) Pullout behavior of steel fibers from cement-based
composites. Cem Concr Res 27:925–936
40. Specimen CT ASTM C 31; one set of four standard cylinders for each compressive-strength test,
unless otherwise directed. Mold store Cylind Lab test specimens Except when field-cured test
specimens are required
41. Ahmad J, Zaid O, Shahzaib M, et al (2021) Mechanical properties of sustainable concrete modified
by adding marble slurry as cement substitution. AIMS Mater Sci 8:343–358
42. Hamzah AF, Ibrahim MHW, Jamaluddin N, et al (2015) Fresh characteristic and mechanical
compressive strength development of self-compacting concrete integrating coal bottom ash as
partial fine aggregates replacement. Int J Mech Mechatronics Eng 15:61–67
43. Iqbal S, Ali A, Holschemacher K, et al (2017) Effect of fly ash on properties of self-compacting high
strength lightweight concrete. Period Polytech Civ Eng 61:81–87
44. Baboo R, Khan HN, Kr A, et al (2011) Influence of Marble powder/granules in Concrete mix. Int J
Civ Struct Eng 1:827–834
45. Al-Akhras NM, Abu-Alfoul BA (2002) Effect of wheat straw ash on mechanical properties of
autoclaved mortar. Cem Concr Res 32:859–863
46. Kikuchi T, Shintani Y, Hirashima T, Kohno M (2020) Mechanical properties of steel fiber reinforced
concrete at high temperature. J Struct Constr Eng 85:169–176
47. Tadepalli PR, Mo YL, Hsu TTC (2013) Mechanical properties of steel fibre concrete. Mag Concr Res
65:462–474
48. Usman M, Farooq SH, Umair M, Hanif A (2020) Axial compressive behavior of confined steel fiber
reinforced high strength concrete. Constr Build Mater 230:117043
49. Oehlert GW (2000) Design and analysis of experiments: Response surface design. New York
50. Designation A (1976) C496‐71. Stand Method Test Split Tensile Strength Cylind Concr Specimens
51. Toubal Seghir N, Mellas M, Sadowski Ł, et al (2019) The utilization of waste marble dust as a cement
replacement in air-cured mortar. Sustainability 11:2215
52. Amin SK, Allam ME, Garas GL, Ezz H (2020) A study of the chemical effect of marble and granite
slurry on green mortar compressive strength. Bull Natl Res Cent 44:19
53. Williamson GR (1974) The effect of steel fibers on the compressive strength of concrete. Spec Publ
44:195–208
54. Lim JC, Ozbakkaloglu T (2014) Confinement model for FRP-confined high-strength concrete. J
Compos Constr 18:4013058
55. Deluce JR, Vecchio FJ (2013) Cracking Behavior of Steel Fiber-Reinforced Concrete Members
Containing Conventional Reinforcement. ACI Struct J 110:
56. Ashby MF (2011) Materials selection in mechanical design (Burlington, MA
57. Belachia M, Aoun H, Hebhoub H (2006) Marble wastes as a substitute in hydraulic concrete. SOLID
WASTE Technol Manag 456–463

58. Ahmad J, Al-Dala’ien RNS, Manan A, et al (2020) Evaluating the effects of flexure cracking
behaviour of beam reinforced with steel fibres from environment affect. J Green Eng 10:4998–5016