Embed Size (px)
Citation preview
Civil Engineering Infrastructures Journal, 52(2): 205 – 224, December 2019
Print ISSN: 2322-2093; Online ISSN: 2423-6691
DOI: 10.22059/ceij.2019.257833.1484
* Corresponding author E-mail: [email protected]
205
Performance of Nondestructive Sonic Echo Testing Method on Partially
Dismantled Unknown Wood Bridge Foundations; A Case Study
Rashidyan, S.1*, Maji, A.2 and Ng, T.T.3
1 Senior Lecturer, Department of Engineering Technology, University of North Texas,
Denton, Texas, USA. 2 Professor Emeritus, Civil Engineering Department, University of New Mexico,
Albuquerque, NM, USA. 3 Professor, Civil Engineering Department, University of New Mexico, Albuquerque, NM,
USA.
Received: 13 May 2018; Revised: 29 May 2019; Accepted: 30 Sep. 2019
ABSTRACT: Sonic Echo (SE) testing method is a well-known, versatile method to gather
information pertaining to unknown bridge foundations. Many studies on the applicability and
methodology improvement of SE tests to evaluate individual piles and foundations
supporting the superstructure have been reported previously. However, there is a rare
opportunity for obtaining the performance of SE tests without the bridge deck. In the current
study, three piles of a dismantled unknown bridge foundation were tested. Unusual
vibrations on velocity signals were found which are independent of the location of the
sensors. Such signals do not contain identifiable echoes from the pile toe. Therefore, they
cannot be used to determine the depth of the piles. The results and observations of this study
show that there is little future application for conducting SE tests on bridges that are out of
service.
Keywords: Foundation, Nondestructive, Pile, Sonic Echo, Wood.
INTRODUCTION
Unknown bridge foundations may be
vulnerable to scour. Thus, in order to
determine scour risk, it is important to assess
the characteristics of such foundations,
particularly the type and depth of
foundations. Conventional excavation
methods used to evaluate unknown bridge
foundations, such as coring and boring, are
expensive, destructive, and limited in their
application. Many nondestructive testing
(NDT) technologies have been purposed and
utilized to assess the condition of civil
infrastructure and materials (Briaud et al.,
2002; Chidambarathanu, 2019; Ghasemzadeh
and Abounouri, 2013; Lai et al., 2012;
Rashidyan et al., 2019). Among common
NDT methods, the Sonic Echo (SE) method
is a well-known, economical method which
can be used to collect the specifications of
unknown bridge foundations.
The SE Test is performed based on the
principle of longitudinal wave propagation in
long rods.
Consider the free vibration of an infinitely
long rod with cross sectional area, A,
Young’s modulus E, Poisson’s ratio v, and
Rashidyan, S. et al.
206
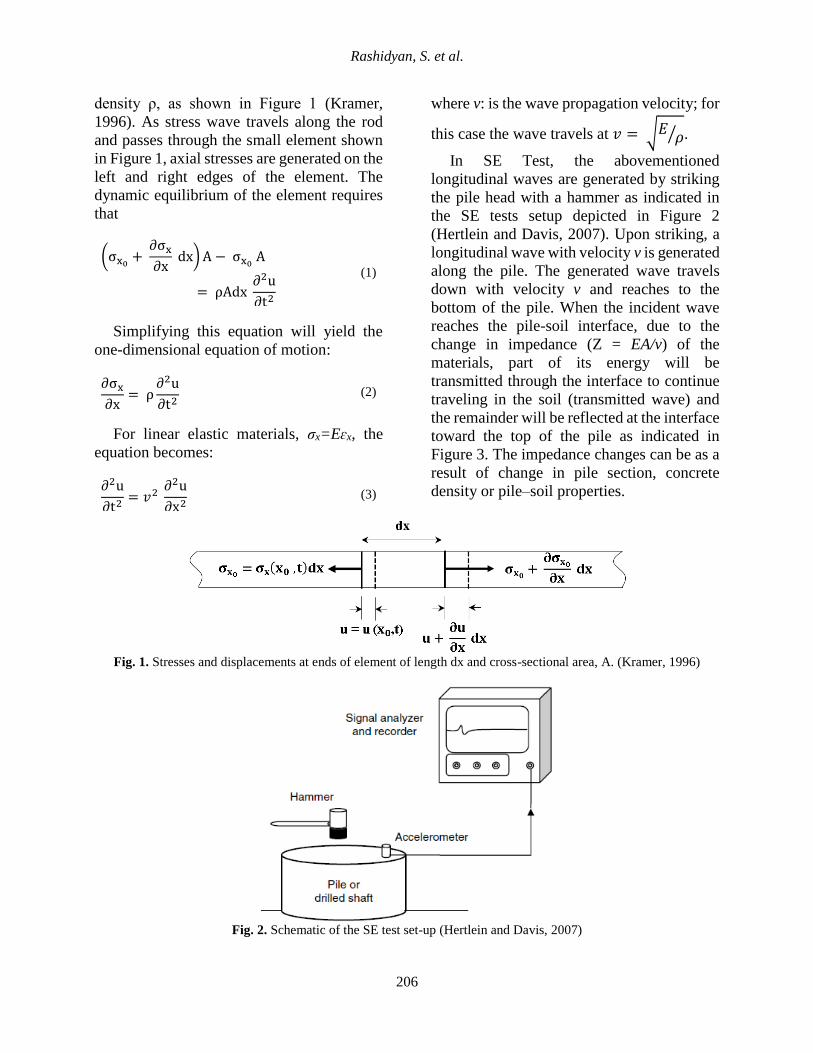
density ρ, as shown in Figure 1 (Kramer,
1996). As stress wave travels along the rod
and passes through the small element shown
in Figure 1, axial stresses are generated on the
left and right edges of the element. The
dynamic equilibrium of the element requires
that
(σx0+
∂σx
∂x dx) A − σx0
A
= ρAdx ∂2u
∂t2
(1)
Simplifying this equation will yield the
one-dimensional equation of motion:
∂σx
∂x= ρ
∂2u
∂t2 (2)
For linear elastic materials, σx=Eɛx, the
equation becomes:
∂2u
∂t2= 𝑣2
∂2u
∂x2 (3)
where v: is the wave propagation velocity; for
this case the wave travels at 𝑣 = √𝐸𝜌⁄ .
In SE Test, the abovementioned
longitudinal waves are generated by striking
the pile head with a hammer as indicated in
the SE tests setup depicted in Figure 2
(Hertlein and Davis, 2007). Upon striking, a
longitudinal wave with velocity v is generated
along the pile. The generated wave travels
down with velocity v and reaches to the
bottom of the pile. When the incident wave
reaches the pile-soil interface, due to the
change in impedance (Z = EA/v) of the
materials, part of its energy will be
transmitted through the interface to continue
traveling in the soil (transmitted wave) and
the remainder will be reflected at the interface
toward the top of the pile as indicated in
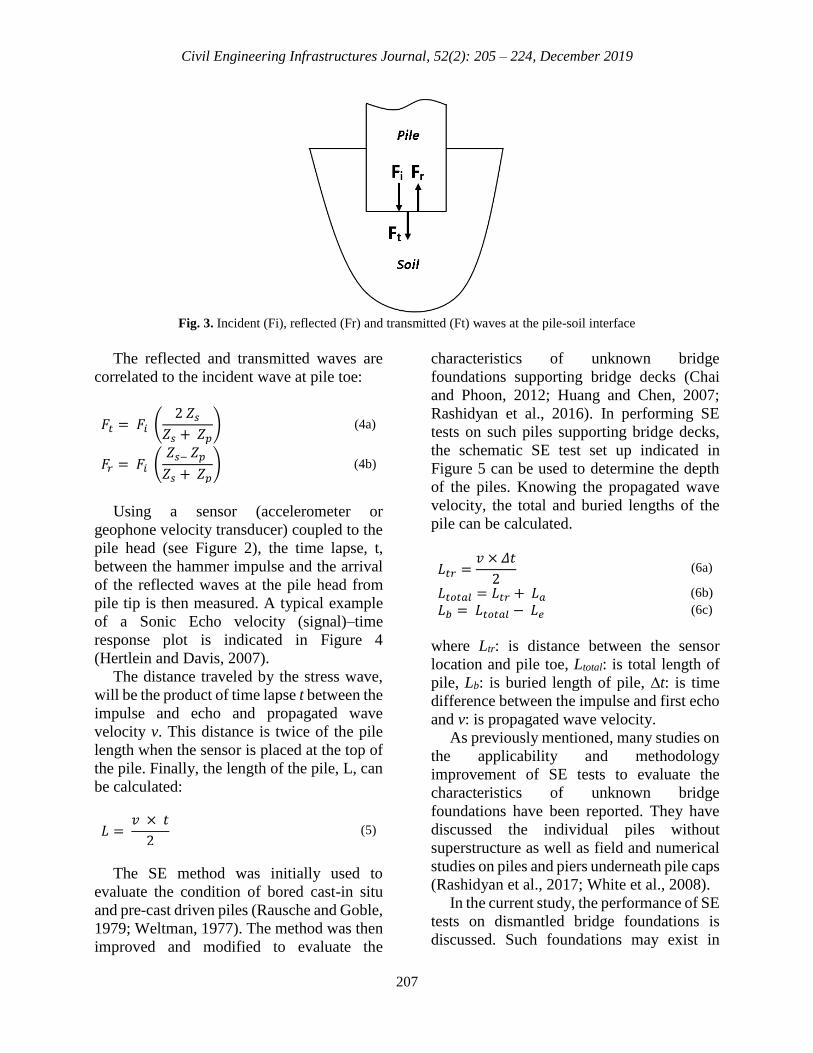
Figure 3. The impedance changes can be as a
result of change in pile section, concrete
density or pile–soil properties.
Fig. 1. Stresses and displacements at ends of element of length dx and cross-sectional area, A. (Kramer, 1996)
Fig. 2. Schematic of the SE test set-up (Hertlein and Davis, 2007)
Civil Engineering Infrastructures Journal, 52(2): 205 – 224, December 2019
207
Fig. 3. Incident (Fi), reflected (Fr) and transmitted (Ft) waves at the pile-soil interface
The reflected and transmitted waves are
correlated to the incident wave at pile toe:
𝐹𝑡 = 𝐹𝑖 (2 𝑍𝑠
𝑍𝑠 + 𝑍𝑝) (4a)
𝐹𝑟 = 𝐹𝑖 (𝑍𝑠− 𝑍𝑝
𝑍𝑠 + 𝑍𝑝) (4b)
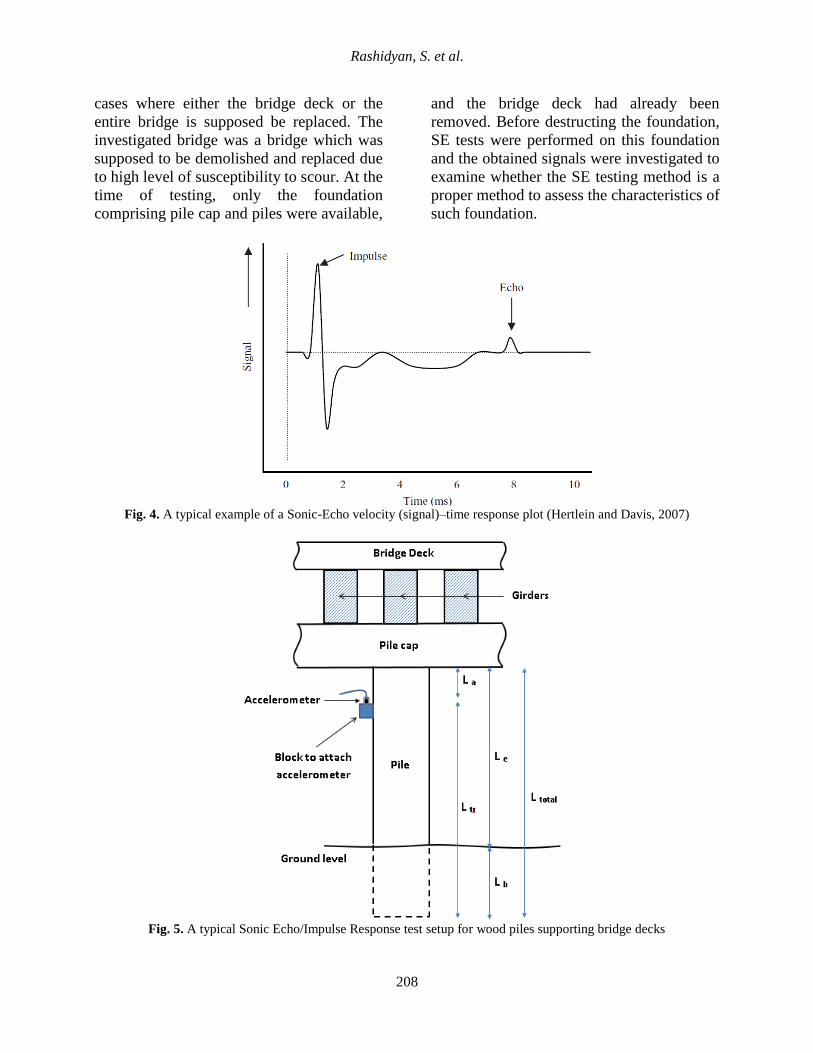
Using a sensor (accelerometer or
geophone velocity transducer) coupled to the
pile head (see Figure 2), the time lapse, t,
between the hammer impulse and the arrival
of the reflected waves at the pile head from
pile tip is then measured. A typical example
of a Sonic Echo velocity (signal)–time
response plot is indicated in Figure 4
(Hertlein and Davis, 2007).
The distance traveled by the stress wave,
will be the product of time lapse t between the
impulse and echo and propagated wave
velocity v. This distance is twice of the pile
length when the sensor is placed at the top of
the pile. Finally, the length of the pile, L, can
be calculated:
𝐿 = 𝑣 × 𝑡
2 (5)
The SE method was initially used to
evaluate the condition of bored cast-in situ
and pre-cast driven piles (Rausche and Goble,
1979; Weltman, 1977). The method was then
improved and modified to evaluate the
characteristics of unknown bridge
foundations supporting bridge decks (Chai
and Phoon, 2012; Huang and Chen, 2007;
Rashidyan et al., 2016). In performing SE
tests on such piles supporting bridge decks,
the schematic SE test set up indicated in
Figure 5 can be used to determine the depth
of the piles. Knowing the propagated wave
velocity, the total and buried lengths of the
pile can be calculated.
𝐿𝑡𝑟 =𝑣 × 𝛥𝑡
2 (6a)
𝐿𝑡𝑜𝑡𝑎𝑙 = 𝐿𝑡𝑟 + 𝐿𝑎 (6b)
𝐿𝑏 = 𝐿𝑡𝑜𝑡𝑎𝑙 − 𝐿𝑒 (6c)
where Ltr: is distance between the sensor
location and pile toe, Ltotal: is total length of
pile, Lb: is buried length of pile, ∆t: is time
difference between the impulse and first echo
and v: is propagated wave velocity.
As previously mentioned, many studies on
the applicability and methodology
improvement of SE tests to evaluate the
characteristics of unknown bridge
foundations have been reported. They have
discussed the individual piles without
superstructure as well as field and numerical
studies on piles and piers underneath pile caps
(Rashidyan et al., 2017; White et al., 2008).
In the current study, the performance of SE
tests on dismantled bridge foundations is
discussed. Such foundations may exist in
Rashidyan, S. et al.
208
cases where either the bridge deck or the
entire bridge is supposed be replaced. The
investigated bridge was a bridge which was
supposed to be demolished and replaced due
to high level of susceptibility to scour. At the
time of testing, only the foundation
comprising pile cap and piles were available,
and the bridge deck had already been
removed. Before destructing the foundation,
SE tests were performed on this foundation
and the obtained signals were investigated to
examine whether the SE testing method is a
proper method to assess the characteristics of
such foundation.
Fig. 4. A typical example of a Sonic-Echo velocity (signal)–time response plot (Hertlein and Davis, 2007)
Fig. 5. A typical Sonic Echo/Impulse Response test setup for wood piles supporting bridge decks
Civil Engineering Infrastructures Journal, 52(2): 205 – 224, December 2019
209
METHODOLOGY
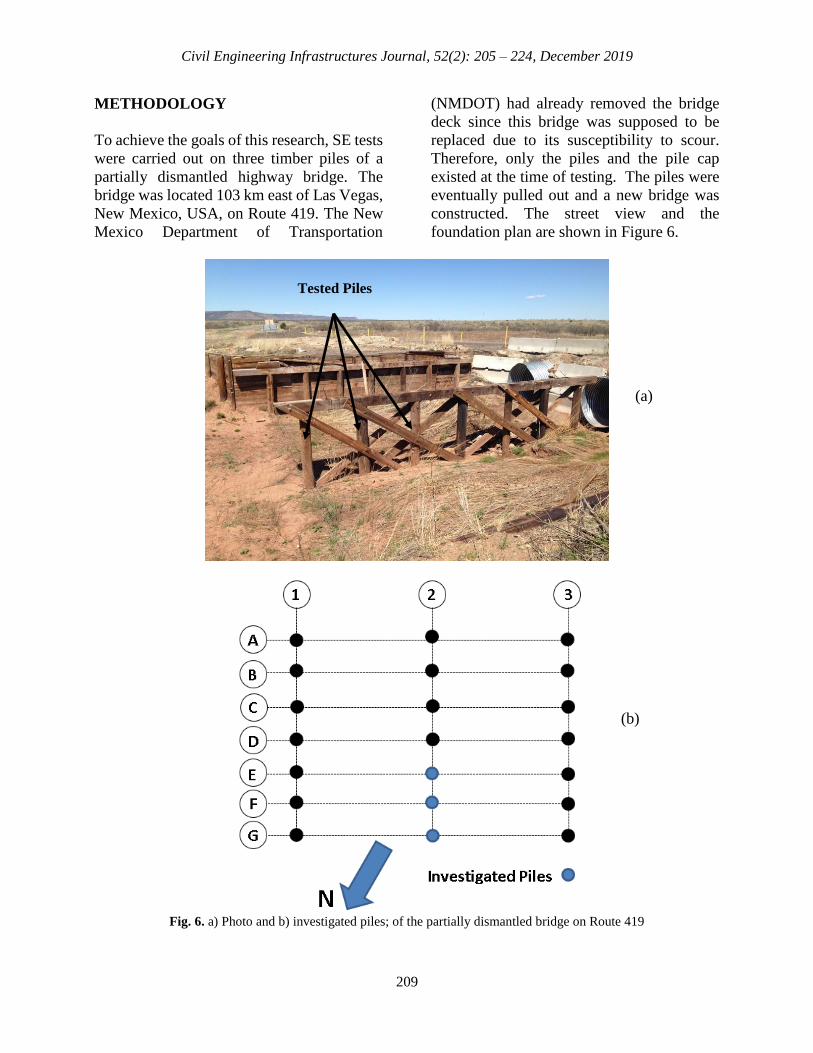
To achieve the goals of this research, SE tests
were carried out on three timber piles of a
partially dismantled highway bridge. The
bridge was located 103 km east of Las Vegas,
New Mexico, USA, on Route 419. The New
Mexico Department of Transportation
(NMDOT) had already removed the bridge
deck since this bridge was supposed to be
replaced due to its susceptibility to scour.
Therefore, only the piles and the pile cap
existed at the time of testing. The piles were
eventually pulled out and a new bridge was
constructed. The street view and the
foundation plan are shown in Figure 6.
Fig. 6. a) Photo and b) investigated piles; of the partially dismantled bridge on Route 419
Tested Piles
(a)
(b)
Rashidyan, S. et al.
210
SE test procedure was followed step by
step in conducting the field tests:
Striking and Receiver Setup
Numerous SE tests were performed by
striking a hammer on the foundation.
Depending on the accessibility of the pile top,
different striking methods can be used to
generate sonic waves along the pile. In this
research, striking methods such as central and
eccentric vertical striking on top surface of
pile cap, and upward vertical striking on the
bottom surface of pile cap were examined.
The effect of striking method on the obtained
signals was investigated. It should be noted
that the downward strikes generate
compressive waves, whereas upward strikes
impart tensile waves into the piles. Since the
piles’ tops were not accessible, the
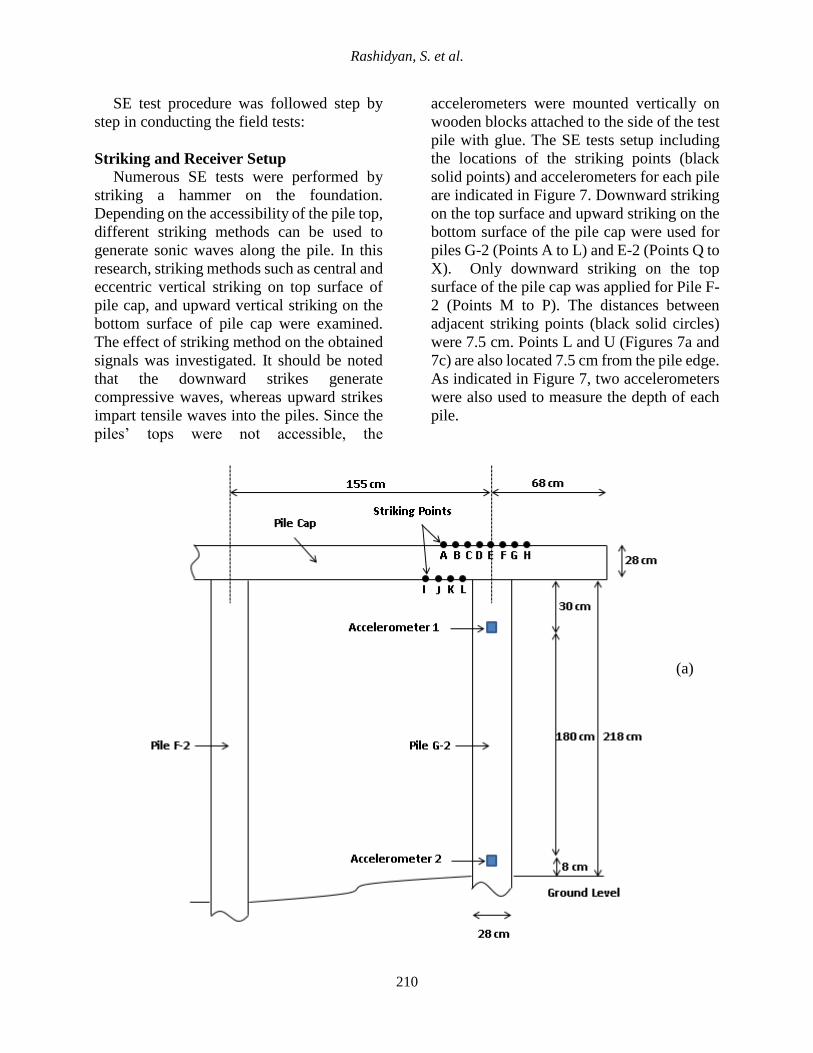
accelerometers were mounted vertically on
wooden blocks attached to the side of the test
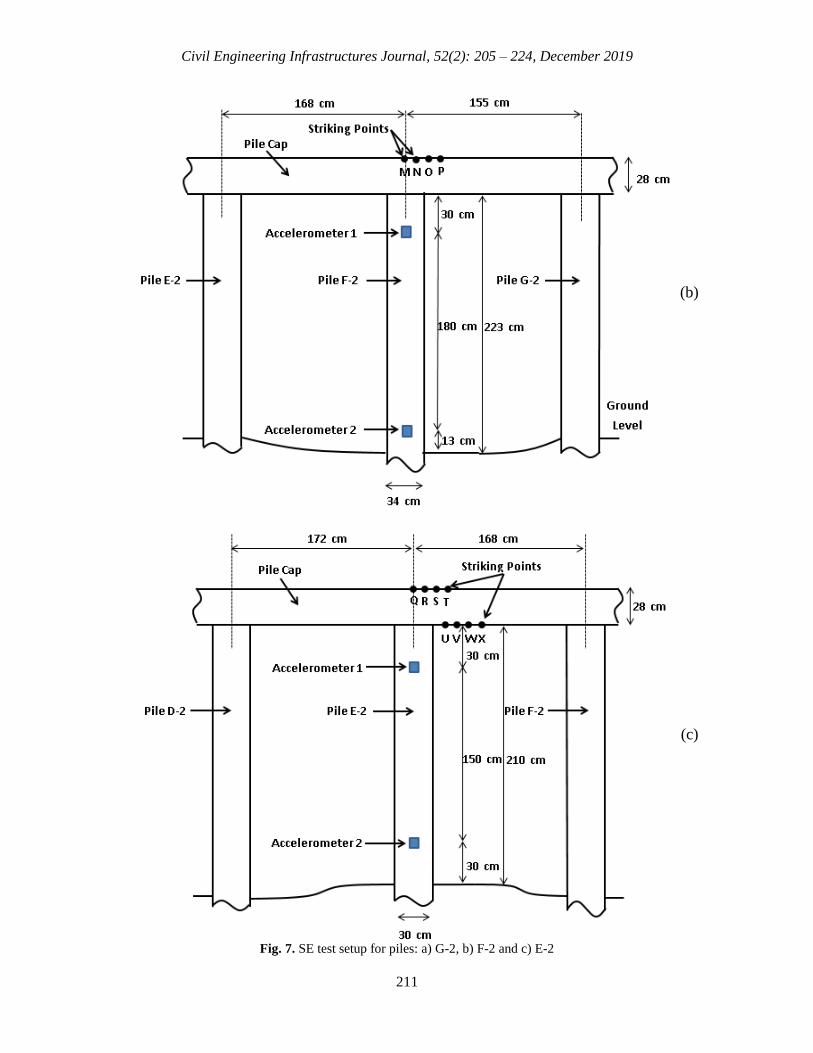
pile with glue. The SE tests setup including
the locations of the striking points (black
solid points) and accelerometers for each pile
are indicated in Figure 7. Downward striking
on the top surface and upward striking on the
bottom surface of the pile cap were used for
piles G-2 (Points A to L) and E-2 (Points Q to
X). Only downward striking on the top
surface of the pile cap was applied for Pile F-
2 (Points M to P). The distances between
adjacent striking points (black solid circles)
were 7.5 cm. Points L and U (Figures 7a and
7c) are also located 7.5 cm from the pile edge.
As indicated in Figure 7, two accelerometers
were also used to measure the depth of each
pile.
(a)
Civil Engineering Infrastructures Journal, 52(2): 205 – 224, December 2019
211
Fig. 7. SE test setup for piles: a) G-2, b) F-2 and c) E-2
(b)
(c)
Rashidyan, S. et al.
212
Hardware Assembly and Data Acquisition The utilized equipment, Freedom Data PC
(FDPC) was acquired pursuant to ASTM
D5882-07-2013 (American Society for
Testing Materials, 2013) and ACI 228.2R-13
(American Concrete Institution, 2013). The
FDPC provides the user with flexibility for
stress-wave based NDT condition evaluation
of different type of materials. Two 100mv/g
accelerometers, and an instrumented hammer
were also used to conduct the tests.
Data Processing
The velocity amplitude-time graphs
obtained from the accelerometers were
investigated to determine the pile lengths by
using Eq. (6). The mechanical properties of
the utilized wood material (Southern Pike)
were obtained from national design
specification for wood construction
(American Wood Council, 2018):
Modulus of Elasticity: E = 1,054,600,000
N/m2 (1,500,000 psi)
Specific Gravity Gs = 0.55
Poisson’s ratio μ = 0.328 (United States
Department of Agriculture Forest Service,
2010)
Using the abovementioned values, the
propagated wave velocity is calculated.
𝑣 = √𝐸
𝜌= √
105406000 ×9.81
0.55 ×1000= 4337 𝑚/𝑠
OBSERVATIONS AND DISCUSSION
Pile G-2
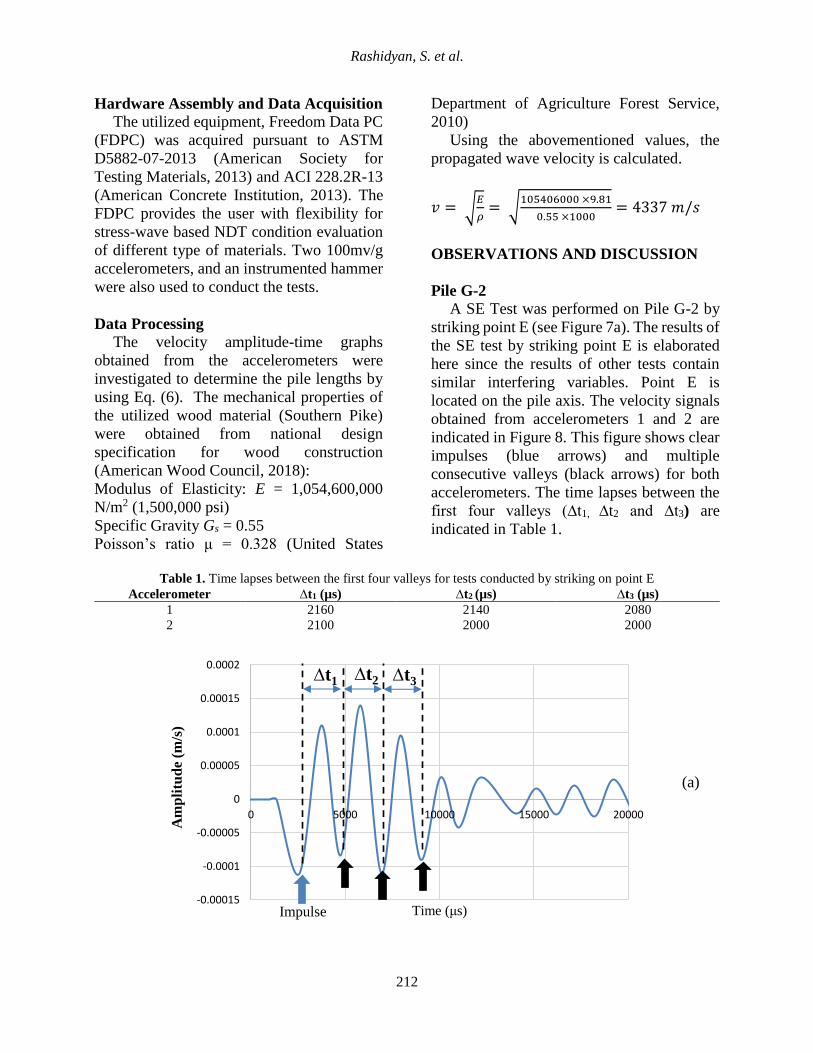
A SE Test was performed on Pile G-2 by
striking point E (see Figure 7a). The results of
the SE test by striking point E is elaborated
here since the results of other tests contain
similar interfering variables. Point E is
located on the pile axis. The velocity signals
obtained from accelerometers 1 and 2 are
indicated in Figure 8. This figure shows clear
impulses (blue arrows) and multiple
consecutive valleys (black arrows) for both
accelerometers. The time lapses between the
first four valleys (∆t1, ∆t2 and ∆t3) are
indicated in Table 1.
Table 1. Time lapses between the first four valleys for tests conducted by striking on point E
Accelerometer ∆t1 (µs) ∆t2 (µs) ∆t3 (µs)
1 2160 2140 2080
2 2100 2000 2000
-0.00015
-0.0001
-0.00005
0
0.00005
0.0001
0.00015
0.0002
0 5000 10000 15000 20000
Am
pli
tud
e (m
/s)
Time (μs)
∆t1 ∆t3∆t2
(a)
Impulse
Civil Engineering Infrastructures Journal, 52(2): 205 – 224, December 2019
213
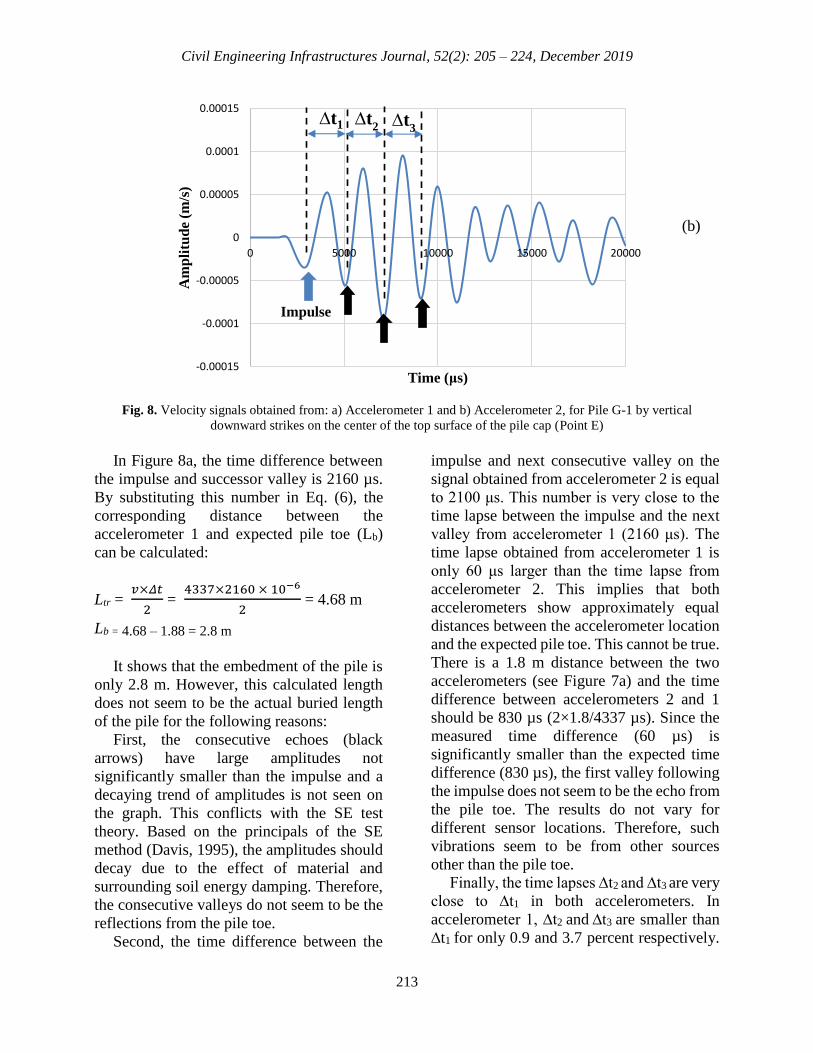
Fig. 8. Velocity signals obtained from: a) Accelerometer 1 and b) Accelerometer 2, for Pile G-1 by vertical
downward strikes on the center of the top surface of the pile cap (Point E)
In Figure 8a, the time difference between
the impulse and successor valley is 2160 µs.
By substituting this number in Eq. (6), the
corresponding distance between the
accelerometer 1 and expected pile toe (Lb)
can be calculated:
Ltr = 𝑣×𝛥𝑡
2 =
4337×2160 × 10−6
2 = 4.68 m
Lb = 4.68 – 1.88 = 2.8 m
It shows that the embedment of the pile is
only 2.8 m. However, this calculated length
does not seem to be the actual buried length
of the pile for the following reasons:
First, the consecutive echoes (black
arrows) have large amplitudes not
significantly smaller than the impulse and a
decaying trend of amplitudes is not seen on
the graph. This conflicts with the SE test
theory. Based on the principals of the SE
method (Davis, 1995), the amplitudes should
decay due to the effect of material and
surrounding soil energy damping. Therefore,
the consecutive valleys do not seem to be the
reflections from the pile toe.
Second, the time difference between the
impulse and next consecutive valley on the
signal obtained from accelerometer 2 is equal
to 2100 μs. This number is very close to the
time lapse between the impulse and the next
valley from accelerometer 1 (2160 μs). The
time lapse obtained from accelerometer 1 is
only 60 μs larger than the time lapse from
accelerometer 2. This implies that both
accelerometers show approximately equal
distances between the accelerometer location
and the expected pile toe. This cannot be true.
There is a 1.8 m distance between the two
accelerometers (see Figure 7a) and the time
difference between accelerometers 2 and 1
should be 830 µs (2×1.8/4337 µs). Since the
measured time difference (60 µs) is
significantly smaller than the expected time
difference (830 µs), the first valley following
the impulse does not seem to be the echo from
the pile toe. The results do not vary for
different sensor locations. Therefore, such
vibrations seem to be from other sources
other than the pile toe.
Finally, the time lapses ∆t2 and ∆t3 are very
close to ∆t1 in both accelerometers. In
accelerometer 1, ∆t2 and ∆t3 are smaller than
∆t1 for only 0.9 and 3.7 percent respectively.
-0.00015
-0.0001
-0.00005
0
0.00005
0.0001
0.00015
0 5000 10000 15000 20000
Am
pli
tud
e (m
/s)
Time (μs)
∆t1
(b)
∆t3 ∆t
2
Impulse
Rashidyan, S. et al.
214
In accelerometer 2, both ∆t2 and ∆t3 are 4.8
percent smaller than ∆t1. The vibration is
harmonic. Such vibrations are not from the
wave travels between the top and bottom of
the pile. For instance, in accelerometer 2, the
distance between the accelerometer and pile
top is 2.10 m. This means the when the
reflected wave from the pile toe passes
through this accelerometer it needs 968 µs
(2×2.1×106 / 4337 µs) to be sensed again after
reflecting from the pile top. However, the
difference between the second and third
valley on the graph is 2000 µs which is more
than twice of the expected travel duration
(968 µs).
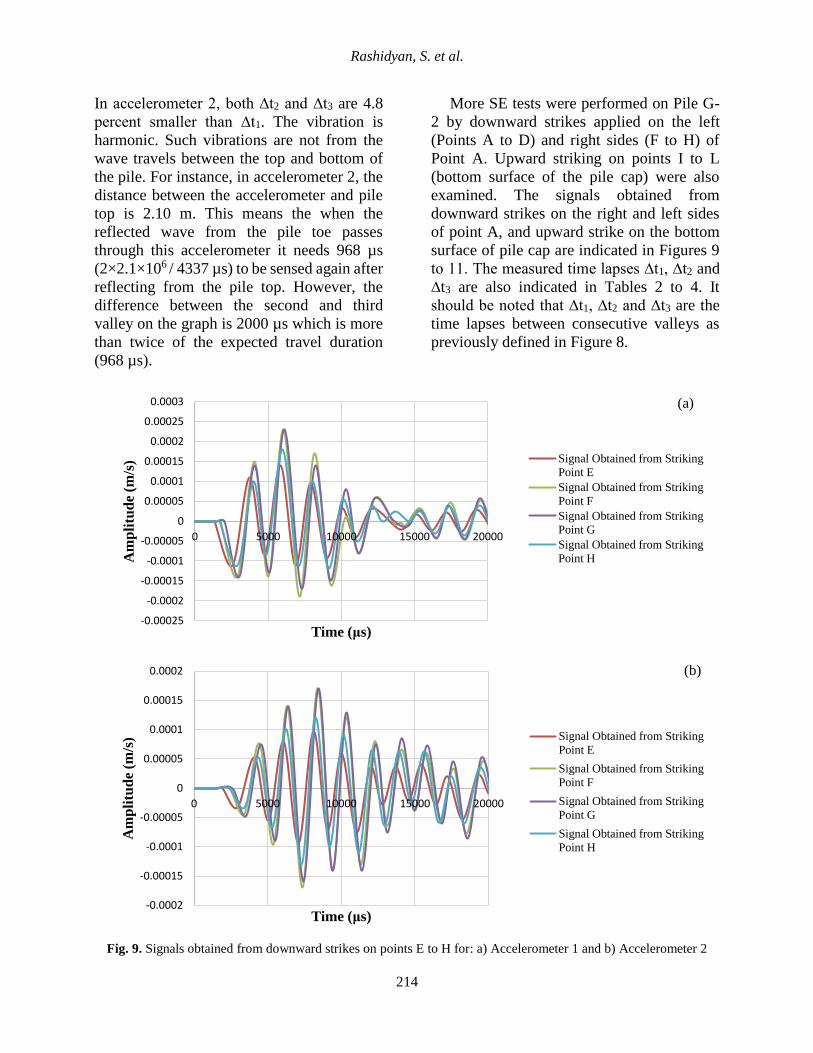
More SE tests were performed on Pile G-
2 by downward strikes applied on the left
(Points A to D) and right sides (F to H) of
Point A. Upward striking on points I to L
(bottom surface of the pile cap) were also
examined. The signals obtained from
downward strikes on the right and left sides
of point A, and upward strike on the bottom
surface of pile cap are indicated in Figures 9
to 11. The measured time lapses ∆t1, ∆t2 and
∆t3 are also indicated in Tables 2 to 4. It
should be noted that ∆t1, ∆t2 and ∆t3 are the
time lapses between consecutive valleys as
previously defined in Figure 8.
Fig. 9. Signals obtained from downward strikes on points E to H for: a) Accelerometer 1 and b) Accelerometer 2
-0.00025
-0.0002
-0.00015
-0.0001
-0.00005
0
0.00005
0.0001
0.00015
0.0002
0.00025
0.0003
0 5000 10000 15000 20000
Am
pli
tud
e (m
/s)
Time (μs)
Signal Obtained from Striking
Point E
Signal Obtained from Striking
Point F
Signal Obtained from Striking
Point G
Signal Obtained from Striking
Point H
(a)
-0.0002
-0.00015
-0.0001
-0.00005
0
0.00005
0.0001
0.00015
0.0002
0 5000 10000 15000 20000
Am
pli
tud
e (m
/s)
Time (μs)
Signal Obtained from Striking
Point E
Signal Obtained from Striking
Point F
Signal Obtained from Striking
Point G
Signal Obtained from Striking
Point H
(b)
Civil Engineering Infrastructures Journal, 52(2): 205 – 224, December 2019
215
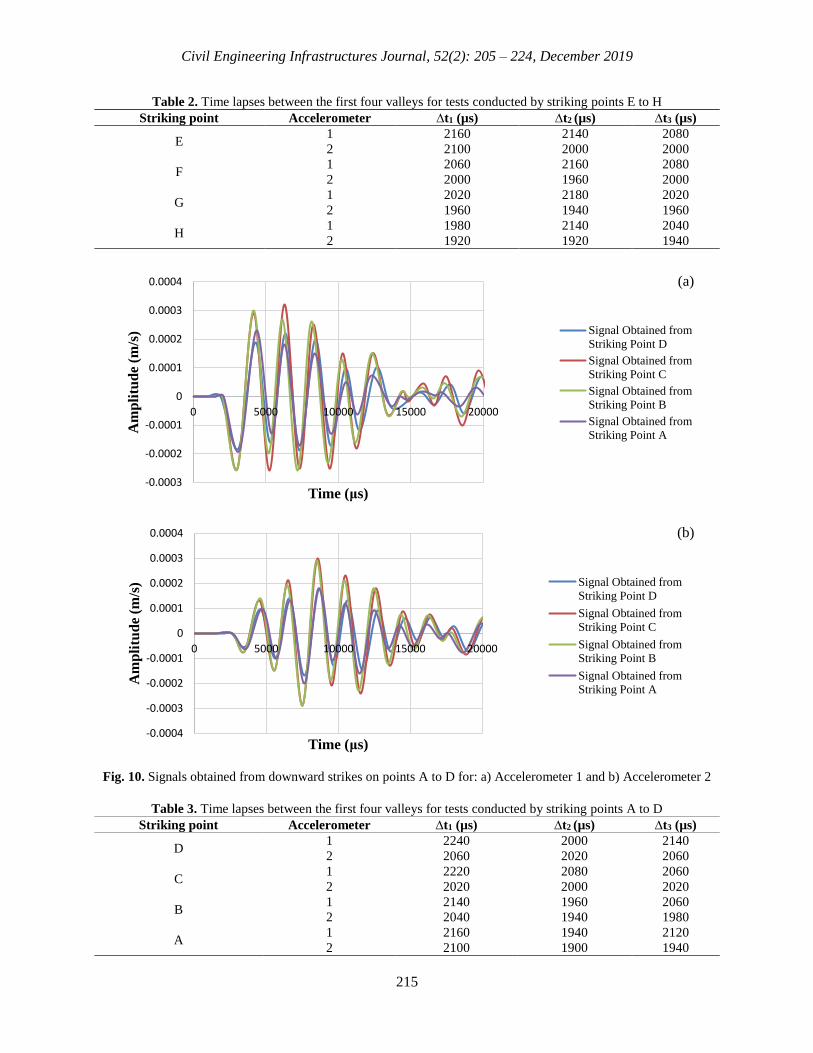
Table 2. Time lapses between the first four valleys for tests conducted by striking points E to H
Striking point Accelerometer ∆t1 (µs) ∆t2 (µs) ∆t3 (µs)
E 1 2160 2140 2080
2 2100 2000 2000
F 1 2060 2160 2080
2 2000 1960 2000
G 1 2020 2180 2020
2 1960 1940 1960
H 1 1980 2140 2040
2 1920 1920 1940
Fig. 10. Signals obtained from downward strikes on points A to D for: a) Accelerometer 1 and b) Accelerometer 2
Table 3. Time lapses between the first four valleys for tests conducted by striking points A to D
Striking point Accelerometer ∆t1 (µs) ∆t2 (µs) ∆t3 (µs)
D 1 2240 2000 2140
2 2060 2020 2060
C 1 2220 2080 2060
2 2020 2000 2020
B 1 2140 1960 2060
2 2040 1940 1980
A 1 2160 1940 2120
2 2100 1900 1940
-0.0003
-0.0002
-0.0001
0
0.0001
0.0002
0.0003
0.0004
0 5000 10000 15000 20000
Am
pli
tud
e (m
/s)
Time (μs)
Signal Obtained from
Striking Point D
Signal Obtained from
Striking Point C
Signal Obtained from
Striking Point B
Signal Obtained from
Striking Point A
(a)
-0.0004
-0.0003
-0.0002
-0.0001
0
0.0001
0.0002
0.0003
0.0004
0 5000 10000 15000 20000
Am
pli
tud
e (m
/s)
Time (μs)
Signal Obtained from
Striking Point D
Signal Obtained from
Striking Point C
Signal Obtained from
Striking Point B
Signal Obtained from
Striking Point A
(b)
Rashidyan, S. et al.
216
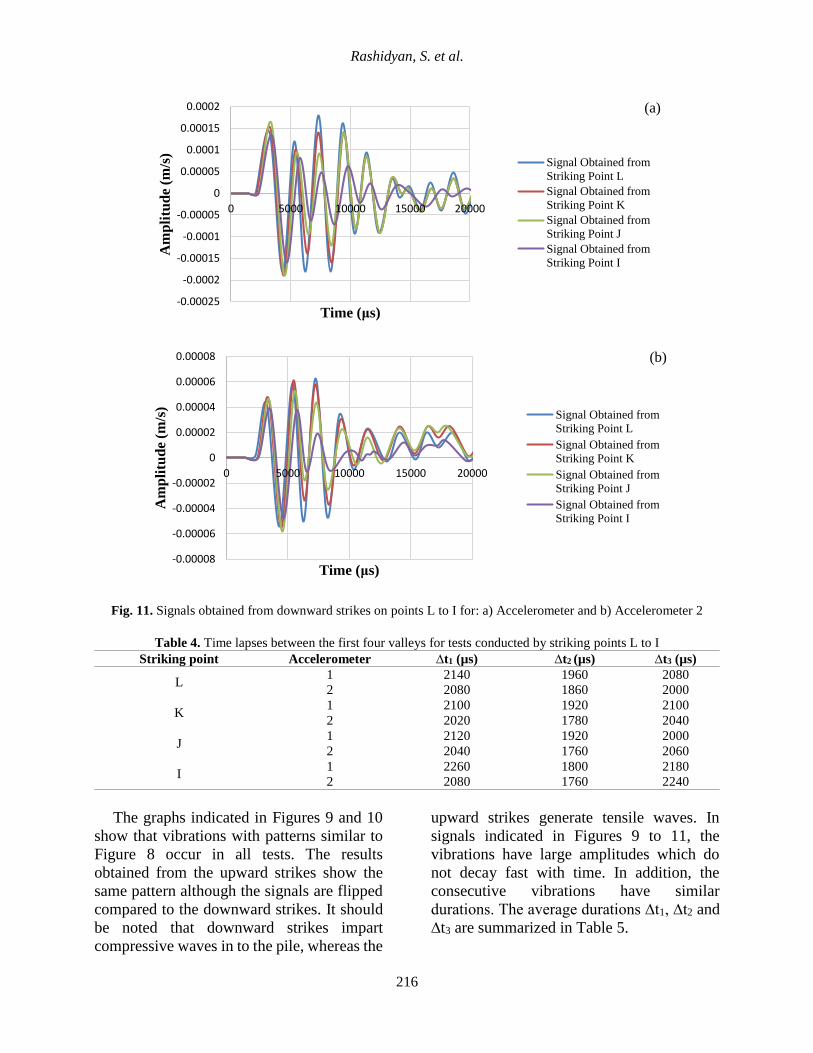
Fig. 11. Signals obtained from downward strikes on points L to I for: a) Accelerometer and b) Accelerometer 2
Table 4. Time lapses between the first four valleys for tests conducted by striking points L to I
Striking point Accelerometer ∆t1 (µs) ∆t2 (µs) ∆t3 (µs)
L 1 2140 1960 2080
2 2080 1860 2000
K 1 2100 1920 2100
2 2020 1780 2040
J 1 2120 1920 2000
2 2040 1760 2060
I 1 2260 1800 2180
2 2080 1760 2240
The graphs indicated in Figures 9 and 10
show that vibrations with patterns similar to
Figure 8 occur in all tests. The results
obtained from the upward strikes show the
same pattern although the signals are flipped
compared to the downward strikes. It should
be noted that downward strikes impart
compressive waves in to the pile, whereas the
upward strikes generate tensile waves. In
signals indicated in Figures 9 to 11, the
vibrations have large amplitudes which do
not decay fast with time. In addition, the
consecutive vibrations have similar
durations. The average durations ∆t1, ∆t2 and
∆t3 are summarized in Table 5.
-0.00025
-0.0002
-0.00015
-0.0001
-0.00005
0
0.00005
0.0001
0.00015
0.0002
0 5000 10000 15000 20000
Am
pli
tud
e (m
/s)
Time (μs)
Signal Obtained from
Striking Point L
Signal Obtained from
Striking Point K
Signal Obtained from
Striking Point J
Signal Obtained from
Striking Point I
(a)
-0.00008
-0.00006
-0.00004
-0.00002
0
0.00002
0.00004
0.00006
0.00008
0 5000 10000 15000 20000
Am
pli
tud
e (m
/s)
Time (μs)
Signal Obtained from
Striking Point L
Signal Obtained from
Striking Point K
Signal Obtained from
Striking Point J
Signal Obtained from
Striking Point I
(b)
Civil Engineering Infrastructures Journal, 52(2): 205 – 224, December 2019
217
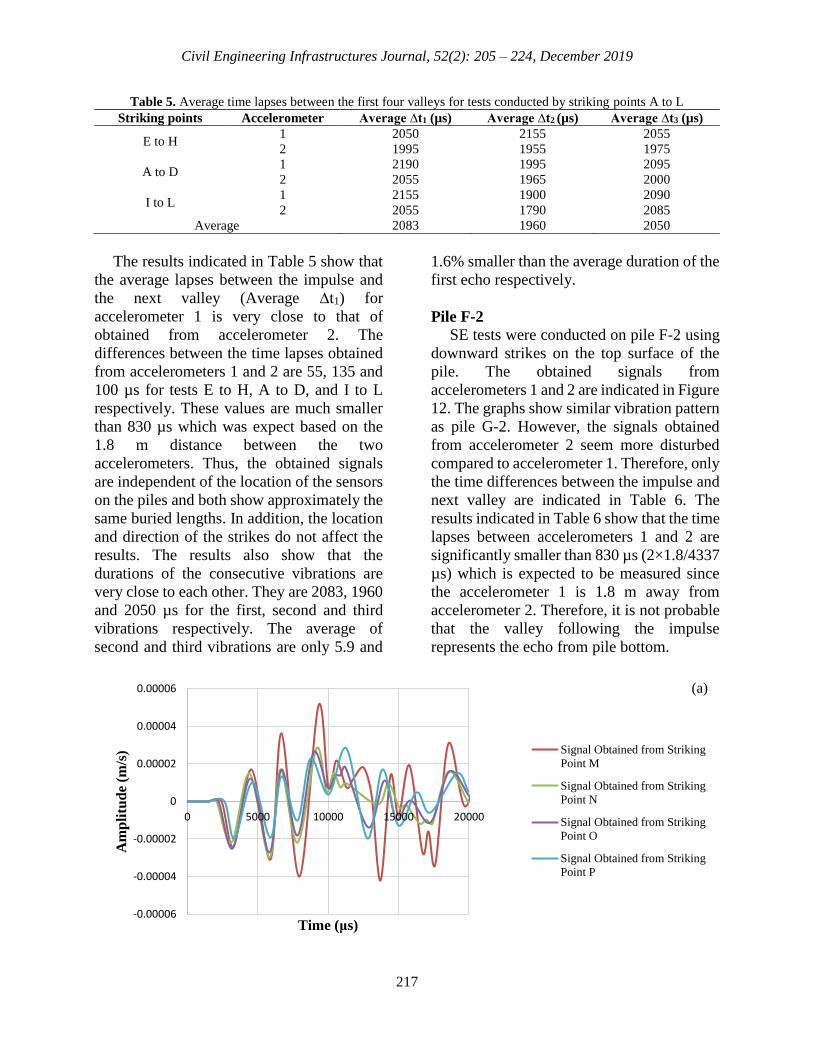
Table 5. Average time lapses between the first four valleys for tests conducted by striking points A to L Striking points Accelerometer Average ∆t1 (µs) Average ∆t2 (µs) Average ∆t3 (µs)
E to H 1 2050 2155 2055
2 1995 1955 1975
A to D 1 2190 1995 2095
2 2055 1965 2000
I to L 1 2155 1900 2090
2 2055 1790 2085
Average 2083 1960 2050
The results indicated in Table 5 show that
the average lapses between the impulse and
the next valley (Average ∆t1) for
accelerometer 1 is very close to that of
obtained from accelerometer 2. The
differences between the time lapses obtained
from accelerometers 1 and 2 are 55, 135 and
100 µs for tests E to H, A to D, and I to L
respectively. These values are much smaller
than 830 µs which was expect based on the
1.8 m distance between the two
accelerometers. Thus, the obtained signals
are independent of the location of the sensors
on the piles and both show approximately the
same buried lengths. In addition, the location
and direction of the strikes do not affect the
results. The results also show that the
durations of the consecutive vibrations are
very close to each other. They are 2083, 1960
and 2050 µs for the first, second and third
vibrations respectively. The average of
second and third vibrations are only 5.9 and
1.6% smaller than the average duration of the
first echo respectively.
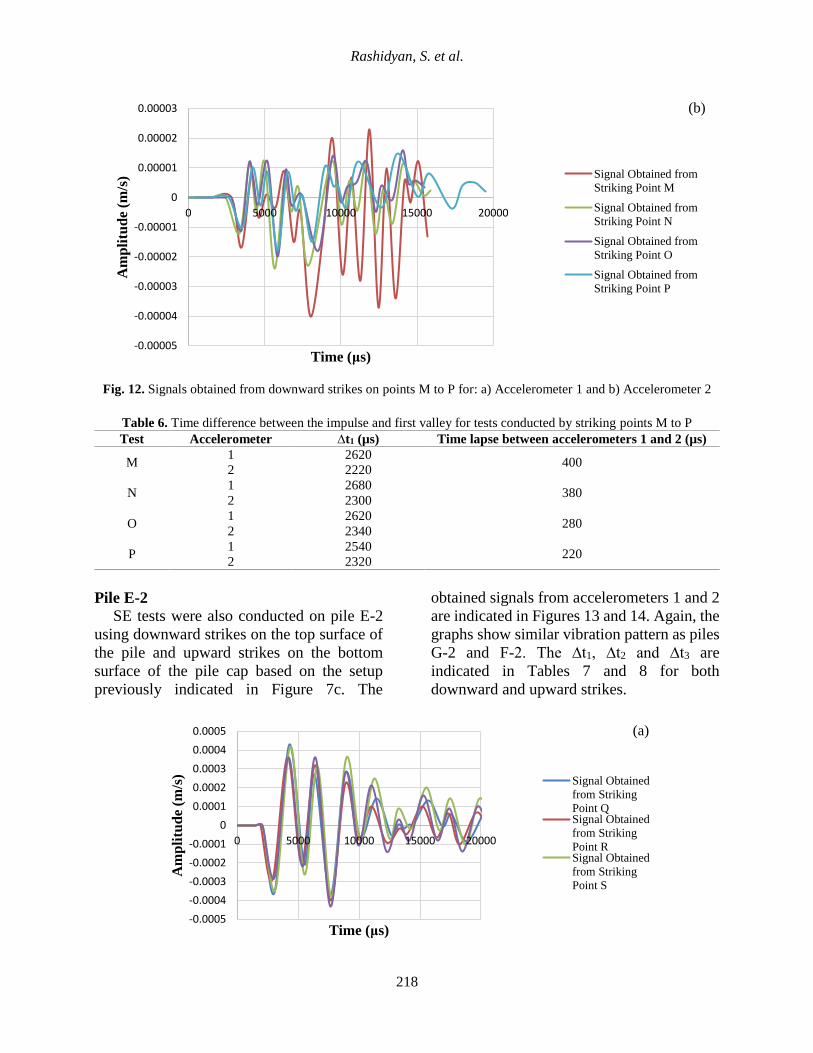
Pile F-2
SE tests were conducted on pile F-2 using
downward strikes on the top surface of the
pile. The obtained signals from
accelerometers 1 and 2 are indicated in Figure
12. The graphs show similar vibration pattern
as pile G-2. However, the signals obtained
from accelerometer 2 seem more disturbed
compared to accelerometer 1. Therefore, only
the time differences between the impulse and
next valley are indicated in Table 6. The
results indicated in Table 6 show that the time
lapses between accelerometers 1 and 2 are
significantly smaller than 830 µs (2×1.8/4337
µs) which is expected to be measured since
the accelerometer 1 is 1.8 m away from
accelerometer 2. Therefore, it is not probable
that the valley following the impulse
represents the echo from pile bottom.
-0.00006
-0.00004
-0.00002
0
0.00002
0.00004
0.00006
0 5000 10000 15000 20000
Am
pli
tud
e (m
/s)
Time (μs)
Signal Obtained from Striking
Point M
Signal Obtained from Striking
Point N
Signal Obtained from Striking
Point O
Signal Obtained from Striking
Point P
(a)
Rashidyan, S. et al.
218
Fig. 12. Signals obtained from downward strikes on points M to P for: a) Accelerometer 1 and b) Accelerometer 2
Table 6. Time difference between the impulse and first valley for tests conducted by striking points M to P Test Accelerometer ∆t1 (µs) Time lapse between accelerometers 1 and 2 (µs)
M 1 2620
400 2 2220
N 1 2680
380 2 2300
O 1 2620
280 2 2340
P 1 2540
220 2 2320
Pile E-2
SE tests were also conducted on pile E-2
using downward strikes on the top surface of
the pile and upward strikes on the bottom
surface of the pile cap based on the setup
previously indicated in Figure 7c. The
obtained signals from accelerometers 1 and 2
are indicated in Figures 13 and 14. Again, the
graphs show similar vibration pattern as piles
G-2 and F-2. The ∆t1, ∆t2 and ∆t3 are
indicated in Tables 7 and 8 for both
downward and upward strikes.
-0.00005
-0.00004
-0.00003
-0.00002
-0.00001
0
0.00001
0.00002
0.00003
0 5000 10000 15000 20000
Am
pli
tud
e (m
/s)
Time (μs)
Signal Obtained from
Striking Point M
Signal Obtained from
Striking Point N
Signal Obtained from
Striking Point O
Signal Obtained from
Striking Point P
(b)
-0.0005
-0.0004
-0.0003
-0.0002
-0.0001
0
0.0001
0.0002
0.0003
0.0004
0.0005
0 5000 10000 15000 20000
Am
pli
tud
e (m
/s)
Time (μs)
Signal Obtained
from Striking
Point QSignal Obtained
from Striking
Point RSignal Obtained
from Striking
Point S
(a)
Civil Engineering Infrastructures Journal, 52(2): 205 – 224, December 2019
219
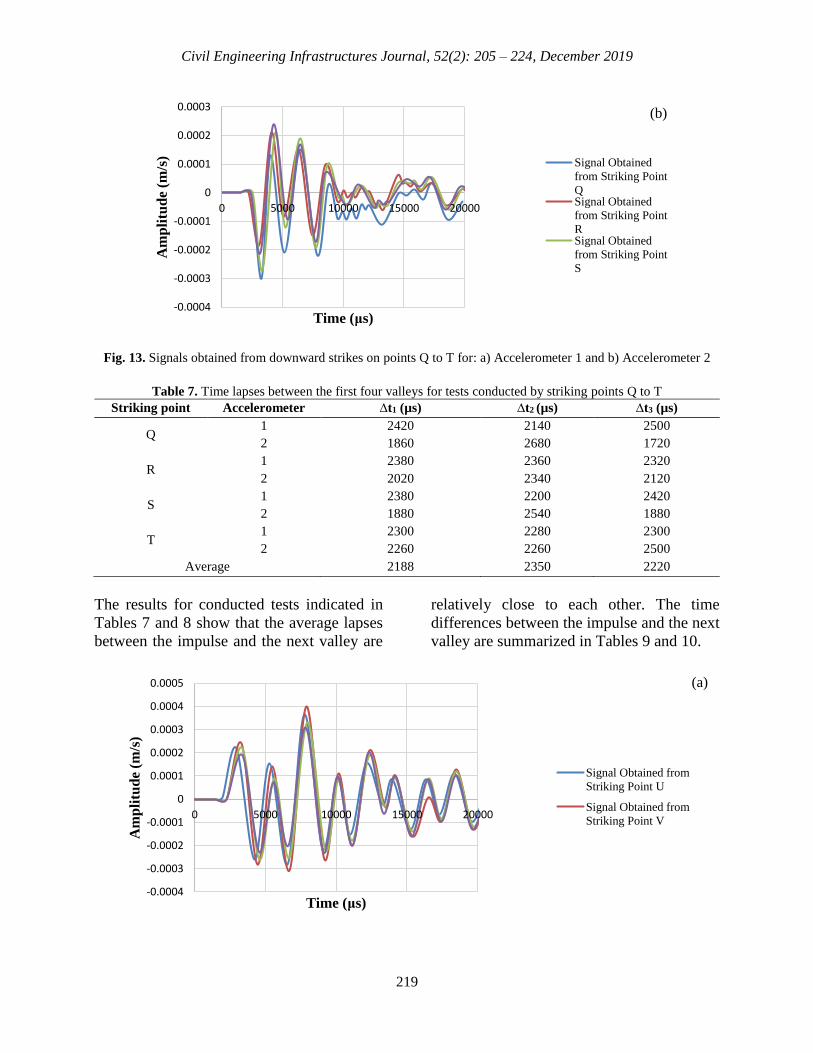
Fig. 13. Signals obtained from downward strikes on points Q to T for: a) Accelerometer 1 and b) Accelerometer 2
Table 7. Time lapses between the first four valleys for tests conducted by striking points Q to T
Striking point Accelerometer ∆t1 (µs) ∆t2 (µs) ∆t3 (µs)
Q 1 2420 2140 2500
2 1860 2680 1720
R 1 2380 2360 2320
2 2020 2340 2120
S 1 2380 2200 2420
2 1880 2540 1880
T 1 2300 2280 2300
2 2260 2260 2500
Average 2188 2350 2220
The results for conducted tests indicated in
Tables 7 and 8 show that the average lapses
between the impulse and the next valley are
relatively close to each other. The time
differences between the impulse and the next
valley are summarized in Tables 9 and 10.
-0.0004
-0.0003
-0.0002
-0.0001
0
0.0001
0.0002
0.0003
0 5000 10000 15000 20000
Am
pli
tud
e (m
/s)
Time (μs)
Signal Obtained
from Striking Point
QSignal Obtained
from Striking Point
RSignal Obtained
from Striking Point
S
(b)
-0.0004
-0.0003
-0.0002
-0.0001
0
0.0001
0.0002
0.0003
0.0004
0.0005
0 5000 10000 15000 20000
Am
pli
tud
e (m
/s)
Time (μs)
Signal Obtained from
Striking Point U
Signal Obtained from
Striking Point V
(a)
Rashidyan, S. et al.
220
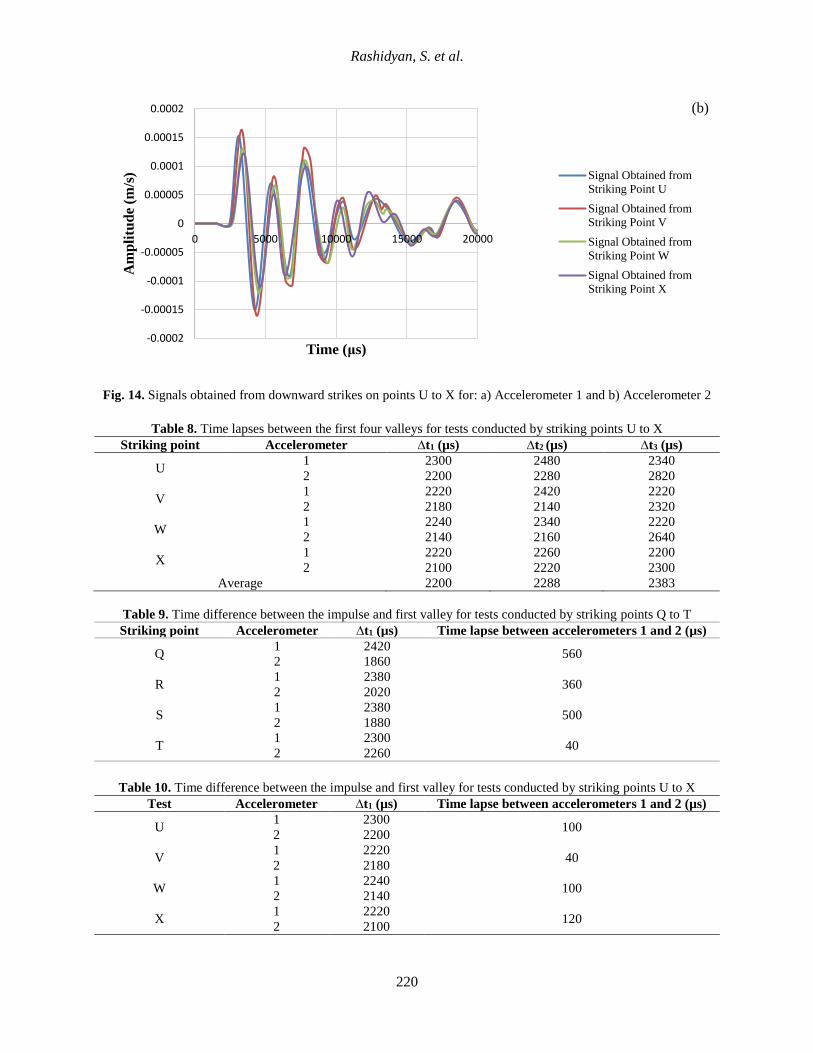
Fig. 14. Signals obtained from downward strikes on points U to X for: a) Accelerometer 1 and b) Accelerometer 2
Table 8. Time lapses between the first four valleys for tests conducted by striking points U to X
Striking point Accelerometer ∆t1 (µs) ∆t2 (µs) ∆t3 (µs)
U 1 2300 2480 2340
2 2200 2280 2820
V 1 2220 2420 2220
2 2180 2140 2320
W 1 2240 2340 2220
2 2140 2160 2640
X 1 2220 2260 2200
2 2100 2220 2300
Average 2200 2288 2383
Table 9. Time difference between the impulse and first valley for tests conducted by striking points Q to T
Striking point Accelerometer ∆t1 (µs) Time lapse between accelerometers 1 and 2 (µs)
Q 1 2420
560 2 1860
R 1 2380
360 2 2020
S 1 2380
500 2 1880
T 1 2300
40 2 2260
Table 10. Time difference between the impulse and first valley for tests conducted by striking points U to X
Test Accelerometer ∆t1 (µs) Time lapse between accelerometers 1 and 2 (µs)
U 1 2300
100 2 2200
V 1 2220
40 2 2180
W 1 2240
100 2 2140
X 1 2220
120 2 2100
-0.0002
-0.00015
-0.0001
-0.00005
0
0.00005
0.0001
0.00015
0.0002
0 5000 10000 15000 20000
Am
pli
tud
e (m
/s)
Time (μs)
Signal Obtained from
Striking Point U
Signal Obtained from
Striking Point V
Signal Obtained from
Striking Point W
Signal Obtained from
Striking Point X
(b)
Civil Engineering Infrastructures Journal, 52(2): 205 – 224, December 2019
221
The results indicated in Tables 9 and 10
show that the time lapses between
accelerometers 1 and 2 are still smaller than
692 µs (2×1.5/4337 µs) particularly for the
tests conducted using upward strike. It should
be noted that the distance between the two
accelerometers in this pile is 1.5m. Therefore,
the first valleys followed by the impulses do
not show reflections from the pile toe. In
addition, the location and direction of the
strikes do not affect the results. The results
also show that the durations of the
consecutive vibrations are very close to each
other. For tests conducted by striking points
Q to T, the average of second and third
vibrations are only 7.4 and 1.5% smaller than
the average duration of the first vibration
respectively. For tests conducted on points U
to X, the average of second and third
vibrations are only 4 and 8.3% smaller than
the average duration of the first vibration
respectively. Therefore, the periods of
vibrations in both conducted on points Q to T
and U to X are relatively close together and a
monotonic vibration occurs in both cases.
These results support the conclusion that the
signals received by the accelerometers
contain echoes from unwanted sources that
are distinctive from the echoes transmitted
from the pile toe.
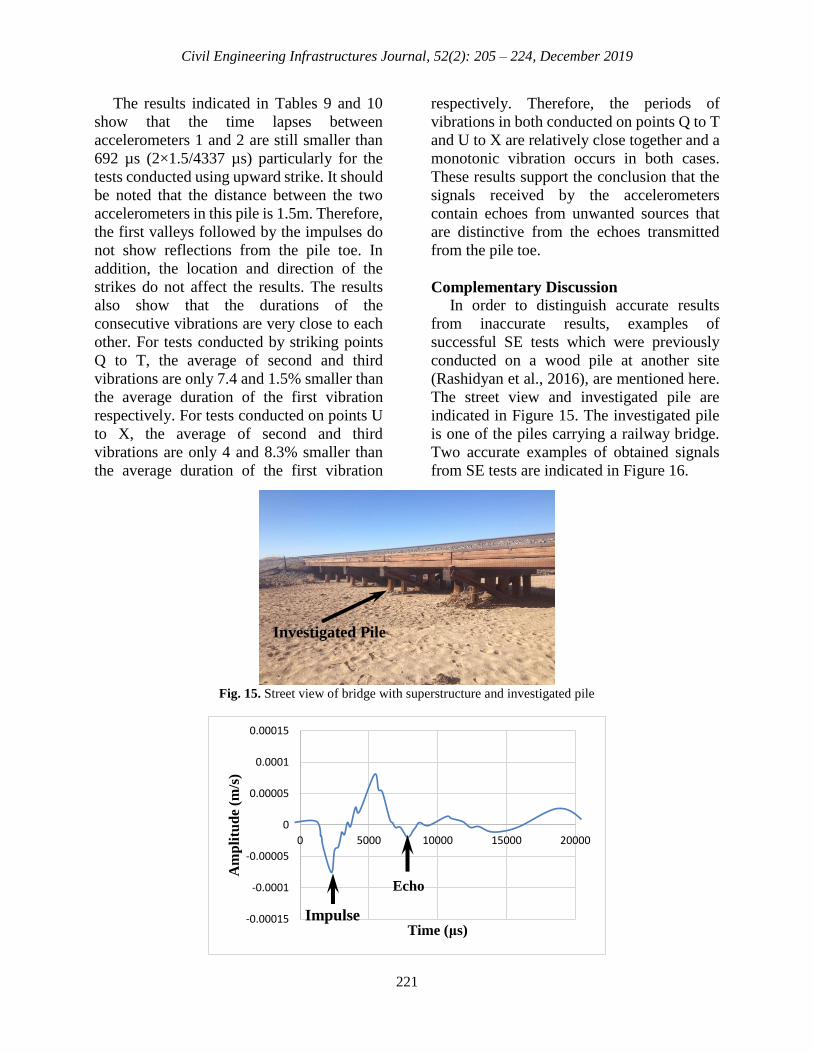
Complementary Discussion
In order to distinguish accurate results
from inaccurate results, examples of
successful SE tests which were previously
conducted on a wood pile at another site
(Rashidyan et al., 2016), are mentioned here.
The street view and investigated pile are
indicated in Figure 15. The investigated pile
is one of the piles carrying a railway bridge.
Two accurate examples of obtained signals
from SE tests are indicated in Figure 16.
Fig. 15. Street view of bridge with superstructure and investigated pile
-0.00015
-0.0001
-0.00005
0
0.00005
0.0001
0.00015
0 5000 10000 15000 20000
Am
pli
tud
e (m
/s)
Time (μs)
Investigated Pile
Impulse
Echo
Rashidyan, S. et al.
222
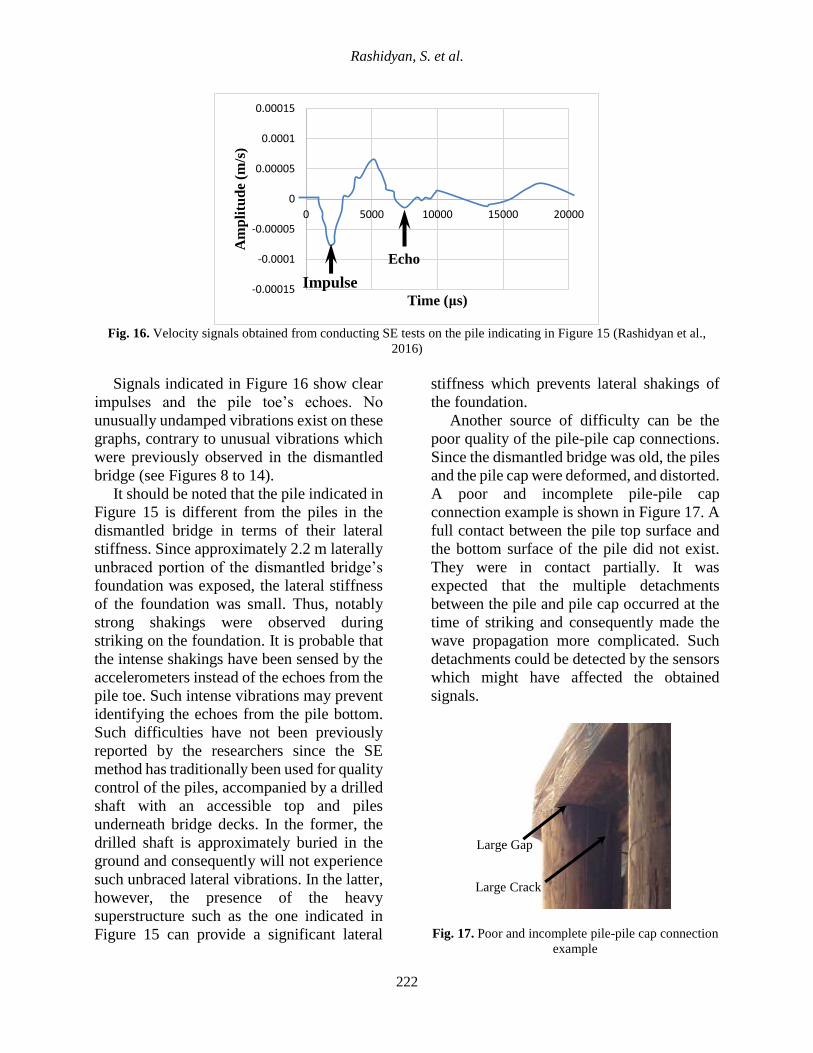
Fig. 16. Velocity signals obtained from conducting SE tests on the pile indicating in Figure 15 (Rashidyan et al.,
2016)
Signals indicated in Figure 16 show clear
impulses and the pile toe’s echoes. No
unusually undamped vibrations exist on these
graphs, contrary to unusual vibrations which
were previously observed in the dismantled
bridge (see Figures 8 to 14).
It should be noted that the pile indicated in
Figure 15 is different from the piles in the
dismantled bridge in terms of their lateral
stiffness. Since approximately 2.2 m laterally
unbraced portion of the dismantled bridge’s
foundation was exposed, the lateral stiffness
of the foundation was small. Thus, notably
strong shakings were observed during
striking on the foundation. It is probable that
the intense shakings have been sensed by the
accelerometers instead of the echoes from the
pile toe. Such intense vibrations may prevent
identifying the echoes from the pile bottom.
Such difficulties have not been previously
reported by the researchers since the SE
method has traditionally been used for quality
control of the piles, accompanied by a drilled
shaft with an accessible top and piles
underneath bridge decks. In the former, the
drilled shaft is approximately buried in the
ground and consequently will not experience
such unbraced lateral vibrations. In the latter,
however, the presence of the heavy
superstructure such as the one indicated in
Figure 15 can provide a significant lateral
stiffness which prevents lateral shakings of
the foundation.
Another source of difficulty can be the
poor quality of the pile-pile cap connections.
Since the dismantled bridge was old, the piles
and the pile cap were deformed, and distorted.
A poor and incomplete pile-pile cap
connection example is shown in Figure 17. A
full contact between the pile top surface and
the bottom surface of the pile did not exist.
They were in contact partially. It was
expected that the multiple detachments
between the pile and pile cap occurred at the
time of striking and consequently made the
wave propagation more complicated. Such
detachments could be detected by the sensors
which might have affected the obtained
signals.
Fig. 17. Poor and incomplete pile-pile cap connection
example
-0.00015
-0.0001
-0.00005
0
0.00005
0.0001
0.00015
0 5000 10000 15000 20000
Am
pli
tud
e (m
/s)
Time (μs)
Impulse
Echo
Large Gap
Large Crack
Civil Engineering Infrastructures Journal, 52(2): 205 – 224, December 2019
223
CONCLUSIONS
In this study, the performance of the SE tests
in determining the depth of foundations
which are comprised of piles and pile caps in
the absence of superstructure is investigated.
The investigated unknown bridge foundation
in this case study had previously supported a
bridge deck. However, at the time of testing,
only the foundation comprising pile caps and
piles were available. The bridge deck had
previously been removed, since the bridge
was going to be demolished. Many SE tests
were performed on three piles of this
foundation to evaluate the performance of SE
testing method on such dismantled
foundations. The velocity signals obtained
from the accelerometers were investigated to
measure the buried length of the piles.
The results showed that although clear
valleys were recognizable after impulse, they
were not the echoes from the pile toe. The
results showed that the time lapses between
the impulse and the next valley were
approximately the same for both the
accelerometers. This was an unexpected
observation since the accelerometers were far
from each other for 1.5 to 1.8 m. Therefore,
the hypothesis was that different notable time
lapses from the accelerometers would occur.
In addition, the presence of consecutive
valleys with large amplitudes and non-
decaying trends showed that the identified
echoes were from other sources other than
pile toes. Such vibrations may relate to the
intense lateral vibrations of the foundation.
The foundation was unbraced above ground
and intense lateral vibrations was probable
due to the low lateral stiffness. In addition,
detachment of the pile cap from the pile
during striking might be another reason for
unsuccessful SE tests. It should be mentioned
that poor connections between the deformed
piles and pile cap were recognizable in this
foundation.
In summary, the SE testing method does
not seem to be a proper method to evaluate
the condition of dismantled foundations
comprising old unbraced wood piles that are
poorly connected to the pile caps.
ACKNOWLEDGEMENT
This study is partially supported by the New
Mexico Department of Transportation. The
authors would like to thank Ms. Michelle
Mann, Mr. Jeff Vigil, Mr. James Castillo
(New Mexico Department of Transportation)
and Dr. Thiet Nguen (Federal Highway
Administration) for their valuable
suggestions.
FUNDING
This work was supported by the New Mexico
Department of Transportation (NMDOT) in
cooperation with Federal Highway
Administration (FHWA).
REFERENCES
American Concrete Institution. (2013). Report on
nondestructive test methods for evaluation of
concrete in structures, Farmington Hills, MI,
United States.
American Society for Testing Materials. (2013).
Standard test method for low strain impact
integrity testing of deep foundations, West
Conshohocken, PA, United States.
American Wood Council. (2018). National design
specification for wood construction, Leesburg,
VA, United States.
Briaud, J.-L., Ballouz, M. and Nasr, G. (2002). "Defect
and length predictions by NDT methods for nine
bored piles", International Perspective on Theory,
Design, Construction, and Performance, 173-192.
Chai, H.-Y. and Phoon, K.-K. (2012). "Detection of
shallow anomalies in pile integrity testing",
International Journal of Geomechanics, 13(5),
672-677.
Chidambarathanu, N. (2019). "Processing digital
image for measurement of crack dimensions in
concrete", Civil Engineering Infrastructures
Journal, 52(1), 11-22.
Davis, A.G. (1995). "Nondestructive evaluation of
existing deep foundations", Journal of
Performance of Constructed Facilities, 9(1), 57-
Rashidyan, S. et al.
224
74.
Ghasemzadeh, H. and Abounouri, A.A. (2013). "The
effect of dynamic permeability on velocity and
intrinsic attenuation of compressional waves in
sand", Civil Engineering Infrastructures Journal,
46(2), 221-231.
Hertlein, B. and Davis, A. (2007). Nondestructive
testing of deep foundations, John Wiley & Sons.
Huang, D. and Chen, L. (2007). "Studies on parallel
seismic testing for integrity of cemented soil
columns", Journal of Zhejiang University-Science
A, 8(11), 1746-1753.
Kramer, S. (1996). Geotechnical earthquake
engineering, Pearson, London, England.
Lai, J., Yang, S.-T. and Chang, T.-S. (2012).
"Evaluating the height of cantilever earth retaining
walls by sonic echo non-destructive testing
method", International Journal of Applied Science
and Engineering, 10(2), 145-154.
Rashidyan, S., Ng, T. and Maji, A. (2016). "Bridge
foundation depth estimation using Sonic Echo
test", In Experimental and Applied Mechanics,
Vol. 4, C. Sciammarella, J. Considine, and P.
Gloeckner, (eds.), Springer International
Publishing, pp. 99-106.
Rashidyan, S., Ng, T. and Maji, A. (2017). "Estimating
the depth of concrete pier wall bridge foundations
using nondestructive Sonic Echo", Journal of
Nondestructive Evaluation, 36(3), 56.
Rashidyan, S., Ng, T. and Maji, A. (2019). "Practical
aspects of nondestructive induction field testing in
determining the depth of steel and reinforced
concrete foundations", Journal of Nondestructive
Evaluation, 38(1), 19.
Rausche, F. and Goble, G.G. (1979). Determination of
pile damage by top measurements, In Behavior of
Deep Foundations, ASTM STP 670, Raymo
Lundgren, (ed.), American Society for Testing and
Materials, pp. 500-506.
United States Department of Agriculture Forest
Service (2010). Wood handbook, wood as an
engineering material, Madison, Wisconsin, United
States.
Weltman, A.J. (1977). Integrity testing of piles: A
review, Construction Industry Research and
Information Association, London, England.
White, B., Nagy, M. and Allin, R. (2008). "Comparing
cross-hole sonic logging and low-strain integrity
testing results", In Proceedings of the Eighth
International Conference on the Application of
Stress Wave Theory to Piles, pp. 471-476. Lisbon,
Portugal.