Embed Size (px)
Citation preview
Journal of Applied Economics and Business Research
JAEBR, 4(2): 120-133 (2014)
Copyright © 2014 JAEBR ISSN 1927-033X
Performance of Micro and Small-Scale Enterprises (MSEs) in
Tanzania: Growth Hazards of Fruit and Vegetables Processing
Vendors
Semistatus Hussein Mashimba1
Department of Outreach programs, Moshi University College of Co-operative and Business
Studies, Tanzania
Rainer Kühl
Agribusiness Management and Food Economics, Justus Liebig University of Giessen,
Germany
Processing of agricultural raw produces in Tanzania is becoming important for food insecurity, poverty
alleviation, and economic development. Unfortunately, smallholder food processing enterprises do not access
opportunities created by market, thus their growth is less likely. In that regard, this paper analyses growth
performance of Micro and Small scale Enterprises (MSEs) involves in processing fruits and vegetables in
Tanzania. The MSEs are herein defined as enterprises that engage between 5 and 49 employees or with capital
investment of value from Tanzanian shillings (TZS) 5 million (mil) to TZS 200 mil. The sampled enterprises
were collected during field work carried out in Dar es Salaam, Morogoro, Coast and Tanga regions of
Tanzania.
The results show a low growth rate of studied enterprises, i.e. at 0.25 and 0.16 per year for revenue and capital
investment respectively. The main factors associated to studied MSEs growth are MSE’s operational capital;
number of owners; staff-size; profit; annual production of products; access to basic market information; linkage
to supportive bodies; business improvement services; distances to inputs sources and marketplaces; and
manager-owner’s age as well as experience in business activities.
These results suggest that if studied enterprises operate under same condition and perhaps more or less the
same growth rate, it will take centuries to realise large scale enterprises growth levels. Therefore it is proposed
studied MSEs have to merge and cooperate. Generally, this paper makes two major contributions. First, gives
empirical evidences regarding growth of MSEs in developing countries. Second, it construct a basic step in
understanding how SME’s policy of Tanzania. Especially, for the food processing sub-section can be
transformed to grow fast to bring significant impact on Tanzanian economy.
Copyright © 2014 JAEBR
Keywords: Fruits, vegetable Processing, MSEs, Performance, Cox PH, Growth Hazard
1. Introduction
Since independence to to-date (i.e. at time this paper is written), Tanzania’s economy is
highly depending on agriculture-sector. The sector contributes to more than one-fourth
‘quarter’ of country’s Gross Domestic Product (GDP). Also, it accounts for almost 85% of
total exports and employs nearly 80% of total labour force of about 24.77 million (mil)
people. However, Tanzania’s economy is still one of poorest in the world as majority of her
people subsists on less than one United State Dollar ($) a day (CIA, 2012). On the other hand,
1 Correspondence to Semistatus Hussein Mashimba, Email: [email protected]

Performance of Micro and Small-Scale Enterprises (MSEs) in Tanzania 121
Copyright © 2014 JAEBR ISSN 1927-033X
the Tanzania's economy is led by private sector that majored by small and medium scale
enterprises (SMEs) (Nkya, 2003, Milanzi et al., 2006).
The United Republic of Tanzania (URT) SME policy clarifies that Tanzania intends to attain
strong economy by year 2025 (URT, 2003). However, the Tanzanian economic survey book
of fiscal year 2011/2010 depicted that, in recent years the Tanzania's economy grew fast, but
absolute poverty and inequality stubborn are still present. This is contrary to facts that, SMEs
widespread ownership provides more equitable distribution of income and contributes to
poverty reduction (Nkya (2003) and Calice et al., (2012)). Liedholm (2002) claimed that,
during periods of overall economic growth the Micro and Small Scale Enterprises (MSEs)
tends to perform better. Unfortunately, for most of Tanzanian SMEs their progress are
relatively at low rate compared to the transitions and developed economies countries. For
instance, estimates showed that, Tanzanian SMEs have greatest potential for further
employment generation (URT, 2003). But, yet it contributed about a third of GDP (Olomi,
2006), employed 20% of labour force, and 94.7% of school leavers (URT, 2009). Thus, this
paper objectively believes there is a need of understanding growth of agriculture related
enterprises while reflecting on strong economic hope of Tanzania. For this reason, it
addresses the booming Fruits and Vegetables Processing (FVP) sub-section of Tanzania.
2. Paper Issue and its Relevance
Most of Tanzanian SMEs, especially food processing ones are confronted with many
problems in their operations. These include heavy cost of compliance resulting from their
size; insufficient working premises; inadequate link with other sectors; limited financial
services; and lack of capital as well as agro-processing machines. Also are characterised with
technical known how; high transaction and organisational costs problems that are difficult to
measure quantitatively. (ILO, 2003; URT, 2003; Eskola, 2005). Also, Tanzanian SMEs are
not competitive enough in terms quality of products to access export markets (Milanzi et al.,
2006) and suffer from severe exposure to information asymmetries (Ruteri and Xu, 2009). As
such, becomes constrained from achieving economies of scale and scope.
Specifically for studied MSEs, it is presumed that, above envisaged characteristics follow
complex networks of supply chains. This leads to a situation where sellers and buyers of
PFVP do not meet immediate. That causes lack of quick disclosure and dissemination of
information among actors in supply chains 'market imperfections'. This constructs a major
problem, which is slow growth. Because of that, stay small over long period 'stagnate'
without experiencing rapid expansion growth stage until closure. This is contradicting with
micro and small scale enterprises growth theories. Generally, the enterprise’s growth theories
depicts that, through learning process an enterprise as a living body would go through time
course from start-up, growth to closure or death stages (Degenhardt et al., 2002). Also, an
enterprise can grow in terms of scale and scope as a strategy to exit closure stage (Mao,
2009). However, MSE's growth herein is manifested in terms of increase values of revenue
and capital investment in machinery.
Therefore, this study seeks to investigate MSE’s human resources, investments, and
associated supply chain characteristics that successful influence studied enterprises growth.
The main objective is to assess empirically growth performance of Tanzanian FVP MSEs and
determine factors accounts for their growth. So, this paper borrows Milanzi et al. (2006)
definition of enterprise as another name for business institution but include ideals of being
bold, adventurous, innovative, and taking risk that means entrepreneurship.
122 S. H. Mashimba and R. Kühl
Copyright © 2014 JAEBR ISSN 1927-033X
3. Methodological approaches to the study
In a field study, survey was conducted in the Dar es Salaam, Morogoro, Tanga, and Coast
regions of Tanzania. Most of primary information generated during field survey consists of
cross-sectional and panel data types that are time variant and invariant. The panel data
represents sampled MSE’s operational information at three periods of start-up period, middle
of their operation, and at their recent time of operation before interviews for this work.
Where, 140 MSEs in above mentioned study locations were selected as sample using simple
random sampling procedure. In which, data were gathered through interviews with
enterprise’s manager-owners. Also, focus group discussions included local experts using
questionnaires contained open and close ended questions. The direct observation method was
also carried out.
This paper employs Cox proportional (Cox PH) analytical tool to investigate growth of
studied MSEs over time. The analysis evolves interaction manager-owner's intrinsic
knowledge, resources, and geographical proximity (i.e. physical distance) of sampled
enterprises. Currently, the studied MSEs operate independently ‘unilaterally’ and are
characterised with complex supply chain. Therefore, in order to examine effect of sampled
MSE’s resource and supply chain attributes on their growth performance. This work
developed performance measures system (PMS) for analysis. These are MSE’s inventories,
distances to services points, ownership, revenue, profit, access of business services, annual
availability of products, and human resources.
4. Description of Data and Tested Hypotheses
The ultimate results of any particular study depend on quality, validity, and availability of
appropriate data with respect to studied issues. Thus, it is imperative to describe outcomes
and covariates in growth analyses of sampled enterprises. The outcomes represent growth
events ‘growth in terms of revenue and capital investment values’ of sampled enterprises,
while covariates are determinants of growth events.
4.1. Analysed Outcomes of Sampled Enterprises
This study aims at estimating growth performance of MSEs at a specific period of time. That
is an experimental time. In which, herein it is time period from years 1982 to 2025. This time
of an experiment was decided based on two reasons. First is that, oldest enterprise in this
paper’s sample started operating in the year 1982 and others came-up to year 2011. The
second reason why experimental time was chosen to end in year 2025 is that, Tanzanian
government aspires to have strong and competitive economy by such particular year.
Empirical analyses involve two growth outcome statuses. These are MSE’s growth in terms
of monthly revenue and capital investment in machinery values, measured in Tanzanian
shillings (TZS). Where, their distribution was used to determine factors essential for growth
of studied MSEs. Also, results obtained from growth analyses explore the control and policy
measures. Which are important into consideration for better performance of studied
entrepreneurs? That would contribute on on-going efforts to meet Tanzanian target of having
strong economy by the year 2025. The vision is deemed to be achieved through
transformation of low productivity agriculture economy to semi productive industrialised
economy (URT, 2003).

Performance of Micro and Small-Scale Enterprises (MSEs) in Tanzania 123
Copyright © 2014 JAEBR ISSN 1927-033X
Note that, growth analyses of sampled MSEs and later on its results presented herein are for
situation where and if studied enterprises continue operate unilateral. Also, most of
smallholder entrepreneurs in Tanzanian do not effectively keep records of their businesses.
Therefore, average figure of their quantitative data were used in assessing MSE’s growth. In
that regard, to present MSE’s outcome the respondents were asked about their MSE’s average
revenue and capital investment in machinery values at each panel time of operation, i.e. start-
up, middle, and recently time of their operation. Note to that, revenue values were later
converted to monthly values for analyses.
4.2. Covariates for Analyses of Studied Enterprises Growth
According to USAID (2005) report, there are numerous factors that are thought to affect and
shape growth performance of small scale enterprises. These are business environment, social,
firm, and individual characteristics. Each of these characteristics has either direct or indirect
effects on the enterprise's opportunities and capacities. Ultimately, growth of an enterprise is
determined based on way it use its capacities at optimal level on available opportunities.
Figure 1 below shows whether above named characteristics effect directly or indirectly
opportunities and capacities of enterprise.
Figure 1. Key factors affecting MSE growth
Source: USAID, 2005
Specifically, it is herein presumed that, staff-size of an enterprise in terms of human labour
capital is related with MSE’s growth. This is because staff-size can influence productivity
and marketing practises to achieve goals. The sampled enterprises differ in staff-size, a
situation that can cause great variation in their performance. Thus, it is expected that, MSEs
with small staff-size will be at a position to grow less, while, MSEs with a bit of big staff-size

124 S. H. Mashimba and R. Kühl
Copyright © 2014 JAEBR ISSN 1927-033X
can work accordingly to ensure efficiency delivery of PFVP. Not only that but also, an
enterprise with adequate workers can have high possibility to seek and access business
supports do better. On top of that, the human capital that describes employee’s business skills
and experience is crucial for MSEs growth. According to Maliti and Mnenwa (2008) some
literatures (i.e. Lugalla (1995), and Biggs et al. (1998)), including their research found
manager-owner’s education and capital asset affects enterprise’s performance. The above
authors revealed firm growth is greater if manager-owner completed secondary and
university levels of education. It is even higher when manager-owner had some technical
knowledge.
Additionally, Goncalves et al. (2011) found that, covariates age, size, and interest on dept are
restrictive factors for growth of young MSEs, but do not restrict significantly growth of old
ones. That, means young enterprises have a negative impact on their growth. This also
mirrors manager-owner’s with young age and less experienced in business restricts enterprise
growth. Therefore, it is considered herein if an enterprise is managed with old manager-
owner, business experienced, and enterprise has high number of employees. Such enterprise
is more likely to grow fast than enterprises with less experienced manager-owner and staff-
size.
Not only that, but also, the increase of employees and assets values in an enterprise is
indication of progress and development. Mabert and Modi (2010) correctly argued that,
manufacturing resources and assets of a firm do have significant impact on its performance.
They provide indication of firm's supply chain efficiency management. Thus, if an enterprise
is owned by more than one owner is more likely to be equipped with enough working capital.
In such regards, it is expected herein that, the manager-owner’s age, experience in business,
large number of employees, and owners in an enterprise, will have positive effect on MSE’s
growth. Therefore, physical assets and human resource information of sampled enterprises
were used to test first hypothesis of that states,
Hypothesis (Ho1): ‘’There is positive relationship between MSE’s resources and their growth
over time’’.
The other asked questions regarding growth analyses of sampled MSEs were those related to
supply chain issues. These are distances to main local government business department, other
supportive bodies, inputs sources, and PFVP marketplaces where price is high; access of
basic market information; annual production of PFVP; linkage of enterprise to government or
NGOs institutions; and access to trade improvement services through government officers
visits. Generally, trade improvement services offered by trade officers in Tanzanian local
government tend to be a major source of information about transformation and businesses,
development process. Also, some small sized enterprises are linked with NGOs and
government agencies to improve their performance. Normally, receive different kind of
support mainly training, working equipment, and little financial support. Thus, entrepreneurs
improve performance of their production and marketing activities.
On top of that, MSE’s distances to and from the services points are very crucial for their
growth performance. Where, specifically for working enterprises are constrained with high
transaction costs, especially transport expenses and traveling time. Further, enterprise’s
access to supportive bodies, input sources, and marketplaces influence net benefits. In which,
the short distances from service points to the MSEs minimises transaction costs such as
transportation, monitoring, negotiation, and time spent in travel. Also, operating at a long
distance from marketplaces where price is high can reduce expected profitability of MSEs.
Performance of Micro and Small-Scale Enterprises (MSEs) in Tanzania 125
Copyright © 2014 JAEBR ISSN 1927-033X
These ideal made this study to understand the effect of distances on MSE’s growth.
Therefore, mutually with covariates of sampled MSE’s regarding annual production of PFVP,
access to important business services and supports explored above, this paper postulates that;
Hypothesis (Ho2): ‘’There is trade-off between organisational attributes of MSEs that relates
to supply chain and their growth over time’’.
Furthermore, information of number of sampled MSEs in vicinity and their profit were
included in MSE's growth models. In business, actors operate against their principal
competitors. If competition is high in market the enterprise’s profits are minimised. In this
regard, it is expected that, more number of enterprises producing identical and more or less
same identical products are in a village that affects profits; less will be their growth. Paulo
(2010) found that, presence of many competitors with identical products, change in products
demand, and linkages constrains growth performance of enterprises Thus, this paper further
test influence of sampled MSE’s profit as an outcome of competition on their growth.
Therefore it is hypothesized that,
Hypothesis (Ho3): ‘’There is positive relationship between the MSE’s previous profit and
their growth’’.
In general, empirical tests of above hypotheses are herein used to understand growth and
covariates that determine overall magnitude of sampled MSE’s growth. Thus, the outcomes
and covariates involved in growth estimation and their expected signs are summarised in
Table 1 below;

Journal of Applied Economics and Business Research
JAEBR, 4(2): 120-133 (2014)
Copyright © 2014 JAEBR ISSN 1927-033X
Table 1: Summary of outcome and covariates used for estimating growth of sampled FVP MSEs
Equation 3 and 4
Outcome and covariates description Proxy Measurement unit Expected sign
Years to end of analysis (i.e. initial started year of oldest sampled enterprise to the
calendar 2025)
AEY2025 Years Experimental time or duration
Enterprise revenue (hgrr) RST TZS/ Month Status outcome
Enterprise capital investment in machinery (hgrc) CPTZ TZS/Month Status outcome
Age of enterprise manager-owner RAG Years Young-positive
Old-negative
Experience in business practices BEX Years Many-positive
Less-negative
MSE’s capital in terms of assets CSA TZS High-positive
Less-negative
Distance to closer main input marketplace DIP Km Shorter-positive Longer-negative
Distance to closer main PFVP marketplace DMP Km Shorter-positive Longer-negative
Distance to closer main government business department DGV Km Shorter-positive Longer-negative
Linkage to government or NGOs LKS Dummy Yes (1)-positive
No (0)-negative
Access to basic market information INFM Dummy Yes (1)-positive
No (0)-negative
Year round production of products ‘PFVP’ by an enterprise YRA Dummy Yes (1)- negative
No (0)- positive
Access of business improvement from trade officers TSA Dummy Yes (1)- negative
No (0)- positive
Number of business owner in an enterprise NOW Number High-positive
Less-negative
On average number of employees in an enterprise ANE Number High-positive
Less-negative
Source: Author's compilation, 2013


Journal of Applied Economics and Business Research
JAEBR, 4(2): 120-133 (2014)
Copyright © 2014 JAEBR ISSN 1927-033X
5. Theoretical framework of small scale enterprises growth
In economics, neoclassical growth theory of 1950’s and 1960’s recognises technical advance
is a key driving force for economic growth. It is argued that, models of this theory are mute
regarding technical advancements sources and operation strategies. This makes importance of
technological advancement and incorporate institutions as well as theory of the firm into
growth theory (Nelson, 1998). In which, new growth models, specifically of a firm treats firm
'an enterprise' as living body that can grow in terms of scale and scope. This is based on an
ability to transform its resources and capacities 'gene combination' into viable output in
lifecycle (Mao, 2009). However, main purpose of this paper is to study Fruits and Vegetable
(FV) processing MSEs growth. Enterprise growth is argued to mean "a development process
of enterprise from small to big and from weak to strong". Also transits from unbalance to
balance and low to high balance conditions. It again takes balanced adjustment of various
relations in interior and exterior characters of a firm (Mao, 2009).
According to Mao (2009) enterprise growth theory is based on three theories, first is scale
boundary theory ‘Coase’s (1937)’ that reflects transaction cost to explain the reason of
enterprise's generation and define scale. Second is lifecycle theory that regards an enterprise
as life body. Third be gene combination theory that involving a concept of biological
corporation where enterprise is viewed as organism. In lifecycle perspective, MSE's growth is
divided into three stages: growth 'start up'; regeneration and mature 'expansion'; and aging
'diversification' and death 'closure' stages. Figure 2 below represents enterprise growth theory
based on lifecycles theory.
Figure 2. Enterprise growth theory based on lifecycle theory
Source: Author’s work, 2013: Influenced by Degerhart (2002); Mao (2009)
The above lifecycle model describes enterprise dynamic. In which, at start-up growth stage
the business is set-up, products are developed, experiences are made, and an enterprise
demonstrates relatively low growth rate. After an enterprise successfully passes early start-up
stage, it might enter expansion stage that characterised by rapid expansion of production,
turnover and employment. Then after some time growth reaches a maturity stage, this is
marked by a point where initial business ideal and concept will no longer guarantee a further
dynamic expansion. Hence, enterprise's growth rate decline and die 'close' otherwise is forced
to advance towards a broader business concept of diversification stage. Within which, its
Performance of Micro and Small-Scale Enterprises (MSEs) in Tanzania 121
Copyright © 2014 JAEBR ISSN 1927-033X
products and services may again pass through above described growth process (Degenhardt et
al., 2002).
From above understanding, the enterprise growth can be analysed from survival and
development view of living body. In development sense, its growth is compared with that of
living organism. In referring lifecycle theory that expresses life body would go through time
course from born, growth to death. An enterprise is ought to experience periods from
generation, growth, aging, and death or decline of growth rate during its development
process. However, for enterprises which exist in market some expands rapidly while others
stagnate.
6. Modelling and Specification of Growth Hazard Functions for Studied MSEs
Actually, empirical evidences are required to illustrate growth performance of studied MSEs.
It has been noted that, Cox PH tool is herein employed to explore magnitude of covariates
thought to affect growth of sampled MSEs. Whereas, characteristics of MSEs, their manager-
owners, and supply chain including distances to main service points are set to be growth
catalysts of MSE’s growth. Thus, Cox PH functions aims to answer what are relevant
enterprise's external and internal factors to consider in future for improvement of Tanzanian
smallholders FVP sub-section.
Specifically, analyses herein are done conditional that sampled enterprises continue existing i
market up to time, t. That means at end of experimental time. Therefore, it is important to
incorporate survival construct in MSE’s growth model. This is survival function S(t), which
gives probabilities that durations of sampled MSE’s growth will be less than or equal to some
specified time, t. That implying sampled enterprises has to survive until time, t. Also, studied
growth hazard for all sampled MSEs have chances of occurring within time, t, which is
experiment time duration.
Note that, MSE’s growth hazard functions herein are modelled condition that, none at start-
up growth stage had attained the herein set hypothetical MSE’s growth values. The set
growth values for sampled MSEs are average monthly revenue and capital investment in
machinery of TZS 357,743.00 and TZS 1,812,403.00 respectively. These are sampled
enterprise’s average mean values of monthly revenue and capital investment in machinery. In
that regard, two equations are herein specified for MSE’s growth analysis. One equation ‘3
below’ represents Cox PH function that estimates MSE's growth in terms of monthly revenue,
on average. The other equation ‘4 below’ is for assessing MSE’s growth in terms of capital
investment in machinery value on average. Note that, both equations equation ‘3 and 4
below’ estimates occurrence of such growth events over time.
Generally, there are two possible methods of incorporating covariates in the hazard
regression models, one is Cox PH and accelerated lifetime being the other (Hensher and
Mannering, 1994). The Cox PH models applied herein seems to be appropriate methods of
handling collected heterogeneous data with high variation and complex business reality this
paper intends to realise. Other advantage of using this model is, it allows making assumptions
according to study interests. For instance, in modelling occurrence of MSE’s growth events
herein are done by making modification in Cox PH models to allow for age varying effects of
an initial, middle, and recently measure of enterprise's efficiency in its operation.
Therefore, in modelling growth of MSEs, it is assumed that enterprise, i, in sampled MSEs, j,
can increase its monthly revenue and capital investment in machinery over time. The MSE’s

122 S. H. Mashimba and R. Kühl
Copyright © 2014 JAEBR ISSN 1927-033X
growth hazards up to time t, )(thgrij, are coded as RST and CPTZ to represent increase value
of monthly revenue and capital investment in machinery respectively. Note that, data for
these growth outcomes were originally measured in TZS. Then later, were categorised to take
value of 1 when MSE's attained set growth value and 0 if otherwise. They define MSE’s
growth probability statuses that could be derived in time, t, by enterprises. An argument
of, )(thgrij,is assumed to be vector of the covariates representing sampled MSEs, their
manager-owners, and geographical proximity characteristics. Where, in considering aspect of
MSE’s heterogeneity effect this can be specified as,
ijtocij xththgr exp)()( (1)
Where, growth hazard, )(thgrij, is a result from multiplicative effect of incorporated
covariate, x , in function which affects MSE's growth over time,t, and,hoc is a shared classical
baseline hazard that accounts for MSE’s heterogeneity. That means in the equations 1 and 2
below, hoc is a function of, t, and, )exp( x ,is function of, x . Indeed, outcomes determinants
integrated in Cox PH functions below proportionally gives outcomes status from effect of
combination of baseline growth hazard of MSEs and selected scaled covariates at different
point of times in their operations. Note that, this paper's growth empirical models have been
estimated using the hazard functions in SPSS package under extended Cox regression option
that includes time covariate, T_.
In addition to that, as far as Cox PH is concern, estimations of MSE’s growth hazards are
done by undertaking estimation of classical baseline hazard semi-parametrically. Where, two
outcomes in growth models are natural logarithm of time from initial time an enterprise
started operating to when each enterprise first attain growth values. Thus, mathematical
presentation of employed Cox PH growth function for sampled MSEs includes covariates
from identified PMS. It takes form as presented in question 2 below.
ePRFANEINFMLKSDIPDMPYRATSANOWCSABEXRAG
ocij thtxthgr
,)(/ (2)
An assumption is that, the covariates in above Cox PH growth function are weakly
exogenous. Further, there are some covariates (i.e. BEX, NOW, DIP, ANE, and LKS) do
appears in each of Cox PH growth models below presented by equations '3 and 4'. These are
of more interest to look at in final results of this paper. On top of that, covariates that have
been included in MSE’s growth assessment were essential to meet proportional hazards
assumption of Cox regression. If introducing coefficients, 's, )(thoc , and covariates, sx' in
question 2 above yields structural questions 3 to 4 shown below. These are Cox PH functions
used to analyses growth performance of sampled MSEs.
RST = hoc(t) exp (β1BEXt + β2PRFt + β3DIPt + β4DMPt + β5YRAt + β6CSAt + β7ANEt +
β8NOWt + β9TSAt + β10LKSt) (3)
CPTZ = hoc(t) exp (β1RAGt + β2BEXt + β3DMPt + β4DIPt + β5NOWt + β6INFMt + β7ANEt +
β8LKS) (4)
Performance of Micro and Small-Scale Enterprises (MSEs) in Tanzania 123
Copyright © 2014 JAEBR ISSN 1927-033X
Note: The proxies of covariates used in above functions are described in Table 1 above
under the context of description of data collected for this paper.
7. Empirical results and discussions
This sub-section provides empirical results of sampled enterprise’s growth in terms of
average monthly revenue and capital investment in machinery values. Therefore, two growth
outcome statuses and several covariates were estimated using the Cox PH functions to
analyse sampled enterprises. Basically, the smoothed hazard functions are used to show
sampled MSE’s growth distribution. While, the survival curves are utilised to predict time
transpires for occurrence of set growth events. After, growth findings help to forecast how
long ‘duration’ sampled enterprises will take to achieve Tanzanian medium and LEs revenue
growth levels. Also, standard capital investment in machinery growth values for LEs as per
European commission (EC). This means the forecasts of sampled enterprises growth are
based on graph estimations of their growth performance under existed Tanzanian business
environment.
The estimation of growth events for sampled MSEs was done at time interval (0, 43 years).
This interval constitutes MSE's earliest observed entry time and last growth time for
experiment. Furthermore, total number of observation was 140 and analysis time at risk from
time, t, and equals 0 is 2686 from risk time equals 0. This means time duration which a
subject ‘enterprise’ is at risk of having set growth events as defined by analyses. Moreover,
in MSE's growth analyses an opted confidence interval for exp(β) was 95% around the
survival function with iterations of 20.
Note that, as Cox PH is used for analyses, then proportional hazards assumption of Cox PH
model has to be met. Which means baseline hazard depends upon time and effect of covariate
is the same for all time points. Thus, if β and z-values are negative then hazards have negative
duration dependence. Implies that, the longer enterprise delay to attain growth events, more
likely events will occur earlier. Consequently, to ensure preciseness of estimated parameters,
this paper tested proportional hazards assumption with respect to covariates used in Cox PH
model. That was done by defining time-dependent covariate ‘T_ COV_’ as a function of time
variable T_ and other covariates included in the model. Afterwards, significance of time-
dependent covariates coefficients was tested to tell whether proportional hazards assumption
is reasonable in respect to implemented growth models. In which, covariates which had
positive and negative duration dependence but fit the models, were incorporated in analyses
as time-dependent covariates to account for dependence. For this reason, it is important to
understand that, in discussion of the results a negative coefficient for covariates implies
negative effects on growth event occurrence.
Further, the likelihood ratio, Wald, and score X2
tests statistics at bottom of analysed growth
estimations is asymbiotically standard normal equivalent test of Omnibus null hypothesis that
all of β's are zero. That also represents Cox regression model testing of hazards
proportionality assumption (Table 2). Therefore, these preceding test statistics values are
essential for interpretations results. Also note that, Table 2 below displays coefficients values
associated to intensity of sampled MSEs growth and covariate for each coefficient. After
reports values of exponential coefficients that offer multiplicative effect on baseline hazards
of studied growth events, z-score which are ratio of each regression coefficient to its standard
error, P>|z|, and S.E values which represents values of covariate's probabilities and standard
errors respectively.
124 S. H. Mashimba and R. Kühl
Copyright © 2014 JAEBR ISSN 1927-033X
Cox PH results and factors that influence growth of sampled MSEs
In growth assessments the numbers of events occurrence at initial records were 30 and 20 for
MSE’s monthly revenue and capital investment in machinery respectively. The results in
Table 3 below indicate tests statistics are in close agreement. This suggests fittest of sampled
MSE’s growth models and proportionality tests of Cox PH growth functions fit to the data. In
that instance, Omnibus null hypothesis stating that all of β's are zero is soundly rejected.
The Cox PH results in Table 2 below is interpreted that, the business improvement services
offered by government officials to enterprises; annual production of PFVP; and distance to
main marketplaces characteristics are highly statistically significant affecting their monthly
revenue. Also, the number of owner(s) in enterprise; manager-owner’s age and business
experience are highly statistically significant manipulating sampled MSE’s capital investment
in machinery. While, MSE’s operational capital; distance to main inputs sources; manager-
owner’s experience in business; link to supportive institutions on business matters; number of
owners in enterprise; and prior profit are marginally statistically significant influencing
sampled MSEs revenue.
On top of that, Table 2 below shows MSE’s staff-size; linkage to supportive bodies; access to
market information; and distance to main input sources characteristics are marginally
statistically significant affecting sampled enterprises capital investment in machinery value.
Also, duration dependence tests (i.e. T_COV_) in growth models are marginally statistically
significant. Thus, before interpreting covariates associated with sampled MSEs growth. This
papers starts with highlights of tested hypotheses. The first hypothesis (Ho1) states that,
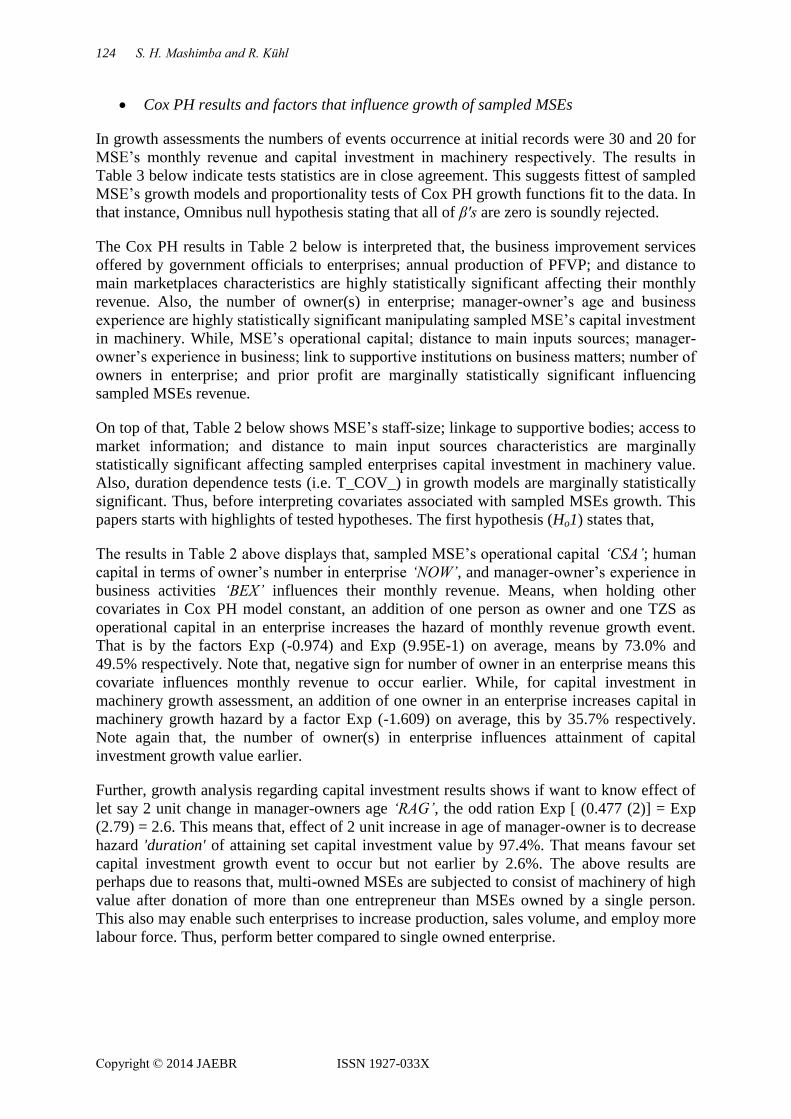
The results in Table 2 above displays that, sampled MSE’s operational capital ‘CSA’; human
capital in terms of owner’s number in enterprise ‘NOW’, and manager-owner’s experience in
business activities ‘BEX’ influences their monthly revenue. Means, when holding other
covariates in Cox PH model constant, an addition of one person as owner and one TZS as
operational capital in an enterprise increases the hazard of monthly revenue growth event.
That is by the factors Exp (-0.974) and Exp (9.95E-1) on average, means by 73.0% and
49.5% respectively. Note that, negative sign for number of owner in an enterprise means this
covariate influences monthly revenue to occur earlier. While, for capital investment in
machinery growth assessment, an addition of one owner in an enterprise increases capital in
machinery growth hazard by a factor Exp (-1.609) on average, this by 35.7% respectively.
Note again that, the number of owner(s) in enterprise influences attainment of capital
investment growth value earlier.
Further, growth analysis regarding capital investment results shows if want to know effect of
let say 2 unit change in manager-owners age ‘RAG’, the odd ration Exp [ (0.477 (2)] = Exp
(2.79) = 2.6. This means that, effect of 2 unit increase in age of manager-owner is to decrease
hazard 'duration' of attaining set capital investment value by 97.4%. That means favour set
capital investment growth event to occur but not earlier by 2.6%. The above results are
perhaps due to reasons that, multi-owned MSEs are subjected to consist of machinery of high
value after donation of more than one entrepreneur than MSEs owned by a single person.
This also may enable such enterprises to increase production, sales volume, and employ more
labour force. Thus, perform better compared to single owned enterprise.
Performance of Micro and Small-Scale Enterprises (MSEs) in Tanzania 125
Copyright © 2014 JAEBR ISSN 1927-033X
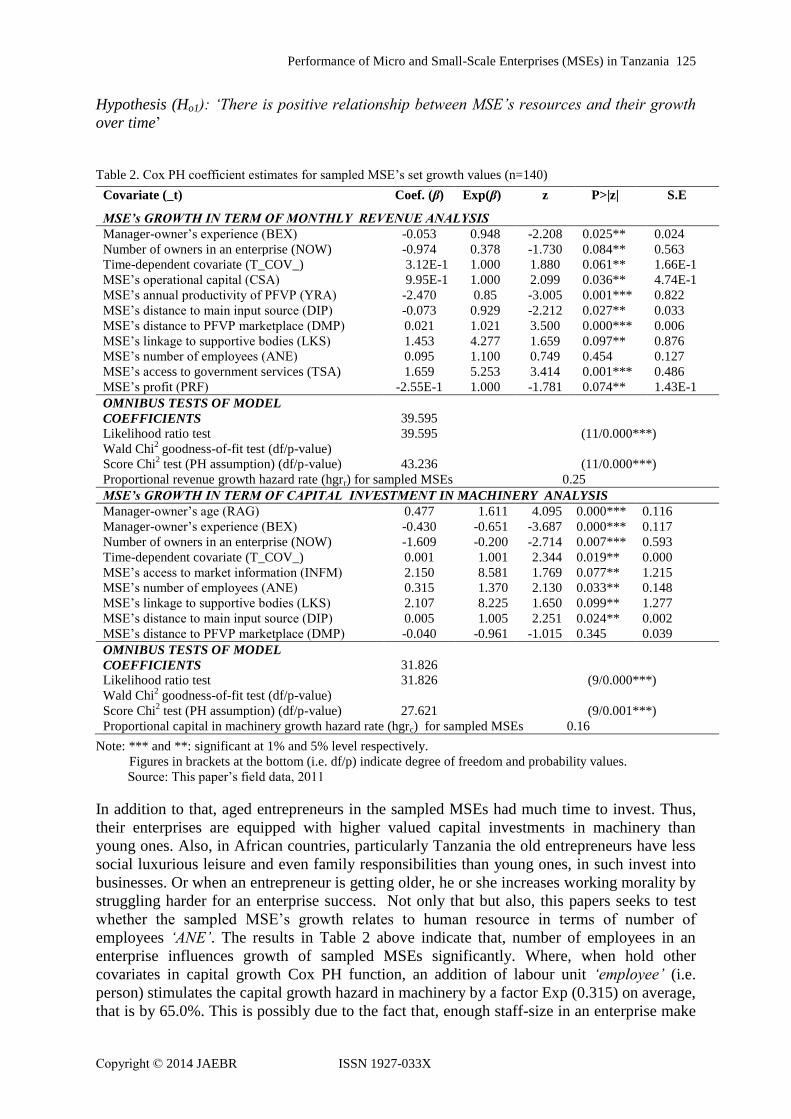
Hypothesis (Ho1): ‘There is positive relationship between MSE’s resources and their growth
over time’
Table 2. Cox PH coefficient estimates for sampled MSE’s set growth values (n=140)
Covariate (_t) Coef. (β) Exp(β) z P>|z| S.E
MSE’s GROWTH IN TERM OF MONTHLY REVENUE ANALYSIS
Manager-owner’s experience (BEX) -0.053 0.948 -2.208 0.025** 0.024
Number of owners in an enterprise (NOW) -0.974 0.378 -1.730 0.084** 0.563
Time-dependent covariate (T_COV_) 3.12E-1 1.000 1.880 0.061** 1.66E-1
MSE’s operational capital (CSA) 9.95E-1 1.000 2.099 0.036** 4.74E-1
MSE’s annual productivity of PFVP (YRA) -2.470 0.85 -3.005 0.001*** 0.822
MSE’s distance to main input source (DIP) -0.073 0.929 -2.212 0.027** 0.033
MSE’s distance to PFVP marketplace (DMP) 0.021 1.021 3.500 0.000*** 0.006
MSE’s linkage to supportive bodies (LKS) 1.453 4.277 1.659 0.097** 0.876
MSE’s number of employees (ANE) 0.095 1.100 0.749 0.454 0.127
MSE’s access to government services (TSA) 1.659 5.253 3.414 0.001*** 0.486
MSE’s profit (PRF) -2.55E-1 1.000 -1.781 0.074** 1.43E-1
OMNIBUS TESTS OF MODEL
COEFFICIENTS
Likelihood ratio test
Wald Chi2 goodness-of-fit test (df/p-value)
39.595
39.595
(11/0.000***)
Score Chi2 test (PH assumption) (df/p-value) 43.236 (11/0.000***)
Proportional revenue growth hazard rate (hgrr) for sampled MSEs 0.25
MSE’s GROWTH IN TERM OF CAPITAL INVESTMENT IN MACHINERY ANALYSIS
Manager-owner’s age (RAG) 0.477 1.611 4.095 0.000*** 0.116
Manager-owner’s experience (BEX) -0.430 -0.651 -3.687 0.000*** 0.117
Number of owners in an enterprise (NOW) -1.609 -0.200 -2.714 0.007*** 0.593
Time-dependent covariate (T_COV_) 0.001 1.001 2.344 0.019** 0.000
MSE’s access to market information (INFM) 2.150 8.581 1.769 0.077** 1.215
MSE’s number of employees (ANE) 0.315 1.370 2.130 0.033** 0.148
MSE’s linkage to supportive bodies (LKS) 2.107 8.225 1.650 0.099** 1.277
MSE’s distance to main input source (DIP) 0.005 1.005 2.251 0.024** 0.002
MSE’s distance to PFVP marketplace (DMP) -0.040 -0.961 -1.015 0.345 0.039
OMNIBUS TESTS OF MODEL
COEFFICIENTS
Likelihood ratio test
Wald Chi2 goodness-of-fit test (df/p-value)
31.826
31.826
(9/0.000***)
Score Chi2 test (PH assumption) (df/p-value) 27.621 (9/0.001***)
Proportional capital in machinery growth hazard rate (hgrc) for sampled MSEs 0.16
Note: *** and **: significant at 1% and 5% level respectively.
Figures in brackets at the bottom (i.e. df/p) indicate degree of freedom and probability values.
Source: This paper’s field data, 2011
In addition to that, aged entrepreneurs in the sampled MSEs had much time to invest. Thus,
their enterprises are equipped with higher valued capital investments in machinery than
young ones. Also, in African countries, particularly Tanzania the old entrepreneurs have less
social luxurious leisure and even family responsibilities than young ones, in such invest into
businesses. Or when an entrepreneur is getting older, he or she increases working morality by
struggling harder for an enterprise success. Not only that but also, this papers seeks to test
whether the sampled MSE’s growth relates to human resource in terms of number of
employees ‘ANE’. The results in Table 2 above indicate that, number of employees in an
enterprise influences growth of sampled MSEs significantly. Where, when hold other
covariates in capital growth Cox PH function, an addition of labour unit ‘employee’ (i.e.
person) stimulates the capital growth hazard in machinery by a factor Exp (0.315) on average,
that is by 65.0%. This is possibly due to the fact that, enough staff-size in an enterprise make
126 S. H. Mashimba and R. Kühl
Copyright © 2014 JAEBR ISSN 1927-033X
it possible to penetrate market, as many staff can specialise, divide, and pursue sundry tasks
'production, management, and supply' to reach customers.
On the other hand, it is observed in the Table 2 of results above that, the manager-owner's
experience in business activities 'BEX' influences occurrence of set monthly revenue and
capital in machinery growth event earlier. This is by the factors Exp (-0.053) and Exp (-
0.430) on average. That means if want to know effect of let say 2 unit change in BEX, the
odd rations Exp [(-0.053(2)] = 0.90 and Exp [(-0.430(2)] = 0.42. This means, effect of 2 unit
increase in experience of manager-owner is to decrease hazard 'duration' of attaining set
monthly revenue and capital in machinery growth values by 10.0% and 58.0% respectively.
Means, the 2 unit increase favour growth event to occur earlier by 90.0% and 42.0%
respectively. This might be due to reason that, an experienced manager-owner can easily
come across problems and improve performance of an enterprise through learning effect. As
such, targets for sensible revenue and then invest in machinery. Because, he or she
understands that, high level of revenue and capital in machinery are essential for enterprise’s
growth. This goes together with the fact that, an experienced manager-owner in business can
easily adopt technologies and deal with the regular challenges and changes that occurs in
market, thus invest more.
These results above supports first hypothesis (Ho2) tested in this paper. In which, based on the
MSE’s growth analyses by Cox PH function it is found that, there is significant relationship
between sampled MSE’s CSA, RAG, BEX, NOW, and ANE characteristic and their growth
performance. Therefore, this paper accepts its first hypothesis, Ho2, which proposes that,
‘’There is positive relationship between MSE’s resources and their growth over time’’
Not only that but also, the Table 2 above indicates that, covariates regarding annual
availability of the PFVP ‘YRA’; MSE’s access of business improvement services from
government ‘TSA’; access to basic market information ‘INFM’; linkage to supportive
institutions ‘LKS’; distances to main input sources ‘DIP’; and to marketplace of PFVP
‘DMP’; are relevant for growth of sampled MSEs. These results means, enterprises that
produce PFVP annually; frequently access the business improvement services; linked to
supportive bodied for business matters are Exp (-2.470), Exp (1.659), and Exp (1.453) ≈ 0.1,
4, and 5 times more likely to attain the set monthly revenue growth value than those MSEs
which do not respectively. That is if the other covariates in Cox PH model are held constant.
Also, if hold the other covariates in model constant, MSE’s that access basic market
information and linked to supportive bodies for the business matters are Exp (2.150) and Exp
(2.107), ≈ 8 and 8 times more likely to attain capital investment in machinery growth value
than those MSEs which do not respectively.
Note that, the sign of coefficient for annual production of PFVP covariate is negative. This
means annual production of PFVP favours set monthly revenue event to occur earlier.
Generally, results of controlled variable above can be interpreted as, risk or hazard of
attaining set growth values is higher for MSEs that produce PFVP annually; linked to
supportive bodies; access business improvement services and basic market information. This
is perhaps due to benefits such as, training, advice, technical, and managerial assistances, and
access of basic market information. The MSE’s linkages to supportive bodies have
advantages. For the sampled FVP enterprises mostly are offered various advices, financial,
training, and sometimes working equipment.
As mentioned earlier, other covariates incorporated in sampled MSEs growth models that
appeared to be statistically significant in affecting their growth are distance to input sources
‘DIP’ and marketplaces of high price for PFVP ‘DMP’. The results in Table 2 above
Performance of Micro and Small-Scale Enterprises (MSEs) in Tanzania 127
Copyright © 2014 JAEBR ISSN 1927-033X
demonstrates, when other covariates in the monthly revenue Cox PH function are held
constant, reduction of one Km from processing unit of an enterprise to main input sources.
And an addition one Km to main marketplace of PFVP where price is high increases
occurrence of revenue growth event by the factors of Exp (-0.073) and Exp (0.021) on
average. That means by 10.6% and 16.7% respectively. While, one addition Km of distance
to input sources for sampled MSEs increases occurrence of set capital in machinery growth
event by a factor of Exp (0.005) on average, means by 12.6% respectively. This is when other
covariates in the Cox PH model for capital analysis are held constant.
These above results might be due to reasons that, the far distances to input sources, where
mostly enterprises fetch their inputs especially packaging materials, raw FV, and working
equipment reduces their revenue. But, on the other side entrepreneurs invests higher in
machinery knowing that cannot access inputs especially processing equipment. Also, at far
distance to marketplaces of PFVP where price is high affects victimised enterprises in supply
of PFVP. Because, they incur high costs in terms of time, transportation and energy
‘transaction costs’ as compared to the MSEs that are situated at shorter distances. But, those
enterprises selling their PFVP at far distance to marketplaces where price is higher also
obtain high revenue. In turn, their average capital investment in machinery and revenue are
indirectly affected. Therefore, the second hypothesis (Ho2), of this paper is accepted. This
hypothesis is about testing if,
Hypothesis (Ho2): ‘There is trade-off between organisational attributes of MSEs that relates
to supply chain and their growth over time’
Finally, the other tested hypothesis is regarding previous received profits by sampled
enterprises and their growth performance. This is the third hypothesis that states,
Hypothesis (Ho3): ‘There is positive relationship between the MSE’s previous profit and their
growth’
The results in Table 2 above give evidences that, previous profit of sampled MSEs is highly
statistically significant at 95% confidence interval influencing their monthly revenue growth
hazard. Where, when holding other covariates in Cox PH function constant, an addition of
one TZS as profit increases hazard of attaining set monthly revenue growth value by a factor
of Exp (-2.55E-1) on average, this is by 78.1%. The profit covariate also influence set
monthly revenue to occur earlier as an enterprise stays longer without attaining set monthly
revenue growth value. Of-course possibly, this happens due to the contribution of profit on
business capital and supply process of PFVP. In hazard sense it is argued that, high profit for
the MSEs in study locations enable them growth faster in terms of revenue. Therefore, last
hypothesis (Ho3) is accepted and concludes that there is positive relationship between
sampled MSE’s previous profit and their revenue growth.
Furthermore, the Table 2 above shows that, statistical tests are highly statistically significant.
This implies that, the Cox regression models for analysing sampled MSEs met the
proportional hazards assumption. Therefore, it is concluded results therein shows that, the
sampled MSE’s on average hazard rates 'growth rate' in terms of for monthly revenue and
capital investment in machinery values, within assigned range of experimental time are 0.25
and 0.16 respectively. That is conditional to covariates incorporates in the models and
experimental time. The growth hazards have positive duration dependence. This means the
longer an enterprise stay without attain the set growth values, the more likely set growth
events will occur soon. Generally, above growth hazards can also be interpreted as, there is
128 S. H. Mashimba and R. Kühl
Copyright © 2014 JAEBR ISSN 1927-033X
probability of 26% and 15% that all the sampled enterprises will attain set monthly revenue
and capital investment in machinery growth values at interval, t, t + ∆t ‘from year 1982 up to
2025’ respectively. That is regardless of how long sampled MSEs have survived.
Forecasted Time for Sampled MSE's Growth at Standard Levels
To this end of the Figures 4a,b and 4c,d below shows survival and smoothed growth hazards
for the sampled enterprises. That means growth in terms of monthly revenue and capital
investment in machinery values within experimental time. The generated graphs by growth
Cox PH functions are basically used for prediction of time transpire for all sampled MSEs to
attain set growth values. That means, interpretations of hazard and survival curves estimates
probabilities and time transpires set growth events to occur. Not only that but also, the
estimations are made based on average growth rates of sampled MSEs to forecast time
required for attainment of standard European Commission (EC) revenue and Tanzanian
capital investment in machinery values of LEs. This is only if the sampled MSEs continue
operating unilaterally in order to be recognised as medium and larger scale enterprises. The
survival curves shows growth events for the whole sample are terminated at a specific point
in or within experimental time. In which, growth process started from 1 and monotonically
decline to zero. At zero point indicates probability that, all the sampled MSEs must
eventually grow to set growth levels.
On the other hand, the smoothed growth curves for sampled MSEs are monotonically
increasing from 0 towards 1 and reach to some point it starts declining downwards. Again
continue to increase and decline in such behaviour. Note that, the generated curves appears in
the Figures 4a,b and 4c,d below are based on operations of the sampled MSEs from stage-up
growth stage to current stage 'the calendar year 2011 where information for this paper were
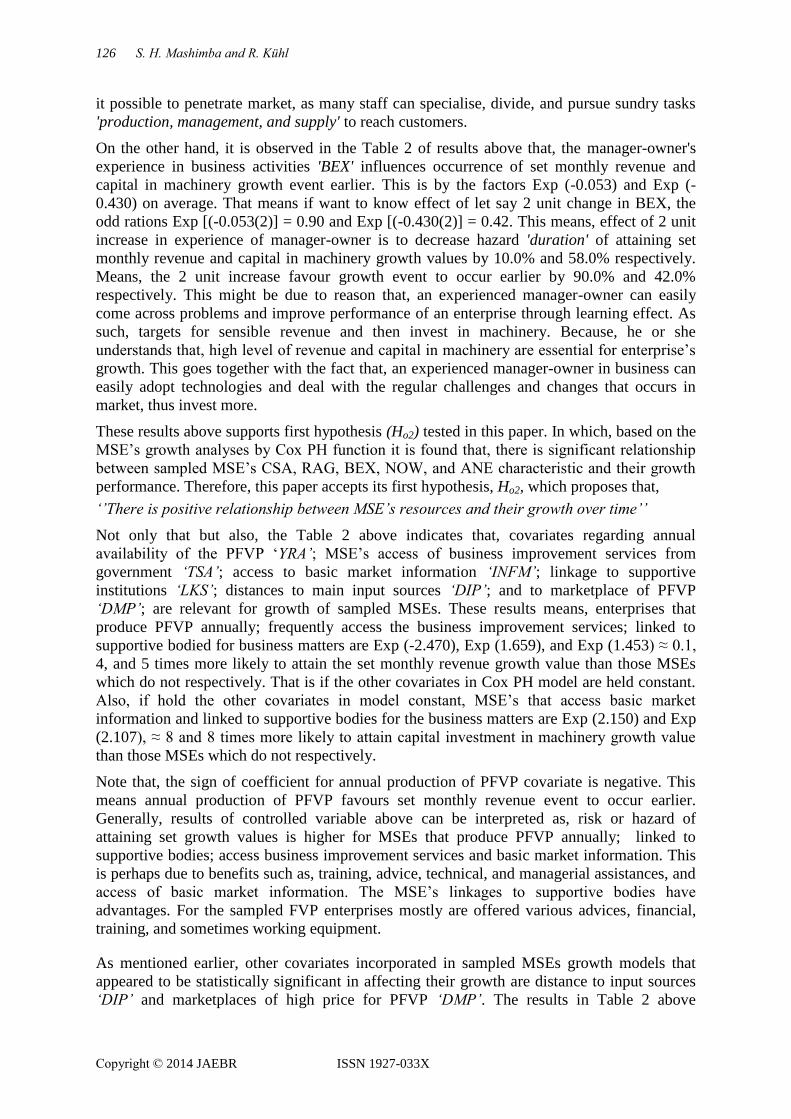
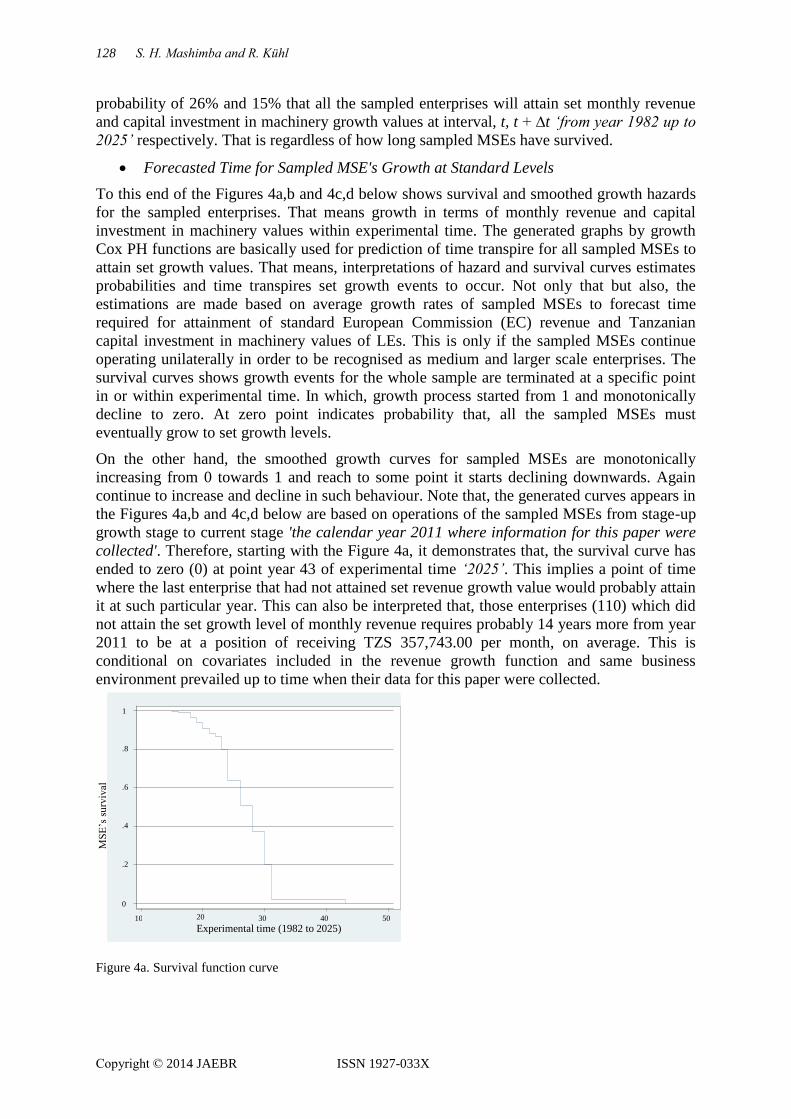
collected'. Therefore, starting with the Figure 4a, it demonstrates that, the survival curve has
ended to zero (0) at point year 43 of experimental time ‘2025’. This implies a point of time
where the last enterprise that had not attained set revenue growth value would probably attain
it at such particular year. This can also be interpreted that, those enterprises (110) which did
not attain the set growth level of monthly revenue requires probably 14 years more from year
2011 to be at a position of receiving TZS 357,743.00 per month, on average. This is
conditional on covariates included in the revenue growth function and same business
environment prevailed up to time when their data for this paper were collected.
Figure 4a. Survival function curve
0
.2
.4
.6
.8
1
MS
E’s
su
rviv
al
10 20 30 40 50 Experimental time (1982 to 2025)

Performance of Micro and Small-Scale Enterprises (MSEs) in Tanzania 129
Copyright © 2014 JAEBR ISSN 1927-033X
Figure 4b. Monthly revenue growth function curve
Figure 4a,b. MSE’s Survival and monthly revenue curves at mean of covariates (n=140)
Source: This research's field data, 2011
In addition, the MSE’s growth was analysed using another yardstick to define micro, small, medium and larger
scale enterprises (MSMEs). This is capital investment in terms of machinery. In determining how long will take
for sampled MSEs to attain set capital investment in machinery growth value. The following survival and
smoothed hazard curves presented in Figure 4c below is used for time prediction.
Figure 4c: Survival function curve
0
.2
.4
.6
.8
1
MS
E’s
Su
rviv
al
10 20 30 40 50 Experimental time (1982 to 2025)
0
.05
.1
.15
.2
M
SE
’s s
mo
oth
ed m
onth
ly r
even
ue
gro
wth
haz
ard
20 25 30 35 40 Experimental time (1982 to 2025)
130 S. H. Mashimba and R. Kühl
Copyright © 2014 JAEBR ISSN 1927-033X
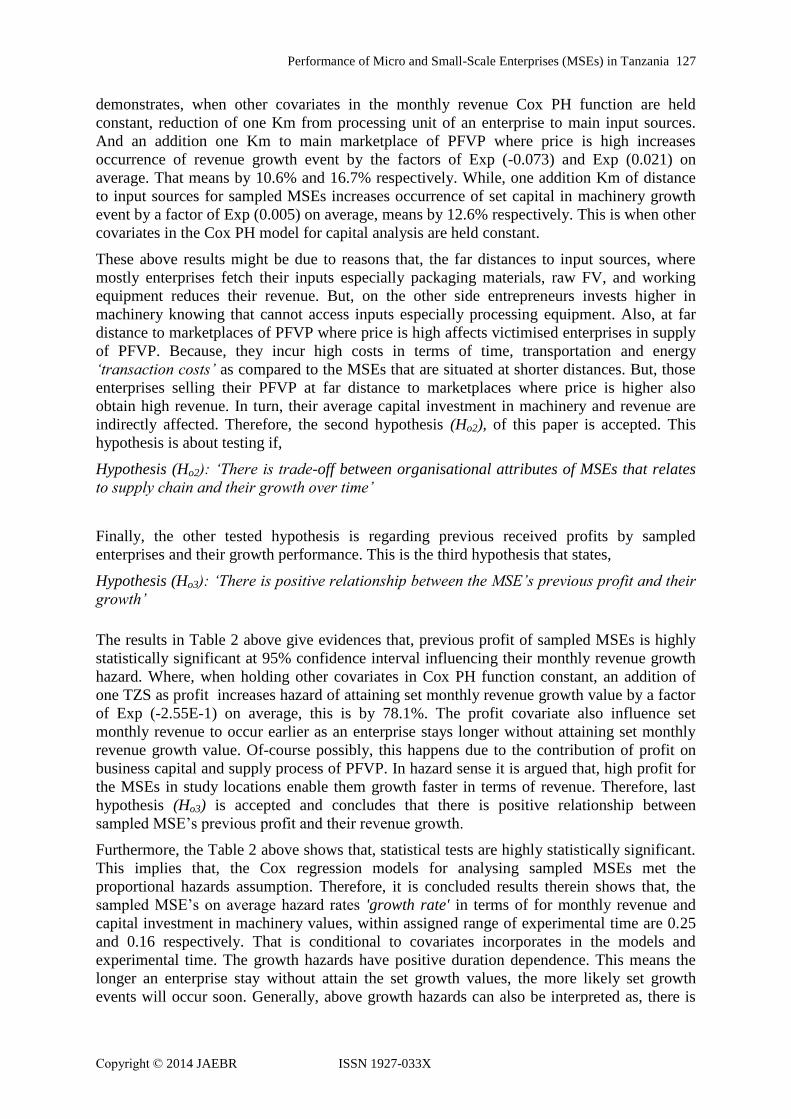
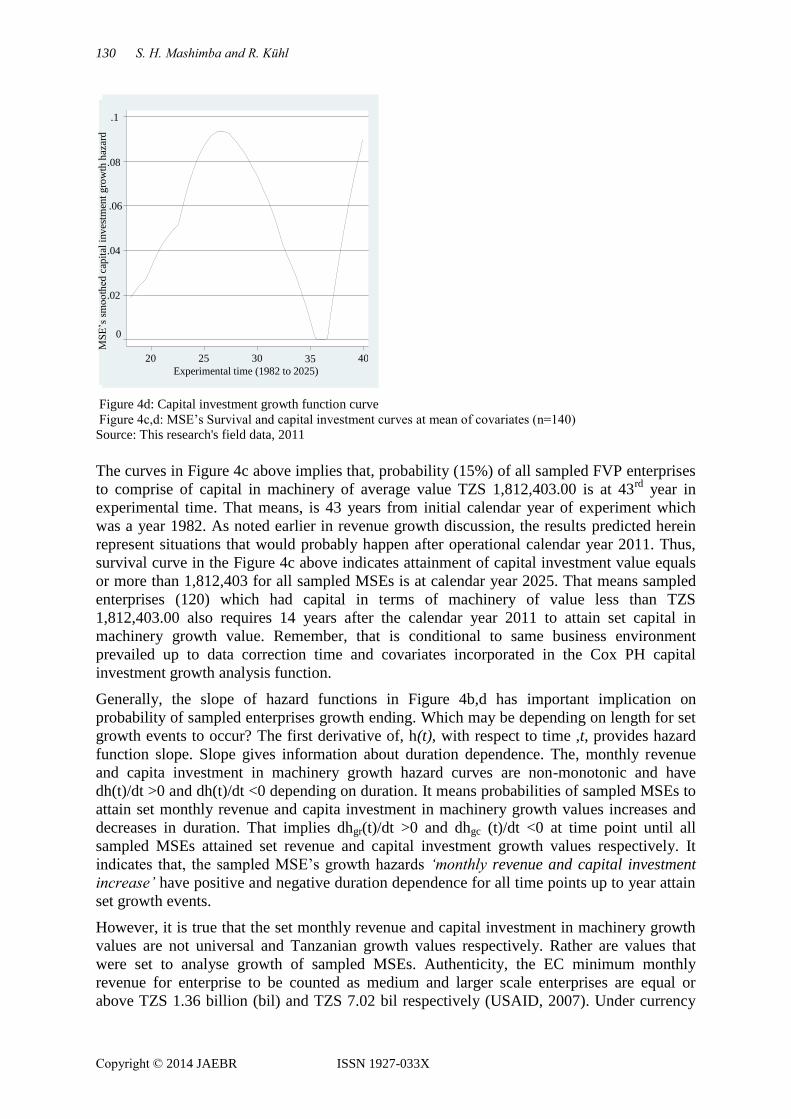
Figure 4d: Capital investment growth function curve
Figure 4c,d: MSE’s Survival and capital investment curves at mean of covariates (n=140)
Source: This research's field data, 2011
The curves in Figure 4c above implies that, probability (15%) of all sampled FVP enterprises
to comprise of capital in machinery of average value TZS 1,812,403.00 is at 43rd
year in
experimental time. That means, is 43 years from initial calendar year of experiment which
was a year 1982. As noted earlier in revenue growth discussion, the results predicted herein
represent situations that would probably happen after operational calendar year 2011. Thus,
survival curve in the Figure 4c above indicates attainment of capital investment value equals
or more than 1,812,403 for all sampled MSEs is at calendar year 2025. That means sampled
enterprises (120) which had capital in terms of machinery of value less than TZS
1,812,403.00 also requires 14 years after the calendar year 2011 to attain set capital in
machinery growth value. Remember, that is conditional to same business environment
prevailed up to data correction time and covariates incorporated in the Cox PH capital
investment growth analysis function.
Generally, the slope of hazard functions in Figure 4b,d has important implication on
probability of sampled enterprises growth ending. Which may be depending on length for set
growth events to occur? The first derivative of, h(t), with respect to time ,t, provides hazard
function slope. Slope gives information about duration dependence. The, monthly revenue
and capita investment in machinery growth hazard curves are non-monotonic and have
dh(t)/dt >0 and dh(t)/dt <0 depending on duration. It means probabilities of sampled MSEs to
attain set monthly revenue and capita investment in machinery growth values increases and
decreases in duration. That implies dhgr(t)/dt >0 and dhgc (t)/dt <0 at time point until all
sampled MSEs attained set revenue and capital investment growth values respectively. It
indicates that, the sampled MSE’s growth hazards ‘monthly revenue and capital investment
increase’ have positive and negative duration dependence for all time points up to year attain
set growth events.
However, it is true that the set monthly revenue and capital investment in machinery growth
values are not universal and Tanzanian growth values respectively. Rather are values that
were set to analyse growth of sampled MSEs. Authenticity, the EC minimum monthly
revenue for enterprise to be counted as medium and larger scale enterprises are equal or
above TZS 1.36 billion (bil) and TZS 7.02 bil respectively (USAID, 2007). Under currency
0
.02
.04
.06
.08
.1
M
SE
’s s
moo
thed
cap
ital
inv
estm
ent
gro
wth
haz
ard
20 25 30 35 40 Experimental time (1982 to 2025)
Performance of Micro and Small-Scale Enterprises (MSEs) in Tanzania 131
Copyright © 2014 JAEBR ISSN 1927-033X
exchange rate of year 2007: $ 1 is equivalent to € 0.7322; and TZS 1,256.74, on average
(Gocurrency.com, 2001-2013). On the other hand, Tanzanian SME's policy defined medium
and large scale enterprises as those enterprises having maximum capital investment in
machinery of TZS 200 mil and 800 TZS and above.
Therefore, the time required by all sampled enterprises to attain EC standard monthly revenue
and Tanzanian capital investment in machinery values of LEs are estimated in this paper by
making simple logics presented as,
‘If the probability (25%) of all sampled MSEs to attain set monthly revenue average of equal
or more TZS 357,743.00 and average capital investment of value TZS 1.8 mil or more (16%)
is in the year 2025. That means 14 years after year 2011. Then, it is herein estimated that for
all sampled enterprises, with more or less same growth rate requires centuries to grow and
attain categories of EC and Tanzanian medium as well as LEs growth levels. That mean on
average monthly revenue equals or above TZS 1.36 bil and TZS 7.02 bil and capital
investment in machinery value of TZS 200 mil and TZS 800 mil respectively. That is if there
are no significant changes made in studied FVP MSE's sub-section’.
8. Conclusion and recommendations
Above results reflects status of studied part of Tanzanian private sector, particularly micro
and small scale FVP sub-section. To which majority of people and Tanzanian government is
depending on for livelihood and economic growth respectively. The predicted time is long
period duration. The sampled MSE’s growth provides important insight in duration process
being modelled. Findings show that, growth performance of studied MSEs is not promising,
means their unilateral mode of operation influence poorly their growth performance. The
situation might hinder earlier realisation of Tanzanian government hope of transforming less
agricultural productive economy to semi-industrial productive economy. That at end
constitutes economic development vision of having strong economy to be less likely realised
by year 2025. That is only if Tanzania’s economy relies on agriculture sector, particularly
MSME’s sub-sector.
The results also suggest importance of studied enterprises to merge. Where, it has been
observed in Table 4 above that, the multi-owned enterprises, MSE’s with large capital, and
staff-size performs grows reasonably better. Therefore Tanzanian SME’s policy should
facilitate studied entrepreneurs to re-organise their activities and form cooperative as their
appropriate operational mode. That is essential to raise capital share in market which is
crucial for benefits, competitiveness, and economic growth.

132 S. H. Mashimba and R. Kühl
Copyright © 2014 JAEBR ISSN 1927-033X
References
Calice, P., Chando,V.M., Sekioua, S. 2012. Bank Financing to Small and Medium
Enterprises in East Africa: Findings of A Survey in Kenya, Tanzania, Uganda and Zambia,
Working Paper Series 146, African Development Bank, Tunis, Tunisia.
Central Intelligence Agency (CIA), 2012. World Factbook. Retrieved from
https://www.cia.gov/library/publications/rss-updates/september-27-2012.html. Retrieved on
27.08.2013.
Degenhardt, S. S., Stamm, A., Zehdnicker, M. 2002. The Growth Gap: A Small Enterprise
Phenomenon, Synthesis Document. The Donor Committee for Enterprise Development
German, 1-17.
Eskola, E. 2005. Agricultural Marketing and Supply Chain Management in Tanzania: ESRF
Study on Globalisation and East Africa Economies. A Case Study Working Paper Series 16.
Gocurrency.com, 2001-2013. Retrieved from, http://www.gocurrency.com.htm. Retrieved on
09.02.2013.
Goncalves M., Nunes P. M., Serrasqueiro, Z. 2011. The Influence of Age on SMEs' Growth
Determinants: Empirical Evidence. First Journal of Small Business Economics, 1-24.
Hensher, D.A., Mannering, F.L. 1994. Hazard-Based Duration Models and Their Application
to Transport Analysis. Transport Reviews 14:1, 63-82.
International Labour Organisation (ILO). 2003. Tanzanian Women Entrepreneurs: Going for
Growth. Geneva, ISBN 92-2-113731-7.
Liedholm, C. 2001. Small Firm Dynamics: Evidence from Africa and Latin America. World
Bank Institute Working Papers Stock 37189, 1-24.
Mabert, A.V., Modi, B.S. 2010. Exploring the Relationship Between Efficient Supply Chain
Management and Firm Innovation: An Archival Search and Analysis. Journal of Supply
Chain Management 46:4, 81-94.
Maliti, E., Mnenwa, R. 2008. The Role of Small Business in Poverty Reduction: The Case of
Dar es Salaam. Research Report 08.2.
Mao, H. 2009. Review on Enterprise Growth Theories. International Journal of Business and
Management 4:8, 20 -22.
Milanzi, M., Ngowi, P. H., Ogutu, F. 2006. SME Competitiveness facility (SCF) SME Export
Market Prospects Desk Study Volume II. Study report.
Nelson, R. R. 1998. The Agenda for Growth Theory: A Different Point of View. Cambridge
Journal of Economics 224, 497 - 520.
Nkya, J.E. 2003. Institutional Barriers to Small-scale Business Development: A Need for
Flexibility in Tanzanian Tax and Regulatory Systems. Journal of Entrepreneurship 12:1, 43-
73.

Performance of Micro and Small-Scale Enterprises (MSEs) in Tanzania 133
Copyright © 2014 JAEBR ISSN 1927-033X
Olomi, D. 2006. Policy Dialogue on Opportunities and Challenges for Rural smes
Development in Tanzania. Seminar Paper.
Ruteri, J.M.; Xu, Q. 2009. Supply Chain Management and Challenges Facing the Food
Industry Sector in Tanzania. International Journal of Business and Management 4:12, 70-80.
United Republic of Tanzania (URT). 2003. Small and Medium Enterprise Development
Policy. Ministry of Industry and Trade, Dar es Salaam.
United Republic of Tanzania (URT). 2009. SMEs Market Access Through Private and Public
Procurement and Linkages, Policy position paper Confederation of Tanzania Industries.
United States Agency for International Development (USAID), 2005. Understanding Micro
and Small Enterprise Growth. MicroReport 36.
United States Agency for International Development (USAID). 2007. Booklet of
Standardized Small and Medium Enterprises Definition. Sustainable Achievement of Business
Expansion and Quality (SABEQ), Bearing point, Inc, USAID/Jordan economic opportunities
Office (EO).
United States Department Of Agriculture (USDA), 2005. Electronic Report from the
Economic Research Service Agriculture Information. Bulletin 794. Retrieved from
http://web.ers.usda.gov.htm. Retrieved on 12.10.2010.