Embed Size (px)
Citation preview

LAPPEENRANTA UNIVERSITY OF TECHNOLOGY
School of Business & Management
Strategic Finance and Business Analytics
Henri Nuppunen
PERFORMANCE OF MERGER ARBITRAGE STRATEGIES IN THE EUROPEAN
STOCK MARKETS
Master’s thesis
2018
1st supervisor: Eero Pätäri
2nd supervisor: Sheraz Ahmed
ABSTRACT
Author: Henri Nuppunen
Title: Performance of merger arbitrage strategies in
the European stock markets
Faculty: School of Business & Management
Master’s Programme: Strategic Finance and Business Analytics
Year: 2018
Master’s Thesis: Lappeenranta University of Technology
77 pages, 5 figures, 11 tables and 3 appendices
Examiners: Professor Eero Pätäri (Lappeenranta University
of Technology)
Associate Professor Sheraz Ahmed
(Lappeenranta University of Technology)
Key words: Merger arbitrage, Sharpe Ratio, SKASR, Fama-
French, CAPM
This thesis focuses on identifying the profitability of the merger arbitrage investment
strategy in European markets during the 2002-2014 sample period. The data
consists of the mergers and acquisition deals between the European publicly traded
companies. The portfolios in the study are constructed by the payment method of the
deal and weighted either by equally or value weighted methods.
The performance of the portfolios is examined by mean monthly return and Sharpe
Ratio. Results are benchmarked against STOXX Europe 600 and European Total
Market return indexes. Abnormal excess returns for the portfolios are studied with
Capital Asset Pricing Model (CAPM) and Fama-French Three Factor model.
Additional robustness to the traditional Sharpe ratio test results are obtained by
Skewness and Kurtosis Adjusted Sharpe Ratio (SKASR). The results in this thesis
indicate that all the constructed total merger arbitrage portfolios outperformed
benchmark market return portfolios during the sample period. Moreover, merger
arbitrage investment strategy proved to be very market neutral investment strategy in
the most market conditions and potential strategy for investors aiming to catch
relatively high return-to-risk ratio.
TIIVISTELMÄ
Tekijä: Henri Nuppunen
Tutkielman nimi: Yrityskauppa-arbitraasin tehokkuus Euroopan
osakemarkkinoilla
Tiedekunta: School of Business and Management
Pääaine: Strategic Finance and Business Analytics
Vuosi: 2018
Pro gradu -tutkielma: Lappeenrannan Teknillinen yliopisto
77 sivua, 5 kuvaajaa, 11 taulukkoa ja 3 liitettä
Tarkastajat: Professor Eero Pätäri (Lappeenrannan
Teknillinen yliopisto)
Associate Professor Sheraz Ahmed
(Lappeenrannan Teknillinen yliopisto)
Avainsanat: Yrityskauppa-arbitraasi, Sharpe, SKASR, Fama-
French, CAPM
Tutkielma pyrkii kartoittamaan yrityskauppa-arbitraasi investointistragian
kannattavuutta Euroopan markkinoilla vuosien 2002-2014 välillä. Tutkimusaineisto
koostuu yrityskauppatarjouksista julkisesti listattujen eurooppalaisten yritysten välillä.
Tutkittavat portfoliot on rakennettu maksutavan perusteella ja kauppojen välinen
painoarvo on laskettu joko tasa-arvoisesti tai markkina-arvon perusteella.
Portfolioiden suoriutumista on arvioitu keskimääräisellä kuukausituotolla ja Sharpen
ratiolla. Tulosten suorituskykyä on mitattu STOXX Europe 600- ja European Total
Market return -indekseihin verrattuna. Ylisuuria portfolioiden tuottoja on tutkittu
Capital Asset Pricing Model (CAPM) ja Fama-French kolmifaktorimallien avulla.
Lisäksi perinteisen Sharpen ration tutkimustulosten luotettavuutta on vahvistettu
huipukkuus- ja vinouskorjatulla Sharpen ratiolla (SKASR). Tutkimustulokset
osoittavat kaikkia maksutyyppejä sisältävien portfolioiden olleen tuottavampia kuin
markkinatuotto tutkitulla aikavälillä. Lisäksi yrityskauppa-arbitraasi osoittaa olevansa
hyvin markkinaneutraali investointistrategia suurimmassa osassa markkinatilanteita.
Se on potentiaalinen strategia sijoittajille, jotka tavoittelevat korkeaa tuottoa
suhteessa riskiin.

Acknowledgements I have to say that studying in Lappeenranta has been a wonderful experience. I have
made many long-lasting friendships in the University. The atmosphere in Skinnarila
campus is something you need to live before you can really understand how great it
is.
The road from the beginning to finalizing my thesis has been long and longer than I
expected. Without the great support from my friends, family and especially from
Emma, I wouldn’t have made it. I want to thank all the faculty in the Lappeenranta
University of Technology for their excellence. Special thanks to my supervisor Eero
Pätäri for the great comments and ideas how to develop this thesis even better.
After all, the thesis was like a puzzle, it took a lot of time with small steps, and I felt
that it is never going to be ready. After all, now it is done.
Henri Nuppunen
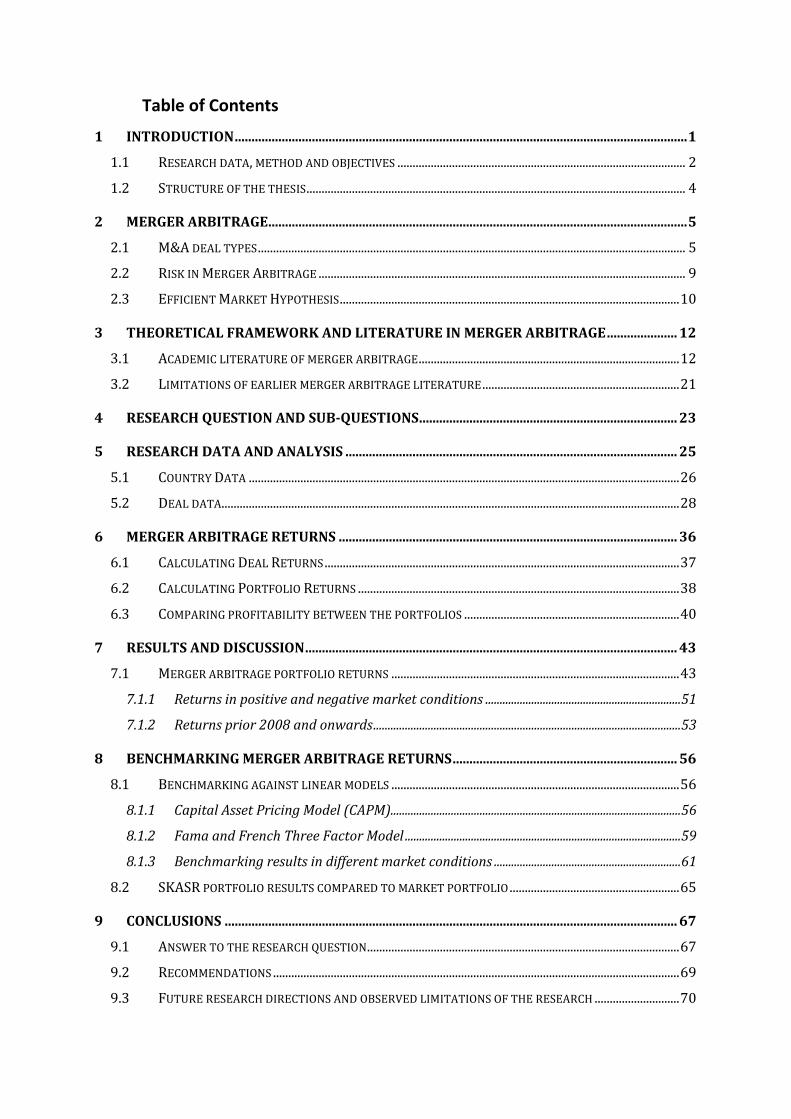
Table of Contents
1 INTRODUCTION ....................................................................................................................................... 1
1.1 RESEARCH DATA, METHOD AND OBJECTIVES ............................................................................................... 2
1.2 STRUCTURE OF THE THESIS ............................................................................................................................. 4
2 MERGER ARBITRAGE ............................................................................................................................. 5
2.1 M&A DEAL TYPES ............................................................................................................................................. 5
2.2 RISK IN MERGER ARBITRAGE ......................................................................................................................... 9
2.3 EFFICIENT MARKET HYPOTHESIS ................................................................................................................ 10
3 THEORETICAL FRAMEWORK AND LITERATURE IN MERGER ARBITRAGE ..................... 12
3.1 ACADEMIC LITERATURE OF MERGER ARBITRAGE ...................................................................................... 12
3.2 LIMITATIONS OF EARLIER MERGER ARBITRAGE LITERATURE ................................................................. 21
4 RESEARCH QUESTION AND SUB-QUESTIONS ............................................................................. 23
5 RESEARCH DATA AND ANALYSIS ................................................................................................... 25
5.1 COUNTRY DATA .............................................................................................................................................. 26
5.2 DEAL DATA ....................................................................................................................................................... 28
6 MERGER ARBITRAGE RETURNS ..................................................................................................... 36
6.1 CALCULATING DEAL RETURNS ..................................................................................................................... 37
6.2 CALCULATING PORTFOLIO RETURNS .......................................................................................................... 38
6.3 COMPARING PROFITABILITY BETWEEN THE PORTFOLIOS ....................................................................... 40
7 RESULTS AND DISCUSSION ............................................................................................................... 43
7.1 MERGER ARBITRAGE PORTFOLIO RETURNS ............................................................................................... 43
7.1.1 Returns in positive and negative market conditions ....................................................................51
7.1.2 Returns prior 2008 and onwards ...........................................................................................................53
8 BENCHMARKING MERGER ARBITRAGE RETURNS ................................................................... 56
8.1 BENCHMARKING AGAINST LINEAR MODELS ............................................................................................... 56
8.1.1 Capital Asset Pricing Model (CAPM).....................................................................................................56
8.1.2 Fama and French Three Factor Model ................................................................................................59
8.1.3 Benchmarking results in different market conditions .................................................................61
8.2 SKASR PORTFOLIO RESULTS COMPARED TO MARKET PORTFOLIO ........................................................ 65
9 CONCLUSIONS ....................................................................................................................................... 67
9.1 ANSWER TO THE RESEARCH QUESTION ....................................................................................................... 67
9.2 RECOMMENDATIONS ...................................................................................................................................... 69
9.3 FUTURE RESEARCH DIRECTIONS AND OBSERVED LIMITATIONS OF THE RESEARCH ............................ 70
REFERENCES ................................................................................................................................................... 71
APPENDICES .................................................................................................................................................... 76
Appendix 1. Portfolio SKASR analysis, where value-weighted portfolios are compared to
equal-weighted portfolios.
Appendix 2. Portfolio SKASR analysis, where short strategy portfolios are compared to long
strategy portfolios.
Appendix 3. Sensitivity analysis showing the relationship between the merger arbitrage
return and market return in different market conditions when losses over 10% are excluded
List of figures
Figure 1. Scania share price development during Volkswagen AG SEK 200 bid offer ........... 7
Figure 2. Number of deals by Country ................................................................................. 27
Figure 3. Cross-Border Deals by Country ............................................................................ 28
Figure 4. Average duration of the deal by announcement year ............................................ 31
Figure 5. Average number of running deals ......................................................................... 32
List of tables
Table 1.Number of deals by announcement year ................................................................ 30
Table 2. Success rate of the deals ...................................................................................... 35
Table 3. Monthly merger arbitrage portfolio returns in Europe 2002-2014 ........................... 44
Table 4. Monthly and annual performance of the merger arbitrage portfolios ...................... 50
Table 5. Share of the months when portfolio beats total market index by return in different
market conditions ................................................................................................................ 51
Table 6. Merger arbitrage monthly returns in positive and negative market return months .. 52
Table 7. Monthly returns 2002 to 2007 and 2008 to 2014 .................................................... 54
Table 8. Capital Asset pricing model (CAPM) total sample results for the constructed
portfolios ............................................................................................................................. 58
Table 9. The results from the Fama and French Three Factor model regression analysis for
total sample ......................................................................................................................... 60
Table 10. Sensitivity analysis showing the relationship between the merger arbitrage return in
different market conditions .................................................................................................. 63
Table 11. Portfolio SKASR results versus Total Market return index ................................... 65
1
1 Introduction
The financial markets are packed of different kind of investors. There are players in
the field of financial markets from small private investors to gigantic institutional
investors. It doesn’t matter who you are as everyone shares the same objective: they
want returns for their investment. The evolution of the financial markets has
developed investment opportunities to cover all kinds of investments and strategies.
Some of the investment strategies and hedge funds claim to obtain abnormal returns,
regardless of the existing market situation. The focus of this master’s thesis is in the
merger arbitrage which is one of those aforesaid investment strategies.
Merger arbitrage or risk arbitrage is an investment strategy that attempts to profit
from the price difference between the stock price and the offer price of the target
company after the merger announcement or an acquisition bid. After an
announcement the share price will increase to a level near offered price, but because
of a risk involved in deal completion there remains a small premium in the stock
price, called the arbitrage spread. Investors involved in this type of investments are
arbitrageurs who take long positions of a target company to take advantage of the
arbitrage spread. If the merger is successful, investors successfully capture the price
difference as a profit for their investment.
In contrast to classical risk-free arbitrage trade, there is a risk related in merger
arbitrage. Risk in a merger arbitrage accrues from the losses if the merger fails, the
target and acquirer stock prices could move unfavorably. Leading merger
arbitrageurs to suffer a much higher loss than the profits if the deal consummates.
The alternative name of merger arbitrage is risk arbitrage which derives from the risk
that the announced deal may or may not succeed.
In academic literature several studies have found large excess returns (i.e., risk-
adjusted returns) related to the merger arbitrage investment strategy. Numerous
earlier academic studies, e.g. Mitchell & Pulvino (2001), Baker & Savasoglu (2002),
Maheswaran & Yeoh (2005), Kearney et al. (2008) have found statistically-significant
evidence between merger arbitrage and excess returns. Investors are always
2
seeking for perfect and more profitable investment opportunities, raising questions
why there are excess returns available on merger arbitrage investments. Larcker &
Lys (1987) suggest that excess return is a compensation for obtaining expensive
private information involved in investments. According to Mitchell & Pulvino (2001)
merger arbitrageurs are providing liquidity to markets and excess returns are
reflected to a premium paid for their presence, especially during severe market
downturns.
Mergers and acquisitions are one of the most studied topics in finance research.
However, the literature of the merger arbitrage is very limited, albeit it’s part of the
merger and acquisition research. Most of the existing studies have used US data as
US markets are often said to be the most efficient markets in the world. Additionally,
some other papers have used data from single countries outside the US e.g. from the
United Kingdom, Canada, Taiwan, Germany and Australia. Also, it’s intriguing to
notice that all the most notable papers published in academic journals contain data
prior the latest finance crisis and latest of them have used data that ends in the year
2008.
1.1 Research data, method and objectives
As opposed to existing literature in this master’s thesis the focus is on European
merger arbitrage markets. By authors’ knowledge this is the most comprehensive
study so far based on the European market data. Sample data consists of mergers
and acquisition bids from 2002 to 2014. Data for this research is from Thomson One
Banker and Datastream databases. In this paper sample is limited to mergers and
acquisition bids between European public companies. Also, only bids that are either
only cash, stock or mixture of cash and stock are included. Different type of deals
that include other kind of payment method than above e.g. financial derivatives or
stock options are excluded, because of their more complicated valuation methods. In
2002 Baker & Savasoglu proposed in their paper that the impact of transaction costs
is rather small in the merger arbitrage returns. Due to the limitations of this study
transaction costs are not accounted for. More specific information about the selected
data and its limitations will be discussed in later chapters.
3
The main objective of this paper is to provide the first and consequently the most
extensive study of the merger arbitrage investment returns in Europe. Needless to
say that the use of data from the whole different continent and a time series that
includes the latest financial crisis can provide unpredictable findings in this field of
financial research. One can predict the results based on the earlier findings in the
United States, Canada, United Kingdom, Taiwan and Australia, but the time series of
this thesis can also be an interesting factor. Ji & Jetley (2009) found that the merger
arbitrage spread has declined dramatically in the last decades and by more than 400
bps between 2002 and 2007. They suggest that some of the decline could be
permanent; consequently, researchers and investors analyzing the profitability of
merger arbitrage hedge funds should focus on returns since 2002. Considering the
different continent and the time series between 2002 and 2014 there is a possibility
that positive excessive returns reported in earlier literature have turned into negative
if the downslide in the arbitrage spread has continued in a same pace as from the
research by Ji & Jetley (2009).
This research is conducted quantitatively and uses statistical methods. The research
data used in the empirical part consists of merger and acquisition bids of 344
European public companies. The dataset in this thesis is from the year 2002 to 2014.
This time horizon is selected to provide as comprehensive time series as possible
since 2002 as Ji & Jetley (2009) recommended not to focus on earnings prior to
2002.
The objective of this master’s thesis is to answer to the question: Are there existing
large excess returns by using the merger arbitrage investment strategy in European
markets in the time series since 2002 and does it make merger arbitrage to an
exceptional investment strategy? The following sub-questions are formed to provide
appropriate information and to achieve an adequate answer to our main research
problem:
Q1: Are there differences in the returns between cash, stock swap and mixed
deals?

4
Q2: Are there differences in the returns between value and equal weighted
portfolios?
Q3: How the latest financial-crisis has affected to the returns of merger arbitrage
and can we see a declining trend in merger arbitrage returns?
Q4: The earlier literature has reported low volatilities involved in merger arbitrage
trade; is it higher in this time horizon examined in Europe than in the earlier
studies in North America?
Q5: Are the risk arbitrageurs facing more risk during the depreciating markets than
the positive and flat market conditions?
In this paper different types of portfolios will be constructed by using merger arbitrage
investment strategy. Portfolios will be formed by deal type, portfolio balance method
and investment strategy. Returns will then be benchmarked against selected market
indexes. The mean monthly return will be calculated for each of the portfolios as a
performance measure. Merger arbitrage returns will be benchmarked against linear
model. Tentatively, performance indicators in this thesis will include both Capital
Asset Pricing Model (CAPM) and three-factor Fama-French model.
1.2 Structure of the thesis
This paper consists of nine chapters. The first chapter is an introduction, and second
chapter is designed to provide an overall understanding of the merger arbitrage as an
investment strategy. The third chapter provides a theoretical framework and literature
review. The main research question and sub-questions are explained in the fourth
chapter. The time series data is presented and analyzed in chapter five. The
research methodology of this study is reviewed are processed in the sixth chapter.
The results of empirical research are presented in the seventh chapter. The results
are benchmarked different models in eight chapter and the conclusions are
presented in the ninth and final chapter.
5
2 Merger Arbitrage
The press usually portrait merger arbitrageurs in an unfavorable way. Merger
arbitrageurs are important players in the market, increasing the welfare, facilitating
takeovers and increase the value of a company. Usually, acquirer offers a higher
price per share than the current trading price in the markets is. Acquirer offers
incentive to convince existing stock owners of the target company to vote favorably
for the takeover bid. Therefore, the market price of the target share rockets after
announcement close to the offer price, but usually trades bit lower than the bid offer.
This means that the value of the stock holdings of the existing owners inflates heavily
from the preannouncement value. Consequently, this attracts merger arbitrageurs
that try to take advantage of that bid premium in takeover attempts. At the same time,
they provide insurance to the other investors to cash out from their initial investment
in case that the takeover attempt fails, and stock price will fall to the earlier trading
price (Cornelli & Li 2002).
2.1 M&A deal types
In the financial markets, there are multiple types of merger and acquisition deals. In
this paper, we are focusing to three different takeover types cash offer, stock offer
and to mixed offer deals.
Cash Offer Deals: In a pure cash deal, acquirer offers a fixed amount of cash per
target company share. Merger arbitrageur tries to take advantage of the existing bid
premium and bets for the successful takeover deal. In case that the deal is
successful merger arbitrageur catches the spread between the invested stock price,
prior deal consummation and the offer price after the deal has gone through. The
strategy is simple and means that the arbitrageur takes a long position in the acquirer
shares and collects profit for the investment after the deal is completed.
The formula for cash deal arbitrage spread is given by the same method as
mentioned earlier by Ji & Jetley (2009):
6
𝑆𝑐𝑎𝑠ℎ,𝑡 =
𝑃𝑜𝑓𝑓𝑒𝑟 − 𝑃𝑡𝑎𝑟𝑔𝑒𝑡,𝑡
𝑃𝑡𝑎𝑟𝑔𝑒𝑡,𝑡 (1)
Where 𝑆𝑐𝑎𝑠ℎ,𝑡 is equal to the arbitrage spread for a cash deal on trading day t. 𝑃𝑜𝑓𝑓𝑒𝑟
is the price in cash that the acquiring firm offers to pay for each target firm’s share.
And 𝑃𝑡𝑎𝑟𝑔𝑒𝑡,𝑡 is the closing price of the target firm’s stock on trading day t.
The deal between Volkswagen and Scania represents a good example of a cash
offer deal. On 21 February 2014, Volkswagen AG announced a public offer to the
shareholders of Scania Ab to tender all shares in Scania to Volkswagen. Volkswagen
offered SEK 200 in cash per share regardless of share class. Day prior public
announcement day Scania was trading at SEK 147. After an announcement by
Volkswagen Scania share price rocketed immediately close to offer price and was
trading at SEK 194.5 on 24th of February 2014. The SEK 5.5 difference between the
offered price by Volkswagen and an actual price in the markets present the premium
that attracts merger arbitrageurs to invest in a deal. The offer was conditioned upon
at least 90% of Scania’s shares being tendered. On 13 May 2014 Volkswagen
announced that the offer will be completed. Later, on 21 May 2014 Scania
announced that NASDAQ OMX Stockholm has decided to delist Scania’s shares and
the last trading day for the Scania was 5th of June 2014 (Volkswagen 2014). In figure
1 the share price development of Scania AB is shown during the bid period. The
share price of Scania was trading below the offered price for the announcement
period. The Scania AB stock was trading with a smaller arbitrage spread in February
and March, but the stock price fell in May as there were more uncertainty with the
deal completion.

7
Figure 1. Scania share price development during Volkswagen AG SEK 200 bid offer
Stock Offer Deals: In a stock offer, acquirer doesn’t offer cash in exchange for the
target firm stock but offers to finance the takeover attempt with its own stock. Like as
already explained in a cash offer case, the strategy is that merger arbitrageurs will
take a long position in the target company stock in stock offers. Additionally, in stock
offers arbitrageurs take a short position in the acquiring company stock, meaning that
they will borrow acquiring company stock. The reason why arbitrageurs short
acquiring stock is behind the fact that after a successful stock offer takeover they will
receive a fixed amount of acquiring company shares anyway. In case that the target
to acquirer stock ratio is fixed, investors will receive promised number of shares as
long the deal is completed.
The actual profit for the arbitrageur will be the combination of the increasing price of
the target stock and the possibly decreasing acquirer’s stock. There are alternative
investment methods available for stock offers. The one option is that the acquirer
offers a fixed amount of its own shares for an exchange for the target company share
this it is called a stock swap. The second alternative of a stock offer is called collar
transaction, meaning that the exchange ratio is not finalized until the consummation
date. Generally, in collar merger transactions it’s designed to provide a stable dollar
8
value for the target share exchanged nevertheless the volatile value of the acquiring
company stock. Branch & Yang (2006b) said that compared to stock swap offer the
use of the collar merger offer put managers of the acquiring firm to be more
comfortable with the valuation of the target firm and/or the positive effect of the
proposed merger attempt. On the other hand, they also mentioned that collar merger
offers are more likely than stock swap offers to receive competing offers.
The formula for stock deal arbitrage spread is given by the same method as
mentioned earlier by Ji & Jetley (2009):
𝑆𝑠𝑡𝑜𝑐𝑘,𝑡 =
(𝑃𝑎𝑐𝑞𝑢𝑖𝑟𝑒𝑟,𝑡)(𝐸𝑅) − 𝑃𝑡𝑎𝑟𝑔𝑒𝑡,𝑡
𝑃𝑡𝑎𝑟𝑔𝑒𝑡,𝑡 (2)
Where 𝑆𝑠𝑡𝑜𝑐𝑘,𝑡 is equal to the arbitrage spread for a stock deal on trading day t.
𝑃𝑎𝑐𝑞𝑢𝑖𝑟𝑒𝑟,𝑡 is the closing price of the acquiring firm’s stock on trading day t and 𝐸𝑅 is
the exchange ratio (i.e., the number of shares of the firm’s stock offered to the target
firm’s shareholders in exchange for one share of the target firm’s stock. Like in cash
deal arbitrage spread formula 𝑃𝑡𝑎𝑟𝑔𝑒𝑡,𝑡 is the closing price of the target firm’s stock on
trading day t.
Mixed Offer: It is common that the acquisition is paid not only with cash or either with
stocks. Sometimes the deal is including the combination of a mix between cash and
stock. In some cases, mixed offers (or hybrid offers) can include other kinds of
financial derivatives and stock options, which set them harder to analyze than
aforesaid deal types. These kind of tricky deal types will be excluded like in most of
the prior studies in merger arbitrage literature. Consequently, in this study only the
cash offer, stock offer and mixed offer deals that contain only stock and cash will be
included.
9
The formula for mixed deal arbitrage spread is given by:
𝑆𝑚𝑖𝑥,𝑡 =𝑃𝑜𝑓𝑓𝑒𝑟+(𝑃𝑎𝑐𝑞𝑢𝑖𝑟𝑒𝑟,𝑡)(𝐸𝑅)−𝑃𝑡𝑎𝑟𝑔𝑒𝑡,𝑡
𝑃𝑡𝑎𝑟𝑔𝑒𝑡,𝑡 (3)
Where all other factors are familiar from cash and stock arbitrage spread formulas,
but 𝑆𝑚𝑖𝑥,𝑡 is the arbitrage spread for a mixed deal consisting of cash and stock on
trading day t.
2.2 Risk in Merger Arbitrage
Arbitrage is understood as an investment process of simultaneous selling and buying
of an asset to profit from a price difference between the markets. The arbitrage
exploits the price differences of equivalent financial instruments on different markets
or in different forms. In an arbitrage trade the quantity of the underlying asset sold
and bough should be the same. The payoff of the trade is the price difference
between the underlying assets. Usually, the payoff is relatively small in percentage
terms and to ensure the profitability of the trade it should also cover the transaction
costs involved in trade. Arbitrage exploits the existing market inefficiencies.
Unlike the generalized arbitrage in merger arbitrage there is a risk involved, why it is
often referred as risk arbitrage. Sometimes takeover deals fail, which can mean
losses to risk arbitrageurs. When a takeover attempt fails prices of the target and
acquiring company could undergo to the preannouncement levels or even further.
However, there is no rule to determine whether unsuccessful deals will always cause
undesirable losses to the merger arbitrageurs as Branch & Yang (2006a) reported
higher profits in their sample data for an unsuccessful cash tender offer deals than in
successful deals. However, the findings by Branch & Yang (2006a) were driven by
the competing bids by different acquiring companies increasing the price of the target
company. The rule of thumb could be that most likely investors will face losses in
case of deal failure unless there will be competing or improved bid offers.
10
Like always in investments the diversifying to multiple investments and not to allocate
all available cash to one single deal decreases the risk for investors. Many earlier
studies have used two following investment strategies to allocate the portfolio by
either value-weighted or equal-weighted strategy (e.g. Baker & Savasoglu 2002,
Maheswaran & Yeoh 2005 and Kearney et al. 2008). Meaning that the weight of a
single deal in a constructed merger arbitrage portfolio could be determined by the
value of the deal or by equal weight for all running deals. Moore et al. (2006) reported
in their merger arbitrage hedge fund survey results that 10% was the most common
maximum limit for hedge funds in a single investment to control their risk, suggesting
that merger arbitrageurs avoid to over-weight some specific deals too much in their
portfolios.
2.3 Efficient Market Hypothesis
One of the most famous theories in the field of finance is efficient market hypothesis
by Eugene Fama (1965). Fama (1970) suggested that there are three forms of the
market efficiency “weak”, “semi-strong” and “strong”. The weak-form suggests that all
the past available public information is already reflected to the market price and one
cannot earn excess returns by analyzing historical data on share prices. Therefore,
prices follow a random walk pattern, meaning that all price changes are random and
cannot be predicted. Semi-strong-form suggests that in addition to weak-form all
publicly available new information will adjust the share prices very rapidly meaning
that no excess returns can be earned based on that information, one can only
achieve excess returns by using insider information. The strong-form hypothesis
suggests that no one can earn excess returns even with private insider information.
Afterwards, several studies have studied efficiency of the markets. Malkiel (1973)
argued in his book “A Random Walk Down Wall Street” that stock prices generally
follow random walk and it is not possible to beat the markets consistently. Later on,
numerous researchers have found anomalies that distort market efficiency and
create possibilities to build up trading rules (Ariel 1987, Agarwal & Tandon 1994,
Cadsby & Torbey, 2003). It is extremely vital to understand the background of the
market efficiency as a perquisite for arbitrage. Arbitrage can be said as an opposite
11
to market efficiency. Generalized arbitrage exploits the inefficiencies between the
markets and earns an excess profit without risk with multiple risks. Contrary to other
arbitrage trades in merger arbitrage investor is exposed to a risk so it’s not a risk-free
investment. Still merger arbitrageurs try to exploit the inefficiencies of the market with
the continual pattern to earn excess returns, which is against the market efficiency.
Myers & Majluf (1984) suggested in their popularized study of pecking order theory
that managers take advantage of asymmetric information as they know more about
their company’s prospects, value and risks than investors. Based on their theory
managers prefer to pay acquisitions with shares rather than cash when they consider
their company shares overvalued in the markets. If, acquiring company managers
value their shares higher than the market price is they may prefer to pay the
transaction with cash. The transaction method to pay with stock over cash puts price
pressure to acquirer stock to shrink after a bid announcement. Consequently,
pecking order theory advocates merger arbitrageurs to sell short acquirer’s stock in
case of stock bid. More detailed findings of the short selling in merger arbitrage
trades will be presented later in the literature review part.
Collar offer could be one of the better examples how offer type can signal the
inefficiencies in the markets. Compared to stock swap offers, the collar provides
more time to the market to evaluate the values of acquirer and targets which possibly
reduces information asymmetry. (Houston & Ryngaert 1997, Fuller 2003) Branch &
Yang (2006) in their study of risk arbitrage focused on payment methods and
acquisition types. Based on their findings, there are huge deviations between the
generated losses between the different payment methods and acquisition types
supporting the inefficiencies of the markets. Generally, failed stock swap mergers
tend to generate higher losses than do failed collar mergers.

12
3 Theoretical Framework and Literature in Merger
Arbitrage
The major part of the prior research has focused to the merger arbitrage returns in
the U.S. markets. Ji & Jetley (2009) reported a significant 520bps lower first-day
arbitrage spread in the 2001 compared to deals announced between 1990 and 1995.
Therefore, it should be kept in mind that some of the earliest reported earnings are
not possible to reach in later time periods. The first part of the chapter is focused to
the earlier academic literature of merger arbitrage. In the second part of the chapter
limitations raised from the earlier literature are raised.
3.1 Academic literature of merger arbitrage
Baker & Savasoglu (2001) used a sample of the deals announced between the years
1981 and 1996. Their diversified portfolio of risk arbitrage positions produced an
abnormal return of 0.6% to 0.9% per month. They found evidence to support the idea
that merger arbitrageurs provide liquidity and insurance to the markets when
undiversified investors sell their holdings to decrease the risk in case of deal failure.
In a return to their presence they require a premium for bearing the completion risk.
Their cross-sectional analysis revealed that firm size and idiosyncratic risk are
determinants of predicted returns. In the study, one standard deviation change in firm
size leads to a 0.8% increase in average returns, suggesting that higher deal value
also leads to a higher arbitrage return. On larger deals there is more information
available supporting the correlation between the transaction costs and the returns of
the deal. In idiosyncratic risk function they measured the probability of takeover
success by the deal attitude and the takeover premium.
In merger arbitrage the possible returns are capped to the announced bid offer,
unless there will be upward revisions or competing offers. Baker & Savasoglu (2001)
report a total of about one third of the abnormal returns to be explained by the
upward revisions or competing offers. In their data between 1992 to 1996 only 13%
13
of the deals were revised one or multiple times. Additionally, the revisions are not
always upward and can be sometimes seen as revisions downwards. However, the
downward revisions can be seen, as an unlikely event as it represented only 2.6% of
the total deals.
Merger success predictions: One of the biggest factors determining the actual profit
of the deal is the completion rate. To predict the completion of the deal Walking
(1985), Schwert (2000) and Baker & Savasoglu (2001) all found the attitude of the
deal to be the best single predictor of deal success. According to Baker & Savasoglu
(2001) acquirer attitude explains 8% of the variation in outcomes.
Mitchell & Pulvino (2001) studied mergers between 1936 to 1998 and found that risk
arbitrage returns are positively correlating to depreciating markets. However, their
findings suggest that risk arbitrage returns are uncorrelated with market returns in flat
and appreciating markets. It was the first paper to document high correlation between
the down markets and the risk arbitrage returns. Not surprisingly, their findings also
report deals to fail more often during market downturns than on flat or appreciating
markets. A 5 percent or decrease in either the contemporaneous market return or the
lagged market returns increased the probability of deal failure in their sample by 2.25
percent.
After controlling for transaction costs, they found that risk arbitrage generates excess
returns of four percent per year. In conclusion, Mitchell & Pulvino (2001) suggest in
financial markets exhibit systematic inefficiency in the pricing of firms involved in
mergers and acquisitions. Some of the potential explanations for inefficiencies could
be the transaction costs and other practical limitations that prevent investors to profit
these extraordinary returns. Other suggestion by Mitchell & Pulvino (2001) could be
the belief that risk arbitrageurs receive a risk premium to compensate for the risk of
the potential deal failure.
Michell & Pulvino (2001) executed their study with two different methods: 1st method
included value-weighted average of returns to individual mergers, the study ignored
all transaction costs and other practical limitations. The 1st method accumulated
statistically significant returns of 0,74% per cent per month equivalent to 9.25 per
14
cent annually. The 2nd alternative method included hypothetical transaction costs,
consisting of all brokerage commissions and the price impact associated with trading
less than perfect liquid securities. The difference of the returns is significant when the
trading costs were included as the alpha declined to 0,29% per cent per month
meaning total returns of 3.54 per cent annually. More importantly, they found risk
arbitrage to generate 50 basis points excess returns per month greater than risk-free
rate with essentially a zero-market beta. Although, during the months with 4 percent
or higher decrease in market, the market beta of risk arbitrage portfolio increases to
0.50. They found risk arbitrage portfolio to generate moderate returns in most of the
market environments, but in some cases to generate also large negative returns as
well. In case, all of the transaction costs are excluded they found merger arbitrage
portfolio to generate excess returns of 10.3% percent and CAPM results suggested
9.25% excess returns. The practical finding though is when transaction costs and
other limitations are applied the merger arbitrage portfolio returns accumulated only
excess returns of 4 percent annually, which is way below than the earlier studies
have suggested. Their findings suggest that excluding the transaction costs and
other limitations is the primary explanation for extraordinary large excess returns
reported in earlier studies.
Deal length as an indicator for deal success is one interesting topic to cover in the
mergers and acquisitions. Mitchell & Pulvino (2001) reported, on average 59,3
trading days duration for successful deals and 64,2 days to ultimately succeed, in
contrast to ultimately failed deals to last on average 39,2 days. Branch and Yang
(2006a) found in their sample that on average cash offer deal duration was 55
business days, shorter than the 101 days for stock swap offers.
Deal type is a one ruling factor to estimate the probability of deal failure or success.
Mitchell & Pulvino (2001) found in their study that hostile deals have 12.8 percent
greater profitability of deal failure than friendly deals, additionally they found leverage
buyouts to have also higher failure than friendly deals. Hsieh and Walking (2005)
didn’t find evidence to support the deal attitude as a factor to affect in merger
arbitrage decision making. According, to their study merger arbitrageurs are as likely
to invest in friendly and hostile attitude deals and the existence of multiple bidders
does not affect to their presence of the trade.
15
The existing literature on bidding company performance is mixed. Early studies by
Jensen & Ruback (1983) and Jarrell et al. (1988) reported that bidding firm
shareholders do not lose but generate positive gains during corporate takeovers.
Agrawal, Jaffe and Mandelker (1992) studied post-merger performance in their
sample between 1955 to 1987 and reported approximately 10% loss for stockholders
of the acquiring firm over the five years following the merger completion.
Mitchell et al. (2004) claim that almost half of the negative announcement period
share price reaction for bidding company shares of stock-financed takeover bids is
caused by the pressure of short selling by merger arbitrage. Mitchell et al. (2004).
They suggest that often the negative price reaction to acquiring company share price
in stock financed bids is caused by investment and financial policy. The argument
supports the idea of favoring stock-financing when the managers think that the
markets overvalue their stock as mentioned earlier in chapter 2. Conversely, in an
earlier study by Andrade et al. (2001) authors found, conversely flat to positive
abnormal returns in total for acquirer stock under termination period. However, the
earlier literature has reported negative abnormal returns for the acquirer share price
for the announcement period from -1.3% to -3.3% in stock-financed takeover bids
(Houston & Ryngaert 1997, Andrade et al 2001, Fuller et al. 2002, Mitchell & Pulvino
2004). Contrary to stock-financed returns, Andrade et al. (2001) and Fuller et al.
(2002) both reported 0.4% positive abnormal returns for holding acquiring company
stock over announcement period in cash-financed deals.
Later Hutson & Kearney (2005) studied the share price behavior of Australian
companies involved in takeover bids between 1984 and 1994. They found strong
interaction between the share price of the target company and acquirer in a stock-
swap and mixed cases, where they saw the large price transfer effect from acquirer
to target. They also found some small interaction in cash bids and in stock-swap
takeovers from the target to the bidder. Hutson & Kearney (2005) found after the bid
announcement 38% decrease in target company betas, but no significant change to
bidder firms.
Blau et al. (2015) studied short selling activity and negative price pressure to bidder
stock price around merger announcements. They tested Mitchell et al. (2004) claim
16
that nearly half of the negative announcement period acquirer stock price decline is
caused by merger arbitrage short selling in fixed-exchange ratio stock mergers.
Contrary to earlier study Blau et al. (2015) performed their research with daily data
compared as the original study was done by the monthly data. They found evidence
for over 2.5 times greater shorting activity for the two-day post-announcement period
than during the ten-day pre-announcement period. Over the announcement period
the shorting activity is abnormally high. Their results indicate that short activity is
significantly higher for stock than cash-financed takeover bids, short selling turnover
for stock-financed mergers was nearly three times higher than for cash-financed
mergers in their sample. Contrary to earlier literature (Mitchell et al. 2004) they argue
that short selling is uncorrelated to post-announcement returns and show that short
selling does not increase price pressure around takeover period.
The role of merger arbitrageurs in takeover success was studied by Cornelli & Li
(2002). According to their paper the new arbitrage has increased, narrowing the
spreads, and after the takeover bid announcement the share prices are rising more
rapidly than before. Their findings suggest that often merger arbitrage community
controls approximately 30 to 40% of the stock and is the single most important factor
to determine the success of a takeover, as the risk arbitrageurs are more likely to
tender in favor the deal completion. According to Cornelli & Li (2002) there is a
positive relationship between probability of takeover success and the trading volume.
Additionally, this also implies a positive relationship between the stock price and the
trading volume. Moreover, they found that the increase in the number of alternative
takeover deals decreases the number of the expected arbitrageurs to invest in a
specific deal, increasing the takeover premiums in the market and risk arbitrageur
profits, suggesting inefficiencies and limited arbitrage capital in the markets.
Cornelli & Li (2002) find that the higher liquidity of stock increases the possibility to
hide the trade by risk arbitrageurs. Therefore, the presence of risk arbitrageurs is
higher in takeover bids with liquid stock and higher are their returns, in case they
decide to invest in the takeover deal. Risk arbitrageurs try not to reveal their
presence in the market not to fully reflect the increased probability of a deal success
to buy more shares and earn higher profit. They also show that the higher
competition between the risk arbitrageurs are reducing the profitability of merger
17
arbitrage. Hsieh & Walking (2005) confirmed in their study some of the findings
earlier suggested by Cornelli & Li (2002). Hsieh & Walking (2005) found empirical
evidence to support a change of risk arbitrageur holdings has a positive relationship
to arbitrage returns, offer outcomes and bid premium.
Moore et al. (2006) did a survey-based research on the behavior of risk arbitrageurs
in mergers and acquisitions. Their results confirm the findings by Cornelli & Li (2002)
that risk arbitrageur community holds a significant share in target companies’ stock.
Hsieh and Walking (2005) estimated that immediately after the announcement the
merger arbitrage community acquires approximately 15% share of the target
company and Officer (2007) reported even higher 35% share in an average deal.
Moore et al. (2006) reported that most of the merger arbitrageurs select their position
already on the announcement day, but one third of the respondents said that they will
select the position from a few days after an announcement to two weeks after.
Merger arbitrageurs seem to unwind quite slowly after the deal cancellation; only less
than 10% of the respondents sell their sales immediately an announcement day of
failed deal. Most of the respondents seem to wait for an improved or competing offer
after the takeover bid has been turned down. Moore et al. report also that there are
professional hedge funds operating only focusing to risk arbitrage and multi-strategy
hedge funds investing to risk arbitrage.
Officer (2007) tested the performance-based arbitrage hypothesis by Shleifer &
Vishny (1997) suggesting that the returns of past arbitrage trades is affecting to the
availability of funds in the future arbitrage trades and hence affecting to return.
Officer (2007) suggests in his paper that arbitrage markets are well-functioning and
large losses or number of investment opportunities do not have a significant impact
on the prices and arbitrage opportunities neither returns, unlike performance-based
arbitrage hypothesis suggests. Officer (2007) focused how merger arbitrageurs are
preparing for ‘disasters’ and presents that merger arbitrageurs diversify their
investments in a proper level for potential losses. However, Officer (2007) reported
that after large arbitrage losses the merger announced shortly after trades on
average with approximately 1-2% wider spread premium than normal supporting little
evidence for performance-based arbitrage hypothesis.
18
Hansen (1987) argued in his paper that when the target company knows its value
better than the acquiring company, the acquirer prefers to offer stock as a payment
method for a deal, which has desirable contingent-pricing characteristics, rather than
cash. Branch & Yang (2006a) analyzed the profitability of merger arbitrage by
different payment methods with their sample between 1990 and 2000. Their results
indicate that successful stock deals generate a higher return-to-total-risk-ratio to the
investors than a successful cash offer. Their findings support an argument of
asymmetric information (see. Myers & Majluf 1984, Hansen 1987) involved in
mergers and acquisitions and its relationship to the profitability of merger arbitrage.
Surprisingly, in their sample unsuccessful cash tender offers generated higher
returns than successful deals due to the frequency of competing bids. Therefore,
cash deals generated a higher annual return than stock swap deals when risk is
excluded. Additionally, their results indicate that the payment method and the market
conditions have a huge influence to a beta of typical risk arbitrage positions and
portfolios. Stock swap and collar offers have a lower beta than cash tender offer
deals due to the long-only position.
The betas of different payment methods are behaving differently during the down
markets suggested by Branch & Yang (2006a). Their results suggest that the beta of
cash and collar offers is not increasing, but for stock swap offers the beta is
increasing during the down markets. As over 70% of their sample deals were stock
swap deals compared to over 70% cash deal offers in Mitchell & Pulvino (2001) study
also their aggregate results were in contrary during the down markets. They suggest
that the deal type structure of the sample is an important factor for the down-market
beta results. Comparing the acquirer and target stock betas Branch & Yang (2006a)
found acquirer company stock betas to be higher than do target stock. Wang &
Wedge (2012) reported a 1,30% average return to stock deal portfolios and 1,43%
average return to cash deals with their US sample between 1996 to 2008. Turamari
& Hyderabad (2017) found in their Indian sample data that cash-financed mergers
perform better than stock-financed mergers, supporting payment method as a factor
to estimate post-merger performance of firms. Hsieh & Walking (2005) argue in their
study that merger arbitrageurs are more likely to get involved collar than cash or
stock swap offers.
19
Stanley Block (2006) compared the performance of the merger arbitrage index to
S&P 500 Index between the 1993 to 2004. Interestingly, during 2000 and 2002 he
found that Merger Arbitrage index was negative only one year as S&P 500 was down
by 3 consecutive years. During that time-period Merger arbitrage had a cumulative
gain of 20,7% and in total outperformed S&P 500 index by over 59% which
generated cumulative losses of over 38%. However, in a total of the 12year sample
period cumulative results for the merger arbitrage and S&P 500 indexes were almost
tied. These findings by Block (2006) suggest that merger arbitrage funds aren’t
attractive in strong market conditions, but most attractive in neutral and down
markets.
As most of the existing literature is focusing on U.S. markets, it’s important to realize
that mergers and acquisitions are also happening outside the U.S. In the academic
literature, most of the studies are focusing to domestic deals and relatively small
amount of studies have focused to cross-border mergers and acquisitions. Erel et al.
(2012) show that only 23% of the worldwide acquisitions were cross-border deals in
1998. By the year of 2007 Erel et al. (2012) reported that the number of cross-border
deals reached to 45% in total and it’s likely that more mergers in the future will
involve companies from different countries.
Maheswaran & Yeoh (2005) studied profitability of risk arbitrage in Australia from
1991 to 2000. In their sample they found risk-adjusted returns ranging from 0.84% to
1.2% per month before any transaction costs. However, after adjusting transaction
costs, the reported risk-adjusted returns were not statistically significant. They also
reported higher standard deviation than the market portfolio for their risk arbitrage
portfolios due to small number of deals versus market portfolio.
Hall et al. (2013) found in their Australian sample between 1985 to 2008 that merger
arbitrage has been a highly profitable investment strategy in the Australian markets.
They reported annualized returns to be close to 30%, which is higher than reported in
the other markets. Needless, to say that in their paper all kinds of transactions were
excluded, but still it’s easy to say that the results indicate merger arbitrage to be
20
highly profitable in Australian markets. One of the more interesting findings in the
research of Hall et al. (2013) was to realize how the compounded annual returns in
their long position portfolio decreased from 40,7% between 1994-2000, to 19,4%
between the period of 2001-2008. They as well reported a significantly higher rate of
deal failure for stock swap deals during months of down-market performance
compared to periods of up market performance. Though, they didn’t find evidence to
support that stock swap deal portfolios have higher risk than cash deal portfolios.
In the earlier study in the United Kingdom by Sudarsanam & Nguyen (2008) found
annualized abnormal returns of 7.3% for portfolios that constrain the maximum
portfolio allocation to a specific deal to 10% and 17,0% abnormal returns for
unconstrained value-weighted portfolios. Kearney et al. (2008) studied risk and return
of merger arbitrage in the UK in the 2001 to 2004. Kearney et al. found merger
arbitrage strategy to generate significant risk adjusted returns and exhibits little
systematic risk. Against prior research Kearney et al. didn’t find support to an
increase in systematic risk with their UK sample data in depreciating markets. Focus
in their study was exclusively on a sample period with down market returns. Kearney
et al. reported highest earnings in in their equally weighted portfolio with a risk-
adjusted daily excess returns of 0,04% Their value weighted portfolio resulted 0,02%
risk-adjusted daily returns and additionally they formed real world portfolio to model
portfolio returns which includes all the transaction costs that investors are facing,
which generated 0,009% daily returns. McDermott & Mulcahy (2017) reported
annualized returns ranging from 14,9% to 57,9% in constructed portfolios in their
German sample. Karolyi & Shannon (1999) reported an annualized excess return of
33,9% in their study in Canada.
In emerging markets there is a limited literature available for the returns of merger
arbitrage. Lin et al. (2013) studied merger arbitrage in Taiwan between the 2000 and
2007. Interestingly, Lin et al. reported significantly higher 36,5% failure rate of all the
deals examined in their study. As explained earlier, there is a connection between
higher failure rate and lower profits. Including all the deals in the sample they
reported, on average 5,8% annualized abnormal returns. Interestingly, Lin et al.
reported very long time periods until deal resolution, for successful takeovers the
time consumed on average from bid to completion was 203 days and 186 days on
21
average for failed deals. Mitchell & Pulvino (2002) reported 92 days length on
average from bid to final resolution in their US sample which is distinctly less than the
196 days for all deals on average reported by Lin et al. (2013). In conclusion, it
seems that the takeover bids last remarkably longer in Taiwanese markets until they
are completed. As merger arbitrageurs are demanding a payoff for their investments,
they should look for a higher premium in emerging markets for a longer time-period
and higher failure rate than in the well-developed US markets to reach as high
abnormal returns than in the US.
3.2 Limitations of earlier merger arbitrage literature
It is a well-known fact that there are multiple limitations affecting to the results in
earlier academic studies. Most of the earlier studies have excluded transaction costs
totally from their results and Mitchell & Pulvino (2001) argued that excluding
transaction costs and other limitations sis the primary explanation for extraordinary
large excess return in the earlier studies. They estimated transaction costs to be
$0,05 per share between 1981 and 1990 and $0,04 per share for the time-period
after 1990.
One big driving factor in merger arbitrage returns is depending when the deals are
bought. If deals are bought on announcement day there is a potential to biased
figures. A few days after bid most likely the information has transferred to stock
prices and it should be more reliable for further analysis. Moore (2006) found that
Merger arbitrageurs seem to unwind quite slowly after the deal cancellation; only less
than 10% of the respondents sell their sales immediately an announcement day of
failed deal. Most of the respondents seem to wait for an improved or competing offer
after the takeover bid has been turned down. In most of the earlier merger arbitrage
return studies, it is assumed that merger arbitrageurs sell their holdings immediately
or within a couple of days after if the bid is turned down.
Most of the earlier studies have assumed that merger arbitrageurs have unlimited
access to capital which is clearly not realistic. It is assumed in the merger arbitrage
22
analysis that merger arbitrageurs have optimal availability of cash and money is
invested only in merger arbitrage operations. No doubt that this assumption is made
to simplify the analysis in merger arbitrage return, but in real-life this is not possible.
Also, it is assumed that merger arbitrageurs have unlimited access to short selling
markets and they can get out of the deal whenever they want which is of course one
limitation not reflecting to reality of investors.
The merger waves are often linked to merger arbitrage returns. Mitchell & Pulvino
(2001) argues deal flow not to be a strong determinant of risk arbitrage returns. Their
findings suggest the correlation between the merger activity and risk arbitrage
portfolio returns to be weak. However, the number of active running merger arbitrage
deals is varying over time and during the big merger waves there are more available
deals running than e.g. in economic downturns. It is assumed in most of the studies
that merger arbitrageurs have possibility to balance their portfolios actively on a daily
basis with no additional costs which is clearly unrealistic. When there is a low number
of available merger arbitrage investment opportunities, investors are facing issues
with diversification and even in equal-weighted portfolio strategies the share for
single deal could rise enormously higher than when there are more investment
opportunities available.
In multiple earlier studies the merger arbitrage results have been benchmarked
against market returns. However, in most of the cases the beta factors have stayed
close to zero and in some studies have correlated only in depreciating markets (e.g.
Mitchell & Pulvino 2001). Consequently, explanatory factors with constructed linear
models have been relatively low and probably are not the most plausible models to
measure the abnormal returns gained in merger arbitrage.
23
4 Research Question and Sub-Questions
The objective of this master’s thesis is to answer to the question: Are there existing
large excess returns by using the merger arbitrage investment strategy in European
markets in the time series since 2002 and does it make merger arbitrage to an
exceptional investment strategy? The following sub-questions are formed to provide
appropriate information and to achieve an adequate answer to our main research
problem:
Q1: Are there differences in the returns between cash, stock swap and mixed
deals?
Earlier studies by Baker & Savasoglu (2002), Branch & Yang (2006a) and Wang &
Wedge (2012) have reported mixed results in return by deal type. Therefore, there is
a research cap to study, if there is a difference in return by payment method.
Q2: Are there differences in the returns between value and equal weighted
portfolios?
Baker & Savasoglu (2001) reported higher returns for value weighted portfolios and
one standard deviation change in firm size leads to a 0,8% increase in average
returns, suggesting that higher deal value also leads to a higher arbitrage return.
However, Maheswaran & Yeoh (2005) and Kearney et al. (2008) reported higher
returns for equally weighted deals. Hence, there is no consensus in opinion and
literature is still lacking the absolute resolution.
Q3: How the latest financial-crisis has affected to the returns of merger arbitrage
and can we see a declining trend in merger arbitrage returns?
To the author’s knowledge the field of study is still lacking a proper study in the U.S
or in multiple European countries with a sample later than 2008. Lately Ji & Jetley
(2009) and Hall et al. (2013) have reported decreasing trend in merger arbitrage
24
return. According to Officer (2007) arbitrage markets are well-functioning and large
losses or number of investment opportunities do not have a significant impact on the
prices and arbitrage opportunities neither returns, unlike performance-based
arbitrage hypothesis by Shleifer and Vishny (1997) suggests. Therefore, there is a
clear research cap to study the differences in later time-period compared to prior
series.
Q4: The earlier literature has reported low volatilities involved in merger arbitrage
trade; is it higher in this time horizon examined in Europe than in the earlier
studies in North America?
Earlier studies in North America (e.g. Mitchell & Pulvino 2001, Baker & Savasoglu
2002, Branch & Yang 2006a) have reported relatively low volatilities in return
compared to market volatility. As there are no significant studies in multiple European
countries to author’s knowledge. The volatility of merger arbitrage return is still
unstudied in multiple European countries. We will try to answer this question in this
paper.
Q5: Are the risk arbitrageurs facing more risk during the depreciating markets than
the positive and flat market conditions?
Mitchell & Pulvino (2001) and Branch & Yang (2006a) found in their studies
nonlinearity between the merger arbitrage and market returns in different market
conditions. Findings suggest market arbitrage returns to be uncorrelated with market
returns in most market conditions. Nevertheless, during market downturns Mitchell et
al. (2001) reported for a dramatic increase in the relationship between the market
and merger arbitrage returns. Block (2006) found merger arbitrage to be more
attractive in neutral and depreciating markets, but less attractive for investors in
strong market conditions. Accordingly, there is a need to analyze returns in different
market conditions.
25
5 Research Data and Analysis
This paper uses data from the Thomson One Mergers & Acquisitions database. The
data consist of deals announced between the 1st of January 2002 to 31st of
December 2014, meaning that some of the deals were completed later than the
aforementioned time frame. Some of the announced deals were completed later than
the end of 2014 and in these cases the returns until the 31st of December were
included and returns later than the date mentioned are excluded from the analysis.
Contrary, to the major part of prior research in merger arbitrage focusing to the U.S.
markets, the data of this research are limited to, include only the deals announced
between the public companies in Europe. Specifying that only the domestic deals
and cross-border deals between the companies in Europe will be included. The
majority, of the prior research has studied domestic deals in Mergers and Acquisition
(Erel et al. 2012) and to our knowledge, none of the prior papers have included as a
high number of countries to analyze risk arbitrage returns as in this paper. One other
major restriction to the data is to include only deals worth at least €100 million. The
limitation to include deals worth at least €100 million decreases the number of deals
but guarantees higher liquidity for the stock and decreases the transaction costs
involved in arbitrage investments. The limitation is to mimic the situation that could be
reflected to real-life situation and not to present biased results with highly illiquid
stocks.
All daily stock data for the target and acquirer was obtained from the Thomson
Reuters Datastream database. In some cross-border deals the offer was made in a
different currency than the acquirer was trading in the markets. In this research
historical daily exchange conversion rates were used to value the cross-border deals
between the companies, using different currencies in the markets. Thomson Reuters
Datastream was the source for the currency conversion data. Stock transactions
were made two days after deal announcement, this was to avoid the potential
distortion about deal announcement.
The total number of 883 announced deals were gathered from the Thomson one
Mergers and Acquisitions database before prior data screening. Due to the limitations
26
some of the deals contained imperfect data or the data was unreliable, and these
deals were excluded from the final analysis. Furthermore, in some of the deals the
trading price of the target was higher than the bid announced, and these deals were
also excluded from the data. The final data consisted of the total number of 344
deals. The decrease from the original sample to the final research sample is
comparable with the prior academic literature in risk arbitrage, as the final sample of
the Baker & Savasoglu (2002) had only left 46% and Maheswaran & Yeoh (2005)
had 35% of the deals left from the original sample.
5.1 Country Data
In the final sample the total number of deals was 344 and total number of European
countries involved as an acquirer or target company was 29. Not surprisingly, 217
deals were domestic deals, meaning the acquirer and the target are from the same
country, only 127 deals were cross-border deals involving bidder and target from the
other countries. Because total of 74 deals and over 20% of the deals are domestic
deals between the companies registered in the UK it’s easy to say that the results
should be benchmarked to the earlier studies done in the UK by Sudarsanam &
Nguyen (2008) and Kearney et al. (2008). After United Kingdom the second highest
number of domestic deals involved in the data sample is from France and Italy, but
the share of the total sample is significantly lower than in the United Kingdom and
therefore the results shouldn’t be biased by the too high share of the domestic deals
in certain countries (see Figure 1).
In the final sample the top 10 highest ranked countries by the number of total deals
had an enormous 82.6% share of the total. Results reveal some specific countries to
appear more often in deals than the others. The countries outside the top 10 are
mostly smaller countries and have smaller capital exchange markets. One
explanation for a small number of deals outside the top 10 ranked countries could be
due to strict limitations on minimum deal value in the sample.

27
Figure 2. Number of Deals by Country
Looking closer to the cross-border deals by country illustrated in figure 2, the results
offer an interesting content compared to the domestic deal characteristics illustrated
in figure 3. In the United Kingdom the total number of deals included in the sample
was the highest in the any country. Contrary to the high number of domestic deals in
the United Kingdom it’s surprising to see France involved more often than the United
Kingdom in cross-border deals. The more interesting fact for the cross-border deals
reveal that the companies from France, Germany, Sweden, the Netherlands and Italy
ranked higher when measuring the total number of cross-border deals involved as an
acquirer. However, the companies in the United Kingdom were targeted more often
in cross-border deals than by any other country companies. The total share of the
United Kingdom companies targeted in cross-border deals was 72%, suggesting that
UK firms prefer to target domestic companies rather than companies from the other
European countries. To the rest of Europe, companies in the United Kingdom seem
to be the most popular targets.
0
20
40
60
80
100
120
Un
ited
Kin
gdo
m
Fra
nce
Ger
man
y
Ital
y
Swed
en
Net
her
lan
ds
Spai
n
Swit
zerl
and
No
rway
Bel
giu
m
Fin
lan
d
Ru
ssia
n F
ed
Au
stri
a
Den
mar
k
Gre
ece
Po
lan
d
Irel
and
-Rep
Po
rtu
gal
Icel
and
Lu
xem
bo
urg
Hu
nga
ry
Cy
pru
s
Slo
ven
ia
Est
on
ia
Lie
chte
nst
ein
Cro
atia
Lit
hu
ania
Slo
vak
ia
Cze
ch R
epu
bli
c
Domestic Deals Cross-Border Deals

28
Figure 3. Cross-Border Deals by Country
5.2 Deal data
After summarizing the statistics of the country level data, the second step is to focus
on the data by deal type. As mentioned earlier, there are three kinds of deals
included in this analysis by the payment type, cash, stock and mixed deals that aren’t
either pure cash or stock deals, but typically a hybrid mixture between these two
options. The deal is considered as a cash deal where the acquirer bids for a fixed
amount of any currency in payment. Stock deals are classified as deals where
acquirer and the target of a merger and acquisition deal consider predetermined
stock exchange ratio as a payment method. Some earlier studies have excluded the
hybrid or mixed deals from the analysis as those are more complicated to analyze
than the pure cash or stock deals. The final sample in this paper includes 344 deals,
which consists of 266 cash deals, 78 stock deals and a total of 40 mixed deals.
0
5
10
15
20
25
30
35
40
Fra
nce
Un
ited
Kin
gdo
m
Ger
man
y
Swed
en
Net
her
lan
ds
Ital
y
Swit
zerl
and
Spai
n
No
rway
Bel
giu
m
Fin
lan
d
Au
stri
a
Irel
and
-Rep
Den
mar
k
Po
lan
d
Icel
and
Lu
xem
bo
urg
Ru
ssia
n F
ed
Hu
nga
ry
Cy
pru
s
Gre
ece
Po
rtu
gal
Slo
ven
ia
Est
on
ia
Lie
chte
nst
ein
Cro
atia
Lit
hu
ania
Slo
vak
ia
Cze
ch R
epu
bli
c
Target Acquirer
29
Table 1 represents the deals by announcement year and is split into two sections.
The first section describes the number of deals by bid announcement year. The first
section is divided into four subcategories by the following deal types: cash deals,
stock deals, mixed deals and total number of deals. The second section of the table
represents the share of annual deals by deal type. The second section is broken
down into three subcategories cash deals, stock deals and mixed deals and each of
the subcategory stand for their share of the total annual deals.
As earlier literature has reported huge merger waves in the history (see e.g.
Martynova & Renneboog 2008) we can see the effect of the sixth merger wave which
was estimated approximately between 2003 to late 2007 by Alexandridis et al.
(2012). During the sixth merger wave the number of the announced deals was the
highest in the time-period. After the sixth merger wave there was a huge decline in
the number of deals and it should be mentioned that there weren’t any mixed deals in
years 2009 and 2012. The major part of the total deals in the sample are cash deals
representing approximately two thirds of the total sample.
The share of the cash deals in the sample is 66%, stock deals are 23% of the sample
and mixed deals are only 12% of the total sample. The sample distribution is in line
with the prior academic literature and the 66% share of the cash deals from the all
deals a was bit smaller than the 73% share reported by Mitchell & Pulvino (2001).
However, it’s good to remember that most of the earlier studies have included only
cash and stock swap deals and have excluded mixed deals totally from their sample.
Contrary to the sample of this paper, Branch & Yang (2006a) had more stock offers
than cash offers in their sample. Branch & Yang (2006a) reported positive betas for
the cash tender offers and negative betas for the stock swaps during the down
markets, and therefore the nature of the sample can affect to the overall risk exposed
in the portfolio. Following the findings by Mitchell & Pulvino (2001) merger arbitrage
returns in this paper should predict a positive correlation between merger arbitrage
returns and market returns in down markets.
One important thing to remember before analyzing the returns of the deals is to
realize an enormous difference between the share of the cash deal flow from 2002 to
2008 and from 2009 to 2014. In the period between 2002 to 2008 the share of cash
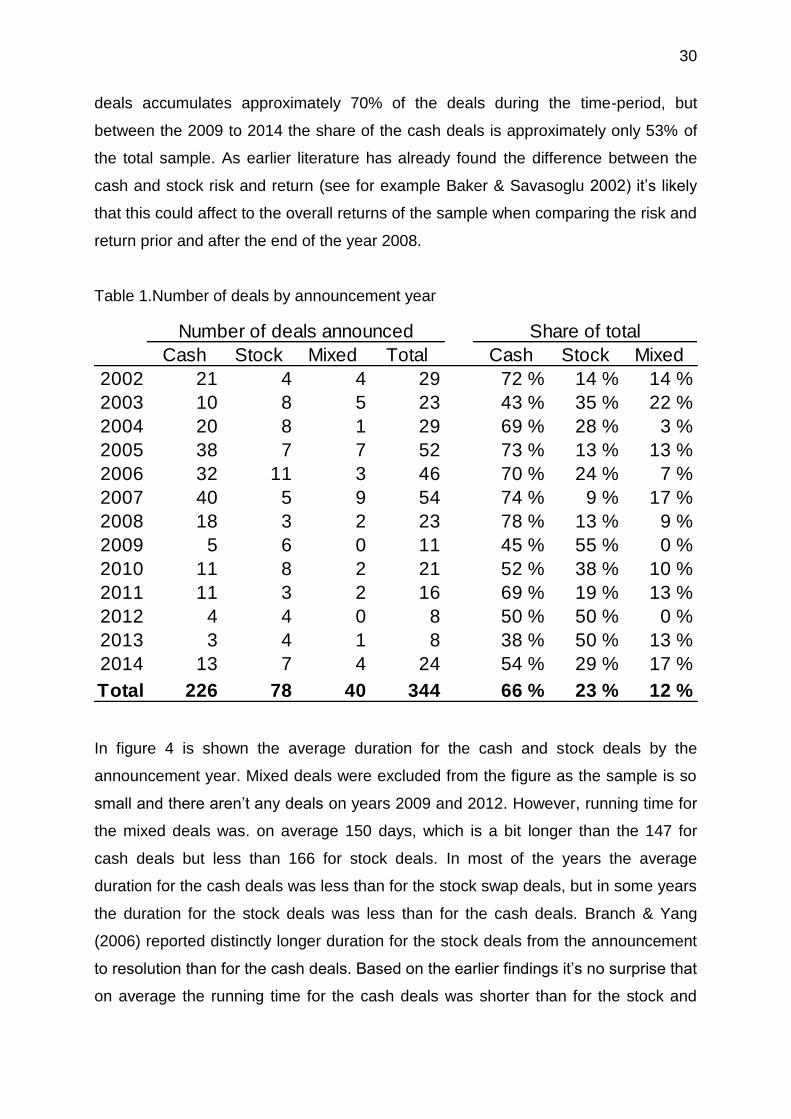
30
deals accumulates approximately 70% of the deals during the time-period, but
between the 2009 to 2014 the share of the cash deals is approximately only 53% of
the total sample. As earlier literature has already found the difference between the
cash and stock risk and return (see for example Baker & Savasoglu 2002) it’s likely
that this could affect to the overall returns of the sample when comparing the risk and
return prior and after the end of the year 2008.
Table 1.Number of deals by announcement year
In figure 4 is shown the average duration for the cash and stock deals by the
announcement year. Mixed deals were excluded from the figure as the sample is so
small and there aren’t any deals on years 2009 and 2012. However, running time for
the mixed deals was. on average 150 days, which is a bit longer than the 147 for
cash deals but less than 166 for stock deals. In most of the years the average
duration for the cash deals was less than for the stock swap deals, but in some years
the duration for the stock deals was less than for the cash deals. Branch & Yang
(2006) reported distinctly longer duration for the stock deals from the announcement
to resolution than for the cash deals. Based on the earlier findings it’s no surprise that
on average the running time for the cash deals was shorter than for the stock and
Cash Stock Mixed Total Cash Stock Mixed
2002 21 4 4 29 72 % 14 % 14 %
2003 10 8 5 23 43 % 35 % 22 %
2004 20 8 1 29 69 % 28 % 3 %
2005 38 7 7 52 73 % 13 % 13 %
2006 32 11 3 46 70 % 24 % 7 %
2007 40 5 9 54 74 % 9 % 17 %
2008 18 3 2 23 78 % 13 % 9 %
2009 5 6 0 11 45 % 55 % 0 %
2010 11 8 2 21 52 % 38 % 10 %
2011 11 3 2 16 69 % 19 % 13 %
2012 4 4 0 8 50 % 50 % 0 %
2013 3 4 1 8 38 % 50 % 13 %
2014 13 7 4 24 54 % 29 % 17 %
Total 226 78 40 344 66 % 23 % 12 %
Share of totalNumber of deals announced
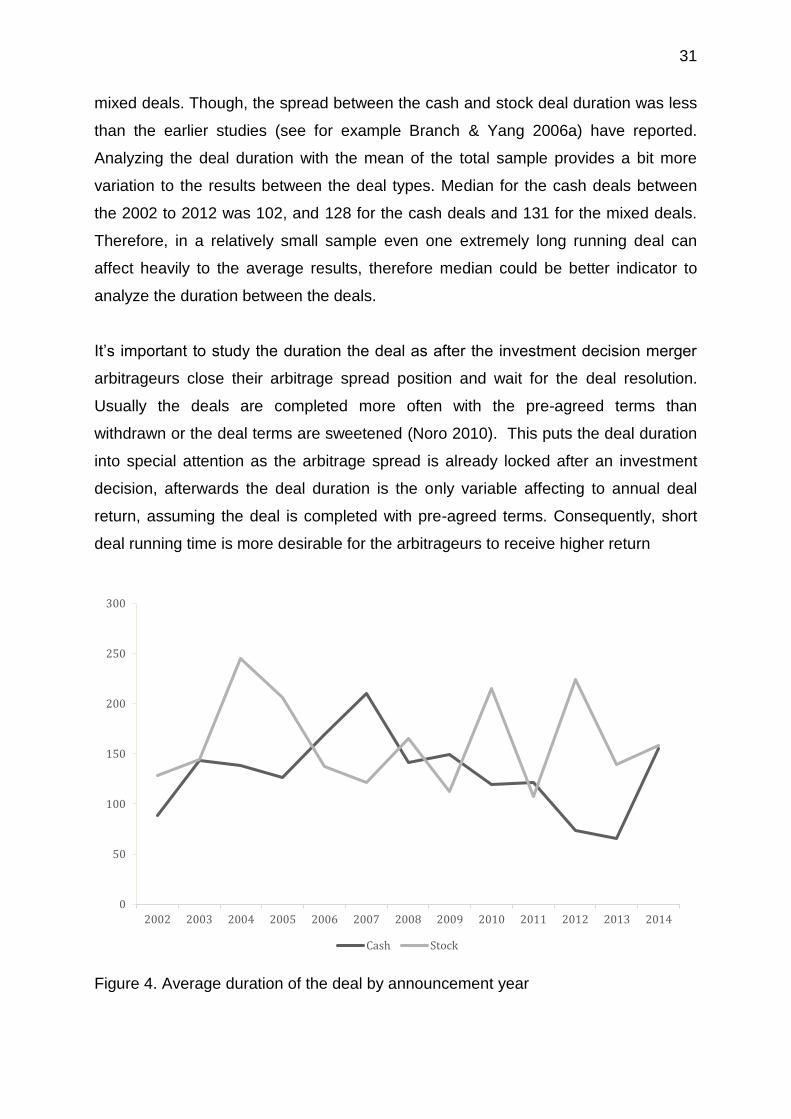
31
mixed deals. Though, the spread between the cash and stock deal duration was less
than the earlier studies (see for example Branch & Yang 2006a) have reported.
Analyzing the deal duration with the mean of the total sample provides a bit more
variation to the results between the deal types. Median for the cash deals between
the 2002 to 2012 was 102, and 128 for the cash deals and 131 for the mixed deals.
Therefore, in a relatively small sample even one extremely long running deal can
affect heavily to the average results, therefore median could be better indicator to
analyze the duration between the deals.
It’s important to study the duration the deal as after the investment decision merger
arbitrageurs close their arbitrage spread position and wait for the deal resolution.
Usually the deals are completed more often with the pre-agreed terms than
withdrawn or the deal terms are sweetened (Noro 2010). This puts the deal duration
into special attention as the arbitrage spread is already locked after an investment
decision, afterwards the deal duration is the only variable affecting to annual deal
return, assuming the deal is completed with pre-agreed terms. Consequently, short
deal running time is more desirable for the arbitrageurs to receive higher return
Figure 4. Average duration of the deal by announcement year
0
50
100
150
200
250
300
2002 2003 2004 2005 2006 2007 2008 2009 2010 2011 2012 2013 2014
Cash Stock
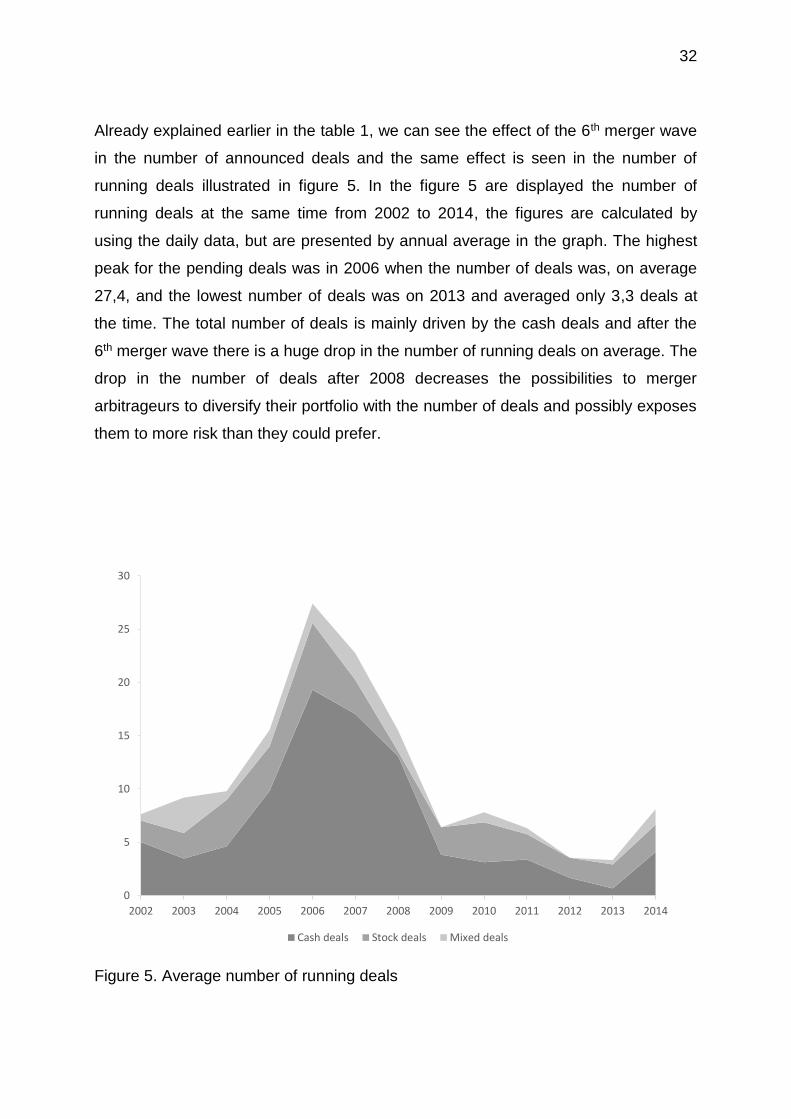
32
Already explained earlier in the table 1, we can see the effect of the 6th merger wave
in the number of announced deals and the same effect is seen in the number of
running deals illustrated in figure 5. In the figure 5 are displayed the number of
running deals at the same time from 2002 to 2014, the figures are calculated by
using the daily data, but are presented by annual average in the graph. The highest
peak for the pending deals was in 2006 when the number of deals was, on average
27,4, and the lowest number of deals was on 2013 and averaged only 3,3 deals at
the time. The total number of deals is mainly driven by the cash deals and after the
6th merger wave there is a huge drop in the number of running deals on average. The
drop in the number of deals after 2008 decreases the possibilities to merger
arbitrageurs to diversify their portfolio with the number of deals and possibly exposes
them to more risk than they could prefer.
Figure 5. Average number of running deals
0
5
10
15
20
25
30
2002 2003 2004 2005 2006 2007 2008 2009 2010 2011 2012 2013 2014
Cash deals Stock deals Mixed deals
33
Ji & Jetley (2009) noticed in their study a huge decline 520bps in first-day arbitrage
spread comparing the time-series 1990 to 1995 and 2002 to 2007. They were using
U.S. cash and stock deal data in their study, but the more fascinating is to study if the
same trend can be seen in this sample. However, in this paper the arbitrage spread
is calculated two days after the announcement not on first-day. Between the 2002 to
2008 the median arbitrage spread for the cash deals is 2,7% and 3,5% for the stock,
both spreads are higher than Ji & Jetley (2009) had reported as a median spread for
the successful deals from 2002 to 2007, but less than they reported for the prior time-
series. It turns out to be more interesting findings when analyzing the spread
premiums between 2009 to 2014. In the latter series the mean arbitrage spread for
the cash deals is almost the same 2,8%, but the mean spread for stock deals is
remarkably higher 5,7%.
There could be some explanations for the remarkably higher arbitrage spread for the
stock deals after 2008 and one of them could be the financial-crisis in Europe that
increased the uncertainty in stock markets. Other possible explanations could have
been the agency theory with overvaluation hypothesis. Nonetheless, the nature of the
sample could have been one reason why the arbitrage spread was declining so much
in the Ji & Jetley (2009) study, as the share of cash deals compared to stock deals
was higher in their last than prior time-periods. Based on the median deal duration by
the deal type it’s no surprise that stock deals are typically trading with a higher
spread than cash deals two days after a bid announcement. One other reason could
be the fact that Ji & Jetley (2009) only included the completed deals in their arbitrage
spread findings and Mitchell & Pulvino (2001) notable difference in arbitrage spread
between the failed and successful deals. In this sample the median arbitrage spread
for withdrawn cash deals is 9,7% and for successful deals it is only 2.3%. Based on
these findings, it seems that the markets can evaluate efficiently the probabilities for
the deals to succeed.
One of the most interesting things to discover in the sample is to analyze the success
rate between the deal types and years. The data of the deals withdrawn and
completed is illustrated in table 2. It’s obvious to say that over time the cash deals
have had the highest success rate by the possible payment methods. Cash deals
had 88% success, rate which is a bit below than some other papers have
34
documented (Ji & Jetley 2009, Noro 2010). Additionally, stock deals had a bit lower
83% success rate and mixed deals had only 75% success rate. In total sample the
success rate for the all deals together was 86%. There can be seen two extremely
successful time-periods for the deal success from 2002 to 2005 and from 2010 to
2011, predicting high returns for the periods. Contrary to prior mentioned periods the
was a decline in the success rate from 2007 to 2009 and from 2012 to 2014. It could
be expected to see lower returns for the years when the success rate was relatively
lower.
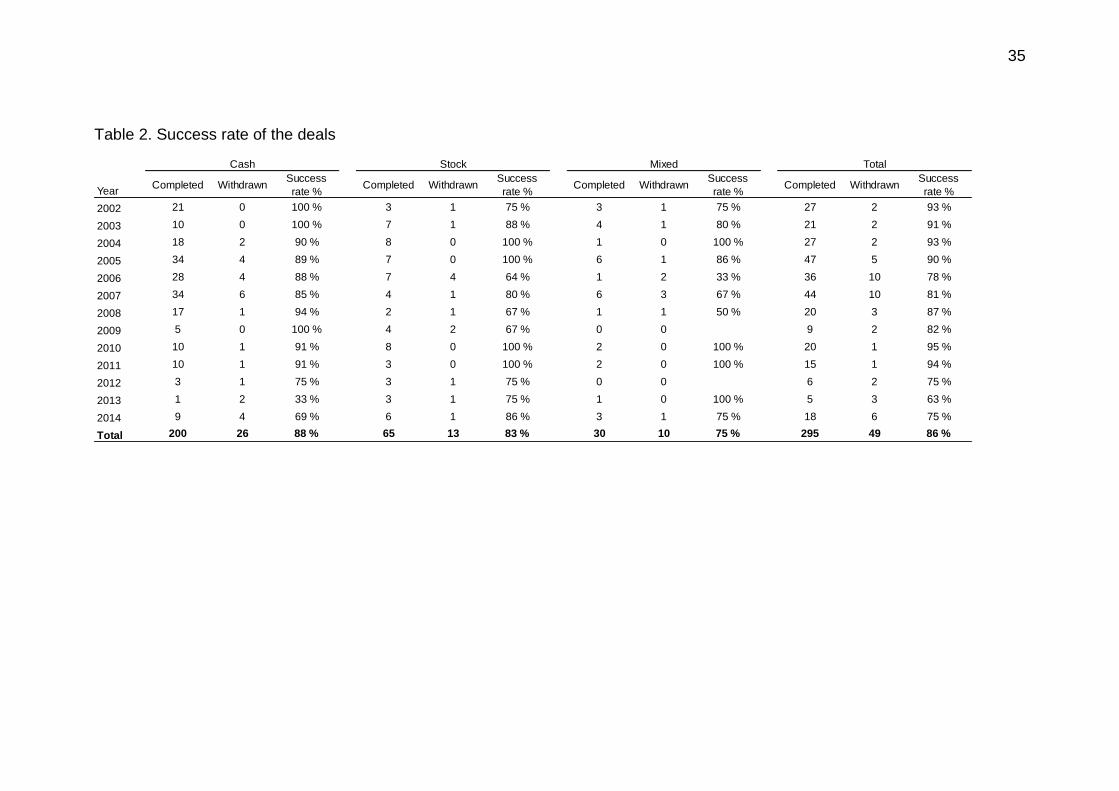
35
Table 2. Success rate of the deals
YearCompleted Withdrawn
Success
rate %Completed Withdrawn
Success
rate %Completed Withdrawn
Success
rate %Completed Withdrawn
Success
rate %
2002 21 0 100 % 3 1 75 % 3 1 75 % 27 2 93 %
2003 10 0 100 % 7 1 88 % 4 1 80 % 21 2 91 %
2004 18 2 90 % 8 0 100 % 1 0 100 % 27 2 93 %
2005 34 4 89 % 7 0 100 % 6 1 86 % 47 5 90 %
2006 28 4 88 % 7 4 64 % 1 2 33 % 36 10 78 %
2007 34 6 85 % 4 1 80 % 6 3 67 % 44 10 81 %
2008 17 1 94 % 2 1 67 % 1 1 50 % 20 3 87 %
2009 5 0 100 % 4 2 67 % 0 0 9 2 82 %
2010 10 1 91 % 8 0 100 % 2 0 100 % 20 1 95 %
2011 10 1 91 % 3 0 100 % 2 0 100 % 15 1 94 %
2012 3 1 75 % 3 1 75 % 0 0 6 2 75 %
2013 1 2 33 % 3 1 75 % 1 0 100 % 5 3 63 %
2014 9 4 69 % 6 1 86 % 3 1 75 % 18 6 75 %
Total 200 26 88 % 65 13 83 % 30 10 75 % 295 49 86 %
Cash Stock Mixed Total

36
6 Merger Arbitrage Returns
This master’s thesis analyzes the returns of merger arbitrage by forming time-series
portfolios of the European Mergers and Acquisition deals. To the authors knowledge,
none of the earlier studies in merger arbitrage returns have included the data from as
many countries as in this study. None of the deals from the final sample is excluded
or picked separately and a passive investment strategy includes all the deals in the
sample. All the deals included in the portfolio and the portfolio is rebalanced on a
daily level as old deals are completed, and new deals are announced. However, in
the results part the results will be represented only in a monthly or annual level, as
we are measuring the abnormal returns over the time-series and to get a better
picture of the development of returns. It should be noted that the results, are based to
the assumption that merger arbitrageurs have unlimited access to capital and face no
transaction costs. In real-life, merger arbitrageurs don’t have unlimited access to
capital and face transaction costs. This is something to keep in mind as some earlier
studies (see for example Mitchell & Pulvino 2001) have reported lower abnormal
returns when transaction costs are applied.
Each deal included in the portfolios is unique and there could be variations in risk
level, duration or size. The portfolios constructed in this paper are either equal
weighted or value weighted portfolios. The portfolios are constructed separately for
cash, stock and mixed deals. The stock and mixed deals are also divided into two
subsections measuring returns with shorting the acquirer’s stock and without short
selling. Earlier studies with the US data have used a short selling strategy when
measuring the stock deal returns, but the late naked short selling ban in European
countries and short selling ban in Russia, Greece, Cyprus and Croatia restricts the
short selling in 9 deals from the total sample (Jain 2013).
Later in this chapter there will be presented the calculation methods for each deal
type, the calculation for the annual and monthly returns and at last will represented
the construction of the portfolios.
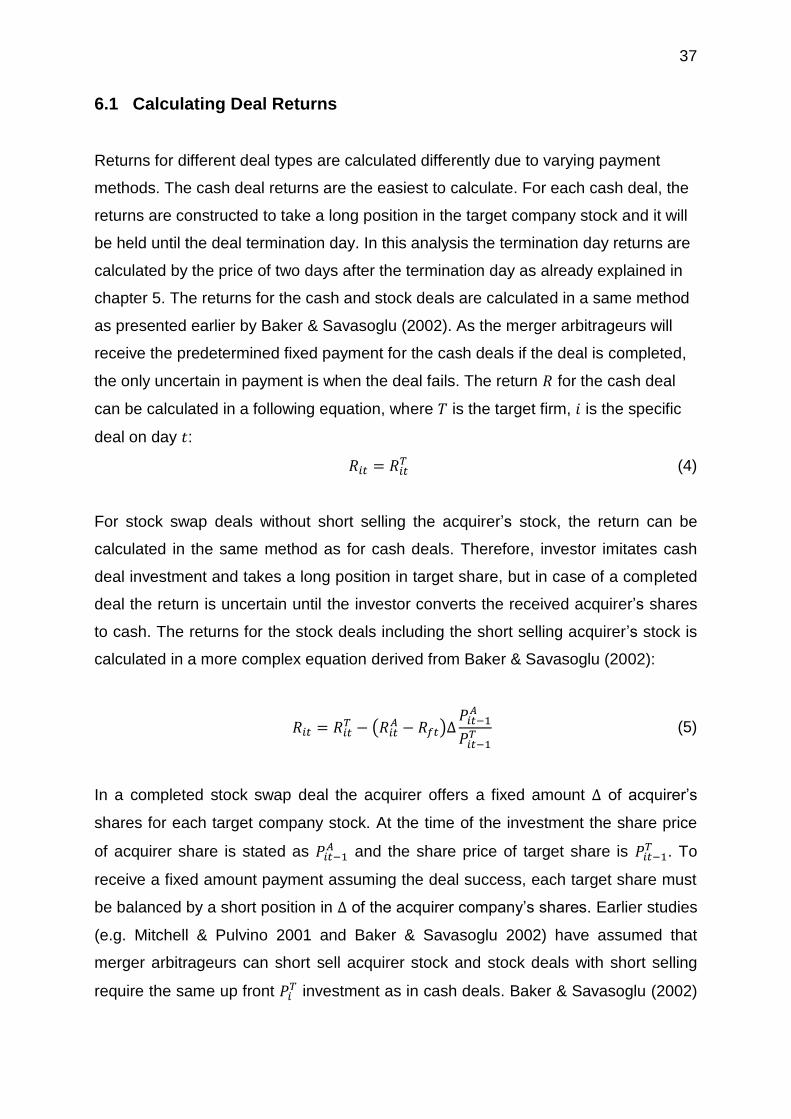
37
6.1 Calculating Deal Returns
Returns for different deal types are calculated differently due to varying payment
methods. The cash deal returns are the easiest to calculate. For each cash deal, the
returns are constructed to take a long position in the target company stock and it will
be held until the deal termination day. In this analysis the termination day returns are
calculated by the price of two days after the termination day as already explained in
chapter 5. The returns for the cash and stock deals are calculated in a same method
as presented earlier by Baker & Savasoglu (2002). As the merger arbitrageurs will
receive the predetermined fixed payment for the cash deals if the deal is completed,
the only uncertain in payment is when the deal fails. The return 𝑅 for the cash deal
can be calculated in a following equation, where 𝑇 is the target firm, 𝑖 is the specific
deal on day 𝑡:
𝑅𝑖𝑡 = 𝑅𝑖𝑡𝑇 (4)
For stock swap deals without short selling the acquirer’s stock, the return can be
calculated in the same method as for cash deals. Therefore, investor imitates cash
deal investment and takes a long position in target share, but in case of a completed
deal the return is uncertain until the investor converts the received acquirer’s shares
to cash. The returns for the stock deals including the short selling acquirer’s stock is
calculated in a more complex equation derived from Baker & Savasoglu (2002):
𝑅𝑖𝑡 = 𝑅𝑖𝑡
𝑇 − (𝑅𝑖𝑡𝐴 − 𝑅𝑓𝑡)∆
𝑃𝑖𝑡−1𝐴
𝑃𝑖𝑡−1𝑇 (5)
In a completed stock swap deal the acquirer offers a fixed amount ∆ of acquirer’s
shares for each target company stock. At the time of the investment the share price
of acquirer share is stated as 𝑃𝑖𝑡−1𝐴 and the share price of target share is 𝑃𝑖𝑡−1
𝑇 . To
receive a fixed amount payment assuming the deal success, each target share must
be balanced by a short position in ∆ of the acquirer company’s shares. Earlier studies
(e.g. Mitchell & Pulvino 2001 and Baker & Savasoglu 2002) have assumed that
merger arbitrageurs can short sell acquirer stock and stock deals with short selling
require the same up front 𝑃𝑖𝑇 investment as in cash deals. Baker & Savasoglu (2002)
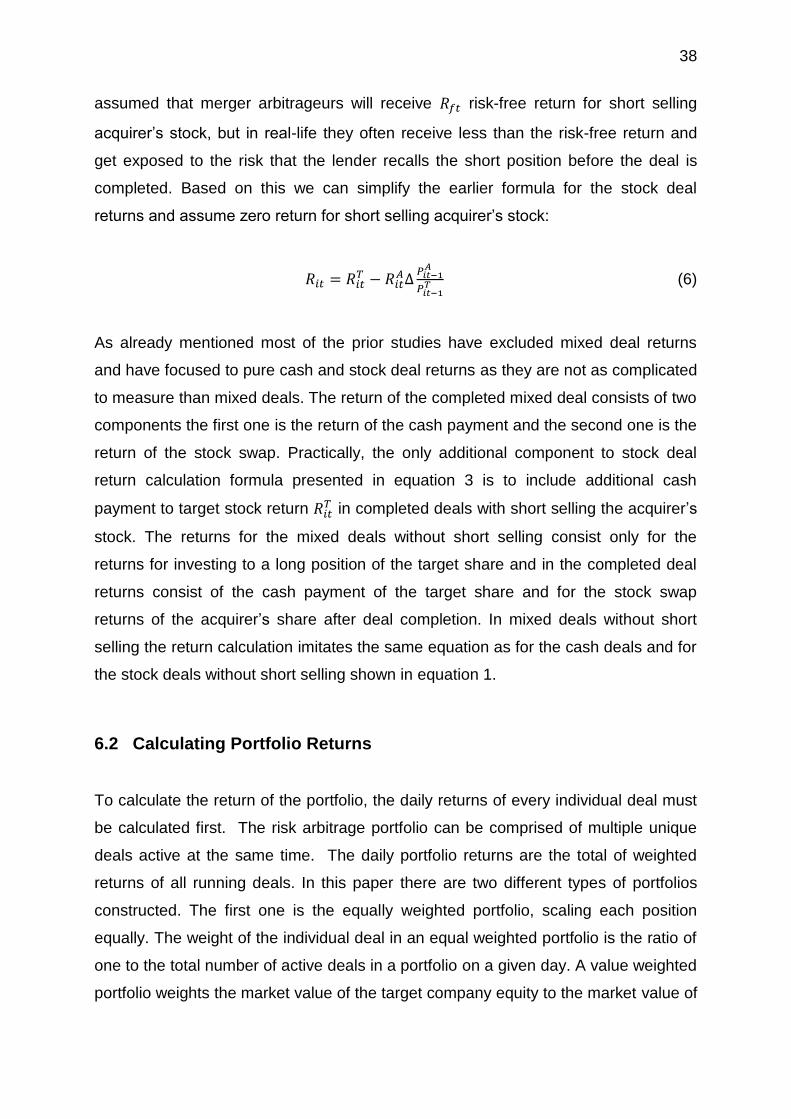
38
assumed that merger arbitrageurs will receive 𝑅𝑓𝑡 risk-free return for short selling
acquirer’s stock, but in real-life they often receive less than the risk-free return and
get exposed to the risk that the lender recalls the short position before the deal is
completed. Based on this we can simplify the earlier formula for the stock deal
returns and assume zero return for short selling acquirer’s stock:
𝑅𝑖𝑡 = 𝑅𝑖𝑡
𝑇 − 𝑅𝑖𝑡𝐴∆
𝑃𝑖𝑡−1𝐴
𝑃𝑖𝑡−1𝑇 (6)
As already mentioned most of the prior studies have excluded mixed deal returns
and have focused to pure cash and stock deal returns as they are not as complicated
to measure than mixed deals. The return of the completed mixed deal consists of two
components the first one is the return of the cash payment and the second one is the
return of the stock swap. Practically, the only additional component to stock deal
return calculation formula presented in equation 3 is to include additional cash
payment to target stock return 𝑅𝑖𝑡𝑇 in completed deals with short selling the acquirer’s
stock. The returns for the mixed deals without short selling consist only for the
returns for investing to a long position of the target share and in the completed deal
returns consist of the cash payment of the target share and for the stock swap
returns of the acquirer’s share after deal completion. In mixed deals without short
selling the return calculation imitates the same equation as for the cash deals and for
the stock deals without short selling shown in equation 1.
6.2 Calculating Portfolio Returns
To calculate the return of the portfolio, the daily returns of every individual deal must
be calculated first. The risk arbitrage portfolio can be comprised of multiple unique
deals active at the same time. The daily portfolio returns are the total of weighted
returns of all running deals. In this paper there are two different types of portfolios
constructed. The first one is the equally weighted portfolio, scaling each position
equally. The weight of the individual deal in an equal weighted portfolio is the ratio of
one to the total number of active deals in a portfolio on a given day. A value weighted
portfolio weights the market value of the target company equity to the market value of

39
the portfolio. Therefore, the weight of an individual deal in a value weighted portfolio
is the share of the equity in a deal of the total equity in active deals. The portfolio
return formulas are following the same method as presented earlier on Mitchell &
Pulvino (2002). Equal weighted portfolio returns are calculated by the following
equation:
(7)
𝑅𝑃𝑚 is the monthly return of the portfolio, where 𝑉𝑖 is the market value of the target
company on the deal announcement date. 𝑁𝑚 is the number of active deals during
the month 𝑚. Returns of the value weighted portfolio are calculated as presented in
the equation 5:
(8)
Both portfolios assume that merger arbitrageurs don’t face any transaction costs
involved in the procedure. Also, the assumption is that the merger arbitrageurs have
unlimited access to capital. In real-life, merger arbitrageurs do face transaction costs
and have limited access to capital. However, most of the earlier studies have made
the same assumptions when measuring the returns of the merger arbitrage portfolios.
The magnitude of transaction costs could be expected to be about the same as for
example Mitchell & Pulvino (2002) have documented before. Still and all, even if
there will be some costs not included in the portfolio returns it should give a good
approach if the merger arbitrage is a profitable investment strategy or not in Europe.
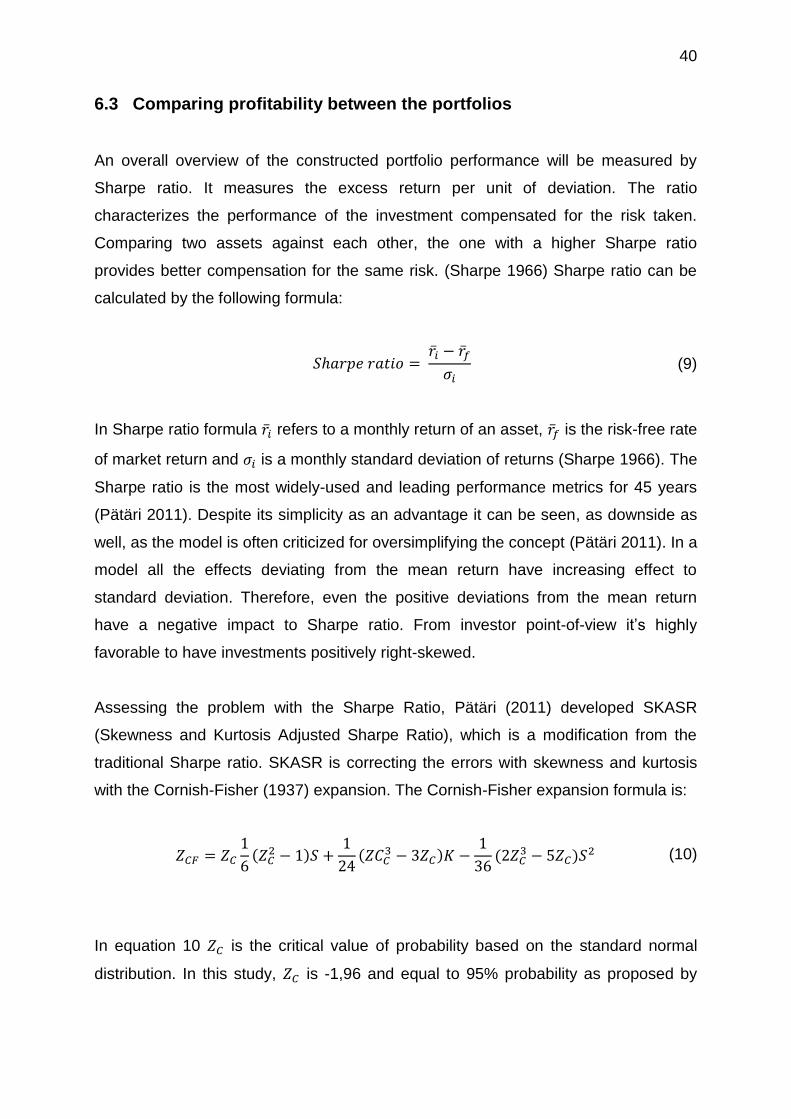
40
6.3 Comparing profitability between the portfolios
An overall overview of the constructed portfolio performance will be measured by
Sharpe ratio. It measures the excess return per unit of deviation. The ratio
characterizes the performance of the investment compensated for the risk taken.
Comparing two assets against each other, the one with a higher Sharpe ratio
provides better compensation for the same risk. (Sharpe 1966) Sharpe ratio can be
calculated by the following formula:
𝑆ℎ𝑎𝑟𝑝𝑒 𝑟𝑎𝑡𝑖𝑜 =
�̅�𝑖 − �̅�𝑓
𝜎𝑖 (9)
In Sharpe ratio formula �̅�𝑖 refers to a monthly return of an asset, �̅�𝑓 is the risk-free rate
of market return and 𝜎𝑖 is a monthly standard deviation of returns (Sharpe 1966). The
Sharpe ratio is the most widely-used and leading performance metrics for 45 years
(Pätäri 2011). Despite its simplicity as an advantage it can be seen, as downside as
well, as the model is often criticized for oversimplifying the concept (Pätäri 2011). In a
model all the effects deviating from the mean return have increasing effect to
standard deviation. Therefore, even the positive deviations from the mean return
have a negative impact to Sharpe ratio. From investor point-of-view it’s highly
favorable to have investments positively right-skewed.
Assessing the problem with the Sharpe Ratio, Pätäri (2011) developed SKASR
(Skewness and Kurtosis Adjusted Sharpe Ratio), which is a modification from the
traditional Sharpe ratio. SKASR is correcting the errors with skewness and kurtosis
with the Cornish-Fisher (1937) expansion. The Cornish-Fisher expansion formula is:
𝑍𝐶𝐹 = 𝑍𝐶
1
6(𝑍𝐶
2 − 1)𝑆 +1
24(𝑍𝐶𝐶
3 − 3𝑍𝐶)𝐾 −1
36(2𝑍𝐶
3 − 5𝑍𝐶)𝑆2 (10)
In equation 10 𝑍𝐶 is the critical value of probability based on the standard normal
distribution. In this study, 𝑍𝐶 is -1,96 and equal to 95% probability as proposed by

41
Favre & Galeano (2002). K denotes kurtosis and S skewness of the return
distribution. Therefore, formulas for kurtosis and skewness are calculated as follows:
𝐾 =1
𝑁∑(
𝑟𝑖𝑡 − �̅�𝑖𝜎
)4𝑁
𝑖=1
− 3 (11)
𝐾 =1
𝑁∑(
𝑟𝑖𝑡 − �̅�𝑖𝜎
)3𝑁
𝑖=1
(12)
In equations 11 and 12 �̅�𝑖 is the average return and N represents the number of
outcomes, 𝜎 is the standard deviation of the portfolio. The SKAD is calculated with
the following formula with the 𝑍𝐶𝐹 Cornish-Fisher expansion, the critical value of
probability on standard deviation 𝑍𝐶 and standard deviation 𝜎 as follows:
𝑆𝐾𝐴𝐷 =
𝑍𝐶𝐹
𝑍𝐶𝜎
(13)
Finally, as we have figured out SKAD, we can calculate SKASR with the following
formula developed by Pätäri (2011):
𝑆𝐾𝐴𝑆𝑅 =
�̅�𝑖 − �̅�𝑖𝑓
𝑆𝐾𝐴𝐷𝑖(𝐸𝑅/|𝐸𝑅|)
(14)
In equation 14 for SKASR 𝐸𝑅 represent mean excess return of the portfolio 𝑖 over the
time period. Compared to original Sharpe ratio divisor is now substituted with a new
model that according to Pätäri (2011) takes into the account all distributional
asymmetries of returns discovered by measures of kurtosis and skewness.

42
Jobson-Korkie (1981) developed Z-test to measure the significance for the Sharpe
ratio. Later, Memmel (2003) modified the test to the following form:
𝑧 =
�̂�ℎ𝑖 − �̂�ℎ𝑛
√�̂�= 𝑧𝐽𝐾 (15)
𝑁𝑉 = 2 − 2𝜌𝑖𝑛 +1
2(𝑆ℎ𝑖
2 + 𝑆ℎ𝑛2 − 2𝑆ℎ𝑖𝑆ℎ𝑛𝜌𝑖𝑛
2 ) (16)
In equations 15 and 16 presented above N is the number of observations in the time-
series in this study representing the number of months. �̂� represents the asymptotic
variance of the Sharpe ratio difference. 𝑆ℎ is the Sharpe ratio of the portfolio replaced
by the comparable portfolio and market portfolio SKASR-values. 𝜌𝑖𝑛 =
𝜎𝑖𝑛𝜎𝑖𝜎𝑛
is the
correlation of the return between the portfolios.
43
7 Results and Discussion
In this chapter the focus point will be on the merger arbitrage portfolio returns. The
analysis includes all the public merger arbitrage deals valued over €100 million in
Europe between 2002 to 2014. In the first part of the section merger arbitrage
portfolio returns are displayed in a monthly level. The second part focuses on
cumulative portfolio returns. In both parts there will be presented the total number of
14 different merger arbitrage portfolios and to get a perspective for the return
portfolios are benchmarked against STOXX Europe 600 stock index and Market
Return data, including all stock data from following European countries: Austria,
Belgium, Germany, Denmark, Finland, France, Great Britain, Greece, Ireland, Italy,
Netherlands, Norway, Portugal, Spain, Sweden and Switzerland. Additionally, to
answer the research hypotheses presented in chapter 5 we will examine the risk of
the merger arbitrage portfolios and benchmark the results to benchmark index and to
earlier academic studies. All the returns in this chapter are calculated by the
formulas and methods explained earlier in chapter 6.
7.1 Merger arbitrage portfolio returns
In this paper there are portfolios constructed for each deal type; cash, stock and
mixed deals and one portfolio including all the deal types. Based on the deal types,
there are two different strategies to construct the portfolios either value-weighted or
equal-weighted portfolio. Monthly merger arbitrage portfolio returns in this sample are
presented in table 3. In some European countries short selling is illegal and there are
more limitations and restrictions for short selling than in the U.S., where most of the
earlier merger arbitrage studies are focusing. Considering these market specific facts
in table 3 there are two different strategies presented. Panel A merger arbitrage
portfolio returns are calculated when investors short sell acquirer’s stock in mixed
and stock deals. In Panel B portfolios take only long position in target stock and will
not short sell acquirer’s stock. Though, it should be noted that investors never short
sell acquirer’s stock in cash deals, therefore Panel A and Panel B results are the
same for cash deals. Panel C is presenting returns for the benchmark index STOXX
Europe 600 and Risk-free rate of return.
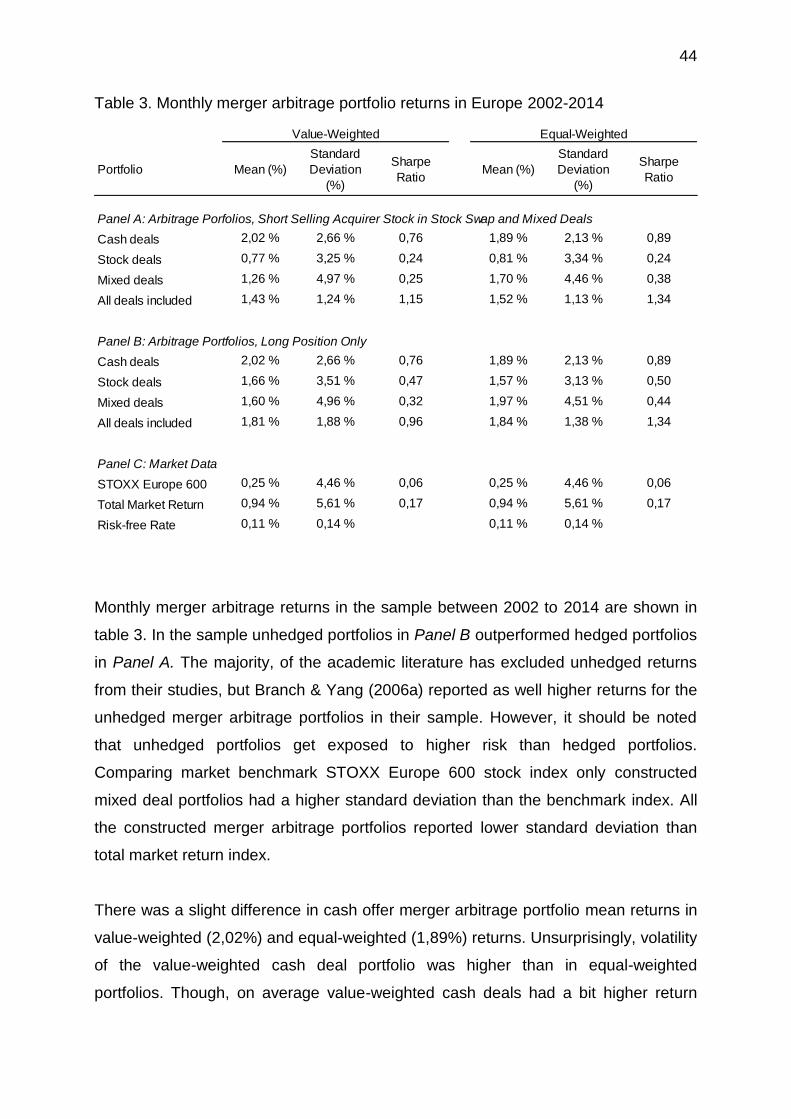
44
Table 3. Monthly merger arbitrage portfolio returns in Europe 2002-2014
Monthly merger arbitrage returns in the sample between 2002 to 2014 are shown in
table 3. In the sample unhedged portfolios in Panel B outperformed hedged portfolios
in Panel A. The majority, of the academic literature has excluded unhedged returns
from their studies, but Branch & Yang (2006a) reported as well higher returns for the
unhedged merger arbitrage portfolios in their sample. However, it should be noted
that unhedged portfolios get exposed to higher risk than hedged portfolios.
Comparing market benchmark STOXX Europe 600 stock index only constructed
mixed deal portfolios had a higher standard deviation than the benchmark index. All
the constructed merger arbitrage portfolios reported lower standard deviation than
total market return index.
There was a slight difference in cash offer merger arbitrage portfolio mean returns in
value-weighted (2,02%) and equal-weighted (1,89%) returns. Unsurprisingly, volatility
of the value-weighted cash deal portfolio was higher than in equal-weighted
portfolios. Though, on average value-weighted cash deals had a bit higher return
Portfolio Mean (%)
Standard
Deviation
(%)
Sharpe
RatioMean (%)
Standard
Deviation
(%)
Sharpe
Ratio
Panel A: Arbitrage Porfolios, Short Selling Acquirer Stock in Stock Swap and Mixed Deals
Cash deals 2,02 % 2,66 % 0,76 1,89 % 2,13 % 0,89
Stock deals 0,77 % 3,25 % 0,24 0,81 % 3,34 % 0,24
Mixed deals 1,26 % 4,97 % 0,25 1,70 % 4,46 % 0,38
All deals included 1,43 % 1,24 % 1,15 1,52 % 1,13 % 1,34
Panel B: Arbitrage Portfolios, Long Position Only
Cash deals 2,02 % 2,66 % 0,76 1,89 % 2,13 % 0,89
Stock deals 1,66 % 3,51 % 0,47 1,57 % 3,13 % 0,50
Mixed deals 1,60 % 4,96 % 0,32 1,97 % 4,51 % 0,44
All deals included 1,81 % 1,88 % 0,96 1,84 % 1,38 % 1,34
Panel C: Market Data
STOXX Europe 600 0,25 % 4,46 % 0,06 0,25 % 4,46 % 0,06
Total Market Return 0,94 % 5,61 % 0,17 0,94 % 5,61 % 0,17
Risk-free Rate 0,11 % 0,14 % 0,11 % 0,14 %
Value-Weighted Equal-Weighted
45
than equal-weighted cash deal portfolio. Compared to mixed and stock deal portfolios
cash deal portfolio had a lower standard deviation which is likely to be driven by the
higher total number of deals.
In constructed stock deal portfolios there can be seen a significant difference in mean
return between the hedged and unhedged strategies. The highest mean stock
portfolio return was for the long only position value weighted stock portfolio (2,02%),
and in contrary the lowest was for the hedged value-weighted stock deals. This
finding indicates the problem in the sample where short selling acquirer’s stock
accumulates negative returns. Again, these supporting results are supporting the
earlier findings by Branch & Yang (2006a), but in the contrary, with the most studies
in the U.S. markets (Andrade et al. 2001, Fuller et al. 2002, Mitchell et al. 2004).
Therefore, in unhedged stock swap deals, it is visible that investors gain additional
return when acquiring company stock price increases during the deal running period.
The mean monthly returns for the constructed stock deal portfolios range from 0,77%
to 1,66%.
The four constructed mixed deal portfolios generate monthly mean returns from
1,26% to 1,97%. Like in stock swap deal portfolios the returns of the unhedged
portfolios are higher than portfolios that include short selling acquirer’s stock. Due to
the smaller sample size than other deal types the standard deviation of monthly
mixed returns is higher than in other deal types.
Interestingly, every other portfolio strategy than stock deal portfolios with short selling
beat STOXX Europe 600 and Total European market return indexes during the time-
period in average return. The difference in returns is remarkably high and one
explanation for that could be the low volatility in merger arbitrage portfolios. All four
merger arbitrage portfolios, including all deal types posted relatively low standard
deviations ranging from 1,13% to 1,88%, which is lower than any other portfolio by
deal payment method alone. These findings suggest that in the European markets,
it’s better to combine more deal types than one to the portfolio and by diversifying,
investors can minimize the exposed risk in their portfolios. As in the other deal type
portfolios, the combination portfolios using long position strategy scored higher mean

46
returns than portfolios short selling acquirer stock. In total combination portfolios
posted high mean returns ranging from 1,43% to 1,84%.
Benchmarking the results to earlier academic literature, there was only a small
difference in monthly cash deal portfolio mean returns compared to Baker &
Savasoglu (2002) and Branch & Yang (2006a). Compared to earlier academic
studies (Mitchell & Pulvino 2001, Baker & Savasoglu 2002, Maheswaran & Yeoh
2006, Branch & Yang 2006, Hall et al. 2013) stock swap portfolio using short selling
strategy to acquirer’s stock, scored remarkably lower mean returns than in most of
the earlier studies. These findings challenge the short selling acquirer’s stock as a
profitable merger arbitrage investment method in the European markets. In overall
the portfolio results are in line with the earlier academic literature presented in
chapter 3. Because, there is no real benchmark yet for authors’ knowledge including
data from multiple European countries, the results can be seen a good baseline for
the future studies. The arbitrage spread and deal running time alone don’t support
this high return on average. Therefore, it seems that the total returns are highly
driven by the competing bids and other upward revisions resulting extraordinary
returns, as Baker & Savasoglu (2002) earlier reported.
In a big picture, the Sharpe ratios higher than market benchmarks are in line with the
earlier academic literature (Mitchell & Pulvino 2001, Baker & Savasoglu 2002,
Maheswaran & Yeoh 2006, Branch & Yang 2006a, Hall et al. 2013). The reported
standard deviations are lower than in some of the earlier studies, for example Baker
& Savasoglu (2002). However, in some studies, (see, e.g. Branch & Yang 2006a) the
monthly standard deviation was below 3% in stock swap deals, which is lower than in
any of the stock swap portfolios in this paper.
In chapter 4 main research question and sub-questions were presented. Based on
the findings in table 3 we can evaluate the outcome to Q1:
Q1: Are there differences in the returns between cash, stock swap and mixed deals?
47
In the results we can see that using by using typical merger arbitrage, including short
selling acquirer’s stock in stock swap and mixed deals cash deals generated the
highest return by mean. Second, there were mixed deal returns and in third place
stock deals. The difference in cash deal and mixed deal mean returns is really small
compared to stock deal returns. Therefore, the proposed hypothesis stands and
there are differences by deal type. However, when we focus to long position only
strategy the difference by deal type in average return is smaller. For value-weighted
portfolios cash deals posted the greatest return second to stock deals and mixed
deals in last place. Opposite to value-weighted portfolio returns with long only
strategy mixed deals posted greater mean return than cash and stock deals.
Using long only strategy mixed and stock deal portfolios posted remarkably higher
returns shown in Panel B compared to Panel A in table 3 which decreases the
difference in returns by deal type. Still, there is a difference by the deal types in Panel
B as well. It seems that cash and mixed deals performed better than stock deals
using equal weight strategy. Cash deal portfolios also had lower volatility with returns
than stock and mixed deal type portfolios and consequently remarkably higher
Sharpe ratios. It is very likely, that the nature of the sample consisting more cash
deals than stock swap and mixed deals highly correlates to volatility results in this
paper. Findings that cash deals generated higher returns than stock swap deals are
supporting earlier findings by Branch & Yang (2006a) and Wang & Wedge (2012).
The second question presented in chapter 4 was the following:
Q2: Are there differences in the returns between value and equal weighted
portfolios?
Earlier Baker & Savasoglu (2002) reported that one standard deviation change in firm
size leads to a 0,8% increase in average returns, suggesting that higher deal value
also leads to a higher arbitrage return. Therefore, the prediction is that value-
weighted portfolios with a higher weight to large deals should have higher mean
return than equal weighted portfolios.
48
Comparing portfolios, including all deal types equal-weighted portfolios posted higher
mean returns with lower volatilities than value-weighted portfolios. The volatility is not
surprising as value-weighted portfolios weight more for the single large deals and
therefore are not diversified for failure risk as well than equal-weighted portfolios.
The monthly mean return difference between the cash deal portfolios was only 0,12%
which is a slight difference. Though, value-weighted cash deal portfolios generated
higher average return than cash deals. During the total sample period for stock and
mixed deals using short selling strategy, equal-weighted portfolios performed better
than value-weighted portfolios. Contrary to short-selling strategy, for stock and mixed
deals with long only strategy, value-weighted portfolios beat equal-weighted
portfolios by average return. The most notable difference between the equal-
weighted and value-weighted investment methods is the standard deviation. It is
notable to see that all, but one equal weighted portfolio had lower volatility than their
comparable value-weighted portfolios. All equal-weighted portfolios scored higher
Sharpe ratio than comparable value-weighted strategy. Therefore, it can be said that
in total sample equal-weighted portfolios performed better than their value-weighted
alternatives and there are differences especially with the risk-adjusted returns and
proposed hypothesis stand.
Skewness and Kurtosis adjusted Sharpe ratio (SKASR) results, where value-
weighted portfolios are compared to similar equally weighted strategy portfolio are
presented in appendix 1. SKASR analysis favors equal weighted portfolios to perform
better than value weighted portfolios in all other, but stock deal portfolios with high
significance levels. SKASR results don’t support either weighting strategy to be
significantly better than other for stock deals. Despite the fact, that SKASR results
don’t recommend either weighting strategy, it suggests a long strategy to be more
attractive than short selling strategy as shown in appendix 2. In this sample period
there was no significant difference between short and long strategy SKASR results
for mixed deals.
Portfolio weighting strategy results for Sharpe ratio and standard deviation findings
are in line with the earlier literature by Baker & Savasoglu (2002), Maheswaran &
Yeoh (2005). Baker & Savasoglu (2002) also reported higher mean returns for value-
weighted cash deal portfolio than equal-weighted portfolio, but the results were
49
opposite for stock deal portfolios and in total sample the difference in mean return
was only 0,01% between value-weight and equal-weight portfolios. The findings in
this paper claiming equally weighted portfolios to perform better than value weighted
portfolios are in line with the earlier academic studies by Maheswaran & Yeoh (2005)
and Kearney et al. (2008), but in contrary to earlier findings by Baker & Savasoglu
(2002).
The monthly and annual performance of the portfolios is shown in table 4 below. Only
the months when there was at least one deal running in the portfolio were included.
In the left side of the table are value-weighted portfolio and on the right side there are
equal-weighted portfolio performances. The table 4 results are sectioned into three
parts Panel A shows the performance when market merger arbitrageurs take a short
position to acquirer stock in stock swap and mixed deals. Panel B follows the
strategy when investor takes only long position to target stock and in Panel C there
are results for the benchmark indexes STOXX Europe 600 and total European
market return index. However, cash deal portfolio results presented in Panel A and B
is always investing for long position only and there is no difference in strategy
between the panels.
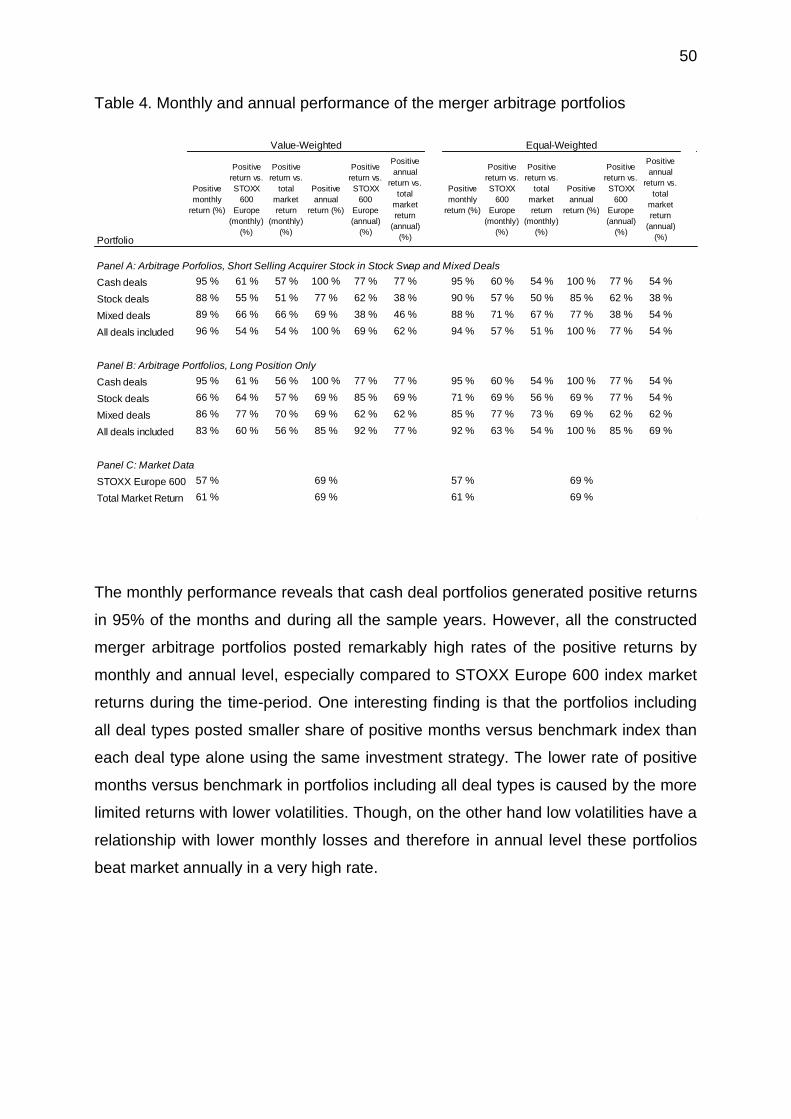
50
Table 4. Monthly and annual performance of the merger arbitrage portfolios
The monthly performance reveals that cash deal portfolios generated positive returns
in 95% of the months and during all the sample years. However, all the constructed
merger arbitrage portfolios posted remarkably high rates of the positive returns by
monthly and annual level, especially compared to STOXX Europe 600 index market
returns during the time-period. One interesting finding is that the portfolios including
all deal types posted smaller share of positive months versus benchmark index than
each deal type alone using the same investment strategy. The lower rate of positive
months versus benchmark in portfolios including all deal types is caused by the more
limited returns with lower volatilities. Though, on the other hand low volatilities have a
relationship with lower monthly losses and therefore in annual level these portfolios
beat market annually in a very high rate.
Portfolio
Positive
monthly
return (%)
Positive
return vs.
STOXX
600
Europe
(monthly)
(%)
Positive
return vs.
total
market
return
(monthly)
(%)
Positive
annual
return (%)
Positive
return vs.
STOXX
600
Europe
(annual)
(%)
Positive
annual
return vs.
total
market
return
(annual)
(%)
Positive
monthly
return (%)
Positive
return vs.
STOXX
600
Europe
(monthly)
(%)
Positive
return vs.
total
market
return
(monthly)
(%)
Positive
annual
return (%)
Positive
return vs.
STOXX
600
Europe
(annual)
(%)
Positive
annual
return vs.
total
market
return
(annual)
(%)
Panel A: Arbitrage Porfolios, Short Selling Acquirer Stock in Stock Swap and Mixed Deals
Cash deals 95 % 61 % 57 % 100 % 77 % 77 % 95 % 60 % 54 % 100 % 77 % 54 %
Stock deals 88 % 55 % 51 % 77 % 62 % 38 % 90 % 57 % 50 % 85 % 62 % 38 %
Mixed deals 89 % 66 % 66 % 69 % 38 % 46 % 88 % 71 % 67 % 77 % 38 % 54 %
All deals included 96 % 54 % 54 % 100 % 69 % 62 % 94 % 57 % 51 % 100 % 77 % 54 %
Panel B: Arbitrage Portfolios, Long Position Only
Cash deals 95 % 61 % 56 % 100 % 77 % 77 % 95 % 60 % 54 % 100 % 77 % 54 %
Stock deals 66 % 64 % 57 % 69 % 85 % 69 % 71 % 69 % 56 % 69 % 77 % 54 %
Mixed deals 86 % 77 % 70 % 69 % 62 % 62 % 85 % 77 % 73 % 69 % 62 % 62 %
All deals included 83 % 60 % 56 % 85 % 92 % 77 % 92 % 63 % 54 % 100 % 85 % 69 %
Panel C: Market Data
STOXX Europe 600 57 % 69 % 57 % 69 %
Total Market Return 61 % 69 % 61 % 69 %
Value-Weighted Equal-Weighted
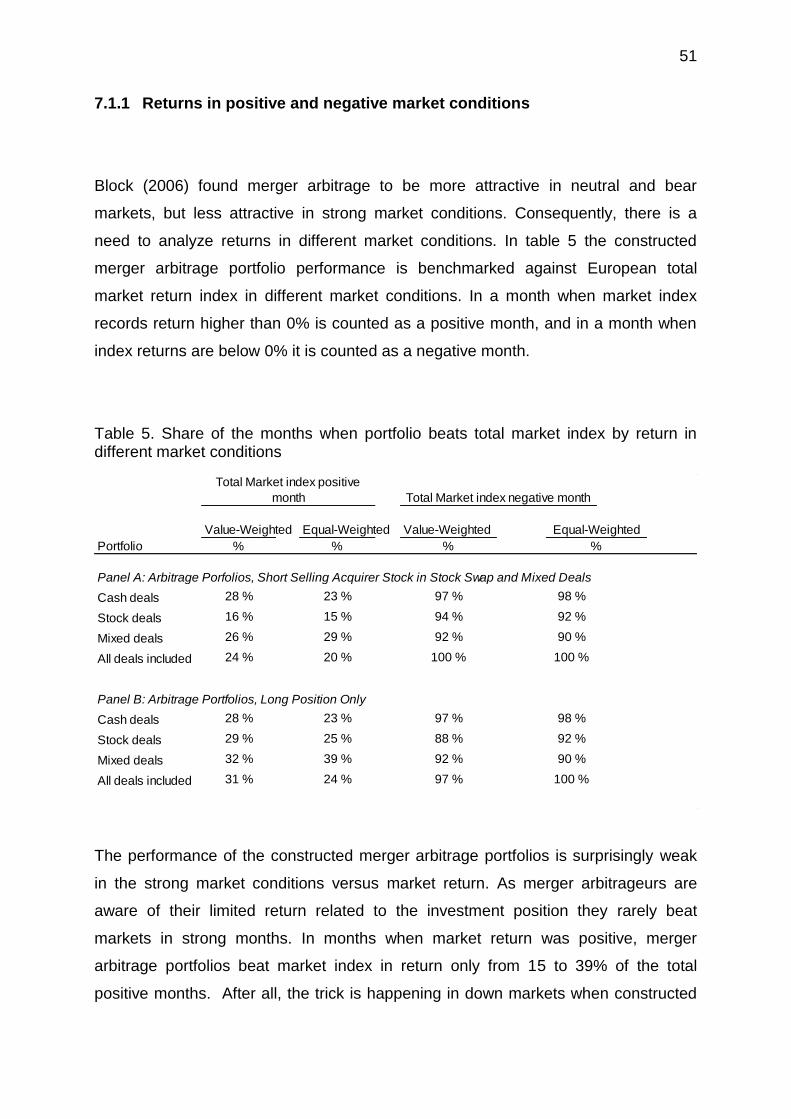
51
7.1.1 Returns in positive and negative market conditions
Block (2006) found merger arbitrage to be more attractive in neutral and bear
markets, but less attractive in strong market conditions. Consequently, there is a
need to analyze returns in different market conditions. In table 5 the constructed
merger arbitrage portfolio performance is benchmarked against European total
market return index in different market conditions. In a month when market index
records return higher than 0% is counted as a positive month, and in a month when
index returns are below 0% it is counted as a negative month.
Table 5. Share of the months when portfolio beats total market index by return in different market conditions
The performance of the constructed merger arbitrage portfolios is surprisingly weak
in the strong market conditions versus market return. As merger arbitrageurs are
aware of their limited return related to the investment position they rarely beat
markets in strong months. In months when market return was positive, merger
arbitrage portfolios beat market index in return only from 15 to 39% of the total
positive months. After all, the trick is happening in down markets when constructed
Value-Weighted Equal-Weighted Value-Weighted
Portfolio % % %
Panel A: Arbitrage Porfolios, Short Selling Acquirer Stock in Stock Swap and Mixed Deals
Cash deals 28 % 23 % 97 % 98 %
Stock deals 16 % 15 % 94 % 92 %
Mixed deals 26 % 29 % 92 % 90 %
All deals included 24 % 20 % 100 % 100 %
Panel B: Arbitrage Portfolios, Long Position Only
Cash deals 28 % 23 % 97 % 98 %
Stock deals 29 % 25 % 88 % 92 %
Mixed deals 32 % 39 % 92 % 90 %
All deals included 31 % 24 % 97 % 100 %
%
Total Market index positive
month Total Market index negative month
Equal-Weighted
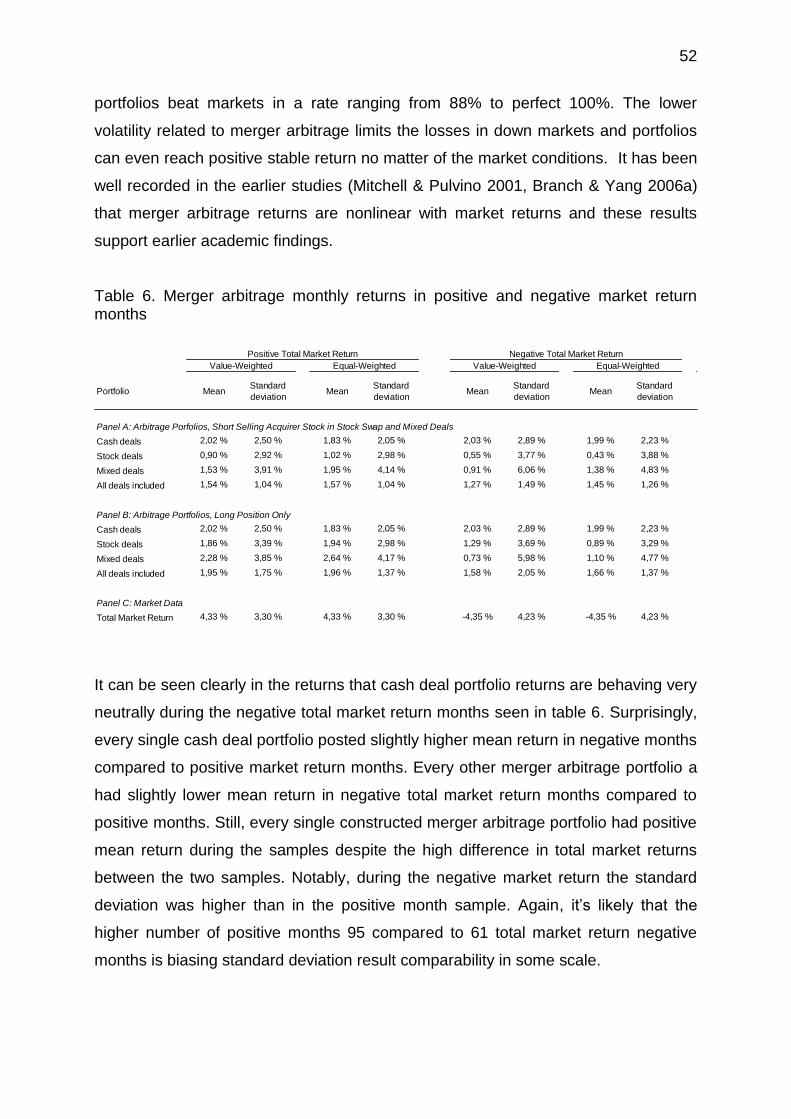
52
portfolios beat markets in a rate ranging from 88% to perfect 100%. The lower
volatility related to merger arbitrage limits the losses in down markets and portfolios
can even reach positive stable return no matter of the market conditions. It has been
well recorded in the earlier studies (Mitchell & Pulvino 2001, Branch & Yang 2006a)
that merger arbitrage returns are nonlinear with market returns and these results
support earlier academic findings.
Table 6. Merger arbitrage monthly returns in positive and negative market return months
It can be seen clearly in the returns that cash deal portfolio returns are behaving very
neutrally during the negative total market return months seen in table 6. Surprisingly,
every single cash deal portfolio posted slightly higher mean return in negative months
compared to positive market return months. Every other merger arbitrage portfolio a
had slightly lower mean return in negative total market return months compared to
positive months. Still, every single constructed merger arbitrage portfolio had positive
mean return during the samples despite the high difference in total market returns
between the two samples. Notably, during the negative market return the standard
deviation was higher than in the positive month sample. Again, it’s likely that the
higher number of positive months 95 compared to 61 total market return negative
months is biasing standard deviation result comparability in some scale.
Portfolio Mean Standard
deviationMean
Standard
deviationMean
Standard
deviationMean
Standard
deviation
Panel A: Arbitrage Porfolios, Short Selling Acquirer Stock in Stock Swap and Mixed Deals
Cash deals 2,02 % 2,50 % 1,83 % 2,05 % 2,03 % 2,89 % 1,99 % 2,23 %
Stock deals 0,90 % 2,92 % 1,02 % 2,98 % 0,55 % 3,77 % 0,43 % 3,88 %
Mixed deals 1,53 % 3,91 % 1,95 % 4,14 % 0,91 % 6,06 % 1,38 % 4,83 %
All deals included 1,54 % 1,04 % 1,57 % 1,04 % 1,27 % 1,49 % 1,45 % 1,26 %
Panel B: Arbitrage Portfolios, Long Position Only
Cash deals 2,02 % 2,50 % 1,83 % 2,05 % 2,03 % 2,89 % 1,99 % 2,23 %
Stock deals 1,86 % 3,39 % 1,94 % 2,98 % 1,29 % 3,69 % 0,89 % 3,29 %
Mixed deals 2,28 % 3,85 % 2,64 % 4,17 % 0,73 % 5,98 % 1,10 % 4,77 %
All deals included 1,95 % 1,75 % 1,96 % 1,37 % 1,58 % 2,05 % 1,66 % 1,37 %
Panel C: Market Data
Total Market Return 4,33 % 3,30 % 4,33 % 3,30 % -4,35 % 4,23 % -4,35 % 4,23 %
Positive Total Market Return Negative Total Market Return
Value-Weighted Equal-Weighted Value-Weighted Equal-Weighted
53
7.1.2 Returns prior 2008 and onwards
One of the research questions was to test, if there are differences in merger arbitrage
portfolio returns before and after European debt crisis and Great recession:
Q3: How the latest financial-crisis has affected to the returns of merger arbitrage
and can we see a declining trend in merger arbitrage returns?
Earlier Officer (2007) tested the performance-based arbitrage hypothesis by Shleifer
and Vishny (1997) suggesting that the returns of past arbitrage trades is affecting to
the availability of funds in the future arbitrage trades and hence affecting to returns.
According to Officer (2007) arbitrage markets are well-functioning and large losses or
number of investment opportunities do not have a significant impact on the prices
and arbitrage opportunities neither returns, unlike performance-based arbitrage
hypothesis suggests. Later academic studies by Ji & Jetley (2009) and Hall et al.
(2013) have reported decreasing trend in merger arbitrage return in later time-series
compared to earlier time-series.
The sample is divided into two parts, one focusing to monthly returns from 2002 to
end of 2007 presented in the left-hand side in table 7. The monthly returns from 2008
to end of 2014 are presented on the right-hand side. In this sample year 2007 is still
assumed as a year prior recession and debt crisis as annual total market return in
2007 was positive, but in 2008 the annual total market return was -45,9%.
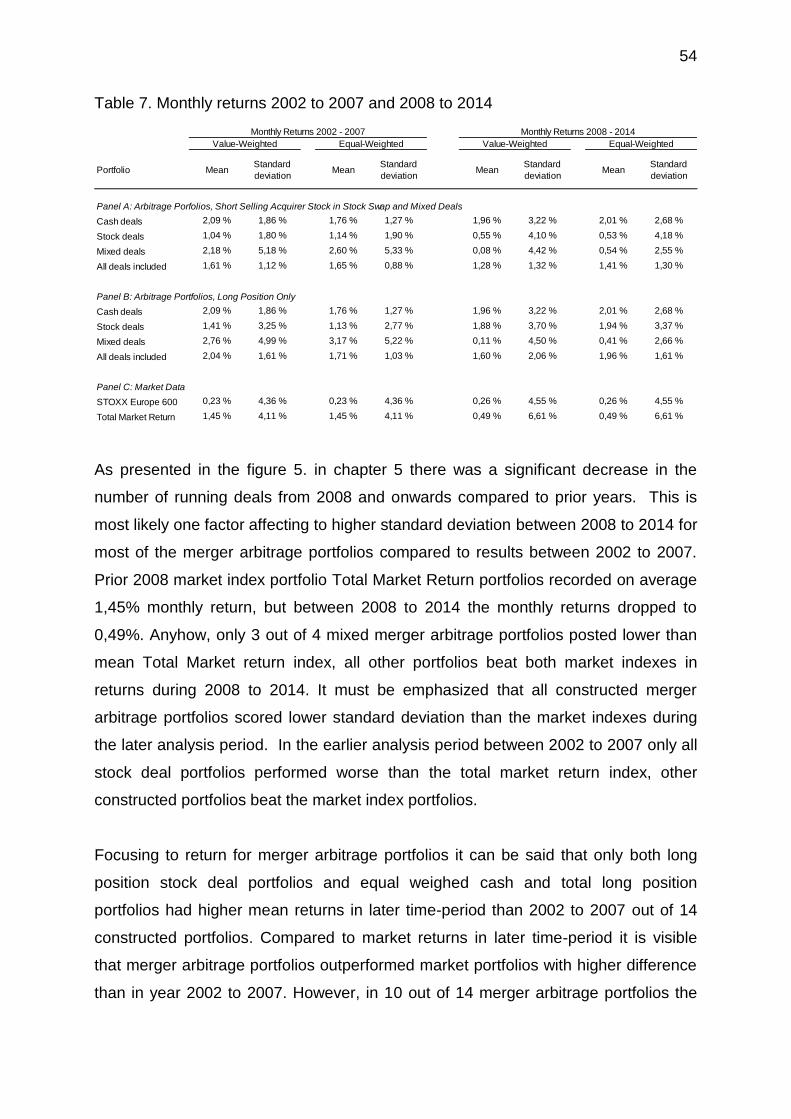
54
Table 7. Monthly returns 2002 to 2007 and 2008 to 2014
As presented in the figure 5. in chapter 5 there was a significant decrease in the
number of running deals from 2008 and onwards compared to prior years. This is
most likely one factor affecting to higher standard deviation between 2008 to 2014 for
most of the merger arbitrage portfolios compared to results between 2002 to 2007.
Prior 2008 market index portfolio Total Market Return portfolios recorded on average
1,45% monthly return, but between 2008 to 2014 the monthly returns dropped to
0,49%. Anyhow, only 3 out of 4 mixed merger arbitrage portfolios posted lower than
mean Total Market return index, all other portfolios beat both market indexes in
returns during 2008 to 2014. It must be emphasized that all constructed merger
arbitrage portfolios scored lower standard deviation than the market indexes during
the later analysis period. In the earlier analysis period between 2002 to 2007 only all
stock deal portfolios performed worse than the total market return index, other
constructed portfolios beat the market index portfolios.
Focusing to return for merger arbitrage portfolios it can be said that only both long
position stock deal portfolios and equal weighed cash and total long position
portfolios had higher mean returns in later time-period than 2002 to 2007 out of 14
constructed portfolios. Compared to market returns in later time-period it is visible
that merger arbitrage portfolios outperformed market portfolios with higher difference
than in year 2002 to 2007. However, in 10 out of 14 merger arbitrage portfolios the
Portfolio Mean Standard
deviationMean
Standard
deviationMean
Standard
deviationMean
Standard
deviation
Panel A: Arbitrage Porfolios, Short Selling Acquirer Stock in Stock Swap and Mixed Deals
Cash deals 2,09 % 1,86 % 1,76 % 1,27 % 1,96 % 3,22 % 2,01 % 2,68 %
Stock deals 1,04 % 1,80 % 1,14 % 1,90 % 0,55 % 4,10 % 0,53 % 4,18 %
Mixed deals 2,18 % 5,18 % 2,60 % 5,33 % 0,08 % 4,42 % 0,54 % 2,55 %
All deals included 1,61 % 1,12 % 1,65 % 0,88 % 1,28 % 1,32 % 1,41 % 1,30 %
Panel B: Arbitrage Portfolios, Long Position Only
Cash deals 2,09 % 1,86 % 1,76 % 1,27 % 1,96 % 3,22 % 2,01 % 2,68 %
Stock deals 1,41 % 3,25 % 1,13 % 2,77 % 1,88 % 3,70 % 1,94 % 3,37 %
Mixed deals 2,76 % 4,99 % 3,17 % 5,22 % 0,11 % 4,50 % 0,41 % 2,66 %
All deals included 2,04 % 1,61 % 1,71 % 1,03 % 1,60 % 2,06 % 1,96 % 1,61 %
Panel C: Market Data
STOXX Europe 600 0,23 % 4,36 % 0,23 % 4,36 % 0,26 % 4,55 % 0,26 % 4,55 %
Total Market Return 1,45 % 4,11 % 1,45 % 4,11 % 0,49 % 6,61 % 0,49 % 6,61 %
Monthly Returns 2002 - 2007 Monthly Returns 2008 - 2014
Value-Weighted Equal-Weighted Value-Weighted Equal-Weighted
55
mean return was lower in later sample. One big factor affecting to standard deviation
is the smaller sample size in later period, possibly even affecting to total returns in a
negative way. From 2002 to 2007 there was 233 announced deals compared to only
111 announced deals from 2008 to 2014. It is likely that the lower number of deals is
one factor to be considered when comparing the difference in merger arbitrage
portfolios between the two time-series, and it’s most visibly seen in a development of
the mixed deal returns.
Analysis between the two time-series leaves some questions open and don’t answer
if the lower number of merger arbitrage deal investment opportunities have been
driving some results down or not. When focusing purely merger arbitrage portfolio
returns, decreasing in three out of four merger arbitrage total portfolios, which could
support the earlier findings by Ji & Jetley (2009) and Hall et al. (2013) reporting
shrinking trend in merger arbitrage returns in later time-series.
Based on earlier analysis by Maheswaran & Yeoh (2005) claiming merger arbitrage
to be market neutral investment strategy and Block (2006) suggesting it to be more
attractive in neutral and down markets than in strong market conditions. Mitchell &
Pulvino (2001) and Branch & Yang (2006a) have reported a higher correlation
between merger arbitrage returns and down markets, which will be tested more
thoroughly in chapter 8. In the period between 2002 to 2008 the share of cash deals
accumulated approximately 70% of the deals during the time-period, but between the
2009 to 2014 the share of the cash deals was approximately only 53% of the total
sample. As earlier literature has already found the difference between the cash and
stock risk and return (see for example Baker & Savasoglu 2002) and cash deal
returns were more market neutral than other deal types, it can be said that the total
results between the two time-periods are also driven by the portfolio deal type
balance differences.
56
8 Benchmarking Merger Arbitrage Returns
The results of constructed portfolios shown in chapter 7 are benchmarked against the
two linear models: Capital Asset Pricing Model (CAPM) and the Fama-French Three-
Factor Model. Benchmarking results against the models will discover the sensitivity to
non-diversifiable risk, and to evaluate the excess returns generated by the
constructed merger arbitrage portfolios. Mitchell & Pulvino (2001) suggested in their
paper that the non-linear model is a better benchmark for merger arbitrage returns
than linear-models. Therefore, this section will be divided into two parts, in the first
part the merger arbitrage portfolios will be benchmarked against linear and non-linear
models. In the second part of the chapter the portfolios are tested with SKASR to
show the robustness in the results.
8.1 Benchmarking against linear models
In the first part of the linear models section the results will be benchmarked against
Capital Asset Pricing Model (CAPM) and in the second part the focus will be in Fama
and French Three-Factor Model. In the final part of this chapter, the results are
benchmarked in different market conditions.
8.1.1 Capital Asset Pricing Model (CAPM)
The Capital Asset Pricing Model often written as the CAPM was introduced by
Sharpe (1964), Lintner (1965) and Mossin (1966). The model is used to calculate the
costs of capital and measure portfolio performance. The CAPM assumes that in a
well-diversified portfolio there will not be unsystematic risk and there will be only
systematic risk left. The systematic risk is the market risk investors are facing as
consequence to market conditions and cannot be eliminated through diversification.
The measure of risk in a model is called market beta β, and the risk premium per unit
of increased risk is the same across all assets. The CAPM states a linear relationship
between the expected risk premium on individual assets and their market beta. The
CAPM expresses that returns vary across assets only because the market betas are
57
different. The level of market risk in a portfolio can be measured by the beta β. When
portfolio returns move in line with the market returns the beta is 1. Beta higher than 1
denotes that the portfolio returns vary more heavily than the market returns and beta
below 1 indicates that returns vary less than the market returns. When portfolio
returns move in to opposite direction than the market returns the beta is negative.
The CAPM model equation for portfolio returns is:
𝑅𝑝 − 𝑅𝑓 = 𝛼𝑝 + 𝛽𝑝(𝑅𝑀 − 𝑅𝑓) + 𝜖𝑃 (17)
In an equation 𝑅𝑝 is a return of portfolio and 𝑅𝑓 is a risk-free rate of return. Alpha 𝛼𝑝
measures the size of excess return, positive alpha indicates that the portfolio has
outperformed the market return 𝑅𝑀 − 𝑅𝑓. 𝛽𝑝 is the portfolio beta, the error term 𝜖𝑃 is
the idiosyncratic risk which is assumed as zero in the CAPM.
The CAPM is a linear pricing model that predicts a linear relationship between the
constructed merger arbitrage portfolio returns and the market returns. In this analysis
STOXX Europe 600 index is used as a proxy for the market returns. Regression
analysis is performed for each merger arbitrage portfolio to measure the linear
relationship between the portfolios and market return. The CAPM results are
presented in table 8:
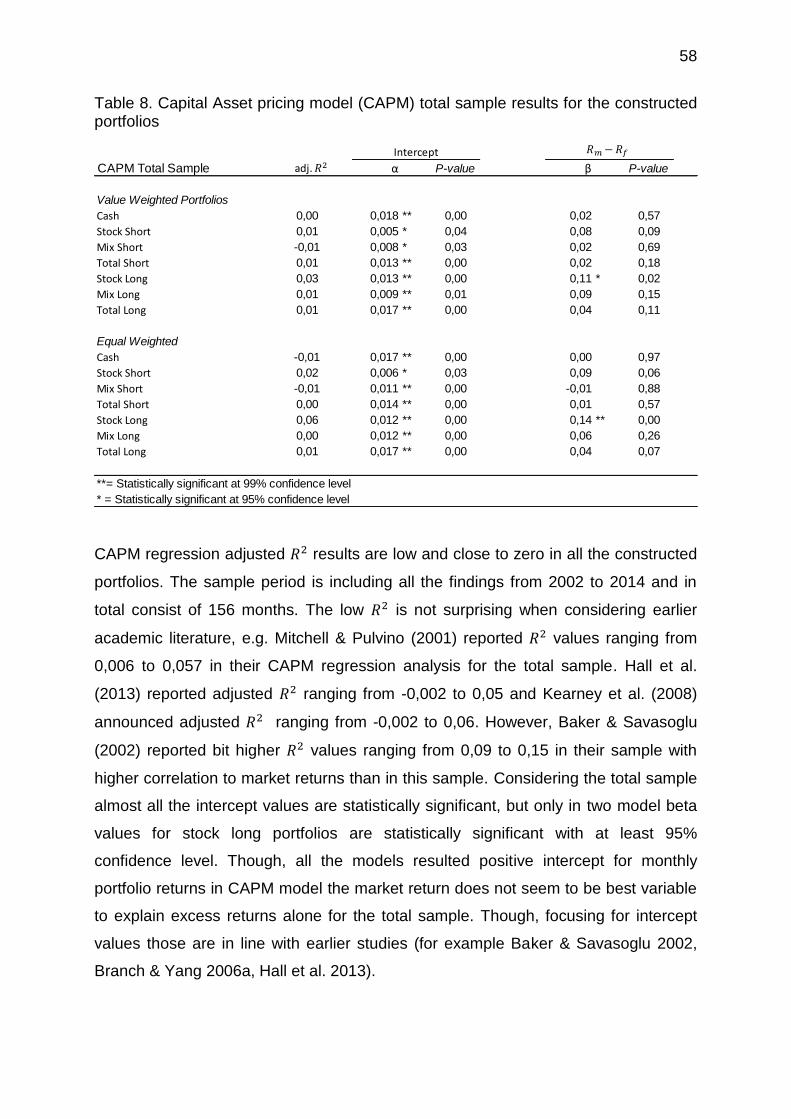
58
Table 8. Capital Asset pricing model (CAPM) total sample results for the constructed portfolios
CAPM regression adjusted 𝑅2 results are low and close to zero in all the constructed
portfolios. The sample period is including all the findings from 2002 to 2014 and in
total consist of 156 months. The low 𝑅2 is not surprising when considering earlier
academic literature, e.g. Mitchell & Pulvino (2001) reported 𝑅2 values ranging from
0,006 to 0,057 in their CAPM regression analysis for the total sample. Hall et al.
(2013) reported adjusted 𝑅2 ranging from -0,002 to 0,05 and Kearney et al. (2008)
announced adjusted 𝑅2 ranging from -0,002 to 0,06. However, Baker & Savasoglu
(2002) reported bit higher 𝑅2 values ranging from 0,09 to 0,15 in their sample with
higher correlation to market returns than in this sample. Considering the total sample
almost all the intercept values are statistically significant, but only in two model beta
values for stock long portfolios are statistically significant with at least 95%
confidence level. Though, all the models resulted positive intercept for monthly
portfolio returns in CAPM model the market return does not seem to be best variable
to explain excess returns alone for the total sample. Though, focusing for intercept
values those are in line with earlier studies (for example Baker & Savasoglu 2002,
Branch & Yang 2006a, Hall et al. 2013).
CAPM Total Sample α P-value β P-value
Value Weighted Portfolios
Cash 0,00 0,018 ** 0,00 0,02 0,57
Stock Short 0,01 0,005 * 0,04 0,08 0,09
Mix Short -0,01 0,008 * 0,03 0,02 0,69
Total Short 0,01 0,013 ** 0,00 0,02 0,18
Stock Long 0,03 0,013 ** 0,00 0,11 * 0,02
Mix Long 0,01 0,009 ** 0,01 0,09 0,15
Total Long 0,01 0,017 ** 0,00 0,04 0,11
Equal Weighted
Cash -0,01 0,017 ** 0,00 0,00 0,97
Stock Short 0,02 0,006 * 0,03 0,09 0,06
Mix Short -0,01 0,011 ** 0,00 -0,01 0,88
Total Short 0,00 0,014 ** 0,00 0,01 0,57
Stock Long 0,06 0,012 ** 0,00 0,14 ** 0,00
Mix Long 0,00 0,012 ** 0,00 0,06 0,26
Total Long 0,01 0,017 ** 0,00 0,04 0,07
**= Statistically significant at 99% confidence level
* = Statistically significant at 95% confidence level
Intercept
adj. 𝑅2
𝑅𝑚 − 𝑅𝑓
59
8.1.2 Fama and French Three Factor Model
The Fama-French three-factor model is based on the Capital Asset Pricing Model by
Fama and French (1993). The basis of the model is the same as the CAPM, but they
increased the number of factors from market risk in the original model to the total
number of three factors. Earlier Fama and French observed that stocks with small
market capitalization and stock with high market to book ratio had outperformed the
markets. Therefore, Fama and French added size factor SMB and value factor HML
to the original CAPM model. SMB stands for Small Minus Big measuring the
outperformance of small versus big companies. HML means High Minus Low
indicates the outperformance of high book-to-market companies versus small book-
to-market companies.
Historical values used in this paper for SML and HML were obtained from the
Kenneth French’s web page. The formula for Fama and French Three Factor model
regression analysis is:
𝑅𝑝 − 𝑅𝑓 = 𝛼𝑝 + 𝛽𝑝(𝑅𝑀 − 𝑅𝑓) + 𝛽𝑆𝑀𝐵𝑆𝑀𝐵 + 𝛽𝐻𝑀𝐿𝐻𝑀𝐿 + 𝜖𝑃 (18)

60
Table 9. The results from the Fama and French Three Factor model regression analysis for total sample
Regression results for Fama- French three factor model for the total sample period
are shown in table 9. The sample period is including all the findings from 2002 to
2014 and in total consist of 156 months. Like earlier for CAPM model the results are
mostly significant for intercept, but not for other factors. Again adjusted 𝑅2 results are
relatively low, ranging from -0,02 to 0,08 suggesting Fama-French three factor model
not to be much better model to explain monthly excess returns than CAPM. The
intercept values are ranging from 0,005 to 0,018 suggesting positive monthly excess
returns for all the constructed portfolios. However, beta values are mostly statistically
insignificant and relatively low, ranging from -0,08 to 0,16. Therefore, regression
results for the total sample suggest merger arbitrage returns to be highly
uncorrelated with market returns. Other factors in model SMB and HML are not either
correlating much to merger arbitrage portfolio returns. Other notable academic
studies have experienced the same kind of problems with Fama-French three factor
model like Mitchell & Pulvino. (2001) reported 𝑅2 results ranging from 0,014 to 0,076
and beta values from 0,0176 to 0,1052. Baker & Savasoglu (2002) represented
higher 𝑅2 values from 0,12 to 0,20 in their paper for constructed merger arbitrage
portfolios with higher beta values from 0,25 to 0,37. Though, focusing for intercept
FF Total Sample α P-value β P-value β P-value β P-value
Value Weighted Portfolios
Cash -0,02 0,018 ** 0,00 0,01 0,81 -0,05 0,68 0,05 0,62
Stock Short 0,00 0,005 * 0,05 0,08 0,11 0,08 0,51 -0,02 0,89
Mix Short 0,02 0,007 0,05 -0,04 0,53 0,09 0,62 0,40 * 0,02
Total Short -0,01 0,013 ** 0,00 0,03 0,19 -0,02 0,74 -0,02 0,70
Stock Long 0,06 0,012 ** 0,00 0,14 * 0,01 0,35 * 0,01 -0,07 0,62
Mix Long 0,03 0,008 * 0,01 0,04 0,58 0,22 0,19 0,35 * 0,05
Total Long 0,01 0,016 ** 0,00 0,05 0,11 0,11 0,16 -0,01 0,91
Equal Weighted
Cash -0,02 0,017 ** 0,00 -0,01 0,79 0,02 0,84 0,05 0,57
Stock Short 0,01 0,005 * 0,04 0,09 0,08 0,07 0,62 0,00 0,97
Mix Short 0,04 0,010 ** 0,00 -0,08 0,19 0,10 0,50 0,43 ** 0,01
Total Short 0,01 0,014 ** 0,00 -0,01 0,73 0,02 0,72 0,09 * 0,05
Stock Long 0,08 0,012 ** 0,00 0,16 ** 0,00 0,30 * 0,02 -0,07 0,59
Mix Long 0,04 0,011 ** 0,00 0,01 0,88 0,25 0,12 0,36 * 0,02
Total Long 0,03 0,017 ** 0,00 0,03 0,24 0,09 0,12 0,08 0,19
**= Statistically significant at 99% confidence level
* = Statistically significant at 95% confidence level
Intercept SMB HML
𝑎 𝑅2
𝑅𝑚 − 𝑅𝑓
61
values those are in line with earlier studies (for example Baker & Savasoglu 2002,
Branch & Yang 2006a and Hall et al. 2013).
8.1.3 Benchmarking results in different market conditions
Mitchell & Pulvino (2001) and Branch & Yang (2006a) found in their paper
nonlinearity between the merger arbitrage and market returns in different market
conditions. Their findings suggest market arbitrage returns to be uncorrelated with
market returns in most market conditions. However, during market downturns
Mitchell & Pulvino (2001) reported for a dramatic increase in the relationship between
the market and merger arbitrage returns. As the results in the earlier regression
analysis in chapter 8.1 for the total sample suggest there is no great correlation
between the market and merger arbitrage returns in the total sample. Therefore, the
next step is to find out, if there is a positive correlation between the merger arbitrage
and market returns in different market conditions which is also answering to the fifth
research question presented in chapter 4, which is the following:
Q5: Are the risk arbitrageurs facing more risk during the depreciating markets than
the positive and flat market conditions?
To determine the linearity in merger arbitrage in different market conditions we are
estimating linear model that meets the predetermined Threshold conditions given for
the sample. One can see that model shown in equation 19 is a CAPM formula with
an extension of Threshold-dummy factor.
𝑅𝑝𝑇ℎ𝑟𝑒𝑠ℎ𝑜𝑙𝑑 − 𝑅𝑓 = 𝛼𝑃𝑇ℎ𝑟𝑒𝑠ℎ𝑜𝑙𝑑 + 𝛽𝑀𝑘𝑡𝑇ℎ𝑟𝑒𝑠ℎ𝑜𝑙𝑑(𝑅𝑚 − 𝑅𝑓) (19)
The Threshold-dummy factor is derived from the earlier piecewise regression model
presented by Mitchell & Pulvino (2001), but due to the higher number of different
portfolios measured in this paper compared to earlier academic studies (e.g. Mitchell
& Pulvino 2001, Maheswaran & Yeoh 2005, Branch & Yang 2006a, Hall et al. 2013)
the models will be presented to multiple Threshold-values in a 1% interval. The
62
Threshold value is a Market return – risk free rate of return. As an example, if the
Threshold-value is <-2% all the months when Market return – risk free rate was
below -2% are included in the model and months with higher returns than -2% are
excluded from the sample.
The CAPM regression results for different market conditions are shown in table 10.
The predetermined Threshold-values are >+1%, >0%, <0%, <-1%, <-2%, <-3% and
<-4%. It can be seen from the regression results that in, there is only some
statistically significant beta values in some of the selected threshold-values. The
earlier academic literature by Mitchell & Pulvino (2002) reported that betas are high
in depreciating markets, but close to zero in appreciating and flat markets. Seen in
regression results it seems that during this sample none of the portfolios were highly
correlated to market results neither in positive nor more negative markets and stayed
relatively close to zero in all market conditions.
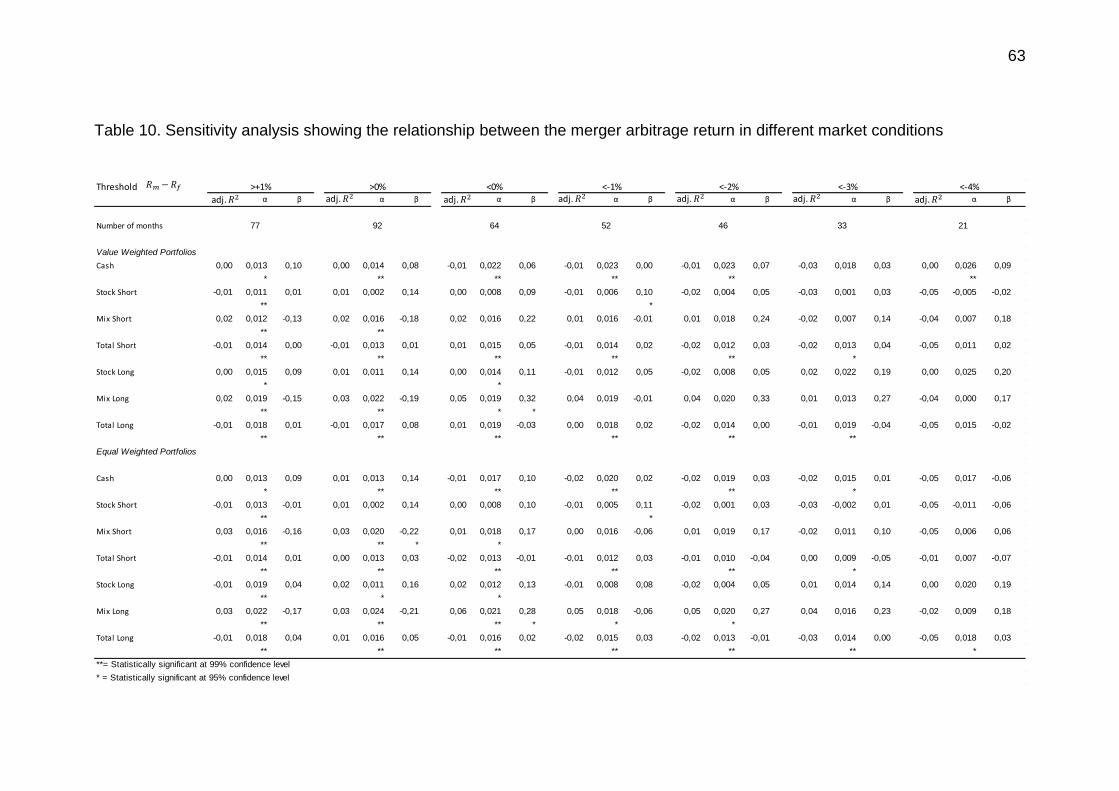
63
Table 10. Sensitivity analysis showing the relationship between the merger arbitrage return in different market conditions
Thresholdα β α β α β α β α β α β α β
Number of months
Value Weighted Portfolios
Cash 0,00 0,013 0,10 0,00 0,014 0,08 -0,01 0,022 0,06 -0,01 0,023 0,00 -0,01 0,023 0,07 -0,03 0,018 0,03 0,00 0,026 0,09
* ** ** ** ** **
Stock Short -0,01 0,011 0,01 0,01 0,002 0,14 0,00 0,008 0,09 -0,01 0,006 0,10 -0,02 0,004 0,05 -0,03 0,001 0,03 -0,05 -0,005 -0,02
** *
Mix Short 0,02 0,012 -0,13 0,02 0,016 -0,18 0,02 0,016 0,22 0,01 0,016 -0,01 0,01 0,018 0,24 -0,02 0,007 0,14 -0,04 0,007 0,18
** **
Total Short -0,01 0,014 0,00 -0,01 0,013 0,01 0,01 0,015 0,05 -0,01 0,014 0,02 -0,02 0,012 0,03 -0,02 0,013 0,04 -0,05 0,011 0,02
** ** ** ** ** *
Stock Long 0,00 0,015 0,09 0,01 0,011 0,14 0,00 0,014 0,11 -0,01 0,012 0,05 -0,02 0,008 0,05 0,02 0,022 0,19 0,00 0,025 0,20
* *
Mix Long 0,02 0,019 -0,15 0,03 0,022 -0,19 0,05 0,019 0,32 0,04 0,019 -0,01 0,04 0,020 0,33 0,01 0,013 0,27 -0,04 0,000 0,17
** ** * *
Total Long -0,01 0,018 0,01 -0,01 0,017 0,08 0,01 0,019 -0,03 0,00 0,018 0,02 -0,02 0,014 0,00 -0,01 0,019 -0,04 -0,05 0,015 -0,02
** ** ** ** ** **
Equal Weighted Portfolios
Cash 0,00 0,013 0,09 0,01 0,013 0,14 -0,01 0,017 0,10 -0,02 0,020 0,02 -0,02 0,019 0,03 -0,02 0,015 0,01 -0,05 0,017 -0,06
* ** ** ** ** *
Stock Short -0,01 0,013 -0,01 0,01 0,002 0,14 0,00 0,008 0,10 -0,01 0,005 0,11 -0,02 0,001 0,03 -0,03 -0,002 0,01 -0,05 -0,011 -0,06
** *
Mix Short 0,03 0,016 -0,16 0,03 0,020 -0,22 0,01 0,018 0,17 0,00 0,016 -0,06 0,01 0,019 0,17 -0,02 0,011 0,10 -0,05 0,006 0,06
** ** * *
Total Short -0,01 0,014 0,01 0,00 0,013 0,03 -0,02 0,013 -0,01 -0,01 0,012 0,03 -0,01 0,010 -0,04 0,00 0,009 -0,05 -0,01 0,007 -0,07
** ** ** ** ** *
Stock Long -0,01 0,019 0,04 0,02 0,011 0,16 0,02 0,012 0,13 -0,01 0,008 0,08 -0,02 0,004 0,05 0,01 0,014 0,14 0,00 0,020 0,19
** * *
Mix Long 0,03 0,022 -0,17 0,03 0,024 -0,21 0,06 0,021 0,28 0,05 0,018 -0,06 0,05 0,020 0,27 0,04 0,016 0,23 -0,02 0,009 0,18
** ** ** * * *
Total Long -0,01 0,018 0,04 0,01 0,016 0,05 -0,01 0,016 0,02 -0,02 0,015 0,03 -0,02 0,013 -0,01 -0,03 0,014 0,00 -0,05 0,018 0,03
** ** ** ** ** ** *
**= Statistically significant at 99% confidence level
* = Statistically significant at 95% confidence level
77 213346526492
<-4%>+1% >0% <0% <-1% <-2% <-3%
adj. 𝑅2
𝑅𝑚 − 𝑅𝑓
adj. 𝑅2 adj. 𝑅2 adj. 𝑅2 adj. 𝑅2 adj. 𝑅2 adj.𝑅2
64
One possible explanation for the different results compared to some earlier studies in
depreciating market conditions could be the completely different sample in this study.
In appendix 1 there are regression results shown with different Threshold-values
when months with over 10% of negative market return are excluded as outlier values.
When the most radically negative months are excluded it seems that especially cash
and stock deal portfolios are having higher beta values with increasingly negative
Threshold-values. When the most negative market return months are excluded from
the sample findings are supporting the earlier findings by Mitchell & Pulvino (2001)
that merger arbitrage results are having higher beta values in the negative than flat
and positive market conditions.
In all given Threshold-value beta coefficients are close to zero and highly insignificant
in the total sample, unless the most negative market returns are excluded from the
regression analysis. Therefore, it can be said that based on these regression results
there is no significant relationship between merger arbitrage cash deal portfolio
returns and market return. Based on this European merger arbitrage cash deal
sample between 2002 to 2014 merger arbitrage cash deal portfolio can be seen, as a
neutral investment strategy in any given market conditions.
In the market downturns with negative risk-adjusted market return and the months
with over 10% negative return excluded, the beta coefficients are increasing from the
values close to zero, and even statistically significant for stock short, mix short, mix
long portfolios with some specific Threshold-levels. However, for long position stock
deal portfolios the beta values are increasing with the lower market returns, but
statistically beta coefficients are not reliable. Therefore, the greater correlation to
market returns in market downturns can’t be confirmed for long position stock
portfolios. Consequently, stock long portfolio returns seem to behave likewise cash
deal portfolio returns with no remarkable correlation to market returns in any given
condition. Branch & Yang (2006a) found that some merger arbitrage deal type
portfolios were more highly correlated to the negative markets than other deal types.
Contrary to Branch & Yang (2006a) findings, in this sample cash deals were really
market neutral and mostly stock and mixed deal portfolios recorded higher beta
values than cash deals portfolios.
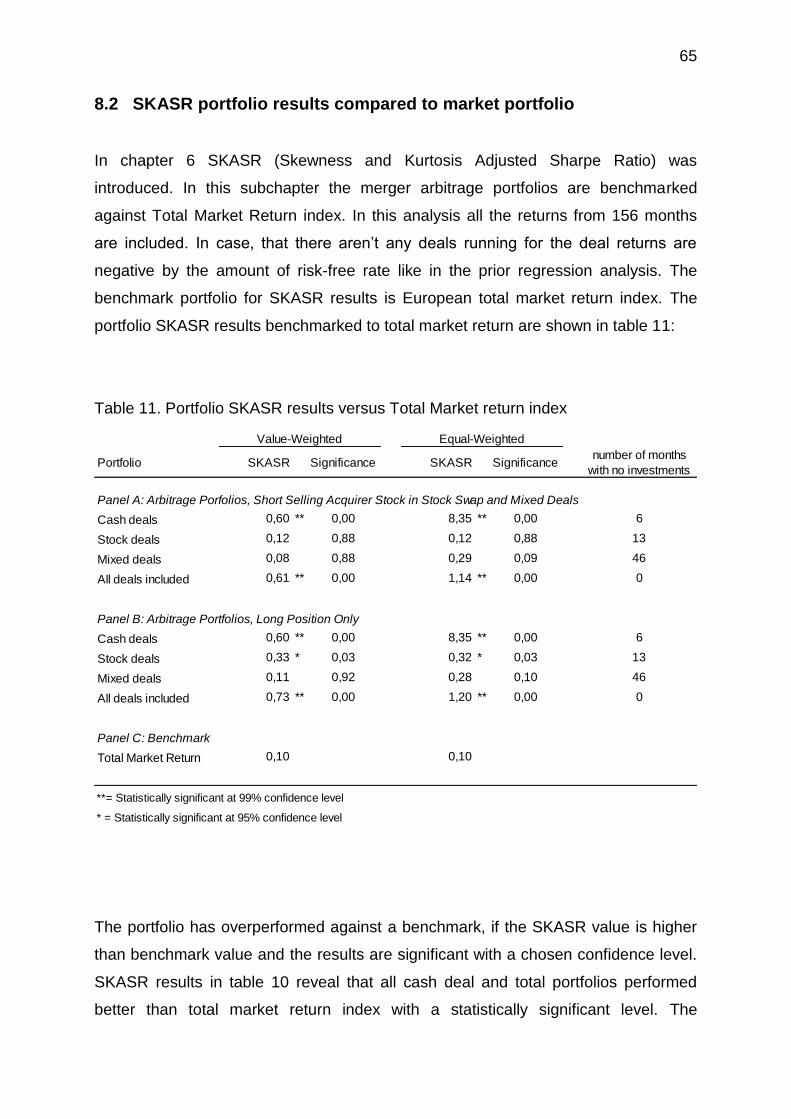
65
8.2 SKASR portfolio results compared to market portfolio
In chapter 6 SKASR (Skewness and Kurtosis Adjusted Sharpe Ratio) was
introduced. In this subchapter the merger arbitrage portfolios are benchmarked
against Total Market Return index. In this analysis all the returns from 156 months
are included. In case, that there aren’t any deals running for the deal returns are
negative by the amount of risk-free rate like in the prior regression analysis. The
benchmark portfolio for SKASR results is European total market return index. The
portfolio SKASR results benchmarked to total market return are shown in table 11:
Table 11. Portfolio SKASR results versus Total Market return index
The portfolio has overperformed against a benchmark, if the SKASR value is higher
than benchmark value and the results are significant with a chosen confidence level.
SKASR results in table 10 reveal that all cash deal and total portfolios performed
better than total market return index with a statistically significant level. The
Portfolio SKASR Significance SKASR Significancenumber of months
with no investments
Panel A: Arbitrage Porfolios, Short Selling Acquirer Stock in Stock Swap and Mixed Deals
Cash deals 0,60 ** 0,00 8,35 ** 0,00 6
Stock deals 0,12 0,88 0,12 0,88 13
Mixed deals 0,08 0,88 0,29 0,09 46
All deals included 0,61 ** 0,00 1,14 ** 0,00 0
Panel B: Arbitrage Portfolios, Long Position Only
Cash deals 0,60 ** 0,00 8,35 ** 0,00 6
Stock deals 0,33 * 0,03 0,32 * 0,03 13
Mixed deals 0,11 0,92 0,28 0,10 46
All deals included 0,73 ** 0,00 1,20 ** 0,00 0
Panel C: Benchmark
Total Market Return 0,10 0,10
**= Statistically significant at 99% confidence level
* = Statistically significant at 95% confidence level
Value-Weighted Equal-Weighted
66
difference with these portfolios is relatively high compared to benchmark portfolio
SKASR values. The results are highly significant for all total portfolios and
consequently it can be said that merger arbitrage portfolios ultimately produced a
return than the benchmark. Additionally, long position stock deal portfolios resulted
higher SKASR values than the benchmark index with 0,10 and the results are
significant with 95% confidence level. However, none of the mixed deal portfolios and
short position stock deal portfolios result statistically significant results versus
benchmark portfolio.
It is remarkable to mention that for some of the portfolios the skewness and kurtosis
values were relatively high affecting and hence affecting to the SKASR values.
Equally weighted cash portfolio is a one good example of a portfolio that is highly
skewed to the positive side. Excluding five of the most profitable months for equally
weighted portfolio would drop the SKASR value from over 8 to around 1. Additionally,
It is likely that especially mixed deal portfolios suffer from the higher number of
months with no running deals than other portfolios. In the future studies with different
sample with a lower number of months with no running deals, it could be possible to
see statistically significant results for the deal types that didn’t result statistically
significant SKASR results in this study.
The regression results with CAPM and Fama-French three factor model didn’t result
statistically significant results for most of the tested portfolios. Additionally, the
explanatory factor was relatively low with the regression models as the correlation
between the market return and merger arbitrage portfolio returns were relatively
weak. Therefore, for future studies SKASR could be a better benchmark to compare
excess returns of the merger arbitrage portfolios than the traditional linear models
that have been used in the numerous studies discovering the returns of merger
arbitrage.
67
9 Conclusions
The study examined the profitability of the merger arbitrage in Europe between 2002
to 2014. The main findings are summarized in this section, after which conclusions
and implications of them are drawn. Topics for the further research are made in
connection to the previous academic literature in merger arbitrage. The limitations of
this study are discussed in the subchapter 9.3.
9.1 Answer to the research question
The objective in this master’s thesis was to answer the research question: Are there
existing large excess returns by using the merger arbitrage investment strategy in
European markets in the time series since 2002 and does it make merger arbitrage
to an exceptional investment strategy. SKASR results for the merger arbitrage
portfolios revealed that all the constructed total merger arbitrage portfolios
outperformed benchmark market return portfolio. However, none of the mixed deal
portfolios and short position stock deal portfolios didn’t result statistically significant
results versus benchmark portfolio.
The study revealed that in the big picture there is some deviation in returns between
the deal types and cash deals generated higher returns than stock deals and in three
out of four comparable portfolios cash deals generated a higher mean return than
mixed deal portfolios. Using short selling strategy mixed deals also performed better
than stock deal portfolios in this sample. Moreover, cash deals posted also, smaller
standard deviation than stock and mixed deal portfolios. Findings that cash deals
generated higher returns than stock swap deals are supporting earlier findings by
Branch & Yang (2006a) and Wang & Wedge (2012).
Comparing portfolios including all deal types equal-weighted portfolios posted higher
mean returns with lover volatilities than value-weighted portfolios. For cash deal
portfolios there was only 0,12% difference between the two strategies. During the
total sample period for stock and mixed deals using short selling strategy, equal-
weighted portfolios performed better than value-weighted portfolios. Contrary to
short-selling strategy, for stock and mixed deals with long only strategy, value-
68
weighted portfolios beat equal-weighted portfolios by average return. However,
almost all equal weighted portfolios had a lower standard deviation than their
comparable value-weighted portfolios. Therefore, all equal-weighted portfolios scored
higher Sharpe ratio than their comparable value-weighted strategy. After all, it can be
said that in total sample equal-weighted portfolios performed better than their value-
weighted alternatives and there are differences with the risk-adjusted returns but not
that clear pattern for mean return.
In this analysis, it was visible to see the decrease in the number of running deals
from the pre-financial-crisis period between 2002 to 2008 compared 2008 to 2014. In
return there was a huge decline in a period 2008 onwards in stock deals using short
selling strategy and for mixed deals using long and short strategy. Surprisingly, long
strategy stock deal portfolios performed better in later analyzing period 2008 onwards
than in the prior period. For cash deals there was no remarkable pattern in portfolio
return to be explained by two different time-series and the returns seem very market
neutral. To answer the question three out of four total portfolios posted lower mean
return in later than earlier time-period mainly driven by mixed and stock deals.
Therefore, it can be said that the negative declining merger arbitrage trend continued
in the latter series like Ji & Jetley (2009) and Hall et al. (2013) reported before.
Clearly, all but three mixed deal portfolios posted a lower monthly standard deviation
than STOXX Europe 600 market index and all the constructed portfolios had a lower
standard deviation than the total market index. Compared to Branch & Yang (2006a)
results ranging from 2,9% standard deviation for stock deals to 4,2% for cash deals
this analysis posted slightly higher 3,13% to 3,51% standard deviation for stock deal
portfolios, but lower 2,13% to 2,66% standard deviation for cash deal portfolios.
These results seem to be driven mainly by the nature of the sample and in overall it
can be said that these results are in line with the low volatilities with the earlier
studies in North America. Like Baker & Savasoglu (2002) argued total portfolios
consisting cash and stock deals posted lower standard deviation than either deal
type portfolio alone. Findings that equally weighted portfolios posted a lower standard
deviation than value weighted portfolios in big picture and cash deal portfolios had
lower standard deviation than stock deals are similar findings to Baker & Savasoglu
(2002). As the volatility in overall was slightly less than in this sample for total

69
portfolios than in Baker & Savasoglu (2002) and Branch & Yang (2006a) the volatility
in overall isn’t any higher than in the earlier studies done in the North America.
Earlier, during market downturns Mitchell & Pulvino (2001) reported for a dramatic
increase in the relationship between the market and merger arbitrage returns and in
this analysis regression analysis was performed. In regression analysis, there was no
clear correlation between the merger arbitrage return and market return in any
conditions. The relationship to market return was found when maximum monthly
losses were capped to maximum 10% and the analysis was done in negative market
return months. Unless the maximum losses are capped there is no statistically
significant relationship between the market return and merger arbitrage portfolio
return. Consequently, the presumption that risk arbitrageurs could be facing more
risk during the depreciating than the positive and flat market conditions can’t be
confirmed in this study.
9.2 Recommendations
In this study merger arbitrage proved to be a profitable investment strategy in all
market conditions before any transaction costs or any other limitation. Based on
these findings merger arbitrage in Europe is more attractive investment strategy in
neutral and depreciating markets than in strong market conditions as Block (2006)
earlier recommended in his study in U.S. markets. It is recommended to diversify the
investments to high number of running deals with an equally weighted balance, as
equally weighted portfolios scored lower volatilities and higher sharp ratios than value
weighted portfolios. In this analysis long position strategies posted higher return than
short position strategies, therefore it’s not recommended to close the arbitrage
position after an initial investment. Long position strategy means higher exposure to
risk, but between 2002 to 2014 it was more profitable investment strategy than with
short selling. Merger arbitrage is not recommended for too small investors as
otherwise transaction costs and diversification can be too steep limitations to keep
investments profitable.

70
9.3 Future research directions and observed limitations of the research
In this study transaction costs and capital constraints were excluded. Real life
arbitrageurs are facing both limitations in their everyday investments. One of the
good future research findings could be to estimate merger arbitrage returns in
Europe with estimated reduction costs. Though, it could be more complicated to
measure than in the U.S. studies as it’s likely that transaction costs could vary
between the countries. One other limitation is that there was no commission or any
other transaction costs calculated between the currency exchange rates between the
countries. Returns between the currencies were calculated with a market rate,
though it is unlikely that merger arbitrageurs have access to exact same rates.
Multiple countries were included in this research and differences in return between
the countries were not analyzed. It could be interesting to analyze the differences in
merger arbitrage returns between the countries or either in geographical areas for
example returns in Northern Europe vs. Southern Europe. Additionally, it could be
possible to study if merger arbitrage deals in some specific countries or geographical
areas are more correlated to market returns than others.
In this study the was no focus to deal attitude or any that kind of factors possibly
affecting to deal outcome and return. In future research, it could be interesting to
analyze if there is any difference in return between friendly and hostile deal type
portfolios in Europe. As upwards revisions to bids are affecting to deal returns in a
positive way for merger arbitrageur, it could be the next step to build a model to
forecast if the deal is likely to be sweetened from original terms or not.
There have not been any merger arbitrage return studies to the authors, knowledge
to include this wide variety of European countries in a single study. The stage is now
open to future studies if they can replicate same findings or not. The negative
declining merger arbitrage trend continued in the latter time-series as like Ji & Jetley
(2009) and Hall et al. (2013) reported before. The future is still unknown and there is
a research gap to examine if the trend will continue to decline.
71
References
Agrawal, A., Jaffe J.G. & Mandelker, B.N. 1992. The Post-Merger Performance of
Acquiring Firms. Journal of Finance, 47, 1605-1622.
Agrawal, A. & Tandon K. (1994). Anomalies or Illusions? Evidence from Stock
Markets in Eighteen Countries. Journal of International Money and Finance 13(1) 83-
106.
Alexandridis, G., Mavrovitis C.F. & Travlos N.G. 2012. How have M&As changed?
Evidence from the sixth merger wave. The European Journal of Finance. 18(8), 663-
688.
Andrade, G., Mitchell, M. & Stafford, E. 2001. New evidence and perspectives on
mergers’, Journal of Economic Perspectives. 15, 103-120.
Ariel, R.A. 1987. A Monthly Effect in Stock Returns, Journal of Financial Economics,
19, 161-176.
Baker, M. & Savasoglu, S. 2002. Limited arbitrage in mergers and acquisitions.
Journal of Financial Economics, 64, 91-115.
Blau, B.M., Fuller, K.P. & Wade, C. 2015. Short Selling and Price Pressure Around
Merger Announcements. Journal of Financial Services Research, 48, 143, 143-160.
Block S. 2006. Merger Arbitrage Hedge Funds. Journal of Applied Finance, 16 (1),
88-96.
Branch, B. & Yang, T. 2006a. A Test of Risk Arbitrage Profitability. International
Review of Financial Analysis, 15, 39-56.
Branch, B. & Yang, T. 2006b. The Risk Arbitrage Performance: Failed Acquisition
Attempts. Quarterly Journal of Business and Economics, 45, 53-68.
Cadsby, C.B. & Torbey, V. 2003. Time-of-month anomaly: Reality or Mirage?.
Applied Economic Letters, 10 (1), 741-745.
72
Cornelli, F. & Li, D.L. 2002. Risk Arbitrage in Takeovers. The Review of Financial
Studies, 15 (3), 837-868.
Cornish, E.A., & Fisher, R.A. 1937. Moments and cumulants in the specification of
distributions. Review of the International Statistical Institute, 4, 307-320.
Erel, I., & Liao, R.C. & Weisbach, M.S. 2012. Determinants of Cross-Border Mergers
and Acquisitions. Journal of Finance, 67 (3), 1045-1082.
Fama, E.F. 1965. The Behavior of Stock Market Prices. Journal of Business, 38, 34-
105.
Fama, E.F, 1970. A review of theory and empirical work. Journal of Finance 25 (2),
383-417.
Fama, E.F. & French, K.R. 1993. Common risk factors in the returns of stocks and
bonds. Journal of Financial Economics, 33 (1), 3-56.
Favre, L., & Galeano, J.A. 2002. Mean-modified value-at-risk optimization with hedge
funds. Journal of Alternative Investments, 5, 21-25.
Fuller, K., Netter, J. & Stegemoller, M. 2002. What do returns to acquiring firms tell
us: Evidence from firms that make many acquisitions. Journal of Finance 57, 1763-
1793.
Hall, J., Pinnuck, M. & Thorne, M. 2013. Market risk exposure of merger arbitrage in
Australia. Accounting and Finance, 53, 185-215.
Hansen R.G. 1987. A theory for the Choice of Exchange Medium in Mergers and
Acquisitions. Journal of Business, 60 (1), 75-95.
Houston, J. & Ryngaert, J. 1997. Equity issuance and adverse selection: A direct test
using conditional stock offers. Journal of Finance, 52, 197-219
Hsieh, J. & Walking R.A. 2005. Determinants and implications of arbitrage holdings in
acquisitions. Journal of Financial Economics, 77, 605-648.
73
Hutson, E. & Kearney, C. 2005. Merger arbitrage and the interaction between target
and bidder stocks during takeover bids. Research in International Business and
Finance, 19, 1-26.
Jarrell, G.A., Brickley, J.A. & Netter J.M, 1988. The Market for Corporate Control:
The Empirical Evidence Since 1980. Journal of Economic Perspectives, 2 (1), 49-68.
Jensen, M.C. & Ruback, R. 1983. The Market for Corporate Control: The Scientific
Evidence. Journal of Financial Economics, 11, 5-50.
Jain, A., Jain P.K., McInish, T.H. & Mckenzie M. 2013. Worldwide reach of short
selling regulations. Journal of Financial Economics, 109, 1, 177-197.
Ji, X. & Jetley G. 2009. The Shrinking Merger Arbitrage Spread: Reasons and
Implications. Financial Analysts Journal, 66, 2, 54-68.
Jobson, J.D. & Korkie, B. 1981. Performance Hypothesis Testing with the Sharpe
and Treynor Measures. Journal of Finance, 36, 889-908.
Karolyi, G.A. & Shannon, J. 1999. Where’s the Risk in Risk Arbitrage? Canadian
Investment Review, 12 (1), 12-18.
Kearney, P., Hutchinson, M.C. & Cotter, D. 2008. Risk and Return of Merger
Arbitrage in the UK 2001 to 2004. The Irish Accounting Review, 14,2,17
Larcker, D. & Lys, T. 1987. An empirical analysis of the incentives to engage in costly
information acquisitions. Journal of Financial Economics 18, 111-126.
Lin, L., Lan L.H. & Chuang, S.S. 2013. An Option-Based Approach to Risk Arbitrage
in Emerging Markets: Evidence from Taiwan Takeover Attempts. Journal of
Forecasting, 32, 512-521.
Lintner, J. 1965. The valuation of risk assets and selection of risky investments in
stock portfolios and capital budgets. Review of Economics and Statistics, 47, 13-37.

74
Maheswaran, K. & Yeoh, S.C. 2005. The Profitability of Merger Arbitrage: Some
Australian Evidence. Australian Journal of Management 30 (1), 111-126.
Malkiel, B.G. 1973. A Random Walk Down Wall Street. Norton, New York.
Martynova, M. & Renneboog L. 2008. A century of corporate takeovers: What have
we learned and where do we stand?. Journal of Banking & Finance 32, 2148-2177.
McDermott, I. & Mulcahy, M. 2017. Merger arbitrage in Germany. Journal of Finance
and Investment Analysis, 6 (2), 29-44.
Memmel, C. 2003. Performance Hypothesis Testing with the Sharpe Ratio. Finance
Letters, 1, 2003.
Mitchell, M. & Pulvino, T. 2001. Characteristics of risk in risk arbitrage. Journal of
Finance 56, 2135-2175.
Mitchell, M., Pulvino, T. & Stafford, E. 2004. Price Pressure around Mergers. Journal
of Finance, 59 (1), 31-63.
Moore, K.M., Lai, G.C. & Oppenheimer H.R. 2006. The Behavior of Risk Arbitrageurs
in Mergers and Acquisitions. The Journal of Alternative Investments, 9, 19-27.
Mossin, J. 1966. Equilibrium in a Capital Asset Market. Econometrica. 34, 768-783.
Myers, S. C. & Majluf, N.S. 1984. Corporate Financing and Investment Decisions
when Firms Have Information that Investors Do not Have. Journal of Financial
Economics, 1984, 187-221.
Noro, K. 2010. Takeover Success Prediction European acquisitions between 1999
and 2009. Master’s thesis, Hanken School of Economics.
Officer, M. 2007. Are performance based arbitrage effects detectable? Evidence from
merger arbitrage. Journal of Corporate Finance, 13, 793-812.
75
Pätäri E.J. 2011. Does the risk-adjustment method matter at all in hedge fund
rankings? International Research Journal of Finance and Economics, 75, 69-99.
Schwert, G.W. 2000. Hostility in the Takeovers: In the Eye of the Beholder. Journal of
Finance 55, 2599-2640.
Sharpe, W.F. 1964. Capital asset prices: A theory of market equilibrium under
conditions of risk. Journal of Finance, 19, 3, 325-442.
Sharpe W.F. 1966. Mutual Fund Performance. The Journal of Business, 39, 1, 119-
138.
Shleifer A. & Vishny, R.W. 1997. The limits of arbitrage. Journal of Finance, 52, 35-
55.
Sudarsanam, P. & Nguyen D.V. 2008. UK Evidence on the Profitability and the Risk-
Return Characteristics of Merger Arbitrage. Centre for Research in Economics and
Finance, Working Paper, Cranfield University, Bedfordshire, UK.
Turamari, R.I. & Hyderabad, R.L. 2017. Measurement of Long-Term Post-Merger
Performance and Method of Payment. Journal of Management in Practice, 2, 1, 1-21.
Volkswagen. 2014. Volkswagen controls 98.19 percent of shares in Scania, 21 May
2014, Press release. Available at:
http://www.scania.com/group/en/wp-content/uploads/sites/2/2015/11/20140521-
Volkswagen_controls_9819_percent_of_the_shares_in_Scania.pdf
Walking, R.A. 1985. Predicting tender offer success; a logistic analysis. Journal of
Finance and Quantitative Analysis 20, 461-478.
Wang, X., Wedge, L. 2012. Profitability of Option-Based Merger Arbitrage. The IUP
Journal of Applied Finance, 18, 4, 31-45.

76
Appendices
Appendix 1. Portfolio SKASR analysis, where value-weighted portfolios are
compared to equal-weighted portfolios.
Appendix 2. Portfolio SKASR analysis, where short strategy portfolios are compared
to long strategy portfolios.
vs.
Portfolio SKASR SKASR Significancenumber of months
with no deals running
Arbitrage Porfolios, Short Selling Acquirer Stock in Stock Swap and Mixed Deals
Cash deals 0,60 8,35 0,00 ** 6
Stock deals 0,12 0,12 0,98 13
Mixed deals 0,08 0,29 0,00 ** 46
All deals included 0,61 1,14 0,00 ** 0
Arbitrage Portfolios, Long Position Only
Stock deals 0,33 0,32 0,79 13
Mixed deals 0,11 0,28 0,00 ** 46
All deals included 0,73 1,20 0,00 ** 0
**= Statistically significant at 99% confidence level
* = Statistically significant at 95% confidence level
Value-Weighted Equal-Weighted
vs.
Portfolio SKASR SKASR Significancenumber of months
with no deals running
Value Weighted Portfolios
Stock deals 0,12 0,33 0,00 ** 13
Mixed deals 0,08 0,11 0,22 46
Equal weighted Portfolios
Stock deals 0,12 0,32 0,00 ** 13
Mixed deals 0,29 0,28 0,12 46
**= Statistically significant at 99% confidence level
* = Statistically significant at 95% confidence level
Short Strategy Long Strategy
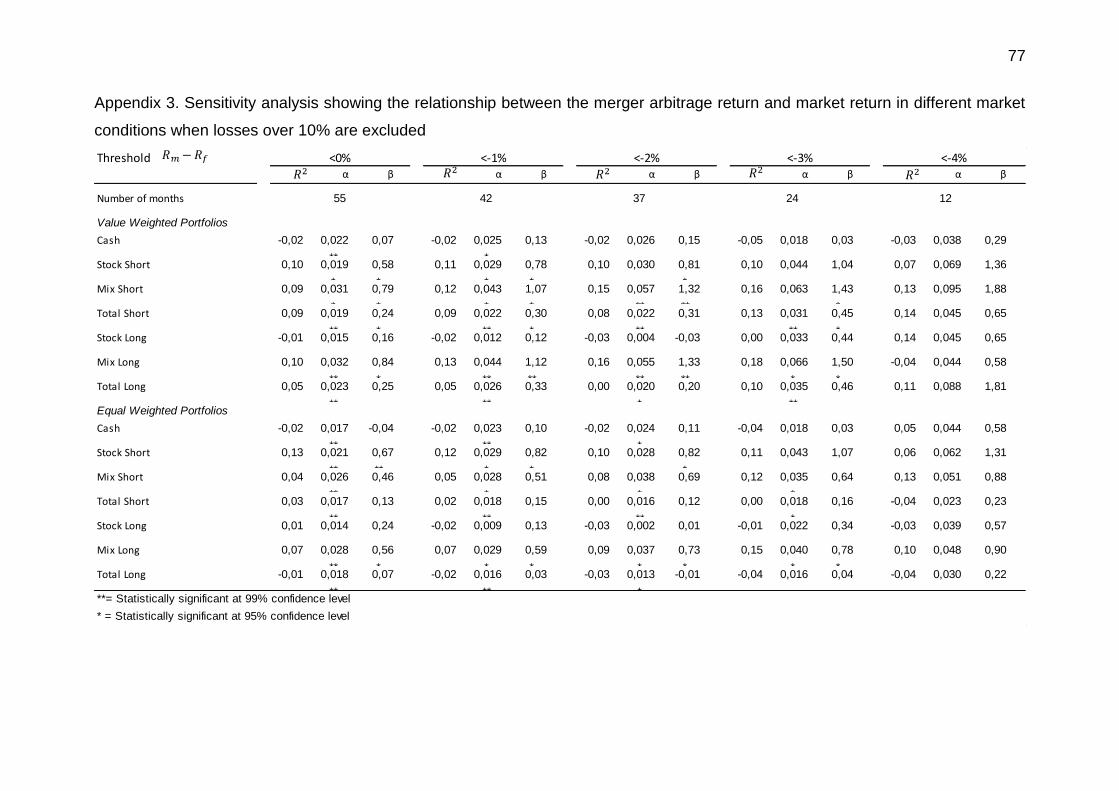
77
Appendix 3. Sensitivity analysis showing the relationship between the merger arbitrage return and market return in different market
conditions when losses over 10% are excluded
Thresholdα β α β α β α β α β
Number of months
Value Weighted Portfolios
Cash -0,02 0,022 0,07 -0,02 0,025 0,13 -0,02 0,026 0,15 -0,05 0,018 0,03 -0,03 0,038 0,29
** *Stock Short 0,10 0,019 0,58 0,11 0,029 0,78 0,10 0,030 0,81 0,10 0,044 1,04 0,07 0,069 1,36
* * * * *Mix Short 0,09 0,031 0,79 0,12 0,043 1,07 0,15 0,057 1,32 0,16 0,063 1,43 0,13 0,095 1,88
* * * * ** ** *Total Short 0,09 0,019 0,24 0,09 0,022 0,30 0,08 0,022 0,31 0,13 0,031 0,45 0,14 0,045 0,65
** * ** * ** ** *Stock Long -0,01 0,015 0,16 -0,02 0,012 0,12 -0,03 0,004 -0,03 0,00 0,033 0,44 0,14 0,045 0,65
Mix Long 0,10 0,032 0,84 0,13 0,044 1,12 0,16 0,055 1,33 0,18 0,066 1,50 -0,04 0,044 0,58
** * ** ** ** ** * *Total Long 0,05 0,023 0,25 0,05 0,026 0,33 0,00 0,020 0,20 0,10 0,035 0,46 0,11 0,088 1,81
** ** * **Equal Weighted Portfolios
Cash -0,02 0,017 -0,04 -0,02 0,023 0,10 -0,02 0,024 0,11 -0,04 0,018 0,03 0,05 0,044 0,58
** ** *Stock Short 0,13 0,021 0,67 0,12 0,029 0,82 0,10 0,028 0,82 0,11 0,043 1,07 0,06 0,062 1,31
** ** * * *Mix Short 0,04 0,026 0,46 0,05 0,028 0,51 0,08 0,038 0,69 0,12 0,035 0,64 0,13 0,051 0,88
** * * *Total Short 0,03 0,017 0,13 0,02 0,018 0,15 0,00 0,016 0,12 0,00 0,018 0,16 -0,04 0,023 0,23
** ** ** *Stock Long 0,01 0,014 0,24 -0,02 0,009 0,13 -0,03 0,002 0,01 -0,01 0,022 0,34 -0,03 0,039 0,57
Mix Long 0,07 0,028 0,56 0,07 0,029 0,59 0,09 0,037 0,73 0,15 0,040 0,78 0,10 0,048 0,90
** * * * * * * *Total Long -0,01 0,018 0,07 -0,02 0,016 0,03 -0,03 0,013 -0,01 -0,04 0,016 0,04 -0,04 0,030 0,22
** ** ***= Statistically significant at 99% confidence level
* = Statistically significant at 95% confidence level
1224374255
<-4%<0% <-1% <-2% <-3%
𝑅2 𝑅2 𝑅2 𝑅2 𝑅2
𝑅𝑚 − 𝑅𝑓