Embed Size (px)
Citation preview

RepFina
PELOAGLO Scot
July COLDTD
ort No. CDal Report
ERFOROCAL AGGREGOW TR
tt Shuler
y 2013
LORADOD APPLIE
DOT-2013
RMANCAND MGATES
RAFFIC
O DEPARTED RESEA
3-7
CE OF MINIMAS FOR PC VOLU
TMENT OARCH AN
CHIP SALLY PPRESEUME R
OF TRANSND INNOV
SEALSPROCE
ERVATROADW
SPORTATVATION B
S USINESSED
TION OWAYS
TION BRANCH
G D OF
H

The contents of this report reflect the views of the
author(s), who is(are) responsible for the facts and
accuracy of the data presented herein. The contents
do not necessarily reflect the official views of the
Colorado Department of Transportation or the
Federal Highway Administration. This report does
not constitute a standard, specification, or regulation.

Technical Report Documentation Page 1. Report No.
CDOT-2013-7 2. Government Accession No.
3. Recipient's Catalog No.
4. Title and Subtitle
PERFORMANCE OF CHIP SEALS USING LOCAL AND MINIMALLY PROCESSED AGGREGATES FOR PRESERVATION OF LOW TRAFFIC VOLUME ROADWAYS
5. Report Date
July 2013
6. Performing Organization Code
7. Author(s)
Scott Shuler 8. Performing Organization Report No.
CDOT-2013-7
9. Performing Organization Name and Address
Colorado State University Ft. Collins, CO 80523-1584
10. Work Unit No. (TRAIS)
11. Contract or Grant No.
12. Sponsoring Agency Name and Address
Colorado Department of Transportation - Research 4201 E. Arkansas Ave. Denver, CO 80222
13. Type of Report and Period Covered
Final
14. Sponsoring Agency Code
12.72
15. Supplementary Notes
Prepared in cooperation with the US Department of Transportation, Federal Highway Administration 16. Abstract
This report documents the performance of two low traffic volume experimental chip seals constructed using locally available, minimally processed sand and gravel aggregates after four winters of service. The projects were constructed by CDOT maintenance personnel during the summer of 2009 using two sources of aggregate. These aggregates consisted of locally available products representing 1) materials routinely utilized and 2) materials that were marginal with respect to aggregate gradation and crushing requirements. An objective of this work was to evaluate the feasibility and cost/benefit of using aggregates in chip seals of lower quality than normally used with respect to gradation on low volume roadways. Because the cost of transporting high quality aggregates from front range sand and gravel and quarry locations to the eastern regions of Colorado is high and much of the pavement preservation activities in eastern Colorado are on low volume roadways, utilizing locally available aggregates would provide economic benefits if acceptable performance were demonstrated. After four winters and three summers service both experimental chip seals are performing well. Condition surveys of each pavement were conducted after each winter and summer to document pavement condition. Results indicate that pavement distress is in the form of longitudinal and transverse cracking and localized flushing due to non-uniform asphalt emulsion application during construction. Based on results from the last condition survey, both test pavements should perform acceptably for the next several years assuming no significant change in traffic levels. No significant differences were measured in performance for any of the evaluation sections.
Implementation It appears that locally available, minimally processed aggregates can be successfully applied as chip seal aggregate on low volume roadways. 17. Keywords
low volume roadways, experimental chip seals, marginal aggregate chip seals, pavement preservation
18. Distribution Statement
This document is available on CDOT’s website http://www.coloradodot.info/programs/research/pdfs
19. Security Classif. (of this report)
Unclassified 20. Security Classif. (of this page)
Unclassified 21. No. of Pages
96 22. Price
Form DOT F 1700.7 (8-72) Reproduction of completed page authorized

ii
ACKNOWLEDGEMENTS Thanks to study panel members Gary DeWitt, CDOT Region 4 Materials; Masoud Ghaeli, CDOT R-
6 Materials; Rex Goodrich, CDOT R-3 Materials; Roy Guevara, CDOT Materials and Geotechnical
Branch; Donna Harmelink, FHWA Colorado Division; Neal Retzer, CDOT Materials and
Geotechnical Branch; Gary Strome, CDOT R-4 Materials; and Roberto de Dios CDOT-DTD
Research for coordinating the research and helping to establish the full scale test sections. Also,
thanks are due to Byron Rogers and his crew of Region 4 Maintenance for constructing the test
sections and helping to coordinate and construct the application of the different aggregates in the
locations identified by the research team.
Thank you all.
iii
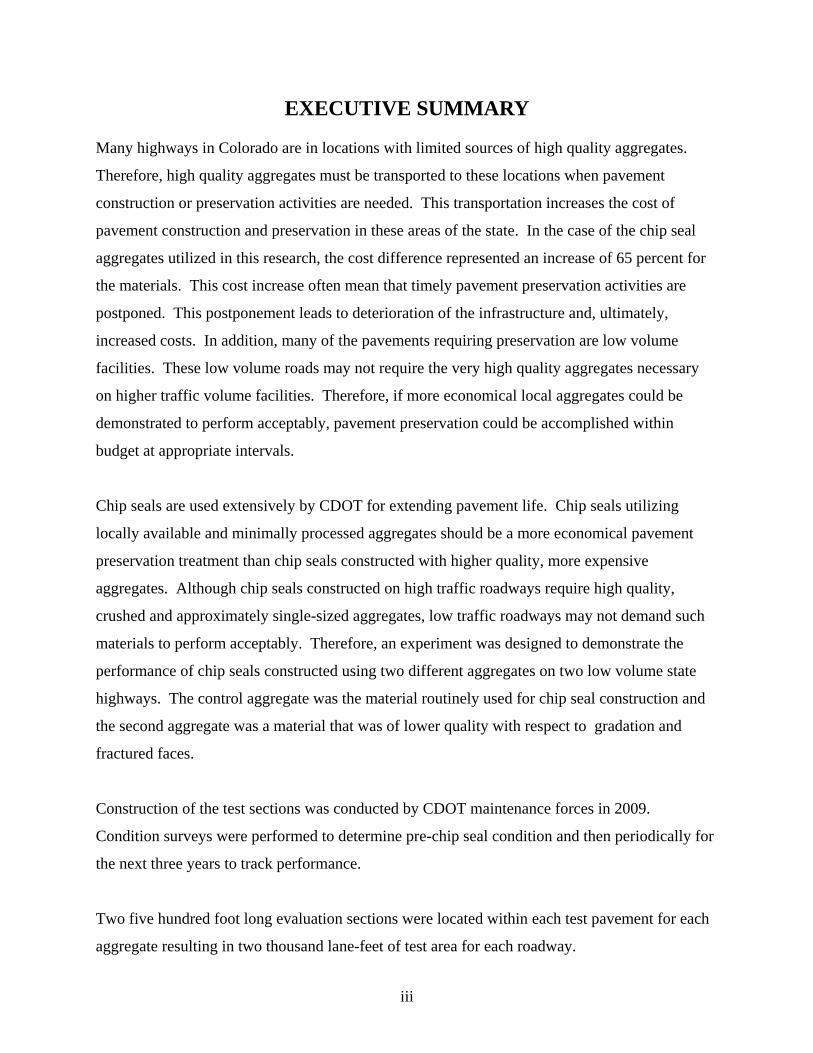
EXECUTIVE SUMMARY Many highways in Colorado are in locations with limited sources of high quality aggregates.
Therefore, high quality aggregates must be transported to these locations when pavement
construction or preservation activities are needed. This transportation increases the cost of
pavement construction and preservation in these areas of the state. In the case of the chip seal
aggregates utilized in this research, the cost difference represented an increase of 65 percent for
the materials. This cost increase often mean that timely pavement preservation activities are
postponed. This postponement leads to deterioration of the infrastructure and, ultimately,
increased costs. In addition, many of the pavements requiring preservation are low volume
facilities. These low volume roads may not require the very high quality aggregates necessary
on higher traffic volume facilities. Therefore, if more economical local aggregates could be
demonstrated to perform acceptably, pavement preservation could be accomplished within
budget at appropriate intervals.
Chip seals are used extensively by CDOT for extending pavement life. Chip seals utilizing
locally available and minimally processed aggregates should be a more economical pavement
preservation treatment than chip seals constructed with higher quality, more expensive
aggregates. Although chip seals constructed on high traffic roadways require high quality,
crushed and approximately single-sized aggregates, low traffic roadways may not demand such
materials to perform acceptably. Therefore, an experiment was designed to demonstrate the
performance of chip seals constructed using two different aggregates on two low volume state
highways. The control aggregate was the material routinely used for chip seal construction and
the second aggregate was a material that was of lower quality with respect to gradation and
fractured faces.
Construction of the test sections was conducted by CDOT maintenance forces in 2009.
Condition surveys were performed to determine pre-chip seal condition and then periodically for
the next three years to track performance.
Two five hundred foot long evaluation sections were located within each test pavement for each
aggregate resulting in two thousand lane-feet of test area for each roadway.

iv
Results of the experiment after three years of service indicate no significant difference in
performance between the aggregates. Distress in both pavements is limited to a return of
transverse and longitudinal cracks, but with low percentages of chip loss. Some limited areas of
the pavements also contain longitudinal flushing streaks where distributor nozzles may not have
been adjusted correctly and higher quantities of asphalt were applied.
Implementation
Based on this research, recommendations are provided regarding chip seal materials, design, and
construction methods to be used for low traffic volume pavements. It appears that locally
available, minimally processed aggregates can be successfully applied as chip seal aggregate on
low volume roadways.

v
TABLE OF CONTENTS
INTRODUCTION .............................................................................................................. 1
LITERATURE REVIEW ................................................................................................... 3
EXPERIMENT DESIGN .................................................................................................. 53
METHODOLOGY ........................................................................................................... 55
ANALYSIS ....................................................................................................................... 65
CONCLUSIONS............................................................................................................... 70
RECOMMENDATIONS AND OBSERVATIONS ......................................................... 71
REFERENCES ................................................................................................................. 72
APPENDIX A – PRECONSTRUCTION CONDITION SURVEYS .............................. 83
APPENDIX B – DRAFT SPECIFICATION FOR COVER COAT AGGREGATE ....... 86
APPENDIX C – DRAFT DESIGN METHOD FOR CHIP SEALS ................................ 88

1
INTRODUCTION Many highways in Colorado are in locations without high quality aggregates. Therefore, high
quality aggregates must be transported to these locations when pavement construction or
preservation activities are needed. This transportation increases the cost of pavement
construction and preservation in these parts of the state. Increased costs often mean that timely
pavement preservation activities are postponed. This postponement leads to deterioration of the
infrastructure and, ultimately, increased costs. In addition, many of the pavements requiring
preservation are low volume facilities. These low volume roads may not require the very high
quality aggregates necessary on higher traffic volume facilities. Therefore, if more economical
local aggregates could be demonstrated to perform acceptably, pavement preservation could be
accomplished at appropriate intervals and within budget. Both short and long term savings
would result.
Chip seals are used extensively by CDOT for extending pavement life. Chip seals utilizing
locally available and minimally processed aggregates may be a more economical pavement
preservation treatment than chip seals constructed with higher quality, more expensive
aggregates. Although chip seals constructed on high traffic roadways require high quality,
crushed and approximately single-sized aggregates, low traffic roadways may not demand such
materials to perform acceptably. Therefore, an experiment was designed to demonstrate the
performance of chip seals constructed using two different aggregates on two low volume state
highways. The control aggregate was the material routinely used for chip seal construction and
the second aggregate was a material that did not meet specifications for gradation or fracture.
Objectives
1. Construct chip seal test and control sections using locally available and minimally
processed aggregates and document the performance of these pavements for three
consecutive years.
2. Develop and/or adopt monitoring and documentation procedures for evaluating the
performance of the test sections.

2
3. Develop or adopt a design procedure, aggregate specifications, and construction
guidelines for chip seals constructed with local, minimally processed aggregates on low
traffic volume roadways.

3
LITERATURE REVIEW
There is a significant amount of information available on chip seal design, construction and
performance. From two design methods by Hanson in New Zealand (Hanson, 1934-1935) and
Kearby (Kearby, 1953) in Texas, most methods used today can be traced (McLeod, 1960, 1969;
Potter and Church, 1976; Marais, 1981; Epps, 1981). These methods are essentially based on the
concept that aggregate in a chip seal should be as one-sized as possible and that embedment of
the aggregate in the asphalt binder should occupy a specific percentage of the aggregate
dimension. How the aggregate dimension is determined and how the volume of asphalt binder is
calculated vary between methods but usually require measuring the gradation of the aggregate in
order to obtain the average least dimension (ALD) in the case of the Hanson method or the unit
weight, specific gravity and spread quantity in the case of Kearby. The shape of the aggregate is
considered important and is measured using the Flakiness Index in the case of the Hanson
method and the percent embedment is varied as a function of traffic for both methods. However,
although both of these methods are rational procedures, based on sound engineering principles,
they have been shown to produce different results when applied to the same aggregates and
emulsions on the same pavement (Shuler, 1998). An evaluation of the most evolved version of
both design methods is proposed in the Research Plan to determine which design process should
be recommended at the conclusion of this research.
Once the chip seal has been designed, how it performs during construction and in early life under
traffic is the greatest concern. Loss of chips during construction leads to construction delays and
loss of chips during early trafficking may lead to vehicular damage. Therefore, reducing this
potential has been a focus of research. Benson (Benson and Gallaway, 1953) evaluated the
effects of various factors on the retention of cover stone on chip seals. Among other factors this
study evaluated the effects of cover stone and asphalt quantity, aggregate gradation, time
between asphalt and aggregate application, and dust and moisture content of chips on retention
of cover stone. The type of binder used in the chip seal can have an effect on performance.
Studies have been conducted to measure binder viscosity as function of chip size, precoated or
not, damp or dry (Kari, 1962; Major, 1965; Kandhal, 1991) and make recommendations
regarding the optimum consistency for desired performance. In addition, the performance of the

chip seal
substrate
penetrati
early chip
simulator
The perfo
Temple,
Selecting
There is
dependen
types of t
life. Whe
desired li
applied to
on specif
coat meth
Table 1. Asphalt
after long te
pavement.
on is practic
p retention h
rs (Kari, 196
ormance of c
2003; Chen,
g Appropria
a need to ide
nt on the con
treatments a
en placed at
ife and perfo
oo late are in
fics in the lit
hods.
Summary oConcrete P
erm trafficki
A process o
ced in the UK
has been don
65; Shuler, 1
chip seals ha
, 2003; Jahre
ate Pavemen
entify when
ndition of the
re likely onl
the right tim
ormance of t
neffective. A
terature exce
of the Perfoavements. (
ing can be af
of evaluating
K and Africa
ne using labo
990; Stroup
as been repo
en, 2004; Gr
nt to Chip S
it is “best” t
e pavement a
ly to be effec
me, a chip sea
the pavemen
Although thi
ept ranges of
ormance of S(Geoffroy, 1
4
ffected by th
g the ability o
a (Hitch, 198
oratory abras
-Gardiner, 1
rted by man
ransberg, 200
Seal
to apply chip
at the time o
ctive when p
al becomes a
nt. Chip seals
is general ru
f time as sho
Selected Pre1996).
he properties
of the substr
81; Colwill,
sion tests, im
1990; Davis,
ny (Jackson,
05).
p seals. Trea
of treatment
placed at cert
a cost-effect
s applied too
ule is self-evi
own in the ta
eventive Ma
s of the cove
rate pavemen
et al., 1995)
mpact tests, a
1991).
1990; Sebaa
atment perfor
application,
tain times in
ive means o
o soon add li
ident, there i
able below fo
aintenance
er stone and t
nt to resist ch
. Predicting
and traffic
aly, 1995;
rmance is gr
and differen
n a pavement
f attaining th
ittle benefit a
is little avail
or various se
Treatments
the
hip
g
reatly
nt
t’s
he
and
lable
eal
s for

Further a
applicatio
Table 2.
There are
apply chi
research
One met
maximiz
actual va
Index (EI
computed
individua
individua
fraction o
analysis by G
on chip seals
Single App
e few studies
ip seals; alth
continues to
thod for iden
es benefit w
alues of the b
I) has been i
d B/C ratios
al B/C ratio (
al B/C ratio i
of the maxim
Geoffroy pro
s as shown i
plication Ch
s that have s
hough a num
o study it (NC
ntifying timi
while minimiz
benefits/cost
introduced (N
to a 0 to 100
(i.e., the rati
is assigned a
mum EI.
ovides some
n the table b
ip Seal Perf
successfully
mber of comp
CHRP Repo
ng is based o
zing costs is
s (B/C) ratio
NCHRP Rep
0 scale by co
io associated
an EI of 100
5
indication o
below.
formance an
determined h
pleted studies
ort 523, 2004
on an analys
the most eff
os more mea
port 523, 200
omparing all
d with the op
, and all othe
of performan
nd Cost Dat
how to ident
s have exam
4).
sis of benefit
ffective timin
aningful, the
04). The EI
l B/C ratios
ptimal timing
er B/C ratios
nce and cost
ta. (Goeffro
tify the optim
mined this iss
t and costs. T
ng scenario.
concept of a
normalizes a
with the ma
g scenario). T
s are represe
for single
oy, 1996).
mal time to
sue and other
Timing that
To make the
an Effectiven
all individua
aximum
The maximu
ented as a
r
e
ness
ally
um

The EI is
where:
E
(B
(B
sc
i
Of course
has less u
Chip seal
prevent m
tree has b
authors s
Figure 1
s computed f
EIi = EI assoc
B/C)i = B/C
B/C)max =
cenarios, and
= Index asso
e, identifyin
utility.
ls are applie
moisture intr
been propose
suggest that f
. (Zimmerm
for each timi
ciated with t
ratio associa
Maximum
d
ociated with
g the benefit
d to provide
rusion. Assu
ed to determ
for traffic ov
man, & Pesh
ing scenario
the ith timing
ated with the
of all of th
the current t
t can be diff
e increased fr
uming moistu
mine when to
ver 5000 AD
hkin, 2003).
6
using the fo
g scenario (d
e ith timing
he B/C ratio
timing scena
ficult to quan
friction or to
ure intrusion
use chip sea
DT, chip seal
ollowing equ
dimensionle
scenario,
os associate
ario (NCHR
ntify, and wi
seal the surf
n is be contr
als or other s
ls should not
uation:
ss),
ed with the
RP Report 52
ithout this, th
face of aspha
rolled the fol
sealing meth
t be used.
different ti
23, 2004).
he above ana
alt pavemen
llowing deci
hods. These
iming
alysis
nts to
sion

7
Al-Mansour and Sinha (1994) used regression analysis to determine a functional relationship
between the immediate gain in PSI (pavement serviceability index) and the PSI at the time of
application of a chip seal. The authors note that the immediate gain in PSI represents the change
in PSI estimated within one year of undertaking a chip seal activity. The equation describing the
relationship is:
ΔPSI= 0.3325*(PSI -1.433)
where:
ΔPSI = gain in pavement serviceability owing to chip seal activity, and
PSI = PSI at time of chip seal application.
Al-Mansour & Sinha (1994), developed a model for the cost (in $ per lane-mile) of performing a
chip seal. The cost model is based on the pavement condition at the time the chip seal is
performed. The logarithmic equation shown below is based on 34 observations and has a
correlation coefficient (R2) of 0.3079:
Log SC =3.6101+(-0.1034 * PSI)
where:
SC = cost of performing chip seal ($ per lane-mile), and
PSI = pavement serviceability index at time of chip seal.
A life cycle cost analysis was also performed in this study. The results showed that for optimal
cost savings when considering total costs (agency costs and vehicle operating costs), chip seal
applications should be applied before the PSI value drops below 3.0.
Abdullah, Sinha, & Kuczek found that chip or sand seals only provided adequate performance on
low volume roads if applied at advanced stages in the pavement life.
Hicks, et al., provide the following decision tree for selection of various treatments depending on
pavement condition. Again, note that chip seals are recommended only when traffic levels are
below 5000 ADT.

Figure 22000)
A similar
2. Decision T
r decision tre
Tree for Sele
ee is offered
ecting Preve
d by these au
8
entive Main
uthors depend
ntenance Te
ding on distr
echniques (H
ress level as
Hicks, et al.
shown belo
,
ow:

Figure 32000)
The main
C
P
ox
R
re
S
ad
D
co
D
. Distress L
n criteria add
Conventional
olymer-Mod
xidation.
Rubberized c
eflection cra
pecial binde
ddress speci
Distresses suc
onventional
Deformation,
Level Preven
dressed by th
l chip seals a
dified Emuls
hip seals cur
cking.
ers such as as
fic distress m
ch as crackin
or hot applie
, rutting and
ntive Mainte
he varying ch
are used on s
sion (PME) c
re quickly, r
sphalt rubbe
modes.
ng, flushing,
ed chip seals
shoving can
9
enance Deci
hip seal type
structurally s
chip seals ar
estore skid r
er and polym
, and base fa
s.
nnot be addre
ision Tree (
es are:
sound pavem
re used to co
resistance on
mer modified
ailures canno
essed with c
(Hicks, Seed
ments with m
orrect ravelin
n worn surfa
d asphalt may
ot be address
chip seals of
ds, & Peshk
minimal crac
ng and pavem
aces and resi
y be used to
sed with
any kind.
in,
king.
ment
st

Table 3 l
mechanis
Table 3. (Caltran
Once a p
needed to
E
E
E
E
E
D
D
(from NC
Rational
Binder A
The resid
performa
lists appropri
sms. Genera
Binder/Chins Maintena
avement has
o optimize p
Evaluate surf
Evaluate traff
Evaluate clim
Evaluate and
Evaluate aggr
Determine bin
Determine ho
CHRP Synth
l Constructi
Application
dual binder a
ance. Enough
iate binder/c
ally, chip sea
ip Seal Comance Techni
s been select
performance:
face texture;
fic condition
matic and sea
select type o
regate select
nder applica
ow many hou
hesis 342, 20
ion Practice
application r
h binder mus
chip seal com
als are not us
mbinations fcal Advisor
ted for a chip
:
ns: volume, s
asonal charac
of chip seal;
tion;
ation rate; an
urs per day a
005).
e
ate is one of
st be present
10
mbinations fo
sed on roads
for Addressiry Guide, 20
p seal the fol
speed, percen
cteristics;
nd
are available
f the most im
t to hold the
for addressin
with AADT
ing Specific003)
llowing wel
ntage of truc
e for construc
mportant fact
aggregate in
ng various di
T > 40,000.
c Distress M
l known req
cks, etc;
ction operati
tors affecting
n place, but n
istress
Mechanisms
quirements ar
ions.
g chip seal
not so much
re
h that

the binde
ensures t
based on
as shape,
much bin
at or near
It is most
proper am
applicatio
bar (Was
If the bin
applied to
controls w
vehicle. T
are norm
being ref
Distribut
bar outpu
used inte
where:
S
G
W
R
9
er fills, or is
he desired su
the average
, density, abs
nder flows in
r the paveme
t important t
mount of asp
on. The nozz
shington Stat
nder is applie
oo thin, exce
which can re
This results
mally used on
filled by the
tor speed for
ut is depende
erchangeably
f = distributo
Gt = spray ba
W = sprayed
R = rate of bi
= conversio
forced by tra
urface textur
e least dimen
sorption and
nto existing v
ent surface (
that the distr
phalt. The ba
zle size, spac
te Departme
ed too heavil
essive chip l
egulate the p
in a constant
n a seal coat
tanker (Jani
r the desired
ent on the ty
y with x valu
or speed (ft/m
ar output (gal
width (ft),
inder applica
on factor from
affic action t
re is maintai
nsion of the a
d grading. Th
voids in the
(Caltrans Div
ributor be pro
ar and its noz
cing, and an
ent of Transp
ly, flushing o
loss will resu
pressure of th
t application
project. This
sch & Gailla
asphalt rate
ype of the bin
ue in this calc
min),
l/min),
ation (gal/ sy
m sy to sf.
11
to cover the
ined. Binder
aggregate, as
he optimum
pavement, a
vision of Ma
operly adjus
zzles must b
ngle in relatio
portation, 20
of the aspha
ult. Most dis
he material t
n rate, regard
s allows one
ard,1998).
can be calcu
nder sprayer
culation as x
y), and
aggregate. T
r application
s well as oth
binder conte
and how muc
aintenance, 2
sted and oper
be properly s
on to the bar
003).
alt in the whe
stributors use
to compensa
dless of trave
e to continue
ulated from
r used. W is t
x = W (Gran
The proper a
n rates can b
her aggregate
ent also depe
ch binder is
2003).
rated to unif
set to obtain
r determine t
eel paths wil
ed today hav
ate for the sp
el speed. Tw
e to work wh
following eq
the width of
nsberg, et.al.
amount of bi
e determined
e properties
ends on how
already pres
formly apply
a uniform
the height of
ll result. If
ve computeri
peed of the
wo distributo
hile the other
quation. Spr
f the shot and
, 2004):
inder
d
such
w
sent
y the
f the
ized
rs
r is
ay
d is

12
In this analysis, the production rates of the chip spreader and asphalt distributor are taken to be
equal as observed in practice (Gransberg et al., 1999). Therefore, the combined production rate
of the system is expressed as the distributor production rate. If the stipulated minimum rolling
time requirement was being strictly enforced on a TxDOT chip seal project, the rollers were
observed to be lagging behind the asphalt distributor and aggregate spreader. If the equipment
spread moved up to the next shot before the rollers had completed their linger time, the rollers
tried to catch up, and failed to provide the minimum rolling time called for in the contract. The
computations below prove that rollers cannot keep up with the distributor under the mentioned
assumptions. This example shows it is extremely important that a sufficient numbers of rollers be
available to provide a rolling production rate that matches or exceeds the production of the
distributor (Gransberg, et al., 2004).
An accurate and uniform rate of application of bituminous binder is an important element in
undertaking effective sprayed seal work. New procedures have now been introduced in Australia
that set national standards for sprayer calibration and central administration of calibration test
certificates. Figure 3 describes a procedure for the calibration and certification of bitumen
sprayers in Australia. (Austroads work tips, 2002)

Figure 3
One stud
distributo
that prov
could pro
One inter
cent for f
condition
. Calibratio
dy (Shuler, 1
ors. This stu
vided special
oceed.
resting study
fast or down
ns (Hitch, 19
on and Cert
998) describ
udy was base
lly machined
y suggests th
nhill traffic c
981).
ification of
bed the calib
ed on the pra
d, calibrated
hat binder ap
onditions an
13
Distributor
ration of the
actice in the
nozzles to c
pplication rat
nd decreased
rs in Austra
e nozzles ins
Brownwood
contractors b
tes should be
d by 10 per c
alia
serted into co
d District of
before chip s
e increased b
cent for slow
ontractor
f the Texas D
eal operation
by 10–15 pe
w or, uphill
DOT
ns
er

14
One method for estimating the binder content is as follows (Caltrans Division of Maintenance,
2003):
B = [0.40(H) × T × V + S + A + P] / R
where:
B = Binder Content (l/m2),
H = average least dimension (ALD) (m),
T = Traffic Factor,
V = Voids in Loose Aggregate (%),
S = Surface Condition Factor (l/m2),
A = Aggregate Absorption (l/m2),
P = Surface Hardness Correction for Soft Pavement (L/m2), and
R = Percent Binder in the Emulsion (%).
For projects in areas maintained by snowplows, the binder content is calculated using both the
median particle size and the average least dimension (ALD). The average of these two results is
used as the starting application rate in these areas (Caltrans Division of Maintenance, 2003)
Asphalt distributors must be calibrated and adjusted prior to chip seal operations to obtain a
successful chip seal. Figures 4 and 5 show the influence of angle for nozzle discharge and the
influence of spray bar height.

Figure 4
Figure 5
4. Influence
5. Influence
e of Angle fo
of Spray Ba
or Nozzle Di
ar Height(M
15
ischarge (M
McLeod, 196
McLeod, 196
60)
60)

16
Every bituminous distributor should be calibrated periodically. For highway departments whose
specifications specifically require this calibration, the items calibrated or checked include the
following:
Distributor tank
Pump
Spray bar and spraying system
Transverse distribution of binder applied by the spray bar
Hydraulic pressure in the spray bar
Road speed indicator
Opening and closing of the spray bar
Thermometer
Field test for uniformity of bitumen application
The following are examples of the requirements of tolerances that have been specified for some
of these items (McLeod, 1960):
Pump output under all conditions shall not vary from the mean by more than ±5%.
Hydraulic pressure in the spray bar when spraying shall not vary from any given
predetermined pressure by more than ±5%.
Air Temperature
The success of a seal coating operation is highly dependent on the weather conditions while
spraying the binder and the placing the aggregate. Asphalt emulsions break slowly in cold or
damp conditions. An air temperature of 55oF (10oC) in the shade and rising is often used as
guideline for seal coating (Croteau, et al., 2005).
Effects of weather can have a marked effect on the quality of a seal coat. These variations can be
cool temperatures, hot temperatures, rain, wind, and variations can be cool temperatures, hot
temperatures, rain, wind, and humidity (Washington State Department of Transportation, 2003).
Griffith, et al., 2000 quotes that initially, it was speculated that asphalt cement chip seals could
be applied over a wider range of temperatures than emulsified asphalt seals. However, cool

17
temperatures and pavement temperatures (under 13°C (55°F)) may impact embedment and
bonding.
On the actual day when chip seals are constructed the weather should be clear and warm. In
general, pavement surface temperatures should be 10°C (55°F) and rising, and the humidity
should be 50% or lower (Caltrans Division of Maintenance, 2003).
Sealing in hot weather at air temperatures above 90oF may create construction problems with
emulsion chip seals. At these elevated temperatures, the asphalt is less viscous and does not
develop full strength until cooler. Traffic control, pilot vehicles and a dry choke stone application
also help protect new chip seals in hot weather (Washington State Department of Transportation,
2003).
Cool air or pavement temperatures (under 55-60oF) can affect the binding characteristics of the
asphalt by making it less tacky (sticky) and/or increasing its viscosity. This can result in a poorer
bond between the existing pavement, the asphalt, and the rock. Further, it can reduce the
embedment of the rock into the asphalt. In either case, it can result in extensive rock loss. A
moderate increase of the asphalt application rate in cooler conditions improves rock retention,
but increases the possibility of flushing or bleeding when the weather warms (Washington State
Department of Transportation, 2003).
Seal coating must be postponed, if there is rain or the threat of rain. If it rains several steps may
help save the seal: 1) close the road to traffic (impractical), 2) reduce the speed of traffic, or 3)
apply additional cover stone (Washington State Department of Transportation, 2003). Any
rainfall immediately before, during or after the construction of the chip seal will contribute to
failure of the treatment. Thus, placement of chip seals should be avoided during such conditions
(Caltrans Division of Maintenance, 2003).
Sealing during high winds should be discouraged. High winds can distort the spray pattern from
the distributor and prevent a uniform asphalt application. High winds can blow dust onto the road
surface to be sealed or onto fresh emulsion before the cover rock can be applied. Wind may

18
cause the emulsion spray to be diverted and compromise uniformity of application rate.
However, a gentle breeze will assist in accelerating cure times (Caltrans Division of
Maintenance, 2003).
The set time for asphalt emulsions is increased when humidity is high. Late spring to early fall
are the seasons most likely to have weather that is favorable for chip seal construction.
Generally, there are also more daylight hours during this time of the year. Although daytime
temperatures may be warm, cool overnight temperatures, typical during the spring and the fall
and in mountainous areas, will increase the cure time for asphalt emulsions (Washington State
Department of Transportation, 2003). Some recommendations for application temperatures for
asphalt emulsions are shown below:
Table 4. Recommendations for Application Temperatures for Asphalt Emulsions (Washington DOT, 2003)
Emulsion Type Distributor, min F Distributor, max F
CSS-1, CSS-1h 70 140
CRS-1, CRS-2, RS-1, RS-2 125 185
It may be desirable to maintain the temperature somewhat below the maximum recommendation
to reduce the danger of breaking the emulsions too soon (Washington State Department of
Transportation, 2003).
Aggregate Spreading
An aggregate spreader is used to place a uniform application of cover aggregate onto the freshly
applied asphalt emulsion. Aggregate spreaders are either self-propelled or attached to the dump
truck tail gate. Some self-propelled aggregate spreaders have the capability of placing the
aggregate onto the roadway at variable widths. The self-propelled spreader pulls the supply
trucks. The aggregate is placed into a receiving hopper and it is conveyed towards the front of
the machine to a system that drops the aggregate from a constant height onto the roadway
(Croteau, et al., 2005).

19
The chip spreader must be able to apply a uniform, even layer of aggregate across the width of
the pavement to be chipped. A study by Griffith, et al., 2000, mentions a chip spreader equipped
with computerized controls that adjust the opening and closing of the gates based on the speed of
the spreader (Griffith, et al., 2000).
Some specifications indicate the application of aggregate should follow the binder application by
no more than 90 seconds in order to obtain the best aggregate retention. A good visual check is
that the spreader should be no more than 100 feet (30 meters) behind the distributor truck
(Caltrans Division of Maintenance, 2003). However, these recommendations may not always be
true depending on weather and materials conditions. One method to determine when to apply
chips is to cast a handful of chips onto the fresh emulsion surface. When the chips do not roll
over on impact, but stick to the surface, the chip spreader should apply the chips.
Calculation of the design aggregate application rate is based on determining the amount of
aggregate needed to create an even, single coat of chips on the pavement surface. The amount of
cover aggregate required can be determined using the following equation (Caltrans Division of
Maintenance, 2003):
C= (1 - 0.4V) × H × G × E
where:
C = Cover Aggregate (kg/m2),
V = Voids in Loose Aggregate (%),
H = ALD (mm) ,
G = Bulk Specific Gravity, and
E = Wastage Factor (%).
Another method, called the Board Method, uses a one square yard piece of plywood with 1 x 2
lumber nailed to the perimeter. The chips planned for use in the chip seal are spread onto the
board one stone thick until no more chips can be squeezed onto the board. The board is weighed,
and the amount of aggregate is calculated in pounds per square yard (Epps, et al. ,1981).

20
Gates on the aggregate spreader should be adjusted to apply a uniform application of aggregate.
However, the gates in line with the wheel paths may be opened slightly more to give a heavier
cover in these areas. This is the area of the greatest initial wheel loading. A slightly heavier
aggregate cover prevents pick up on the wheels of the chip spreader and aggregate trucks. If
there is an auger roller in the aggregate hopper it should not be bent or out of round. This can
cause corrugations (Washington State Department of Transportation, 2003).
When constructing a seal coat, the cover aggregate should be applied so it is only one-layer
thick. Applying too much aggregate not only increases the chance of windshield damage to
passing vehicles but can also dislodge properly embedded stones. The exception to this is in
areas where extensive stopping and turning movements take place, such as intersections and turn
lanes. Using a slight excess of aggregate, about 5 or 10 percent, can help reduce the scuffing
caused by vehicle tires turning on the fresh, uncured, seal coat. (Janisch & Gaillard1998).
Hitch, 1981, and others (Shuler, 1998) mention a procedure used to measure the rate of spread
where light metal trays approximately 10 mm deep and 0.1m2 in area were used to check rates of
spread. Three trays were placed for each 200m run of the distributor and the weight of binder
deposited on each was recorded. The rate of spread, taken as the mean of three trays, assisted in
the calibration of the machine and verified the rate of binder actually sprayed. The unsealed
squares beneath the trays were repaired by hand in the earlier trials but subsequently they were
mowed to remain thus providing a comparison between the original and the resealed surface.
Unsealed squares were always repaired during work on new bases. The poor condition of some
of the distributors sometimes prevented the required rates of spread from being obtained
consistently.
To achieve maximum sustained production, the production rates of the chip spreader and the
rollers must be greater than or equal to the sustained production rate of the distributor. The
distributor controls the overall production because no other piece of equipment can begin to
produce its function until the distributor has applied the binder to the surface. Therefore, to
ensure a high standard of quality control, all other equipment systems must be able to keep up

21
with the production of the distributor (Gransberg, et al., 2004). Observations in the field confirm
that the distributor sets the pace for the rest of the equipment spread (Gransberg, et al., 1999).
Rolling
Rollers embed the aggregate into the asphalt binder and orient the chips on their flat side. It is
important to have enough rollers to complete the rolling quickly. The chips need to be embedded
into the emulsion before it ‘breaks’ or sets. Normally, a minimum of three rollers will be
required. The first two, drive side-by-side rolling the outer edges. The third roller then follows
closely behind, rolling the center of the lane. It is very important for the rollers to travel slowly,
no more than 5 miles per hour (8 km/hr), so the chips are correctly embedded into the binder.
(Janisch & Gaillard1998). Rolling can be standardized on the basis of certain number of roller
passes, or a rolling time in hours, for each 250 gallons of binder sprayed (Potter & Church,
1976).
Pneumatic rollers are preferred for rolling chip seals because they tend not to fracture the rock
and will roll into depressions or wheel ruts. Rolling of a seal coat is done to orient the rock.
Rollers should be operated at speeds under 5 miles per hour so the rock is set, not displaced. The
number of rollers required for a seal coat project depends on the spread of the operations. It takes
two to four passes of the roller to set the rock. These rollers should have tire pressures of 45 psi
or more (Washington State Department of Transportation, 2003)
Figure 6 shows the required number of rollers versus specified rolling linger time (1.0 yd2/h
50.84 m2/h) in a study by Gransberg, et al., 2004.

Figure 6
Well-tim
very imp
their flat
the rollin
A Wisco
increased
which su
embedme
chip seal
typically
three roll
twice as m
(Gransbe
Rollers w
should be
6. Linger Tim
med rolling is
portant to qui
side before
ng occur with
nsin DOT st
d embedmen
ubsequently i
ent. Howev
surface. Tw
occurs outs
lers on a twe
much rolling
erg, et al., 20
with ballast a
e 4 to 6 tons
me Versus N
s even more
ickly roll the
the asphalt c
hout delay (G
tudy found th
nt, as expecte
increases the
er, rolling to
wo studies co
ide and betw
elve foot lane
g between th
004)
are very usef
(4500 to 54
Number of R
critical in co
e panel to em
cools too mu
Griffith, et a
hat rolling a
ed. This is be
e amount of
oo soon can c
onducted in
ween the whe
e width. The
he wheel path
ful in assurin
400 kg) with
22
Rollers requ
ooler temper
mbed the chi
uch. Also, du
al., 2000).
as soon as po
ecause as the
rolling energ
cause pickup
Texas and M
eel paths wh
e use of four
hs as three r
ng sufficient
a correspon
uired (Gran
ratures and s
ips into the b
uring cooler
ossible after
e binder coo
gy required
p on the tire
Minnesota fo
here roller co
r rollers prov
rollers accord
t contact pres
nding tire pre
nsberg, et al
shaded areas
binder and to
weather it is
application o
ols, the visco
to achieve th
s of rollers,
ound that agg
overage is le
vides a unifo
ding to Gran
ssure. The b
essure of 90
l., 2004)
. In shade, it
o orient them
s essential th
of the binder
osity increase
he same
damaging th
gregate loss
ss when usin
orm coverage
nsberg
ballasted wei
psi (600 kPa
t is
m on
hat
r
es,
he
ng
e and
ight
a).

23
Tires must have a smooth tread, should not vary more than 7 psi (50 kPa) in pressure, and should
not wobble during operation. Rollers should follow aggregate spreading by no more than 500 ft
(150 m) and should not be operated at more than 6 mph (10 kph). The rolling pattern will depend
on the number of rollers used. A minimum of two rollers should be used to cover the full width
of the chip spreader. When two rollers are used, three passes are sufficient; one forward, one in
reverse, and the final pass extending into the next section according to California (Caltrans
Division of Maintenance October 2003).
Sweeping
Sweeping the chip seal is recommended before, after, and sometimes during the chip seal
operation. After the chip seal has been constructed, excess aggregate must be broomed off to
minimize whip-off by traffic. Sweeping is done using rotary brooms with nylon or steel bristles
or with vacuum mobile pickup brooms. The broom should not be worn, and should not be
operated in such a manner that removes embedded aggregate. Mobile pickup brooms are usually
capable of picking up aggregate and storing it. Sometimes so-called “kick brooms” are used.
These brooms move the aggregate into a windrow so that is can be collected, but they often
generate dust and may sweep aggregate into gutters. Sweeping can generally be done within 2 to
4 hours after sealing. Hot applied chip seals can be swept within 30 minutes while conventional
chip seals can be swept in 2 to 4 hours. A flush coat shall be applied after brooming to eliminate
further rock loss and improve durability prior to opening the pavement to uncontrolled traffic
(Caltrans Division of Maintenance October 2003).
It is desirable to broom during the cool period of the day. If the rock is being dislodged, the
brooming should be delayed until the asphalt has cured further or the weather is cooler. The
gutter broom on a pick-up sweeper should not be used because it may exert too much force and
damage the chip seal (Washington State Department of Transportation, 2003).
Recent research (Shuler 2011, Howard 2011) indicates that moisture content in the chip seal is
directly related to chip adhesion. This work suggests that a moisture content of approximately
15 percent is the limit below which the seal should resist dislodgement of chips due to brooms
and traffic.

24
Traffic Control
The aggregate layer in a freshly placed chip seal is often fragile for several hours after the
completion of rolling and sweeping. Therefore, high speed vehicular traffic may dislodge
aggregates during the first few hours after the placement of the seal coat. Therefore, reduced
speeds are needed to avoid flying chips and, have been shown, to aid in the embedment of the
chips in the new seal (Shuler, 1998). Speed enforcement will be necessary to ensure that traffic
adheres to the speed limitations (Croteau, et al., 2005).
After chipping, pilot cars should be used for between 2 and 24 hours to ensure that traffic speed
is limited to less than 20 mph (30 kph) (Caltrans Division of Maintenance, 2003). The primary
purpose of the pilot car is to control the speed of the traffic through the project. In addition, the
pilot car can move traffic back and forth across the roads to prevent traveling in the same wheel
paths. This traffic will supply some secondary pneumatic tired rolling and helps embed the
aggregate further (Washington State Department of Transportation, 2003, Gransberg, 2005).
Wet Weather Adhesion Problems
Most aggregates prefer to be coated with water rather than with asphalt. However, this trend
may be reversed in two ways: 1) by making the chip surface less attractive to water than to
asphalt by precoating the chip with asphalt, or 2) by making the asphalt “wetter” than water by
treating the asphalt with an antistripping additive. Although both of these processes have been
reported (Major, 1965) use with emulsions may not be appropriate since precoating aggregates
with asphalt may interfere with the emulsion setting process. However, some evaluation may be
warranted if antistripping additives could be added to the base asphalt prior to emulsification.
General Construction Guidelines
In a study done by Jackson (1990) statewide uniformity of construction inspection procedures
and focus on the following basic guidelines of chip sealing have been suggested (Jackson, 1990):
Use of clean single sized aggregates: the existing ½” to ¼”. Washington State
Department of Transportation (WSDOT)aggregate specification works well.

25
Chip seal yields should be tightly controlled to minimize waste and windshield damage:
the field review indicated chip rates of 35-60 lb/sq yd were used where 25-30 lb/sq yd
was more than adequate in all cases for ½” ¼” chips.
Asphalt emulsion rates should be such that the chips embed about 50-70 percent into the
asphalt film: for ½” to ¼” chips this rate is about 0.45 gal/sq yd were used, in the past,
with almost all of the lower application rates losing chips.
A choke stone course of ¼”-0 helps to complete the aggregate matrix and lock down
single-sized chips when applied immediately after the initial rolling. The field review
indicated that chocker stone was used sporadically with mixed results, most likely caused
by high-chip rates s and inconsistent chocker stone application procedure.
When emulsions are used, rolling that embeds chips or lays them on their flat side must
occur immediately but in no case longer than the time it takes the emulsion to set. The
standard specifications governing rolling should indicate the time limit.
Brooming should be accomplished as soon as possible after the emulsion has set up.
Brooming can usually be accomplished the morning after the shot. The existing
specification called for final brooming after 5 days.
When embedment is low and there are signs of chip loss after brooming or exposure to
traffic, a fog seal of CSS-one asphalt emulsion can be used to increase embedment and
eliminate or reduce winter chip loss.
The following steps can be taken to mitigate raveling according to Jackson (1990):
Use of preseals: A preseal is a light application of emulsion (0.15-0.20 gal/ sq yd) followed by a
light application ¼”or smaller chips (8 to 15 lb/sq yd). When construction prior to placement of
the seal coat over pavements that are dry, crack open, or have had recent hot mix patches, the
preseal provides a more uniform and less porous surface. This also results in a more consistent
final product. The preseal provides a cost-effective crack seal when the existing pavement has
excessive alligator cracking.
Effect of Traffic on Performance
Traffic plays a very important role in the performance of a chip seal. Therefore, it is necessary to
predict or measure the traffic volume as accurately as possible. Observations of the performance

26
of single chip seals indicate that the usual equivalency factors used in structural pavement design
for converting cars to equivalent single wheel loads do not apply in the case of chip seals. In fact,
cars are of little consequence in structural pavement design but they play an important part in the
performance of chip seals, as do trucks. If particular information becomes available of an
exceptional increase or decrease in the present traffic count, it should be taken into consideration
in the design calculation. (Benson & Gallaway, 1953).
Benson & Gallaway, 1953 studied and analyzed retention of chip seals for two types of
aggregates and four types of asphalt materials, all of which have given satisfactory field
performance. Following conclusions are warranted from the study: The proper quantity of a
given aggregate for a one course surface treatment is the quantity required to cover a square yard
one stone thick plus an allowance of 10 percent for spreading inaccuracy.
The experimental work reported here shows that the Kearby Method is a good procedure for
determining the asphalt quantity for a one course surface treatment. It is recommended, however,
that the broken line in the above figure be used for percentage of embedment for the smaller
sizes. Field quantities must also be adjusted for the expected absorption of the surface.
When asphalt cements are used as binders for surface treatments, it is important that the stone be
placed as soon as possible after the asphalt is applied. The harder asphalt cements hold the cover
stone more tightly, but initial retention is more difficult to obtain.
The grading of the aggregate has an important bearing on the amount of stone retained for a
given maximum size. Cover stone with a limited variation in grading will give highest retention
for a given quantity applied.
The retention of stone rolled in a wet condition is very poor. If however, the stone is allowed to
dry before rolling, reasonably good retention results.

27
Dust in the aggregates is an important cause of poor aggregate retention and in particular the dry
dusty condition is bad. Wetting dusty aggregates before application and allowing drying before
rolling reduces the effect of dust.
The retention was found to be slightly lower for RS-2 emulsion and RC-2 cutback on a gallon for
gallon basis, than for OA-230 asphalt cement for the aggregates and conditions used in this
experiment work. The differences do not appear to be significant.
For a given quantity of aggregates applied, the retention increases with increase in quantity of
asphlatic material for the all asphlatic material used and for the application rates studied. The
retention of wet stone by RS-2 emulsion was slightly greater than that for dry stone. The
retention of wet dusty stone was slightly less than dry stone. The above applies where a 24 hour
curing period under summer atmospheric conditions was provided.
Temperature is an important factor in the adhesion of stone to asphalt cements in surface
treatments. Limited studies indicated that heating the stone to 150-200oF would increase
retention for a given of stone and asphalt applied (Benson & Gallaway, 1953).
Hanson found that for a surface treatment that has carried considerable traffic, the cover
aggregate reaches its densest condition with about 20% voids. If enough asphalt binder has been
applied to more than fill this 20 per cent of void spaces, the excess binder accumulates on the
surface and causes flushing or bleeding. If too little binder is used, the cover stone is torn by
traffic because there is not enough binder to cement the aggregate firmly into place.
Considerable analysis of surface treatment samples, Hanson concluded that the optimum
bituminous binder content for a surface treatment or seal coat is just enough to fill approximately
two-thirds of the 20% of void space between the aggregate particles (McLeod, 1960). However,
these studies were done before the advent of polymer modified asphalts. These asphalts have
significantly higher consistency than unmodified asphalts and have been shown to not
necessarily flush in the wheelpaths when application rates rise (Shuler, 1998).

28
Aggregate Specifications
The best chip seal performance is obtained when aggregate has the following characteristics
(Caltrans Division of Maintenance, 2003):
Single-sized
Clean
Free of clay
Cubical (limited flat particles)
Crushed faces
Compatible with the selected binder type.
Aggregates must be damp for emulsion use.
The aggregate should be carefully analyzed to determine its unit weight, specific gravity, percent
of voids, and screen analysis. From the screen analysis the average particle size and effective mat
thickness of the aggregate is determined by multiplying each individual screen size by its
individual percentage and then obtaining the sum of the products. (Kearby, 1953).
Aggregate Cleanliness
Dusty and dirty aggregate ultimately lead to problems with aggregate retention. Asphalt binders
have difficulty bonding to dirty or dusty aggregate, causing the aggregate to be dislodged on
opening to traffic (McLeod 1969; Gransberg & James, 2005). It is recommended that the
aggregate be sprayed with water several days before the start of the project (Maintenance Chip
Seal Manual 2000, Gransberg & James, 2005). Washing chip seal aggregate with clean, potable
water before application may assist in removing fine particles that will prevent adhesion with the
binder. In addition, damp chips will assist the binder in wetting the rock, thus increasing
embedment (Maintenance Chip Seal Manual, 2000, Gransberg & James, 2005). In addition to
washing with water, petroleum materials are sometimes used to clean the aggregate before
application. Petroleum-based materials such as diesel fuel are commonly used to wash aggregate
in Australia and New Zealand (Sprayed Sealing Guide 2004; Gransberg & James, 2005).
Dust on the aggregate surface is one of the major causes of aggregate retention problems. Dust is
defined as the percentage of fine material that passes the No. 200 sieve. To improve the quality
29
of the material, the percentage of fines passing the No. 200 sieve should be specified as a
maximum of 1% at the time of manufacture (Janisch & Gaillard, 1998).
The cover aggregate for a seal coat should not have a dust coat. Better results are obtained if the
rock is damp when it is applied. The aggregate should be dampened in the stock pile
(Washington State Department of Transportation, 2003).
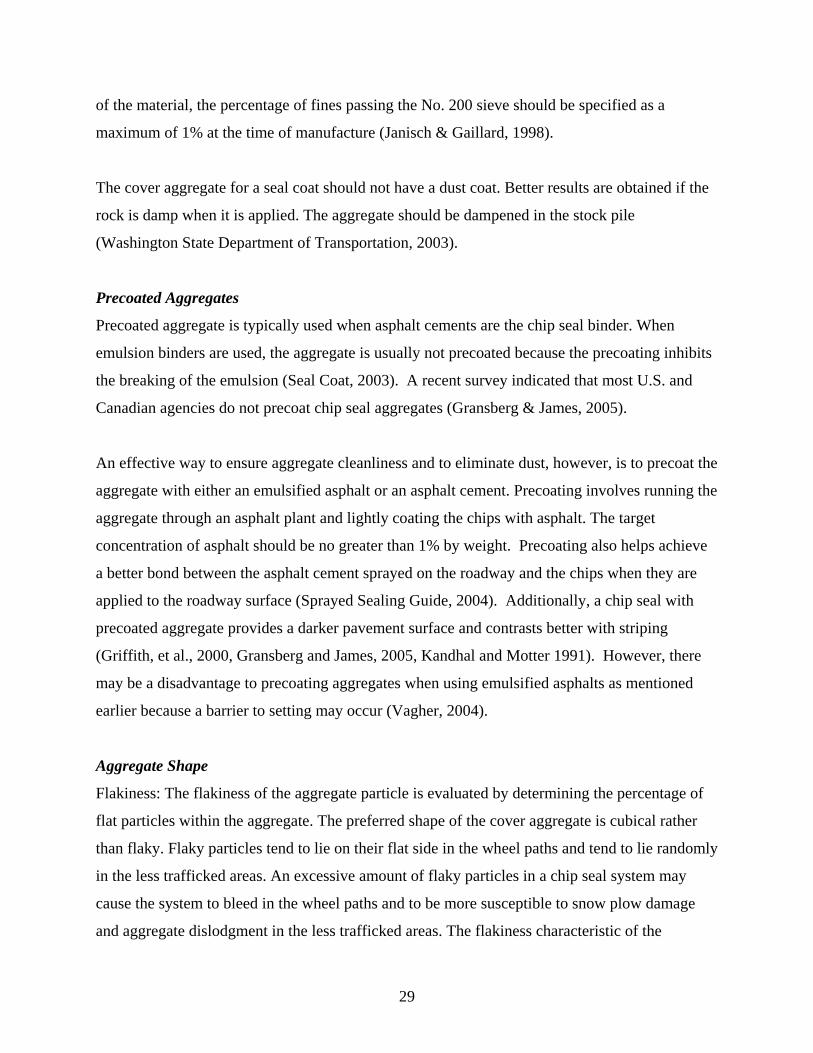
Precoated Aggregates
Precoated aggregate is typically used when asphalt cements are the chip seal binder. When
emulsion binders are used, the aggregate is usually not precoated because the precoating inhibits
the breaking of the emulsion (Seal Coat, 2003). A recent survey indicated that most U.S. and
Canadian agencies do not precoat chip seal aggregates (Gransberg & James, 2005).
An effective way to ensure aggregate cleanliness and to eliminate dust, however, is to precoat the
aggregate with either an emulsified asphalt or an asphalt cement. Precoating involves running the
aggregate through an asphalt plant and lightly coating the chips with asphalt. The target
concentration of asphalt should be no greater than 1% by weight. Precoating also helps achieve
a better bond between the asphalt cement sprayed on the roadway and the chips when they are
applied to the roadway surface (Sprayed Sealing Guide, 2004). Additionally, a chip seal with
precoated aggregate provides a darker pavement surface and contrasts better with striping
(Griffith, et al., 2000, Gransberg and James, 2005, Kandhal and Motter 1991). However, there
may be a disadvantage to precoating aggregates when using emulsified asphalts as mentioned
earlier because a barrier to setting may occur (Vagher, 2004).
Aggregate Shape
Flakiness: The flakiness of the aggregate particle is evaluated by determining the percentage of
flat particles within the aggregate. The preferred shape of the cover aggregate is cubical rather
than flaky. Flaky particles tend to lie on their flat side in the wheel paths and tend to lie randomly
in the less trafficked areas. An excessive amount of flaky particles in a chip seal system may
cause the system to bleed in the wheel paths and to be more susceptible to snow plow damage
and aggregate dislodgment in the less trafficked areas. The flakiness characteristic of the
30
aggregate is most often determined using the Flakiness Index. (Croteau, et al., 2005, Texas Test
Method Tex-224F).
The Flakiness Index by the Texas procedure is used to determine the percentage of particles in a
coarse aggregate material that have a thickness (smallest dimension) of less than 60 percent of
the average aggregate size. The least dimension of an aggregate is defined as the minimum
opening of a slot through which the aggregate can be passed. There are five slots in the plate for
five different size fractions of the aggregate. If the chips can fit through the slotted plate they are
considered to be flat. If not, they are considered to be cubical. The lower the Flakiness Index, the
more cubical the material is. The weight of material passing all of the slots is then divided by the
total weight of the sample to give the percent flat particles, by weight, or Flakiness Index. The
five slots in the plate are for the following:
• Slot 1: Material passing the 1 in. sieve (25 mm) but retained on the 3/4 in. sieve (19 mm).
• Slot 2: Material passing the 3/4 in. sieve (19 mm) but retained on the 1/2 in. sieve (9.5 mm).
• Slot 3: Material passing the 1/2 in. sieve (9.5 mm) but retained on the 3/8 in. sieve (6.3 mm).
• Slot 4: Material passing the 3/8 in. sieve (9.5 mm) but retained on the 1/4 in. sieve (6.3 mm).
• Slot 5: Material passing the 1/4 in. sieve (6.3 mm) but retained on the No. 4 sieve (4.75 mm).
The tolerance limits for the flakiness of the aggregate are based on traffic but generally should be
less than 30 (Croteau, et al., 2005).
Aggregate shape is typically characterized by angularity. As the orientation of the embedded
chip is important, cubical aggregate shapes are preferred because traffic does not have a
significant effect on the final orientation of aggregate (Janisch and Galliard, 1998).
Australian practice requires that 75% of the aggregate have at least two fractured faces (Sprayed
Sealing Guide, 2004). Rounded aggregates, as indicated by low percent fracture, are susceptible
to displacement by traffic because they provide the least interfacial area between the aggregate
and binder. The roundness of the aggregate will determine how resistant the chip seal will be to
turning and stopping movements. (Gransberg & James, 2005).

31
Gradation
Uniformly graded aggregates usually develop better interlocking qualities and provide lateral
support to adjacent particles, thereby preventing displacement from traction and friction of high
speed traffic. (Kearby, 1953). The gradation of the aggregate is assessed to determine the
average least dimension of an aggregate. The average least dimension of an aggregate is
influenced by the mean size of an aggregate. An aggregate is considered coarse if its gradation is
positioned in the lower part of the gradation band and fine if it is positioned in the upper part.
Accordingly, the mean size of the aggregate varies from course to fine gradations within the
same gradation band. The optimal binder spray rate for a single chip seal system may vary as
much as ten percent between a coarse aggregate and a fine aggregate even when both chips
comply with the same single-size gradation band. The impact of the aggregate gradation on the
binder rate is less for the secondary layers of multi-layer chip seal systems (Croteau, et al.,
2005).
Table 5 shows the recommended grading of aggregates for chip seals by Kearby from 1953.

Table 5.
Table 6 l
States.
Table 6.
Recommen
lists typical c
Examples o
nded Gradi
chip seal gra
of Chip Sea
ng of Aggre
adations take
l Gradation
32
egates for C
en from vario
ns in the U. S
Chip Seals (K
ous state DO
S (Gransbe
Kearby,195
OT manuals
erg & James
3).
in the United
s, 2005)
d
33
Uniform appearance and the best nonskid characteristics are obtained with an aggregate with few
fines. The removal of the fines fraction (usually ¼” or smaller ) from the chips results in a
uniformly graded surface (Washington State Department of Transportation, 2003).
A one-sized aggregate gradation produces a uniform pavement surface. However, without the
finer rock matrix, the one-sized rock has a tendency to roll under traffic. A choke stone applied
after the rolling, but before the seal is opened to traffic, can prevent this rock displacement
(Washington State Department of Transportation, 2003).
Aggregate should be free of excess material passing the No. 200) sieve. Usually, less than 1% is
considered acceptable (Croteau, et al., 2005, Benson and Gallaway, 1953, Wegman, 1991,
Janisch & Galliard 1998). These clean chip seal aggregates are defined as one-size aggregate if
nearly all the aggregate particles are contained between two consecutive sieves that obey the
general rule of d ≥ 0.6D where “d” represents the size of the smaller sieve, while “D” represents
the size of the larger sieve. The common sizes of the chips, expressed in d/D, are 2/4 mm, 2/6
mm, 4/6 mm, 6/10 mm and 10/14 mm in Europe. Coarser chips (14/20 mm) are also used as the
primary layer of triple chip seals. The graded-aggregate may be dense graded or gap graded.
They are usually unwashed and the dust content may range between 1 to 8 percent. The nominal
maximum size of the aggregate or the D value ranges from 10 mm to 16 mm. Coarser graded-
aggregate such as 20 mm are occasionally used as the first layer of multi-layer systems (Croteau,
et al., 2005).
The small percentage of oversize particles of aggregate permitted by some specifications are
usually the flying stones that we hear so much about as being hazardous and damaging to traffic.
The excess percentage of undersize particles of aggregates permitted by some specifications are
often times so fie as to bolt the asphalt film and prevent the larger aggregates from becoming
embedded in the asphalt. In many cases, specification allow gap-graded aggregates which are
undesirable and also allow aggregates graded uniformly from fine to course, with maximum
density and minimum voids desirable for certain asphalt mixes but very undesirable for
penetration-asphalt surface treatments (Kearby, 1953).

34
Aggregate size, typically referred to as nominal maximum size, is the smallest sieve through
which all of the aggregate passes. The average of the smallest dimension of the aggregate is
referred to as the Average Least Dimension (ALD) (Hanson, 1934/35). The nominal size of
aggregate is selected based on traffic, surface condition, and type of chip seal. Larger aggregate
particle sizes are generally more durable and less sensitive to variations in binder application rate
(Gransberg, et al., 1998).
The Average Least Dimension, or ALD, is determined from the Median Particle Size and the
Flakiness Index. It is a reduction of the Median Particle Size after accounting for flat particles. It
represents the expected seal coat thickness in the wheel paths where traffic forces the flat chips
to lie on their flattest side (Janisch & Gaillard, 1998).
The average least dimension (ALD) can be determined using the following equation (Asphalt
Institute):
H = [M / 1.139285 + (0.011506)*FI]
where:
H = Average Least Dimension, or (ALD),
M = Median Particle Size, and
FI = Flakiness Index.
A larger sized aggregate requires more asphalt to hold the aggregate in place. This will result in
a thicker binder layer, enhancing the quality of the chip seal. However, if not properly embedded
and swept, larger aggregate can cause more damage to vehicles immediately after application. Its
coarser texture also results in a chip seal with higher noise emissions. The specified gradation
should be such that the texture of the chip seal is consistent. Tight gradation bands, which ensure
a uniformly graded aggregate, with minimal fines and dust, are necessary for a high-quality chip
seal. In fact, a study of chip seals on high traffic pavements exceeding 7500 vehicles per day per
lane recommended a job mix formula be developed as in hot mix asphalt construction to control
construction gradations (Shuler, 1998).
35
The specification should limit the amount of flat and elongated particles in the aggregate and
define what shall be considered flat and elongated particles. Flat and elongated particles
combined should not exceed 10 percent of any aggregate gradation requirement (Kearby, 1953).
A uniformly graded aggregate provides a more consistent embedment that results in improved
aggregate retention, surface friction, and drainage capabilities of the seal (McHattie 2001).
Loose Unit Weight
The loose unit weight of an aggregate is used to determine the voids in the loose aggregate. If
the voids in the loose aggregate are known after rolling, the amount of binder can be calculated
to fill the voids. The loose unit weight of an aggregate depends on its gradation, shape, texture
and specific gravity (Epps, et al., 1981, Croteau, et al., 2005).
ASTM C29 can be used to measure the loose unit weight. This approximates the voids in the
loose aggregate when it is dropped onto the pavement. It is assumed that once rolled a cubical
aggregate will contain voids of approximately 30% and finally to 20% after trafficking. Figure 6
shows the average least dimension (ALD), the effects of flakiness and changes in voids based on
compaction (Caltrans Division of Maintenance, 2003).

Figure 6
The aver
when the
are evalu
aggregate
particles.
determin
The void
V
where:
V
W
G
6. (Caltrans
rage least dim
e particles lie
uated to deter
e provide an
. The aggreg
ne the voids i
ds in loose ag
V = 1 – W / (
V = Voids in
W = Loose U
G = Bulk Spe
Division of
mension repr
e with their l
rmine the av
n indication o
gate loose un
in the loose a
ggregate may
(G * 62.4)
the Aggrega
Unit Weight o
ecific Gravity
Maintenan
resents the a
least dimens
verage least d
of the space
nit weight alo
aggregate (C
y be calculat
ate,
of the Aggre
y of the Agg
36
nce, 2003)
average of th
ion upwards
dimension o
available to
ong with the
Croteau, et al
ted using the
egate, and
gregate.
he thickness
s. The aggreg
of the aggreg
fit the binde
e aggregate s
l, 2005).
e familiar eq
of all individ
gate flakines
gate. The voi
er in between
specific grav
quation:
dual particle
ss and grada
ids in the loo
n the aggreg
vity is used to
es
ation
ose
gate
o

Potter &
with decr
Figure 7
Angulari
Angulari
however,
more diff
round ag
et al., 200
Lightwei
The adva
standard
2001).
Church dev
reasing layer
7. Reduction
ity
ity of the agg
, it is an imp
ficult to achi
gregates ten
05).
ight Aggrega
antages in th
chips, and lo
eloped the re
r depth.
n in voids wi
gregate is no
portant factor
ieve with rou
nd to be more
ate
e use of ligh
ower haul co
elationship s
ith decreasi
ot a factor co
r to take into
und particles
e prone to di
htweight chip
osts because
37
shown in Fig
ing layer de
onsidered in
o account. Ti
s than with a
islodgement
ps are reduce
they weigh
gure 7 showi
epth (Potter
determining
ightly packe
angular, crus
due to rollin
ed windshie
less than sta
ing the reduc
& Church,
g the binder s
ed chip seal a
shed particle
ng of the agg
ld damage c
andard chip
ction in void
, 1976).
spray rate,
aggregates a
es. Therefor
gregate (Cro
compared wi
weight (Out
ds
are
re,
oteau,
ith
tcalt,

Figure 8
done by G
Figure 8
Gallaway
used in th
is approx
generally
Gallaway
well as a
This min
laborator
clean uni
should be
the plus N
the No. 5
types sho
is a graph sh
Gallaway, &
8. (Gallaway
y, & Harper,
he project. L
ximately 25 p
y more expen
y, & Harper,
maximum u
nimum could
ry data from
iform graded
e given to ad
No 5 materia
5 sieve rather
ould be enco
howing aggr
& Harper, 19
y, & Harper
, 1966 found
Lightweight a
percent that
nsive than na
, 1966 sugge
unit weight f
d be set figur
an abrasion
d materials w
dopting the L
al after test b
r than the No
ouraged wher
regate loss co
66.
r, 1966).
d that lightwe
aggregates r
of natural st
atural aggreg
ests that cons
for lightweig
re or it could
test and rap
were emphas
Louisiana mo
being provis
o 4). The use
re these mat
38
ompared wit
eight aggreg
reduced wind
tone aggrega
gate and may
sideration sh
ght aggregate
d be provisio
pid freeze-tha
sized in the s
odification o
ional (Analy
e of syntheti
erial meet se
th asphalt ap
gates had a st
dshield dama
ate. However
y have high
hould be give
es used in se
onally based
aw results. T
study. It is su
of the L.A. a
ysis for wear
ic aggregates
ervice requir
pplication ra
trong affinit
age because
r, lightweigh
water absor
en to setting
eals and surf
on service r
The definite
uggested tha
abrasion test
r should be m
s in paving s
rement Gene
ate from a stu
ty for all asp
specific gra
ht aggregate
rption.
g a minimum
face treatmen
records and o
advantages
at considerat
with washin
made by use
systems of a
eral
udy
halts
avity
s are
m as
nts.
or
of
tion
ng of
e of
all

39
specifications should be prepared which would place the various synthetic aggregates in use
categories. However, the advantages of using lightweight aggregates may disappear as traffic
levels increase. A pavement constructed in Tulsa, OK using lightweight aggregate in one of the
test sections completely disintegrated after one day (Shuler, 1991) although Los Angeles
Abrasion results indicated the aggregate had a loss of 28 percent, well within specification limits.
The discrepancy apparently was due to the cushioning effect of the aggregates in the Los
Angeles drum as the test proceeds, producing a misleading test result.
Aggregate–Binder Compatibility
Adhesion between the aggregate and binder is governed by a number of variables. The adhesion
between aggregate and binder is a function of mechanical, chemical, and in the past, it was
believed electrostatic properties (Yazgan and Senadheera 2003). Possible mechanical- and
chemical-related factors include aggregate dust, moisture content, and binder temperature.
Different types of aggregate were thought to be better suited to certain binders as a result of
electrostatic charges (Sprayed Sealing Guide, 2004). However, new evidence indicates this may
only be true before the emulsion has set and that after the binder becomes a residue, no effect
exists (Shuler, 2011).
In addition, porosity and the presence of water on the surface of the aggregate affect binder–
aggregate compatibility. Aggregate, which is quite porous, will actually lead to excessive
absorption of the binder. Loss of aggregate shortly after construction is indicative of poor
adhesion between the binders and aggregate. Before construction, it is essential to conduct
laboratory testing to determine the adhesion capability between the aggregate and the binder. An
antistrip test, such as ASTM D1664 (AASHTO T182), will assist in determining the
compatibility between the aggregate and binder. This test may also highlight the need for an
antistrip additive (Asphalt Seal Coats, 2003).

40
Aggregate Absorption
The amount of binder applied to the roadway not only needs to compensate for absorption into
the existing pavement but also into the cover aggregate itself. Sedimentary aggregates such as
limestone can have ten times the absorption of igneous aggregate such as granite or trap rock.
Failure to recognize this fact and correct for it can lead to excessive chips loss due to lack of
embedment (Janisch & Gaillard, 1998).
Important aggregate characteristics include absorption and shape. Corrections for absorption are
based on experience and the characteristics of the local aggregates. Chip shape effects are
variable: rounded chips leave greater voids and do not interlock and are not recommended. This
type of chip also requires additional binder. Non-uniform sized aggregates produce uneven
surfaces (Caltrans Division of Maintenance, 2003).
Aggregate Toughness and Soundness
Resistance to abrasion, degradation, and polishing will ensure that the selected aggregate remains
functional for the expected life span of the chip seal. It is desirable to use aggregates with
resistance to polishing, as indicated through tests such as the British Wheel test (AASHTO T279,
ASTM D3319). The results of this test indicate the polished stone value of the aggregate, and the
Australians recommend a polished stone value in the range of 44 to 48 (Sprayed Sealing Guide
2004). Resistance to degradation and abrasion is also an important characteristic of suitable
aggregate. Survey results indicate that testing for those characteristics is quite common and
usually measured by the Los Angeles abrasion test (AASHTO T96, ASTM C131). Resistance to
weathering and freeze-thaw degradation is generally measured by either magnesium sulfate loss
or sodium sulfate loss (AASHTO T104, ASTM C88) (Gransberg & James, 2005).
Aggregate Type
Igneous, metamorphic, sedimentary, and manufactured aggregates have all been successfully
used for chip sealing (Sprayed Sealing Guide 2004). Limestone, granite, and natural gravels are
most widely used in North America. Also, one comprehensive report studied the suitability of
lightweight aggregate as cover stone for chip seals (Gallaway and Harper 1966).

41
Lightweight aggregate has proved to be a successful cover aggregate for chip seals on low
volume roads but on high traffic over 7500 vehicles per day per lane it may be problematic
(Shuler, 1991). A more recent study showed that lightweight synthetic aggregate furnished a
superior ability to retain its skid resistance (Gransberg and Zaman 2002). Such a phenomenon
was highlighted by Australian and United Kingdom responses that stressed the use of calcined
bauxite, a synthetic aggregate, in high-stress areas where chip polishing is an issue (Gransberg &
James, 2005).
Aggregate Moisture
Excess moisture on the cover aggregate has an effect similar to a coating of dust. The moisture
film prevents or delays the wetting and development of good adhesion between aggregate and
binder. In humid, or damp cool weather, evaporation of the moisture on the aggregate occurs
slowly, but it dries out quickly on warm dry days. During this drying period, uncontrolled high
speed traffic may displace the cover stone. If rain falls soon after construction, while the
adhesion between binder and damp cover stone is still poorly developed, traffic may cause very
serious or even complete loss of cover aggregate. A combination of both dust and moisture on
the cover stone, increases the delay in the development of good adhesion between aggregate and
binder, and multiplies the possibility of loss of cover aggregate under traffic, if cool rainy or hot
humid weather follows immediately after construction. Every reasonable effort should be made
to have the cover aggregate only damp before it is applied to the emulsion (McLeod, 1960).
Material Selection
As previously stated, one-sized aggregates are preferred for producing successful chip seals.
However, Jahren, (2004) found that graded cover aggregates for chip seals have performed well,
producing tight, quiet surfaces. These tight surfaces also seem to be beneficial to reduce
snowplow damage. This research indicates that if application rates can be controlled sufficiently
to prevent bleeding problems that the various size pieces of aggregate can be bound well enough
to prevent aggregate loss problems. Smaller sizes (e.g., 0.25”) of chip seal aggregate perform
well in the short term. They provide a tighter surface texture (improving noise) and require less
weight of aggregate to provide adequate coverage. Also, less binder is required to bind the
aggregate to the surface, further reducing costs. Generally, the literature suggests that chip seals

42
constructed with smaller cover aggregate sizes will wear more quickly than larger sizes,
especially under heavier traffic (Jahren, 2004).
Janisch and Gaillard, 1998 state that the selection of chip seal materials is project dependent, and
the engineer in charge of design must fully understand not only the pavement and traffic
conditions in which the chip seal will operate but also the climatic conditions under which the
chip seal will be applied. It appears that the widespread use of emulsion binder chip seals results
from the notion that emulsions are less sensitive to environmental conditions during
construction. Additionally, emulsions are constructed at a lower binder temperature so they are
less hazardous to the construction workers.
The selection of the binder is dependent on the type of aggregate that is economically available
for the chip seal. Australia and New Zealand pay higher aggregate costs to ensure the quality of
chip seals is achieved. The aggregate should be checked to ensure that electrostatic compatibility
is met with the type of binder specified.
Several best practices can be obtained from these other countries (Janisch and Gaillard, 1998):
1. Conduct electrostatic testing of chip seal aggregate source before chip design to ensure that
the binder selected for the project is compatible with the potential sources of aggregate.
2. Specify a uniformly graded, high-quality aggregate.
3. Consider using lightweight synthetic aggregate in areas where post-construction vehicle
damage is a major concern and traffic volumes are low.
4. Use life-cycle cost analysis to determine the benefit of importing either synthetic aggregate
or high-quality natural aggregates to areas where availability of high quality aggregate is
limited.
5. Use polymer-modified binders to enhance chip seal performance.
Aggregate Spread Rate
Hanson proposed that the spread rate of stone was directly related to the ALD of stone or 20% of
the ALD volume. He also stated that the voids in any loose volume of stone are equivalent to
50% of the total volume occupied by the stone. Both these volumes were taken to be independent

43
of the size and shape of the stone. Marais has shown that the voids in a single layer of stone are
related to ALD of the stone. He has also shown that the voids in a loose volume of stone are to
some extent, dependent on the shape of the stone as defined by the flakiness index. As can be
seen the flakiness index does have an effect on the void volume of stone (single-sized). The more
flaky stone (higher flakiness index) has a greater volume of voids in the loose bulk condition.
When it is assumed that the average compacted depth of stone layer is equal to the ALD, the
following is obtained:
SRt = ALD
1000
2100
1100
V
V
where:
SRt = spread rate of stone (theoretical) (m2/m3),
ALD = Average least dimension of stone (mm),
V1= void volume in loose bulk expressed as percentage of total volume occupied by
stones, and
V2 = void volume in a single layer of stone expressed as a percentage of ALD
volume.
The above relationship shows that the rate of spread of stone (no allowance for excess stone) is
inversely proportional to the ALD of the stone and the voids in the single layer of stone, and
directly proportional to the voids in a loose volume of stone (Benson & Gallaway, 1953).
Whip-off should range from 2% for large cover stone to 10%when the cover aggregate is small.
With reasonably careful application of stone chips therefore, the loss of one size cover aggregate
from a seal coat or surface treatment due to traffic whip-off should not exceed 10%. In addition
to whip-off by traffic, experience in Australia has shown that an average wastage loss of about
5% occurs during handling and transportation between the quarry or other source of cover
aggregate and its actual application on the road surface (McLeod, 1960).
Rate of Application of Binder
The optimum quantity of asphalt is determined on the basis that a certain percentage of
embedment of the stone is necessary in order to hold the stone adequately and at the same time
not produce a sticky surface. The percentage of embedment is stated by Kearby to be a function

of the av
Kearby’s
Figure 9
Benson a
less than
1953). Th
embedme
and the o
Gallaway
erage thickn
s recommend
9. Embedme
and Gallaway
30% embed
he method o
ent is relativ
optimum qua
y, 1953):
ness of the on
dation for pe
ent as a Fun
y suggested
dment as the
of calculation
vely simple. T
antity to cove
ne stone laye
ercentages of
nction of Av
a revised Ke
mat thickne
n of the optim
The specific
er one squar
44
er which is d
f embedmen
erage Mat T
earby relatio
ess approach
mum asphalt
c gravity, the
re yard one s
designed as t
nt is shown b
Thickness (K
onship shown
hed 0.1 inche
t quantity fro
e dry loose u
stone thick m
the average m
by the solid l
Kearby, 195
n in Figure 9
es (Benson &
om the perce
unit weight o
must be know
mat thicknes
line in Figur
53)
9 by not allo
& Gallaway,
entage of
of the aggreg
wn (Benson
ss.
re 9.
owing
gate,
&

45
Q = optimum quantity of stone, lbs,
w = dry loose unit weight of stone, lbs per cu ft., and
g = specific gravity of the stone.
Average mat thickness t = 1.33Qw
Percentage embedment from Figure 9 = e
Asphalt depth d = 100
et
Gallons of asphalt per sq yd = 7.48 (9d/12) (1-w/62.4 g)
= 5.61 d (1- g
w
4.62 )
Wide differences in ALD values for two one-size cover aggregates of the same nominal size
results in equally wide differences in the quantities of asphalt binder that should be applied for
one of these cover aggregates as compared with the other (McLeod, 1960). The Vialit Test
(CalTrans, 2003) for aggregate retention in chip seals is an indicator of aggregate retention for
chip seals. Asphalt emulsion or hot asphalt cement is applied to standard size stainless-steel pans.
Exactly one hundred graded aggregates are embedded in the binder. The material is allowed to
cure under specified conditions. Following this cure, the trays are conditioned at -22° C for 30
minutes. Then a 500 g ball is dropped 3 times from a distance of 50 cm onto the inverted trays.
The results are recorded as percent aggregate retention (Caltrans, 2003).
Binder Properties
Proprietary modified binders, made by addition of polymers or other means, are available. There
is no standard specification for these binders at present, but a suite of discriminatory tests is
under development, which may include such tests as mini-fretting, toughness and tenacity, Vialit,
and rheological characteristics. Compliance requirements have to be based on one or more
provisional test methods, or a performance criterion, or local experience on previous jobs.
The addition of polymers to bituminous binders modifies the performance in a number of ways
depending on the polymer used. Typically, improved performance in one or more of the
following areas is possible (Colwill, et al., 1995):
46
Reduced temperature susceptibility in service;
Improved low temperature adhesion and elasticity;
Improved elasticity to bridge hairline cracks in the underlying surface;
Improved early "grip" on the aggregate;
Improve long term cohesion of the system
Improved durability as thicker films are possible and
Earlier release of the site to free-flowing traffic
High viscosity binders should be used on roads in which the 85th –percentile traffic speed
exceeds 100 km/hr (60 mph) in order to resist displacement of chippings by high-speed traffic.
(Colwill, et al., 1995).
Gransberg, & Zaman, (2002), found that emulsion chip seals performed as well as hot asphalt
cement seals and emulsion chip seals also furnished better long term friction (Gransberg, &
Zaman, 2002).
Walubita, et al., (2005) quotes that from the 2001 and 2002 TxDOT district surface treatment
programs, seven different types of binders (designated B1 to B7) were identified, and all were
modified. These binders are summarized in Table 5. The binders were sampled, tested, and
graded according to the SPG specification.
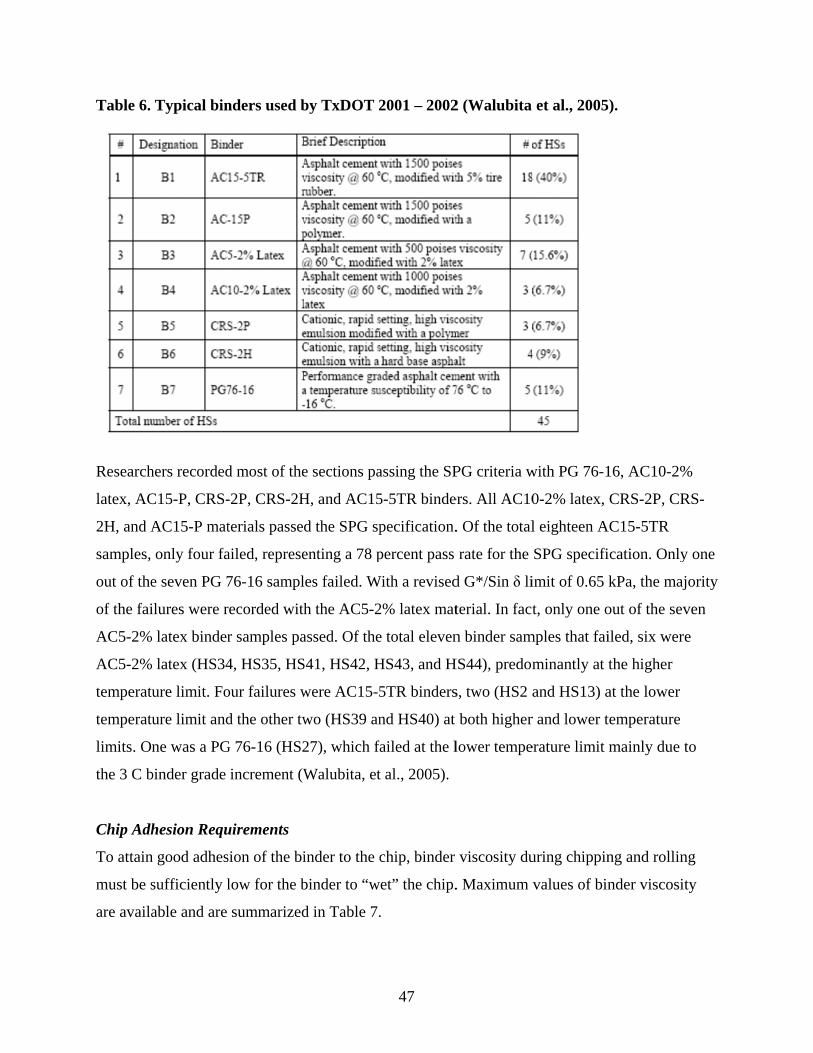
Table 6.
Research
latex, AC
2H, and A
samples,
out of the
of the fai
AC5-2%
AC5-2%
temperatu
temperatu
limits. On
the 3 C b
Chip Adh
To attain
must be s
are availa
Typical bin
hers recorded
C15-P, CRS-
AC15-P mat
only four fa
e seven PG 7
ilures were r
latex binder
latex (HS34
ure limit. Fo
ure limit and
ne was a PG
binder grade
hesion Requ
n good adhes
sufficiently l
able and are
nders used b
d most of the
-2P, CRS-2H
terials passed
ailed, represe
76-16 sampl
recorded with
r samples pa
4, HS35, HS
our failures w
d the other tw
G 76-16 (HS2
increment (W
uirements
sion of the bi
low for the b
summarized
by TxDOT 2
e sections pa
H, and AC15
d the SPG sp
enting a 78 p
les failed. W
h the AC5-2
assed. Of the
S41, HS42, H
were AC15-5
wo (HS39 an
27), which fa
Walubita, et
inder to the c
binder to “w
d in Table 7.
47
2001 – 2002
assing the SP
5-5TR binde
pecification.
percent pass
With a revised
2% latex mat
e total eleven
HS43, and H
5TR binders
nd HS40) at
failed at the l
t al., 2005).
chip, binder
et” the chip.
.
2 (Walubita
PG criteria w
ers. All AC10
. Of the total
rate for the
d G*/Sin δ li
terial. In fact
n binder sam
HS44), predom
s, two (HS2 a
both higher
lower tempe
viscosity du
. Maximum
et al., 2005
with PG 76-1
0-2% latex,
l eighteen A
SPG specifi
imit of 0.65 k
t, only one o
mples that fai
minantly at t
and HS13) a
r and lower t
erature limit
uring chippin
values of bin
).
16, AC10-2%
CRS-2P, CR
AC15-5TR
ication. Only
kPa, the maj
out of the sev
iled, six wer
the higher
at the lower
temperature
mainly due t
ng and rollin
nder viscosit
%
RS-
y one
jority
ven
e
to
ng
ty
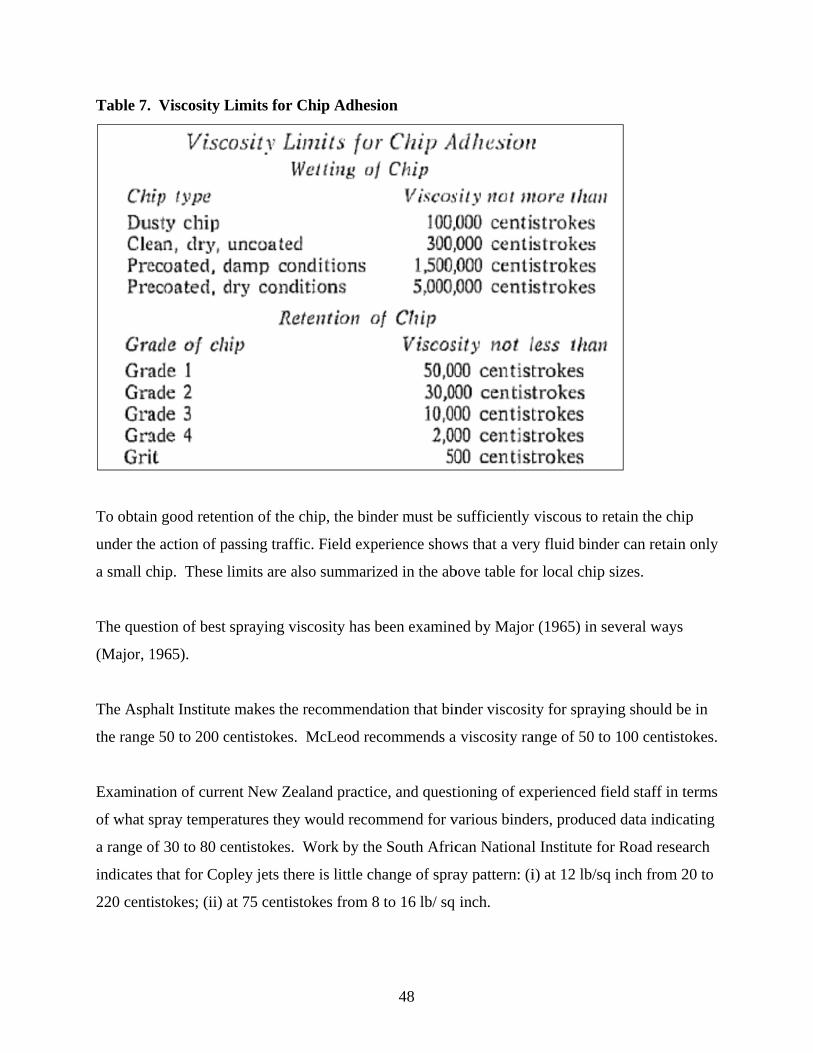
Table 7.
To obtain
under the
a small c
The ques
(Major, 1
The Asph
the range
Examina
of what s
a range o
indicates
220 centi
Viscosity L
n good reten
e action of p
hip. These l
stion of best
1965).
halt Institute
e 50 to 200 c
ation of curre
spray temper
of 30 to 80 ce
that for Cop
istokes; (ii) a
Limits for C
ntion of the c
assing traffic
limits are als
spraying vis
e makes the r
centistokes.
ent New Zea
ratures they
entistokes. W
pley jets ther
at 75 centisto
Chip Adhesi
chip, the bind
c. Field expe
so summariz
scosity has b
recommenda
McLeod rec
aland practic
would recom
Work by the
re is little ch
okes from 8
48
ion
der must be
erience show
zed in the ab
been examine
ation that bin
commends a
e, and quest
mmend for v
e South Afric
hange of spra
to 16 lb/ sq
sufficiently
ws that a very
bove table fo
ed by Major
nder viscosit
a viscosity ra
tioning of ex
various binde
can National
ay pattern: (i
inch.
viscous to re
ry fluid binde
or local chip
r (1965) in se
ty for sprayi
ange of 50 to
xperienced fi
ers, produce
l Institute fo
i) at 12 lb/sq
etain the chi
er can retain
sizes.
everal ways
ing should b
o 100 centist
ield staff in t
d data indica
or Road resea
q inch from 2
ip
n only
e in
tokes.
terms
ating
arch
20 to

49
The country Roads Board, Victoria, which consistently produces excellent chip seals, specifies
that binder temperature must be adjusted to give a viscosity of 25 to 50 centistokes at spraying.
The conclusion to be drawn is that for satisfactory spraying the binder temperature should be
adjusted to a target viscosity of approximately 70- centistokes. Binder temperature may vary
between tank and nozzle, and although this should not be significant with current insulation
practices, it is worth consideration. The South African findings on desirable pressure range (8 to
16 lb/ sq inch at jet) do not seem to agree with recently specified values( 20 to 60 lb/ sq inch at
pump) (Major, 1965).
Binder consistency during application is an important factor in surface treatment performance.
Binder sprayed at temperatures colder than optimum tend to be viscous and do not allow proper
embedment of the aggregate, possibly resulting in aggregate loss. If they are sprayed too hot,
they are prone to flow, which causes the same effect. The rotational viscometer (AASHTO
TP48) was used for selected binders to obtain temperatures that correspond to recommended
viscosity ranges. Spraying temperatures corresponding to viscosities between 0.10 and 0.15 Pa
were recommended for inclusion in the SPG specification. A maximum temperature of 180◦C
was also set to prevent alteration of the binder and modifiers (Griffith & Hunt, 2000).
The tendency at times to use a grade of bituminous binder that is too hard or viscous for the
weather and road surface conditions, frequently leads to serious loss of cover aggregate and a
badly flushed surface treatment or seal coat. Because the bitumen is too hard, the particles of
cover aggregate fail to make adequate contact with the binder (at times they do little more than
dent the surface of the binder even after being rolled), and a considerable percentage is removed
sooner or later by traffic. The surface treatment or seal coat is left with a deficiency of cover
stone and the flushing of the binder may be so pronounced that section of the entire surface
treatment of seal coat may be lifted off by the tires of passing vehicles. A flushed surface can
result from the assumption that surface treatments and seal coats made with graded cover
aggregates should be constructed on-stone particle thick, as is usual practice with one-size cover
stone. When this principle is followed, it is inevitable that the quantity of binder required to
cement the larger particles of a graded cover aggregate into place, tends to submerge the finer

50
particles in the appreciable areas they occupy. Tires make contact with the binder in these areas
and black surface results. This may be even accentuated if a smaller amount of binder is applied,
leading to loss of a considerable portion of the coarser sizes, which in turn results in an overall
deficiency of cover aggregate in the surface treatment. It will be seen later that better surface
treatments or seal coats are likely to result when made with graded cover aggregates, if they are
considered to be 2-stone particles thick (McLeod, 1960).
Adhesion to the Road
In second coat seals and reseals there is rarely any problem of adhesion of the sprayed binder to
the existing road surface. Normal brooming in preparation for sealing will produce a fairly dust
free surface and the initial contact between the binder at near spraying temperature and the
surface will be under conditions of low binder viscosity which promotes rapid wetting. For first
coat seals, where the surface necessarily exhibits some dustiness, adhesion is promoted by the
use of more fluid binders (Major, 1965).
Flow on the Road
When a binder of low viscosity is sprayed on a sloping impervious surface there will be some
tendency for the material to flow downhill while it is still fluid before cooling to road surface
temperature. This is unlikely to be significant at low application rates, but could be of
importance at high rates. Few data are available on this point, but indications are that flow
becomes significant for road viscosities of 500,000 centistokes and under at application rates of
0.35 gal/sq yd and upwards on cross falls of over ¾ in/ft. The normal solution to this problem is
to limit the binder application rate and use as small a chip as this rate limitation dictates (Major,
1965).
Residual Binder Properties
Two factors govern the required residual binder properties for sealing an impervious surface.
These are climate and traffic density. The conflicting demands imposed by climate are a hard
enough binder to withstand peak summer temperatures without softening to the stage where
traffic can displace stone, or the seal become susceptible to bleeding, and a soft enough binder to
not become brittle under minimum winter temperatures. It is impracticable to obtain full

compacti
chips sec
their opti
is aided c
in warm
suggested
penetrati
approx, 4
Binder P
There is
wetting o
and chip
Table 8.
Table 8.
Standard
diluent. T
surface s
currently
not comp
Ideally, t
difficulti
ion of the lay
cure against t
imum positio
considerably
climates tha
d that the ran
on grade bitu
400/500pen.)
Properties at
a range of bi
of the chip an
treatment. S
Binder Vis
d constituents
The grades o
ealing are 80
y limited. Th
pletely non-v
the volatile d
es of supply
yer of sealin
traffic dama
on for durab
y by the use o
an in cold on
nge of residu
umen, for ve
) for very lig
t Chip Appli
inder viscos
nd good chip
Suggested tar
scosity Rela
s needed are
of asphalt cem
0/100 pen. T
e most readi
volatile, but
diluent used
y, transport a
ng chips with
age. Hence, t
bility. With li
of a soft resi
nes, and softe
ual binders f
ery heavy tra
ght traffic in
ication
ities at the ti
p retention. T
rget values f
ative to Chip
e penetration
ment availab
The latter is f
ily available
is nearly so
should be ra
and storage w
51
h constructio
the traffic wi
ight traffic, t
idual binder.
er for low tra
for New Zea
affic and hig
cold areas (
ime of chip a
Target binde
for viscosity
p Size and C
n grade bitum
ble in New Z
freely availa
suitable hea
at the conce
apid curing a
with material
on rolling, w
ill be expect
this is achiev
. Thus residu
affic densitie
aland use sho
gh temperatu
(Major, 1965
application t
er viscosity w
y under vario
Condition
mens, no-vol
Zealand with
able, but supp
avy diluent i
entrations en
a crude gaso
ls of such lo
which is aime
ted to compa
ved only slo
ual binder sh
es than high
ould vary bet
ures and ligh
5).
that will allo
will vary wit
ous condition
latile diluent
hin the range
plies of the f
is class D fue
nvisaged for
line or naph
w flash poin
ed at making
act the chips
wly, the pro
hould be har
ones. It is
tween 80/10
ht road oil(
ow adequate
th the chip s
ns are set out
t and volatile
e of interest i
former are
el oil, which
surface seali
htha-but there
nts. The mor
g the
to
ocess
rder
00
size
t in
e
in
h is
ing.
e are
re

52
readily available power kerosene, already in use as a standard cut-back material, is less
hazardous and a more practicable choice (Major, 1965).
Binder consistency in terms of viscosity during application is an important factor in surface
treatment performance and is largely controlled by the spraying temperature.
Optimum binder temperature is essential to ensure optimum binder viscosity, uniformity, and
adequate aggregate embedment at the time of construction to prevent run-off and minimize
aggregate loss. Spraying the binder at temperatures lower or higher than optimum could be a
potential source of aggregate loss, due to either high or low viscosity, respectively. Binders that
are sprayed at colder temperatures than optimum tend to be viscous and do not allow proper
embedment of the aggregate, resulting in potential aggregate loss. If the binder is sprayed too
hot, it is prone to flow, causing the same effect. Extremely high temperatures can also increase
aging and/or alter the binder properties to the detriment of performance. High-temperature
properties are critical in specifying surface treatment binders to preclude aggregate loss and to
minimize bleeding at high service temperatures due to low shear resistance and the inability of
the binder to hold the aggregate in place under traffic forces (Walubita, et al., 2005).
53
EXPERIMENT DESIGN This experiment was designed to determine if aggregate characteristics affect performance of
chip seals on low volume roads. To test this hypothesis the performance of two aggregates was
evaluated on two two-lane state highways. Therefore, independent variables included two
aggregates and two highways. This resulted in a 2 x 2 factorial experiment.
One aggregate was the material routinely used for chip seal construction by CDOT maintenance
with a history of acceptable performance. The second aggregate represented a locally available
and marginal material not meeting CDOT specifications with unknown performance. These
materials will be identified as Control and Experimental, respectively.
Test sections were constructed on SH71 north of Snyder, CO and on SH59 south of Sedgwick,
CO as shown in Figure 10. Both of these pavements are rural, farm to market two lane highways
with 12 foot wide driving lanes, no shoulders on SH71 and 10 foot shoulders on SH59. Traffic
volumes are 360 AADT with 30 single unit trucks and 120 combination trucks on SH71 and
between 160 and 470 AADT with 20 single unit trucks and 20 combination trucks on SH59.
Evaluation sections were established on each highway to measure performance over time for
each aggregate being evaluated. Two 500-foot-long evaluation sections were established for
each highway for each aggregate. This resulted in four 500 foot long evaluation sections for
each highway or eight evaluation sections total.
Analysis of this design is accomplished using conventional analysis of variance (ANOVA)
techniques using the model shown below:
Yij = + Ai + ij
where:
Yijk= dependent variable, e. g. cracking, raveling, or chip loss,
= overall mean,
Ai = Effect due to ith aggregate, and
ijk= Random error.

Figure 1
The appr
and 12. N
direction
Figure 1
Figure 1
Depende
Performa
after the
measurin
NB
SB
S
0. Location
roximate loc
Note that SH
n in the locati
1. Evaluati
2. Evaluati
ent Variable
ance of the c
winter and b
ng cracking,
MP 187
MP 163.95
SH71 Site
E
n of Evaluat
ations of the
H59 is a nort
ion of the ev
ion Sections
ion Sections
es
chip seals wa
before fall ea
raveling and
7.0
16
Control
186.9 Exp
tion Section
e evaluation
th-south tren
valuation sec
s on SH71
s on SH59
as evaluated
ach year. Th
d chip loss.
186.5 Exp
64.15
SH5
186.6
54
ns
sections on
nding highwa
ctions.
by conducti
hese conditio
186.3 186.1
164.8
59 Site
Control
each pavem
ay but is alig
ing visual co
on surveys e
8
Experim
ment are show
gned in an ea
ondition surv
evaluated per
Control
165.0
184184.5
wn in Figures
ast-west
veys of the s
rformance b
SB
NB
4.3
s 11
ites
y

55
METHODOLOGY The process used to conduct this experiment consisted of the following steps:
1. Evaluate condition of the pavement in the area of the evaluation sections prior to
application of the chip seals.
2. Sample the materials used for construction and determine physical properties
3. Construct evaluation sections
4. Evaluate condition of the evaluation sections after winter and before fall each year for
three years.
Pavement Condition Prior to Construction of Test Sections
Prior to construction of the test sections condition surveys were performed in the areas of the
evaluation sections to determine pre-chip seal condition. These surveys were conducted visually
following the procedures outlined by the Strategic Highway Research Program (SHRP 2003).
Results of this survey are shown in Appendix A and consisted primarily of longitudinal,
transverse, alligator cracking, and chip loss.
Materials
The two aggregates used in this study were obtained from L. G. Everist and McAtee
Construction. One aggregate is representative of what is typically used in eastern Colorado for
chip seal construction on low volume roads. This will be referred to as the control aggregate.
The cost of this aggregate chip was $40.90 per ton. The other aggregate is finer in gradation and
less processed with respect to crushing. This aggregate will be referred to as the experimental
aggregate. The cost of this aggregate chip was $24.80 per ton. The gradations, percent of
fractured faces and soundness loss measured for each of these aggregates is shown in Table 9
and compared with CDOT Table 703-6 for chip seal aggregate and the Nebraska Department of
Roads (NDOR) Section 1033 specification for what is termed ‘armour coat’ by NDOR. Armour
coat is a chip seal constructed with minimally processed aggregates for use on low volume roads.

56
Table 9. Aggregates Used in Experimental Chip Seal Evaluation Sections
Sieve Passing, %
Control Experimental CDOT Table
703-6 NDOR 1033
¾ 100 3/8 100 100 100 94-100 4 32 62 0-15 8 6 13 10 5 10 30-35 50 3 6 0-10 200 1 3 0-1 0-4
L. A. Loss, % 29 31 < 35 < 40 2 Fractured Faces, % 25 15 > 90 n/a
Soundness Loss, % 3 3 n/a < 12
Asphalt emulsion used on the project was obtained from Cobitco in Denver with the properties
shown in Table 10.
Table 10. Asphalt Emulsion
Property CRS-2P
Spec Project Tests on Emulsion
Viscosity, 50C, Saybolt-Furol, s 50-450 120 Storage Stability, 24 hr, % max 1.0 0 Particle Charge Test Positive Positive Sieve Test, % max 0.10 0 Demulsibility, % min 40 70 Oil Distillate by Volume, % max 3.0 0 Residue by Evaporation, % min 65 69
Tests on Residue Penetration, 25C, 100g, 5s, dmm, min 70-150 105 Solubility in TCE, % min 97.5 100 Toughness, in-lbs, min 70 95 Tenacity, in-lbs, min 45 75
Construction
Construction of the test sections was conducted by CDOT Region 4 maintenance forces in the
summer of 2009. Equipment utilized consisted of a conventional asphalt distributor, self-
propelled aggregate spreader and two pneumatic tired rollers. Traffic control consisted of

57
diverting traffic on each of the two lane pavements around the chip seal operations until the
strength of the emulsion was high enough to resist chip dislodgement.
Materials application rates for SH71 evaluation sections were 28 pounds per square yard for the
control and 26 pounds per square yard for the experimental aggregate. Emulsion was applied at
0.28 gallons per square yard for both control and experimental sections. Chips on SH59 were
applied at 28 pounds per square yard for both control and experimental aggregates and at 0.29
gallons per square yard for the emulsion. Design application rates were estimated using the
Texas chip seal design procedure (Epps, et al., 1981). Results of this design are shown in Table
11.
Table 11. Design Quantities for Materials
SH 71 SH 59
Control Experiment Control Experiment
Quantity of chips*, Q, psy 26 24 27 28
Loose Unit Weight, W, pcf 113 115 113 115
Design Embedment, e, % 40 40 40 40
Traffic Correction, T 1.1 1.1 1.1 1.1
Surface Correction, V -0.03 -0.03 -0.03 -0.03
Emulsion, gsy 0.30 0.26 0.32 0.31
* From Board Test during laboratory design
This design procedure uses a one-square yard board to estimate the quantity of chips required to
cover the surface one stone thick. The asphalt quantity is estimated by calculating the amount of
asphalt to fill the voids between the chips to a specific embedment depth. That relationship is as
follows:
A = {5.61 e [1.33Q/W][1-(W/(62.4G))] T + V}/ R (Epps, et al., 1981)
where:
A = Emulsion, gsy,
e = Design Embedment, %,

58
Q = Quantity of chips*, psy,
W = Loose Unit Weight, pcf,
G = aggregate specific gravity,
T = Traffic Correction,
V = Surface Correction, and
R = emulsion residue, %.
Construction proceeded with no difficulties for either test pavement. Aggregate embedment was
achieved after approximately four passes of the pneumatic tired rollers and vehicular traffic was
allowed back onto the fresh chip seals after approximately two hours from the time of
application.
The environmental conditions at the time of construction are summarized in Table 12.
Table 12. Environment During Construction Location Pavement Temp, F Weather Wind SH 71 90-105 Clear/Sun/Dry 270 @ 10 mph SH 59 80-95 Clear/Sun/Dry 270 @ 5 mph Pavement Condition After Construction of Test Sections Evaluation sections were monitored to measure performance from the spring of 2010 until the
fall of 2012. Methods used to evaluate performance were visual condition surveys conducted by
walking along the shoulders of the pavements and observing condition according to the methods
described by SHRP (SHRP 2003) for the cracking and flushing and Epps (Epps, et al., 1981) for
the chip loss. The results of these surveys are shown in Figures 13 to 17 for SH71 and Figures
18 to 22 for SH59. The evaluation sections are presented separately on the graphs. That is,
sections 1 to 5 are the first five, 100 foot long control sections, sections 6 to 10 are the second
five, 100 foot long control sections; sections 11 to 15 are the first five, 100 foot long
experimental sections, and sections 16 to 20 are the second five, 100 foot long experimental
sections.

59
Figure 13. Longitudinal Cracking on SH71
Figure 14. Transverse Cracking on SH71
0%
20%
40%
60%
80%
100%
120%
140%
Spring2010
Fall2010
Spring2011
Fall2011
Spring2012
Fall2012
% of Original Cracking
Longitudinal Cracking‐SH71
Control 1‐5
Control 6‐10
Experiment 11‐15
Experiment 16‐20
0%
20%
40%
60%
80%
100%
120%
Spring2010
Fall2010
Spring2011
Fall2011
Spring2012
Fall2012
% of Original Cracking
Transverse Cracking‐SH71
Control 1‐5
Control 6‐10
Experiment 11‐15
Experiment 16‐20

60
Figure 15. Alligator Cracking on SH71
Figure 16. Chip Loss on SH71
0%
5%
10%
15%
20%
25%
30%
35%
40%
Spring2010
Fall2010
Spring2011
Fall2011
Spring2012
Fall2012
% of Original Cracking
Alligator Cracking‐SH71
Control 1‐5
Control 6‐10
Experiment 11‐15
Experiment 16‐20
0.00%
0.10%
0.20%
0.30%
0.40%
0.50%
0.60%
Spring2010
Fall2010
Spring2011
Fall2011
Spring2012
Fall2012
% of Original Chips
Chip Loss‐SH71
Control 1‐5
Control 6‐10
Experiment 11‐15
Experiment 16‐20

61
Figure 17. Flushing on SH71
Figure 18. Longitudinal Cracking on SH59
0.0%
0.2%
0.4%
0.6%
0.8%
1.0%
1.2%
1.4%
1.6%
Spring2010
Fall2010
Spring2011
Fall2011
Spring2012
Fall2012
% of Original Flusing
Flushing‐SH71
Control 1‐5
Control 6‐10
Experiment 11‐15
Experiment 16‐20
0%
10%
20%
30%
40%
50%
60%
70%
80%
90%
Spring2010
Fall 2010 Spring2011
Fall 2011 Spring2012
Fall 2012
% of Original
Longitudinal Cracking‐SH59
Control 1‐5
Control 6‐10
Experiment 11‐15
Experiment 16‐20

62
Figure 19. Transverse Cracking on SH59
Figure 20. Alligator Cracking on SH59
0%
10%
20%
30%
40%
50%
60%
70%
80%
90%
Spring2010
Fall 2010 Spring2011
Fall 2011 Spring2012
Fall 2012
% of Original
Transverse Cracking‐SH59
Control 1‐5
Control 6‐10
Experiment 11‐15
Experiment 16‐20
0%
10%
20%
30%
40%
50%
60%
70%
80%
90%
Spring2010
Fall 2010 Spring2011
Fall 2011 Spring2012
Fall 2012
% of Original
Alligator Cracking‐SH59
Control 1‐5
Control 6‐10
Experiment 11‐15
Experiment 16‐20

63
Figure 21. Chip Loss on SH59
Figure 22. Flushing on SH59
Distress in both pavements is limited to a return of transverse and longitudinal cracks to pre-chip
seal conditions after approximately 2.5 years. Alligator cracking, which was only present in the
control sections prior to treatment, has returned to approximately 22 to 35 percent of that present
0.00%
0.10%
0.20%
0.30%
0.40%
0.50%
0.60%
Spring2010
Fall2010
Spring2011
Fall2011
Spring2012
Fall2012
% of Original
Chip Loss‐SH59
Control 1‐5
Control 6‐10
Experiment 11‐15
Experiment 16‐20
0.00%
0.20%
0.40%
0.60%
0.80%
1.00%
1.20%
Spring2010
Fall2010
Spring2011
Fall2011
Spring2012
Fall2012
% of Original
Flushing‐SH59
Control 1‐5
Control 6‐10
Experiment 11‐15
Experiment 16‐20

64
prior to treatment. Chip loss ranges from 0.35 to approximately 0.50 percent of the area of the
evaluation sections. Some areas of the pavements also contain longitudinal flushing streaks
where distributor nozzles may not have been adjusted correctly and higher quantities of asphalt
were applied. The cause of this is not related to either type of chip, but is reported for
thoroughness.

65
ANALYSIS The results of the condition surveys after three years of service were analyzed using conventional
analysis of variance techniques (ANOVA) to determine whether any significant differences exist
in performance for any of the evaluation sections. The results of this analysis are shown in
Tables 13 to 17 for SH71 and Tables 18 to 22 for SH59. The dependent variable analyzed to
determine differences in performance was the percent of the original distress observed for each
evaluation section at the end of the performance period in the fall of 2012. For example, Table
13 indicates that the control sections on SH71 had an average of 99 percent of the original
longitudinal cracking returning during the fall 2012 condition survey while the experimental
sections had an average of 107 percent. The ANOVA indicates that at =0.05 significance, there
is no statistical difference between these values, that is, the P-value = 0.67 in this case. This
means there is only a 33 percent probability that a difference exists between the cracking
observed in the control section compared with the experiment section.
Table 13. ANOVA for Longitudinal Cracking on SH71
SUMMARY
Groups Count Sum Average Variance
Control 10 9.90 0.99 0.10
Experiment 10 10.66 1.07 0.20
ANOVA1
Source of Variation SS df MS F P‐value F crit
Between Groups 0.03 1 0.03 0.19 0.67 4.41
Within Groups 2.75 18 0.15
Total 2.78 19
1 Columns in these tables are traditional ANOVA parameters of Sum of Squares (SS), degrees of freedom (df), Mean Square Error (MS), the F-statistic (F), the probability of no statistical significance between the treatment variables (in this case between the control and experiment chips), and the critical F-statistic (F-crit) for which a value of F greater than this value would indicate statistical significance between the treatment variables at = 0.05.

66
Table 14. ANOVA for Transverse Cracking on SH71
Groups Count Sum Average Variance
Control 10 7.65125 0.765125 0.117613
Experiment 10 10.1125 1.01125 0.217923
ANOVA
Source of Variation SS df MS F P‐value F crit
Between Groups 0.302888 1 0.302888 1.8054 0.195755 4.413873
Within Groups 3.019817 18 0.167768
Total 3.322705 19
Table 15. ANOVA for Alligator Cracking on SH71
Groups Count Sum Average Variance
Control 1 5 1.07 0.21 0.06
Control 2 5 0.22 0.04 0.01
ANOVA
Source of Variation SS df MS F P‐value F crit
Between Groups 0.07 1 0.07 2.07 0.19 5.32
Within Groups 0.28 8 0.04
Total 0.36 9
Table 16. ANOVA for Chip Loss on SH71
Groups Count Sum Average Variance
Control 10 0.0417 0.0042 0.0000
Experiment 10 0.0418 0.0042 0.0000
ANOVA
Source of Variation SS df MS F P‐value F crit
Between Groups 0.0000 1 0.0000 0.0001 0.9912 4.4139
Within Groups 0.0000 18 0.0000
Total 0.0000 19

67
Table 17. ANOVA for Flushing on SH71
Groups Count Sum Average Variance
Control 10 0.13 0.013 0.00
Experiment 10 0.10 0.010 0.00
ANOVA
Source of Variation SS df MS F P‐value F crit
Between Groups 0.00 1 0.00 4.70 0.04 4.41
Within Groups 0.00 18 0.00
Total 0.00 19
Table 18. ANOVA for Longitudinal Cracking on SH59
Groups Count Sum Average Variance
Control 10 6.20 0.62 0.11
Experiment 10 5.55 0.56 0.15
ANOVA
Source of Variation SS df MS F P‐value F crit
Between Groups 0.02 1 0.02 0.16 0.69 4.41
Within Groups 2.33 18 0.13
Total 2.35 19
Table 19. ANOVA for Transverse Cracking on SH59
Groups Count Sum Average Variance
Control 10 7.48 0.75 0.01
Experiment 10 7.05 0.71 0.06
ANOVA
Source of Variation SS df MS F P‐value F crit
Between Groups 0.01 1 0.01 0.25 0.63 4.41
Within Groups 0.68 18 0.04
Total 0.68 19

68
Table 20. ANOVA for Alligator Cracking on SH59
Groups Count Sum Average Variance
Control 1‐5 5 3.13 0.63 0.12
Control 6‐10 5 3.27 0.65 0.01
ANOVA
Source of Variation SS df MS F P‐value F crit
Between Groups 0.00 1 0.00 0.03 0.87 5.32
Within Groups 0.53 8 0.07
Total 0.54 9
Table 21. ANOVA for Chip Loss on SH59
Groups Count Sum Average Variance
Control 10 0.0417 0.0042 0.0000
Experiment 10 0.0407 0.0041 0.0000
ANOVA
Source of Variation SS df MS F P‐value F crit
Between Groups 0.0000 1 0.0000 0.0309 0.8624 4.4139
Within Groups 0.0000 18 0.0000
Total 0.0000 19
Table 22. ANOVA for Flushing on SH59
Groups Count Sum Average Variance
Control 10 0.1089 0.0109 0.0000
Experiment 10 0.1043 0.0104 0.0000
ANOVA
Source of Variation SS df MS F P‐value F crit
Between Groups 0.0000 1 0.0000 0.1404 0.7123 4.4139
Within Groups 0.0001 18 0.0000
Total 0.0001 19
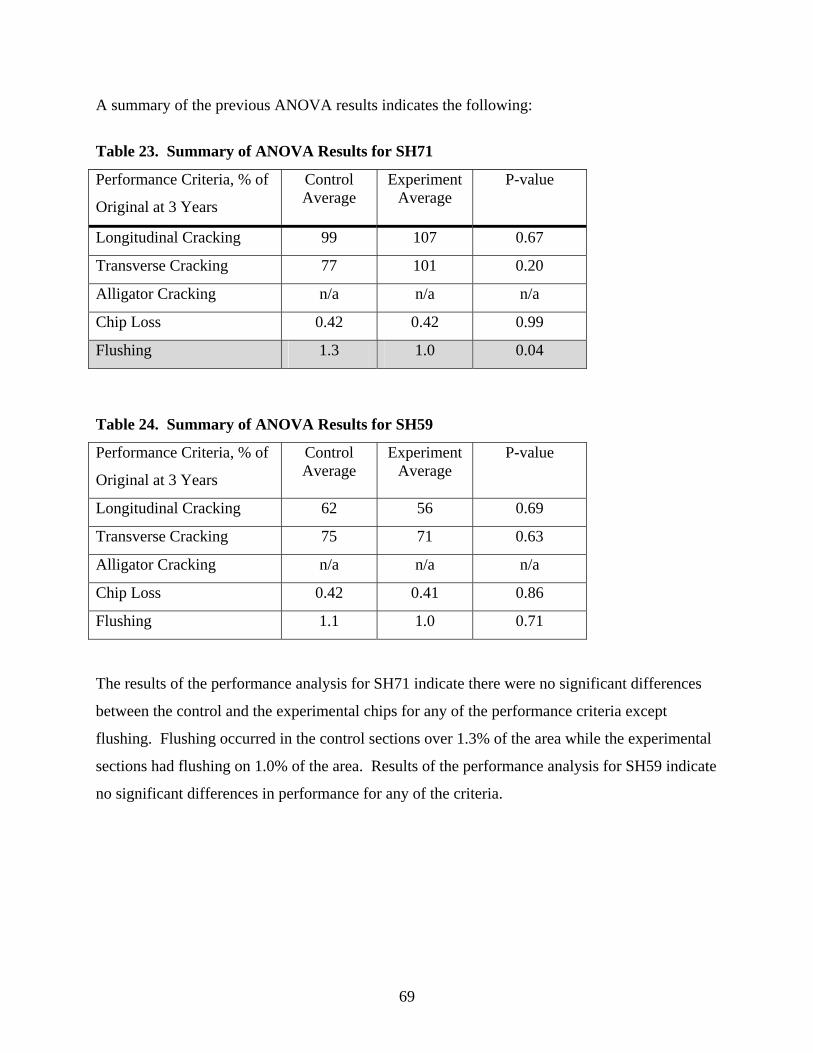
69
A summary of the previous ANOVA results indicates the following:
Table 23. Summary of ANOVA Results for SH71
Performance Criteria, % of
Original at 3 Years
Control Average
Experiment Average
P-value
Longitudinal Cracking 99 107 0.67
Transverse Cracking 77 101 0.20
Alligator Cracking n/a n/a n/a
Chip Loss 0.42 0.42 0.99
Flushing 1.3 1.0 0.04
Table 24. Summary of ANOVA Results for SH59
Performance Criteria, % of
Original at 3 Years
Control Average
Experiment Average
P-value
Longitudinal Cracking 62 56 0.69
Transverse Cracking 75 71 0.63
Alligator Cracking n/a n/a n/a
Chip Loss 0.42 0.41 0.86
Flushing 1.1 1.0 0.71
The results of the performance analysis for SH71 indicate there were no significant differences
between the control and the experimental chips for any of the performance criteria except
flushing. Flushing occurred in the control sections over 1.3% of the area while the experimental
sections had flushing on 1.0% of the area. Results of the performance analysis for SH59 indicate
no significant differences in performance for any of the criteria.

70
CONCLUSIONS
1. Locally available, minimally processed aggregates can be successfully applied as chip
seal aggregate on low volume roadways. After three years of service two experimental
pavements provided the same performance with respect to cracking, chip loss and
flushing for both control and experimental aggregate chips.
2. The design procedure used to estimate aggregate chip application quantity and emulsion
spray rates matched the actual quantities placed reasonably well and these quantities
resulted in acceptable performance for three years.

71
RECOMMENDATIONS AND OBSERVATIONS The chip seal design procedure used to estimate aggregate chip and emulsion quantities
correlated well with the quantities actually used to construct the test sections on SH71 and SH59.
Therefore, this design procedure is recommended for all chip seals planned on low volume roads
in Colorado. The method is described in Appendix C for reference.
Longitudinal streaking of the emulsion occurred on both pavements which lead to flushing. This
over application could have been caused by plugged nozzles in parts of the spraybar, spraybar
height, or nozzles not adjusted to the same angle. In addition, although chip loss was minimal,
much of the loss occurred at or near the roadway centerline. An edge nozzle designed to provide
half the fan of a full nozzle can be used to reduce this potential loss of chips.
In some cases, tandem dump trucks delivering chips to the aggregate spreader overfilled the
spreader hopper and excess chips were applied to the surface. These excess chips may also have
been a source of some of the flushing observed.

72
REFERENCES
Abdullah, I., Sinha, K. & Kuczek, T. (1994, January/February). Effects of Routine Maintenance on Flexible Pavement Condition. Journal of Transportation Engineering, 120(1), 65-73. Abe, H., T. Akinori, J.J. Henry, and J. Wambold, “Measurement of Pavement Macrotexture with Circular Texture Meter”, Transportation Research Record 1764, Transportation Research Board, Washington, D. C. (2001). AFNOR, T66-017, “Determination of the Index of Rupture of Cationic Emulsions”. Al- Mansour, A.I. and Sinha, K.C., “Economic analysis of effectiveness of pavement preventive maintenance”, Transportation Research Record 1442, pp. 31-37 (1995). Anderson, V., and Epps, J. E., “Durable Asphalt Emulsion Seal Coats, Volume I: Research Report”, FHWA-RD-89-230, October, 1989. Arizona Department of Transportation, AZ 233, “Flakiness Index of Coarse Aggregates”. Arizona Department of Transportation, AZ 504, “Vacuum Recovery of Asphalt Emulsion Residue”. ASTM, “Standard Test Methods and Practices for Emulsified Asphalts”, ASTM D244-97C, ASTM International, West Conshohocken, Pennsylvania (1997). ASTM D5624-02, “Standard Test Method for Determining the Transverse-Aggregate Spread Rate for Surface Treatment Applications”, American Society for Testing Materials, Vol. 04.03, Road and Paving Materials; Vehicular-Pavement Systems. ASTM, “Standard Test Method for Distillation of Emulsified Asphalt”, ASTM D6997-04, ASTM International, West Conshohocken, Pennsylvania (2004). ASTM D7000-04”Standard Test Method for Sweep Test of Bituminous Surface Treatment Samples”, ”, American Society for Testing Materials, Vol. 04.03, Road and Paving Materials; Vehicular-Pavement Systems. ASTM, ”Standard Practice for Recovering Residue from Emulsified Asphalt Using Low Temperature Evaporative Technique”, ASTM D7497-09, ASTM International, West Conshohocken, PA (2009). ASTM E965-96, “Standard Test Method for Measuring Pavement Macrotexture Using a Volumetric Technique”, American Society for Testing Materials, Vol. 04.03, Road and Paving Materials; Vehicular-Pavement Systems.

73
ASTM, “Standard Practice for Calculating Pavement Macrotexture Mean Profile Depth,” ASTM E 1845-01, Volume 04.03, ASTM, West Conshohocken, Pennsylvania (2003). ASTM, “Standard Test Method for Measuring Pavement Macrotexture Properties Using the Circular Track Meter,” ASTM E 2157-01 (Reapproved 2005), Volume 04.03, West Conshohocken, Pennsylvania (2005). ASTM, “New Proposed Standard Specification for Surface Performance Graded Asphalt Binder”, Draft Under Development, ASTM WK5321, ASTM International, West Conshohocken, PA (2004). Australian Standard AS 1141.20.1 “Methods for sampling and testing aggregates, Method 20.1: Average Least Dimension – Direct Measurement (nominal size 10 mm and greater)”, Published by Standards Australia International Ltd, GPO Box 5420, Sydney, NSW 2001, Australia Australian Standard AS 1141.20.3—2000, “Methods for sampling and testing aggregates Method 20.3: Average least dimension—Calculation (nomograph)”, Published by Standards Australia International Ltd, GPO Box 5420, Sydney, NSW 2001, Australia ISBN 0 7337 3476 6 “Update of the Austroads Sprayed Seal Design Method”, Austroads Project No. TT1132, Austroads Publication No. AP–T68/06, Prepared by Allan Alderson, ARRB Group Published by Austroads Incorporated, ISBN 1 921139 65 X Austroads Work Tips: Aggregate Pre-Coating http://www.aapa.asn.au/content/aapa/download/worktips23.pdf Accessed June 2005 Austroads Work Tips: Aggregate Pre-coating. (2000, september). retrieved on september, 28th from http://www.aapa.asn.au/content/aapa/download/worktips23.pdf Austroads Work Tips: Calibration of Bitumen Sprayers http://www.aapa.asn.au/content/aapa/download/worktips34.pdf Accessed June 2005 Austroads Work Tips: High Pressure Water Retexturing http://www.aapa.asn.au/content/aapa/download/worktips44.pdf Accessed June 2005 Barcena, R, A. Epps Martin, and D. Hazlett, “Performance Graded Binder Specification for Surface Treatments”, Transportation Research Record 1810”, Transportation Research Board (TRB), Washington D.C. (2002). Barnat, J., McCune, W., and Vopat, V., “The Sweep Test: A Performance Test for Chip Seals”, Asphalt Emulsion Manufacturers Association, San Diego, CA, February, 2001. Benson, F., & Gallaway, B. (1953). Retention of cover stone by asphalt surface treatments. Texas Engineering Experiment Station, 133, 1-58

74
Bouquety, M. N., Descantes, Y., Barcelo, L., de Larrard, F., and Clavaud, B., “Automated measurement of aggregate properties: Part 2—flakiness index”, RILEM, 2006. British Standard (BS) EN 12272-3: Surface dressing - Test methods - Part 3: “Determination of binder aggregate adhesivity by the Vialit plate shock method” British Standard (BS) EN 933-3: Surface dressing - Test methods - Part 3: “Flakiness Index of aggregates for Surface Dressings” Burr, B. (1990). Solvent removal from asphalt. Transportation Research Record, 1269(9), 1-8. California Department of Transportation Test Method 331, “Method of Test for Residue by Evaporation of Latex Modified Emulsified Asphalt”, September 1998. Caltrans, “Chip Seals: Chapter 5,” Caltrans Division of Maintenance. Oct. 2003 Caltrans, California Standard Test Methods, October 31, 2003, “Vialit Test for Aggregate Retention in Chip Seals”. Chen, D., Lin, D., & Luo, H. (2003, August). Effectiveness of Preventative Maintenance Treatments Using Fourteen SPS-3 Sites in Texas. Journal of Performance of Constructed Facilities, 136-143 Colorado Department of Transportation Standard Specifications for Road and Bridge Construction, 1999. Colorado Department of Transportation, Standard Specifications for Road and Bridge Construction, 2011. Colorado Department of Transportation Study No.-10.50, “Evaluation of the Performance, Cost-Effectiveness, and Timing of Various Preventive Maintenances”, 2004. Colorado Department of Transportation, Colorado Procedure L-2212, “Residue by Evaporation of Asphalt Emulsion, August 2002. Colwill, D., & Mercer, J., & Nicholl, J. (1995). U.K. Design Procedure for Surface Dressing. Transportation Research Record, 1507, 13-22. Cornet, E. (1999). ESSO Abrasion Cohesion Test A Description of the Cohesive Breaking Emulsions for Chip Seal. International Symposium on Asphalt Emulsion Technology: Manufacturing, application and Performance, 346-355 Croteau, J., Linton, P., Davidson, K., & Houston, G. (2005). Seal Coat Systems in Canada: performances and practice, 2005 Annual Conference of the Transportation Association of Canada, 1-15.

75
Davis, D., Stroup-Gardiner, M., Davis, K., and Epps, J.A. Evaluation of 1989 Chip Seal Test Sections on US 95A between Wabuska and Yerington, Nevada: Vol. 1. University of Nevada, Reno report for Nevada department of Transportation. 1991. Davis, L., “Chip Sealing Over Fabric in Borrego Springs, California, USA”, Proceedings of the International RILEM Conference, Limoges, France, 5-8 May 2004. Dumas, B., Proceedings of the 8th Conference on Asphalt Pavements for Southern Africa (CAPSA'04) 12 – 16 September 2004, Sun City, South Africa. ISBN Number: 1-920-01718-6 Elmore, W. E., Solaimanian, M., McGennis, R. B., Phromson, C., and Kennedy, T. W. (1995) “Performance-based Seal Coat Specifications.” CTR Research Report No. 1367-1, Center for Transportation Research, Austin, Texas. Epps, A.L., C.J. Glover, and R. Barcena, “A Performance-Graded Binder Specification for Surface Treatments”, Report No. FHWA/TX-02/1710-1, Texas Department of Transportation and U.S. Department of Transportation, Federal Highway Administration (FHWA), Washington, D.C. (2001). Epps, J. A., Gallaway, B. M., and Hughes, C. H., “Field Manual on Design and Construction of Seal Coats”, Texas Transportation Institute, Research Report 214-25, July, 1981. Federal Highway Administration (FHWA), “LTPP Seasonal Asphalt Concrete (AC) Pavement Temperature Models”, Report No. FHWA-RD-97-103, Federal Highway Administration, Washington, D.C. (1997). Gallaway, B. M. and W. J. Harper, “A Laboratory and Field Evaluation of Lightweight Aggregates as Coverstone for Seal Coats and Surface Treatments,” Research Report 51-2, Texas Transportation Institute, Texas A&M University, College Station, 1966. Geoffroy, D. N. 1996. Cost-Effective Preventive Pavement Maintenance. NCHRP Synthesis of Highway Practice 223. Transportation Research Board, Washington, DC. Gransberg, D. and James, D.M. B., “Chip Seal Best Practices, A Synthesis of Highway Practice, NCHRP Synthesis 342, Transportation Research Board, Washington, D. C., 2005. Gransberg, D., & Zaman, M. (2002). Comparing the Performance of Emulsion Versus Hot Asphalt Chip Seal Projects in the Texas Department of Transportation’s Atlanta District, Asphalt Emulsion Manufacturer’s Association, Annapolis, Md. Gransberg, D., Karaca, I., & Senadheera, S. (2004, May/June). Calculating Roller Requirements for Chip Seal Projects. Journal of Construction Engineering and Management, 130 (3), 378-384. Gransberg, D., Pidwerbesky, B., Stemprok, R., and Waters, J., “Measuring Chip Seal Surface Texture with Digital Imagery”, International Conference on Surface Friction of Roads and Runways, Christchurch, NZ, May 2005.
76
Gransberg, D., Senadheera, S., & Karaca, I. (1999). Analysis of statewide seal coat constructability review. Texas Dept. of Transportation Research Rep. No. TX-98/0-1787-1R, Texas Tech Univ., Lubbock, Texas. Gransberg, D; & James, D. (2005). Chip Seal Best Practices. A NCHRP Synthesis 342 of Highway Practice. Transportation Research Board, Washington D.C. Griffith, A., & Hunt, E. (2000, June). Asphalt Cement Chip Seals in Oregon Construction Report. Oregon Department of Transportation Research Group, Oregon. Hall, J.W., Smith, K.L., Titus-Glover, L., Wambold, J.C., Yager, T.J., and Rado, Z., “Guide for Pavement Friction,” Final Report, Project 1-43, National Cooperative Highway Research Program (NCHRP), Transportation Research Board, Washington, D.C. (2006). Hanson, F. M., “Bituminous Surface Treatments on Rural Highways”, Proceedings of the New Zealand Society of Civil Engineers, Vol. 21, 1934-1935, p 89. Hanson, D.I. and B.D. Prowell, “Evaluation of Circular Texture Meter for Measuring Surface Texture of Pavements,” National Center for Asphalt Technology (NCAT), Auburn, AL (2004). Hanz, A., Z. A. Arega, and H. U. Bahia, “Rheological Evaluation of Emulsion Residues Recovered Using Newly Proposed Evaporative Techniques”, Paper #09-2877 Presented at the 88th Annual Meeting of the Transportation Research Board, January (2009). Hicks, G., Seeds, S., & Peshkin, D. (2000, June). Selecting a Preventive Maintenance Treatment for Flexible Pavements. Foundation for Pavement Preservation, Washington, DC. Hicks, R., Dunn, K., & Moulthrop, J. (1997). Framework for Selecting Effective Preventive Maintenance Treatments for Flexible Pavements. Transportation Research Record 1597, Transportation Research Board, Washington, D.C., 1-10. Hitch, L., (1981). Surface Dressing in Developing Countries: Research in Kenya, Transport and Road Research Laboratory: Crowthorne, Berkshire. Howard, Isaac L, Hemsley Jr, Mike, Baumgardner, Gaylon L, Jordan III, Walter Stephens, “Chip and Scrub Seal Binder Evaluation by Frosted Marble Aggregate Retention Test”, Transportation Research Board Annual Meeting 2009 Paper #09-1662. Howard, Isaac L., Shuler, S., Jordan, Walter S. III, Hemsley, James M. Jr., and McGlumphy, Kevin, 2011, Correlation of Moisture Loss and Strength Gain in Chip Seals, Transportation Research Record: Journal of the Transportation Research Board, No. 2207 Asphalt Materials and Mixtures, Transportation Research Board of the National Academies, Washington, D.C., pp. 49-57. ISSA TB 100, “Wet Track Abrasion Test”.

77
Jackson, D. (1990). Washington State Chip Seal Study. Transportation Research Record, 1259, 1-10. Jackson G.P., 1963 Surface Dressing. Bitumen Division, Shell International Petroleum Co. Ltd. London. Jahren, C., and Behling, K. R., (2004). Thin Maintenance Surface Treatments: Comparative Study. Journal of the Transportation Research Board, TRR 1866, pp. 20-27. Janisch, D. & Gaillard, F. (1998). Minnesota Seal Coat Handbook, MN/RC-1999-07, Minnesota Department of Transportation, Maplewood, 112. Kadrmas, A., “Report on Comparison of Residue Recovery Methods and Rheological Testing of Latex and Polymer Modified Asphalt Emulsions”, Annual Meeting of the American Emulsion Manufacturers Association, Report #4-AEMA ISAET 08 (2008). Kadrmas, Arlis, Personal Communication, February 2009. Kandhal, P. & Motter, J. (1991). Criteria for Accepting Precoated Aggregates for Seal Coats and Surface Treatments. Transportation Research Record 1300, 80–89. Kari, W. J., Coyne, L. D., and McCoy, P. E., (1962). Seal Coat Performance-Interrelation of Variables Established by Laboratory and Field Studies, Proceedings of the Association of Asphalt Paving Technologists, Vol 31, pp 1-34. Kearby, J. P., “Tests and Theories on Penetration Surfaces”, Proceedings, Highway Research Board, Vol 32, 1953. Kucharek, A., “Measuring the Curing Characteristics of Chip Sealing Emulsions”, Paper Presented at the Joint ARRA-ISSA-AEMA Meeting, Asphalt Emulsion Manufacturers Association and McAsphalt (2007). Lee, Ju Sang, and Kim, R. Y. “Performance-Based Uniformity Coefficient of Chip Seal Aggregate”, presented at 88th Annual Meeting of Transportation Research Board, Washington, D. C., 2009. LTPPBIND, Version 3.0/3.1, http://www.fhwa.dot.gov/PAVEMENT/ltpp/ltppbind.cfm, Federal Highway Administration, Washington, D.C. (page modified 2009). LTPP DataPave. SPS-3 Construction Report SHRP North Atlantic Region. Pavement Management Systems Limited. Oct. 1990. LTPP DataPave. SPS-3 Construction Report SHRP Southern Regional Coordination Office. Brent Rauhut Engineering Inc. Jan. 1991.

78
LTPP DataPave. SPS-3 Construction Report SHRP Western Region. Nichols Consulting Engineers, Chtd. Reno, NV. Dec. 1990. Maintenance Chip Seal Manual, (2000). Montana Department of Transportation, Helena. Maintenance Treatments, Instructor’s Guide. Report No. FHWA-SA-96-028, Federal Highway Administration, Washington, D.C. Major, N. G. (1965). A basis for selection of binders for chip sealing. New Zealand Engineering, Vol 20, Issue 12, pp 521-528. Marais, C. P., “Rational Design of the Single Surface Treatment Technique for Road Maintenance, The Civil Engineer in South Africa, August, 1981. Marchal, Julien Boussad, “Bitumen Emulsion Testing: Toward a Better Understanding of Emulsion Behaviour”, Proceedings, Eurobitume, 1993. Masad, Eyad, “Aggregate Imaging System (AIMS): Basics and Applications,” Implementation Report FHWA/TX-05/5-1707-01-1, Texas Transportation Institute (TTI), College Station, TX (2005). McHattie, R., (2001). Asphalt Surface Treatment Guide, Report FHWA-AK-RD-01-03, Alaska Department of Transportation and Public Facilities, Juneau, 136. McLeod, N. (1960). Basic Principles for the Design and construction of Seal Coats and Surface Treatments. Proceedings of the Association of Asphalt Paving Technologist, 29, 1-150. McLeod, N. W., “Seal Coat Design”, Proceedings of the Association of Asphalt Paving Technologists, Vol. 38, February, 1969. Miller, John S. and Bellinger, William Y., “Distress Identification Manual for the Long-Term Pavement Performance Program (Fourth Revised Edition), FHWA-RD-03-031, June 2003, http://www.tfhrc.gov/pavement/ltpp/reports/03031/index.htm Morgenstern, Bruce, Wyoming 538.0 (under review), Field Emulsion Viscosity Test NCHRP Report 523 (2004). Optimal Timing of Pavement Preventive Maintenance. Transportation Research Board, Washington, D. C. NCHRP Synthesis 342. (2005). Chip Seal Best Practices, Transportation Research Board, Washington, D. C. Nebraska Department of Roads, Standard Specifications for Highway Construction, 2007 edition. Nixon, Wilfrid. Thin Maintenance Overlays and Winter Maintenance, May 2000.

79
Novi, Michigan. http://ci.novi.mi.us/community/PASER/PASERratingsystem.htm accessed May 2005 Notes for the Specification for Bituminous Reseals. TNZ P17. Transit New Zealand, Wellington, 2002. Outcalt, W. SHRP Chip Seal. Colorado Research Report No. CDOT-DTD-R-2001-20. Dec. 2001. Pavement Preservation Emulsion Task Force Meeting Minutes, Online at www.pavementpreservation.org/expert/12-15-08-ETG-ETF-Final.pdf, Lexington, Kentucky, December (2008), Accessed July 31, 2009. Performance Graded Asphalt Binder Specification and Testing. Superpave Series No. 1 (SP-1). Asphalt Institute, Lexington, KY. “Pavement Preservation Concepts and Techniques”, FHWA Publication No. FHWA-RC-BAL-04-0015, Federal Highway Administration (FHWA), Washington, D.C. (2004). Pidwerbesky, B., J. Waters, D. Gransberg, and R. Stemprok, “Road Surface Texture Measurement Using Digital Image Processing and Information Theory,” Land Transport New Zealand Research Report 290, New Zealand. Plummer, R. (1996). Chip Seal Use- Back to the Basics. Better Roads, 66(4), 36-38. Potter, J. L., and Church, M., “The Design of Sprayed Seals”, Proceedings of the Australian Road Research Board, Vol 8, 1976, pp 18-23. Prapaitrakul,N., R. Han, X. Jin, C. J. Glover, D. Hoyt and A. Epps Martin, “The Effect of Three Asphalt Emulsion Recovery Methods on Recovered Binder Properties”, Petersen Asphalt Research Conference (2009). Preventive Maintenance. Transportation Research Record 1442, Washington D.C., p 31-37. Reigle, J. (2000). Development of an Integrated Project-Level Pavement Management Model Using Risk Analysis. Dissertation. West Virginia University: West Virginia. Roque, R., D. Anderson, and M. Thompson, “Effect of Material, Design, and Construction Variables on Seal-Coat Performance,” Transportation Research Record 1300, Transportation Research Board, National Research Council, Washington, D.C., 1991. Santi, Michael, “Case Study of a State Emulsion QA Program”, presentation to the Rocky Mountain Pavement Preservation Partnership, Airport Hilton, Salt Lake City, UT, October 30, 2009.

80
Saskatchewan Highways and Transportation, Specifications for Manufactured Materials, Asphalt Emulsions, SMM 103-3.4, 1999. Seal Coat Placement, (2004). Indiana Department of Transportation Training Manual, Indianapolis, Retrieved from http://www.in.gov/dot/div/training/manuals/hotmix/chapter_09.pdf Sebaaly, P. E., Lani, S., and Hand, A., (1995). Performance Models for Flexible Pavement Maintenance Treatments, Journal of the Transportation Research Board, TRR 1508, pp. 9-21. Semmelink, C. J., “The Determination of the Average Least Dimension and the Void Ratio of Stone for Surface Seals by Means of a Modified Tray Test”, National Institute for Transport and Road Research, Technical Note: TC/67/82, December, 1982. Sezen, H., Principal Investigator, “Validation of ODOT’s Laser Macrotexture System,” The Ohio Department of Transportation Office of Research and Development, Executive Summary Report, Project FHWA/OH-2008/12, 2008. SHRP Distress Identification Manual for the Long-Term Pavement Performance Program, FHWA RD-03-031, June 2003. Shuler, S. (1991). “High Traffic Chip-Seal Construction: The Tulsa Test Road” Transportation Research Record 1300. Transportation Research Board, National Research Council, Washington, D.C., 1991. Shuler, S., (1996).“Chip Seals for High-Traffic Volume Asphalt Concrete Pavements”, NCHRP Final Report for Project 14-8A, 1996. Shuler, S. (1998). “Design and Construction of Chip Seals for High Traffic Volume.” Flexible Pavement Rehabilitation and Maintenance. ASTM Special Technical Publication (STP) Number 1348. American Society for Testing and Materials. West Conshohocken, PA. Shuler, S. (2007). “Interim Report: Pavement Preventive Maintenance Treatments.” Project 10.50 Colorado Department of Transportation, Denver, CO. Shuler, Scott, 2011, When to Safely Broom or Remove Traffic Control on Fresh Emulsified Asphalt Chip Seals, Transportation Research Record: Journal of the Transportation Research Board, No. 2235, Maintenance and Preservation of Pavements, Transportation Research Board of the National Academies, Washington, D.C., pp. 82-87. Shuler, S., Epps-Martin, A., Lord, A., and Wiley-Cunnigan, D., “Manual for Emulsified Asphalt Chip Seal Design and Construction”, NCHRP Report 680, National Academies, 2011. Sprayed Sealing Guide (2004). AP-676/104, Austroads, Sydney, Australia, , p 104. Stevenson, James, Maintenance Chief, MDT Billings District, Montana Department of Transportation, email correspondence September 20, 2006.

81
Stony Brook Scientific Falling Needle Viscometer (http://www.stonybrooksci.com/) Stroup-Gardiner, M, Newcomb, D. E., Epps, J. A., and Paulsen, G. L. (1990). Laboratory Test Methods and Field Correlations for Predicting the Performance of Chip Seals, Asphalt Emulsions, ASTM STP 1079, H. W. Muncy, Ed., ASTM, Philadelphia, PA, pp. 2-19. Stroup-Gardiner, Mary, summaries of LTPP database developed from 2002-2006 for use in Auburn University CIVL 7850. Design and Construction of Surfacing Seals, Technical Recommendations for Highways, TRH3 2007, South African National Roads Agency, Ltd, Pretoria, South Africa, pp 1-276. Takamura, K., “Comparison of Emulsion Residues Recovered by Forced Air Flow and RTFOT Drying”, International Slurry Surfacing Association/Asphalt Emulsion Manufacturers Association, Joint Annual Meeting, Amelia Island, FL, March 2000. Temple, W. (2002). Performance of Louisiana’s Chip Seal and Microsurfacing Program. Transportation Research Record, 1795, 3-16. Texas Test Method Tex-224-F, “Flakiness Index”. Transport Research Laboratory (1996). Design guide for road surface dressings. Road Note 39 4th edition. (TRL Limited, Crowthorne). Urbac, R.R., and Skok, E.L. Strategic Highway Research Program Long Term Pavement Performance North Central Region SPS-3 Program: Effectiveness of Routine Maintenance Treatments on the Performance of flexible Pavements. March 1993 Vagher, B., President, A-1 Chip Seal, Denver, Colorado, personal communication, June 2004. Van Zyl, Gerrie, “Measurement and Interpretation of Input Parameters Used in the SA Surface Seal Design Method”, presented at CAPSA 07, 9th Conference on Asphalt Pavements for South Africa, 2007, retrieved on October 7, 2009 from: http://www.capsa07.co.za/CapsaDocs/papers/012%20van%20Zyl.pdf The Vialit Plate Shock Test�, BS EN 12272-3 : 2003 : Surface Dressing - Test Methods - Part 3 Virginia Department of Transportation, Special Provisions for Project US19/460, Tazewell, 1991. Wade, M., DeSombre, R. & Peshkin, D. (2001). High Volume/High Speed Asphalt Roadway Preventive Maintenance Surface Treatment, Research Report SD99-09, Walubita, L.F., A. Epps Martin, D. Hazlett, and R. Barcena, “Initial Validation of a New Surface Performance-Graded Binder Specification”, Transportation Research Record 1875, Transportation Research Board, Washington D.C. (2004).

82
Walubita, L.F., A.E. Martin, and C.J. Glover, “A Surface Performance-Graded (SPG) Specification for Surface Treatment Binders: Development and Initial Validation”, Report No. FHWA/TX-05/0-1710-2. Texas Department of Transportation and U.S. Department of Transportation, FHWA (2005). Washington State Department of Transportation. (2003, March). Asphalt Seal, Technology Transfer, 1-30. Wegman, S., (1991). Design and Construction of Seal Coats. Minnesota Department of Transportation, Mendota Heights, 34. Weinert, H. H., “Climate and the durability of South African road aggregates”, Bulletin of Engineering Geology and the Environment, Vol 29, Number 1, June 1984. Whitcomb, W. G., Terrel, R. L., Paulsen, G., Hicks, R. G., Wyckoff, C., Woo, J.W., E. Ofori-Abebresse, A. Chowdhury, J. Hilbrich, Z. Kraus, A. Epps Martin, and C. Glover, “Polymer Modified Asphalt Durability in Pavements”, Report #FHWA/TX-07/0-4688-1, Texas Transportation Institute (2006) Yazgan, B. and Senadheera, S., (2003). A New Testing Protocol for Seal Coat (Chip Seal) Material, Texas Tech University, Lubbock, Zaniewski, J and Mamlouk, M. (1996). Preventive Maintenance Effectiveness – Preventive Zimmerman, K., and Peshkin, D. (2003, August). Integrating Preventive Maintenance and Pavement Management Practices. Retrieved on October 15, 2006 from http://www.ctre.iastate.edu/pubs/midcon2003/ZimmermanPreventive.pdf

83
APPENDIX A – PRECONSTRUCTION CONDITION SURVEYS
CRACK SURVEY FORM Date Apr-09Roadway No./Name: SH71 Site no. 1: Snyder
North East COLane: north bound
70 46### ### 15Low
M oderate
High
100 48### ### 14Low
M oderate
High
100 66### ### 13Low
M oderate
High
100 76### ### 12Low
M oderate
High
About MP 186.5 is boundary of section 10 and section 11
80 68### ### 11Low
M oderate
High
80 62900 ### 10Low
M oderate
High
100 60 30800 900 9Low
M oderate
High
80 60 0
From To
StationSeveritySect ion
Test
500 600 6Low
Low 64 10 0Longitudinal (ft) Transverse (ft) Alligator (sq. ft)
High 0 3 0
M oderate 1 6 0
M oderate 0 3 0Low 72 27 0
Low 39 32 30High 0 2 0
0 0
M oderate 0 8 0
100 200 2
0 0
Low 36 5
M oderate 100 54 0
0 100 1
27High 0
200 300 3 "
33 2
High
300 400 M oderate
High4
400 500
Low
5
Notes
ch loss along road 1'-10" width total1 ft width of loss is next to road C.L.
Long cracks loss agg in spots
"
"05540 31
0
"High 0 0 0
M oderate 35 8 0
600 700 7Low
M oderate
High
100 66 0
700 800 8Low
M oderate
High

84
CRACK SURVEY FORM Date Apr-09Roadway No./Name: SH71 Site no. 1: Snyder
North East COLane: north bound
High
Notes
25 56
300 400 M oderate
High19
400 500Low
20
200 300 18
10 24
100 200 17
M oderate 0
Low 36
0 100 16
M oderate 6 12High
High
Low 72
Low 72M oderate 16 12
10High
Low 48M oderate 24
StationSeveritySect ion
Test
Longitudinal (ft) Transverse (ft)From To Alligator (sq. ft)
CRACK SURVEY FORM DateRoadway No./Name: SH59 Site no. 3: Sedgwick
15 ft lane including shoulder North East COLane: south bound section 1 starts at mm 165
Jul 8, 09
700 800 8Low
M oderate
High
0 8 0
57 15 02 4 24 "600 700 7
Low
M oderate
High
308"
High 0 0 0
"
0 0M oderate
0
0 9 0
"0
5
Notes
scraped flush (except for shoulder); chipseal approx nil in lane
0 3 0
15 ft lane
8
High
300 400 M oderate
High4
400 500Low
M oderate 0 13 0 "
200 300 3 "
100 200 2
40 20
Low 4 0 288
0 100 1
M oderate 5 0 60High 0 0 0
High 0 3 0Low 97 26 16
Low 105 25 6M oderate 1 6 0
5 0High 0 0 0
Low 52 56 24
Low 76 34 0M oderate 10
StationSeveritySect ion
Test
Longitudinal (ft) Transverse (ft)
43 14 12
From To Alligator (sq. ft)
500 600 6
0 3 00 20 4
84 12 12800 900 9
Low
M oderate
High 0 3 010 7 0
0 6 0900 1000 10
Low
M oderate
High 0 3 00 30 68
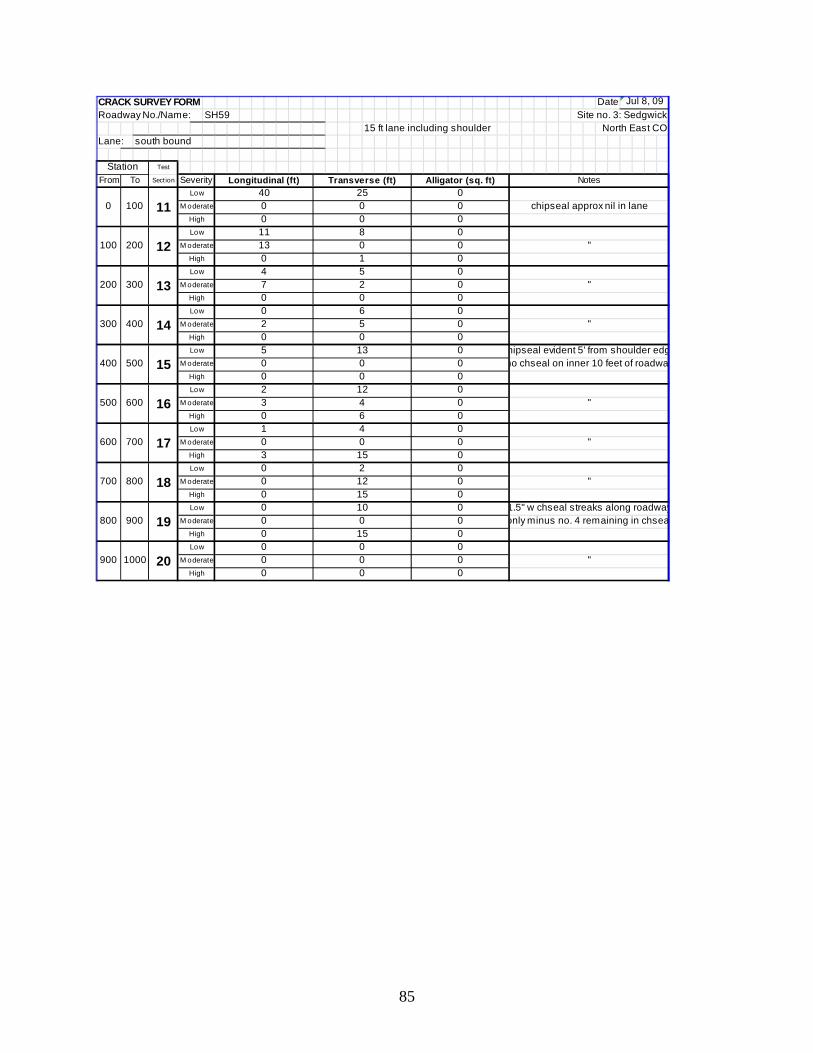
85
CRACK SURVEY FORM DateRoadway No./Name: SH59 Site no. 3: Sedgwick
15 ft lane including shoulder North East COLane: south bound
Jul 8, 09
700 800 18Low
M oderate
High
3 15 0
1 4 00 0 0 "600 700 17
Low
M oderate
High
0 hipseal evident 5' from shoulder edgno chseal on inner 10 feet of roadwa
High 0 0 0
"
5 13M oderate
0
0 0 0
"0
15
Notes
chipseal approx nil in lane
0 6 0
5
High
300 400 M oderate
High14
400 500Low
M oderate 3 4 0 "
200 300 13 "
100 200 12
0 02
Low 0 6 0
0 100 11
M oderate 7 2 0High 0 0 0
High 0 1 0Low 4 5 0
Low 11 8 0M oderate 13 0 0
0 0High 0 0 0
Low 2 12 0
Low 40 25 0M oderate 0
StationSeveritySect ion
Test
Longitudinal (ft) Transverse (ft)
0 2 0
From To Alligator (sq. ft)
500 600 16
0 15 00 12 0 "
0 10 0 1.5" w chseal streaks along roadway800 900 19
Low
M oderate
High 0 15 00 0 0 only minus no. 4 remaining in chsea
0 0 0900 1000 20
Low
M oderate
High 0 0 00 0 0 "

86
APPENDIX B – DRAFT SPECIFICATION FOR COVER COAT AGGREGATE
703.05 Aggregate for Cover Coat Material for Traffic Greater Than 500 AADT. Aggregates for cover coat material shall be crushed stone, crushed slag, crushed gravel, or natural gravel. Aggregates shall be composed of clean, tough, durable fragments free from an excess of flat, elongated, soft, or disintegrated pieces and free from fragments coated with dirt or other objectionable matter. Slag shall be air-cooled blast-furnace slag reasonably uniform in density.
The aggregate shall conform to the following requirements for traffic volumes exceeding 500 AADT
(1) Percentage of wear, Los Angeles Abrasion Test (AASHTO T 96), not more than 35.
(2) When blast-furnace slag is used, weight per cubic foot shall be at least 70 pounds.
(3) For Type I, II, or III cover coat material, 90 percent by weight of the particles retained on the 4.75 mm (No. 4) sieve shall have at least two fractured faces when tested in accordance with Colorado Procedure 45.
(4) Lightweight aggregate used for cover coat material shall be an aggregate prepared by expanding shale, clay, or slate in a rotary fired kiln. Lightweight aggregate shall have a dry loose unit weight of 35 to 55 pounds per cubic foot determined in accordance with AASHTO T 19, Shoveling Procedure. The total mass of the test sample of lightweight aggregate used in AASHTO T 96 (Los Angles Abrasion) shall be 2000 g.
Table 703-6a
GRADATION SPECIFICATIONS FOR COVER COAT AGGREGATE
Sieve Size
Percent by Weight Passing Square Mesh Sieve
9.5 mm (3/8") Type 1
12.5 mm (½") Type II
19.0 mm (¾")* Type III
19.0 mm (¾") 100
12.5 mm (½") 100 95-100 9.5 mm (3/8") 100 70-100 60-80
4.75 mm (No. 4) 0-15 0-4 0-10
75 µm (# 200) 0-1.0 0-1.0 0-1.0 *Type III shall be used only with lightweight aggregates.
703.051 Aggregate for Cover Coat Material for Traffic Less Than 500 AADT. Aggregates for cover coat material shall be crushed stone, crushed slag, crushed gravel, or natural gravel. Aggregates shall be composed of clean, tough, durable fragments free from an excess of flat, elongated, soft, or disintegrated pieces and free from fragments coated with dirt or other objectionable matter. Slag shall be air-cooled blast-furnace slag reasonably uniform in density.
The aggregate shall conform to the following requirements for traffic volumes less than 500 AADT
(1) Percentage of wear, Los Angeles Abrasion Test (AASHTO T 96), not more than 35.
(2) Type IV cover coat material shall have greater than 15 percent by weight of the particles retained on the 4.75 mm (No. 4) sieve with two fractured faces when tested in accordance with Colorado Procedure 45.
(3) Flakiness Index less than 35 (Tex 224F)

87
Table 703-6b
GRADATION SPECIFICATIONS FOR COVER COAT AGGREGATE
Sieve Size
Passing, %
9.5 mm (3/8") Type 1V
9.5 mm (3/8") 100
4.75 mm (No. 4) 20-70
2.37 mm (No. 8) 0-15
75 µm (# 200) 0-3

88
APPENDIX C – DRAFT DESIGN METHOD FOR CHIP SEALS
Design of chip seals involves estimating the quantities of aggregate chips and asphalt emulsion
to be applied to the surface of the pavement to be sealed. The method that has been found to
estimate the appropriate quantity of materials closest for low volume (500 AADT or less) traffic
roadways in Colorado is based on a method originally proposed by Kearby (1953) revised by
Benson and Gallaway (1953), then further revised based on recent research (Shuler, 2011).
This method requires some simple laboratory apparatus and tests to conduct. The tests and
method are listed below:
Dry Loose Unit Weight- AASHTO T19 (rodding procedure)
Bulk Specific Gravity – AASTHO T84 and T85
Sieve Analysis of Fine and Coarse Aggregate – AASHTO T27
Board Test. Fabricate a rectangular board from 5/8-inch thick plywood, melamine, or
particle board measuring 18 inches by 36 inches. Attach 1-inch x 2-inch
pieces of lumber to the perimeter of the board to create an edge. Weigh the
completed board and edging. Place a representative sample of aggregate
chips on the board so that the quantity of chips is one stone thick and so
there is little or no space between the chips. Testing has verified this
process should require approximately 30 minutes to complete. It is
important that as many chips be placed on the board so no room remains for
additional chips without obtaining more than one layer of chips. Record the
quantity of chips in terms of pounds of chips per square yard of board. This
is the design aggregate quantity, Q.
The quantity of emulsion to be applied to the pavement to cement this quantity of chips is
calculated as follows:
E = {3Q/W} {1 – [W/62.4G]}(T) + V R where: E = emulsion spray rate, gal/square yard,

89
Q = Aggregate quantity from Board Test, lbs/square yard, W = Dry Loose Unit Weight, pounds/square yard, G = Bulk Specific Gravity of Aggregate Chips, T = Traffic Correction from Table C1, V = Substrate Surface Condition from Table C2, and R = Asphalt Residue Content of Emulsion (expressed as a decimal).
Table C1. Traffic Correction
Traffic Factor, T
AADT
< 100 100-250 250-500
1.20 1.15 1.10
Table C2. Substrate Surface Condition
Existing Surface Condition Correction Factor, V, gal/square yard
Flushed-bleeding -0.06
Smooth, non-porous -0.03
Slightly porous, slightly oxidized 0.00
Slightly pocked, porous, oxidized +0.03
Badly pocked, porous, oxidized +0.06
An example of how this method works is as follows:
Q= 26 psy, W=113 pcf, G = 2.65, T = 1.1 (AADT=250-500), V = -0.03 gsy (smooth, non-porous), and R= 0.69 then: E ={3 ( 26)/ 113} ({1 – [113/62.4 (2.65)]} 1.1 ) – 0.03 = 0.27 gsy 0.69