Embed Size (px)
Citation preview
5Revista Ingeniería de Construcción Vol. 27 Nº2, Agosto de 2012 www.ricuc.cl
Performance of foamed bitumen pavements in accelerated testing facility /Desempeño de pavimentos estabilizado con asfalto espumado en una prueba de pavimentos
Performance of foamed bitumen pavements in accelerated testing facilityDesempeño de pavimentos estabilizado con asfalto espumado en una prueba de pavimentos a escala real y carga acelerada
Alvaro Gonzalez1*, Misko Cubrinovski**, Bryan Pidwerbesky***, David Alabaster****
* Universidad del Desarrollo, Santiago. CHILE** University of Canterbury. NEW ZEALAND*** Fulton Hogan Ltd. NEW ZEALAND**** New Zealand Transport Agency. NEW ZEALAND
Fecha de Recepción:01/11/2011Fecha de Aceptación:01/04/2012
PAG 05 - 17
Abstract
One of the key principal goals of pavement asset management is to develop and implement cost-effective pavement construction and maintenance strategies that achieve the required levels of service and performance. A sustainable, cost-effective technique for rehabilitating pavements is foamed bitumen stabilization. This paper presents a study on the performance of foamed bitumen pavements tested in the Canterbury Accelerated Pavement Testing Indoor Facility (CAPTIF), for full scale testing of pavements. Six pavement sections were tested; the variables were bitumen and cement content; one control section with the untreated unbound material was tested. Results showed that surface deflections decreased at sections with higher bitumen contents. After the application of 5,710,000 Equivalent Standard Axles (ESAs), the sections stabilised with cement only, bitumen only, and the control section all showed large amounts of rutting. Conversely, little rutting was observed in the three sections stabilised with foamed bitumen and 1.0% cement, showing that cement and FB together significantly improve pavement performance. The rutting results were used to develop models to describe the stable and unstable performance of the tested pavements. The paper concludes by outlining some of the practical benefits of utilising this technology in pavement asset management.
Keywords: pavement recycling, foamed bitumen, full-scale testing, rutting models
Resumen
Uno de los objetivos claves de la gestión de pavimentos es desarrollar e implementar una estrategia de construcción y mantenimiento rentables, con el fin de alcanzar niveles requeridos de servicio y desempeño. Una técnica rentable y sustentable para la rehabilitación de pavimentos es la de estabilización o reciclado con asfalto espumado (AE). Este artículo presenta un estudio sobre el desempeño de pavimentos estabilizados con asfalto espumado en el Canterbury Accelerated Pavement Testing Indoor Facility CAPTIF. CAPTIF es un laboratorio a escala real para pavimentos ubicado en Nueva Zelandia, que permite aplicar un gran número de cargas de tráfico en un breve período de tiempo. Seis secciones de pavimentos con distintos contenidos de asfalto y cemento fueron ensayadas en CAPTIF. Los resultados del experimento mostraron que las deflexiones disminuyen en las secciones con mayor contenido de asfalto espumado. Luego de aplicar más de un millón de ciclos de carga, las secciones estabilizadas sólo con cemento, sólo con asfalto y la sección sin estabilizar mostraron un deterioro significativo en forma de ahuellamiento. Por otro lado, las secciones que fueron estabilizadas con AE y cemento mostraron un buen desempeño, demostrando que el cemento y el AE juntos mejoran significativamente el desempeño del pavimento. Los resultados de ahuellamiento fueron empleados para desarrollar modelos y describir el deterioro estable y acelerado de los pavimentos en estudio, lo que puede ser utilizado para una mejor gestión de los pavimentos estabilizados con asfalto espumado
Palabras Clave: Reciclaje de pavimentos, asfalto espumado, pruebas de pavimento aceleradas, modelos de ahuellamiento
1 Autor de correspondencia / Corresponding author:E-mail: [email protected]
1. Introduction
In New Zealand more than 95% of the roads are constructed of flexible unbound granular pavements. A typical New Zealand pavement consist of a thin surface (usually not exceeding 50 mm thickness), the basecourse (which is constructed from unbound granular material that is usually crushed quarried rock or locally sourced aggregate) and the subbase (which is usually one or sometimes two layers of unbound granular aggregate). This pavement type has been adopted in New Zealand because in the past high quality aggregate has been readily available in most regions of the country and because in most New Zealand roads, low traffic volumes do not justify the incorporation of thick asphalt pavements, usually constructed in heavy trafficked roads.
6 Revista Ingeniería de Construcción Vol. 27 Nº2, Agosto de 2012 www.ricuc.cl
Álvaro González, Misko Cubrinovski, Bryan Pidwerbesky, David Alabaster
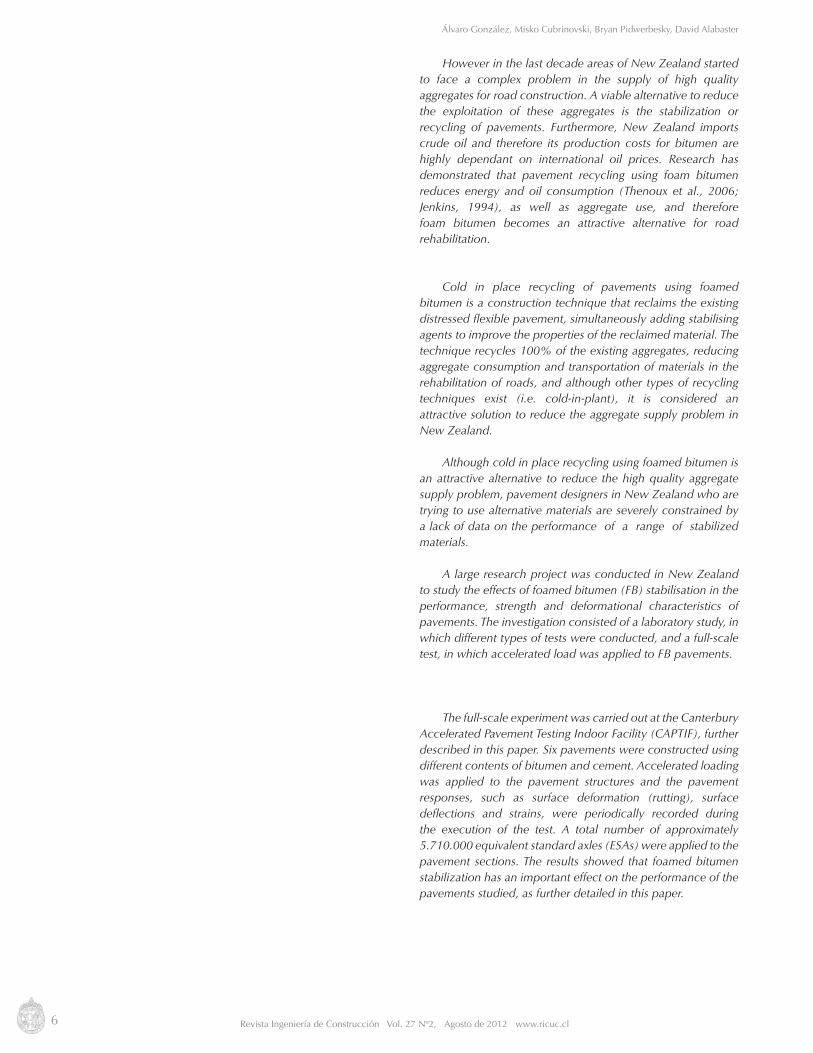
However in the last decade areas of New Zealand started to face a complex problem in the supply of high quality aggregates for road construction. A viable alternative to reduce the exploitation of these aggregates is the stabilization or recycling of pavements. Furthermore, New Zealand imports crude oil and therefore its production costs for bitumen are highly dependant on international oil prices. Research has demonstrated that pavement recycling using foam bitumen reduces energy and oil consumption (Thenoux et al., 2006; Jenkins, 1994), as well as aggregate use, and therefore foam bitumen becomes an attractive alternative for road rehabilitation.
Cold in place recycling of pavements using foamed bitumen is a construction technique that reclaims the existing distressed flexible pavement, simultaneously adding stabilising agents to improve the properties of the reclaimed material. The technique recycles 100% of the existing aggregates, reducing aggregate consumption and transportation of materials in the rehabilitation of roads, and although other types of recycling techniques exist (i.e. cold-in-plant), it is considered an attractive solution to reduce the aggregate supply problem in New Zealand.
Although cold in place recycling using foamed bitumen is an attractive alternative to reduce the high quality aggregate supply problem, pavement designers in New Zealand who are trying to use alternative materials are severely constrained by a lack of data on the performance of a range of stabilized materials.
A large research project was conducted in New Zealand to study the effects of foamed bitumen (FB) stabilisation in the performance, strength and deformational characteristics of pavements. The investigation consisted of a laboratory study, in which different types of tests were conducted, and a full-scale test, in which accelerated load was applied to FB pavements.
The full-scale experiment was carried out at the Canterbury Accelerated Pavement Testing Indoor Facility (CAPTIF), further described in this paper. Six pavements were constructed using different contents of bitumen and cement. Accelerated loading was applied to the pavement structures and the pavement responses, such as surface deformation (rutting), surface deflections and strains, were periodically recorded during the execution of the test. A total number of approximately 5.710.000 equivalent standard axles (ESAs) were applied to the pavement sections. The results showed that foamed bitumen stabilization has an important effect on the performance of the pavements studied, as further detailed in this paper.
7Revista Ingeniería de Construcción Vol. 27 Nº2, Agosto de 2012 www.ricuc.cl
Performance of foamed bitumen pavements in accelerated testing facility /Desempeño de pavimentos estabilizado con asfalto espumado en una prueba de pavimentos
2. Materials and mix design
2.1 AggregatesThe aggregates used in the full scale testing of pavements
were a blend of coarse granular soils ‘H40’ and sand material (‘AP5’). The H40 is a crushed aggregate of 40 mm maximum size, with specific gravity of 2.69 t/m3, maximum dry density of 2.22 t/m3 and optimum moisture content (OMC) of 4.0%. The H40 aggregate satisfied the following requirements:
• To be a representative aggregate used in New Zealand for road construction and to have a grading in compliance with the current TNZ M/4 specification for basecourse aggregate (TNZ 2006)
• The aggregate source should be located in a region of New Zealand where high-quality aggregates are not readily available for road construction.
• The quality of the aggregate should be moderate to poor according to the experience of road engineering practitioners. In such case, the effects of stabilisation should be more relevant than in a good quality aggregate.
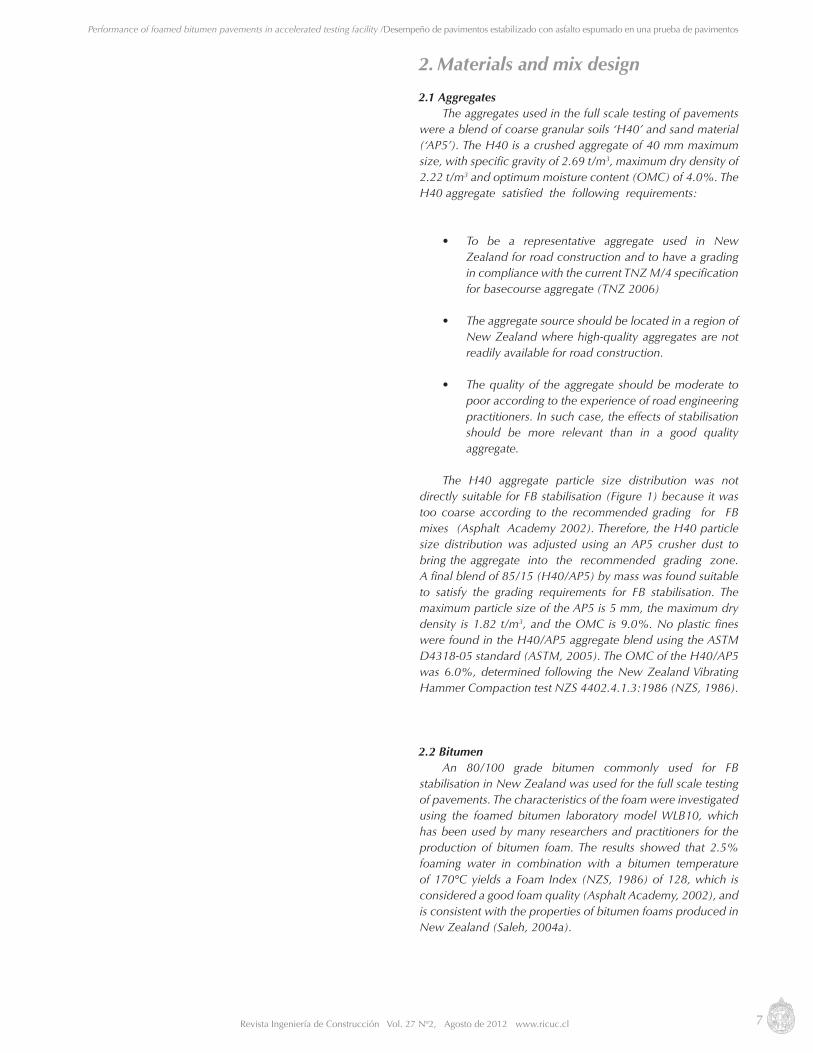
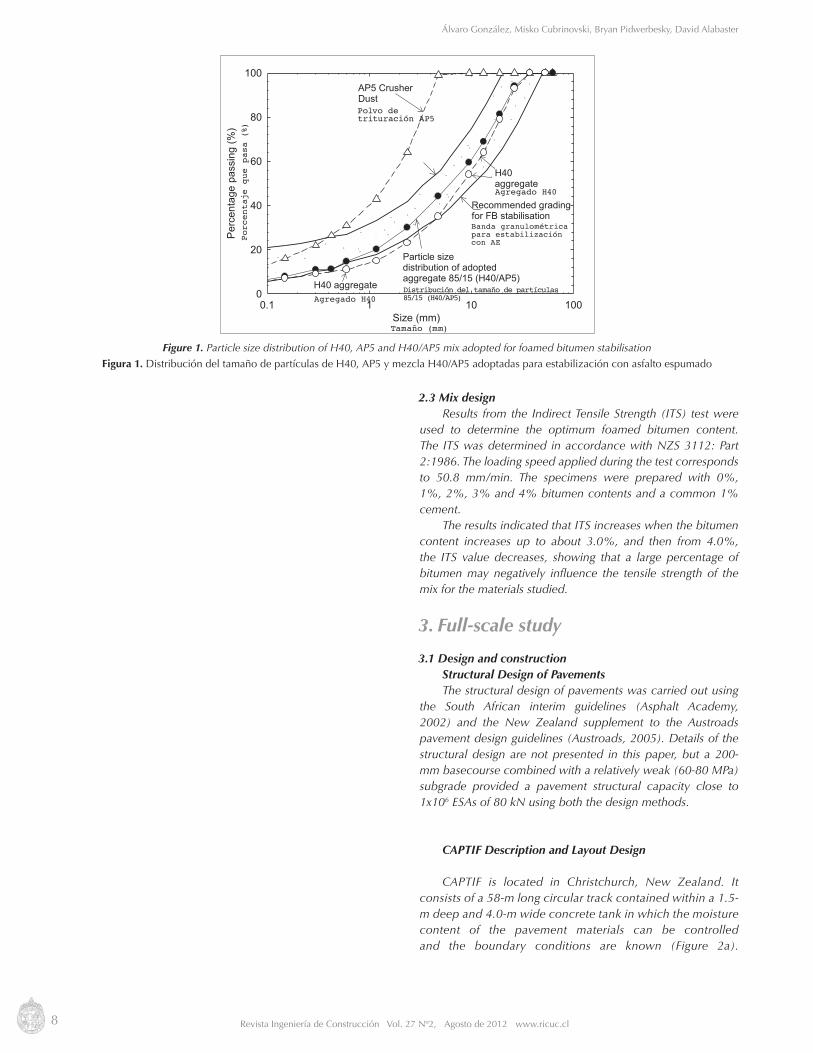
The H40 aggregate particle size distribution was not directly suitable for FB stabilisation (Figure 1) because it was too coarse according to the recommended grading for FB mixes (Asphalt Academy 2002). Therefore, the H40 particle size distribution was adjusted using an AP5 crusher dust to bring the aggregate into the recommended grading zone. A final blend of 85/15 (H40/AP5) by mass was found suitable to satisfy the grading requirements for FB stabilisation. The maximum particle size of the AP5 is 5 mm, the maximum dry density is 1.82 t/m3, and the OMC is 9.0%. No plastic fines were found in the H40/AP5 aggregate blend using the ASTM D4318-05 standard (ASTM, 2005). The OMC of the H40/AP5 was 6.0%, determined following the New Zealand Vibrating Hammer Compaction test NZS 4402.4.1.3:1986 (NZS, 1986).
2.2 BitumenAn 80/100 grade bitumen commonly used for FB
stabilisation in New Zealand was used for the full scale testing of pavements. The characteristics of the foam were investigated using the foamed bitumen laboratory model WLB10, which has been used by many researchers and practitioners for the production of bitumen foam. The results showed that 2.5% foaming water in combination with a bitumen temperature of 170°C yields a Foam Index (NZS, 1986) of 128, which is considered a good foam quality (Asphalt Academy, 2002), and is consistent with the properties of bitumen foams produced in New Zealand (Saleh, 2004a).
8 Revista Ingeniería de Construcción Vol. 27 Nº2, Agosto de 2012 www.ricuc.cl
Álvaro González, Misko Cubrinovski, Bryan Pidwerbesky, David Alabaster
Size (mm)0.1 1 10 100
Per
cent
age
pass
ing
(%)
0
20
40
60
80
100
Particle size distribution of adopted aggregate 85/15 (H40/AP5)
AP5 Crusher Dust
H40 aggregate
Recommended gradingfor FB stabilisation
H40 aggregate
2.3 Mix designResults from the Indirect Tensile Strength (ITS) test were
used to determine the optimum foamed bitumen content. The ITS was determined in accordance with NZS 3112: Part 2:1986. The loading speed applied during the test corresponds to 50.8 mm/min. The specimens were prepared with 0%, 1%, 2%, 3% and 4% bitumen contents and a common 1% cement.
The results indicated that ITS increases when the bitumen content increases up to about 3.0%, and then from 4.0%, the ITS value decreases, showing that a large percentage of bitumen may negatively influence the tensile strength of the mix for the materials studied.
3. Full-scale study
3.1 Design and constructionStructural Design of PavementsThe structural design of pavements was carried out using
the South African interim guidelines (Asphalt Academy, 2002) and the New Zealand supplement to the Austroads pavement design guidelines (Austroads, 2005). Details of the structural design are not presented in this paper, but a 200-mm basecourse combined with a relatively weak (60-80 MPa) subgrade provided a pavement structural capacity close to 1x10⁶ ESAs of 80 kN using both the design methods.
CAPTIF Description and Layout Design
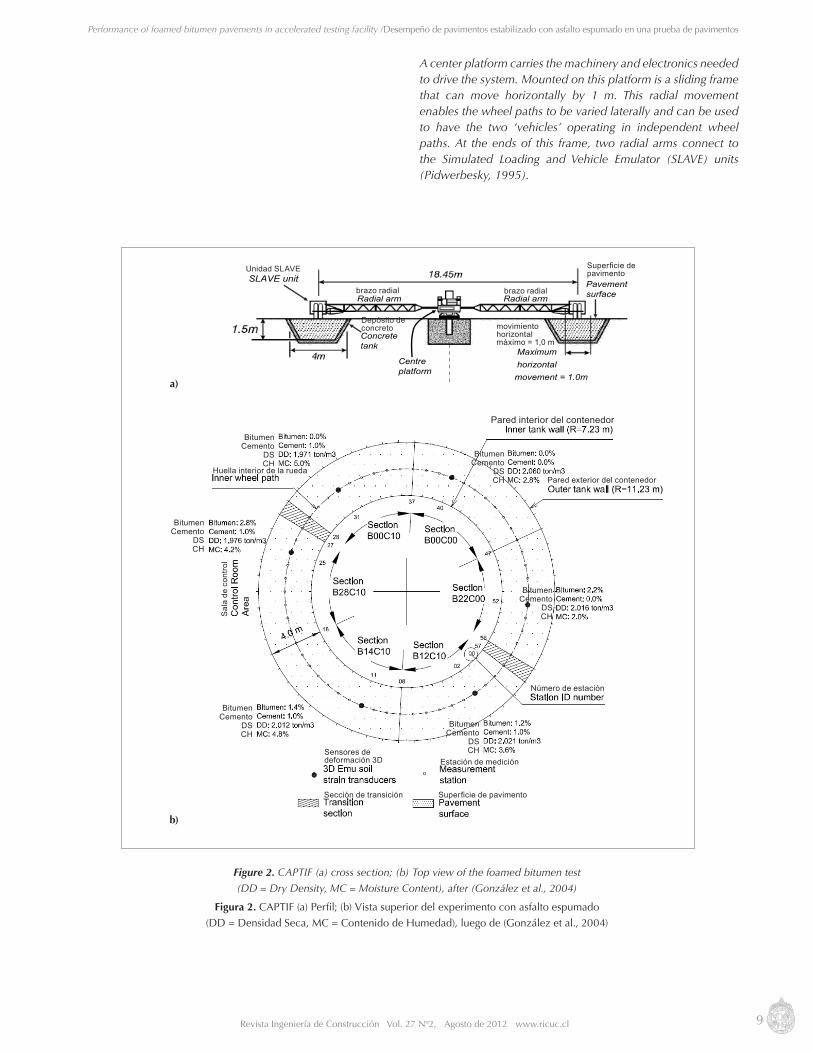
CAPTIF is located in Christchurch, New Zealand. It consists of a 58-m long circular track contained within a 1.5-m deep and 4.0-m wide concrete tank in which the moisture content of the pavement materials can be controlled and the boundary conditions are known (Figure 2a).
Figure 1. Particle size distribution of H40, AP5 and H40/AP5 mix adopted for foamed bitumen stabilisation
Figura 1. Distribución del tamaño de partículas de H40, AP5 y mezcla H40/AP5 adoptadas para estabilización con asfalto espumado
Porcentaje que pasa (%)
Tamaño (mm)
Polvo de trituración AP5
Agregado H40
Banda granulométrica para estabilización con AE
Distribución del tamaño de partículas85/15 (H40/AP5)Agregado H40
9Revista Ingeniería de Construcción Vol. 27 Nº2, Agosto de 2012 www.ricuc.cl
Performance of foamed bitumen pavements in accelerated testing facility /Desempeño de pavimentos estabilizado con asfalto espumado en una prueba de pavimentos
A center platform carries the machinery and electronics needed to drive the system. Mounted on this platform is a sliding frame that can move horizontally by 1 m. This radial movement enables the wheel paths to be varied laterally and can be used to have the two ‘vehicles’ operating in independent wheel paths. At the ends of this frame, two radial arms connect to the Simulated Loading and Vehicle Emulator (SLAVE) units (Pidwerbesky, 1995).
SLAVE unit
Centre platform
movement = 1.0mhorizontal
Concrete tank
Radial arm Radial arm
Pavement surface
Maximum
SLAVE unit
Centre platform
movement = 1.0mhorizontal
Concrete tank
Radial arm Radial arm
Pavement surface
Maximum
a)
b)
Figure 2. CAPTIF (a) cross section; (b) Top view of the foamed bitumen test
(DD = Dry Density, MC = Moisture Content), after (González et al., 2004)
Figura 2. CAPTIF (a) Perfil; (b) Vista superior del experimento con asfalto espumado
(DD = Densidad Seca, MC = Contenido de Humedad), luego de (González et al., 2004)
Unidad SLAVE
brazo radial brazo radial
Superficie de pavimento
Depósito de concreto movimiento
horizontal máximo = 1,0 m
BitumenCemento
DS CH
BitumenCemento
DS CH
BitumenCemento
DS CH
BitumenCemento
DS CH
BitumenCemento
DS CH
BitumenCemento
DS CH
Pared interior del contenedor
Superficie de pavimento
Estación de medición
Número de estación
Pared exterior del contenedor
Sección de transición
Sensores de deformación 3D
Sal
a de
con
trol
Huella interior de la rueda
10 Revista Ingeniería de Construcción Vol. 27 Nº2, Agosto de 2012 www.ricuc.cl
Álvaro González, Misko Cubrinovski, Bryan Pidwerbesky, David Alabaster
CAPTIF enables up to six pavement sections of about 10 m length each to be tested. Four sections were stabilised using 1% cement at different bitumen contents. One section was retained as a control with the H40 material only, and another section had FB only, to separate the effects of the FB with the cement. A top view of the pavement test track is presented in Figure 2b, in which the six pavement sections are depicted. The sections were named B12C10, B14C10, B28C10, B00C10, B00C00 and B22C00, where the first two digits (after B) indicate the bitumen content, and the last two (after C) indicate the cement content. For instance, section B14C10 was built adding 1.4% of FB and 1.0% cement. Section B28C10 had approximately the ‘optimum’ FB content determined from ITS test.
Materials and ConstructionSubgradeThe top 525 mm of the subgrade was clay, extended in
lifts of 225, 150 and 150 mm, and compacted using a roller available at CAPTIF. Back-calculation analysis using FWD data yields a subgrade stiffness of 60 MPa approximately, which is in agreement with the target stiffness from the structural design of pavements.
Stabilisation processDetails of the stabilisation process can be found in
(González et al., 2004). Two hundred tonnes of H40 crushed aggregates were transported to CAPTIF. For the stabilisation process, trenches were excavated outside the CAPTIF building. Layers of H40 crushed aggregate material and AP5 were laid and compacted to 95% of maximum dry density at their optimum moisture contents so that the target mass ratio of 85/15 obtained in the laboratory mix design was achieved in the field. Once the untreated material was ready the trenches were stabilised with the recycling machine. The stabilised material was transported into the CAPTIF building by loaders. A paver was used to place the basecourse material and a steel roller was used for compaction. Before laying the final surface layer, the sections were cured at ambient temperature for 30 days.
Surface layersAll sections were sealed with a single coat chipseal.
After a week to allow the chipseal to set up, all sections were surfaced with a skim coat of AC10 hot mix covering the top of the chipseal. The approximate thickness of this surface was 20 mm. Before the sealing, density and moisture measurements were taken using a nuclear gauge directly over the basecourse. Dry densities and moisture contents are included in Figure 2b.
11Revista Ingeniería de Construcción Vol. 27 Nº2, Agosto de 2012 www.ricuc.cl
Performance of foamed bitumen pavements in accelerated testing facility /Desempeño de pavimentos estabilizado con asfalto espumado en una prueba de pavimentos
During the execution of the experiment and after the application of 200.000 load cycles, the original thin surface started to show wear. A thin hot mix asphalt (HMA) layer of 30 mm was laid over the original surface, leading to a total surface thickness of approximately 50 mm for the rest of the project.
InstrumentationThe pavement instrumentation at CAPTIF includes 3D
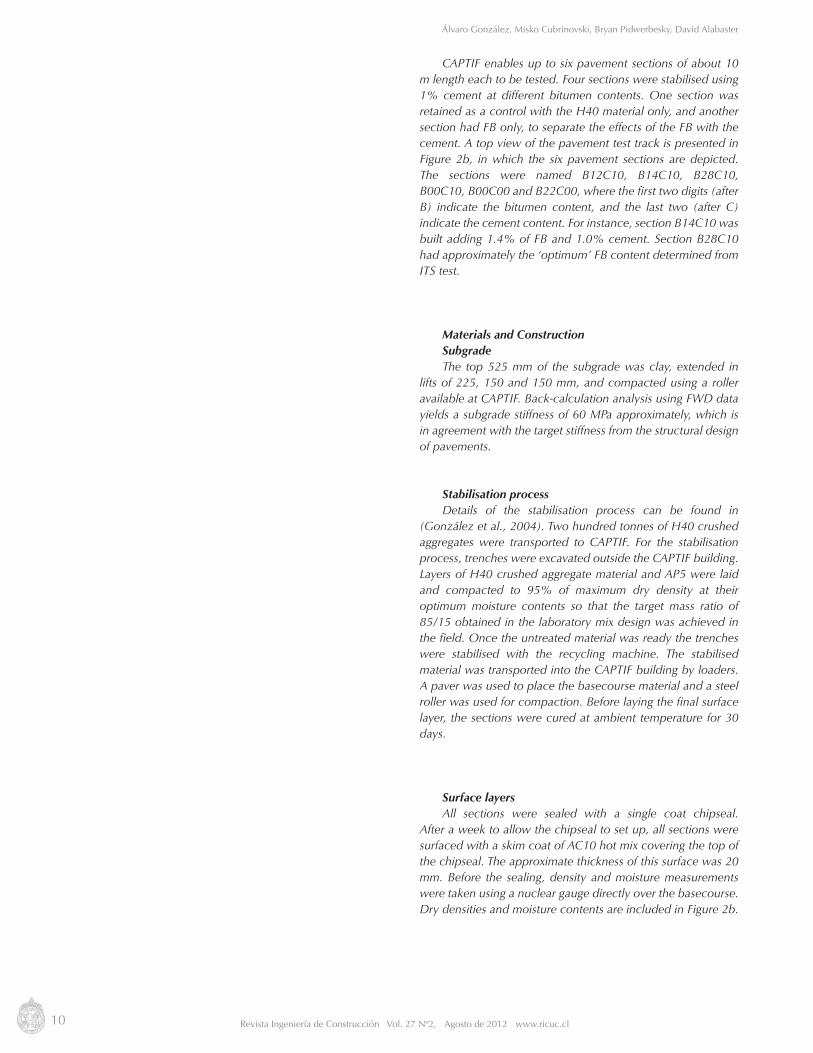
Emu (Dawson, 1994) soil strain transducers to measure the vertical, transverse and longitudinal strains in the pavement. Details of the strain measurements collected during this project can be found in González. The final cross section adopted in all pavement sections is shown in Figure 3.
3.2 Experimental procedureLoading sequence and speedThe load was a dual truck tire with a separation of 350 mm
between the centers of the tires inflated to 700 kPa. The original project intended that a constant loading of 40 kN would be applied for each SLAVE unit. However, since little rutting was measured during the early stages of the project, the load was increased to 50 kN after 100,000 load cycles and again to 60 kN after 300.000 load cycles.
The speed of the vehicles was kept constant at 40 km/h during most of the project. The load was applied on one wheel path with a lateral wandering of 100 mm.
Figure 3. Cross section of the pavements tested at CAPTIF
Figura 3. Perfil de los pavimentos ensayados en CAPTIF
Rueda doble
Superficie de pavimento
Pared de concreto
Pare
d de
con
cret
o
Pared de concreto
Capa de base
Capa 3
Capa 2
Capa 1
Subrasante existente Arcilla tipo ‘Waikari’
12 Revista Ingeniería de Construcción Vol. 27 Nº2, Agosto de 2012 www.ricuc.cl
Álvaro González, Misko Cubrinovski, Bryan Pidwerbesky, David Alabaster
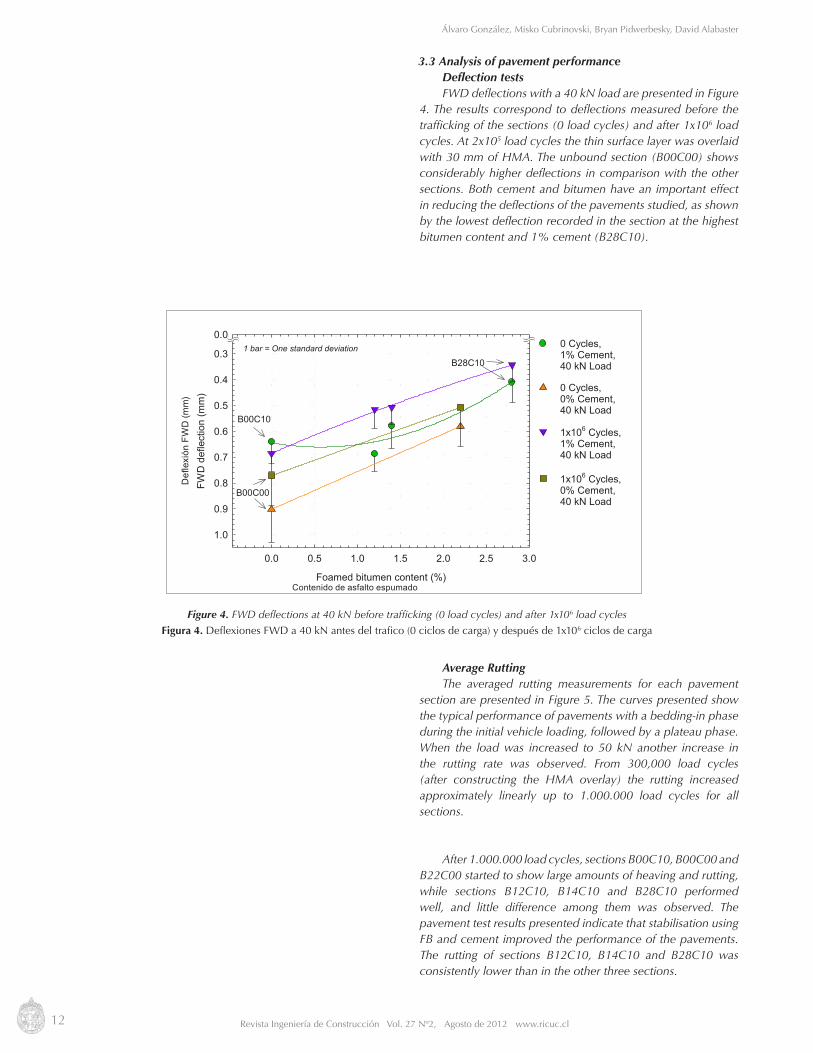
3.3 Analysis of pavement performanceDeflection testsFWD deflections with a 40 kN load are presented in Figure
4. The results correspond to deflections measured before the trafficking of the sections (0 load cycles) and after 1x10⁶ load cycles. At 2x10⁵ load cycles the thin surface layer was overlaid with 30 mm of HMA. The unbound section (B00C00) shows considerably higher deflections in comparison with the other sections. Both cement and bitumen have an important effect in reducing the deflections of the pavements studied, as shown by the lowest deflection recorded in the section at the highest bitumen content and 1% cement (B28C10).
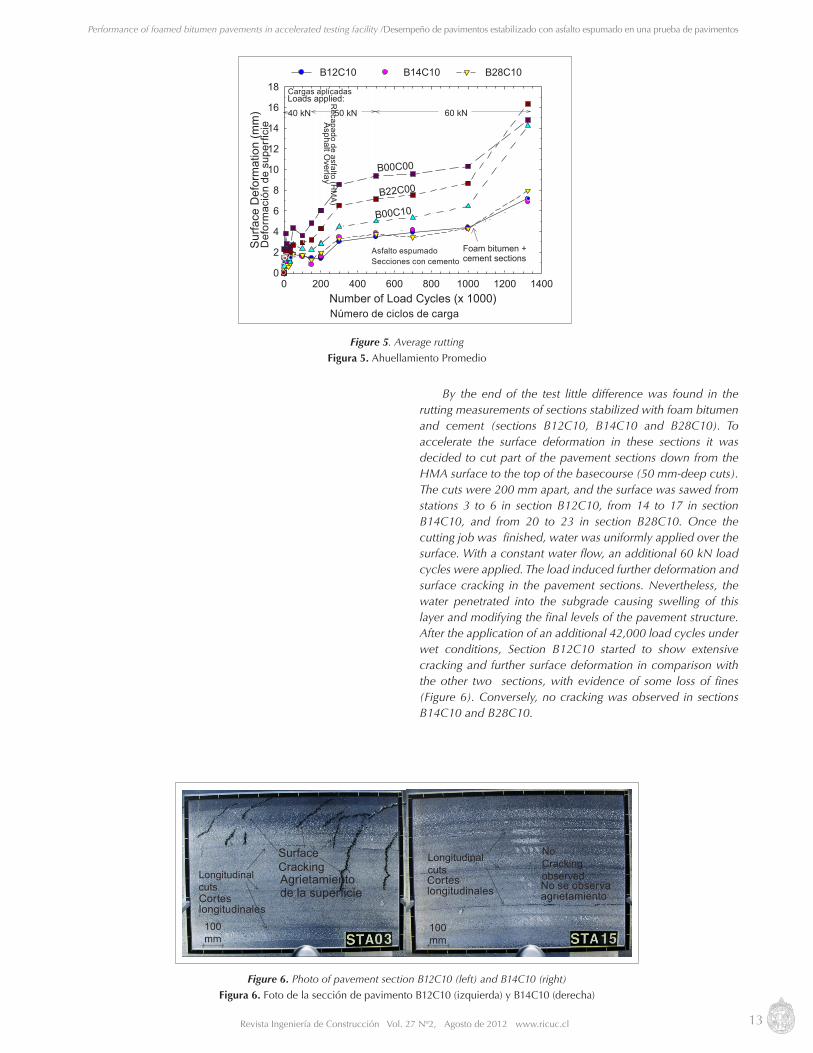
Average RuttingThe averaged rutting measurements for each pavement
section are presented in Figure 5. The curves presented show the typical performance of pavements with a bedding-in phase during the initial vehicle loading, followed by a plateau phase. When the load was increased to 50 kN another increase in the rutting rate was observed. From 300,000 load cycles (after constructing the HMA overlay) the rutting increased approximately linearly up to 1.000.000 load cycles for all sections.
After 1.000.000 load cycles, sections B00C10, B00C00 and B22C00 started to show large amounts of heaving and rutting, while sections B12C10, B14C10 and B28C10 performed well, and little difference among them was observed. The pavement test results presented indicate that stabilisation using FB and cement improved the performance of the pavements. The rutting of sections B12C10, B14C10 and B28C10 was consistently lower than in the other three sections.
Figure 4. FWD deflections at 40 kN before trafficking (0 load cycles) and after 1x10⁶ load cycles
Figura 4. Deflexiones FWD a 40 kN antes del trafico (0 ciclos de carga) y después de 1x10⁶ ciclos de carga
Defl
exió
n FW
D (m
m)
1 barra = una desviación estándar
Contenido de asfalto espumado
CiclosCementoCarga
CiclosCementoCarga
CiclosCementoCarga
CiclosCementoCarga
Foamed bitumen content (%)
0.0 0.5 1.0 1.5 2.0 2.5 3.0
FWD
def
lect
ion
(mm
)
0.0
0.3
0.4
0.5
0.6
0.7
0.8
0.9
1.0
B00C10
B00C00
B28C101 bar = One standard deviation 0 Cycles,
1% Cement, 40 kN Load
0 Cycles, 0% Cement, 40 kN Load
1x10⁶ Cycles, 1% Cement, 40 kN Load
1x10⁶ Cycles, 0% Cement, 40 kN Load
13Revista Ingeniería de Construcción Vol. 27 Nº2, Agosto de 2012 www.ricuc.cl
Performance of foamed bitumen pavements in accelerated testing facility /Desempeño de pavimentos estabilizado con asfalto espumado en una prueba de pavimentos
100 mm
Longitudinal cuts
Surface Cracking
100 mm
Longitudinal cuts
No Cracking observed
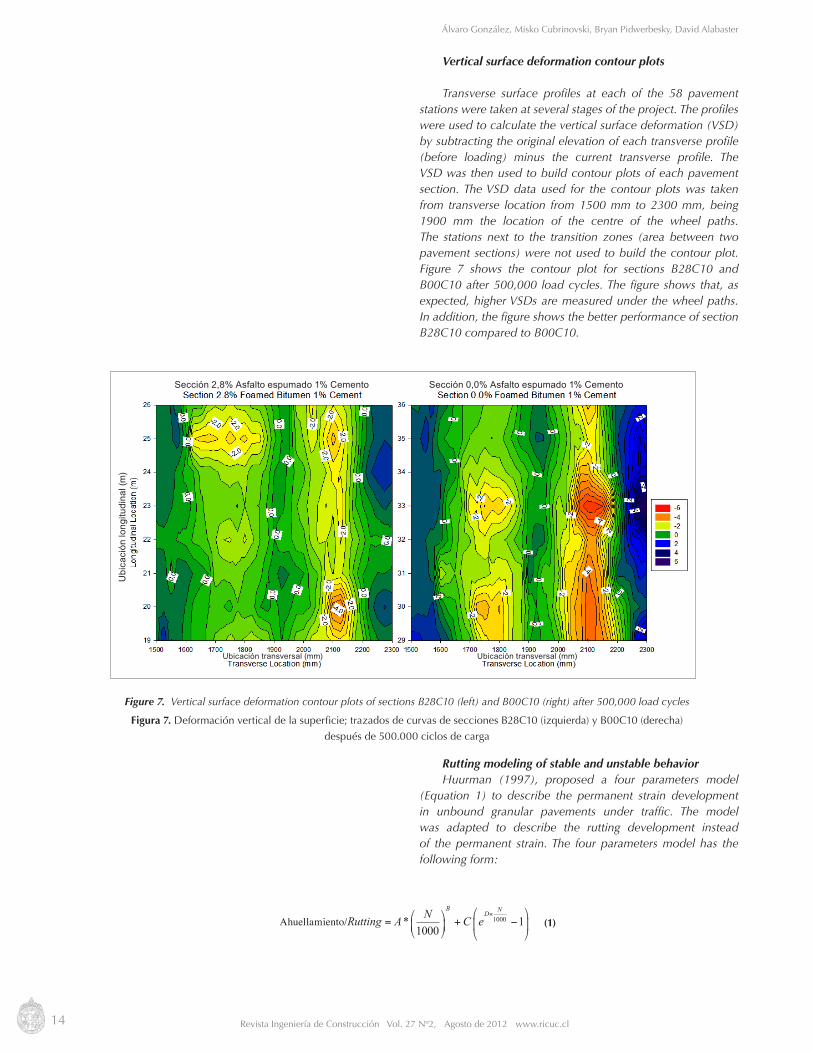
Figure 6. Photo of pavement section B12C10 (left) and B14C10 (right)
Figura 6. Foto de la sección de pavimento B12C10 (izquierda) y B14C10 (derecha)
By the end of the test little difference was found in the rutting measurements of sections stabilized with foam bitumen and cement (sections B12C10, B14C10 and B28C10). To accelerate the surface deformation in these sections it was decided to cut part of the pavement sections down from the HMA surface to the top of the basecourse (50 mm-deep cuts). The cuts were 200 mm apart, and the surface was sawed from stations 3 to 6 in section B12C10, from 14 to 17 in section B14C10, and from 20 to 23 in section B28C10. Once the cutting job was finished, water was uniformly applied over the surface. With a constant water flow, an additional 60 kN load cycles were applied. The load induced further deformation and surface cracking in the pavement sections. Nevertheless, the water penetrated into the subgrade causing swelling of this layer and modifying the final levels of the pavement structure. After the application of an additional 42,000 load cycles under wet conditions, Section B12C10 started to show extensive cracking and further surface deformation in comparison with the other two sections, with evidence of some loss of fines (Figure 6). Conversely, no cracking was observed in sections B14C10 and B28C10.
No se observa agrietamiento
Agrietamiento de la superficieCortes
longitudinales
Cortes longitudinales
Number of Load Cycles (x 1000)0 200 400 600 800 1000 1200 1400
Sur
face
Def
orm
atio
n (m
m)
0
2
4
6
8
10
12
14
16
18
Foam bitumen + cement sections
Asphalt O
verlay
40 kN 50 kN 60 kN
B00C00
B22C00
B00C10
B12C10 B14C10 B28C10
Loads applied:
Def
orm
ació
n de
sup
erfic
ie
Cargas aplicadas
Recapado de asfalto (H
MA)
Asfalto espumado Secciones con cemento
Número de ciclos de carga
Figure 5. Average rutting
Figura 5. Ahuellamiento Promedio
14 Revista Ingeniería de Construcción Vol. 27 Nº2, Agosto de 2012 www.ricuc.cl
Álvaro González, Misko Cubrinovski, Bryan Pidwerbesky, David Alabaster
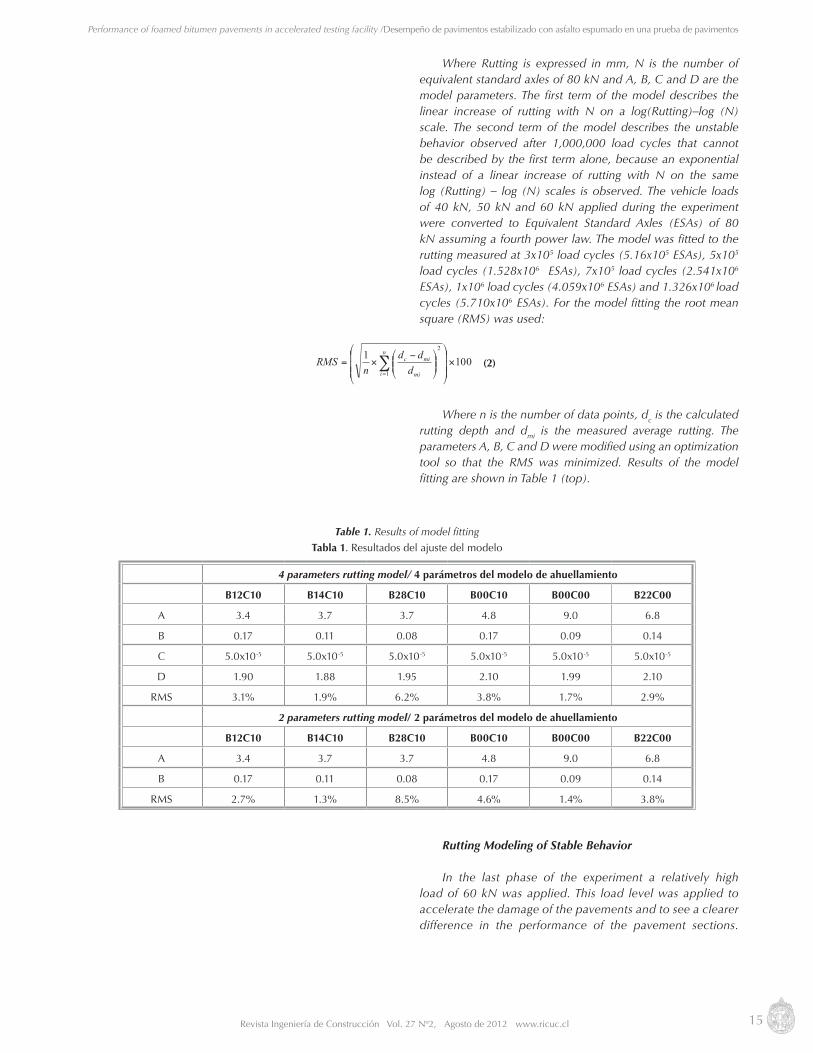
Vertical surface deformation contour plots
Transverse surface profiles at each of the 58 pavement stations were taken at several stages of the project. The profiles were used to calculate the vertical surface deformation (VSD) by subtracting the original elevation of each transverse profile (before loading) minus the current transverse profile. The VSD was then used to build contour plots of each pavement section. The VSD data used for the contour plots was taken from transverse location from 1500 mm to 2300 mm, being 1900 mm the location of the centre of the wheel paths. The stations next to the transition zones (area between two pavement sections) were not used to build the contour plot. Figure 7 shows the contour plot for sections B28C10 and B00C10 after 500,000 load cycles. The figure shows that, as expected, higher VSDs are measured under the wheel paths. In addition, the figure shows the better performance of section B28C10 compared to B00C10.
Rutting modeling of stable and unstable behaviorHuurman (1997), proposed a four parameters model
(Equation 1) to describe the permanent strain development in unbound granular pavements under traffic. The model was adapted to describe the rutting development instead of the permanent strain. The four parameters model has the following form:
Figure 7. Vertical surface deformation contour plots of sections B28C10 (left) and B00C10 (right) after 500,000 load cycles
Figura 7. Deformación vertical de la superficie; trazados de curvas de secciones B28C10 (izquierda) y B00C10 (derecha)
después de 500.000 ciclos de carga
Sección 2,8% Asfalto espumado 1% Cemento Sección 0,0% Asfalto espumado 1% Cemento
Ubi
caci
ón lo
ngitu
dina
l (m
)
Ubicación transversal (mm) Ubicación transversal (mm)
(1)Ahuellamiento/
15Revista Ingeniería de Construcción Vol. 27 Nº2, Agosto de 2012 www.ricuc.cl
Performance of foamed bitumen pavements in accelerated testing facility /Desempeño de pavimentos estabilizado con asfalto espumado en una prueba de pavimentos
Where Rutting is expressed in mm, N is the number of equivalent standard axles of 80 kN and A, B, C and D are the model parameters. The first term of the model describes the linear increase of rutting with N on a log(Rutting)–log (N) scale. The second term of the model describes the unstable behavior observed after 1,000,000 load cycles that cannot be described by the first term alone, because an exponential instead of a linear increase of rutting with N on the same log (Rutting) – log (N) scales is observed. The vehicle loads of 40 kN, 50 kN and 60 kN applied during the experiment were converted to Equivalent Standard Axles (ESAs) of 80 kN assuming a fourth power law. The model was fitted to the rutting measured at 3x10⁵ load cycles (5.16x10⁵ ESAs), 5x10⁵
load cycles (1.528x10⁶ ESAs), 7x10⁵ load cycles (2.541x10⁶
ESAs), 1x10⁶ load cycles (4.059x10⁶ ESAs) and 1.326x10⁶ load cycles (5.710x10⁶ ESAs). For the model fitting the root mean square (RMS) was used:
Where n is the number of data points, dc is the calculated rutting depth and dmi is the measured average rutting. The parameters A, B, C and D were modified using an optimization tool so that the RMS was minimized. Results of the model fitting are shown in Table 1 (top).
Rutting Modeling of Stable Behavior
In the last phase of the experiment a relatively high load of 60 kN was applied. This load level was applied to accelerate the damage of the pavements and to see a clearer difference in the performance of the pavement sections.
(2)
4 parameters rutting model/ 4 parámetros del modelo de ahuellamiento
B12C10 B14C10 B28C10 B00C10 B00C00 B22C00
A 3.4 3.7 3.7 4.8 9.0 6.8
B 0.17 0.11 0.08 0.17 0.09 0.14
C 5.0x10⁻⁵ 5.0x10⁻⁵ 5.0x10⁻⁵ 5.0x10⁻⁵ 5.0x10⁻⁵ 5.0x10⁻⁵
D 1.90 1.88 1.95 2.10 1.99 2.10
RMS 3.1% 1.9% 6.2% 3.8% 1.7% 2.9%
2 parameters rutting model/ 2 parámetros del modelo de ahuellamiento
B12C10 B14C10 B28C10 B00C10 B00C00 B22C00
A 3.4 3.7 3.7 4.8 9.0 6.8
B 0.17 0.11 0.08 0.17 0.09 0.14
RMS 2.7% 1.3% 8.5% 4.6% 1.4% 3.8%
Table 1. Results of model fitting
Tabla 1. Resultados del ajuste del modelo
16 Revista Ingeniería de Construcción Vol. 27 Nº2, Agosto de 2012 www.ricuc.cl
Álvaro González, Misko Cubrinovski, Bryan Pidwerbesky, David Alabaster
Number of ESAs (x 103)
0 5000 10000 15000 20000 25000 30000
Sur
face
Def
orm
atio
n (m
m)
0
2
4
6
8
10
12
14
Foamed bitumen + cement sections
B00C00
B22C00
B00C10
B12C10 B14C10 B28C10
Extrapolation of results
N=30(N/1000)0.12
N=50(N/1000)0.12
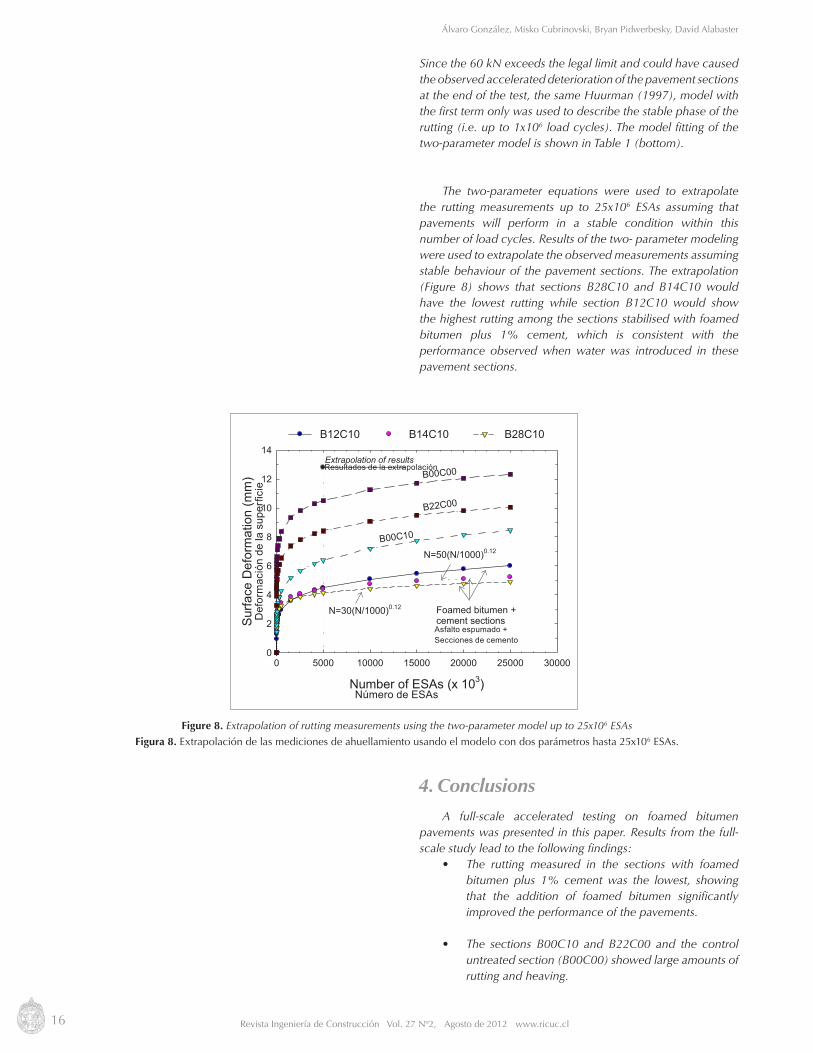
Since the 60 kN exceeds the legal limit and could have caused the observed accelerated deterioration of the pavement sections at the end of the test, the same Huurman (1997), model with the first term only was used to describe the stable phase of the rutting (i.e. up to 1x10⁶ load cycles). The model fitting of the two-parameter model is shown in Table 1 (bottom).
The two-parameter equations were used to extrapolate the rutting measurements up to 25x106 ESAs assuming that pavements will perform in a stable condition within this number of load cycles. Results of the two- parameter modeling were used to extrapolate the observed measurements assuming stable behaviour of the pavement sections. The extrapolation (Figure 8) shows that sections B28C10 and B14C10 would have the lowest rutting while section B12C10 would show the highest rutting among the sections stabilised with foamed bitumen plus 1% cement, which is consistent with the performance observed when water was introduced in these pavement sections.
4. Conclusions
A full-scale accelerated testing on foamed bitumen pavements was presented in this paper. Results from the full-scale study lead to the following findings:
• The rutting measured in the sections with foamed bitumen plus 1% cement was the lowest, showing that the addition of foamed bitumen significantly improved the performance of the pavements.
• The sections B00C10 and B22C00 and the control untreated section (B00C00) showed large amounts of rutting and heaving.
Figure 8. Extrapolation of rutting measurements using the two-parameter model up to 25x106 ESAs
Figura 8. Extrapolación de las mediciones de ahuellamiento usando el modelo con dos parámetros hasta 25x106 ESAs.
Def
orm
ació
n de
la s
uper
ficie
Número de ESAs
Resultados de la extrapolación
Asfalto espumado +Secciones de cemento
17Revista Ingeniería de Construcción Vol. 27 Nº2, Agosto de 2012 www.ricuc.cl
Performance of foamed bitumen pavements in accelerated testing facility /Desempeño de pavimentos estabilizado con asfalto espumado en una prueba de pavimentos
• The deflections of section B28C10 were lower than those of the other sections, while the untreated section (B00C00) showed the largest values.
• To differentiate the rutting performance of the sections stabilized with foam bitumen and cement, water was introduced through surface cuts. After the application of additional accelerated traffic load, section B12C10 started to show surface cracking, while sections B14C10 and B28C10 performed well.
• Two types of models were fitted to the rutting measurements. The first model described the stable and unstable rutting of the pavement sections while second model only considered the stable phase in where a steady increase in rutting with the number of cycles is observed.
• The developed models and the better understanding of the performance of foamed bitumen pavements leads to more accurate programming of treatments or maintenance of pavements.
5. Acknowledgments
The authors extend their gratitude to: Land Transport New Zealand, New Zealand Transport Agency, the Civil and Natural Resources Engineering Department of Canterbury University, Fulton Hogan and the NZ Stabilisation Group.
6. Referencias/ ReferencesAsphalt Academy (2002), Interim Technical Guidelines (TG2): The Design and Use of Foamed Bitumen Treated Materials. Asphalt
Academy, Pretoria.ASTM Standard D4318 (2005), “Standard Test Method for Liquid Limit, Plastic Limit, and Plasticity Index of Soils” ASTM international,
West Conshohocken, PA, 2003, DOI: 10.1520/D4318-05E01.Austroads (2005), Pavement Design: A Guide to the Structural Design of Road Pavements. New Zealand Supplement. Dawson A. (1994), The E-mu System. Users Manual, 2nd ed. University of Nottingham, United Kingdom.Gonzalez A., Cubrinovski M., Pidwerbesky B. and Alabaster D. (2004), “Full scale experiment on foam bitumen pavements in CAPTIF
accelerated testing facility”. Transportation Research Record, Journal of the Transportation Research Board, Washington, D.C., pp. 21-29.
Hurman M. (1997), Permanent Deformation in Concrete Block Pavements, PhD Thesis, Delft University of Technology. Jenkins K.J. (1994), Analysis of a Pavement Layer which has been Treated by Single Pass In Situ Stabilisation. University of Natal, South
Africa. NZS. (1986), “NZS 4402.4.1.3:1986:Determination of the dry density/water content relationship - Test 4.1.3 New Zealand vibrating
hammer compaction test.” Standards New Zealand, Wellington.Saleh, M. F. (2004a), “Detailed Experimental Investigation for Foamed Bitumen Stabilisation.”, University of Canterbury, ChristchurchThenoux G., Gonzalez A., and Dowling R. (2006), Energy Consumption Comparison for Different Asphalt Pavements Rehabilitation
Techniques Used in Chile. Resources, Conservation and Recycling,16 pp.