Embed Size (px)
Citation preview

Agricultural and Biosystems EngineeringPublications Agricultural and Biosystems Engineering
1986
Performance of Farm-Type Moisture MetersCharles R. Hurburgh Jr.Iowa State University, [email protected]
Lynn N. PaynterIowa State University
Steven G. SchmittIowa State University
Carl J. BernIowa State University, [email protected]
Follow this and additional works at: http://lib.dr.iastate.edu/abe_eng_pubs
Part of the Agriculture Commons, and the Bioresource and Agricultural Engineering Commons
The complete bibliographic information for this item can be found at http://lib.dr.iastate.edu/abe_eng_pubs/423. For information on how to cite this item, please visit http://lib.dr.iastate.edu/howtocite.html.
This Article is brought to you for free and open access by the Agricultural and Biosystems Engineering at Iowa State University Digital Repository. Ithas been accepted for inclusion in Agricultural and Biosystems Engineering Publications by an authorized administrator of Iowa State UniversityDigital Repository. For more information, please contact [email protected].
Performance of Farm-Type Moisture Meters
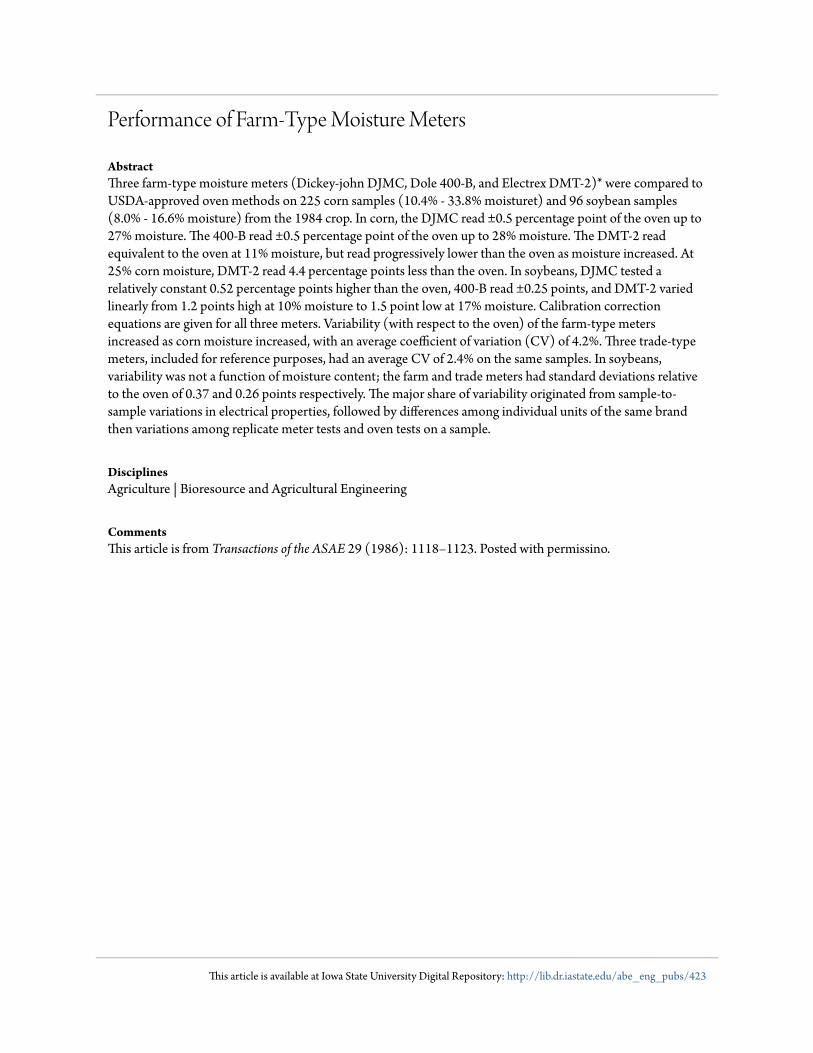
AbstractThree farm-type moisture meters (Dickey-john DJMC, Dole 400-B, and Electrex DMT-2)* were compared toUSDA-approved oven methods on 225 corn samples (10.4% - 33.8% moisturet) and 96 soybean samples(8.0% - 16.6% moisture) from the 1984 crop. In corn, the DJMC read ±0.5 percentage point of the oven up to27% moisture. The 400-B read ±0.5 percentage point of the oven up to 28% moisture. The DMT-2 readequivalent to the oven at 11% moisture, but read progressively lower than the oven as moisture increased. At25% corn moisture, DMT-2 read 4.4 percentage points less than the oven. In soybeans, DJMC tested arelatively constant 0.52 percentage points higher than the oven, 400-B read ±0.25 points, and DMT-2 variedlinearly from 1.2 points high at 10% moisture to 1.5 point low at 17% moisture. Calibration correctionequations are given for all three meters. Variability (with respect to the oven) of the farm-type metersincreased as corn moisture increased, with an average coefficient of variation (CV) of 4.2%. Three trade-typemeters, included for reference purposes, had an average CV of 2.4% on the same samples. In soybeans,variability was not a function of moisture content; the farm and trade meters had standard deviations relativeto the oven of 0.37 and 0.26 points respectively. The major share of variability originated from sample-to-sample variations in electrical properties, followed by differences among individual units of the same brandthen variations among replicate meter tests and oven tests on a sample.
DisciplinesAgriculture | Bioresource and Agricultural Engineering
CommentsThis article is from Transactions of the ASAE 29 (1986): 1118–1123. Posted with permissino.
This article is available at Iowa State University Digital Repository: http://lib.dr.iastate.edu/abe_eng_pubs/423

Performance of Farm-Type Moisture Meters
Charles R. Hurburgh, Jr., Lynn N. Paynter, Steven G. Schmitt, Carl J. Bern MEMBER
ASAE ASSOC. MEMBER
ASAE MEMBER
ASAE
ABSTRACT
Three farm-type moisture meters (Dickey-john DJMC, Dole 400-B, and Electrex DMT-2)* were compared
to USDA-approved oven methods on 225 corn samples (10.4% - 33.8% moisturet) and 96 soybean samples (8.0% - 16.6% moisture) from the 1984 crop. In corn, the DJMC read ±0.5 percentage point of the oven up to 27% moisture. The 400-B read ±0.5 percentage point of the oven up to 28% moisture. The DMT-2 read equivalent to the oven at 11% moisture, but read progressively lower than the oven as moisture increased. At 25% corn moisture, DMT-2 read 4.4 percentage points less than the oven. In soybeans, DJMC tested a relatively constant 0.52 percentage points higher than the oven, 400-B read ±0.25 points, and DMT-2 varied linearly from 1.2 points high at 10% moisture to 1.5 point low at 17% moisture. Calibration correction equations are given for all three meters.
Variability (with respect to the oven) of the farm-type meters increased as corn moisture increased, with an average coefficient of variation (CV) of 4.2%. Three trade-type meters, included for reference purposes, had an average CV of 2.4% on the same samples. In soybeans, variability was not a function of moisture content; the farm and trade meters had standard deviations relative to the oven of 0.37 and 0.26 points respectively. The major share of variability originated from sample-to-sample variations in electrical properties, followed by differences among individual units of the same brand then variations among replicate meter tests and oven tests on a sample.
INTRODUCTION
Electronic meters are now the primary instrument for grain moisture measurement on farms. These meters convert a dielectric measurement to percentage moisture
Article was submitted for publication in August, 1985; reviewed and approved for publication by the Electric Power and Processing Div. of ASAE in June, 1986. Presented as ASAE Paper No, 85-3008.
Research supported by Farm Journal, Inc., and the Iowa Agriculture and Home Economics Experiment Station.
Journal Paper J-11960 of the Iowa Agriculture and Home Economics Experiment Station, Ames; Project 2339.
The authors are: CHARLES R. HURBURGH, Jr., Associate Professor, LYNN N. PAYNTER, Laboratory Supervisor, STEVEN G. SCHMITT, Predoctoral Research Associate, and CARL J. BERN, Professor, Agricultural Engineering Dept., Iowa State University, Ames.
Acknowledgements: We thank the student workers in the Grain Quality Laboratory, Dave Metzger, Liisa Schmitt, Jon Lyon, Cindy West, Joe Slater, Don Lamb, Dennis Weber and Bill Wiley, for assisting on the over 6,700 individual moisture tests, and Claudia Buttery for manuscript organization.
*The use of trade names does not constitute an endorsement by Iowa State University.
tAll moisture contents reported on the wet basis.
in a manner similar to that of meters used at elevators. The principles of dielectric moisture measurement have changed little since the late 1950's and have been described in several works (Nelson, 1965, 1973, 1982). Farm-type meters are less complex, less expensive, and more portable than trade-type meters. Performance characteristics of farm-type meters are important because their readings determine harvestability and storability. More than 80% of U.S. corn is dried and stored on farms (Iowa Crop and Livestock Reporting Service, 1985). Accepted data for storage time versus moisture content show a rapid decrease in storage life with increasing moisture (Steele et al., 1969).
Incorrect on-farm moisture tests will also produce economic consequences at time of sale, either as discounts for excess moisture or as lost weight for overdry grain. Typical market bases in Iowa are 15.5% for corn (14% for warehouse storage) and 13% for soybeans. A one percentage point variation above or below the basis will reduce market value by about 5 cents and 8 centers per bushel for corn and soybeans, respectively.
The coefficient of variations (CV) relative to corn oven moisture is approximately 3% for trade-type meters (Hurburgh et al., 1984). Trade-type meters show approximately half the variability in soybeans as in corn (Hurburgh, 1984).
Performance of farm-type meters has not been studied as extensively as that of trade-type meters. Bern and Hurburgh (1981) reported a meter-to-oven standard deviation of 1.14 percentage points in dry (13.4%) corn. This is about twice the variability of trade-type meters. These data were obtained with no control over brand, age, or working condition.
OBJECTIVES
The objectives of this research were to: 1. Determine calibration accuracy of three popular
farm-type moisture meters for corn and soybeans. 2. Quantify the variability of farm-type meters,
identify its source(s), and compare to trade-type meters. 3. Improve meter-operation procedures, based on
the variability analysis.
MATERIALS AND METHODS
Moisture meters The project sponsor, Farm Journal, Inc., determined
three meters to be the most popular on-farm brands—Dickey-john DJMC, the Dole 400B, and the Electrex DMT-2. Specifications are given in Table 1. The three units of each farm-type meter were obtained either directly from the manufacturer (Dole) or from a local firm selling the model (Dickey-john and Electrex). The three trade-type meters, (Dickey-john GACII, Steinlite SS250, an Motomco 919) used in previous
1118 (c) 1986 American Society of Agricultural Engineers 0001-2351/86/2904-1118$02.00 TRANSACTIONS of the ASAE
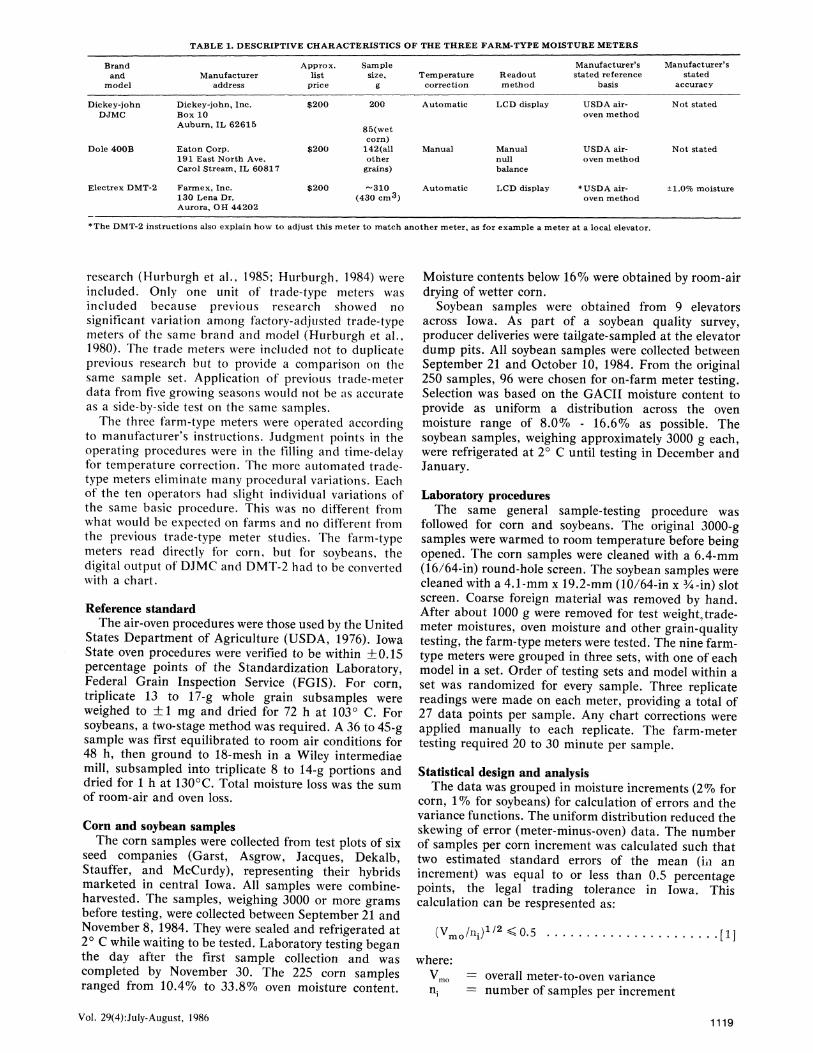
TABLE 1. DESCRIPTIVE CHARACTERISTICS OF THE THREE FARM-TYPE MOISTURE METERS
Brand a n d
model
Dickey-john DJMC
Dole 400B
Electrex DMT-2
Manufacturer address
Dickey-john, Inc. Box 10 Auburn, IL 62615
Eaton Corp. 191 East North Ave. Carol Stream, IL 60817
Farmex, Inc. 130 Lena Dr. Aurora, OH 44202
Approx. list
price
$200
$200
$200
Sample size.
g
2 0 0
85(wet corn)
142 (all other
grains)
--310 (430 cm3)
Temperature correction
Automatic
Manual
Automatic
Readout method
LCD display
Manual null balance
LCD display
Manufacturer's stated reference
basis
USD A air-oven method
USDA air-oven method
* USD A air-oven method
Manufacturer's stated
accuracy
Not stated
Not stated
±1.0% moisture
*The DMT-2 instructions also explain how to adjust this meter to match another meter, as for example a meter at a local elevator.
1
research (Hurburgh et al., 1985; Hurburgh, 1984) were included. Only one unit of trade-type meters was included because previous research showed no significant variation among factory-adjusted trade-type meters of the same brand and model (Hurburgh et al., 1980). The trade meters were included not to duplicate previous research but to provide a comparison on the same sample set. Application of previous trade-meter data from five growing seasons would not be as accurate as a side-by-side test on the same samples.
The three farm-type meters were operated according to manufacturer's instructions. Judgment points in the operating procedures were in the filling and time-delay for temperature correction. The more automated trade-type meters eliminate many procedural variations. Each of the ten operators had slight individual variations of the same basic procedure. This was no different from what would be expected on farms and no different from the previous trade-type meter studies. The farm-type meters read directly for corn, but for soybeans, the digital output of DJMC and DMT-2 had to be converted with a chart.
Reference standard The air-oven procedures were those used by the United
States Department of Agriculture (USDA, 1976). Iowa State oven procedures were verified to be within +0.15 percentage points of the Standardization Laboratory, Federal Grain Inspection Service (FGIS). For corn, triplicate 13 to 17-g whole grain subsamples were weighed to ± 1 mg and dried for 72 h at 103° C. For soybeans, a two-stage method was required. A 36 to 45-g sample was first equilibrated to room air conditions for 48 h, then ground to 18-mesh in a Wiley intermediae mill, subsampled into triplicate 8 to 14-g portions and dried for 1 h at 130°C. Total moisture loss was the sum of room-air and oven loss.
Corn and soybean samples The corn samples were collected from test plots of six
seed companies (Garst, Asgrow, Jacques, Dekalb, Stauffer, and McCurdy), representing their hybrids marketed in central Iowa. All samples were combine-harvested. The samples, weighing 3000 or more grams before testing, were collected between September 21 and November 8, 1984. They were sealed and refrigerated at 2° C while waiting to be tested. Laboratory testing began the day after the first sample collection and was completed by November 30. The 225 corn samples ranged from 10.4% to 33.8% oven moisture content.
Moisture contents below 16% were obtained by room-air drying of wetter corn.
Soybean samples were obtained from 9 elevators across Iowa. As part of a soybean quality survey, producer deliveries were tailgate-sampled at the elevator dump pits. All soybean samples were collected between September 21 and October 10, 1984. From the original 250 samples, 96 were chosen for on-farm meter testing. Selection was based on the GACII moisture content to provide as uniform a distribution across the oven moisture range of 8.0% - 16.6% as possible. The soybean samples, weighing approximately 3000 g each, were refrigerated at 2° C until testing in December and January.
Laboratory procedures The same general sample-testing procedure was
followed for corn and soybeans. The original 3000-g samples were warmed to room temperature before being opened. The corn samples were cleaned with a 6.4-mm (16/64-in) round-hole screen. The soybean samples were cleaned with a 4.1-mm x 19.2-mm (10/64-in x y4-in) slot screen. Coarse foreign material was removed by hand. After about 1000 g were removed for test weight.trade-meter moistures, oven moisture and other grain-quality testing, the farm-type meters were tested. The nine farm-type meters were grouped in three sets, with one of each model in a set. Order of testing sets and model within a set was randomized for every sample. Three replicate readings were made on each meter, providing a total of 27 data points per sample. Any chart corrections were applied manually to each replicate. The farm-meter testing required 20 to 30 minute per sample.
Statistical design and analysis The data was grouped in moisture increments (2% for
corn, 1% for soybeans) for calculation of errors and the variance functions. The uniform distribution reduced the skewing of error (meter-minus-oven) data. The number of samples per corn increment was calculated such that two estimated standard errors of the mean (in an increment) was equal to or less than 0.5 percentage points, the legal trading tolerance in Iowa. This calculation can be respresented as:
(V™o/ni) ' ' '<0.5 [1]
where: ^mo ~ overall meter-to-oven variance n. = number of samples per increment
Vol. 29(4):July-August, 1986 1119
For trade-type meters in corn:
V^^ = 0.016486 M^2 _ 0.57931 M^ + 5.339 [2]
where: M„ = oven moisture content, % Based on the data of Bern and Hurburgh (1981),
equation [2] was doubled to estimate variability of farm-type meters. Substitution into equation [1] and solution for n yielded 7 to 28 corn samples per 2-point increment up to 28% moisture. To maintain uniformity in the distribution, 20 to 30 samples per category were set as the target. Availability of high-moisture corn limited the numbers of samples in the high moisture categories.
Because soybeans produce half the moisture-test variability of corn (Hurburgh, 1984), the tolerance may be set half as wide. (0.25 percentage points) and n. will still be half as large. A target of 10 samples per one-point increment was set for soybeans.
Meter error was calculated as the difference between a meter reading and an oven determination on a sample. Errors were averaged by moisture increment, then regressed against oven moisture. Regression of errors against oven moisture proved the existence of calibration inaccuracies, but did not identify calibration corrections. Correction equations were determined as functions of average meter reading for each model.
The variability model described by Hurburgh et al. (1984):
V = v + V + V / n + V / n .[3]
where:
V. year-to-year component of variance sample-to-sample (within a year) component of variance variance among meter replicates on a sample number of meter replicates per sample ( = 3) variance among oven replicates on a sample number of oven replicates per sample ( = 3)
was modified to include variance among units of the same meter model.
V.
n^
V in<
where:
v..
V + v y !
; + n , ( V , , + V^/n^ + V , / n J •[4]
= variance among units of the same meter model
V',, = sample-to-sample variance without the unit effect
n = number of units of a brand (==3 for on-farm meters, 1 for trade-type)
Equation [4] predicted variability of a meter with respect to the oven in any year. Inasmuch as the farm-meter study was done for only one year, the contribution of growing season, V , could not be estimated. Therefore the variance model applied to the farm-meter data was:
Vwy = V'33 + n , ( V , , 4 - V ^ / n ^ + V , / n J .[5]
where: V y = meter-to-oven variance within a crop year For trade-type meters, V,, = 0 (Hurburgh et al., 1980).
The total variance, V ^ was the variance of errors, meter-minus-oven, about the mean error in an increment. Meter, V , and oven, V , variances were the average variances among replicates on samples within an increment. Equation [5] was rearranged to calculate V' ^ in an increment.
The meter-errors and variances were calculated for each individual meter, significance in each formulation. The individual-meter data determined V y and V^ . The like-model data established calibration corrections and estimated variance of an unknown-performance unit of the brand. The all-meters data generalized the variance of farm-type meters, regardless of model. The average errors across brands were of no practical value.
RESULTS
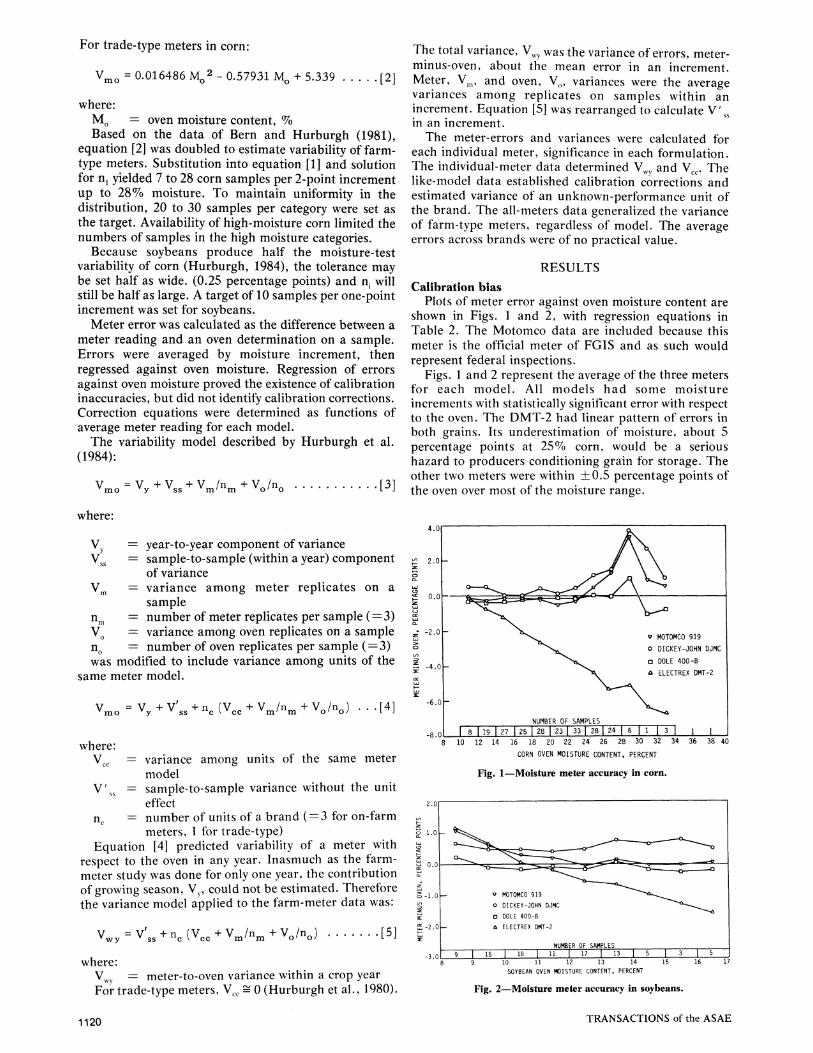
Calibration bias Plots of meter error against oven moisture content are
shown in Figs. 1 and 2, with regression equations in Table 2. The Motomco data are included because this meter is the official meter of FGIS and as such would represent federal inspections.
Figs. 1 and 2 represent the average of the three meters for each model. All models had some moisture increments with statistically significant error with respect to the oven. The DMT-2 had linear pattern of errors in both grains. Its underestimation of moisture, about 5 percentage points at 25% corn, would be a serious hazard to producers conditioning grain for storage. The other two meters were within ±0.5 percentage points of the oven over most of the moisture range.
10 12 14 16 18 20 22 24 26 28 30 32 34 36 38 40
CORN OVEN MOISTURE CONTENT, PERCENT
Fig. 1—Moisture meter accuracy in corn.
10 11 12 13 14
SOYBEAN OVEN MOISTURE CONTENT, PERCENT
Fig. 2—Moisture meter accuracy in soybeans.
1120 TRANSACTIONS of the ASAE
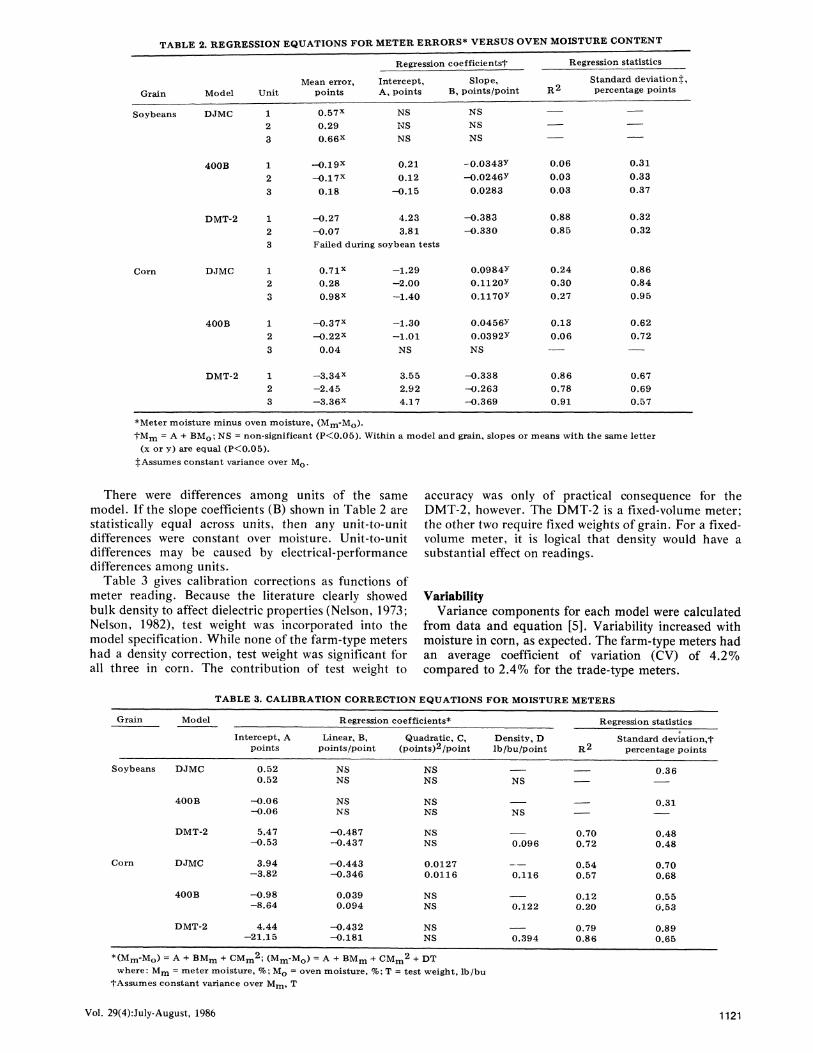
TABLE 2. REGRESSION EQUATIONS FOR METER ERRORS* VERSUS OVEN MOISTURE CONTENT
Regression coefficientsl*
Grain Model Unit Mean error,
po in ts In tercept , A, po in ts
Slope, B, po in t s /po in t
Regression statistics
Standard devia t ion^ , percentage points
Soybeans
Corn
DJMC
400B
DMT-2
DJMC
400B
DMT-2
1 2
3
1
2
3
1
2
3
1 2
3
1 2
3
1 2
3
0.57X
0.29 0.66X
- 0 . 1 9 X
-0 .17X
0.18
- 0 . 2 7
- 0 . 0 7
Failed c
0.71X
0.28 0.98X
- 0 . 3 7 X
- 0 . 2 2 X
0.04
-3 .34X
- 2 . 4 5 -3 .36X
NS
NS
NS
0 .21
0.12
- 0 . 1 5
4 .23
3.81
- 1 . 2 9
- 2 . 0 0
- 1 . 4 0
- 1 . 3 0
- 1 . 0 1
NS
3.55 2.92 4.17
NS
NS
NS
-0 .0343y
-0 .0246y 0.0283
-0 .383 -0 .330
0.0984y
o . i i 2 o y
o . i i 7 o y
0 .0456y
0 .0392y
NS
- 0 . 3 3 8 - 0 . 2 6 3 - 0 . 3 6 9
0.06 0.03 0.03
0.88
0 .85
0.24 0.30 0.27
0.13
0 .06
0.86 0.78 0 .91
0 .31
0 .33
0.37
0.32 0.32
0.86
0.84
0.95
0 .62
0.72
0.67 0.69 0.57
*Meter mois ture minus oven mois ture , ( M J ^ - M Q ) .
t M j n = A + B M Q ; NS = non-significant ( P < 0 . 0 5 ) . Within a mode l and grain, slopes or means wi th t he same let ter
(x or y) are equal (P<0 .05 ) .
:|: Assumes cons tan t variance over M Q .
There were differences among units of the same model. If the slope coefficients (B) shown in Table 2 are statistically equal across units, then any unit-to-unit differences were constant over moisture. Unit-to-unit differences may be caused by electrical-performance differences among units.
Table 3 gives calibration corrections as functions of meter reading. Because the literature clearly showed bulk density to affect dielectric properties (Nelson, 1973; Nelson, 1982), test weight was incorporated into the model specification. While none of the farm-type meters had a density correction, test weight was significant for all three in corn. The contribution of test weight to
accuracy was only of practical consequence for the DMT-2, however. The DMT-2 is a fixed-volume meter; the other two require fixed weights of grain. For a fixed-volume meter, it is logical that density would have a substantial effect on readings.
Variability Variance components for each model were calculated
from data and equation [5]. Variability increased with moisture in corn, as expected. The farm-type meters had an average coefficient of variation (CV) of 4.2% compared to 2.4% for the trade-type meters.
TABLE 3. CALIBRATION CORRECTION EQUATIONS FOR MOISTURE METERS
Grain
Soybeans
Corn
Model
DJMC
400B
DMT-2
DJMC
400B
DMT-2
In tercept , A poin ts
0 .52 0.52
- 0 . 0 6 - 0 . 0 6
5.47 - 0 . 5 3
3.94 - 3 . 8 2
- 0 . 9 8 - 8 . 6 4
4 .44 - 2 1 . 1 5
Regression coefficients*
Linear, B, po in t s /po in t
NS NS
NS NS
- 0 . 4 8 7 - 0 . 4 3 7
- 0 . 4 4 3 - 0 . 3 4 6
0 .039 0 .094
- 0 . 4 3 2 - 0 . 1 8 1
Quadrat ic , C, (po in t s )^ /po in t
NS NS
NS NS
NS NS
0 .0127 0 .0116
NS NS
NS NS
Density, D lb /bu /po in t
NS
NS
0 .096
0.116
0 .122
0 .394
R 2
0.70 0.72
0 .54 0.57
0.12 0.20
0.79 0 .86
Regression statistics
Standard dev ia t ion , t percentage po in t s
0 .36
0 .31
0 .48 0 .48
0.70 0.68
0 .55 0 .53
0.89 0.65
*(Mjn-Mo) = A + BMm + C M ^ ^ ; ( M ^ - M O ) = A + B M ^ + CMi„2 + D T where : M^n = me te r mois ture , %; M Q = oven mois ture , %; T = test weight , Ib /bu
i 'Assumes cons tan t variance over Mm, T
Vol. 29(4):July-August, 1986 1121
CV was calculated as:
CV (Vn.o)
1 / 2
M. .[6]
In soybeans, variance was constant over moisture. The three farm-type meters had a standard deviation of 0.37 percentage points, and the three trade-type meters 0.26 percentage points. The previous trade-meter study (Hurburgh, 1984) also showed constant varibility over moisture in soybeans.
Most of the variability was associated with samples or units, not the meter or the oven. Therefore, repeat testing in a meter will not substantially improve accuracy, nor will more precise laboratory methods for calibration. More improvements will arise from understanding of factors affecting sample-to-sample dielectric properties and from uniformity of units.
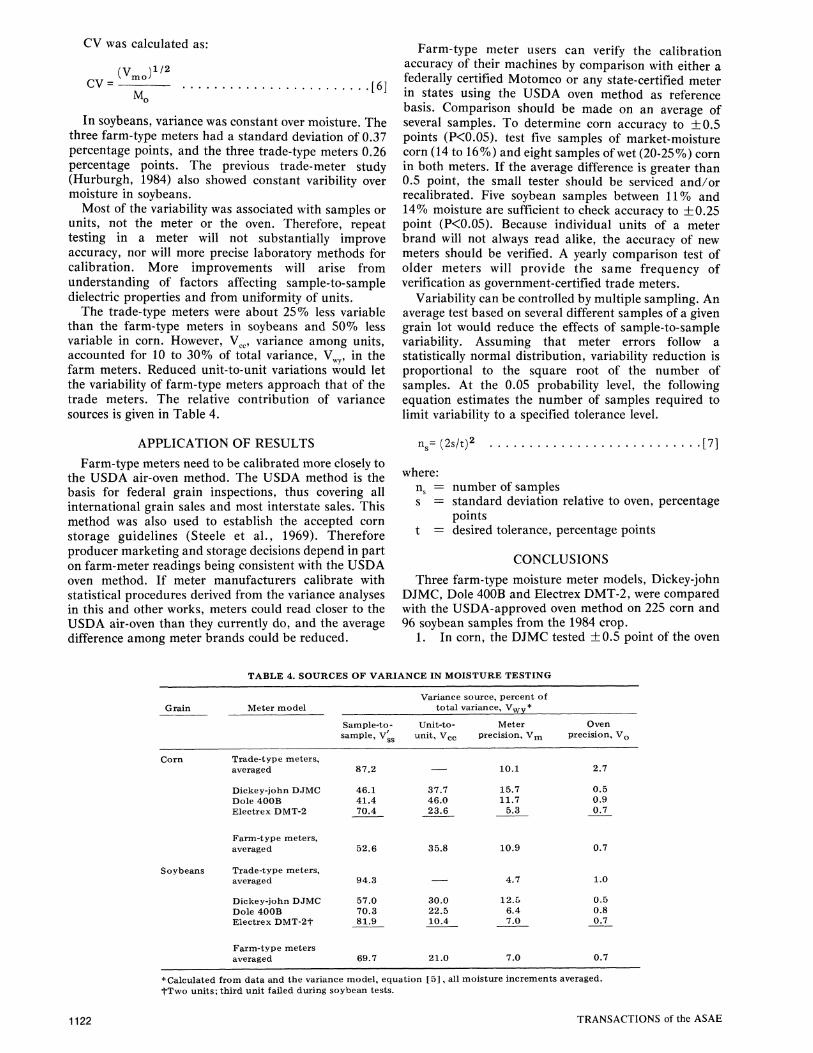
The trade-type meters were about 25% less variable than the farm-type meters in soybeans and 50% less variable in corn. However, V^ , variance among units, accounted for 10 to 30% of total variance, V^ , in the farm meters. Reduced unit-to-unit variations would let the variability of farm-type meters approach that of the trade meters. The relative contribution of variance sources is given in Table 4.
APPLICATION OF RESULTS
Farm-type meters need to be calibrated more closely to the USDA air-oven method. The USDA method is the basis for federal grain inspections, thus covering all international grain sales and most interstate sales. This method was also used to establish the accepted corn storage guidelines (Steele et al., 1969). Therefore producer marketing and storage decisions depend in part on farm-meter readings being consistent with the USDA oven method. If meter manufacturers calibrate with statistical procedures derived from the variance analyses in this and other works, meters could read closer to the USDA air-oven than they currently do, and the average difference among meter brands could be reduced.
Farm-type meter users can verify the calibration accuracy of their machines by comparison with either a federally certified Motomco or any state-certified meter in states using the USDA oven method as reference basis. Comparison should be made on an average of several samples. To determine corn accuracy to ±0.5 points (P<0.05). test five samples of market-moisture corn (14 to 16%) and eight samples of wet (20-25%) corn in both meters. If the average difference is greater than 0.5 point, the small tester should be serviced and/or recalibrated. Five soybean samples between 11% and 14% moisture are sufficient to check accuracy to ±0.25 point (P<0.05). Because individual units of a meter brand will not always read alike, the accuracy of new meters should be verified. A yearly comparison test of older meters will provide the same frequency of verification as government-certified trade meters.
Variability can be controlled by multiple sampling. An average test based on several different samples of a given grain lot would reduce the effects of sample-to-sample variability. Assuming that meter errors follow a statistically normal distribution, variability reduction is proportional to the square root of the number of samples. At the 0.05 probability level, the following equation estimates the number of samples required to limit variability to a specified tolerance level.
ns= (2s/t)2 .[7]
where: n = number of samples s = standard deviation relative to oven, percentage
points t = desired tolerance, percentage points
CONCLUSIONS
Three farm-type moisture meter models, Dickey-john DJMC, Dole 400B and Electrex DMT-2, were compared with the USDA-approved oven method on 225 corn and 96 soybean samples from the 1984 crop.
1. In corn, the DJMC tested ±0.5 point of the oven
TABLE 4. SOURCES OF VARIANCE IN MOISTURE TESTING
Grain
Corn
Soybeans
Meter model
Trade-type meters, averaged
Dickey-john DJMC Dole 400B Electrex DMT-2
Farm-type meters, averaged
Trade-type meters, averaged
Dickey-john DJMC Dole 400B Electrex DMT-2t
Farm-type meters averaged
Sample-to-sample, V g
87.2
46.1 41.4 70.4
52.6
94.3
57.0 70.3 81.9
69.7
Variance total
Unit-to-unit, Vcc
37.7 46.0 23.6
35.8
30.0 22.5 10.4
21.0
source, percent of variance, V^y*
Meter precision, V ^
10.1
15.7 11.7
5.3
10.9
4.7
12.5 6.4 7.0
7.0
Oven precision, VQ
2.7
0.5 0.9 0.7
0.7
1.0
0.5 0.8 0.7
0.7
* Calculated from data and the variance model, equation [5] , all moisture increments averaged. tTwo units; third unit failed during soybean tests.
1122 TRANSACTIONS of the ASAE

up to 25% moisture, and the 400B ±0.5 point up to 28% moisture. The DMT-2 read equivalent to the oven at 11% moisture and dclined linearly to 4.4 points below the oven at 25%corn.
2. In 8%-17% soybeans, the DJMC read 0.5 points higher than the oven, and the 400B tested ±0.25 points of the oven. The DMT-2 tested 1.2 points higher than the oven at 10% moisture, declining linearly to 1.5 points below the oven at 17% moisture.
3. In corn, the variability of all meters increased with moisture. The coefficient of variation for farm-type meters was 4.2%, as contrasted with 2.4% for the trade-type meters on the same samples.
4. In soybeans the farm-type meters had a constant standard deviation with respect to the oven of 0.37 points. The trade meters had a standard deviation of 0.26 points on the same samples.
5. As calculated from the variance model, sample-to-sample differences accounted for 52.6% of corn variance and 69.7% of soybean variance. Differences among individual units of the same model generated 35.8% and 21.0% of the variance in corn and soybeans, respectively. Meter precision caused only 10.9% and 7.0% of the variance, with oven precision contributing 0.7% in both grains.
6. The accuracy of on-farm moisture testing can be improved by calibration of meters to the USD A oven method, reduced differences among units of the same brand, and averaged tests on multiple samples of a grain lot.
References 1. Bern, C. J. and C. R. Hurburgh Jr. 1981. Performance of some
on-farm meters in corn. ASAE Paper 81-3025, ASAE, St. Joseph, Ml 49085.
2. Hurburgh, C. R. Jr., C. J. Bern and C. D. Sitzmann. 1980. Performance of electronic moisture meters in Iowa. ASAE Paper 80-3057, ASAE, St. Joseph, Ml 49085.
3. Hurburgh, C. R., Jr. 1984. Moisture measurement in soybeans. ASAE Paper 84-3547, ASAE, St. Joseph, Ml 49085.
4. Hurburgh, C. R., Jr., L. N. Paynter and S. G. Schmitt. 1984. Performance of moisture meter corn calibrations over five crop years. ASAE Paper 84-3550, ASAE, St. Joseph, MI 49085.
5. Hurburgh, C. R. Jr., T. E. Hazen and C. J. Bern. 1985. Corn moisture measurement accuracy. TRANSACTIONS of the ASAE 28(2):634:640.
6. Iowa Crop and Livestock Reporting Service. 1985. Corn harvesting and handling methods. In: Iowa Crop Report 85(4), Iowa Crop Livestock Reporting Service, Rm. 833, Federal Bldg., Des Moines, lA.
7. Nelson, S. O. 1965. Dielectric properties of grain and seed in the 1 to 50 mhz range. TRANSACTIONS of the ASAE 8(l):38-47.
8. Nelson, S. O. 1973. Microwave dielectric properties of grain and seed. TRANSACTIONS of the ASAE 16(5):902-905.
9. Nelson, S. O. 1982. Factors affecting the dielectric properties of grain. TRANSACTIONS of the ASAE 25(4): 1045-1049.
10. Steele, J. L., R. A. Saul and W. V. Hukill. 1969. Deterioration of shelled corn as measured by carbon dioxide production. TRANSACTIONS of the ASAE 12(5):685-689.
11. USDA. 1976. Oven method for determining moisture content of grain and related agricultural commodities. In: Equipment handbook, January 1984, Chapter XII, Federal Grain Inspection Service, United States Department of Agriculture, Washington, D.C.
12. USDA. 1980. Test weight per bushel. In: Grain Inspection Handbook—Book II. January 1980, Federal Grain Inspection Service, United States Department of Agricultural, Washington D.C, pp.1.18-1.22.
Vol. 29(4):July-August, 1986 1123