Embed Size (px)
Citation preview

Performance of a Wastewater Treatment Pond System with Microfiltration
A Master’s Thesis Presented to the Faculty of California Polytechnic State University
San Luis Obispo
In Partial Fulfillment Of the Requirements for the Degree
Master of Science in Civil and Environmental Engineering
By
Eric Martin
December 2012

ii
© 2012 Eric Martin
ALL RIGHTS RESERVED
iii
AUTHORIZATION FOR REPRODUCTION
OF MASTER’S THESIS
I hereby grant permission for the reproduction of this thesis in its entirety or any of its parts, without further authorization, provided acknowledgment is made to the authors and advisors.
Eric Martin
Date

iv
APPROVAL PAGE
TITLE: Performance of a Wastewater Treatment Pond System with Microfiltration
AUTHOR: Eric Martin
DATE SUBMITTED: December 2012
Committee Chair: Dr. Tryg Lundquist
Committee Member: Dr. Yarrow Nelson
Committee Member: Dr. Sam Vigil
v
ABSTRACT
PERFORMANCE OF A WASTEWATER TREATMENT POND SYSTEM WITH MICROFILTRATION
Eric Martin
The Woodlands Wastewater Treatment Plant (WWWTP) treats wastewater from the Woodlands
housing community near Nipomo, California. The treated effluent is recycled for irrigation of a
golf course within the community. The treatment facility consists of three facultative ponds in
series followed by a microfiltration system and chlorine disinfection. Microfiltration of
wastewater pond effluent is a fairly new, and potentially challenging, application of
microfiltration. This thesis describes the operating conditions and behavior of the WWWTP
pond system followed by a microfiltration system for the purpose of producing recyclable water
fit for reuse under the regulations of Title 22.
Water quality data were compiled in two ways. Weekly influent and effluent water quality and
flow measurements conducted by the WWWTP operators over the course of three years were
studied to show the treatment trends of the treatment plant as a whole. In addition, weekly water
quality tests were performed on samples of wastewater influent, effluent, and intermediate stages
of treatment for 20 weeks and studied to show treatment performance of each individual pond
and the microfiltration system. Pond treatment performance was analyzed based on removal of
biochemical oxygen demand (BOD) and total suspended solids (TSS) and accumulation of
sludge within the pond system. Microfiltration performance was analyzed in terms of meeting
vi
the TSS discharge requirement and the membrane fouling rate. The power consumption of the
pond system components and the microfiltration system were estimated.
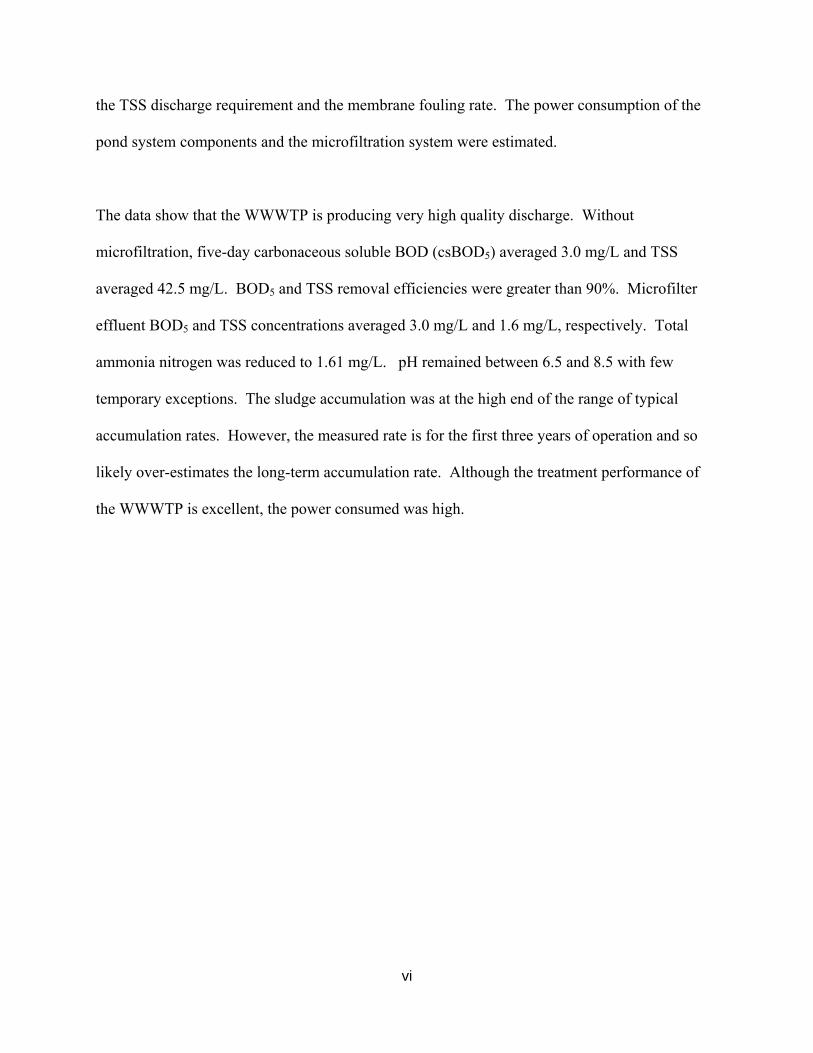
The data show that the WWWTP is producing very high quality discharge. Without
microfiltration, five-day carbonaceous soluble BOD (csBOD5) averaged 3.0 mg/L and TSS
averaged 42.5 mg/L. BOD5 and TSS removal efficiencies were greater than 90%. Microfilter
effluent BOD5 and TSS concentrations averaged 3.0 mg/L and 1.6 mg/L, respectively. Total
ammonia nitrogen was reduced to 1.61 mg/L. pH remained between 6.5 and 8.5 with few
temporary exceptions. The sludge accumulation was at the high end of the range of typical
accumulation rates. However, the measured rate is for the first three years of operation and so
likely over-estimates the long-term accumulation rate. Although the treatment performance of
the WWWTP is excellent, the power consumed was high.

vii
ACKNOWLEDGMENTS
To Dr. Tryg Lundquist Thank you for your support, guidance, and willingness to be available to your students who would not succeed if not for your guidance and knowledge in the area of study that we have
endeavored to learn.
To Dr. Yarrow Nelson and Dr. Sam Vigil Thank you for support, your time, and your willingness to be available. Success would not have
been possible without your contribution.
To Jenny Struthers, Mike Wentzel, and and Scott Ryczek at Fluid Resource Management. Thank you for your willingness, your knowledge, and your patience for my studies. Without your consistent help with the treatment plant operations, this would not have been possible.
Thank you to Rob Miller at Wallace Group, San Luis Obispo who helped arrange access to the site.
To my undergraduate lab technicians: Jennifer Shedden, Christos Mavrakis, Miles Johnson,
Shauna Falvey, Katie Rollins, and Samantha August. Thank you for your time and dedication and help in my attempt to teach and manage a successful
laboratory.
To my parents Todd and Julie, and my family, Thank you for your support and confidence throughout this process. This is all possible because
of the encouragement you regularly gave when I needed it most.
viii
TABLE OF CONTENTS LIST OF TABLES............................................................................................................................................. xi
LIST OF FIGURES........................................................................................................................................... xiii
CHAPTER 1: INTRODUCTION........................................................................................................................ 1
CHAPTER 2: BACKGROUND...........................................................................................................................5
2.1 Microfiltration ...................................................................................................................................5
2.2 Treatment Ponds.............................................................................................................................. 10
CHAPTER 3: POND TREATMENT CHARACTERISTICS…........................................................................ 13
3.1 Short History of the Woodlands Wastewater Treatment Plant....................................................... 13
3.2 Description of Treatment Plant Operation...................................................................................... 13
3.3 Treatment Plant Expansion Potential.............................................................................................. 17
3.4 Pond Dimensions……..................................................................................................................... 17
3.5 Flow Characteristics.……………………………………………………………………………... 19
3.6 Load Characteristics….……………………………………………………………….………….. 20
3.7 Maintenance………………………………………..……………………….………………….… 21
3.8 Regional Water Quality Control Board Regulations ……………………………………………. 23
CHAPTER 4: MICROFILTER CHARACTERISTICS ……………………………………………………… 24
4.1 Microfilter System …………………………………………………………………………….…. 24
4.2 Expansion Plans ………………………………………………………………………………..… 26
4.3 Microfilter Maintenance …………………………………………………………………………. 26
CHAPTER 5: METHODS ……………………………………………………………………………………. 29
5.1 Sampling …………………………………………………………………………………………. 29
CHAPTER 6: ANALYSIS OF HISTORICAL DATA ……………………………………………………….. 29
6.1: Biochemical Oxygen Demand …………………………………………………………………... 32
6.2 Total Suspended Solids ………………………………………………………………………….. 35
6.3 Dissolved Oxygen ……………………………………………………………………………….. 37
ix
6.4 pH …………………………………………………………………………………... 38
6.5 Temperature……………………………….…………………………………………37
6.6 Insulation………………………………….…………………………………………39
6.7 Analysis of Historical Data and Conclusion…………………………………………40
CHAPTER 7: ANALYSIS: A CLOSER LOOK AT WATER QUALITY …………………… 42
7.1 Biochemical Oxygen Demand ……………………………………………………... 42
7.2 Total Suspended Solids …………………………………………………………….. 46
7.3 Total Ammonia Nitrogen …...……………………………………………………… 48
7.4 Alkalinity …………………………………………………………………………... 49
7.5 Sludge Production ………………………………………………………………….. 50
7.6 Algal Species ……………………….……………………………………………… 52
7.7 Microfiltration ……………………………………………………………………… 54
CHAPTER 8: Electricity Use…….. …………………………………………………………… 56
8.1 Overall Energy Use...………………...………………………………………………56
8.2 Aeration Energy Use………………………………………………………………... 57
8.3 Estimated Energy Use by Equipment....……..……………………………………... 58
8.4 Efficiency....……………………………….………………………………………... 62
CHAPTER 9: CONCLUSIONS………………………………………………………………... 64
REFERENCES ………………………………………………………………………………… 66
APPENDIX ……………………………………………….……………………………………. 69
x
LIST OF TABLES
Table Page
1.1 Limits set by the RWQCB for discharge effluent (Water Quality Permit). “BOD” indicates tBOD5 limits ............................................................................... 3
2.1 Membrane types, pore sizes, and contaminants commonly removed ..................... 5
3.1 Full volumes and approximate dimensions of the ponds. The water surface width and length are given. Digester pits are two feet deeper than recorded depth. The treatment portion of Pond C and the maturation portion of Pond C have a combined volume of 1.75 MG. Volumes were given in the plant specifications ........................................................................................................ 18
3.2 Volume in millions of gallons (MG) and retention time for each pond and the total pond system, with a 25,000 gallon per day average flow ............................. 20
3.3 Dissolved oxygen set-points for automatic aerator operation in each pond at the WWWTP ................................................................................................................ 22
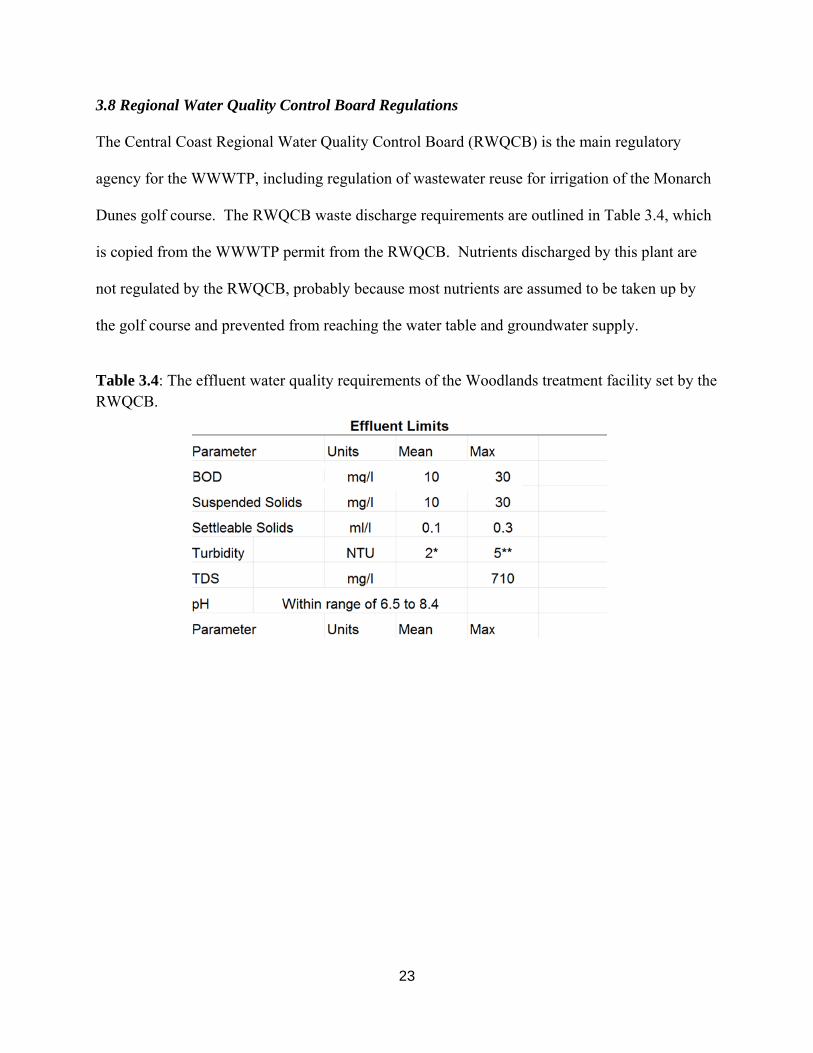
3.4 The effluent water quality requirements of the Woodlands treatment facility set by the RWQCB ...................................................................................................... 23
4.1 Caustic and acidic additions to rinse water during chemical cleaning ................. 26
6.1 Summary of effluent characteristics of the WWWTP (tBOD5, TSS, DO and pH from March 2009 to March 2012 and comparison to regulations set by the RWQCB .,............................................................................................................. 41
7.1 Data of csBOD5 for Pond A, B, C, and the microfilter from September 2011 to March 2012 ........................................................................................................... 44
7.2 Summary of csBOD5 data collected from September 2011 to March 2012. Note that the detection limit for BOD is 1 mg/L ........................................................... 45
7.3 Summary of kinetic parameters and soluble carbonaceous BOD5 removal efficiency determined from the average data collected during September 2011 to March 2012 ....................................................................................................... 46
7.4 Summary of TSS data collected from September 2011 to March 2012 ............... 48
7.5 Summary of TAN data collected from September 2011 to March 2012 .............. 49
xi
7.6 Summary of ALK data collected from September 2011 to March 2012 ............. 50
7.7 Measured sludge accumulation rates compared to typical ranges in the WWWTP system from March 2009 to March 2012 ........................................... 52
8.1 WWWTP energy consumption and cost for each month of the year of 2011 ...... 56
8.2 WWWTP energy data summary for the year 2011 ............................................. 57
8.3 Summary of aerator motor nameplate power and operating settings in each pond at the WWWTP ............................................................................................................ 58
8.4 Aerator and Microfilter energy estimates and costs per year during the months of March 2009 and March 2012 .......................................................................... 62
8.5 Summary of the performance of WWWTP and those treatment plants included in the study by PG&E (Benschine et al. 2003) ..................................................... 63
9.1 Treatment pond and microfilter performance of BOD5 and TSS and associated costs of operation at the WWWTP ..................................................................... 65
xii
LIST OF FIGURES
Figure Page
1.1 Location of Woodlands Wastewater Treatment plant in Nipomo California, approximately 30 miles south of San Luis Obispo (Google Maps)………………… 2
1.2 Layout diagram of wastewater treatment plant showing flow through plant operations ………….………………………………………………………………. 3
2.1 Sizes of common water constituents and pore sizes of membrane filters ………… 6
2.2 Electron micrographs of a PVDF membrane. The pores have a nominal size of 0.1 microns (Ho et al. 1999) ……………………………………………….....… 7
2.3 Diagram showing the symbiotic relationship between bacteria and algae with the products and constituents of each process. (Oswald et al. 1955) ……………... 10
3.1 Photo of layout of the Woodlands wastewater treatment plant with labeled treatment unit operations ………………………………………………………...... 14
3.2 Headworks of the WWWTP. Below the grate, a grinder reduces waste to small particles and a screen separates and disposes of debris before it enters the pond system …………………………………………………………………… 14
3.3 Pond A seen from the influent end of pond facing southwest …………………… 15
3.4 Pond B seen from the influent end of pond facing northwest ……………………. 16
3.5 Left: Pond C from influent end. Right: Pond C looking down at a maturation (un-aerated) zone of pond C. Maturation zone in relation to Pond C can be seen in Figure 1.2 …………………………………………………………………. 16
3.6 Topographical Plan of the three treatment ponds with pond depth and digester depth shown. Proposed ponds can be seen in the center of the current ponds and treatment plant facility ……………………………………………………………. 17
3.7 Topographical plan of the three treatment ponds. Proposed ponds can be seen in the center of the current ponds and treatment plant facility …………………… 19
3.8 Schematic of the treatment ponds and the Horizontal Rotor Aerators in Ponds A, B, and C ……………………………………………………………………….. 22
4.1 Right: Microfilter skid containing 30 microfilter modules. Each filter module is filled with hollow fiber tube filters. Left: Pall Brand Aria AS series control
xiii
module …………………………………………………………………………… 24
4.2 The Pall Aria AP-4 series used at the Woodlands wastewater treatment facility is similar to the one shown above. Left: A system with five modules. Right: cross section of single module with hollow fibers ……………………………… 24
5.1 Photographs of locations of sample collection. (a) Influent flume. (b) Pond A effluent weir. (c) Pond B effluent weir. (d) Pond 3 collection box. (e) Microfilter effluent spigot. (f) Microfilter backwash ……………………......…… 30
6.1a Total BOD5 in the influent and effluent of the WWWTP from March 2009 through March 2012, as reported in monthly reports to the RWQCB .................... 33
6.1b Total BOD5 influent and effluent of the WWWTP from March 2009 through March 2012, as reported in monthly reports to the RWQCB. Y-axis scale has been changed to omit the highest measurements in order to show more detail in the typical influent range ................................................................................... 33
6.1c Total BOD5 concentration of plant effluent from January 2009 to March 2012. The increase in BOD effluent concentration was reported by the operators to be the result of acetic acid addition to the microfilter effluent in the chlorine contact basin for pH control .................................................................................... 34
6.2a TSS influent and effluent of the WWWTP from March 2009 through March 2012, as reported in monthly reports to the RWQCB .............................................. 35
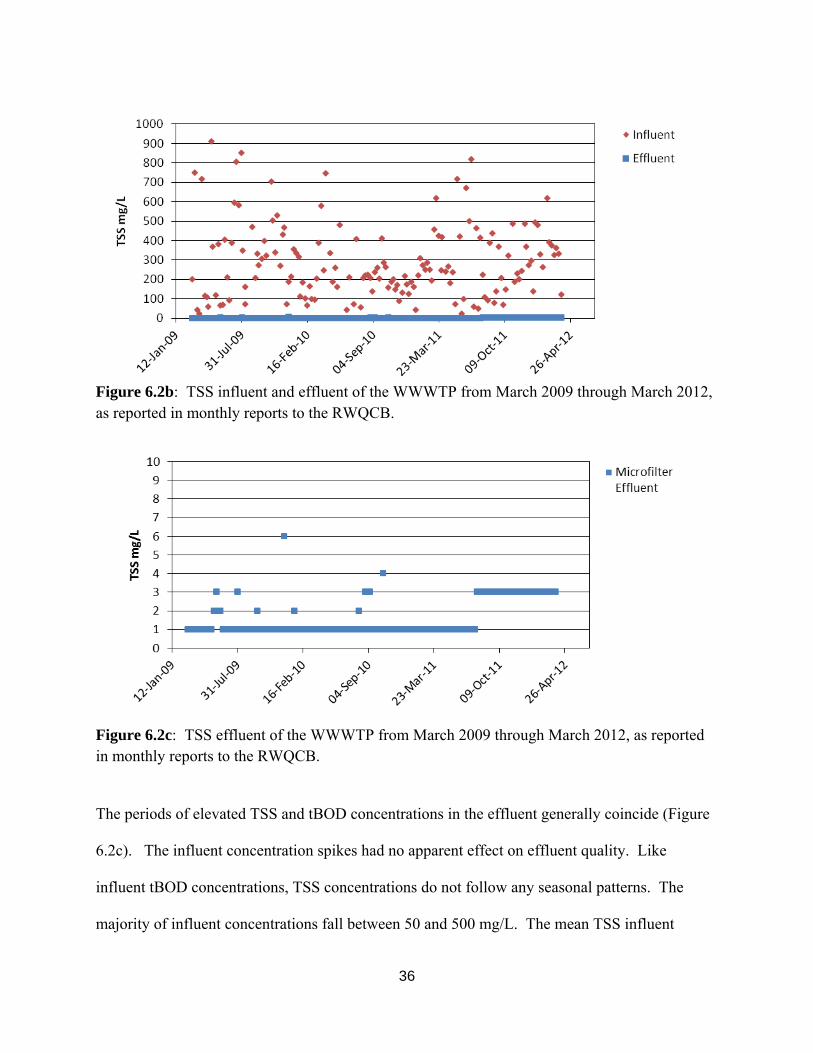
6.2b TSS influent and effluent of the WWWTP from March 2009 through March 2012, as reported in monthly reports to the RWQCB. Y-axis scale has been changed to omit the highest measurements in order to show more detail in the typical influent range ............................................................................................... 36
6.2c TSS effluent of the WWWTP from March 2009 through March 2012, as reported in monthly reports to the RWQCB ............................................................ 36
6.3 Effluent dissolved oxygen effluent of the WWWTP from March 2009 through March 2012, as reported in monthly reports to the RWQCB ................................. 37
6.4 Effluent pH of the WWWTP from March 2009 through March 2012, as reported in monthly reports to the RWQCB ......................................................................... 38
6.5 Monthly ambient temperature recordings from CIMIS Station 202 in Nipomo
xiv
California .............................................................................................................. 39
6.6: Insulation monthly recordings from CIMIS station 202 in Nipomo California ... 40
7.1a csBOD5 at various locations at the WWWTP from September 2011 through March 2012. Locations include influent (total BOD5), influent (carbonaceous soluble BOD5), Pond A effluent, Pond B effluent, Pond C effluent, microfilter effluent, and the microfilter backwash outlet to Pond A ...................................... 43
7.1b Soluble carbonaceous BOD5 at various locations at the WWWTP from September 2011 through March 2012. Locations include Pond A effluent, Pond B effluent, Pond C effluent, and microfilter effluent ................................... 43
7.2 TSS at various locations at the WWWTP from September 2011 through March 2012. The sample locations were the Influent, Pond A effluent, Pond B effluent, Pond C effluent, and microfilter effluent .............................................................. 47
7.3 VSS at various locations at the WWWTP from September 2011 through March 2012. The sample locations include Influent, Pond A effluent, Pond B effluent, Pond C effluent, and microfilter effluent .............................................................. 47
7.4 Total ammonia nitrogen (TAN; NH3+NH4+) at various locations at the WWWTP
from September 2011 through March 2012. Locations include Influent, Pond A effluent, Pond B effluent, Pond C effluent, and microfilter effluent .................... 48
7.5 Alkalinity as mg/L CaCO3 at various locations at the WWWTP from September 2011 through March 2012. Locations include Influent, Pond A effluent, Pond B effluent, Pond C effluent, and microfilter effluent .................... 50
7.6 Sludge depth diagram of 22 depth locations in the pond system at the Woodlands Wastewater Treatment Plant ............................................................. 51
7.7 Identification of algae present in the effluent of Pond C on June 5, 2012 ........... 53
7.8 TSS influent and effluent of the WWWTP microfilters from September 2011 through March 2012, as recorded in monthly reports to the RWQCB. All data points shown as 1 mg/L were recorded as <1 mg/L in the monthly report ......... 54
7.9 TSS effluent of the WWWTP microfilters from March 2009 through March 2012, as reported in monthly reports to the RWQCB. All data points shown as 1 mg/L were reported as <1 mg/L in the monthly reports ............................... 55
A.1 Elevation plan view Woodlands Wastewater Treatment Plant ............................ 69
xv
A.2 Elevation plan view of Pond A. Digester floor and pond floor elevations are displayed on image ............................................................................................. 70
A.3 Elevation plan view of Pond B. Digester floor and pond floor elevations are displayed on image ............................................................................................. 71
A.4 Elevation plan view of Pond C. Pond floor elevations are displayed on image .... 72
A.5 Pall Aria AP-4 data ............................................................................................. 73
A.6 Pall Aria AP-4 data sheet .................................................................................... 74
1
CHAPTER 1: INTRODUCTION
Wastewater treatment pond systems are a common technology throughout the world. Most
municipal pond systems in the US treat to the secondary level, achieving removal of organic
matter (USEPA 2003) and some incidental removal of pathogens and nutrients. Chlorine
disinfection is often applied before discharge or reuse. At many pond facilities producing water
for reuse, filtration is also applied, often using granular media filtration. Low levels of
suspended solids are often required for effluent recycling for irrigation. Use of microfiltration to
improve algae pond effluents is currently rare. Reasons for this may include the relatively recent
application of microfiltration to wastewater, its cost, and inexperience with the fouling rate of
microfilters subjected to pond effluents. In particular, the effluent of many pond systems
contains high concentrations of suspended microalgae, which can be expected to accelerate
fouling. Microfiltration has been more commonly applied to water supply treatment and not
wastewater pond effluent treatment. Increased frequency of backwashing, membrane cleaning,
and membrane replacement are cost factors that need to be better understood for wastewater
applications. The present thesis research sought to better characterize pond-microfilter treatment
by collecting water quality data at such a facility and using it to evaluate the performance of both
the microfilter and the overall pond-microfilter combination. In addition to water quality and
microfilter operations issues, the energy efficiency of the overall process was assessed.
The WWWTP near Nipomo California, was used as a case study for this thesis. The water
quality constituents studied were biochemical oxygen demand, suspended solids, total ammonia
nitrogen, alkalinity, pH, temperature, and dissolved oxygen. Although the subject facility was
not intended for nutrient removal, ammonium removal was extensive.
2
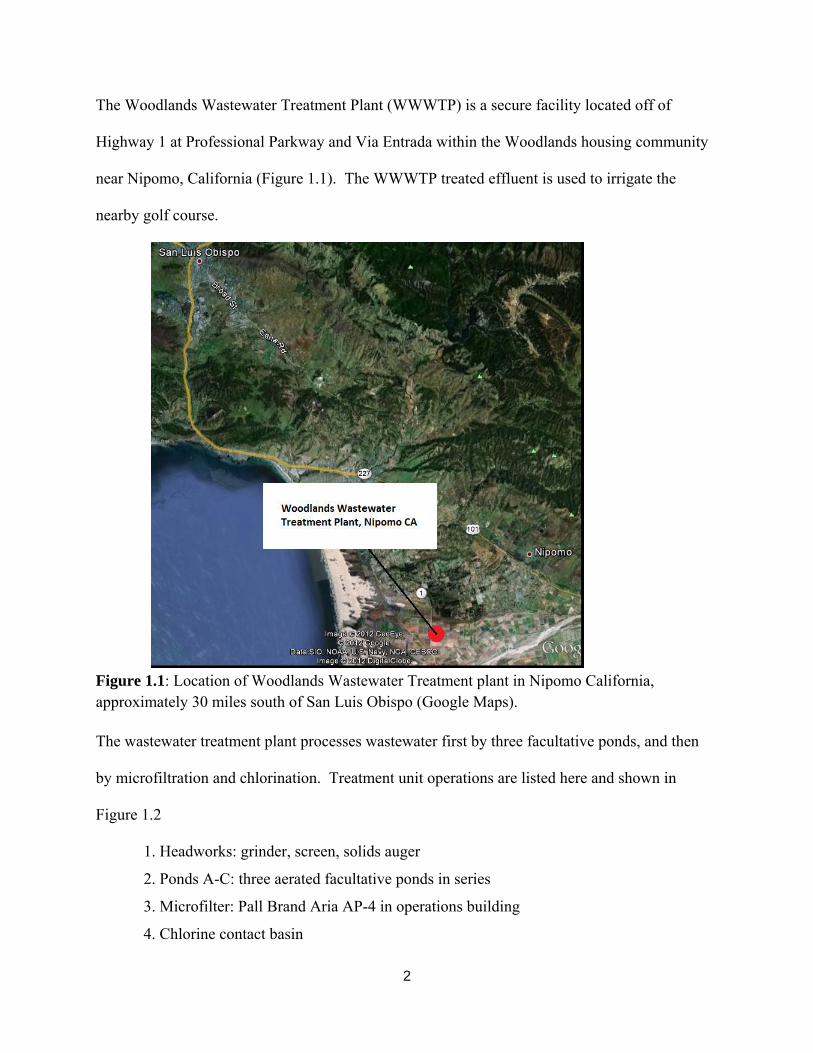
The Woodlands Wastewater Treatment Plant (WWWTP) is a secure facility located off of
Highway 1 at Professional Parkway and Via Entrada within the Woodlands housing community
near Nipomo, California (Figure 1.1). The WWWTP treated effluent is used to irrigate the
nearby golf course.
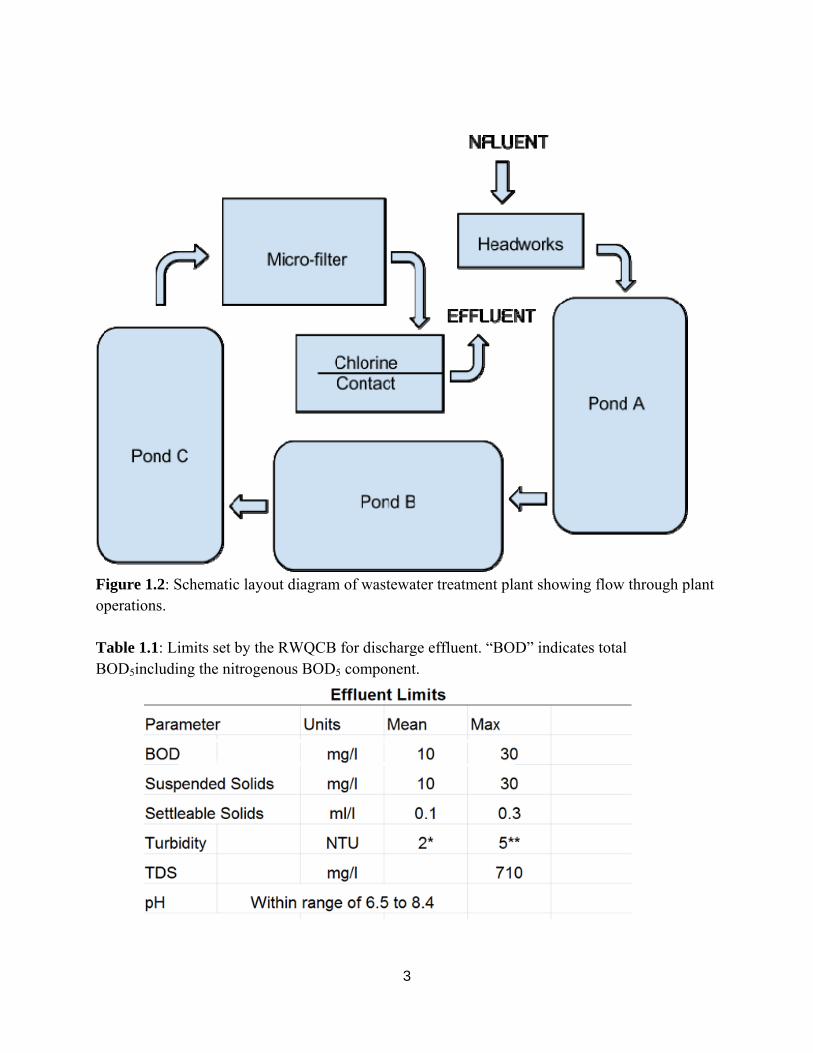
Figure 1.1: Location of Woodlands Wastewater Treatment plant in Nipomo California, approximately 30 miles south of San Luis Obispo (Google Maps). The wastewater treatment plant processes wastewater first by three facultative ponds, and then
by microfiltration and chlorination. Treatment unit operations are listed here and shown in
Figure 1.2
1. Headworks: grinder, screen, solids auger
2. Ponds A-C: three aerated facultative ponds in series
3. Microfilter: Pall Brand Aria AP-4 in operations building
4. Chlorine contact basin
3
Figure 1.2: Schematic layout diagram of wastewater treatment plant showing flow through plant operations. Table 1.1: Limits set by the RWQCB for discharge effluent. “BOD” indicates total BOD5including the nitrogenous BOD5 component.

4
The goal of this thesis is to characterize the treatment conditions and performance of the
WWWTP in its objective to provide secondary treated reclaimed water to the Woodlands
community. The main questions to be answered are listed below.
1. Does the WWWTP remove BOD5 to below the limit of 10 mg/L (Table 1.1)?
2. Does the WWWTP remove TSS to below the limit of 10 mg/L (Table 1.1)?
3. Does the WWWTP provide effluent with pH that falls within the allowable range (Table
1.1)?
4. How effective is the WWWTP at removing nitrogen? (The RWQCB does not require
nitrogen removal at this plant.)
5. How much sludge is accumulating in the pond system?
6. Has there been any permanent fouling of the microfiltration membranes?
7. How does the energy intensity of the WWWTP compare to activated sludge plants?
Chapter 2 reviews microfilter technology and treatment pond characteristics typical to
wastewater treatment, and Chapter 3 describes the WWWTP in some detail.
5
CHAPTER 2: BACKGROUND
2.1 Microfiltration
“Membrane filtration is defined as a pressure- or vacuum-driven separation process in which
particulate matter larger than 1 μm is rejected by an engineered barrier, primarily through a size
exclusion mechanism, and which has a measurable removal efficiency of a target organism that
can be verified through the application of a direct integrity test” (USEPA 2005).
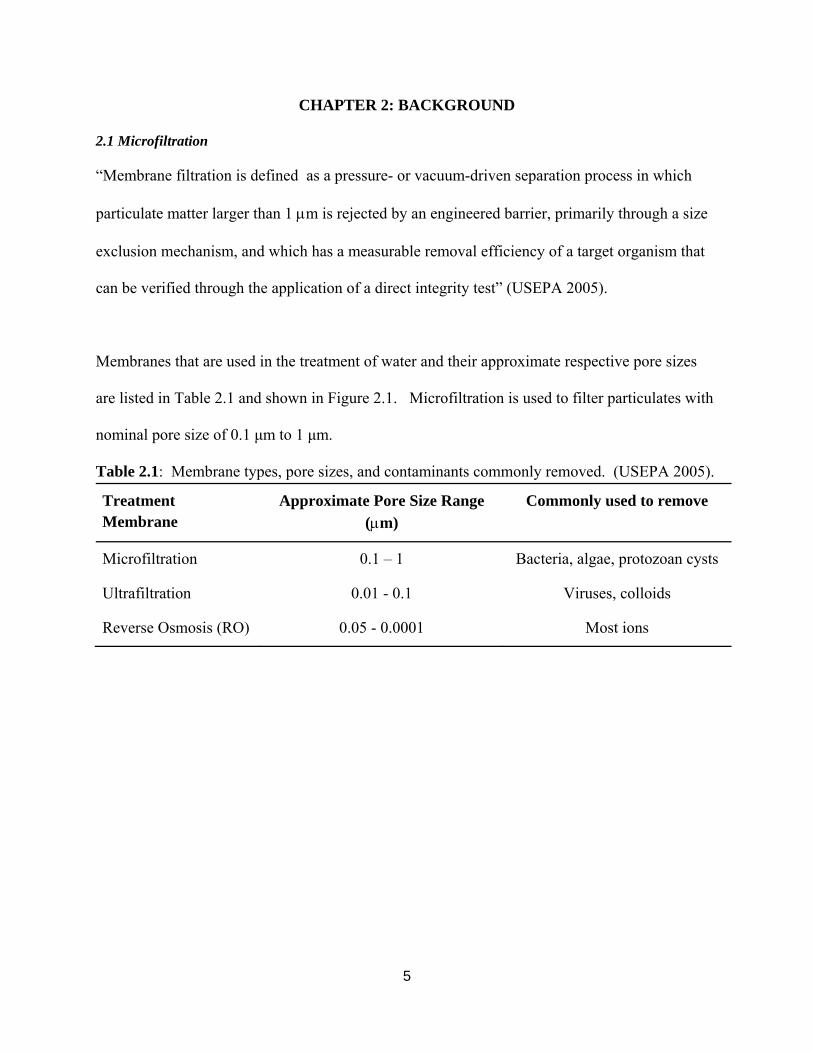
Membranes that are used in the treatment of water and their approximate respective pore sizes
are listed in Table 2.1 and shown in Figure 2.1. Microfiltration is used to filter particulates with
nominal pore size of 0.1 μm to 1 μm.
Table 2.1: Membrane types, pore sizes, and contaminants commonly removed. (USEPA 2005).
Treatment Membrane
Approximate Pore Size Range (μm)
Commonly used to remove
Microfiltration 0.1 – 1 Bacteria, algae, protozoan cysts
Ultrafiltration 0.01 - 0.1 Viruses, colloids
Reverse Osmosis (RO) 0.05 - 0.0001 Most ions

6
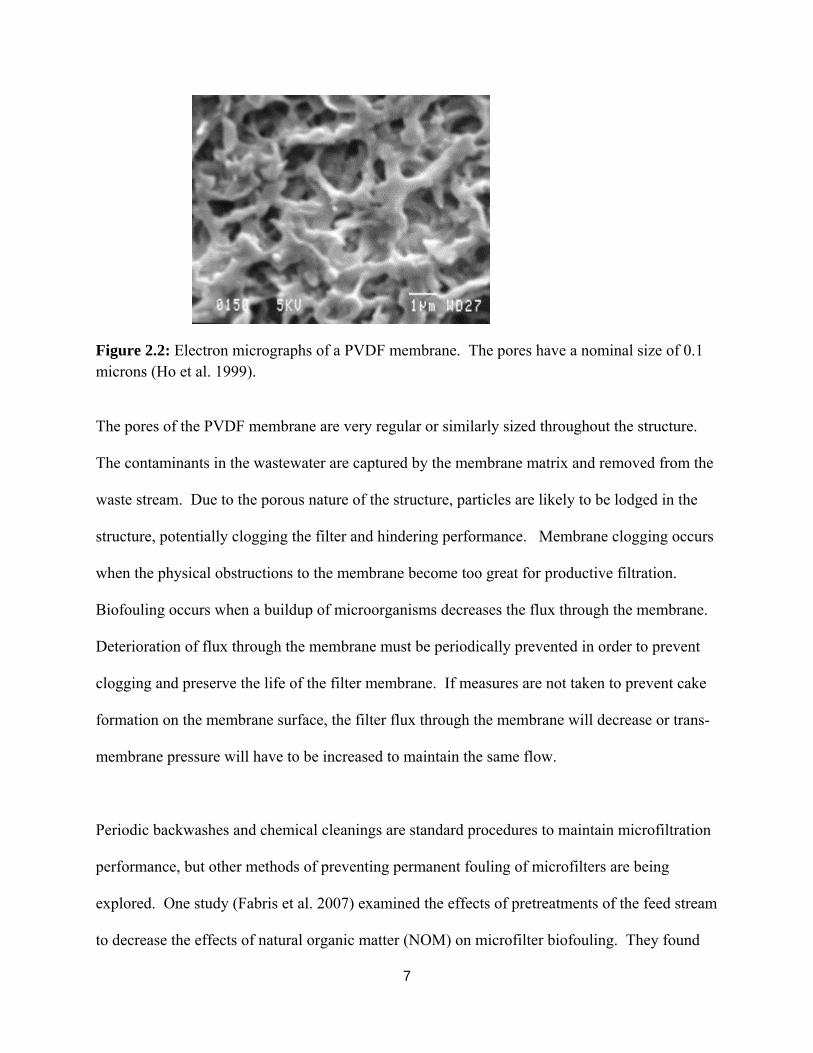
Figure 2.1: Sizes of common water constituents and pore sizes of membrane filters (Good Water Company 2012). The microfiltration system used at the WWWTP is the Pall Brand Aria AP-4 microfiltration
system and has a nominal pre size of 0.1 μm. The Aria AP-4 is a olyvinylidene difluoride
(PVDF) hollow fiber membrane (Figure 2.2). The patent for the hollow fiber PVDF describes
the PVDF as follows: “having a high selectivity in permeation, a high permeability, a high
porosity, an excellent mechanical strength and an excellent chemical resistance and an excellent
inertness to living bodies” (Nohmi et al. 1981). Figure 2.2 below shows a micrograph of a PVDF
membrane.
7
Figure 2.2: Electron micrographs of a PVDF membrane. The pores have a nominal size of 0.1 microns (Ho et al. 1999).
The pores of the PVDF membrane are very regular or similarly sized throughout the structure.
The contaminants in the wastewater are captured by the membrane matrix and removed from the
waste stream. Due to the porous nature of the structure, particles are likely to be lodged in the
structure, potentially clogging the filter and hindering performance. Membrane clogging occurs
when the physical obstructions to the membrane become too great for productive filtration.
Biofouling occurs when a buildup of microorganisms decreases the flux through the membrane.
Deterioration of flux through the membrane must be periodically prevented in order to prevent
clogging and preserve the life of the filter membrane. If measures are not taken to prevent cake
formation on the membrane surface, the filter flux through the membrane will decrease or trans-
membrane pressure will have to be increased to maintain the same flow.
Periodic backwashes and chemical cleanings are standard procedures to maintain microfiltration
performance, but other methods of preventing permanent fouling of microfilters are being
explored. One study (Fabris et al. 2007) examined the effects of pretreatments of the feed stream
to decrease the effects of natural organic matter (NOM) on microfilter biofouling. They found

8
that removal of colloidal suspensions and dissolved organic carbon (DOC) helped prevent
biofouling of a microfilter. The removal of colloids with pretreatment included the use of a
magnetic ion exchange resin or MIEX (Orica Australia Pty. Ltd.), followed by the addition of
aluminum sulfate (alum), then powdered activated carbon (PAC), and alum again. Before MIEX
treatment, coagulated colloids and DOC are removed by settling in order to increase the life of
the microfilter. This study found that by nearly completely eliminating the concentration of
DOC and colloids in the feed stream, biofouling could be reduced significantly in microfiltration.
One wastewater study (Ahn et al. 1999) explored the ability of hollow fiber microfiltration to
process wastewater to reuse standards and found that it is capable of removing solids from
wastewater so that it can be reused as irrigation. However, because wastewater has typically
high levels of solids, preventative measures have to be performed more often in order to prolong
the life of the filter.
Membrane filter biofouling is a major topic of research in the membrane bioreactor field, in
which membranes are used to separate activated sludge suspended solids from mixed liquor.
(Lim et al. 2003). It was found in this study that that the most effective way to prevent
biofouling on submerged microfilter membranes in activated sludge basins is to combine a clean
water backwash, sonication , and a chemical cleaning. Backwashing cleared particulates out of
the membrane pores, sonication disintegrated flocculated particles that were caked on the surface
of the membrane, and flushing with alkaline and acidic chemicals was needed to maintain flux.
This process is not exclusively effective to activated sludge basins.
9
Pretreatment is also another way to increase the life of the microfilter in wastewater reuse
applications. Ferric sulfate and GAC have been shown to decrease the rate of biofouling on
microfiltration of wastewater. It was found that pre-coagulation and clarification produces a flux
25% greater than a feed stream untreated (Hatt et al. 2011). The addition of 0.5 mg/L ferric
sulfate, a common coagulant in the wastewater treatment industry, can increase the
microfiltration flux to a constant pressure. By coagulating and clarifying the wastewater before
microfiltration, the amount of solids being filtered out is less, which increases the time it takes
for the solids to clog the membrane pores. Similar results were found with the addition of
granular activated carbon (GAC) as a preconditioning additive to wastewater (Xing et al. 2012).
By adding GAC to the microfiltration process in the feed stream followed closely by clarification
prior to microfiltration, and controlling for pressure, flux was significantly increased in the
fluidized bed reactor system. If the number of particles is decreased by pretreatment, flux
through the microfilter is increased and the rate at which biofouling occurs is decreased (Xing et
al. 2012).
No literature could be found on microfiltration of wastewater pond system effluent, and this
topic provides a new opportunity for study. The treatment of pond effluent with microfiltration is
the topic of this thesis, but first wastewater treatment ponds are reviewed briefly in the following
section.
2.2 Treatment Ponds
Wastewater treatment ponds provide biological treatment of municipal waste water with a low
operations cost (Metcalf and Eddy, 1991). These ponds can be designed to be heavily-loaded
anaerobic ponds, less loaded facultative ponds, or lightly-loaded aerobic ponds. . In facultative

10
and aerobic ponds, suspended microalgae produce photosynthetic oxygen that can be used by
aerobic bacteria to remove BOD (Figure 2.3). Mechanically aerated ponds are another option,
and combinations of these ponds can be joined together in systems designs. Methanogenesis is a
major mechanism of treatment in anaerobic ponds and in the anaerobic benthic layer of
facultative ponds.
Figure 2.3: Diagram showing the symbiotic relationship between bacteria and algae with the products and constituents of each process (Oswald et al. 1955).
If the rates of algal photosynthesis and bacteria oxidation are in equilibrium, no additional
oxygen need be added to the ponds. However, oxygen production can be hindered by many
common occurrences such as a cloudy day and excessive zooplankton grazing (Metcalf and
Eddy 1991). In order to prevent a slowing of biological activity within the pond, aerators are
commonly installed in pond systems to add dissolved oxygen to the wastewater when O2
production by algae is insufficient.
There are many configurations of pond systems, but Oswald describes a system that the
WWWTP seems to be modeled after. The pond system is characterized by a primary digestion
11
pit followed by an aerobic zone, followed by a secondary solids digestion pit (Oswald et al.
1990). An anaerobic pond will provide some BOD removal and will provide anaerobic digestion
of solids. The depth of this pond must be sufficient to allow for the settling and anaerobic
digestion of primary wastewater solids. After 20 to 30 days, water exits into a facultative pond.
This pond provides some anaerobic digestion in the benthic zone and aerobic respiration as BOD
is removed from the water. An aerobic pond receives effluent from the facultative pond to polish
the wastewater. In this pond pathogens die and remaining BOD is removed by heterotrophic
bacteria. The WWWTP contains all of these zones in its three ponds. Two ponds contain
anaerobic and facultative zones where solids digestion occurs and BOD removal is sustained by
oxygen-rich water provided by algae and surface aerators. A third pond contains a facultative
zone and a maturation or aerated zone where solids settle, and the final BOD present in the
wastewater is meant to be consumed. The performance and conditions of these ponds are
discussed in later sections.
Sludge accumulation is inevitable in a pond system because some sludge is inert and/or inorganic
and thus not susceptible to anaerobic digestion. Over time, this material will decrease the liquid
volume of the ponds, decreasing retention time and treatment performance. It is reported that in
several pond treatment systems in Mexico, sludge production is evenly distributed in anaerobic
ponds, and prevalent at the inlets of aerobic ponds (Nelson et al. 2004). Anaerobic ponds are
usually smaller in size and deeper than aerobic ponds, and they bear the bulk of the solids
deposits from the waste stream. Anaerobic digestion occurs when solids build up on the bottom
and are eliminated as bacteria consume organic matter. (Nelson et al. 2004). In order to promote
12
anaerobic conditions to digest the primary sludge settling near the influent pipes, Oswald
suggested digestion pits (Oswald 1990), as implemented independently at WWWTP.
Pond configuration must be considered in the design of the treatment ponds for the efficient
removal of wastewater contaminants and for the duration of the life of the pond. Successful
designs optimize the life of the pond system by reducing the accumulation of sludge and
provides the necessary treatment to the water entering the treatment plant (Oswald 1990).

13
CHAPTER 3: WOODLANDS WASTEWATER TREATMENT PLANT DESCRIPTION
3.1 Short History of the Woodlands Wastewater Treatment Plant
The wastewater treatment plant for the Woodlands community started operation in March 2009.
The plant currently treats domestic wastewater from 380 single- and multi- family homes, and a
1500 square foot multiuse center located at the golf course. At build-out, the Woodlands
development will consist of 1,320 single-family and multi-family residences, a 500-unit resort
hotel, 48-hole championship golf course, 150,000 square feet of retail and up to 650,000 square
feet of commercial and office space. The increased loading from the additional development will
be accommodated by the current under-utilized capacities of the treatment plant and by eventual
treatment plant expansion.
3.2 Description of Treatment Plant Operation
Influent from the residential community enters the treatment plant where it is processed by a
grinder and screen at the headworks. These devices eliminate debris from the wastewater and
reduce biological matter to manageable sizes. Debris that cannot pass through the screen is
disposed of into a trash receptacle dumpster (Figure 3.2) and transported to a solid waste landfill.
Once the water passes through the screen, it enters the pond system. The system at the
Woodlands wastewater treatment facility provides BOD removal, solids elimination, and
pathogen destruction for the Woodlands community.
14
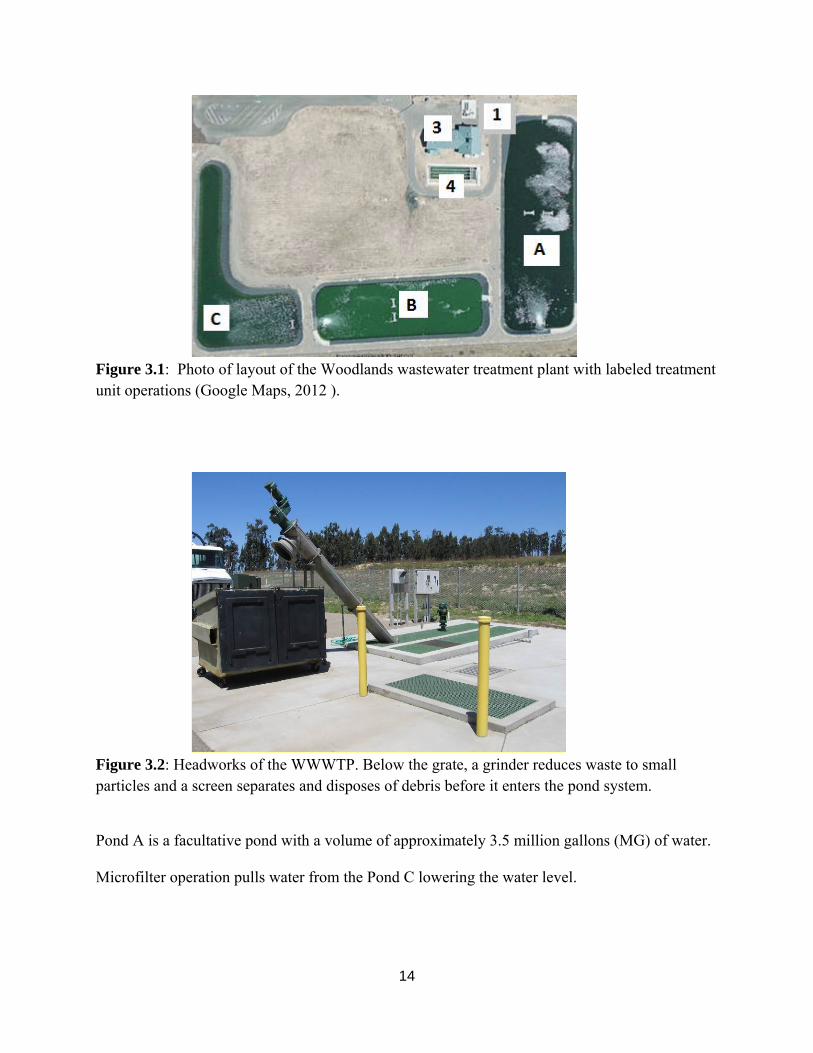
Figure 3.1: Photo of layout of the Woodlands wastewater treatment plant with labeled treatment unit operations (Google Maps, 2012 ).
Figure 3.2: Headworks of the WWWTP. Below the grate, a grinder reduces waste to small particles and a screen separates and disposes of debris before it enters the pond system.
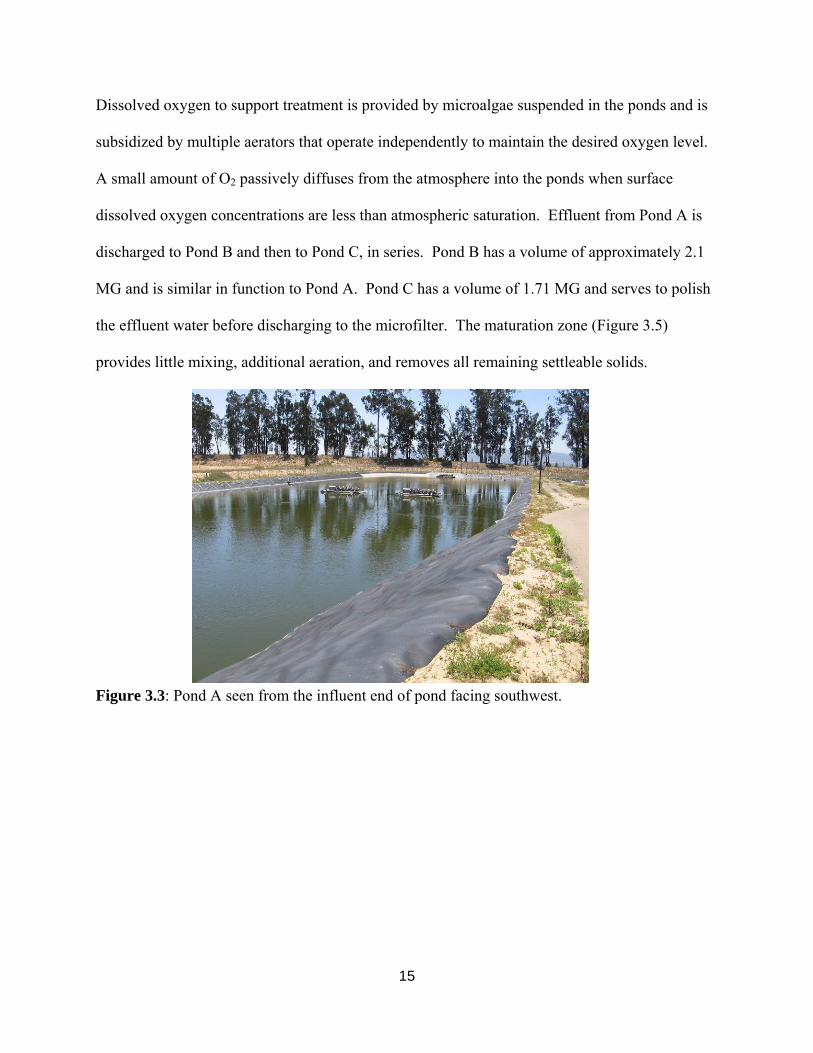
Pond A is a facultative pond with a volume of approximately 3.5 million gallons (MG) of water.
Microfilter operation pulls water from the Pond C lowering the water level.
15
Dissolved oxygen to support treatment is provided by microalgae suspended in the ponds and is
subsidized by multiple aerators that operate independently to maintain the desired oxygen level.
A small amount of O2 passively diffuses from the atmosphere into the ponds when surface
dissolved oxygen concentrations are less than atmospheric saturation. Effluent from Pond A is
discharged to Pond B and then to Pond C, in series. Pond B has a volume of approximately 2.1
MG and is similar in function to Pond A. Pond C has a volume of 1.71 MG and serves to polish
the effluent water before discharging to the microfilter. The maturation zone (Figure 3.5)
provides little mixing, additional aeration, and removes all remaining settleable solids.
Figure 3.3: Pond A seen from the influent end of pond facing southwest.
16
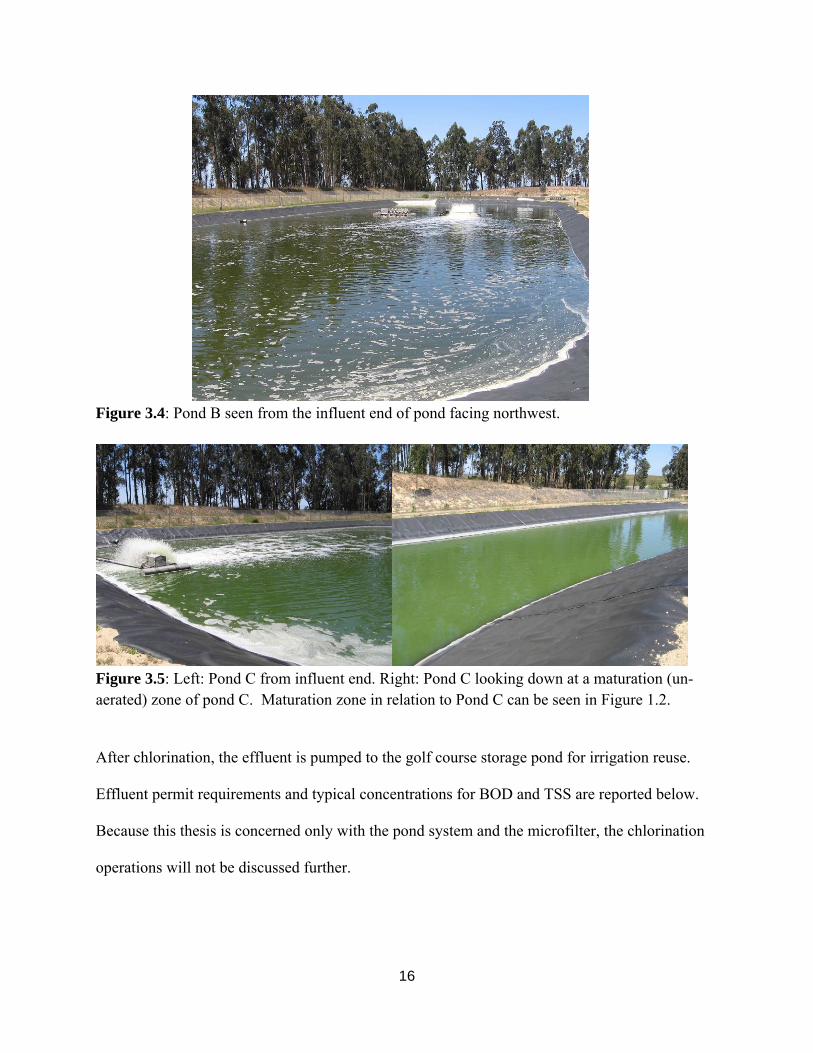
Figure 3.4: Pond B seen from the influent end of pond facing northwest.
Figure 3.5: Left: Pond C from influent end. Right: Pond C looking down at a maturation (un-aerated) zone of pond C. Maturation zone in relation to Pond C can be seen in Figure 1.2.
After chlorination, the effluent is pumped to the golf course storage pond for irrigation reuse.
Effluent permit requirements and typical concentrations for BOD and TSS are reported below.
Because this thesis is concerned only with the pond system and the microfilter, the chlorination
operations will not be discussed further.
17
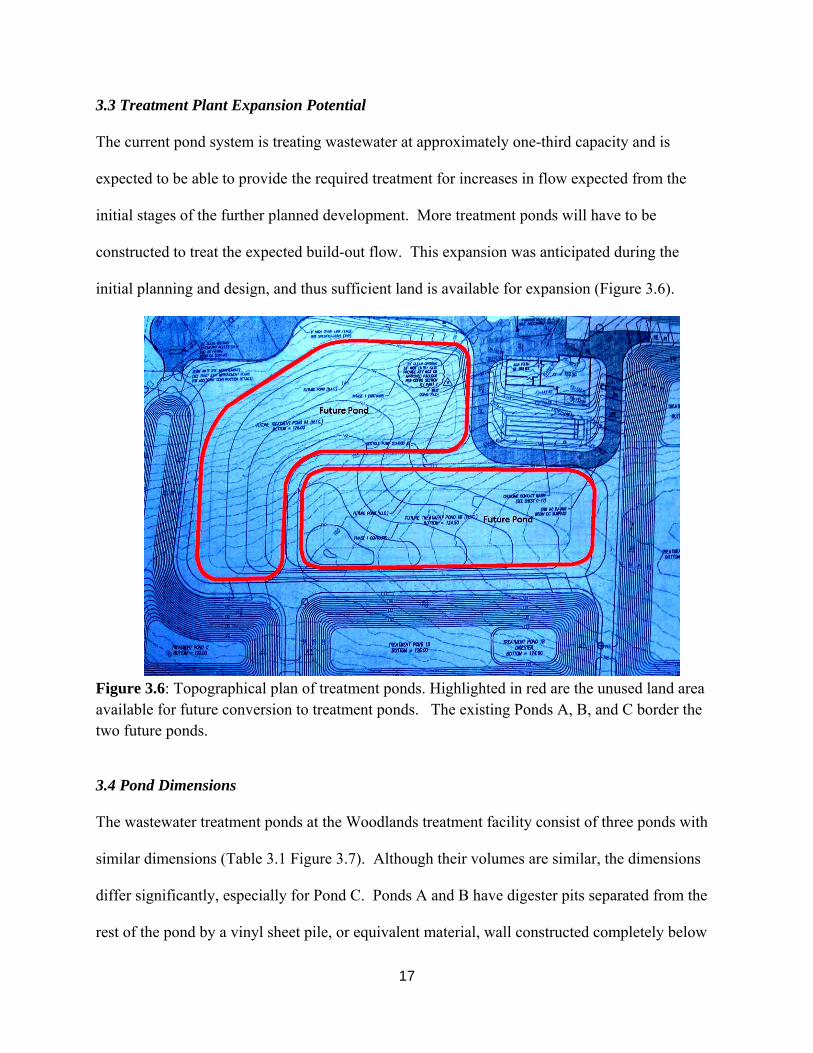
3.3 Treatment Plant Expansion Potential
The current pond system is treating wastewater at approximately one-third capacity and is
expected to be able to provide the required treatment for increases in flow expected from the
initial stages of the further planned development. More treatment ponds will have to be
constructed to treat the expected build-out flow. This expansion was anticipated during the
initial planning and design, and thus sufficient land is available for expansion (Figure 3.6).
Figure 3.6: Topographical plan of treatment ponds. Highlighted in red are the unused land area available for future conversion to treatment ponds. The existing Ponds A, B, and C border the two future ponds.
3.4 Pond Dimensions
The wastewater treatment ponds at the Woodlands treatment facility consist of three ponds with
similar dimensions (Table 3.1 Figure 3.7). Although their volumes are similar, the dimensions
differ significantly, especially for Pond C. Ponds A and B have digester pits separated from the
rest of the pond by a vinyl sheet pile, or equivalent material, wall constructed completely below
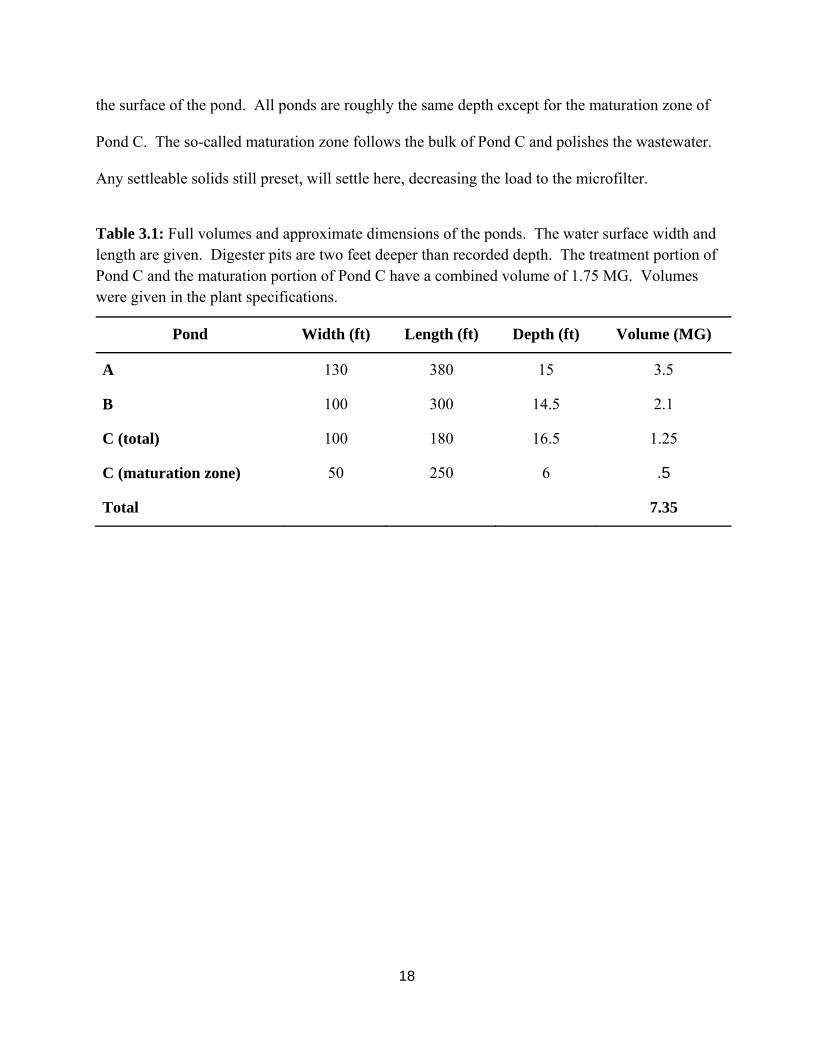
18
the surface of the pond. All ponds are roughly the same depth except for the maturation zone of
Pond C. The so-called maturation zone follows the bulk of Pond C and polishes the wastewater.
Any settleable solids still preset, will settle here, decreasing the load to the microfilter.
Table 3.1: Full volumes and approximate dimensions of the ponds. The water surface width and length are given. Digester pits are two feet deeper than recorded depth. The treatment portion of Pond C and the maturation portion of Pond C have a combined volume of 1.75 MG. Volumes were given in the plant specifications.
Pond Width (ft) Length (ft) Depth (ft) Volume (MG)
A 130 380 15 3.5
B 100 300 14.5 2.1
C (total) 100 180 16.5 1.25
C (maturation zone) 50 250 6 .5
Total 7.35
19
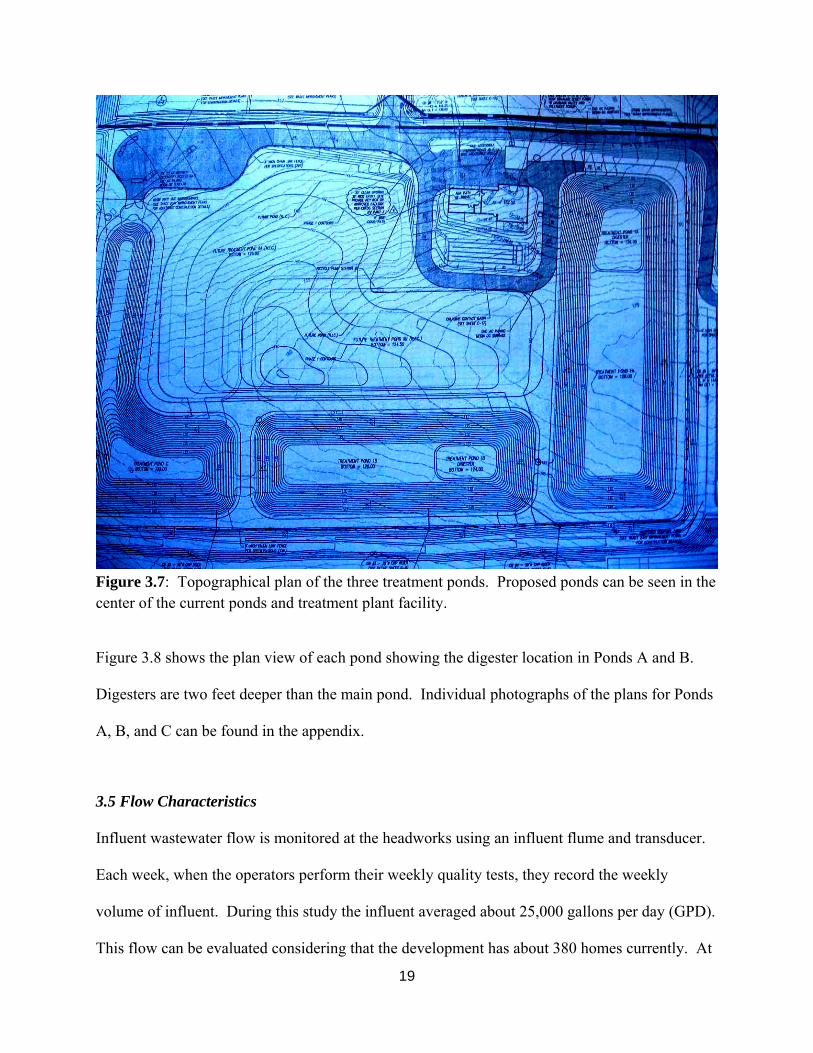
Figure 3.7: Topographical plan of the three treatment ponds. Proposed ponds can be seen in the center of the current ponds and treatment plant facility.
Figure 3.8 shows the plan view of each pond showing the digester location in Ponds A and B.
Digesters are two feet deeper than the main pond. Individual photographs of the plans for Ponds
A, B, and C can be found in the appendix.
3.5 Flow Characteristics
Influent wastewater flow is monitored at the headworks using an influent flume and transducer.
Each week, when the operators perform their weekly quality tests, they record the weekly
volume of influent. During this study the influent averaged about 25,000 gallons per day (GPD).
This flow can be evaluated considering that the development has about 380 homes currently. At
20
2 persons per home, 760 persons is a preliminary estimate of the population. However, at a
typical wastewater production of 70 gal/person-d, the flow would be about 53,200 gal per day.
The lower actual flow leads one to conclude that about half of the residents of the development
do not live in the homes year around. They are likely to be second homes or vacation homes.
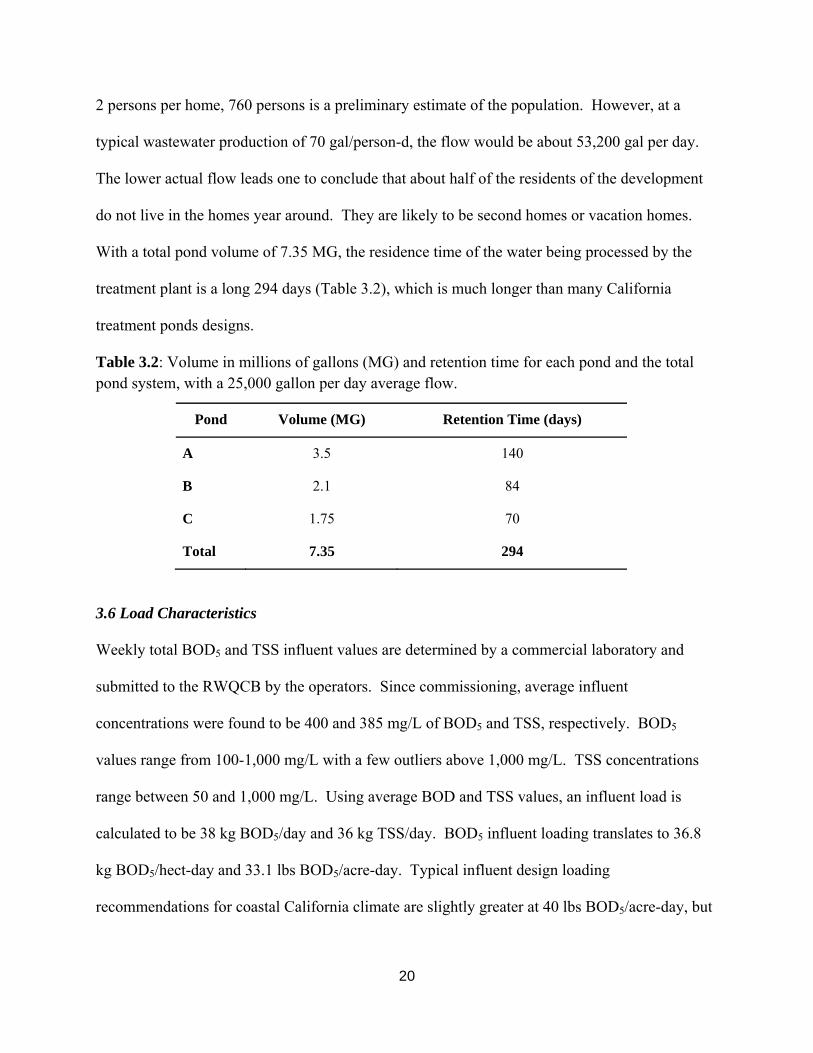
With a total pond volume of 7.35 MG, the residence time of the water being processed by the
treatment plant is a long 294 days (Table 3.2), which is much longer than many California
treatment ponds designs.
Table 3.2: Volume in millions of gallons (MG) and retention time for each pond and the total pond system, with a 25,000 gallon per day average flow.
Pond Volume (MG) Retention Time (days)
A 3.5 140
B 2.1 84
C 1.75 70
Total 7.35 294
3.6 Load Characteristics
Weekly total BOD5 and TSS influent values are determined by a commercial laboratory and
submitted to the RWQCB by the operators. Since commissioning, average influent
concentrations were found to be 400 and 385 mg/L of BOD5 and TSS, respectively. BOD5
values range from 100-1,000 mg/L with a few outliers above 1,000 mg/L. TSS concentrations
range between 50 and 1,000 mg/L. Using average BOD and TSS values, an influent load is
calculated to be 38 kg BOD5/day and 36 kg TSS/day. BOD5 influent loading translates to 36.8
kg BOD5/hect-day and 33.1 lbs BOD5/acre-day. Typical influent design loading
recommendations for coastal California climate are slightly greater at 40 lbs BOD5/acre-day, but
21
aeration makes this a flexible criterion. Increased population in the Woodlands community will
increase the load to the ponds.
3.7 Maintenance
Maintaining the pond system is limited to debris removal and mechanical maintenance on
aerators and pumps. Inspection of the pond system at the Woodlands plant is carried out by the
operators daily.
1. Water levels are managed by observation. Treatment plant operators manually engage
the microfilter to decrease the level of treatment Pond C. The microfilter pulls water from
Pond C for filtration, lowering the water level of the pond system. Pond A and B water
levels are regulated automatically with overflow weirs and a recirculation pump, and are
consistently the same volume.
2. Debris is removed from the ponds each day, if present.
3. Weekly water quality monitoring is conducted as follows:
A. Influent and post chlorination effluent BOD/TSS sampling
B. Chlorine level readings with adjustment, if necessary, to achieve target residual
C. pH reading of effluent
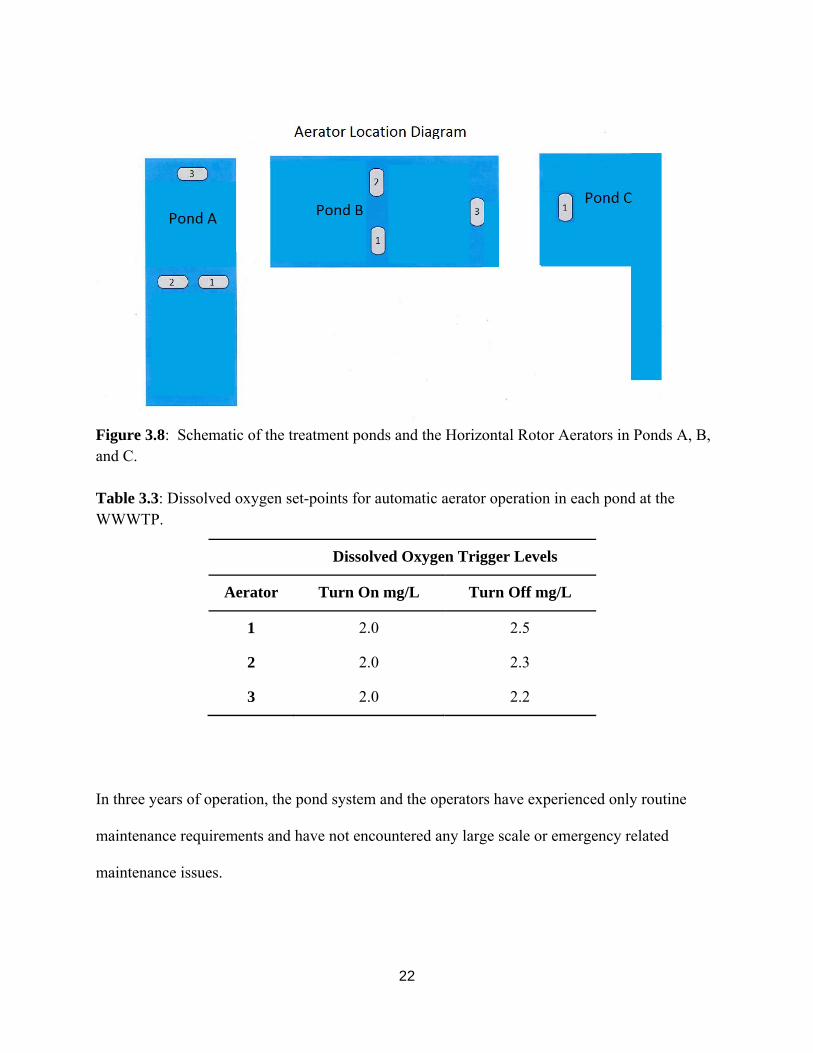
Dissolved oxygen levels are maintained automatically. DO probes are positioned throughout the
pond system (Figure 3.8) and trigger aerator operation when levels drop below 2 mg/L DO
(Table 3.3).
22
Figure 3.8: Schematic of the treatment ponds and the Horizontal Rotor Aerators in Ponds A, B, and C. Table 3.3: Dissolved oxygen set-points for automatic aerator operation in each pond at the WWWTP.
Dissolved Oxygen Trigger Levels
Aerator Turn On mg/L Turn Off mg/L
1 2.0 2.5
2 2.0 2.3
3 2.0 2.2
In three years of operation, the pond system and the operators have experienced only routine
maintenance requirements and have not encountered any large scale or emergency related
maintenance issues.
23
3.8 Regional Water Quality Control Board Regulations
The Central Coast Regional Water Quality Control Board (RWQCB) is the main regulatory
agency for the WWWTP, including regulation of wastewater reuse for irrigation of the Monarch
Dunes golf course. The RWQCB waste discharge requirements are outlined in Table 3.4, which
is copied from the WWWTP permit from the RWQCB. Nutrients discharged by this plant are
not regulated by the RWQCB, probably because most nutrients are assumed to be taken up by
the golf course and prevented from reaching the water table and groundwater supply.
Table 3.4: The effluent water quality requirements of the Woodlands treatment facility set by the RWQCB.
24
CHAPTER 4: MICROFILTER CHARACTERISTICS
4.1 Microfilter System
The WWWTP uses microfiltration to remove solids and pathogens from the waste stream.
Solids include remaining particulate organic matter not eliminated by the ponds and suspended
microalgae. The microfilter is a Pall Aria AP-4, which is a hollow fiber tube microfiltration
system. The product cut sheet and specifications of this filter can be found in the appendix and
are summarized here.
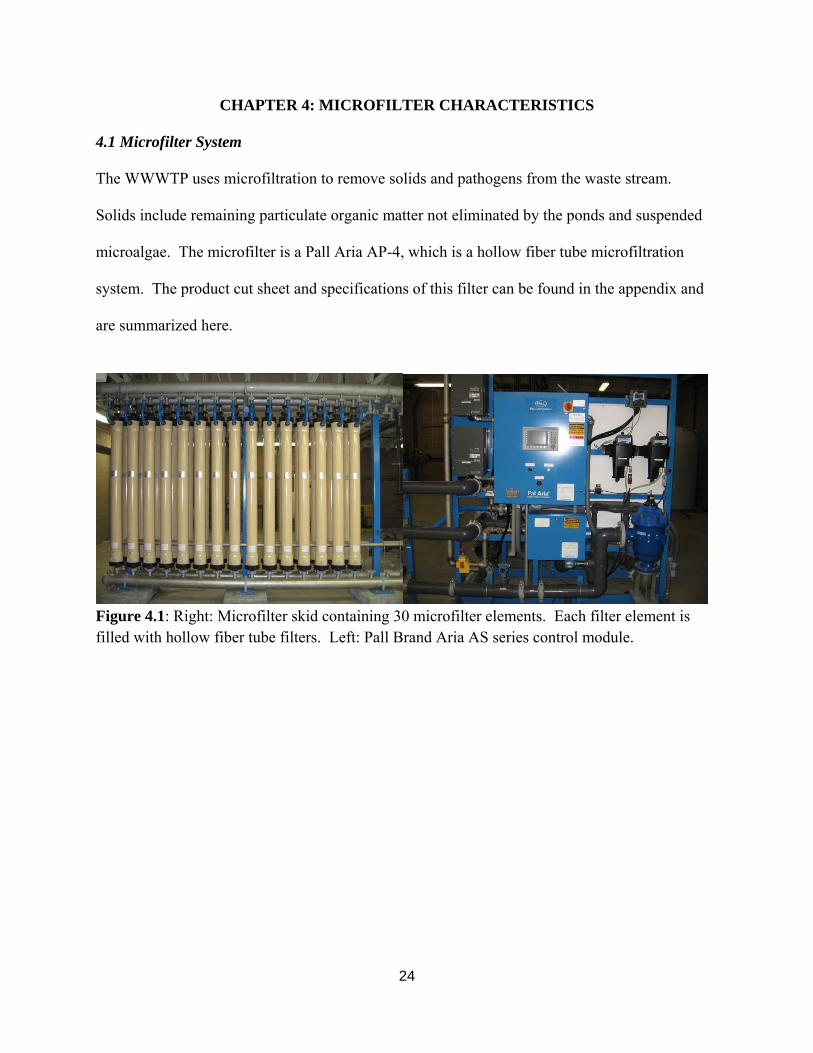
Figure 4.1: Right: Microfilter skid containing 30 microfilter elements. Each filter element is filled with hollow fiber tube filters. Left: Pall Brand Aria AS series control module.
25
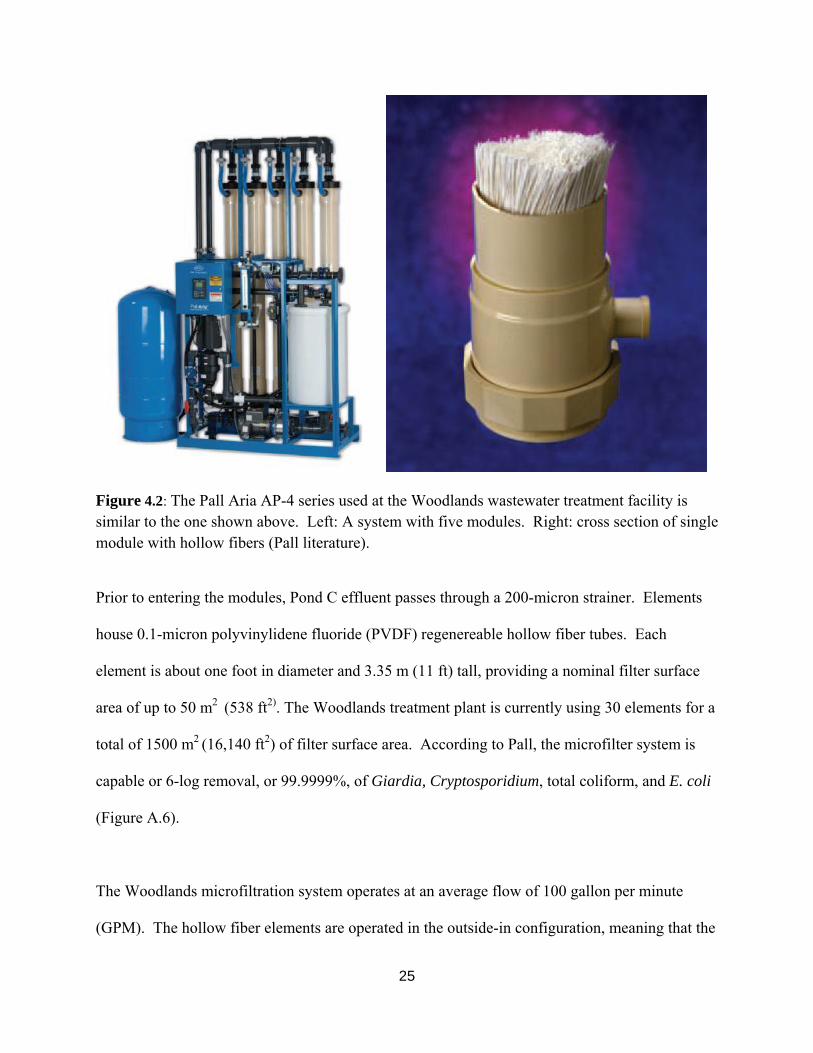
Figure 4.2: The Pall Aria AP-4 series used at the Woodlands wastewater treatment facility is similar to the one shown above. Left: A system with five modules. Right: cross section of single module with hollow fibers (Pall literature).
Prior to entering the modules, Pond C effluent passes through a 200-micron strainer. Elements
house 0.1-micron polyvinylidene fluoride (PVDF) regenereable hollow fiber tubes. Each
element is about one foot in diameter and 3.35 m (11 ft) tall, providing a nominal filter surface
area of up to 50 m2 (538 ft2). The Woodlands treatment plant is currently using 30 elements for a
total of 1500 m2 (16,140 ft2) of filter surface area. According to Pall, the microfilter system is
capable or 6-log removal, or 99.9999%, of Giardia, Cryptosporidium, total coliform, and E. coli
(Figure A.6).
The Woodlands microfiltration system operates at an average flow of 100 gallon per minute
(GPM). The hollow fiber elements are operated in the outside-in configuration, meaning that the
26
water flows into the spaces surrounding the hollow tubes and is forced in through the
membranous walls of the tube, filtering out anything larger than 0.1 μm in size (Figure A.6).
4.2 Expansion Plans
When the Woodlands housing community expands and the load to the treatment plant increases,
the microfiltration system may have to be expanded to maintain a sustainable flux. The building
housing the current system is capable of housing extra microfiltration units needed for build-out
of the Woodlands community. The retrofit would be accomplished by adding more
microfiltration systems to the current plant. Adding modules to the current system will require
more flow and pressure head than the current system is capable of providing, so additional
modules will be installed when the need for larger filtering capacity is required.
4.3 Microfilter Maintenance
Microfilter maintenance is performed regularly and consists of periodic backwashes and
chemical cleanings. Backwashes are induced by the computer system every 20 minutes or every
7,000 gallons of filtrate produced. The backwash procedure is summarized below.
1. Air Scrub: Air is pumped into the modules at a rate of 240 GPM for 60 seconds to
scour the sides of the module of cake build-up.
2. Reverse Flux: Filtrate is pumped from the effluent tank back through the filter for 5
minutes, pushing out any particles caught in the pores of the microfilter.
3. Flush: Water is cycled into the filter for 30 seconds and discharged. This step is
conducted under pressure too low for the feed water to enter the pores. The purpose
27
of the flush is to clear away any air bubbles or particles still present in the module
after the air scrub and simultaneous reverse flux.
Chemical cleanings are performed manually and as needed. Standard operation is that chemical
cleanings be performed every three to six months depending on the amount of microfilter
operation. Since commencement, chemical cleanings have been performed only on an as-needed
basis when algae growth is high during the summer months. Three chemical cleanings per year
have been typical for the WWWTP. Chemical cleaning operations are summarized below and in
Table 4.1.
1. The Pall Aria AP system empties the hollow fiber modules of the feed stream.
2. A caustic soda and chlorine mixture is cycled through the microfilter modules for 60
min.
a. Modules are rinsed with filtrate for 5 min to wash away caustic soda and
chlorine from modules.
3. Acidic solution (citric acid) is cycled through the microfilter modules for 60 min.
a. Final rinse with filtrate is conducted for 5 minutes to wash away citric acid
from modules.
Table 4.1: Caustic and acidic additions to rinse water during chemical cleaning.
Caustic Soda Chlorine Citric Acid Water Final Rinse
Gallons Added 7.6 1.2 15 475
Concentration 1.6% 0.025% 3.1%
Time Cycled (min) 60 60 60 5

28
During normal operating conditions, pressure is measured on either side of the filter to track the
pressure required to push the water through the membrane. The microfilter operates at a pressure
difference of 2.5 - 3 psi for the majority of the year.
29
CHAPTER 5: METHODS
5.1 Sampling
Wastewater samples were collected at the WWWTP for analysis, approximately once per week
from September 2, 2011 to March 7, 2012. Samples were taken at the following locations.
1. Headworks (after screening)
2. Pond A effluent weir splitter box
3. Pond B effluent weir splitter box
4. Pond C effluent holding tank (storage before micro-filtration)
5. Microfilter effluent from sampling spigot
6. Microfilter backwash
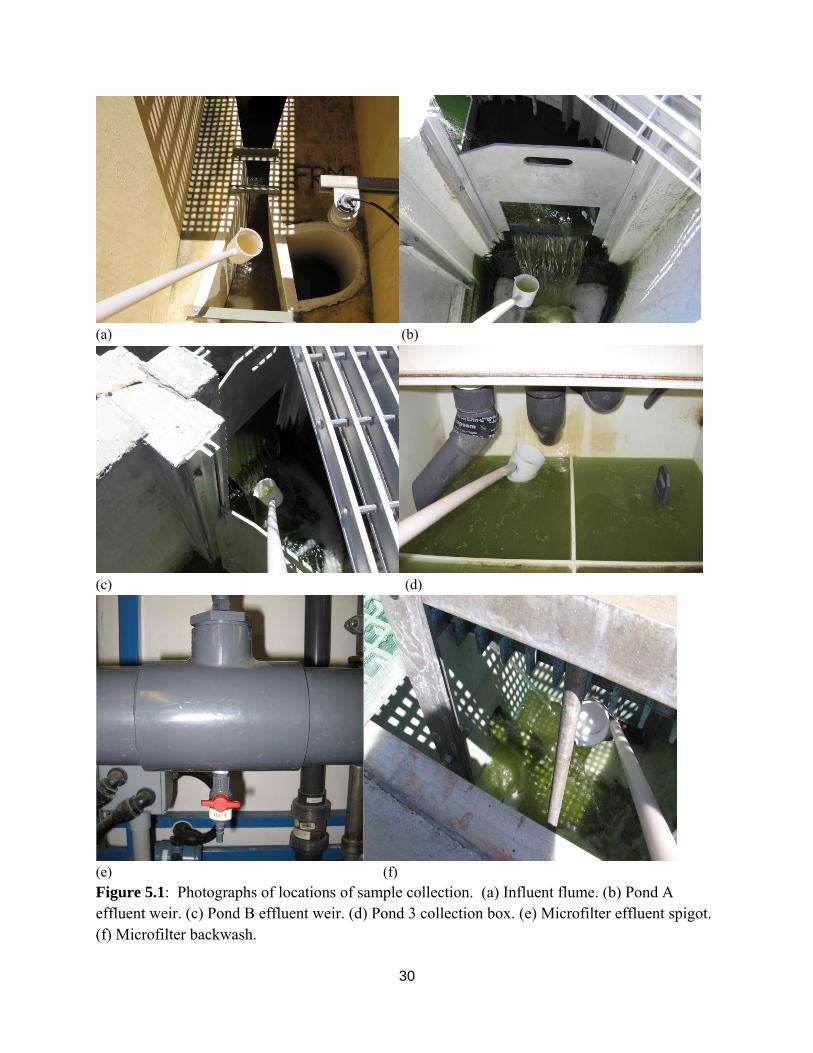
Samples were taken from water flowing over weirs to be representative of the bulk pond water,
and free of concentrated debris (scum for example). Samples were collected using a pole
sampler (Figure 5.1).
30
(a) (b)
(c) (d)
(e) (f) Figure 5.1: Photographs of locations of sample collection. (a) Influent flume. (b) Pond A effluent weir. (c) Pond B effluent weir. (d) Pond 3 collection box. (e) Microfilter effluent spigot. (f) Microfilter backwash.
31
Samples were stored in 500-mL HDPE sample bottles. Approximately 1000 mL was collected
from each location, each week for analysis. Samples were transported immediately back to Cal
Poly for analysis. Samples were stored in an ice chest for transportation to reduce any effects
temperature and light may have on the samples, and stored at room temperature in the lab until
the tests were performed. Lab procedures were concluded within 3 hours of collection. The
following lab tests were conducted in accordance with standard methods.
1. 5-day carbonaceous soluble biochemical oxygen demand (csBOD5) a. Standard Methods 2004-2006 (5210) b. Splits and standards were performed
2. Total suspended solids/volatile suspended solids (TSS/VSS) a. Standard Methods 2004-2006 (2540) b. Splits and standards were performed
3. Total alkalinity (ALK) a. Standard Methods 2004-2006 (2320) b. Splits were performed
4. Total ammonia nitrogen (NH3+, NH4
+ or NHx) a. Standard Methods 2004-2006 (4500) b. Matrix spike was performed
Lab tests were conducted by undergraduate students in the Department of Civil and
Environmental Engineering under the supervision of the author, with assistance from Prof.
Lundquist. Data analysis was conducted by the author and reported in this thesis. Data obtained
from the WWWTP for the past three years by the plant operators were used to analyze trends of
pond quality.
32
CHAPTER 6: ANALYSIS OF HISTORICAL DATA
Woodlands Wastewater Treatment Plant was commissioned March 2009. Plant operators submit
monthly reports to comply with RWQCB permit requirements. The water quality limits
prescribed in the RWQCB permit were discussed in Section 3.9 and, in this section, the
performance of the treatment plant will be described.
For the RWQCB reports, routine samples are collected at two points: influent samples are
collected after the grinder and screen (i.e., before discharge into Pond A). Effluent samples are
collected at the chlorine contact chamber exit for reuse on the golf course.
6.1 Biochemical Oxygen Demand
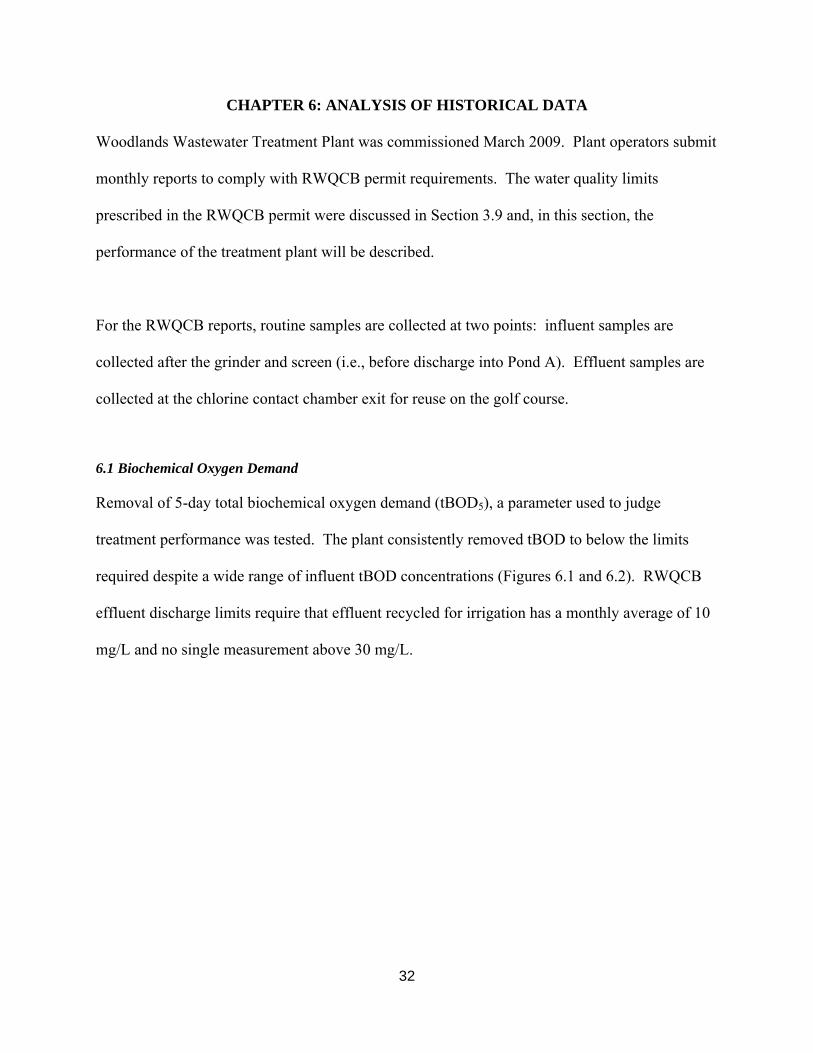
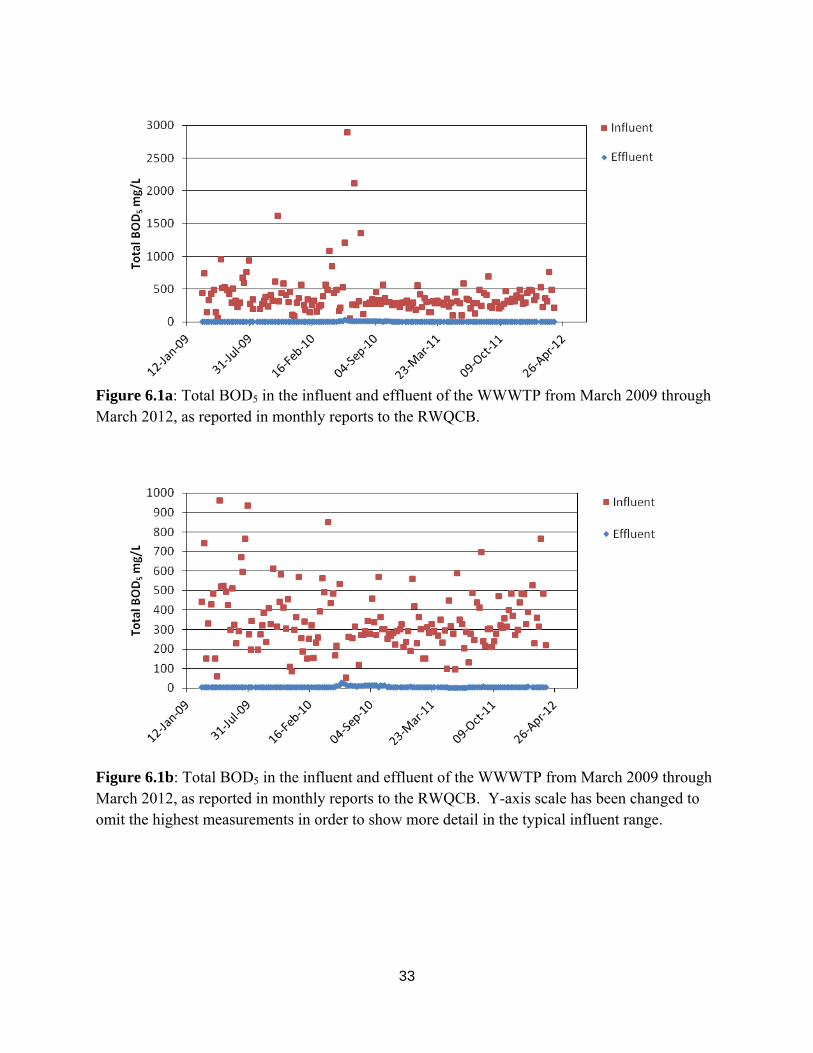
Removal of 5-day total biochemical oxygen demand (tBOD5), a parameter used to judge
treatment performance was tested. The plant consistently removed tBOD to below the limits
required despite a wide range of influent tBOD concentrations (Figures 6.1 and 6.2). RWQCB
effluent discharge limits require that effluent recycled for irrigation has a monthly average of 10
mg/L and no single measurement above 30 mg/L.
33
Figure 6.1a: Total BOD5 in the influent and effluent of the WWWTP from March 2009 through March 2012, as reported in monthly reports to the RWQCB.
Figure 6.1b: Total BOD5 in the influent and effluent of the WWWTP from March 2009 through March 2012, as reported in monthly reports to the RWQCB. Y-axis scale has been changed to omit the highest measurements in order to show more detail in the typical influent range.
34
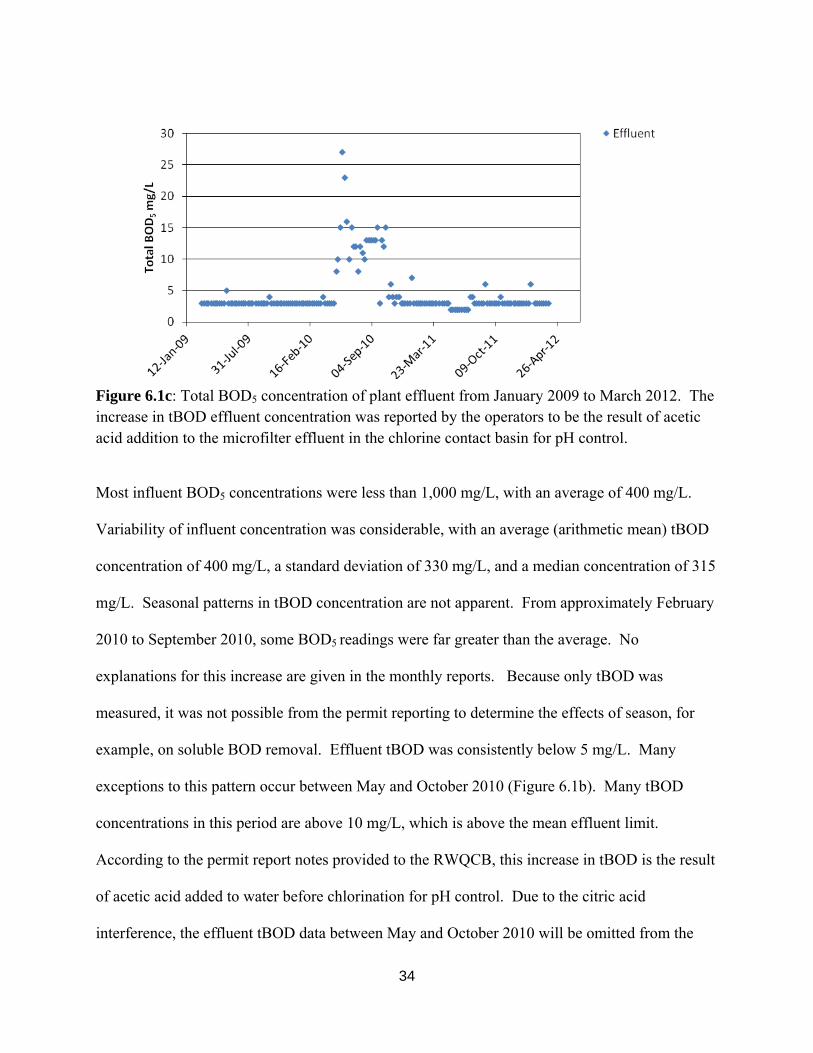
Figure 6.1c: Total BOD5 concentration of plant effluent from January 2009 to March 2012. The increase in tBOD effluent concentration was reported by the operators to be the result of acetic acid addition to the microfilter effluent in the chlorine contact basin for pH control.
Most influent BOD5 concentrations were less than 1,000 mg/L, with an average of 400 mg/L.
Variability of influent concentration was considerable, with an average (arithmetic mean) tBOD
concentration of 400 mg/L, a standard deviation of 330 mg/L, and a median concentration of 315
mg/L. Seasonal patterns in tBOD concentration are not apparent. From approximately February
2010 to September 2010, some BOD5 readings were far greater than the average. No
explanations for this increase are given in the monthly reports. Because only tBOD was
measured, it was not possible from the permit reporting to determine the effects of season, for
example, on soluble BOD removal. Effluent tBOD was consistently below 5 mg/L. Many
exceptions to this pattern occur between May and October 2010 (Figure 6.1b). Many tBOD
concentrations in this period are above 10 mg/L, which is above the mean effluent limit.
According to the permit report notes provided to the RWQCB, this increase in tBOD is the result
of acetic acid added to water before chlorination for pH control. Due to the citric acid
interference, the effluent tBOD data between May and October 2010 will be omitted from the
35
subsequent analysis in this thesis. Excluding the months when citric acid was added, average
effluent tBOD effluent was 3 mg/L with a standard deviation of 0.8 mg/L.
The high performance of the plant can be attributed to the consistent moderate climate, long
pond hydraulic residence times, low influent tBOD loading, and microfiltration.
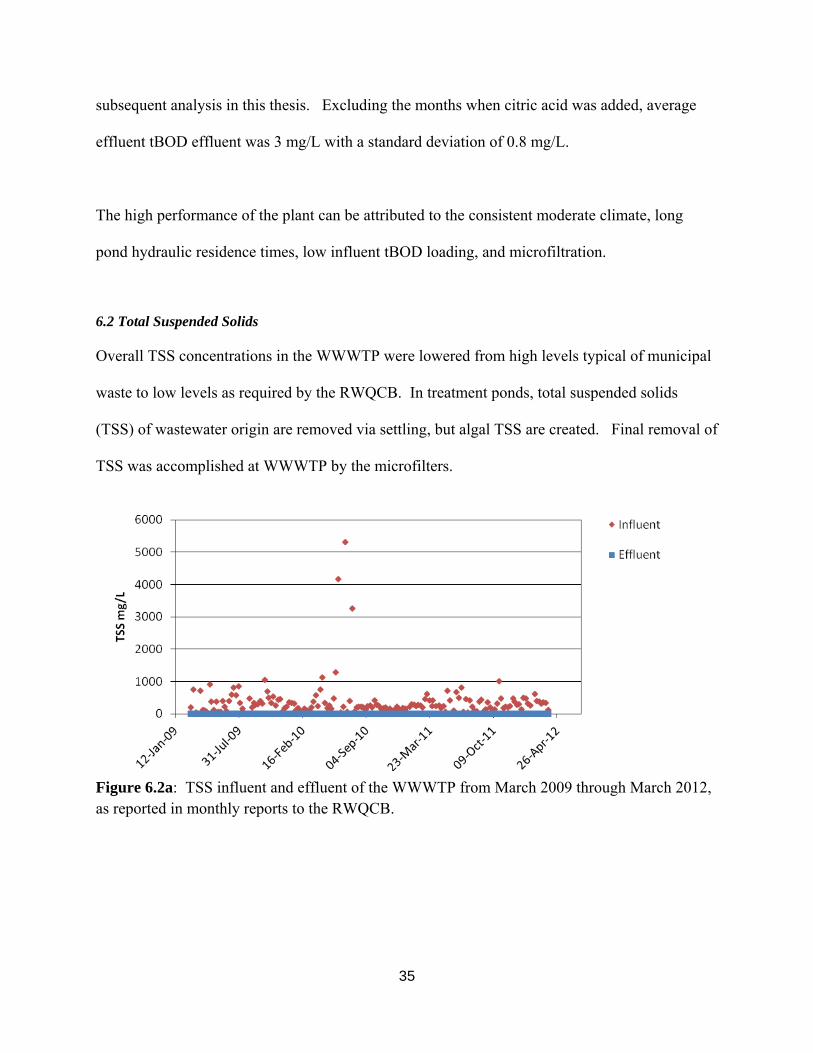
6.2 Total Suspended Solids
Overall TSS concentrations in the WWWTP were lowered from high levels typical of municipal
waste to low levels as required by the RWQCB. In treatment ponds, total suspended solids
(TSS) of wastewater origin are removed via settling, but algal TSS are created. Final removal of
TSS was accomplished at WWWTP by the microfilters.
Figure 6.2a: TSS influent and effluent of the WWWTP from March 2009 through March 2012, as reported in monthly reports to the RWQCB.
36
Figure 6.2b: TSS influent and effluent of the WWWTP from March 2009 through March 2012, as reported in monthly reports to the RWQCB.
Figure 6.2c: TSS effluent of the WWWTP from March 2009 through March 2012, as reported in monthly reports to the RWQCB.
The periods of elevated TSS and tBOD concentrations in the effluent generally coincide (Figure
6.2c). The influent concentration spikes had no apparent effect on effluent quality. Like
influent tBOD concentrations, TSS concentrations do not follow any seasonal patterns. The
majority of influent concentrations fall between 50 and 500 mg/L. The mean TSS influent
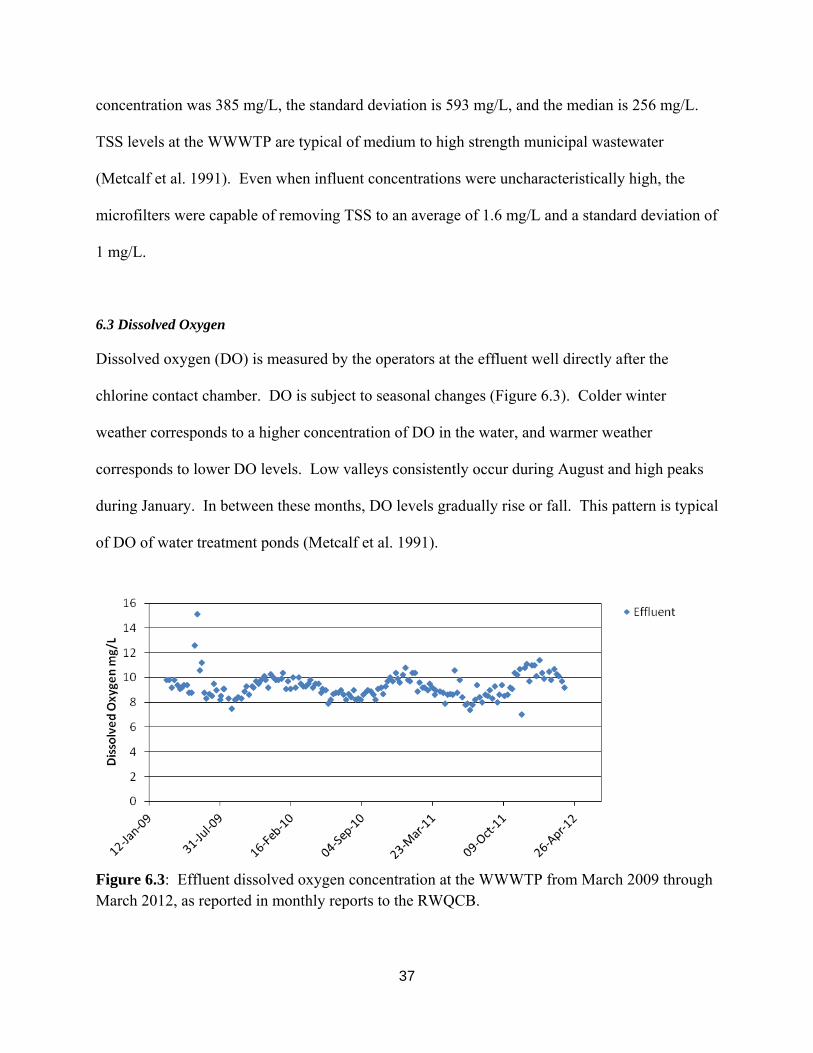
37
concentration was 385 mg/L, the standard deviation is 593 mg/L, and the median is 256 mg/L.
TSS levels at the WWWTP are typical of medium to high strength municipal wastewater
(Metcalf et al. 1991). Even when influent concentrations were uncharacteristically high, the
microfilters were capable of removing TSS to an average of 1.6 mg/L and a standard deviation of
1 mg/L.
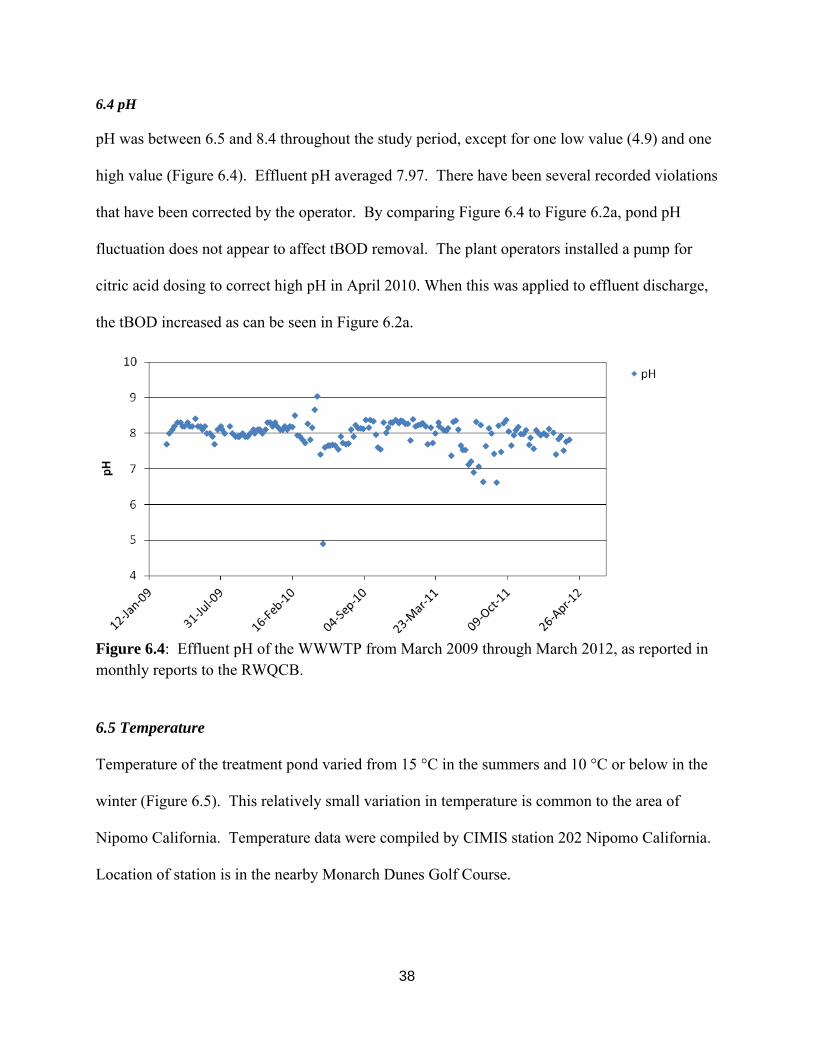
6.3 Dissolved Oxygen
Dissolved oxygen (DO) is measured by the operators at the effluent well directly after the
chlorine contact chamber. DO is subject to seasonal changes (Figure 6.3). Colder winter
weather corresponds to a higher concentration of DO in the water, and warmer weather
corresponds to lower DO levels. Low valleys consistently occur during August and high peaks
during January. In between these months, DO levels gradually rise or fall. This pattern is typical
of DO of water treatment ponds (Metcalf et al. 1991).
Figure 6.3: Effluent dissolved oxygen concentration at the WWWTP from March 2009 through March 2012, as reported in monthly reports to the RWQCB.
38
6.4 pH
pH was between 6.5 and 8.4 throughout the study period, except for one low value (4.9) and one
high value (Figure 6.4). Effluent pH averaged 7.97. There have been several recorded violations
that have been corrected by the operator. By comparing Figure 6.4 to Figure 6.2a, pond pH
fluctuation does not appear to affect tBOD removal. The plant operators installed a pump for
citric acid dosing to correct high pH in April 2010. When this was applied to effluent discharge,
the tBOD increased as can be seen in Figure 6.2a.
Figure 6.4: Effluent pH of the WWWTP from March 2009 through March 2012, as reported in monthly reports to the RWQCB.
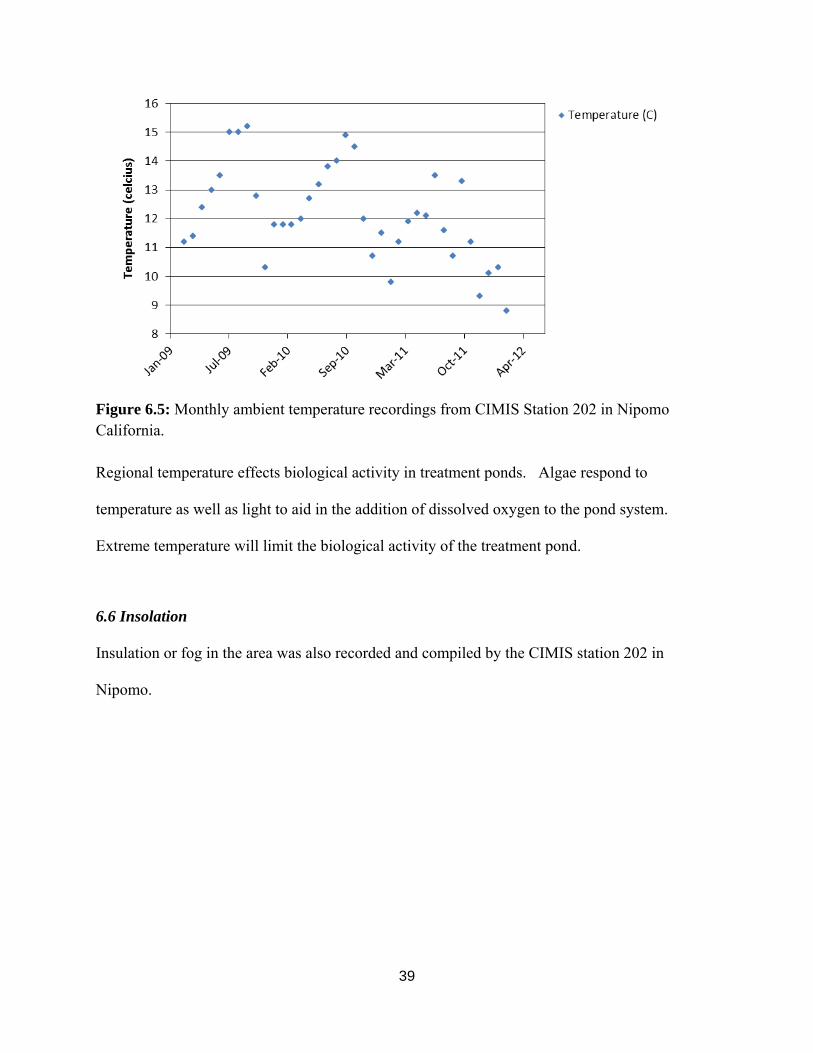
6.5 Temperature
Temperature of the treatment pond varied from 15 °C in the summers and 10 °C or below in the
winter (Figure 6.5). This relatively small variation in temperature is common to the area of
Nipomo California. Temperature data were compiled by CIMIS station 202 Nipomo California.
Location of station is in the nearby Monarch Dunes Golf Course.
39
Figure 6.5: Monthly ambient temperature recordings from CIMIS Station 202 in Nipomo California. Regional temperature effects biological activity in treatment ponds. Algae respond to
temperature as well as light to aid in the addition of dissolved oxygen to the pond system.
Extreme temperature will limit the biological activity of the treatment pond.
6.6 Insolation
Insulation or fog in the area was also recorded and compiled by the CIMIS station 202 in
Nipomo.
40
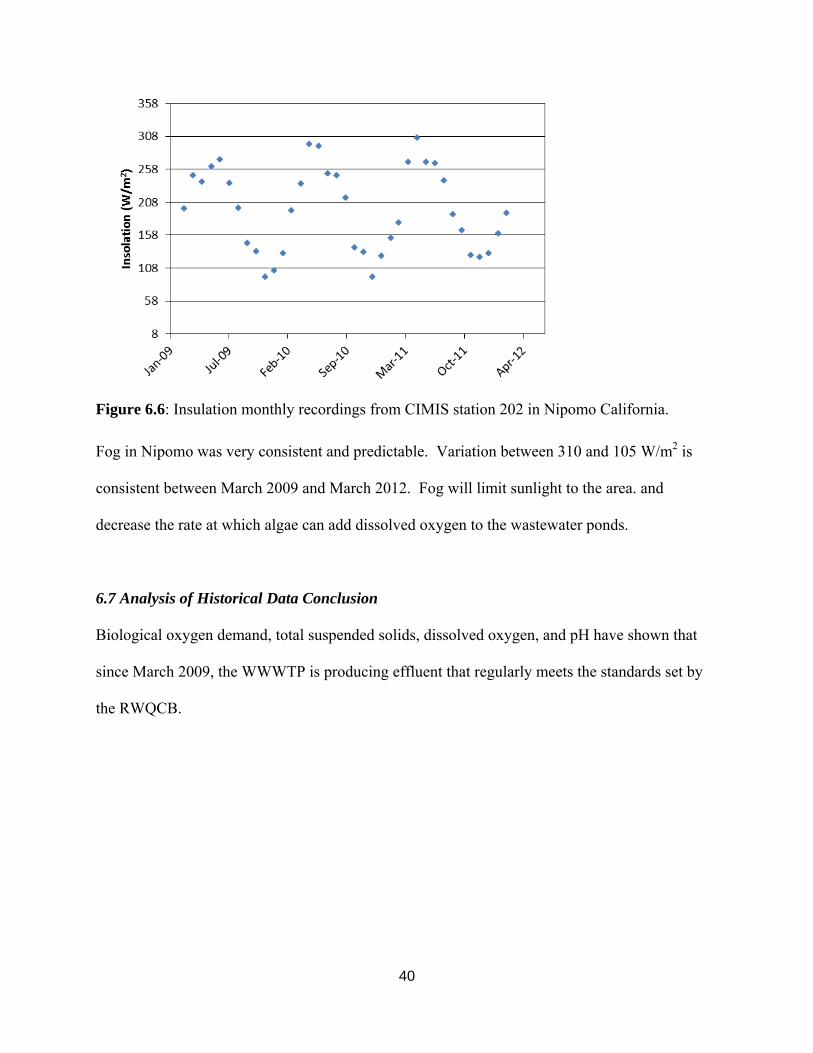
Figure 6.6: Insulation monthly recordings from CIMIS station 202 in Nipomo California. Fog in Nipomo was very consistent and predictable. Variation between 310 and 105 W/m2 is
consistent between March 2009 and March 2012. Fog will limit sunlight to the area. and
decrease the rate at which algae can add dissolved oxygen to the wastewater ponds.
6.7 Analysis of Historical Data Conclusion
Biological oxygen demand, total suspended solids, dissolved oxygen, and pH have shown that
since March 2009, the WWWTP is producing effluent that regularly meets the standards set by
the RWQCB.

41
Table 6.1: Summary of effluent characteristics of the WWWTP (tBOD5, TSS, DO and pH from March 2009 to March 2012 and comparison to regulations set by the RWQCB.
Constituent Regulatory Limit (monthly average)
Average (March 2009-March-2011)
Standard Deviation
tBOD5 10 mg/L 3.0 0.8
TSS 10 mg/L 1.6 1.0
DO NA 9.3 1.0
pH 6.5 – 8.4 7.97 0.42
42
CHAPTER 7: WATER QUALITY ANALYSIS: A CLOSER LOOK
In addition to data collected by the wastewater treatment plant operators, samples were collected
on approximately 20 dates between September 2011 and April 2012 and analyzed at Cal Poly.
The samples were collected weekly as described in the methods section. In summary, samples
were collected at the following locations: inlet of the plant, after each pond, after the microfilter,
and at the microfilter backwash outlet to Pond A. Samples were tested for 5-day total
carbonaceous soluble BOD, TSS/VSS, total ammonia nitrogen, and alkalinity. Cal Poly
laboratory quality control requirements were met for only 20 weeks of 30 weeks of sampling.
This section covers the performance of each pond and the microfilter with regards to the
acceptable water quality measures.
7.1 Biological Oxygen Demand
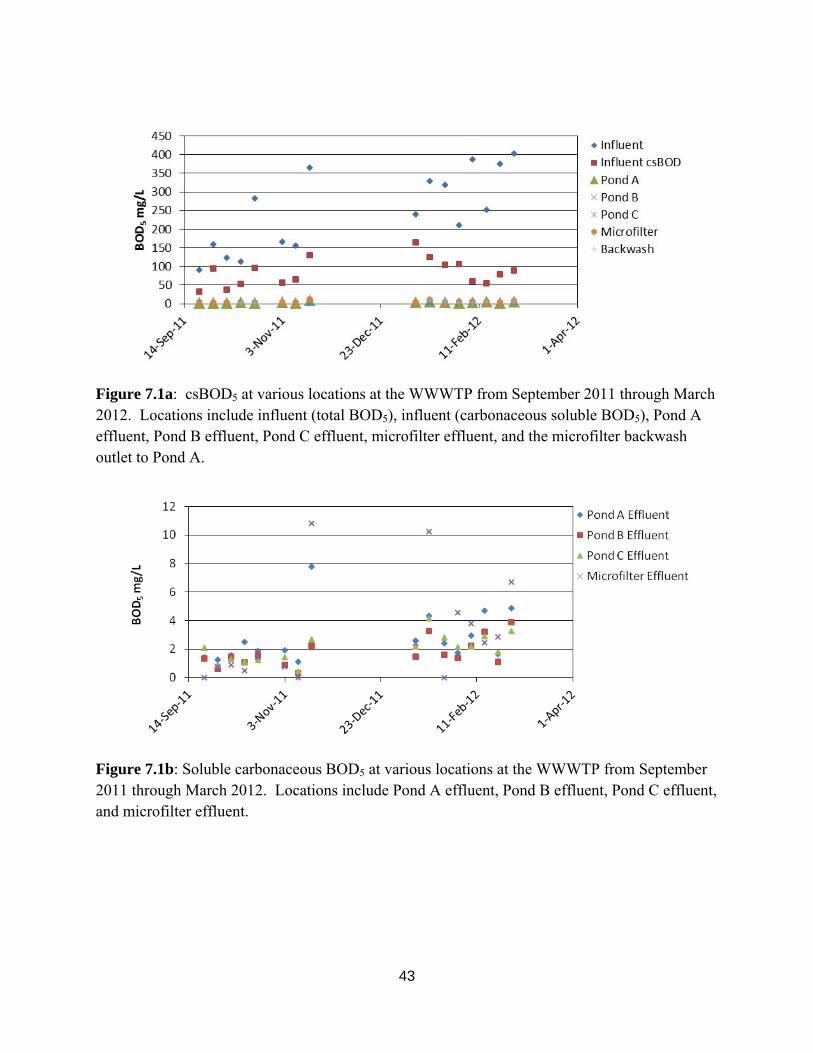
Figure 7.1a shows clearly that even after the first pond, csBOD5 concentration decreases
dramatically to below the regulated limits. Since effluent values cannot be easily discerned from
the graph, listed here is the final effluents values for Pond A, B, C, and the microfilter,
chronologically from September 2011 to March 2012.
43
Figure 7.1a: csBOD5 at various locations at the WWWTP from September 2011 through March 2012. Locations include influent (total BOD5), influent (carbonaceous soluble BOD5), Pond A effluent, Pond B effluent, Pond C effluent, microfilter effluent, and the microfilter backwash outlet to Pond A.
Figure 7.1b: Soluble carbonaceous BOD5 at various locations at the WWWTP from September 2011 through March 2012. Locations include Pond A effluent, Pond B effluent, Pond C effluent, and microfilter effluent.

44
Table 7.1: Data of csBOD5 for Pond A, B, C, and the microfilter from September 2011 to March 2012.
Pond A Pond B Pond C Microfilter
1.4 1.34 2.10 Non-detect
1.125 Non-detect Non-detect Non-detect
1.56 1.45 1.28 Non-detect
2.5 1.08 1.13 Non-detect
1.87 1.56 1.25 Non-detect
1.91 Non-detect 1.42 1.41
1.11 Non-detect Non-detect Non-detect
7.76 2.21 2.67 Non-detect
2.6 1.48 2.2 10.83
4.32 3.26 4.41 2.41
2.43 1.62 2.82 Non-detect
1.73 1.39 2.15 4.54
2.95 2.24 2.19 3.81
4.67 3.21 2.88 2.44
1.67 1.12 1.8 2.87
4.86 3.89 3.25 6.71
Average: 2.79 Average: 1.73 Average: 2.04 Average: 3.01
No pattern could be discerned in csBOD5 concentration throughout the treatment system.
Concentrations did not decrease consistently with each treatment unit. Instead csBOD5 shows
similar levels throughout the WWWTP (Figure 7.1b). On multiple occasions the microfilter
45
concentration is higher than concentration in the ponds. The lack of pattern is probably due to
analytical uncertainty caused by the concentrations being near the detection limit of the method.
Also, it may even be argued that with a residence time of 140 days, Pond A is the only pond
necessary for the level of treatment required at current flow.
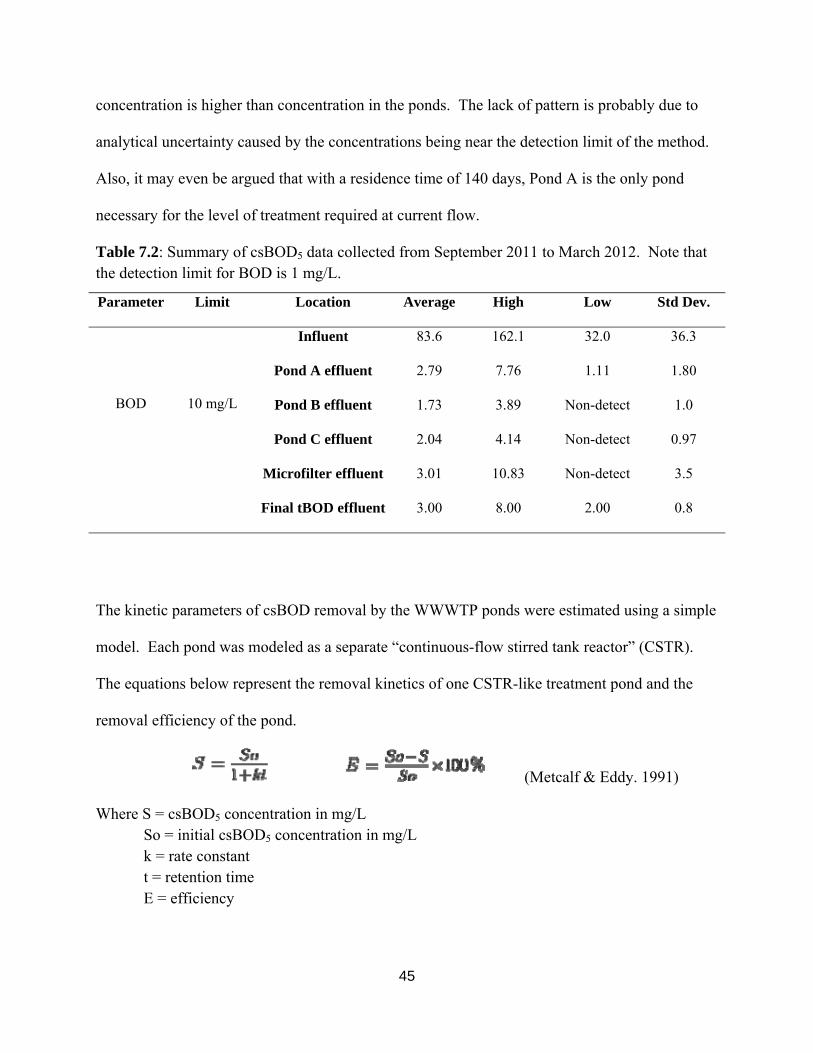
Table 7.2: Summary of csBOD5 data collected from September 2011 to March 2012. Note that the detection limit for BOD is 1 mg/L.
Parameter Limit Location Average High Low Std Dev.
BOD
10 mg/L
Influent 83.6 162.1 32.0 36.3
Pond A effluent 2.79 7.76 1.11 1.80
Pond B effluent 1.73 3.89 Non-detect 1.0
Pond C effluent 2.04 4.14 Non-detect 0.97
Microfilter effluent 3.01 10.83 Non-detect 3.5
Final tBOD effluent 3.00 8.00 2.00 0.8
The kinetic parameters of csBOD removal by the WWWTP ponds were estimated using a simple
model. Each pond was modeled as a separate “continuous-flow stirred tank reactor” (CSTR).
The equations below represent the removal kinetics of one CSTR-like treatment pond and the
removal efficiency of the pond.
(Metcalf & Eddy. 1991)
Where S = csBOD5 concentration in mg/L So = initial csBOD5 concentration in mg/L k = rate constant t = retention time E = efficiency
46
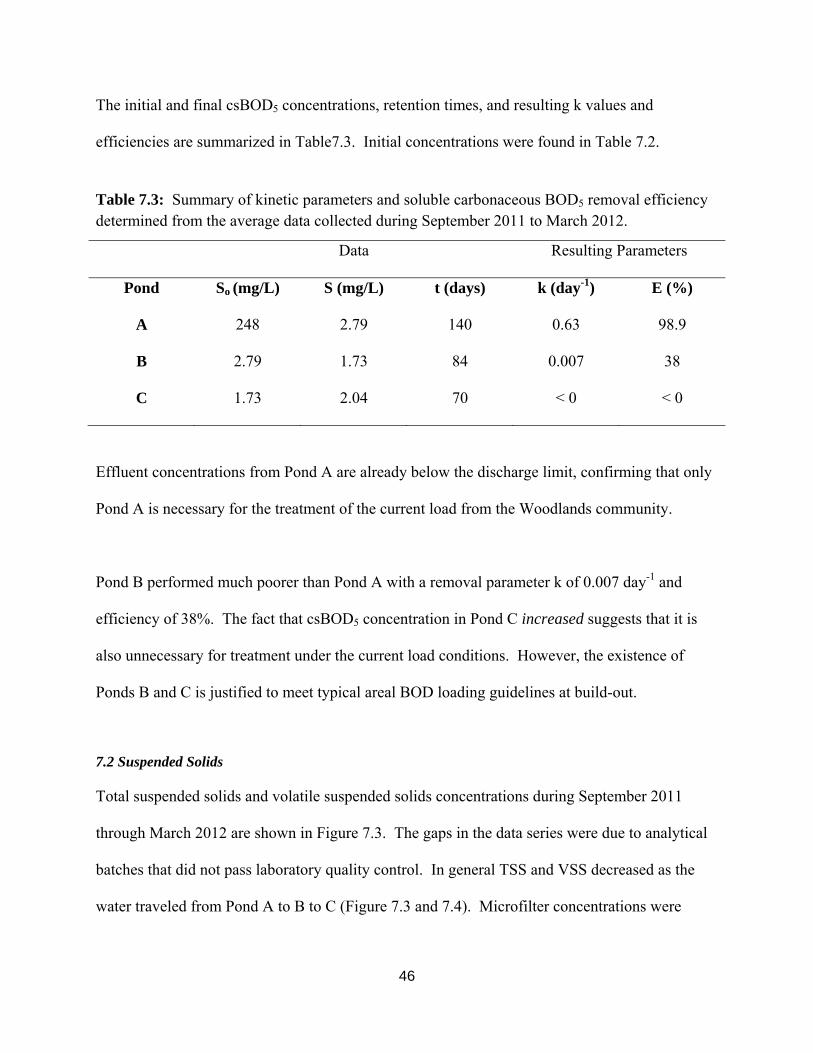
The initial and final csBOD5 concentrations, retention times, and resulting k values and
efficiencies are summarized in Table7.3. Initial concentrations were found in Table 7.2.
Table 7.3: Summary of kinetic parameters and soluble carbonaceous BOD5 removal efficiency determined from the average data collected during September 2011 to March 2012.
Data Resulting Parameters
Pond So (mg/L) S (mg/L) t (days) k (day-1) E (%)
A 248 2.79 140 0.63 98.9
B 2.79 1.73 84 0.007 38
C 1.73 2.04 70 < 0 < 0
Effluent concentrations from Pond A are already below the discharge limit, confirming that only
Pond A is necessary for the treatment of the current load from the Woodlands community.
Pond B performed much poorer than Pond A with a removal parameter k of 0.007 day-1 and
efficiency of 38%. The fact that csBOD5 concentration in Pond C increased suggests that it is
also unnecessary for treatment under the current load conditions. However, the existence of
Ponds B and C is justified to meet typical areal BOD loading guidelines at build-out.
7.2 Suspended Solids
Total suspended solids and volatile suspended solids concentrations during September 2011
through March 2012 are shown in Figure 7.3. The gaps in the data series were due to analytical
batches that did not pass laboratory quality control. In general TSS and VSS decreased as the
water traveled from Pond A to B to C (Figure 7.3 and 7.4). Microfilter concentrations were
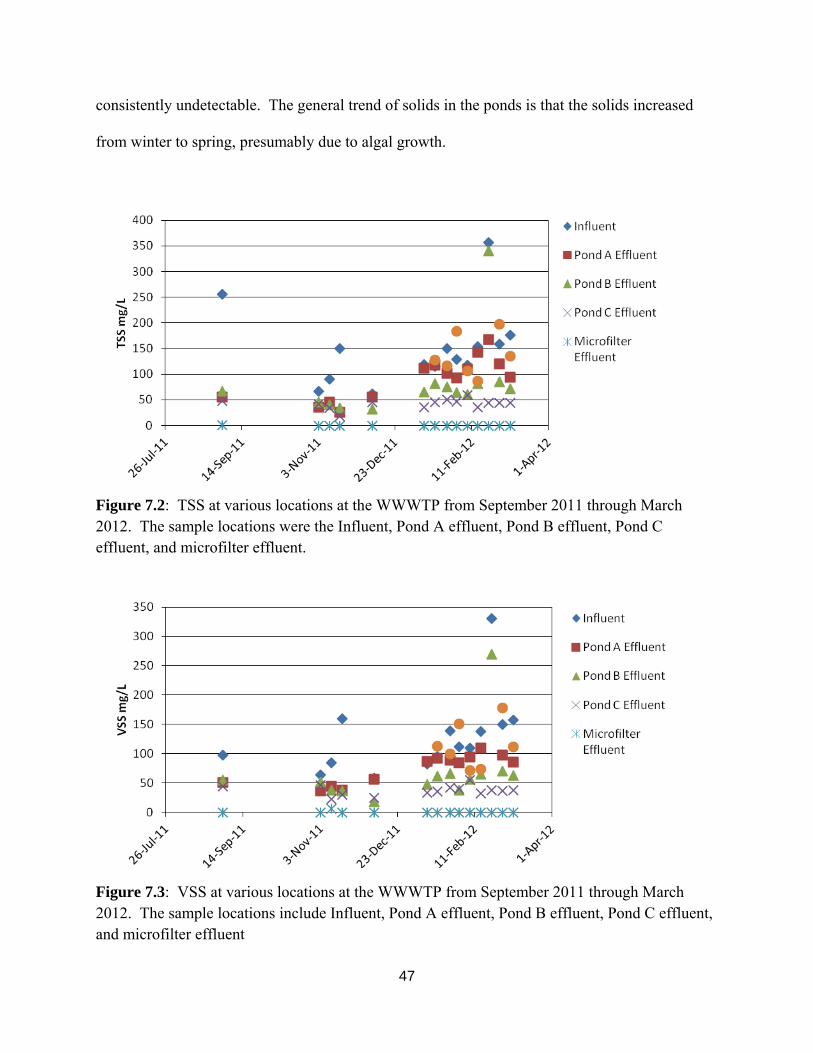
47
consistently undetectable. The general trend of solids in the ponds is that the solids increased
from winter to spring, presumably due to algal growth.
Figure 7.2: TSS at various locations at the WWWTP from September 2011 through March 2012. The sample locations were the Influent, Pond A effluent, Pond B effluent, Pond C effluent, and microfilter effluent.
Figure 7.3: VSS at various locations at the WWWTP from September 2011 through March 2012. The sample locations include Influent, Pond A effluent, Pond B effluent, Pond C effluent, and microfilter effluent
48
Table 7.4: Summary of TSS data collected from September 2011 to March 2012.
Parameter Limit Location Average High Low Std Dev.
TSS
10 mg/L
Influent 150.1 357 62 76.8
Pond A effluent 91.2 168 26 41.9
Pond B effluent 81.5 340 32 76.4
Pond C effluent 42.4 59 18 9.6
Microfilter effluent
.02 .31 0 0.08
Final effluent 1.57 6 1 0.095
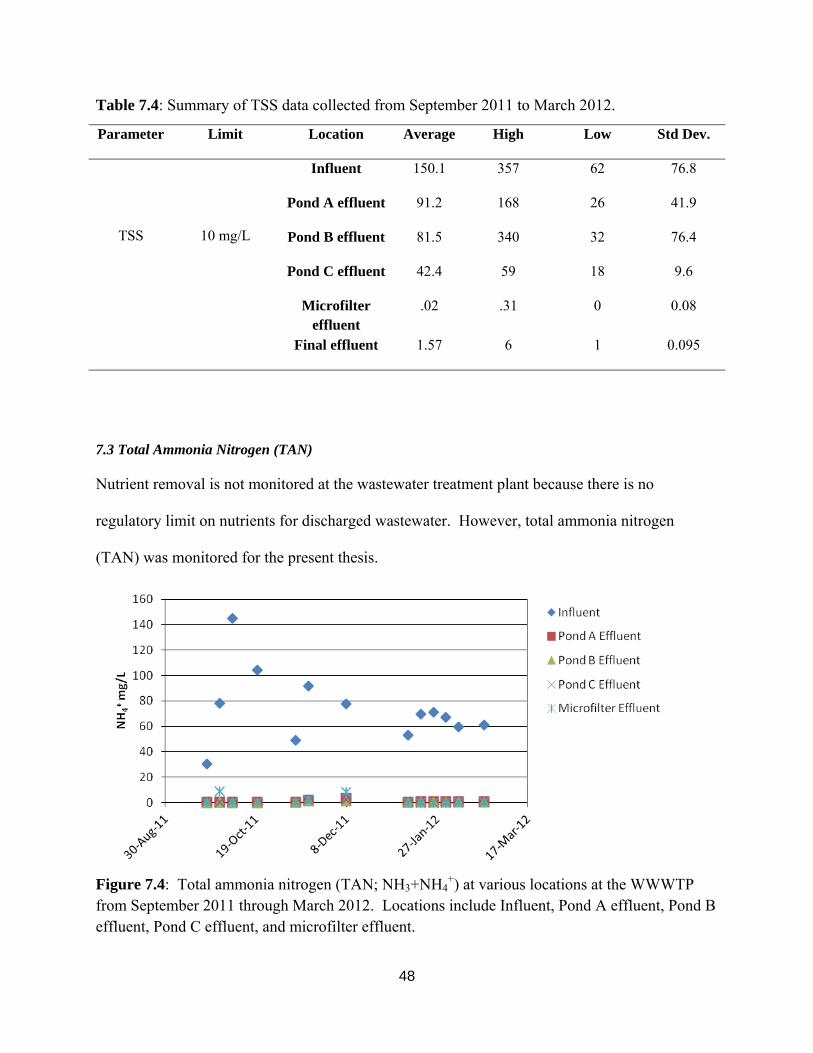
7.3 Total Ammonia Nitrogen (TAN)
Nutrient removal is not monitored at the wastewater treatment plant because there is no
regulatory limit on nutrients for discharged wastewater. However, total ammonia nitrogen
(TAN) was monitored for the present thesis.
Figure 7.4: Total ammonia nitrogen (TAN; NH3+NH4
+) at various locations at the WWWTP from September 2011 through March 2012. Locations include Influent, Pond A effluent, Pond B effluent, Pond C effluent, and microfilter effluent.
49
The ponds at WWWTP decrease the average TAN concentrations from an average of 68.5 mg/L
to less than 1 mg/L. The possible routes of TAN removal include ammonia volatilization,
ammonia assimilation in microbial biomass especially in algae, and nitrification.
Table 7.5: Summary of TAN data collected from September 2011 to March 2012.
Parameter Limit Location Average High Low Std Dev.
TAN
N/A
Influent 73.7 145 30.5 28.5
Pond A effluent 0.80 3.44 0.05 1.0
Pond B effluent 0.3 1.43 0.01 0.5
Pond C effluent 0.43 2.24 0.04 0.74
Microfilter effluent 1.61 9.07 0.03 3.2
Final effluent n/a n/a n/a n/a
7.4 Alkalinity
Influent alkalinity appeared to follow a seasonal pattern and is reduced in the pond system.
Alkalinity was reduced in Pond A and did not change substantially in the locations that followed
(Figure 7.6). Once in the pond system, alkalinity does not change from pond to pond, indicating
that BOD treatment or biological activity of the ponds does not affect the alkalinity as time and
progresses. Comparing Figure 7.6 and Figure 6.8 shows that as pH decreases due to seasonal
changes, alkalinity also decreased.
50
Figure 7.5: Alkalinity as mg/L CaCO3 at various locations at the WWWTP from September 2011 through March 2012. Locations include Influent, Pond A effluent, Pond B effluent, Pond C effluent, and microfilter effluent. Table 7.6: Summary of ALK data collected from September 2011 to March 2012.
Parameter Limit Location Average High Low Std Dev.
ALK
N/A
Influent 345.9 480 137 102.4
Pond A effluent 104.1 175 70 29.2
Pond B effluent 116.2 250 73 41.3
Pond C effluent 145.2 312.5 93 50.6
Microfilter effluent 123.5 175 93 27.0
Final effluent n/a n/a n/a n/a
7.5 Sludge Production
Non-biodegradable settleable solids accumulate in treatment ponds. However, the sludge
production of normally operating domestic wastewater treatment ponds becomes a problem only
after many years of operation (Nelson 2004). The sludge production of the Woodlands
wastewater treatment plant was expected to be minimal because of the low load to the pond
51
system. Sludge buildup at the Woodlands ponds was measured by taking sludge depth
measurements in 22 locations in the three ponds. The measurements were made by FRM staff. A
diagram of these locations and their corresponding sludge depth buildup is shown in Figure 7.6.
Figure 7.6: Diagram of sludge depth in feet at 22 locations in the pond system at the Woodlands Wastewater Treatment Plant. The circles represent locations of rotor aerators. Diagram supplied by FRM.
Sludge buildup in the pond system averaged about one foot overall. Influent wastewater enters
Pond A at the lower left hand corner of the image in Figure 7.6 and flows upward. More sludge
was observed at this point near the influent, as expected because a digester zone was been
constructed by installing a vinyl sheet piling curtain that separates approximately the first third of
Pond A from the rest. This barrier limits the turbulence to the area occupied by the aerators,
minimizing re-suspension and dispersion of settled waste. The digester zone contains
approximately 2.5 feet of solids buildup, indicating that the curtain wall was successful in
trapping sludge in the digester zone. Outside of the digester zone, one foot or less of sludge has

52
accumulated in Pond A. Similarly, Pond B has a digester zone at the inlet of the pond, but
sludge has not accumulated here more than anywhere else in Pond B. Pond B uniformly had
between 0.5 and 1.5 feet of sludge depth. Pond C had even less solids accumulation. Sludge
accumulation rate for the aerobic and anaerobic (digester) portions of the treatment ponds were
found by averaging the sludge depths (Figure 7.6) and dividing by 3 years. Sludge rates were
compared to a range of typical sludge accumulation rates (Nelson 2004).
Table 7.7: Measured sludge accumulation rates compared to typical ranges in the WWWTP system from March 2009 to March 2012.
Pond Sludge Accumulation Rate (in/yr)
Typical Range
Aerobic
A 3.44
0.27 – 3.35 B 3.44
C 2
Anaerobic A 4.66 2.0 – 4.70
B 3.33
Sludge rates in the aerobic regions of ponds A and B are slightly higher than the high end of
typical values, and also at the high end of the typical range for anaerobic ponds (Table 7.6). At
the rate suggested by Table 7.6, and ignoring the need for treatment volume, Ponds A and B
would completely fill in with sludge in 52 years and Pond C in 99 years.
7.6 Algal Species
The pond system relies partly on algae to provide the oxygen used by aerobic heterotrophic
bacteria, which contribute to BOD removal. Variability of algal species in the Woodlands
treatment system was variable. Large populations of the following species were observed in the
53
ponds. These species represent the largest populations of algae within Ponds A, B, and C, as the
variation of species population between ponds is minimal. The main species present in the
Woodlands pond system are listed and pictured below along with micrographs of each.
Pediastrum and Scenedesmus 1000x Ankistodesmus 100x
Cyclotella 1000x Pediastrum 1000x
Cladophora 400x Oscillatoria 1000x Figure 7.7: Tentative identification of algae present in the effluent of Pond C on June 5, 2012.

54
7.7 Microfiltration
Influent solids load on microfilters increases the fouling rate of the membranes. To evaluate
microfilter efficiency and possible fouling this fouling, microfilter effluent samples and Pond C
effluent samples were collected and tested for approximately 20 weeks (Figure 7.8).
The average influent TSS concentration of the microfilters was 42.5 mg/L (Pond C effluent), and
the microfilter effluent concentration was 1.6 mg/L with a standard deviation of 1 mg/L which is
96% removal. These values were found using the value of 1 for those values recorded as <1.
The detection limit reported in the monthly RWQCB reports changed. Before August 2011,
undetectable levels were recorded as < 1 mg/L. After August 2011, undetectable levels are
recorded as <3 mg/L. There is no recorded reason for the difference in recording conventions.
Figure 7.8: TSS influent and effluent of the WWWTP microfilters from September 2011 through March 2012, as recorded in monthly reports to the RWQCB. All data points shown as 1 mg/L were recorded as <1 mg/L in the monthly report.
55
Figure 7.9: TSS effluent of the WWWTP microfilters from March 2009 through March 2012, as reported in monthly reports to the RWQCB. All data points shown as 1 mg/L were reported as <1 mg/L in the monthly reports.
Attempts were made to evaluate fouling based on pressure drops. However, numerical data were
impossible to download from the pressure recording system that monitors microfilter operation.
However, by observation of the recorded pressure readings on the datalogger monitor, it was
seen that normal operating pressure was regularly between 2 and 4 psi. Small fluctuations were
observed within this range. During summertime, operating pressure was elevated but returns to
2.5-3.0 psi after a chemical cleaning. Since chemical cleaning is conducted on an as-needed
basis, it is the responsibility and judgment of the plant operations manager to initiate a chemical
cleaning. Even though backwashes and chemical cleanings are performed regularly, permanent
fouling of the membranes is expected eventually. However, for the three years that the
Woodlands treatment plant has been operating, no permanent increase in headloss has been
observed. Daily load on the microfilters was found to be 80.9 L/m2 of membrane and 3 g
TSS/m2 of membrane each day. Flow to the filter membrane fell in at the high end of typical
values of 30 – 170 L/m2/day, for the microfiltration processes (MWH 2005).

56
CHAPTER 8: ELECTRICITY USE
8.1 Overall Energy Use
The major pieces of electrical equipment on the PG&E meter at the WWWTP were the
following Items: (1) influent grinder and auger, (2) a recirculation pumps, (3) pond aerators, (4)
Pond C lift pump to the microfilter, (5) two chemical dosing pumps, (6) microfilter influent
pressure pump, (7) controls for all mechanical units, and (8) the effluent pump. Total energy
consumption and cost for the entire plant was determined from utility bills (Table 8.1) and used
to assess overall energy efficiency of the WWWTP. Billing data from PG&E shows that the
total energy consumed by the treatment plant was 214,680 kWh during 2011, which cost
$36,998. The annual average inflow, based on the monthly RWQCB reports, was 25,000 gpd or
9.125 MG per year. In 2011, based on the 9.125 MG per year flow, the energy intensity was
23,500 kWh per MG treated, and the cost of electricity for this treatment was $4,100 per MG
($0.173/kWh). These results are discussed and compared to conventional treatment at the end of
this section.
Table 8.1: WWWTP energy consumption and cost during 2011 (Source: PG&E bills).
Month kWh Cost
Jan-11 17,400 $2,555.12
Feb-11 21,960 $3,223.93
Mar-11 16,560 $2,459.76
Apr-11 19,680 $3,013.72
May-11 19,560 $3,875.09
Jun-11 17,280 $3,425.46
Jul-11 13,800 $2,736.68
Aug-11 18,000 $3,566.20

57
Sep-11 17,520 $3,471.93
Oct-11 16,320 $3,235.48
Nov-11 17,760 $2,637.97
Dec-11 18,840 $2,796.65
Total 214,680 $36,997.99
Table 8.2: Total WWWTP energy data summary for 2011.
Energy consumption (kWh/year) 214,680
Cost (dollars/year) 36,998
Flow (MG/Year) 9.125
Energy intensity (kWh/MG) 23,500
Cost (gallons/dollar) 250
8.2 Aeration Energy Use
The treatment ponds are aerated daily to increase the concentration of dissolved oxygen in the
ponds. Figure 3.3 shows the location of the aerators (Item 3) in the pond system. DO meters
positioned throughout the ponds continuously monitor the oxygen levels in the ponds. When the
concentration drops below the values noted (Table 8.3), the aerators turn on. When the dissolved
oxygen has increased in the ponds sufficiently, the aerators turn off. The whole system is
controlled automatically by computers on site at the treatment plant. The pond aerators have a
combined nameplate power rating of 57.5 HP (Table 8.1). Although the aerators may consume
more electricity than any other component at the plant, their operation times are not recorded.
An estimate of aerator energy consumption is calculated by difference in a later section. The
energy use of the other equipment on the list is estimated in the follow sections.
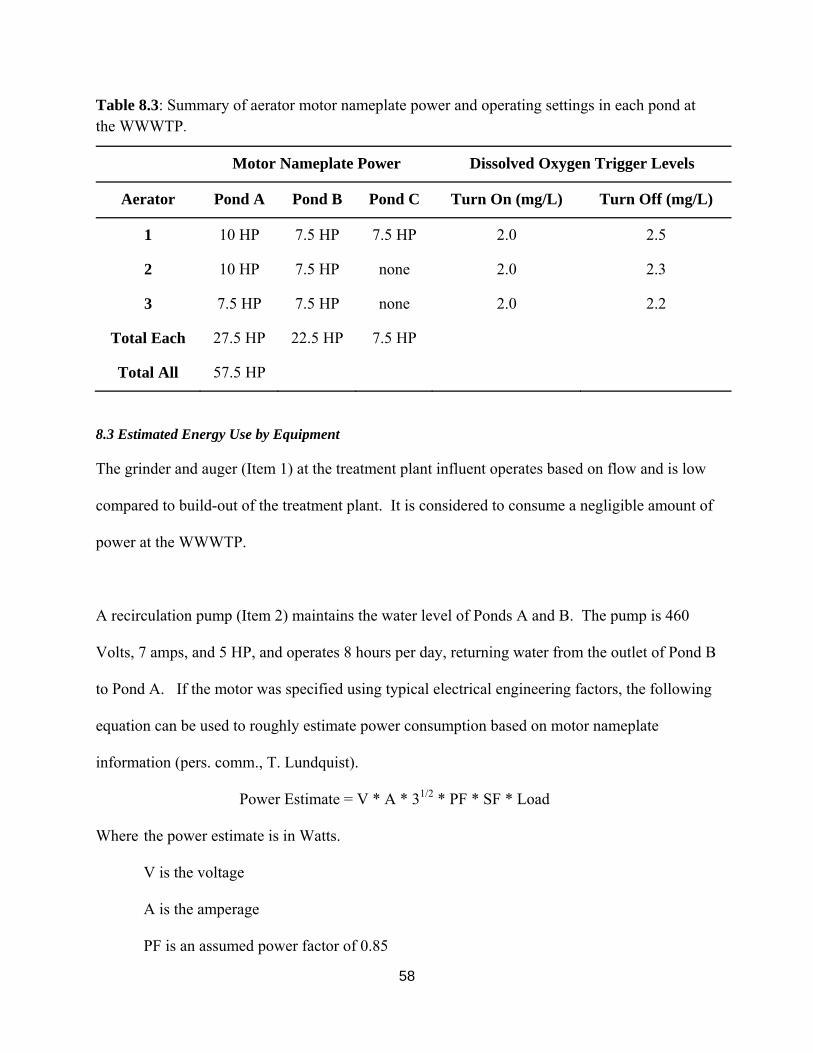
58
Table 8.3: Summary of aerator motor nameplate power and operating settings in each pond at the WWWTP.
Motor Nameplate Power Dissolved Oxygen Trigger Levels
Aerator Pond A Pond B Pond C Turn On (mg/L) Turn Off (mg/L)
1 10 HP 7.5 HP 7.5 HP 2.0 2.5
2 10 HP 7.5 HP none 2.0 2.3
3 7.5 HP 7.5 HP none 2.0 2.2
Total Each 27.5 HP 22.5 HP 7.5 HP
Total All 57.5 HP
8.3 Estimated Energy Use by Equipment
The grinder and auger (Item 1) at the treatment plant influent operates based on flow and is low
compared to build-out of the treatment plant. It is considered to consume a negligible amount of
power at the WWWTP.
A recirculation pump (Item 2) maintains the water level of Ponds A and B. The pump is 460
Volts, 7 amps, and 5 HP, and operates 8 hours per day, returning water from the outlet of Pond B
to Pond A. If the motor was specified using typical electrical engineering factors, the following
equation can be used to roughly estimate power consumption based on motor nameplate
information (pers. comm., T. Lundquist).
Power Estimate = V * A * 31/2 * PF * SF * Load
Where the power estimate is in Watts.
V is the voltage
A is the amperage
PF is an assumed power factor of 0.85

59
SF is the service factor assumed to be 0.80
Load factor is 1 for constant pump operation.
P = (460)*(7)*31/2*(0.85)*(0.80)*(1) = 3,793 W
3,793 W for 8 hrs/day is 11,075 kWh/yr.
Item 3 is the aerator. We will solve for the energy consumed by the aerators in this section.
For the microfilter influent lift station pump from Pond C (Item 4), we assume a flow rate equal
to that of the microfilter: 100 gpm or 0.0063 m3/sec. The elevation gain was determined to be
approximately 16 feet or 5 m. Friction losses are not considered in this power approximation.
P = QγH/e
Where P = power in watts
Q is the flowrate in m3/sec
γ is the specific gravity in N/m3
H is the vertical lift of the water
e is the efficiency of the pump, assumed to be 0.7
P = (0.0063 m3/sec)*(9806 N/m3 )*(5 m)/0.7 = 441 W
441 W for 72 hr/wk of microfiltration is 1,652 kWh/yr.
Chemical dosing pumps (Item 5) are considered to be negligible.
60
The Pall Aria AP-4 microfilter system uses a centrifugal pump (Item 6: G&L Pumps Model No.
65Hk6, 20 HP, 460V, 23A; these values used in the equation below) for influent and backwash
pumping. The microfilter is typically in operation for 72 hours each week. Using the same
equation for power as Item 2, we can solve for an estimation of the microfilter energy use.
Power Estimate = V * A * 31/2 * PF * SF * Load
Where the power estimate is in Watts.
V is the voltage
A is the amperage
PF is an assumed power factor of 0.85
SF is the service factor assumed to be 0.80
Load factor is 1 for constant microfilter operation.
P = (460)*(23)*31/2*(0.85)*(0.80)*(1) = 12,400 W
12.4 kW, for 72 hours per week of microfilter operation is 42,854 kWh/year.
Controls for the mechanical units (Item 7) are considered to be negligible.
For the effluent pump (Item 8), we assume a flow rate equal to that of the microfilter: 100 gpm
or 0.0063 m3/sec. Elevation gain was determined to be about 60 feet or approximately 19 m.
For this estimate of power usage, we neglect friction losses.
P = QγH/e
Where P = power in watts
Q is the flowrate in m3/sec
γ is the specific gravity in N/m3
61
H is the vertical lift of the water
e is the efficiency of the pump, assumed to be 0.7
P = (0.0063 m3/s)*(9806 N/m3)*(19 m)/0.7 = 1676 W
1676 W for 72 hr/wk of effluent pump operation is 6,275 kWh/yr.
The energy required for the aerators can be estimated with the following equation based on the
equipment list in the first paragraph of this chapter:
Aerator energy = Total energy use – Grinder/auger – Recirculation pump – Pond C lift
pump – Chemical dosing pumps – Microfilter influent pump – Controls – Effluent pump
Assuming that the auger and grinder unit, chemical dosing pumps, and the controls have
negligible energy use, the equation for annual aerator energy use simplifies to the following:
Aerator energy = Total energy use – Recirculation pumps – Pond C lift pump–
Microfilter influent pump – Effluent pump
Aerator energy = 214,680 kWh – 11,075 kWh – 1,652 kWh – 42,854 kWh – 6,275 kWh
= 152,824 kWh
The treatment pond aerators require 152,824 kWh/yr or approximately 71% of the total plant
energy consumption.
Table 8.4: Aerator and microfilter energy estimates and costs at $0.173/kWh per year during the months of March 2009 and March 2012.
Aerator Microfilter Total
Annual Energy Consumption
(kWh/yr)
152,824 42,854 195,678
Cost ($/yr) 26,439 7,371 33,810
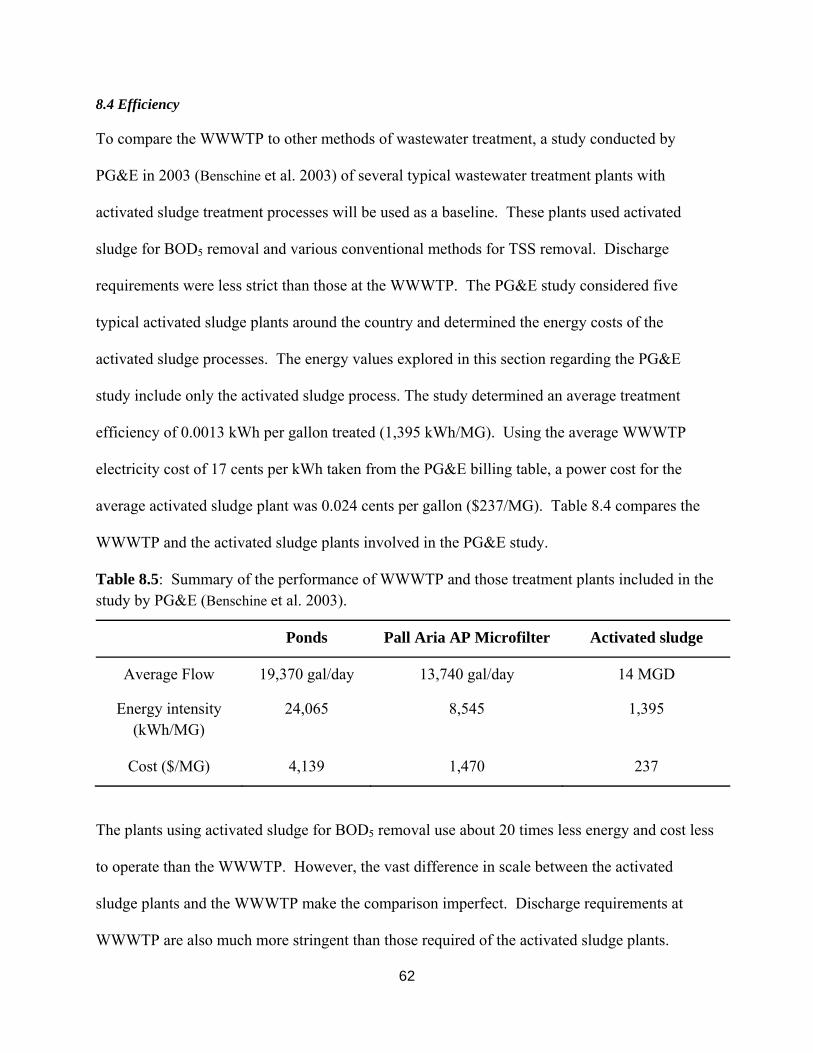
62
8.4 Efficiency
To compare the WWWTP to other methods of wastewater treatment, a study conducted by
PG&E in 2003 (Benschine et al. 2003) of several typical wastewater treatment plants with
activated sludge treatment processes will be used as a baseline. These plants used activated
sludge for BOD5 removal and various conventional methods for TSS removal. Discharge
requirements were less strict than those at the WWWTP. The PG&E study considered five
typical activated sludge plants around the country and determined the energy costs of the
activated sludge processes. The energy values explored in this section regarding the PG&E
study include only the activated sludge process. The study determined an average treatment
efficiency of 0.0013 kWh per gallon treated (1,395 kWh/MG). Using the average WWWTP
electricity cost of 17 cents per kWh taken from the PG&E billing table, a power cost for the
average activated sludge plant was 0.024 cents per gallon ($237/MG). Table 8.4 compares the
WWWTP and the activated sludge plants involved in the PG&E study.
Table 8.5: Summary of the performance of WWWTP and those treatment plants included in the study by PG&E (Benschine et al. 2003).
Ponds Pall Aria AP Microfilter Activated sludge
Average Flow 19,370 gal/day 13,740 gal/day 14 MGD
Energy intensity (kWh/MG)
24,065 8,545 1,395
Cost ($/MG) 4,139 1,470 237
The plants using activated sludge for BOD5 removal use about 20 times less energy and cost less
to operate than the WWWTP. However, the vast difference in scale between the activated
sludge plants and the WWWTP make the comparison imperfect. Discharge requirements at
WWWTP are also much more stringent than those required of the activated sludge plants.
63
Weekly averages and maxima are required to be three times lower at the WWWTP than at the
activated sludge plants used in the PG&E study. Since BOD treatment limits are achieved after
Pond A, aeration performed after Pond A is not contributing to BOD removal. It might,
however, be affecting Pond C TSS concentrations. Loading conditions of the WWWTP are
much lower than those used in the PG&E study. Higher loading conditions at the WWWTP are
expected to raise treatment flow and lower treatment cost per MG. Future higher loading to the
WWWTP will most likely increase the efficiency of the plant. Lowering the aeration is also
recommended to lower the cost of treatment operation.
64
CHAPTER 9: CONCLUSIONS
Based on the present study, the following points can be concluded about the WWWTP regarding
the performance and conditions of the plant.
1. The ponds alone treated tBOD5 to well below the limit of 10 mg/L (Table 9.1). The pond
system provided the required tBOD removal given the current low wastewater load.
2. The plant treated TSS to below the limit of 10 mg/L (Table 9.1). Treatment ponds
reduced TSS to 42.5 mg/L. The microfiltration unit was able to handle the Pond C TSS
load, lowering TSS to 1.5 mg/L without excessive cleaning or fouling.
3. pH has on occasion fallen outside the limit set by the RWQCB but was corrected by the
next monthly report.
4. Total ammonia nitrogen was decreased to an average of 1.61 mg/L.
5. Sludge accumulated at a rate at the high end of typical for aerobic treatment ponds.
However, this result is for the first 3 years of operation and, in the longer term, sludge
consolidation may decrease this rate.
6. The microfiltration unit has experienced no observable permanent fouling since operation
commenced. The TSS loading rate on the microfilters averaged 3.44 gram per m2
membrane surface per day of operation, and flux averaged 80.9 L per m2 per day of
operation.
7. The WWWTP is under-loaded. At the current flow rates, the WWWTP treats municipal
wastewater with 20 times greater electrical intensity than traditional large activated
sludge plants (Table 8.4). At build-out, the Woodlands community will provide higher
waste loads, and the WWWTP should perform at better efficiencies to provide
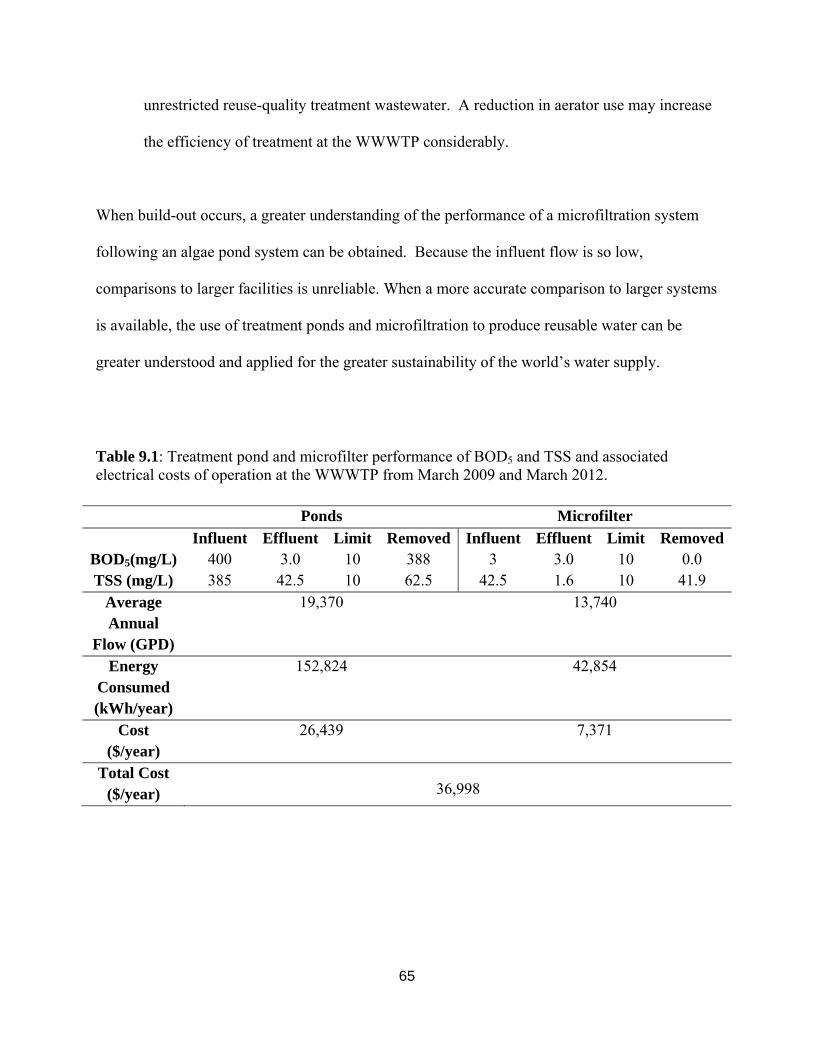
65
unrestricted reuse-quality treatment wastewater. A reduction in aerator use may increase
the efficiency of treatment at the WWWTP considerably.
When build-out occurs, a greater understanding of the performance of a microfiltration system
following an algae pond system can be obtained. Because the influent flow is so low,
comparisons to larger facilities is unreliable. When a more accurate comparison to larger systems
is available, the use of treatment ponds and microfiltration to produce reusable water can be
greater understood and applied for the greater sustainability of the world’s water supply.
Table 9.1: Treatment pond and microfilter performance of BOD5 and TSS and associated electrical costs of operation at the WWWTP from March 2009 and March 2012.
Ponds Microfilter
BOD5(mg/L) TSS (mg/L)
Influent 400 385
Effluent 3.0 42.5
Limit10 10
Removed388 62.5
Influent3
42.5
Effluent 3.0 1.6
Limit 10 10
Removed0.0 41.9
Average Annual
Flow (GPD)
19,370 13,740
Energy Consumed (kWh/year)
152,824 42,854
Cost ($/year)
26,439 7,371
Total Cost ($/year) 36,998
66
REFERENCES
Ahn, K., and K. Song. "Treatment of Domestic Wastewater Using Microfiltration for Reuse of
Wastewater1." Desalination 126.1-3 (1999): 7-14. Print.
Benschine, Kathy, Stephen Fok, Carol Harty, Jayne Ng, and Patsy Dugger. Municipal Wastewater
Treatment Plant: A Baseline Study. Rep. SAN FRANCISCO: M/J Industrial Solutions, (2003).
Print.
“Bidorbuy Mobile Site - Powered by Kayako Fusion Help Desk Software." Bidorbuy Mobile Site -
Powered by Kayako Fusion Help Desk Software. N.p., n.d. Web. 26 Aug. 2012.
<http://support.bidorbuy.co.za/index.php?/Knowledgebase/Article/View/158/2/bidorbuy-mobile-
site>.
Fabris, R., E. Lee, C. Chow, V. Chen, and M. Drikas. "Pre-treatments to Reduce Fouling of Low Pressure
Micro-filtration (MF) Membranes." Journal of Membrane Science 289.1-2 (2007): 231-40. Print.
Farnsworth, Richard K., and Edwin S. Thompson. Mean Monthly, Seasonal, and Annual Pan
Evaporation for the United States. Washington, D.C.: U.S. Dept. of Commerce, National Oceanic
and Atmospheric Administration, National Weather Service, (1983). Print.
Good Water Company Santa Fe: Products/Green Options." Good Water Company Santa Fe:
Products/Green Options. N.p., n.d. Web. 15 Nov. 2012.
<http://goodwatercompany.com/Products/Green_Options/index.html
Grönlund, Erik, Anders Klang, Stefan Falk, and Jörgen Hanæus. "Sustainability of Wastewater Treatment
with Microalgae in Cold Climate, Evaluated with Emergy and Socio-ecological Principles."
Ecological Engineering 22.3 (2004): 155-74. Print.
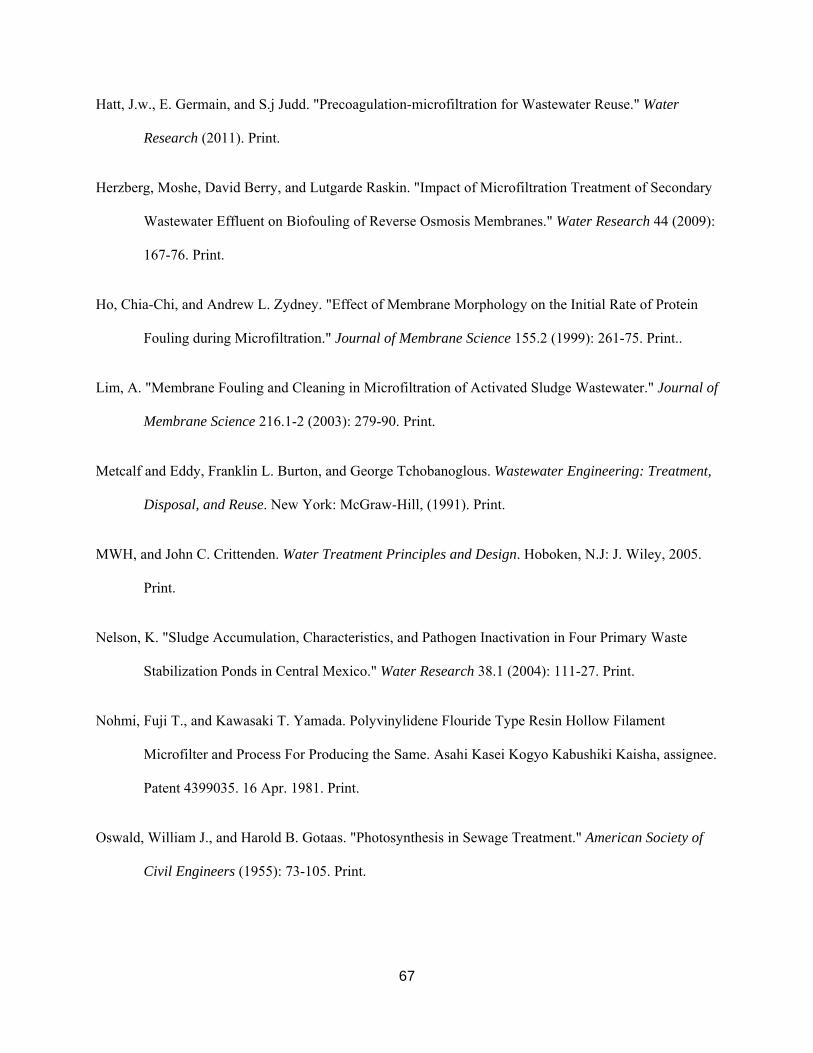
67
Hatt, J.w., E. Germain, and S.j Judd. "Precoagulation-microfiltration for Wastewater Reuse." Water
Research (2011). Print.
Herzberg, Moshe, David Berry, and Lutgarde Raskin. "Impact of Microfiltration Treatment of Secondary
Wastewater Effluent on Biofouling of Reverse Osmosis Membranes." Water Research 44 (2009):
167-76. Print.
Ho, Chia-Chi, and Andrew L. Zydney. "Effect of Membrane Morphology on the Initial Rate of Protein
Fouling during Microfiltration." Journal of Membrane Science 155.2 (1999): 261-75. Print..
Lim, A. "Membrane Fouling and Cleaning in Microfiltration of Activated Sludge Wastewater." Journal of
Membrane Science 216.1-2 (2003): 279-90. Print.
Metcalf and Eddy, Franklin L. Burton, and George Tchobanoglous. Wastewater Engineering: Treatment,
Disposal, and Reuse. New York: McGraw-Hill, (1991). Print.
MWH, and John C. Crittenden. Water Treatment Principles and Design. Hoboken, N.J: J. Wiley, 2005.
Print.
Nelson, K. "Sludge Accumulation, Characteristics, and Pathogen Inactivation in Four Primary Waste
Stabilization Ponds in Central Mexico." Water Research 38.1 (2004): 111-27. Print.
Nohmi, Fuji T., and Kawasaki T. Yamada. Polyvinylidene Flouride Type Resin Hollow Filament
Microfilter and Process For Producing the Same. Asahi Kasei Kogyo Kabushiki Kaisha, assignee.
Patent 4399035. 16 Apr. 1981. Print.
Oswald, William J., and Harold B. Gotaas. "Photosynthesis in Sewage Treatment." American Society of
Civil Engineers (1955): 73-105. Print.
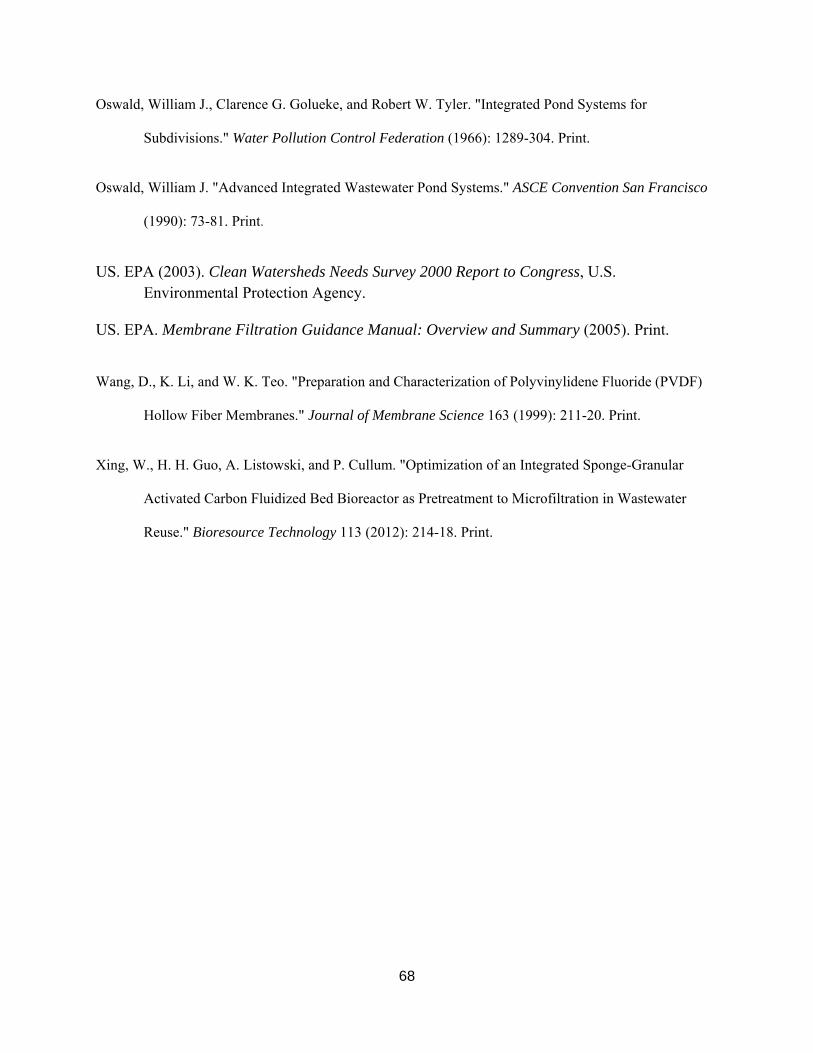
68
Oswald, William J., Clarence G. Golueke, and Robert W. Tyler. "Integrated Pond Systems for
Subdivisions." Water Pollution Control Federation (1966): 1289-304. Print.
Oswald, William J. "Advanced Integrated Wastewater Pond Systems." ASCE Convention San Francisco
(1990): 73-81. Print.
US. EPA (2003). Clean Watersheds Needs Survey 2000 Report to Congress, U.S. Environmental Protection Agency.
US. EPA. Membrane Filtration Guidance Manual: Overview and Summary (2005). Print.
Wang, D., K. Li, and W. K. Teo. "Preparation and Characterization of Polyvinylidene Fluoride (PVDF)
Hollow Fiber Membranes." Journal of Membrane Science 163 (1999): 211-20. Print.
Xing, W., H. H. Guo, A. Listowski, and P. Cullum. "Optimization of an Integrated Sponge-Granular
Activated Carbon Fluidized Bed Bioreactor as Pretreatment to Microfiltration in Wastewater
Reuse." Bioresource Technology 113 (2012): 214-18. Print.
69
APPENDIX
Figure A.1: Topographical plan view Woodlands Wastewater Treatment Plant.
70
Figure A.2: Elevation plan view of Pond A. Digester floor and pond floor elevations are displayed on image
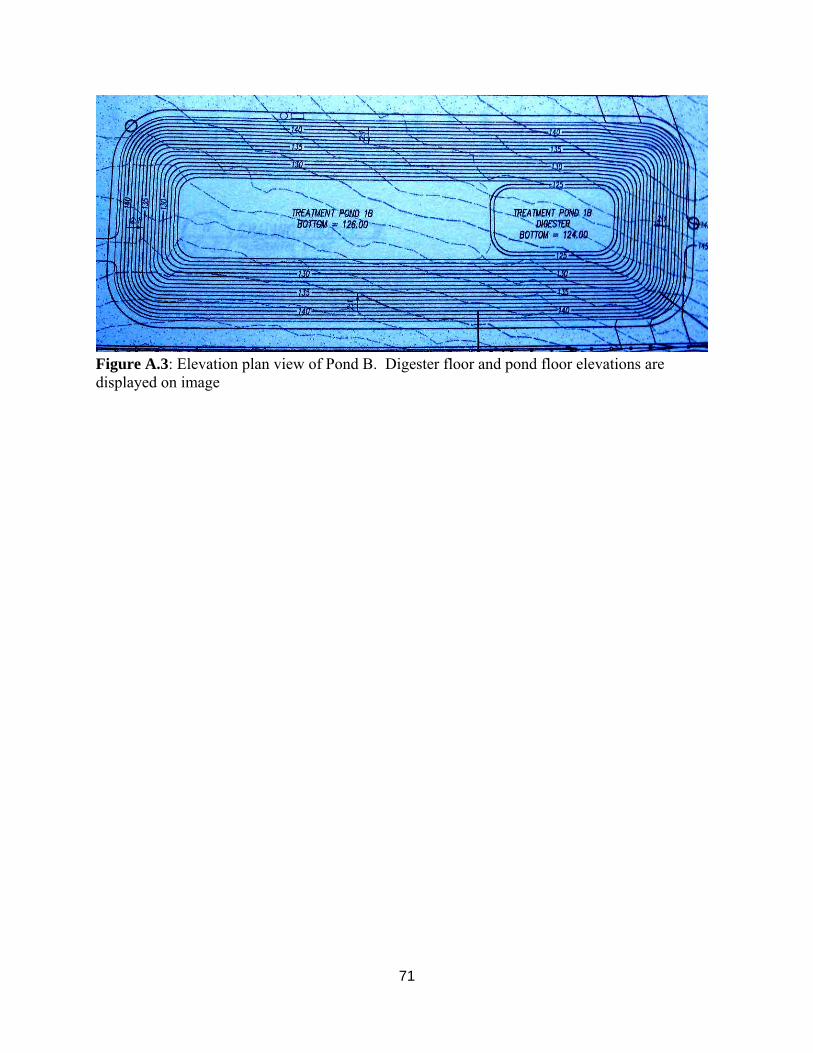
71
Figure A.3: Elevation plan view of Pond B. Digester floor and pond floor elevations are displayed on image

72
Figure A.4: Elevation plan view of Pond C. Pond floor elevations is displayed on image
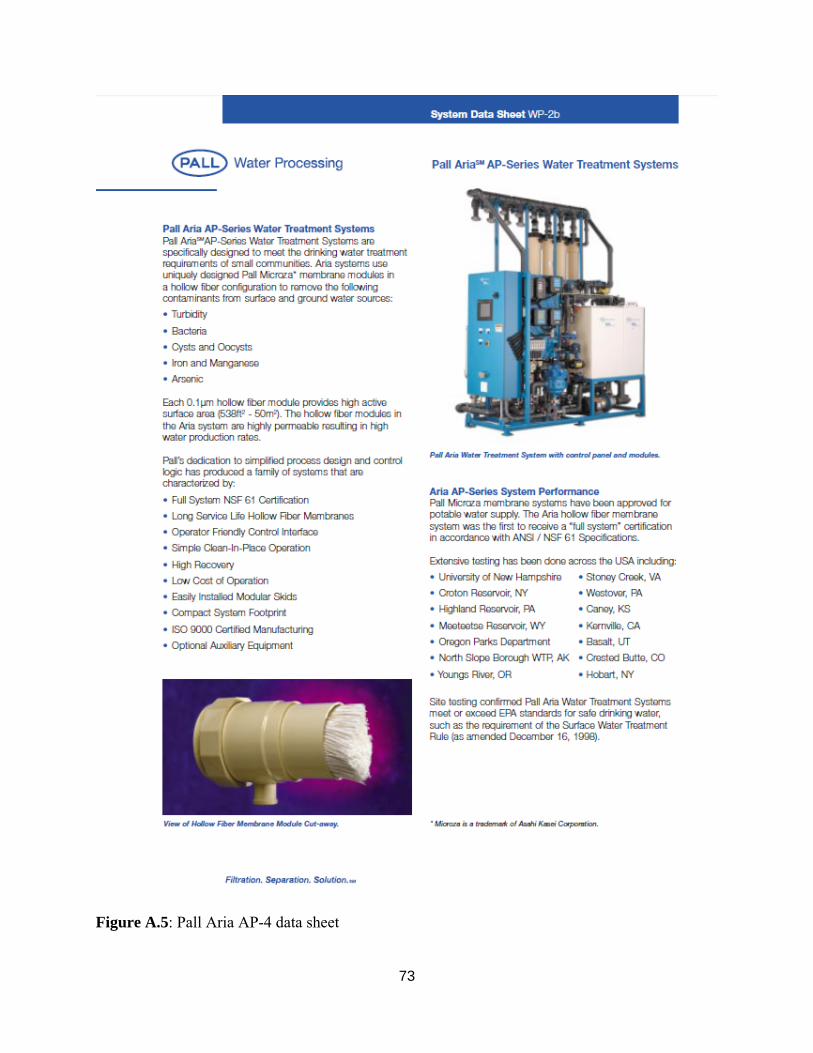
73
Figure A.5: Pall Aria AP-4 data sheet
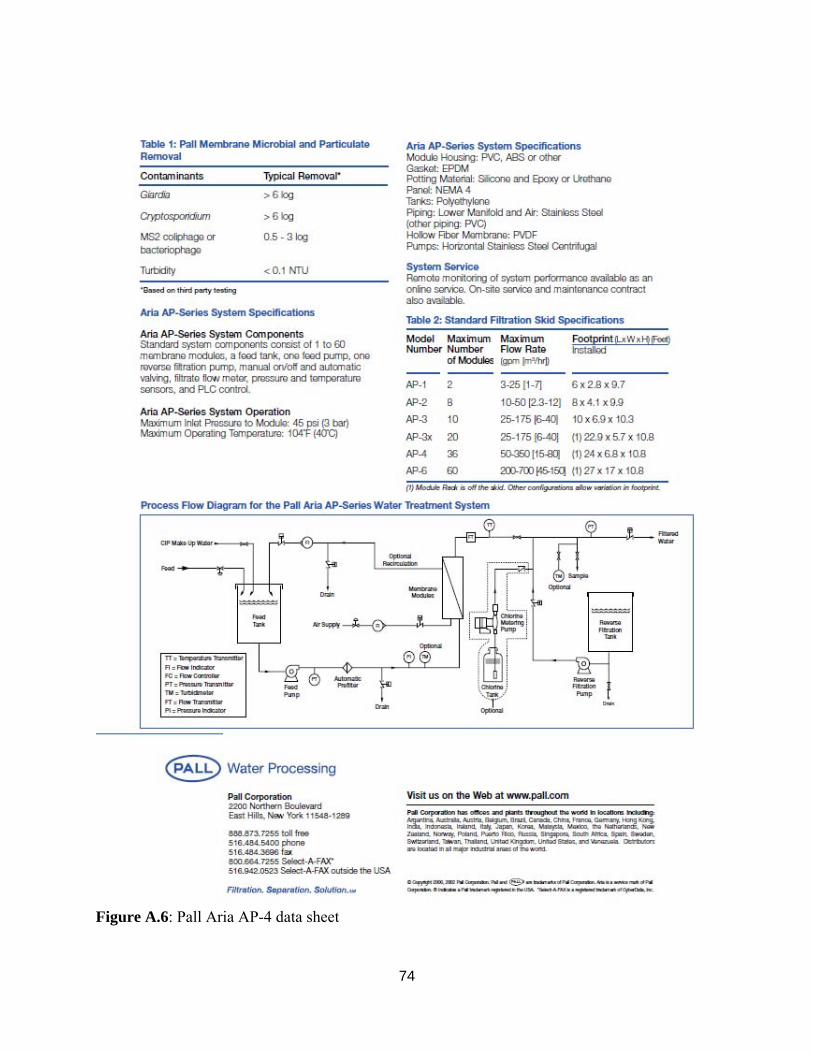
74
Figure A.6: Pall Aria AP-4 data sheet