Embed Size (px)
Citation preview
Page 0 of 22
2017-09 Council Performance monitoring Report version - FINAL
Performance Monitoring Report: end June 2017

Page 1 of 22
Council June 2017 Performance Monitoring Report: end June 2017
2017-09 Council Performance monitoring Report version - FINAL
1. Customer services
1.1 Registrations
2015/16 2016/17 2017/18
Q4 Q1 Q2 Q3 Q4 Q1
Pharmacists 398 243 2,800 263 53 94
Pharmacy technicians 318 248 441 191 190 194
Registered pharmacies 92 99 88 61 74 127
The noticeable drop in pharmacist registrations in Q1 compared with last year potentially reflects the impact of Brexit and our new English language
requirements. Last year in Q1 we registered 166 EEA pharmacists, in this last quarter the number has reduced to 30.
1.2 Registration Totals
Total Budgeted Variance
Pharmacists 53,873 53,586 287
Pharmacy technicians 23,351 23,051 300
Registered pharmacies 14,399 14,207 192
Register totals as at 30 June 2017
1.3 Median application processing times for pharmacists
Median application processing times for pharmacists (working days)
Median application processing times for pharmacy technicians (working days)
Application receipt to approval 3 Application receipt to approval 1
Application receipt to entry 7 Application receipt to entry 7
Medians calculated for applications during the period 1 April 2017 to 30 June 2017
The difference between the two status measurements for each registrant type relates to the current dual entry point each month onto the Register.
Page 2 of 22
Council June 2017 Performance Monitoring Report: end June 2017
2017-09 Council Performance monitoring Report version - FINAL
1.4 Contact Centre
Phone 2015/16 2016/17 2017/18
Q4 Q1 Q2 Q3 Q4 Q1
Calls made to GPhC 9,210 14,017 18,539 13,081 9,176 14,024
Calls answered within 20 seconds (KPI > 80%) 91.6% 81.10% 73.60% 60.00% 62.60% 49.0%
Calls abandoned (KPI < 5%) 1.80% 2.30% 4.00% 9.80% 9.00% 11.80%
Correspondence
Emails actioned within 2 days (KPI > 90%) 97.70% 100% 92.60% 80.00% 89.30% 98.60%
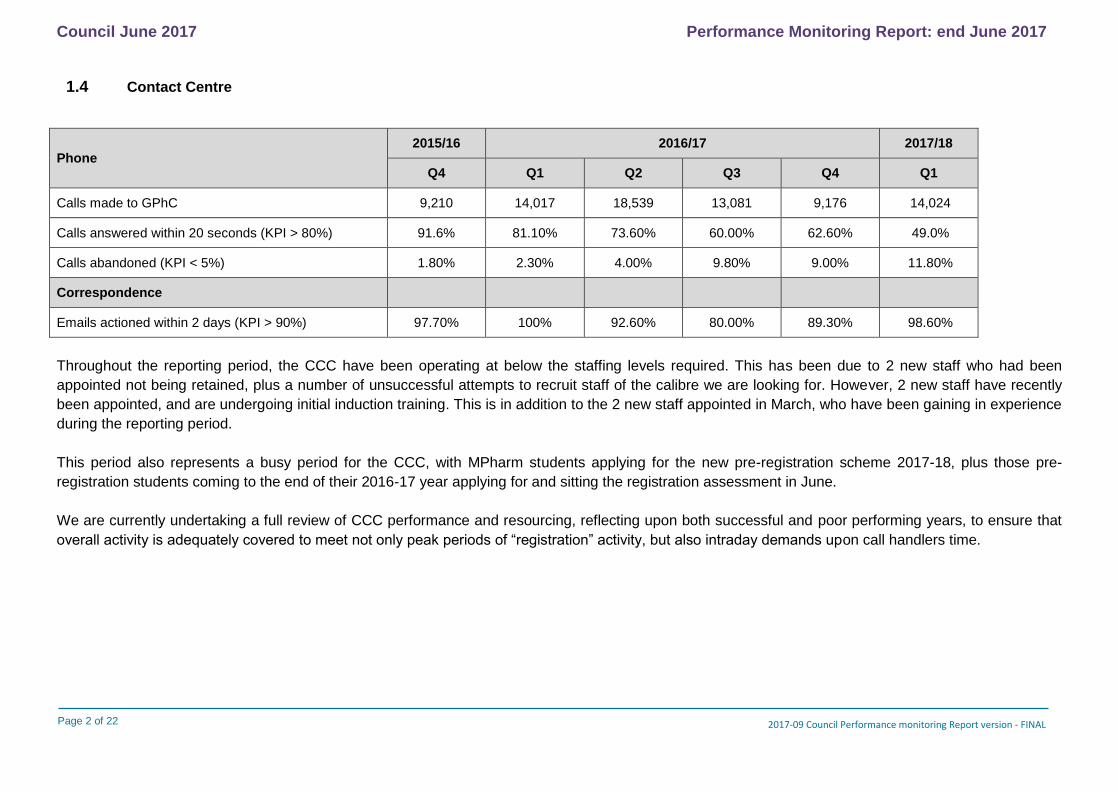
Throughout the reporting period, the CCC have been operating at below the staffing levels required. This has been due to 2 new staff who had been
appointed not being retained, plus a number of unsuccessful attempts to recruit staff of the calibre we are looking for. However, 2 new staff have recently
been appointed, and are undergoing initial induction training. This is in addition to the 2 new staff appointed in March, who have been gaining in experience
during the reporting period.
This period also represents a busy period for the CCC, with MPharm students applying for the new pre-registration scheme 2017-18, plus those pre-
registration students coming to the end of their 2016-17 year applying for and sitting the registration assessment in June.
We are currently undertaking a full review of CCC performance and resourcing, reflecting upon both successful and poor performing years, to ensure that
overall activity is adequately covered to meet not only peak periods of “registration” activity, but also intraday demands upon call handlers time.
Page 3 of 22
Council June 2017 Performance Monitoring Report: end June 2017
2017-09 Council Performance monitoring Report version - FINAL
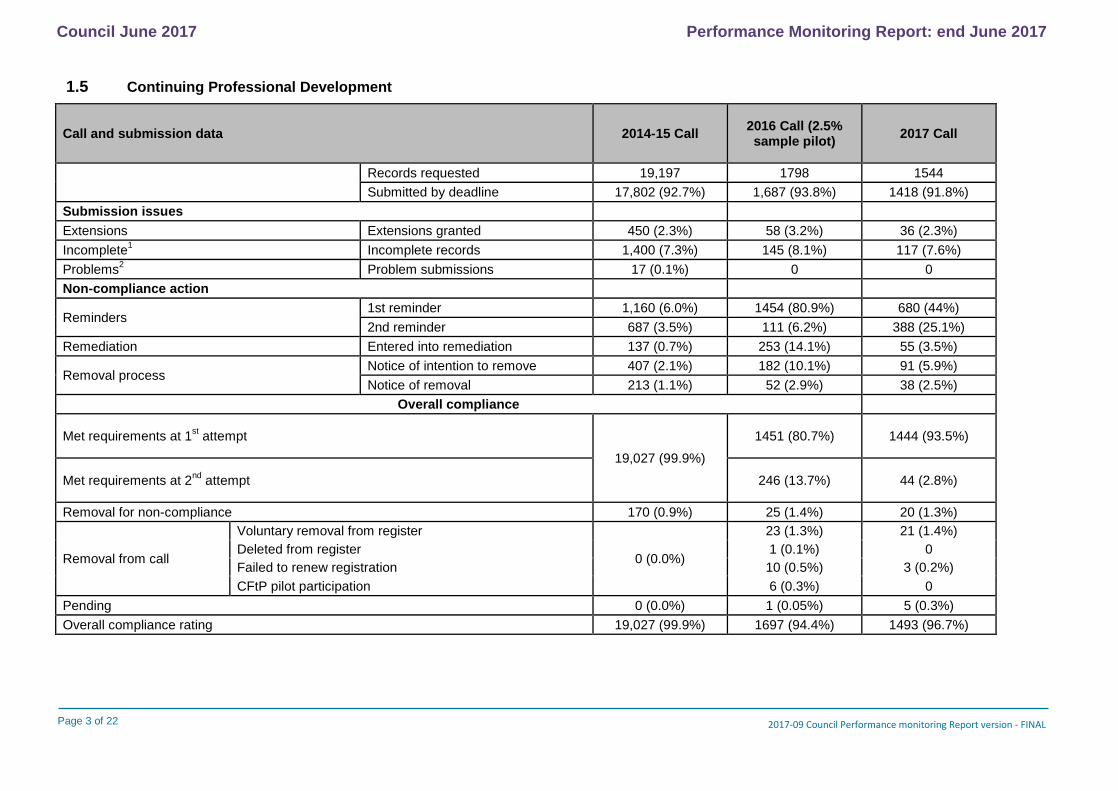
1.5 Continuing Professional Development
Call and submission data 2014-15 Call 2016 Call (2.5% sample pilot)
2017 Call
Records requested 19,197 1798 1544
Submitted by deadline 17,802 (92.7%) 1,687 (93.8%) 1418 (91.8%)
Submission issues
Extensions Extensions granted 450 (2.3%) 58 (3.2%) 36 (2.3%)
Incomplete1 Incomplete records 1,400 (7.3%) 145 (8.1%) 117 (7.6%)
Problems2 Problem submissions 17 (0.1%) 0 0
Non-compliance action
Reminders 1st reminder 1,160 (6.0%) 1454 (80.9%) 680 (44%)
2nd reminder 687 (3.5%) 111 (6.2%) 388 (25.1%)
Remediation Entered into remediation 137 (0.7%) 253 (14.1%) 55 (3.5%)
Removal process Notice of intention to remove 407 (2.1%) 182 (10.1%) 91 (5.9%)
Notice of removal 213 (1.1%) 52 (2.9%) 38 (2.5%)
Overall compliance
Met requirements at 1st attempt
19,027 (99.9%)
1451 (80.7%) 1444 (93.5%)
Met requirements at 2nd
attempt 246 (13.7%) 44 (2.8%)
Removal for non-compliance 170 (0.9%) 25 (1.4%) 20 (1.3%)
Removal from call
Voluntary removal from register
0 (0.0%)
23 (1.3%) 21 (1.4%)
Deleted from register 1 (0.1%) 0
Failed to renew registration 10 (0.5%) 3 (0.2%)
CFtP pilot participation 6 (0.3%) 0
Pending 0 (0.0%) 1 (0.05%) 5 (0.3%)
Overall compliance rating 19,027 (99.9%) 1697 (94.4%) 1493 (96.7%)
Page 4 of 22
Council June 2017 Performance Monitoring Report: end June 2017
2017-09 Council Performance monitoring Report version - FINAL
About the data
Figures are presented as annual call cycles. 2014-15 calls commenced in October 2014 and ended in June 2015. The 2016 and 2017 calls use a sampling
approach of 2.5% of the professional registers.
The 2017 call is on-going and is not yet representative of the final degree of compliance with CPD requirements.
Data was extracted on 25th August 2017.
This call is now drawing to a close with only 5 pending registrants; 4 who have been granted extensions and 1 who has been issued with a Notice of
Removal for non-submission.
Commentary
1 Incomplete refers to having approval to submit fewer entries than usually required (9 per year) as a result of periods away from practice, such as parental
or sick leave.
2 Problem submissions are those that are submitted in formats that cannot be accepted and therefore it is not possible to process them.
Page 5 of 22
Council June 2017 Performance Monitoring Report: end June 2017
2017-09 Council Performance monitoring Report version - FINAL
2. Fitness to Practise (FtP)
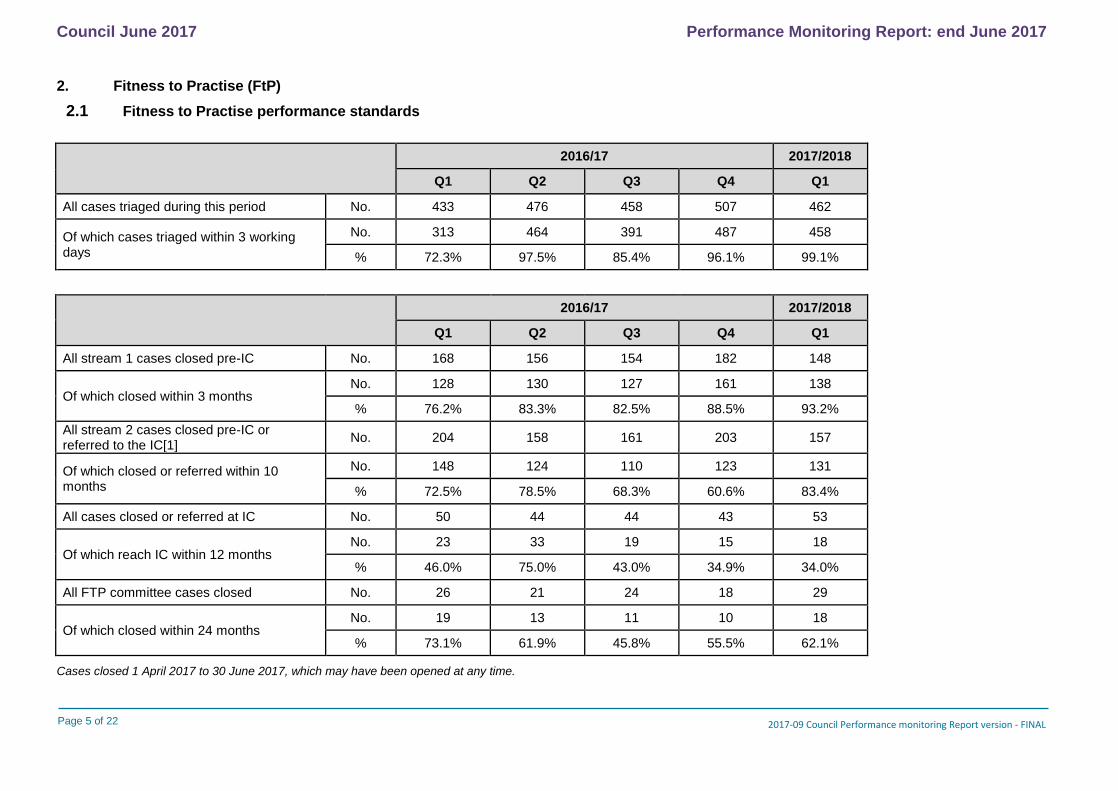
2.1 Fitness to Practise performance standards
2016/17 2017/2018
Q1 Q2 Q3 Q4 Q1
All cases triaged during this period No. 433 476 458 507 462
Of which cases triaged within 3 working days
No. 313 464 391 487 458
% 72.3% 97.5% 85.4% 96.1% 99.1%
2016/17 2017/2018
Q1 Q2 Q3 Q4 Q1
All stream 1 cases closed pre-IC No. 168 156 154 182 148
Of which closed within 3 months No. 128 130 127 161 138
% 76.2% 83.3% 82.5% 88.5% 93.2%
All stream 2 cases closed pre-IC or referred to the IC[1]
No. 204 158 161 203 157
Of which closed or referred within 10 months
No. 148 124 110 123 131
% 72.5% 78.5% 68.3% 60.6% 83.4%
All cases closed or referred at IC No. 50 44 44 43 53
Of which reach IC within 12 months No. 23 33 19 15 18
% 46.0% 75.0% 43.0% 34.9% 34.0%
All FTP committee cases closed No. 26 21 24 18 29
Of which closed within 24 months No. 19 13 11 10 18
% 73.1% 61.9% 45.8% 55.5% 62.1%
Cases closed 1 April 2017 to 30 June 2017, which may have been opened at any time.

Page 6 of 22
Council June 2017 Performance Monitoring Report: end June 2017
2017-09 Council Performance monitoring Report version - FINAL
Overall performance has been positive this reporting period. Performance has improved in 4 out of the 5 performance standards and been sustained in the
other. Triage performance remains strong, with 99% of concerns triaged within 3 days. Stream 1 cases closed within 3 months has also improved to 93%
this reporting period, continuing the positive improvement trend over last year. The percentage of cases closed or referred within 10 months and the
percentage of cases being closed at FtP Committee within 24 months has also improved. The increased numbers of cases at these latter stages of the
fitness to practise process reflects the continued throughput of the significant efforts to progress older cases out of the investigation stage during quarter 4
of 2016/17.
Page 7 of 22
Council June 2017 Performance Monitoring Report: end June 2017
2017-09 Council Performance monitoring Report version - FINAL
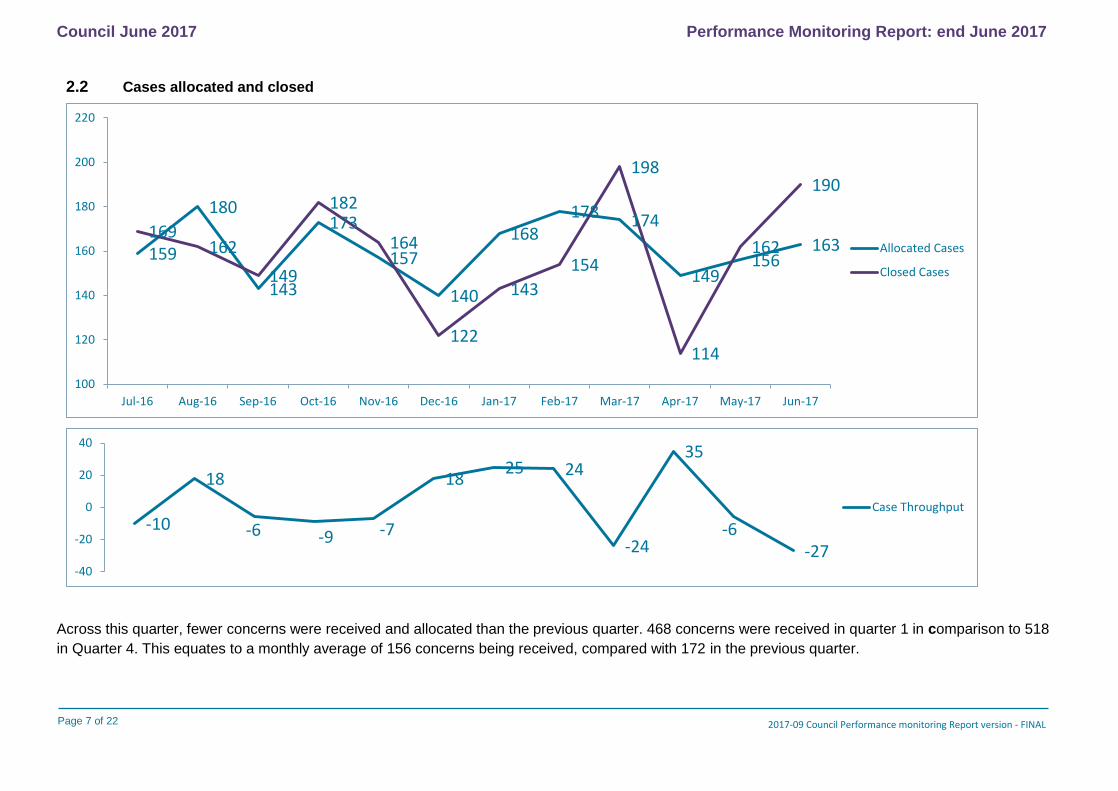
2.2 Cases allocated and closed
Across this quarter, fewer concerns were received and allocated than the previous quarter. 468 concerns were received in quarter 1 in comparison to 518
in Quarter 4. This equates to a monthly average of 156 concerns being received, compared with 172 in the previous quarter.
159
180
143
173
157
140
168 178 174
149 156
163 169
162
149
182
164
122
143
154
198
114
162
190
100
120
140
160
180
200
220
Jul-16 Aug-16 Sep-16 Oct-16 Nov-16 Dec-16 Jan-17 Feb-17 Mar-17 Apr-17 May-17 Jun-17
Allocated Cases
Closed Cases
-10
18
-6 -9 -7
18 25 24
-24
35
-6 -27
-40
-20
0
20
40
Case Throughput
Page 8 of 22
Council June 2017 Performance Monitoring Report: end June 2017
2017-09 Council Performance monitoring Report version - FINAL
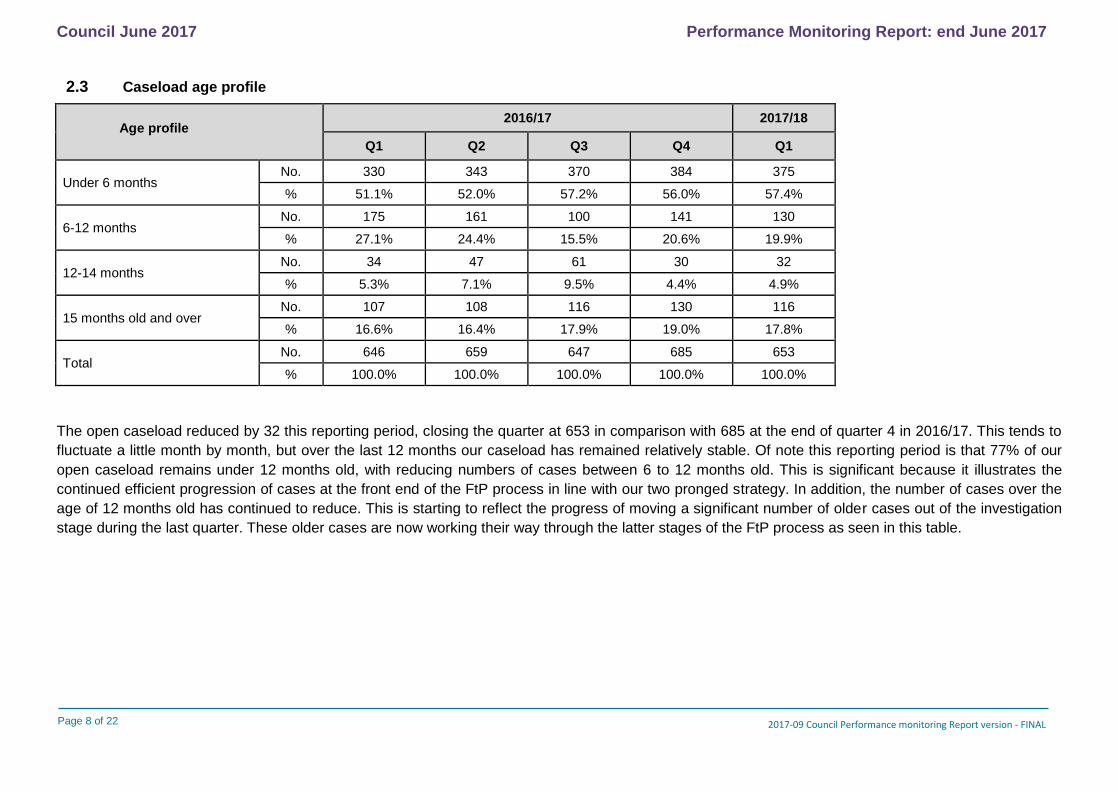
2.3 Caseload age profile
Age profile 2016/17 2017/18
Q1 Q2 Q3 Q4 Q1
Under 6 months No. 330 343 370 384 375
% 51.1% 52.0% 57.2% 56.0% 57.4%
6-12 months No. 175 161 100 141 130
% 27.1% 24.4% 15.5% 20.6% 19.9%
12-14 months No. 34 47 61 30 32
% 5.3% 7.1% 9.5% 4.4% 4.9%
15 months old and over No. 107 108 116 130 116
% 16.6% 16.4% 17.9% 19.0% 17.8%
Total No. 646 659 647 685 653
% 100.0% 100.0% 100.0% 100.0% 100.0%
The open caseload reduced by 32 this reporting period, closing the quarter at 653 in comparison with 685 at the end of quarter 4 in 2016/17. This tends to
fluctuate a little month by month, but over the last 12 months our caseload has remained relatively stable. Of note this reporting period is that 77% of our
open caseload remains under 12 months old, with reducing numbers of cases between 6 to 12 months old. This is significant because it illustrates the
continued efficient progression of cases at the front end of the FtP process in line with our two pronged strategy. In addition, the number of cases over the
age of 12 months old has continued to reduce. This is starting to reflect the progress of moving a significant number of older cases out of the investigation
stage during the last quarter. These older cases are now working their way through the latter stages of the FtP process as seen in this table.
Page 9 of 22
Council June 2017 Performance Monitoring Report: end June 2017
2017-09 Council Performance monitoring Report version - FINAL
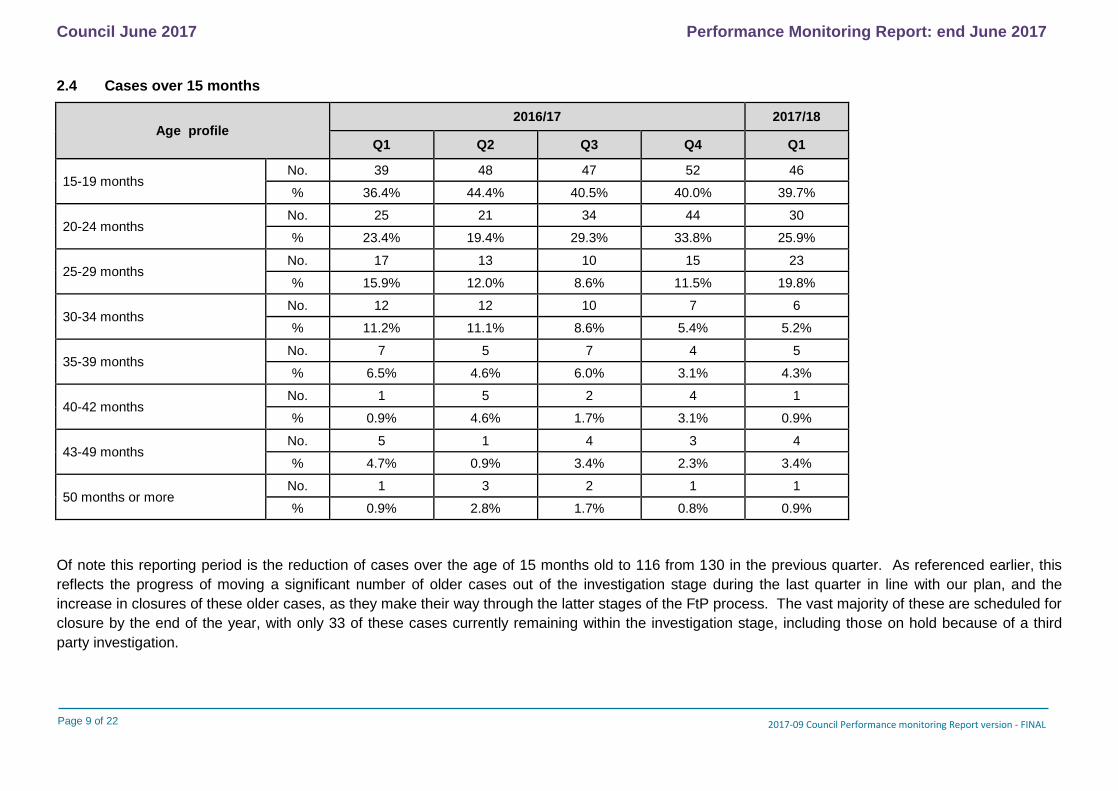
2.4 Cases over 15 months
Age profile 2016/17 2017/18
Q1 Q2 Q3 Q4 Q1
15-19 months No. 39 48 47 52 46
% 36.4% 44.4% 40.5% 40.0% 39.7%
20-24 months No. 25 21 34 44 30
% 23.4% 19.4% 29.3% 33.8% 25.9%
25-29 months No. 17 13 10 15 23
% 15.9% 12.0% 8.6% 11.5% 19.8%
30-34 months No. 12 12 10 7 6
% 11.2% 11.1% 8.6% 5.4% 5.2%
35-39 months No. 7 5 7 4 5
% 6.5% 4.6% 6.0% 3.1% 4.3%
40-42 months No. 1 5 2 4 1
% 0.9% 4.6% 1.7% 3.1% 0.9%
43-49 months No. 5 1 4 3 4
% 4.7% 0.9% 3.4% 2.3% 3.4%
50 months or more No. 1 3 2 1 1
% 0.9% 2.8% 1.7% 0.8% 0.9%
Of note this reporting period is the reduction of cases over the age of 15 months old to 116 from 130 in the previous quarter. As referenced earlier, this
reflects the progress of moving a significant number of older cases out of the investigation stage during the last quarter in line with our plan, and the
increase in closures of these older cases, as they make their way through the latter stages of the FtP process. The vast majority of these are scheduled for
closure by the end of the year, with only 33 of these cases currently remaining within the investigation stage, including those on hold because of a third
party investigation.
Page 10 of 22
Council June 2017 Performance Monitoring Report: end June 2017
2017-09 Council Performance monitoring Report version - FINAL
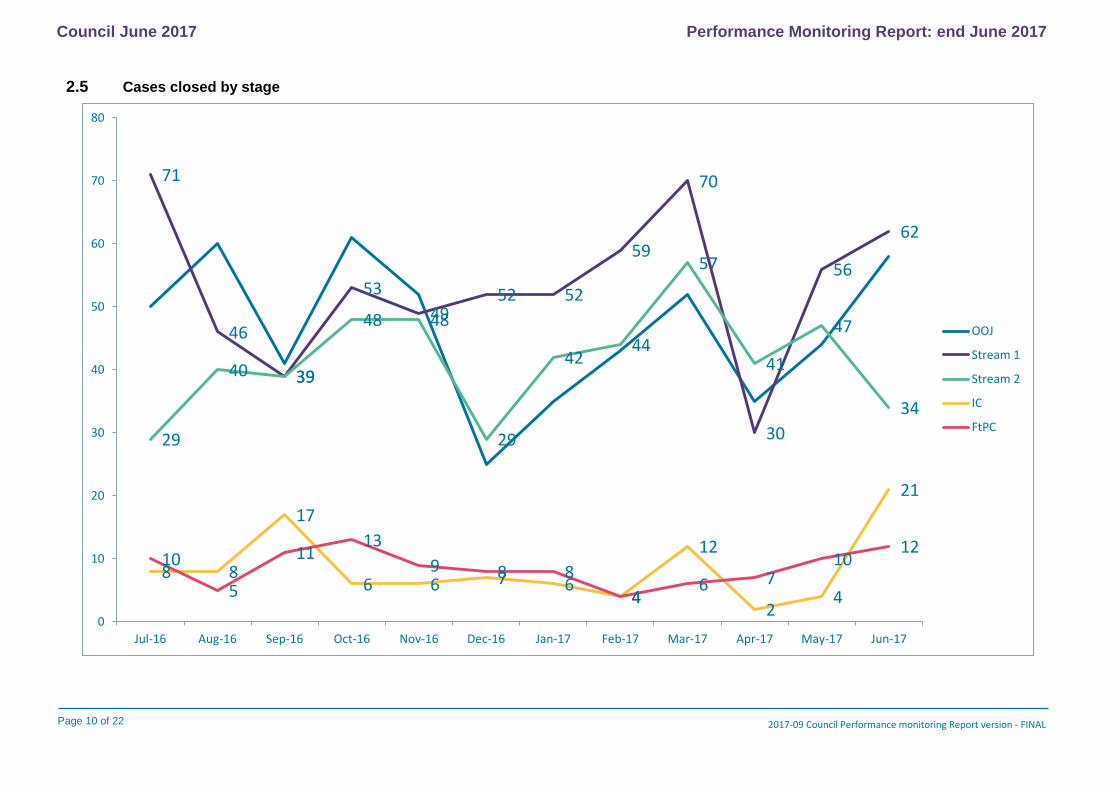
2.5 Cases closed by stage
71
46
39
53
49 52 52
59
70
30
56
62
29
40 39
48 48
29
42 44
57
41
47
34
8 8
17
6 6 7 6 4
12
2 4
21
10
5
11 13
9 8 8
4 6 7
10 12
0
10
20
30
40
50
60
70
80
Jul-16 Aug-16 Sep-16 Oct-16 Nov-16 Dec-16 Jan-17 Feb-17 Mar-17 Apr-17 May-17 Jun-17
OOJ
Stream 1
Stream 2
IC
FtPC
Page 11 of 22
Council June 2017 Performance Monitoring Report: end June 2017
2017-09 Council Performance monitoring Report version - FINAL
2.6 DBS referrals
The GPhC’s Disclosure and Barring Service (DBS) and Disclosure Scotland (DS) Referrals Panel considered 6 matters during this quarter, of which 1 was
referred to DBS (covering England and Wales).
2.7 Appeals
No new appeals were brought during quarter one, and no appeals have been concluded. We currently have 4 ongoing appeals.
Page 12 of 22
Council June 2017 Performance Monitoring Report: end June 2017
2017-09 Council Performance monitoring Report version - FINAL
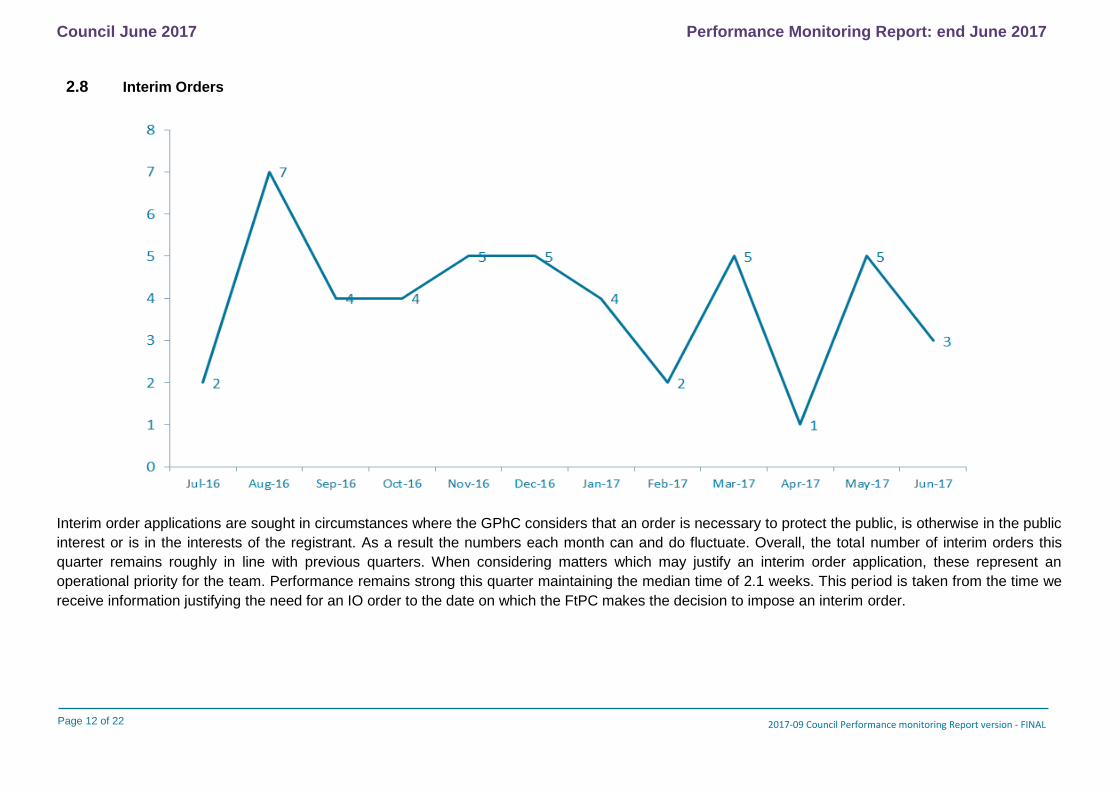
2.8 Interim Orders
Interim order applications are sought in circumstances where the GPhC considers that an order is necessary to protect the public, is otherwise in the public
interest or is in the interests of the registrant. As a result the numbers each month can and do fluctuate. Overall, the total number of interim orders this
quarter remains roughly in line with previous quarters. When considering matters which may justify an interim order application, these represent an
operational priority for the team. Performance remains strong this quarter maintaining the median time of 2.1 weeks. This period is taken from the time we
receive information justifying the need for an IO order to the date on which the FtPC makes the decision to impose an interim order.
Page 13 of 22
Council June 2017 Performance Monitoring Report: end June 2017
2017-09 Council Performance monitoring Report version - FINAL
3. Inspection
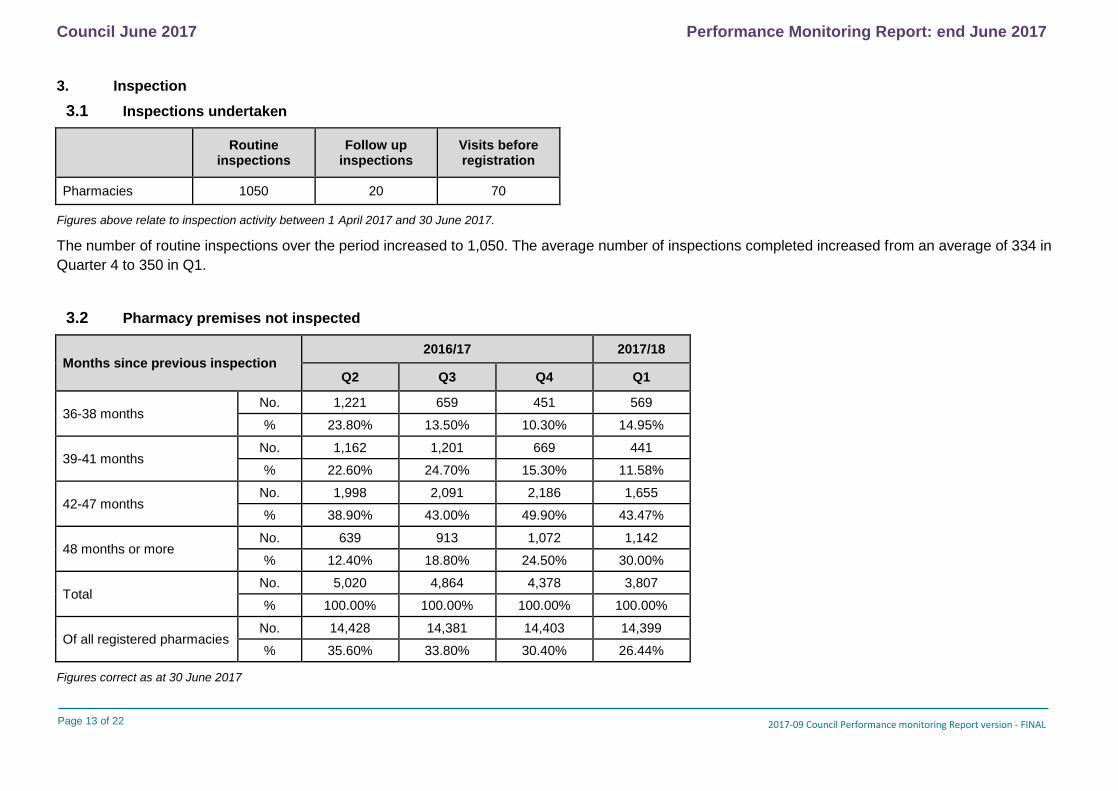
3.1 Inspections undertaken
Routine
inspections Follow up
inspections Visits before registration
Pharmacies 1050 20 70
Figures above relate to inspection activity between 1 April 2017 and 30 June 2017.
The number of routine inspections over the period increased to 1,050. The average number of inspections completed increased from an average of 334 in
Quarter 4 to 350 in Q1.
3.2 Pharmacy premises not inspected
Months since previous inspection 2016/17 2017/18
Q2 Q3 Q4 Q1
36-38 months No. 1,221 659 451 569
% 23.80% 13.50% 10.30% 14.95%
39-41 months No. 1,162 1,201 669 441
% 22.60% 24.70% 15.30% 11.58%
42-47 months No. 1,998 2,091 2,186 1,655
% 38.90% 43.00% 49.90% 43.47%
48 months or more No. 639 913 1,072 1,142
% 12.40% 18.80% 24.50% 30.00%
Total No. 5,020 4,864 4,378 3,807
% 100.00% 100.00% 100.00% 100.00%
Of all registered pharmacies No. 14,428 14,381 14,403 14,399
% 35.60% 33.80% 30.40% 26.44%
Figures correct as at 30 June 2017
Page 14 of 22
Council June 2017 Performance Monitoring Report: end June 2017
2017-09 Council Performance monitoring Report version - FINAL
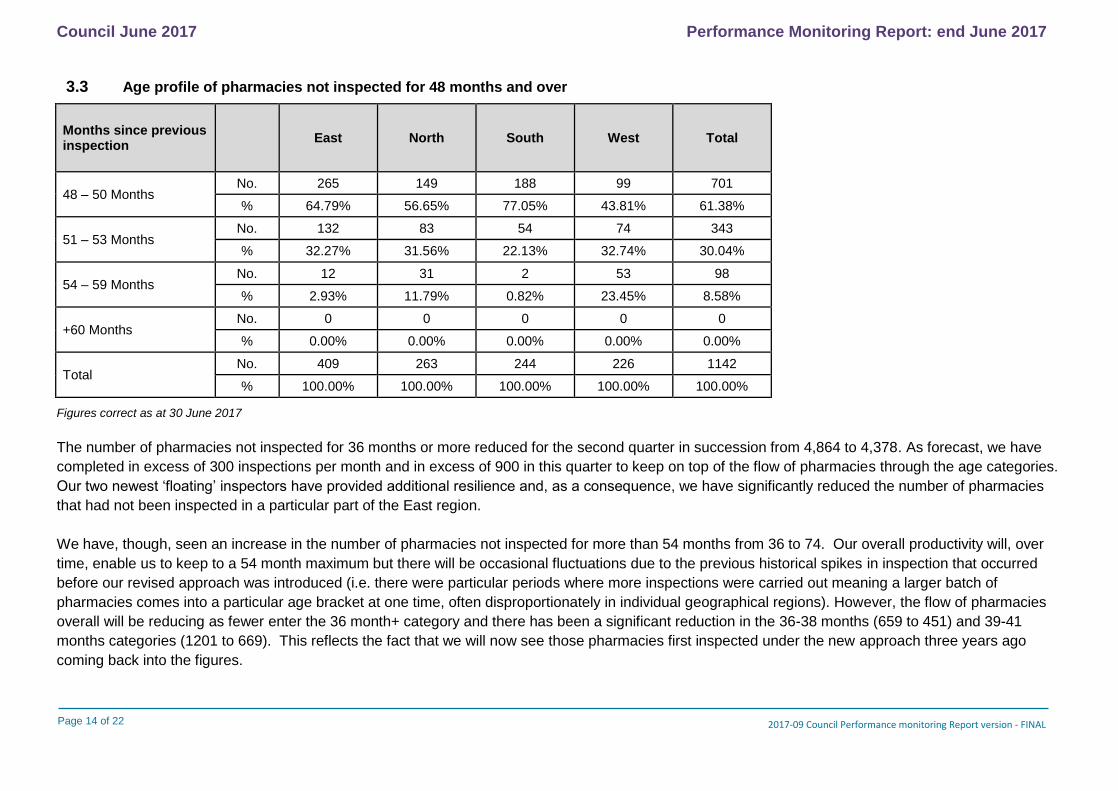
3.3 Age profile of pharmacies not inspected for 48 months and over
Months since previous inspection
East North South West Total
48 – 50 Months No. 265 149 188 99 701
% 64.79% 56.65% 77.05% 43.81% 61.38%
51 – 53 Months No. 132 83 54 74 343
% 32.27% 31.56% 22.13% 32.74% 30.04%
54 – 59 Months No. 12 31 2 53 98
% 2.93% 11.79% 0.82% 23.45% 8.58%
+60 Months No. 0 0 0 0 0
% 0.00% 0.00% 0.00% 0.00% 0.00%
Total No. 409 263 244 226 1142
% 100.00% 100.00% 100.00% 100.00% 100.00%
Figures correct as at 30 June 2017
The number of pharmacies not inspected for 36 months or more reduced for the second quarter in succession from 4,864 to 4,378. As forecast, we have
completed in excess of 300 inspections per month and in excess of 900 in this quarter to keep on top of the flow of pharmacies through the age categories.
Our two newest ‘floating’ inspectors have provided additional resilience and, as a consequence, we have significantly reduced the number of pharmacies
that had not been inspected in a particular part of the East region.
We have, though, seen an increase in the number of pharmacies not inspected for more than 54 months from 36 to 74. Our overall productivity will, over
time, enable us to keep to a 54 month maximum but there will be occasional fluctuations due to the previous historical spikes in inspection that occurred
before our revised approach was introduced (i.e. there were particular periods where more inspections were carried out meaning a larger batch of
pharmacies comes into a particular age bracket at one time, often disproportionately in individual geographical regions). However, the flow of pharmacies
overall will be reducing as fewer enter the 36 month+ category and there has been a significant reduction in the 36-38 months (659 to 451) and 39-41
months categories (1201 to 669). This reflects the fact that we will now see those pharmacies first inspected under the new approach three years ago
coming back into the figures.
Page 15 of 22
Council June 2017 Performance Monitoring Report: end June 2017
2017-09 Council Performance monitoring Report version - FINAL
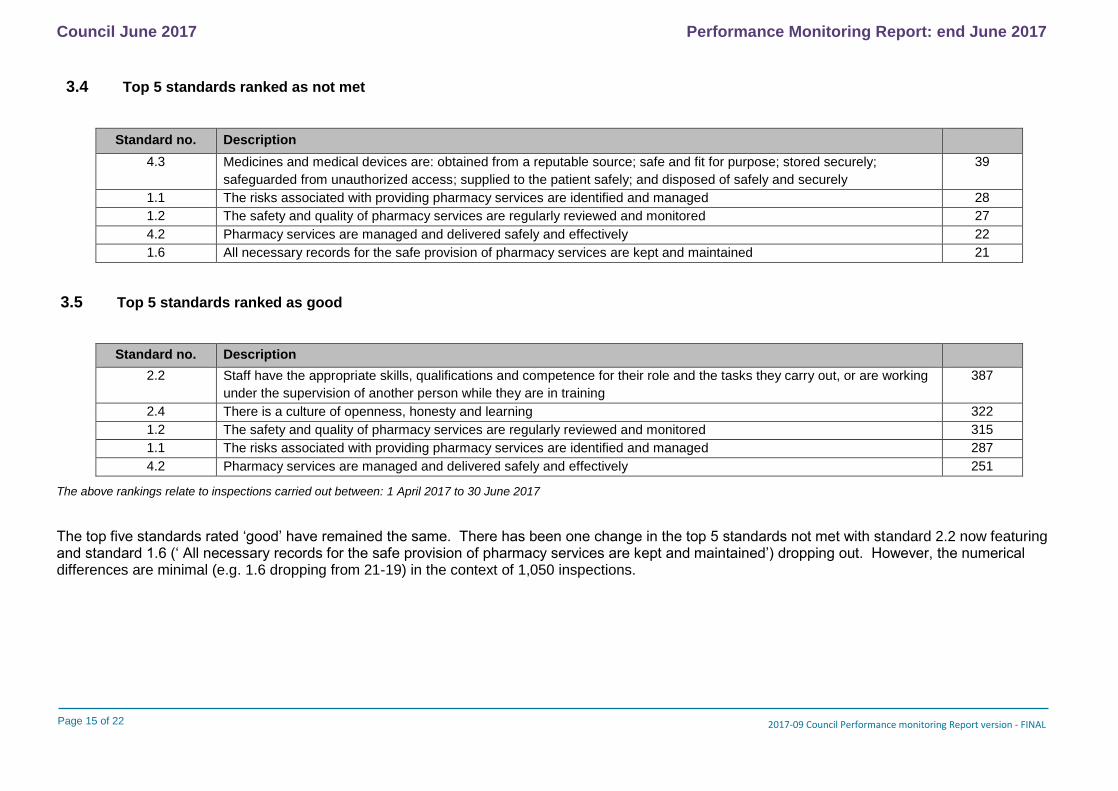
3.4 Top 5 standards ranked as not met
Standard no. Description
4.3 Medicines and medical devices are: obtained from a reputable source; safe and fit for purpose; stored securely;
safeguarded from unauthorized access; supplied to the patient safely; and disposed of safely and securely
39
1.1 The risks associated with providing pharmacy services are identified and managed 28
1.2 The safety and quality of pharmacy services are regularly reviewed and monitored 27
4.2 Pharmacy services are managed and delivered safely and effectively 22
1.6 All necessary records for the safe provision of pharmacy services are kept and maintained 21
3.5 Top 5 standards ranked as good
Standard no. Description
2.2 Staff have the appropriate skills, qualifications and competence for their role and the tasks they carry out, or are working
under the supervision of another person while they are in training
387
2.4 There is a culture of openness, honesty and learning 322
1.2 The safety and quality of pharmacy services are regularly reviewed and monitored 315
1.1 The risks associated with providing pharmacy services are identified and managed 287
4.2 Pharmacy services are managed and delivered safely and effectively 251
The above rankings relate to inspections carried out between: 1 April 2017 to 30 June 2017
The top five standards rated ‘good’ have remained the same. There has been one change in the top 5 standards not met with standard 2.2 now featuring and standard 1.6 (‘ All necessary records for the safe provision of pharmacy services are kept and maintained’) dropping out. However, the numerical differences are minimal (e.g. 1.6 dropping from 21-19) in the context of 1,050 inspections.
Page 16 of 22
Council June 2017 Performance Monitoring Report: end June 2017
2017-09 Council Performance monitoring Report version - FINAL
4. Complaints
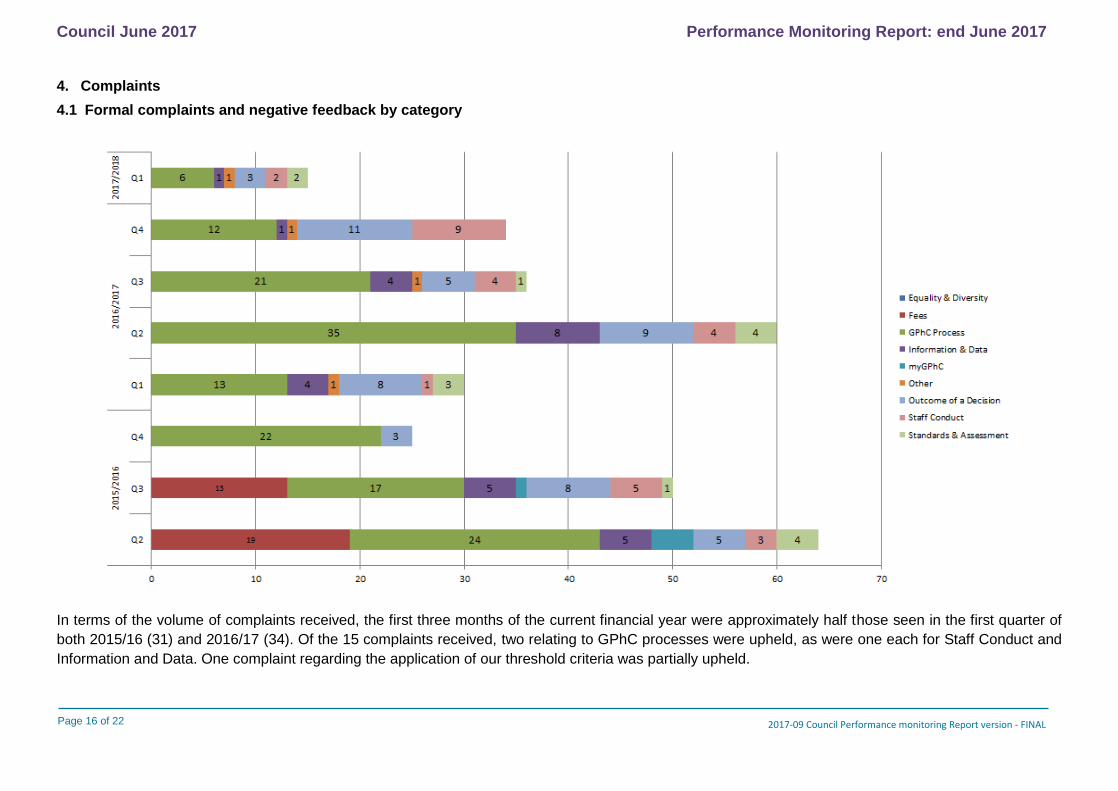
4.1 Formal complaints and negative feedback by category
In terms of the volume of complaints received, the first three months of the current financial year were approximately half those seen in the first quarter of
both 2015/16 (31) and 2016/17 (34). Of the 15 complaints received, two relating to GPhC processes were upheld, as were one each for Staff Conduct and
Information and Data. One complaint regarding the application of our threshold criteria was partially upheld.
Page 17 of 22
Council June 2017 Performance Monitoring Report: end June 2017
2017-09 Council Performance monitoring Report version - FINAL
Whereas the quarter-to-quarter trend at the beginning of the last financial year saw the number of complaints increasing, there were fewer complaints in the
first quarter of 2017/18 than in the final three months of 2016/17. As the most recent complaint numbers are significantly lower than those over the past two
years, additional data is required to assess whether the results form part of new trend or are an anomaly.
As has been the case for the last seven reporting periods, GPhC processes attracted the highest number of complaints between April and June 2017.
However, the number of complaints about process has fallen compared to previous quarters, as have those in the Staff Conduct and Outcome of a
Decision categories. The spread of complaints between categories was broadly more even than has recently been the case. There is now a six-quarter
trend with no complaints received relating to equality and diversity, fees or myGPhC.
Page 18 of 22
Council June 2017 Performance Monitoring Report: end June 2017
2017-09 Council Performance monitoring Report version - FINAL
5. Education
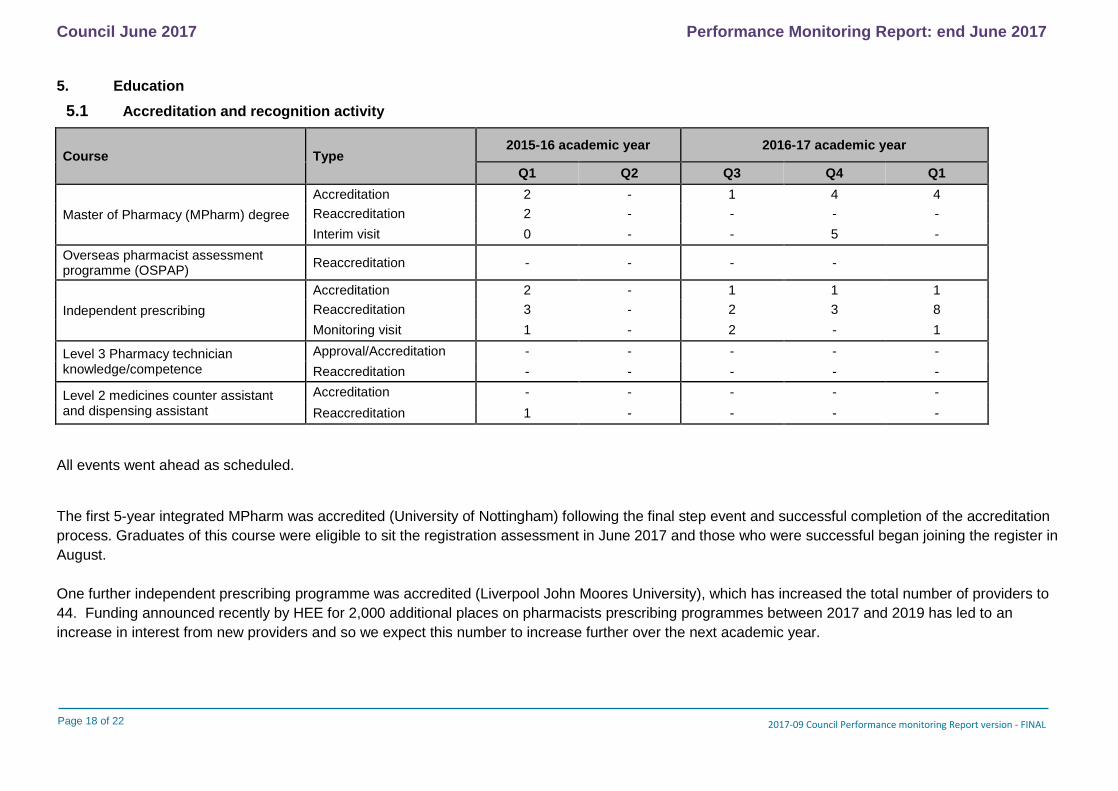
5.1 Accreditation and recognition activity
Course Type 2015-16 academic year 2016-17 academic year
Q1 Q2 Q3 Q4 Q1
Master of Pharmacy (MPharm) degree
Accreditation 2 - 1 4 4
Reaccreditation 2 - - - -
Interim visit 0 - - 5 -
Overseas pharmacist assessment programme (OSPAP)
Reaccreditation - - - -
Independent prescribing
Accreditation 2 - 1 1 1
Reaccreditation 3 - 2 3 8
Monitoring visit 1 - 2 - 1
Level 3 Pharmacy technician knowledge/competence
Approval/Accreditation - - - - -
Reaccreditation - - - - -
Level 2 medicines counter assistant and dispensing assistant
Accreditation - - - - -
Reaccreditation 1 - - - -
All events went ahead as scheduled.
The first 5-year integrated MPharm was accredited (University of Nottingham) following the final step event and successful completion of the accreditation
process. Graduates of this course were eligible to sit the registration assessment in June 2017 and those who were successful began joining the register in
August.
One further independent prescribing programme was accredited (Liverpool John Moores University), which has increased the total number of providers to
44. Funding announced recently by HEE for 2,000 additional places on pharmacists prescribing programmes between 2017 and 2019 has led to an
increase in interest from new providers and so we expect this number to increase further over the next academic year.
Page 19 of 22
Council June 2017 Performance Monitoring Report: end June 2017
2017-09 Council Performance monitoring Report version - FINAL
6. Human Resources
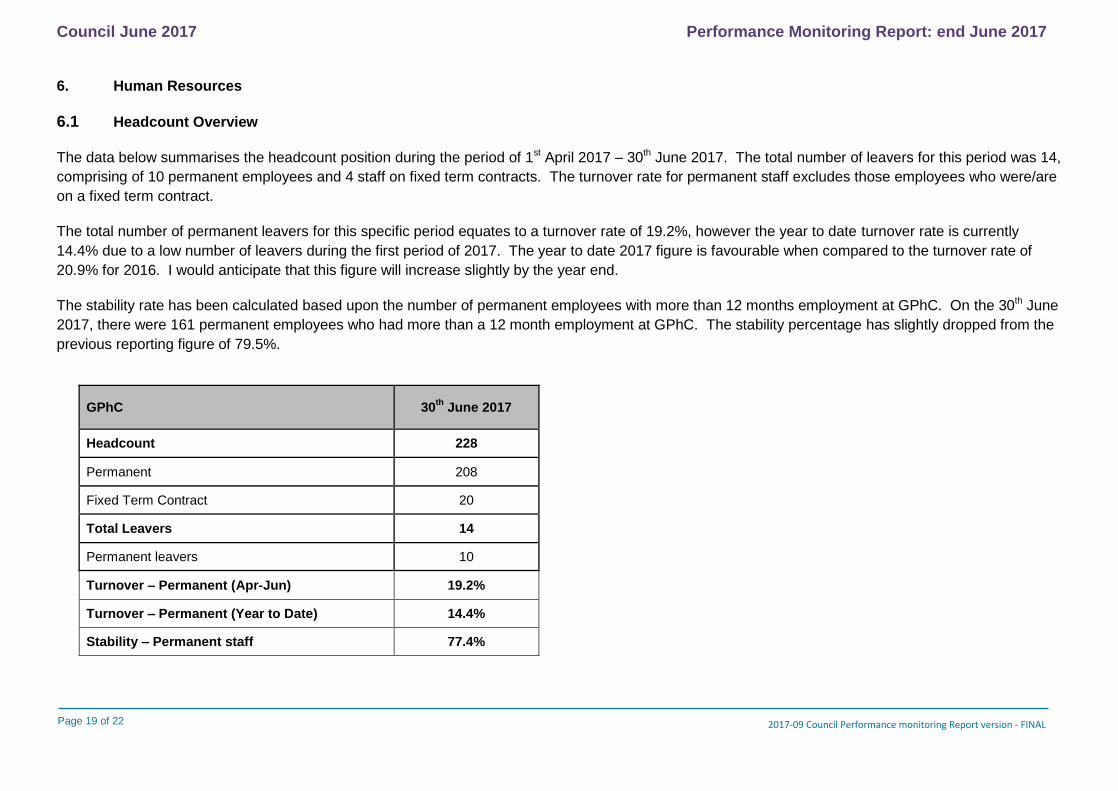
6.1 Headcount Overview
The data below summarises the headcount position during the period of 1st April 2017 – 30th June 2017. The total number of leavers for this period was 14,
comprising of 10 permanent employees and 4 staff on fixed term contracts. The turnover rate for permanent staff excludes those employees who were/are
on a fixed term contract.
The total number of permanent leavers for this specific period equates to a turnover rate of 19.2%, however the year to date turnover rate is currently
14.4% due to a low number of leavers during the first period of 2017. The year to date 2017 figure is favourable when compared to the turnover rate of
20.9% for 2016. I would anticipate that this figure will increase slightly by the year end.
The stability rate has been calculated based upon the number of permanent employees with more than 12 months employment at GPhC. On the 30th June
2017, there were 161 permanent employees who had more than a 12 month employment at GPhC. The stability percentage has slightly dropped from the
previous reporting figure of 79.5%.
GPhC 30th
June 2017
Headcount 228
Permanent 208
Fixed Term Contract 20
Total Leavers 14
Permanent leavers 10
Turnover – Permanent (Apr-Jun) 19.2%
Turnover – Permanent (Year to Date) 14.4%
Stability – Permanent staff 77.4%
Page 20 of 22
Council June 2017 Performance Monitoring Report: end June 2017
2017-09 Council Performance monitoring Report version - FINAL
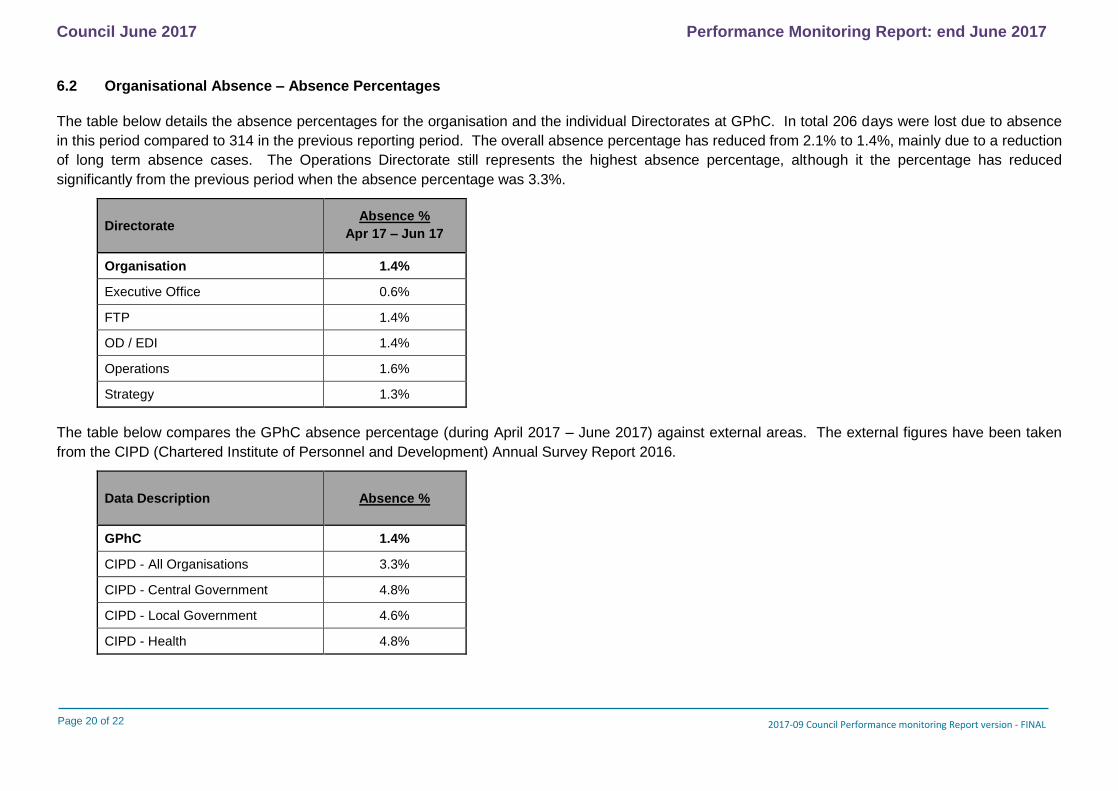
6.2 Organisational Absence – Absence Percentages
The table below details the absence percentages for the organisation and the individual Directorates at GPhC. In total 206 days were lost due to absence
in this period compared to 314 in the previous reporting period. The overall absence percentage has reduced from 2.1% to 1.4%, mainly due to a reduction
of long term absence cases. The Operations Directorate still represents the highest absence percentage, although it the percentage has reduced
significantly from the previous period when the absence percentage was 3.3%.
Directorate Absence %
Apr 17 – Jun 17
Organisation 1.4%
Executive Office 0.6%
FTP 1.4%
OD / EDI 1.4%
Operations 1.6%
Strategy 1.3%
The table below compares the GPhC absence percentage (during April 2017 – June 2017) against external areas. The external figures have been taken
from the CIPD (Chartered Institute of Personnel and Development) Annual Survey Report 2016.
Data Description Absence %
GPhC 1.4%
CIPD - All Organisations 3.3%
CIPD - Central Government 4.8%
CIPD - Local Government 4.6%
CIPD - Health 4.8%

Page 21 of 22
Council June 2017 Performance Monitoring Report: end June 2017
2017-09 Council Performance monitoring Report version - FINAL
6.3 Employee Relations
The table below is a summary of the Employee Relation cases by case type which were closed during the specified period:
Case Type No. of cases
Total Cases 10
Absence 1
Disciplinary 1
Flexible Working 1
Grievance 2
Performance 2
Other 3
There were in total 10 employee relation cases in the second period of 2017. This included a wide range of cases ranging from a redundancy to
performance. There were 2 dismissals in this period and 8 cases which were resolved at the informal stage.
The number of cases continues to be higher than 2016. We believe there are several contributing factors previously reported are still relevant:
New HR Policies and Procedures were introduced at the beginning of 2017.
Management training sessions were successfully rolled out in this period, increasing line manager confidence in tackling people issues.
The HR team has been recently restructured and as a result is focused towards partnering with the organisation and supporting line managers.
Page 22 of 22
Council June 2017 Performance Monitoring Report: end June 2017
2017-09 Council Performance monitoring Report version - FINAL
6.4 Summary
The headcount has increased from the last reported figure of 220 which was taken at the end of March 2017. On the 30th June 2017 the headcount was in
total 228. The reason this may be attributed to additional establishment increases in IFTP and Operations. 8 additional roles we added to the
establishment during this period.
The turnover figure for this period was 19.2%. This figure was anticipated as there were a high number of known leavers during this period which included
a planned retirement and a redundancy. The ‘with or without regret’ measure was also introduced and should provide some assurance in that only 40% of
leavers for this period were with regret.
The GPhC absence percentages compare favourably against the CIPD data however under recording of absence still remains a concern. The HR team
will continue to drive this issue and raise awareness through meetings and the provision of absence data.
The learning and development provision continues to pick up pace at GPhC with planned management training in the next period focused on Recruitment
Training and Equality, Diversity and Inclusion awareness. We have also recently appointed Leila Mikail as our new Learning and Development Manager.
This appointment will help provide the added focus to our learning and development agenda.
6.5 Looking Ahead
The HR team are about to release the next set of HR Quarterly Reports, covering the second quarter of 2017. The HR team are proactively using this data
to work in partnership with line managers in tackling areas of concern within employee relations, turnover and absence.