Embed Size (px)
Citation preview
The Pennsylvania State University
The Graduate School
College of the Liberal Arts
PERFORMANCE MONITORING AND TEMPERAMENTAL FEARFULNESS AS INDICES OF RISK FOR ANXIETY
DURING PRESCHOOL
A Dissertation in
Psychology
by
Rebecca J. Brooker
© 2011 Rebecca J. Brooker
Submitted in Partial Fulfillment of the Requirements
for the Degree of
Doctor of Philosophy
May, 2011
ii
The dissertation of Rebecca J. Brooker was reviewed and approved* by the following: Kristin A. Buss Associate Professor of Psychology Dissertation Adviser Chair of Committee Pamela M. Cole Professor of Psychology Lisa M. Gatzke-Kopp Assistant Professor of Human Development
Rick O. Gilmore
Associate Professor of Psychology
Jenae M. Neiderhiser
Liberal Arts Research Professor Psychology
Professor of Human Development and Family Studies
Melvin M. Mark
Professor of Psychology
Head of the Department of Psychology
iii
ABSTRACT
The current study was designed to examine neurophysiological processes of performance
monitoring that have been suggested as a mechanism of risk for the development of anxiety in early
childhood. Children who were putatively at risk for anxiety problems based on early temperamental
fearfulness were compared with low-fear children. In addition, two aspects of feedback were examined
as possible modulators of response monitoring: social and nonsocial feedback. Forty children were
tested using a modified flanker paradigm when they were 4.5 years of age. Accuracy and reaction time
measures were assessed along with affective behaviors during the laboratory visit and event-related
potentials linked with performance monitoring.
Results suggested that two performance monitoring event-related potentials, the error-related
negativity (ERN) and error positivity (Pe) were present in children at age 4½, much earlier than has been
seen in previous research. Although ERN and Pe amplitudes did not differ for high-fear and low-fear
children, the distribution of the ERN in high-fear children was more frontal than for low-fear children.
This type of distribution is in line with previous theories suggesting that at-risk children show adult-like
ERN earlier than children who are not at risk. In contrast, Pe amplitudes were more posterior for high-
fear than for low-fear children. In addition, ERN was related to observed and parent-reported behaviors
indicating better behavioral control only for low-fear children. Feedback condition was unrelated to fear
status, parent-reported temperament, and observed behaviors.
Overall, results suggest that the ERN and Pe are present much earlier in development than
previously thought. Findings are presented in the framework of individual differences in performance
monitoring and depicting early risk for disorder. Several avenues for future research are implicated,
including the need to disentangle heterogeneous facets of risk and the development of response
monitoring throughout childhood.
iv
TABLE OF CONTENTS
LIST OF APPENDICES……………………………………………………………………………………………..………………….…v
ACKNOWLEDGMENTS………………………………………………………………………………………………………………… vi
Chapter
1. Introduction.…………………….……………………………………………………………………………………..…………….1
2. Method..……………………………………………………………………………………………………………………………….12
3. Results………………..….…………………………………………………………………………………………………………….21
4. Discussion………………..….…………………………………………………………..…………………………………………..28
REFERENCES………………………………………………………………………………..………………………………………………..41
APPENDICES………………………………………………………………………………...…………………………………..…………..51
v
LIST OF APPENDICES
APPENDIX A: Tables………………………………………..………………………………………………………………………….51
APPENDIX B: Figures………………………………………..………………………………………………………………………….56
APPENDIX C: Twenty-four-month Laboratory Visit
Twenty-four-month Visit Laboratory Tasks………………………………………………………………………….62
APPENDIX D: Fifty-four-month Affect
Behavior Rating Scale………………………………………………………………………………………………………….65
Global Coding……………………………………………………………………………………………………………………..67
APPENDIX E: Fifty-four-month Parent-Report Questionnaire Measures
General Information Questionnaire (Demographics)……………………………………….………………….69
Child Behavior Questionnaire (age 48 months)……………………………………………………………………71
vi
ACKNOWLEDGMENTS
One of the many lessons that I have learned throughout my graduate school career is that it is a
rare graduate student who has the opportunity to work with a mentor who provides not only a high
degree of intellectual stimulation and rigorous research training; but also support, encouragement, and
interest that helps a student to grow as a person. It has been my tremendous good fortune to have
received this type of high-quality mentorship in my years of training with Dr. Kristin Buss, who has given
me a solid foundation in developmental psychology, psychobiology, and emotion research along with
the personal courage and confidence to carve a path of my own. Both geographically and academically,
she has taken me many miles; I am eternally grateful.
This research would not have been possible without the dedicated participation of the children
and families who continue to be an integral part of our laboratory. I am additionally grateful to Jeremy
Armstrong for his help with recruitment and scheduling and to Lucia Parry for all of the assistance she
provided in data preparation. In addition, I am forever grateful to the current and former members of
the Emotion Development Lab for all of the intellectual support, encouragement, and friendship that
they have provided to me over the years. I also wish to thank the Social, Life Sciences, and Engineering
Imaging Center as well as the College of the Liberal Arts for their financial support as well as to my
committee for their invaluable input over the course of this project.
Finally, I am forever indebted to my family, who has provided so many years of unwavering
support, encouragement, and guidance. To my parents, who were my very first and most dedicated
mentors, I offer my heartfelt gratitude for the many hours spent on homework, class projects, reports,
study guides, and phone calls that were deeply appreciated but too often went unacknowledged. For all
of the times that they promised me that if I did my best, things would turn out fine, I dedicate this
culmination of work in the hopes that my best continues to make them proud.
1
Chapter 1: Introduction
Precursors to anxiety disorders represent heritable vulnerabilities that have become the foci of
mounting empirical work aimed at identifying biological markers of risk for mental illness (e.g., Patrick &
Bernat, 2010; Olvet & Hajcak, 2008). While anxiety is clearly influenced by multiple processes, robust
findings from previous research have led to a focus on the risk factors of temperamental fearfulness and
processes of cognitive control (e.g., performance monitoring) in the developmental psychopathology
and neuroscience domains, respectively.
From a public health perspective, conducting this work in early childhood populations would
compound its possible benefits. Approximately 20% of children in the general population endorse
anxious symptoms by adolescence (Bell-Dolan, Last, & Strauss, 1990); with prevalence estimates for
anxiety disorders ranging from 12 – 21% in children under age 17 (Gurley, Cohen, Pine, & Brook, 1996;
Shaffer et al, 1996), anxiety disorders are some of the most prevalent and pervasive psychological
problems in children. Despite a crucial need to understand early biomarkers of vulnerability for
psychopathology in order to prevent mental illness across the lifespan (Bosquet & Egeland, 2006), this
type of work is rarely conducted with young children.
Thus, before programs of prevention, intervention, and treatment can truly reap the benefits of
identifying biomarkers of anxiety risk, a host of basic scientific questions need to be addressed.
Empirical work must ascertain the degree to which the same candidate biomarkers can be identified in
adults and children and the degree to which putative biomarkers are associated with other known
precursors to anxiety. To this end, the current study was aimed at addressing gaps in the literature by
determining whether neural measures of performance monitoring - purported markers of anxiety risk -
are visible in early childhood and the ways that performance monitoring is associated with another
known risk factor for anxiety, temperamental fearfulness.
Anxiety, Fearfulness, and Performance Monitoring
2
Cognitive models of anxiety implicate the cognitive control of attention as an important
mechanism by which anxious symptoms may be conferred and maintained over time (Mathews &
Mackintosh, 1998; Mogg & Bradley, 1998; Williams, Watts, MacLeod, & Mathews, 1988).
Developmental studies have similarly identified aspects of cognitive control as mechanisms by which
early risk factors, such as temperamental fearfulness in infancy, may manifest in both subclinical and
clinical levels of anxiety by the adolescent years (McDermott et al., 2009; Pérez-Edgar, Bar-Haim, Martin
McDermott, Chronis-Tuscano, Pine, & Fox, 2010; Pérez-Edgar et al., 2010b). As definitions of cognitive
control tend to be broad, work by Van Veen and Carter (2006) has been particularly useful in parsing
cognitive control into two primary components. The first is an evaluative component, which is linked to
performance monitoring and is attuned to the detection of worse-than-anticipated outcomes. This facet
of cognitive control is believed to rely on neural substrates in the medial frontal lobe such as the
Anterior Cingulate Cortex (ACC). The second is an executive component, which responds to such
outcomes by implementing behavioral changes to enhance subsequent performance. This aspect of
cognitive control is closely tied to areas of the lateral frontal cortex. Although this report is focused on
the monitoring aspect of cognitive control, it is important to note that these systems are not entirely
independent. Rather, they work in concert as part of an integrated network of cognitive control
(Gehring & Knight, 2000; Ullsperger, vonn Cramon, & Müller, 2002).
Additional arguments have contended that anxious individuals are inclined to acutely monitor
their own performance, identifying performance monitoring as one possible mechanism of anxiety risk.
Attention Control Theory (Eysenck & Calvo, 1992; Eysenck, Derakshan, Santos, & Calvo, 2007) asserts
that concerns over evaluation and failure, particularly when evaluations are social in nature (Clark &
Arkowitz, 1975), represent an anxious state that interferes with cognitive processing (Borkovec, 1994).
In fact, anxiety in children, even at non-clinical levels, has been known for several decades to impact
reflection on performance and subsequent behavior (e.g., Messer, 1970). Recent work has extended
3
these findings by showing similar links between early temperamental fearfulness and concern over
performance in older children (McDermott et al., 2009) as part of a trajectory toward anxiety.
Another rationale linking performance monitoring to fearfulness stems from the perspective
that, like other processes of cognitive control, error monitoring is a form of self-regulation. Disruptions
in self-regulatory processes are associated with risk for psychopathology from early in childhood (Cole,
Zahn-Waxler, Fox, Usher, & Welsh, 1996; Thompson & Calkins, 1996) and these processes are visible at
the neural level (Davidson, Abercrombie, Nitschke, & Putnam, 1999). As previously indicated, the bulk
of studies of children who are believed to be at heightened risk for anxiety have occurred in the
temperament domain and concentrated on children believed to be at risk based on high levels of
temperamental fear (Biederman et al., 1993; 2001; Buss, in press; Kagan, 1994) and shyness (Volbrecht
& Goldsmith, 2010). As early as infancy, these children show propensities for dysregulated behaviors
including behavioral withdrawal, high levels of fear, extreme shyness, and inhibition in social contexts.
Thus, it is plausible that the biological underpinnings associated with early temperamental fearfulness
and anxiety risk, including characteristic patterns of neural activation, are already in place early in life
(Buss, Davidson, Kalin, & Goldsmith, 2004; Buss, Schumacher, Dolski, Kalin, Goldsmith, & Davidson,
2003; Fox, Henderson, Marshall, Nichols, & Ghera, 2005; Kagan & Snidman, 1999; Schwartz, Snidman, &
Kagan, 1999).
Given increasing focus on developing programs to prevent psychological disorders and promote
mental health, it is perhaps not surprising that interest in studying the link between specific processes,
like performance monitoring, and temperamental fearfulness in children is rising. Although high
temperamental fearfulness is a long-known risk factor for anxiety problems (Kagan, 1994; Biederman et
al., 1993; 2001), it is well established that not all fearful children develop anxiety disorders. A promising
method for examining whether performance monitoring may serve as a mechanism of risk for fearful
children involves examining this process at the neural level. This can be done via electroencephalograph
4
(EEG) recordings of neural activity that are segmented to discrete events during some performance task.
Averaged together, these segmented recordings form event-related potentials (ERPs). The ERP
technique is a promising method for a study of performance monitoring and fearfulness given that
performance-monitoring components are already well established in the adult ERP literature. Yet,
despite their utility, performance-monitoring ERPs are rarely used in research with children. Historically,
EEG and ERP methods have involved time-consuming and somewhat unpleasant procedures, such as
scalp abrasion, and offered little in the way of paradigms that could be used during childhood.
However, advances like the increase in developmentally appropriate laboratory tasks now allow EEG
and ERP data to be collected easily and noninvasively throughout nearly the entire lifespan. Given the
potential benefits of isolating performance-monitoring ERPs in children to study mechanisms of risk-
related processes, a goal of the current study was to assess the feasibility of studying links between
performance-monitoring ERPs and fearfulness in a sample of young children.
ERP Components of Performance Monitoring
A great deal of EEG work with children has used asymmetric alpha power in the right frontal
lobe as a marker for associations between anxiety risk and dysregulated emotion behaviors such as high
levels of negative affect and withdrawal (e.g., Buss et al., 2003; Fox et al., 2005). Using task-related ERPs
in place of continuous EEG for such investigations can expand the extant literature by focusing on
specific cognitive processes that underlie risk for anxiety early in life. However, little work has used ERPs
in this way in samples of young children.
The error-related negativity (ERN) is an ERP component that is time locked to the participant’s
response and believed to index performance monitoring. The ERN is typically seen 50 to 100 ms
following an incorrect behavioral response, with maximum amplitude at frontocentral midline scalp
recording sites (Dehane, Posner, & Tucker, 1994; Falkenstein, Hohnsbein, Hoormann, & Blanke, 1991;
Gehring, Gross, Coles, Meyer, & Donchin, 1993). The ERN is believed to reflect activation in the ACC
5
(Dehane et al., 1994; Gehring et al., 2000; Luu, Tucker, Derryberry, Reed, & Poulsen, 2003; van Veen and
Carter, 2002), which shows increased activity under conditions requiring cognitive control relative to
neutral conditions (Luu & Pederson, 2004; Posner & Rothbart, 2000). Along with performance
monitoring, the ERN is believed to capture aspects of error detection (Falkenstein et al., 1990; 1991),
conflict detection (Botvinick et al., 2001), reinforcement learning (Holroyd & Coles, 2002), emotion
processing (Luu & Pederson, 2004), and motivation (Gehring & Willoughby, 2002). In general, the ERN
does not appear to be dependent on conscious recognition of errors; in fact, an ERN has been detected
on correct trials for which participants were uncertain about their performance (Pailing & Segalowitz,
2004; Scheffers & Coles, 2000). Thus, the ERN likely reflects a general process of performance
monitoring (Falkenstein et al., 2000), one aspect of which is error detection.
A second index of performance monitoring is the error positivity (Pe), a positive-going slow
wave in the ERP waveform that follows the ERN (Falkenstein et al., 1991; Leuthold & Sommer, 1999) and
is also related to activity in the ACC (van Veen & Carter, 2002). The Pe has a slightly more posterior
scalp distribution than the ERN and is thought to reflect more conscious processes of performance
monitoring and error detection (Falkenstein, Hohnsbein, Hoormann, & Blanke, 1991; Falkenstein,
Hoormann, Christ, & Hohnsbein, 2000; Nieuwenhuis, Ridderinkkhof, Blom, Band, & Kok, 2001). The Pe is
an understudied component of performance monitoring and its exact function is still uncertain (Arbel &
Donchin, 2011; Overbeek, Nieuwenhuis, & Ridderinkhof, 2005). However, links between Pe and
conscious processing has been supported by work showing that Pe amplitudes are associated with post-
error slowing during response time tasks (Hajcak, McDonald, & Simons, 2003; Luu, Flaisch, & Tucker,
2000; Nieuwenhuis et al., 2001).
In recent work, the ERN has been discussed as a putative biological marker of risk for the
development of anxiety disorders, with some evidence present as early as adolescence (e.g., Ladouceur
et al., 2004; 2005; McDermott et al., 2009; Olvet & Hajcak, 2008). Correlates of anxiety risk in adults,
6
including negative emotionality (Tucker, Hartry-Speiser, McDougal, Luu, & deGrandpre, 1999),
overcontrolled (Gehring et al., 2000; Hajcak & Simons, 2002), and anxious (Hajcak, McDonald, & Simons,
2004; Ladouceur et al., 2004; 2006) behaviors have been linked to a greater ERN response. Only a few
studies have examined these associations in children, but this work has largely replicated findings with
adults. A greater ERN has been linked with both less efficient attention processing between 4 and 8
years of age (Brooker, Buss, & Dennis, 2011) and also a more overcontrolled behavioral style in late
childhood (age 10 years; Santesso, Segalowitz, & Schmidt, 2005; 2006).
Temperament studies have begun to recognize the utility of the ERN in predicting risk for
anxiety problems. Stably inhibited children showed more negative ERN amplitudes during adolescence
than unstably or noninhibited children (McDermott, Perez-Edgar, Henderson, Chronis-Tuscano, Pine, &
Fox, 2009). Furthermore, a history of childhood behavioral inhibition combined with more negative ERN
amplitudes in adolescence was linked to greater odds of being diagnosed with an anxiety disorder than
those with only a history of inhibition.
In work with a clinical sample of older children, anxious individuals between 8 and 14 years of
age had greater ERN during a flanker task relative to nonanxious children (Ladouceur, Dahl, Birmaher,
Axelson, & Ryan, 2006). Conversely, a smaller ERN (Steiben, Lewis, Granic, Zelazo, Segalowitz, & Pepler,
2007) has been observed in children who are prone to externalizing behavior problems, though these
results are not entirely consistent.
There is also some evidence that the Pe may be associated with indicators of anxiety risk in
adulthood (Gehring et al. 2000; Hajcak & Simons, 2002), including negative affect (Hajcak, McDonald, &
Simons, 2004) and affective motivation (Santesso et al., 2006). However, results are not consistent
across studies (e.g., Hajcak et al., 2008; Santesso et al., 2005). Work with children and adolescents
documented seemingly large differences in Pe waveforms suggesting a link between a more positive Pe
and anxious symptoms; however, these differences did not achieve statistical significance (Ladouceur et
7
al., 2006; McDermott et al., 2009). Similar to the ERN, attenuated Pe has been linked to externalizing
disorders, such as attention-deficit hyperactivity disorder, or ADHD (Jonkman, van Melis, Kemner, &
Markus, 2007).
In sum, individual differences in error monitoring, marked by ERPs, have been linked to risk for
the development of anxiety. Although investigations linking error monitoring with facets of anxiety risk
have largely been conducted with adult samples, temperament research suggests that risk mechanisms
may be in place much earlier in life. While elucidating the process by which risk becomes disorder
would necessitate work with large, longitudinal samples, an important first step will be to assess
whether the links among ERN, Pe, and facets of risk such as temperamental fearfulness are in place early
in life. Therefore, the current study provides a cross-sectional examination both of the presence of ERN
and Pe in a sample that includes highly fearful preschoolers and also of the degree to which ERN and Pe
in highly fearful children are distinct from these same components in their low-fear peers.
Age-related Changes in ERP Components
For the reasons stated above, work with older children and adults implicates a need for tests of
the associations between performance monitoring and temperamental fearfulness, and it is essential
that such work acknowledges the possibility that these components develop over time. That is, adult
studies of the ERN and Pe cannot necessarily assume that neural components of performance
monitoring will look or function identically in adults and in young children. To this end, research
examining age-related changes in performance-monitoring components using cross-sectional designs
was invaluable for informing the current study. To be sure, truly capturing the developmental course of
the ERN and Pe will require future work employing large samples and longitudinal designs. Yet, given an
absence of these studies in the current literature, research that has approximated development using
age-related differences in performance-monitoring ERPs represents the best information that is
currently available. These studies are reviewed below.
8
Initially believed not to be visible in children younger than 12 years of age (Davies, Segalowitz, &
Gavin, 2004), both the ERN and Pe have now been elicited in children as young as 4 to 7 years of age
(Brooker et al., 2011; Torpey, Hajcak, & Klein, 2009; Wiersema, van der Meere, & Roeyers, 2007). The
distribution of the ERN in children of these ages has largely replicated adult work, with maximum
amplitudes appearing at frontocentral sites, although young children show more broadly distributed
ERN and increased neural activity in more posterior regions than has typically been seen in older
children (Brooker et al., 2011; Hogan, Vargha-Khadem, Kirkham, & Baldeweg, 2005; Torpey, Hajcak, &
Klein, 2009). The amplitude of the ERN generally increases as children age and mature, though
amplitudes of younger children tend to be more variable than those in older children (Davies,
Segalowitz, & Gavin, 2004; Kim, Iwaki, Imashioya, Uno, & Fujita, 2007; Ladouceur, Dahl, & Carter, 2006)
and some studies report no are-related differences (Hogan et al., 2005; Eppinger et al., 2009; Wiersema
et al., 2007). Changes in amplitude are likely linked to the maturation of the ACC, which is occurring
throughout childhood and adolescence (Adleman et al., 2002; Caviness, Kennedy, Richelme,
Rademacher, & Fillipek, 1996; Van Bogaert, Wikler, Damhaut, Szliwowski, & Goldman, 1998).
In contrast to the ERN, the Pe generally shows little age-related change over time (Davies et al.,
2004; Wiersema et al., 2007), perhaps due to a less-protracted period of maturation. Though based on
only a few studies, past work supports the notion that the ERN and Pe are linked, but reflect
independent components of the error-monitoring system. More work will need to be done with both
the ERN and Pe to elucidate the nature and impact of differences between these components.
Arguably, the most informative studies for pinpointing the putative role of ERPs as biomarkers
of anxiety risk have attempted to examine components across development. In work conducted with
adolescents, the ERN was shown to be greater (i.e., more negative) in a group of individuals who met
diagnostic criteria for an anxiety disorder relative to non-anxious controls (Ladouceur et al., 2006). Such
a finding is of particular interest to developmentalists given that previous research had not observed an
9
ERN in children until mid to late adolescence (Davies et al., 2004; Ladouceur, Dahl, & Carter, 2007). The
authors suggested that this implicated a more “adult-like ERN amplitude” (p. 1077) in anxious
adolescents. An implication of this finding is that the ERN is not only greater in anxious adolescents, but
may also be earlier developing in at risk populations, such as fearful children. This possibility was
explored in the current study by comparing ERN in children who were high in early fearfulness to a
group of same-aged children who were low in early fearfulness.
Anxiety, Feedback, and Social Evaluation
Given a general over concern about their performance, it is perhaps not surprising that shy and
anxious individuals have also demonstrated a sensitivity toward threatening and potentially punishing
information (Hardin, Perez-Edgar, Guyer, Pine, Fox, & Ernst, 2006; Monk & Pine, 2004). These effects
are particularly pronounced when evaluations are social in nature (Davidson, Marshall, Tomarken, &
Henriques, 2000; Monk & Pine, 2004). This same pattern is seen in children. Although worry and
fearfulnss of social evaluation increase over time as a part of normative development, steep increases in
fears of social social-evaluation are linked to a risk for the development of anxiety problems
(Westenberg, Drewes, Goedhart, Siebelink, & Treffers, 2004).
The impact of trial-to-trial feedback in ERN studies with adults is mixed. The ERNs of anxious
adults has been reported as smaller (Nieuwenhuis, Nielen, Mol, Hajcak, & Veltman, 2005) or unchanged
(Olvet & Hajcak, 2009) in feedback relative to nonfeedback conditions. However, it is also possible that
introducing trial-to-trial feedback emphasis task performance, which is known to enhance ERN
amplitudes (Gehring et al., 1993). However, none of this work has considered the possibility that the
type of feedback may modulate links between ERN and performance. Moreover, the impact of trial-to-
trial feedback on the Pe has been almost entirely ignored. However, the Pe may be prove to be of
additional importance given that it is believed to originate in the ventral striatum, which is strongly
10
linked to both reward/punishment and social processing systems (Ernst et al., 2004; Knutson, Adams,
Fong, & Hommer, 2001).
As is the case for ERP studies in general, investigations of the impact of trial-to-trial feedback in
studies with children are sparse. One unpublished study in a sample of children between 6 and 8 years
of age suggested that the Pe, rather than the ERN, was amplified by trial-to-trial feedback (Martin
McDermott, 2008). Work on other mediofrontal negativities has produced similar results suggesting
that a greater sensitivity to negative feedback is linked to amplified ERP responses (e.g., FRN: Crowley,
Wu, Crutcher, Bailey, Lejuez, & Mayes, 2009). Again, however, studies have not investigated whether
the use of socially-oriented feedback rather than nonsocial feedback might enhance children’s ERN or Pe
responses. Thus, a final exploratory goal of the current study was to compare the ERN and Pe elicited in
a nonsocial feedback condition with the ERN and Pe elicited in a social feedback condition.
The Current Study
In sum, the extant literature has suggested that a mechanism of cognitive control, performance
monitoring, may be important in shaping the developmental trajectories by which early facets of risk for
anxiety problems, such as temperamental fearfulness, lead to clinical disorders. Research with adults
has suggested that heightened performance monitoring, relative to controls, may be a plausible marker
of risk for disorder and work with adolescents has suggested that heightened performance monitoring
compounds the risk associated with high levels of temperamental fear. To provide a foundation for this
research in children, the current study was designed to examine links between two neural markers of
performance monitoring (i.e., ERN and Pe) and early temperamental fearfulness, along with related
measures of self-regulation, in early childhood.
Overall, the current study was designed to expand the extant literature in three important ways.
First, it was designed to replicate previous work showing that the ERN and Pe can be elicited in children
as young as age 4. It was hypothesized that with the use of a developmentally-appropriate task,
11
children who were 4.5 years of age would, like adults, show larger negative activity for error relative to
correct trials (i.e., ERN) and greater positive activity for error relative to correct trials at the neural level
(i.e., Pe; Hypothesis 1). However, similar to past work, it was expected that ERN and Pe in these children
would be more broadly distributed than is typically seen with adults.
Second, the current study was designed to test whether individual differences associated with
temperamental fearfulness would be linked to the ERN and Pe. It was hypothesized that children who
were high in early fearfulness would show a more well-developed (i.e., more negative, more anterior)
ERN than low fear children (Hypothesis 2). However, consistent with past research, this difference was
not expected for the Pe (Hypothesis 3). Furthermore, individual differences in performance monitoring
were expected to be linked to both observed and parent-reported behaviors thought to mark self-
regulation during the preschool years. Specifically, greater ERN was expected to be associated with
greater levels of fear and shyness as well as greater behavioral control (Hypothesis 4).
Finally, the current study includes an exploration of the extent to which social feedback might
impact amplitudes of the ERN and Pe responses. To do this, two separate feedback conditions were
introduced: a social feedback condition and a nonsocial feedback condition. If, as the literature implies,
it is the case that children who are at risk for anxiety are more sensitive to social feedback, then
performance-monitoring components are expected to be amplified in the social feedback condition for
children for temperamentally fearful children relative to nonfearful children. This set of analyses is
largely exploratory given that the existence of group differences in performance monitoring for high fear
and low fear children has not yet been established.
12
Chapter 2: Method
Participants
Participants for the current study were selected from a larger study of toddler temperament.
The parent project was aimed at examining socioemotional adjustment in children from age 24 months
through school entry. Participants for the parent study were recruited via mailings sent to families
identified through local birth records. Parents who expressed interest in participating completed a set
of screening questionnaires when children were 18 months of age. Families were oversampled for
toddlers who showed high levels of fear and wariness early in life. One-hundred and twenty-five
toddlers participated in laboratory assessments at when children were 24 months and 42 months of age.
Parents completed batteries of questionnaires when children were 24 months, 36 months, 42 months,
and 48 months old. Data from previous assessments were not included in the current study with the
exception of parent-reported preschool temperament collected during the 48-month assessment.
Sixty-five families representing a subset of the sample from the parent study were invited to
participate in the current study when children were 54 months of age. Selection criteria for the current
study were based on observed shyness/withdrawal during six laboratory episodes at age 24 months.
Details of this selection process are provided below. High-fear and low-fear children who had reached
age 54 months by the time of the current study were invited to participate. Inclusion criteria required
children being free of any known developmental delays and psychostimulant medications, and the
absence of a family history of neurological impairment (e.g., epilepsy, etc).
Of the 65 families contacted, 1 family withdrew from the parent project; 7 families did not
return phone calls or respond to recruitment mailings; 3 families had moved away from the area; 13
families declined to participate based on time constraints, driving distance, or because they didn’t
believe that children would tolerate the procedures; and 1 family failed show for their laboratory visit
and did not reschedule. Thus, the final sample included 40 preschoolers (19 girls). Mean age at the time
13
of the laboratory visit was 55.03 months (SD = 1.58, median = 54 months). Of these children, 19 (9 girls)
were rated as high fear and 21 (10 girls) were rated as low fear.
The subsample of participants in the current study was representative of the parent project with
respect to socioeconomic status and racial and ethnic diversity. The majority of children (87.5%) were
identified by parents as Non-Hispanic Caucasian, 5.0% were identified as African-American, 5.0% were
identified as Asian-American, and 2.5% were identified as being of Hispanic ethnicity. Eight families
(20.0%) chose not to report their annual household income. Nearly half of the participating families
(47.5%) reported an annual household income of more than $60,000, 10.0% reported an annual
household income ranging from $51,000 – $60,000, 5.0% ranged between $41,000 – $50,000, 10.0%
ranged between $31,000 – $40,000, 2.5% ranged from $21,000 – $30,000, 2.5% ranged from $16,000 –
$20,000, and 2.5% reported an annual household income of less than $15,000.
Procedure
48-month mailing. As a part of the 48-month mailing, mothers who agreed to participate were
asked to complete and return to the laboratory the Child Behavior Questionnaire – Short form (CBQ -
Short: Putnam & Rothbart, 2006), a 94-item questionnaire that asks about children’s behavior over the
previous six months. Mothers responded to statements on a 5-point interval scale (1 = extremely untrue
of my child, 2 = quite untrue of my child, 3 = slightly untrue of my child, 4 = neither true nor false of my
child, 5 = slightly true of my child, 5 = extremely true of my child). The current study focused on one
broad domain of the CBQ that is linked to children’s control of attention, effortful control and two scales
linked to children’s risk for anxiety problems, fear and shyness. Items comprising these scales of the
CBQ are shown in Appendix E. Sores on the short form of the CBQ have been shown to be highly
correlated with those obtained using the standard version (Putnam & Rothbart, 2006).
54-month laboratory visit. Parents who agreed to participate in the 54-month assessment were
mailed a packet that included directions to the laboratory and IRB-approved consent forms that parents
14
were instructed to read carefully, sign, and bring with them to the laboratory visit. Upon arrival to the
laboratory, an experimenter reviewed the consent form and explained all experimental procedures to
the parent(s) and their child. Children were given a “treasure map” and were told that for each task
they completed, they would receive a sticker to add to the map. All children were rewarded with a
small prize for the stickers they earned throughout the laboratory session. Children were fitted with a
neural net used for EEG data collection. The child then completed three laboratory episodes: a resting
baseline (prebaseline), a modified version of the Attention Network Test (ANT; Fan et al., 2002; Rueda,
Fan, et al., 2004), and a second resting baseline (postbaseline).
Baseline measures. Children and a caregiver were led into the experimental room by the
primary experimenter. Children were seated in the center of the room; the caregiver was seated
approximately 4 ft to the child’s left, within sight of the child. Parents were asked to remain uninvolved
throughout the testing session. After children were seated comfortably, four 1-min trials of resting EEG
were recorded, two trials with eyes open and two trials with eyes closed, alternating in order
(prebaseline period). During eyes open trials, children were asked to remain focused on a moving shape
(circle/square) that appeared on the computer screen (Dell PC) approximately 24” in front of them. For
eyes closed trials, children were told to sit comfortably with their eyes closed while the experimenter
timed one minute. This same procedure was repeated following the completion of the ANT for the
postbaseline period.
Attention Network Test (ANT). Between the pre and post baseline periods, children individually
completed a child version of the ANT (Fan et al., 2002; Rueda et al., 2004) on a Dell PC using E-Prime 1.1
(Psychology Software Tools, Inc: Pittsburg, PA). The primary experimenter and the child’s caregiver were
present throughout testing, but did not provide feedback to participants outside of encouragement to
complete the task. Children were given a response box to either hold in their lap or place on a table in
front of them, whichever was more comfortable.
15
Prior to beginning the ANT, the experimenter explained the task to each participant using a set
of 8”x12” laminated cards depicting arrays of five cartoon fish that served as stimuli for the
experimental task. Participants were told that a similar row of fish would appear on the computer
screen in front of them; they were instructed to attend only to the fish in the middle (i.e., the target fish)
and to “feed that fish” using the response box. The rightmost button on the response box corresponded
to target fish depicted as facing rightward; the leftmost button on the response box corresponded to
target fish depicted as facing leftward. Prior to beginning a set of practice trials, the experimenter asked
participants to indicate which button on the response box corresponded to the correct response for the
target arrays depicted on the cards. When it was clear that participants understood the instructions,
they began a set of computerized practice trials.
A session of the ANT consisted of a total of 16 practice trials and two experimental blocks of 64
trials. Participants were allowed to take a short break between experimental blocks. Each trial began
with the presentation of a fixation cross for 400 ms. On some trials, a warning cue was subsequently
presented for 150 ms and represented one of three warning cue conditions: a center cue, a double cue,
or a spatial cue. The original version of the ANT included a fourth cue condition, a no cue condition, but
these trials were omitted in order to reduce the number of trials for children of this age. In the center
cue condition, an asterisk appeared at the location of the fixation cross. In the double cue condition, an
asterisk appeared at locations of the target both above and below the fixation cross. In the spatial cue
condition, a single asterisk appeared in the position of the upcoming target. A fixation period (no
fixation cross) of 450 ms followed the disappearance of the warning cue. Following this, the target array
comprised of the target fish and four flanker fish appeared and remained on the screen until a response
occurred or a maximum of 1700 ms had elapsed. During congruent trials, the target fish appeared in the
center of four flanking fish (two on each side) facing the same direction as the target; during
16
incongruent trials, the target fish in the center of four flanking fish facing the opposite direction from
the target. Accuracy and reaction time were recorded for each trial.
Social and Nonsocial Feedback Conditions. Given the increased risk for social fear and greater
sensitivity to negative feedback (Hardin, Perez-Edgar, Guyer, Pine, Fox, & Ernst, 2006) observed in high-
fear relative to low-fear children, nonsocial and socially-oriented feedback were provided in the first and
second experimental blocks of the ANT, respectively. During the first experimental block (nonsocial
feedback), correct responses will were followed by an enthusiastic voice cheering “woo-hoo!” Incorrect
responses were followed by a low-toned buzzing noise. During the second experimental block (social
feedback), correct responses were followed by the presentation of a smiling face (07f_ha_x) from the
Nim Stim stimulus set (Tottenham, Borscheid, Ellertsen, Marcus, Nelson, 2009). Incorrect responses
were followed by the presentation of a frowning face (07f_sa_c). A schematic representation of the
ANT is depicted in Figure 1. Overall, children answered an average of 74.95 trials (SD = 24.19) correctly
and 23.55 trials (SD = 15.99) incorrectly. The percent of correct responses produced during the ANT was
uncorrelated with ERN at Fz (r = .01, p > .10) and Cz (r = .02, p > .10). Percent of correct responses
during the ANT was uncorrelated with Pe at Cz (r = .12, p > .10) but was positive correlated with Pe at Pz
(r = .39, p < .05).
Laboratory visit affect. Children’s affect and behaviors were rated online by the primary
experimenter following completion of the prebaseline period, the ANT, and the postbaseline period.
Videotapes of each episode were also later coded offline by a trained research assistant.
Observed affective behaviors. Children’s laboratory affect and behaviors were rated by the
primary experimenter following the completion of the prebaseline period, the ANT, and the
postbaseline period. To do this, the primary experimenter completed the Behavioral Rating Scale (BRS)
a 10-item questionnaire that has been modified from the Infant Behavior Record (IBR; Bayley, 1969;
17
Stifter & Corey, 2001). Questions asked about children’s positivity, negativity, reactivity, responsiveness,
and attentional focus. A full version of the BRS is included in Appendix D.
Videotapes of the laboratory visits were coded by an undergraduate research assistant who was
trained by a master coder. Independent ratings were assigned for five affective behaviors during each
episode: distress, positive affect, shyness/withdrawal, boldness/approach, and vigor of activity. Ratings
were assigned for shyness/withdrawal based on a five-point interval scale ranging from an absence of
the behavior (1) to behavior of the highest intensity and duration (5). Thirty percent of episodes were
double coded in order to establish coding reliabilities. All scales showed adequate reliability: distress
ICC = .98, positive affect ICC = 1.00, shyness/withdrawal ICC = .91, boldness/approach ICC = 1.00, vigor of
activity ICC = .91.
EEG data collection. EEG was recorded during all episodes using a 128-channel Geodesic Sensor
Net and EGI software (Electrical Geodesic, Inc.: Eugene, OR). The sampling rate for data collection was
500 Hz. Prior to beginning data acquisition, all impedances were reduced to less than 80 kΩ. EEG was
recorded using a 0.1 Hz highpass filter and a 100 Hz lowpass filter. All channels were referenced to Cz
(Channel 129) during data collection and rereferenced offline to an average of the two mastoid channels
(Channel 57 and Channel 100). Analyses focus on EEG data collected during the ANT. Data from each
participant were submitted to an Independent Components Analysis in EEGLab Version 8.0.3b (Delorme
& Makeig, 2004) in order to extract eye blink and eye movement artifacts prior to offline processing.
Coding and Data Reduction
Fear group identification from 24-month visit. Laboratory episodes at age 24-months were
drawn from the toddler and preschool versions of the Laboratory Temperament Assessment Battery
(Lab-TAB: Goldsmith, Reilly, Lemery, Longley, & Prescott, 1994; Buss & Goldsmith, 2000; Buss, in press)
and other commonly used laboratory procedures. A full description of each episode is given in Appendix
C. Laboratory episodes were videotaped and independently scored by trained undergraduate and
18
graduate research assistants. Ratings were assigned for shyness/withdrawal based on a five-point
interval scale ranging from an absence of the behavior to behavior of the highest intensity and duration.
All coders achieved reliability with a master coder (ICCs = 0.55-0.96 across episodes) prior to coding
independently. Episodes were double-coded and a master coder resolved all coding discrepancies.
Children scoring 3 or greater (5-point scale) for shyness/withdrawal in at least half of the episodes of the
24-month laboratory visit were labeled as “high fear”. Children scoring less than 3 in at least half of the
episodes of the 24-month laboratory visit were labeled as “low fear”.
48-month temperament. Scores were created for all subscales of the CBQ as well as for the
three broad domains of surgency, negative affectivity, and effortful control. Given the hypotheses of
the current study that early fearful, shy, and overcontrolled behaviors represent precursors to risk for
psychological disorder, analyses focused on the broad domain of effortful control ( = .66) and the
subscales of fear ( = .64) and shyness ( = .92).
Observed laboratory visit affect. Observed ratings of child affect (i.e., BRS, video coding) were
moderately correlated across episodes and so were collapsed to form mean composites for each BRS
scale (mean r = .52) and each of the observer-rated behaviors (mean r = .58). These scores were
submitted to a principal components analysis with oblique rotation. Scales that loaded on factors
containing less than three items (n = 4) were removed and the analysis was rerun. The final analysis
returned a two-factor solution that accounted for 70.55% of the total item variance. The first factor was
labeled “observed fearfulness/withdrawal” ( = .83). It contained high positive loadings for BRS scales
reporting reactivity to new or strange events and observer-rated shyness; it also contained high negative
loadings for BRS scales measuring responsiveness to examiner, amount of gross bodily movement, and
observer-rated positive affect. Absolute values of factor loadings ranged from 0.61 to 0.90 for these
items. The second factor, labeled “positive engagement” ( = .87) contained high positive loadings for
BRS scales measuring happiness, responsiveness to objects, persistence in attending to task, and
19
constancy of response to task demands; it also contained high negative loadings for the BRS scale
measuring irritability and observer-rated distress. Absolute values of factor loadings ranged from .71 to
.88 for these items. The two factors were uncorrelated (r = -.19, p>.10). Factor scores from this solution
were used to create scores of observed fearfulness/withdrawal and positive engagement for each child.
Note that these factors are similar to those derived from children’s observed behaviors at age 24
months (Buss, in press). Indeed, high-fear children showed more observed fearfulness/withdrawal (M =
.32, SD = 1.09) than low-fear children (M = -.29, SD = .83) during the laboratory visit (t (36) = -1.96, p =
.05). The two groups did not differ in observed positive engagement (t (36) = .14, p > .05).
Cognitive control. Cognitive control during the ANT was defined using the ANT conflict score
(Fan et al., 2002). Conflict scores were calculated for each participant based on the response time data
recorded during the ANT by subtracting the average response time for congruent trials from the average
response time for incongruent trials (Figure 1). This score is believed to reflect the degree to which
participants could focus attention on target stimuli and ignore the irrelevant flanking stimuli; greater
scores reflect greater cognitive control.
Event-related potentials. Offline, all data processing was performed with Brain Vision Analyzer
(Brain Products: Gilching, Germany). EEG data were high-pass filtered at .10 Hz (12 dB rolloff). Data
used for peak detection were also low-pass filtered at 20 Hz (12 dB rolloff). From the continuous EEG,
1600 ms segments were extracted beginning 600 ms prior to participant responses. Segments were
baseline corrected by subtracting from each data point the average activity in the 600 ms time window
preceding the response (Pailing, Segqlowitz, Dywan, & Davies, 2002; Segalowitz, Santesso, Murphy,
Homan, Chantziantoniou, & Khan, 2010). Remaining artifacts were rejected when any of the following
criteria were met: a voltage step of more than 75 V occurred between data points, a voltage difference
of 150 V occurred within a single segment, amplitudes exceeded 200 V within a single trial, or
amplitudes dropped below .5 V during any 50 ms period. Each trial was also visually inspected for
20
artifacts following this semi-automated procedure. Based on these criteria, an average of 6.17 (SD =
3.46) trials per person were rejected across all trial types. Grand averages were created by averaging
amplitudes during artifact-free segments during correct and error trials. Trials were not included in the
average if the reaction time occurred outside of a 200-1600 ms time window. The mean number of
trials included in grand averages is shown in Table 1. Separate ERP averages were also created for each
of the four trial types (correct response/nonsocial feedback, incorrect response/nonsocial feedback,
correct response/social feedback, incorrect response/social feedback).
Based on previous work with children, the ERN was defined as the voltage of the greatest
negative deflection in the time window from 100 ms before to 100 ms after the response. The Pe was
similarly defined as the voltage of the greatest positive deflection in the window from 200 ms to 800 ms
after the response. All ERP components were evaluated along the midline (Fz, Cz, Pz) electrodes. Note
that, when scored in this way, greater ERN corresponds to greater negative amplitudes during error
trials while greater Pe corresponds to greater positive amplitudes during error trials.
Missing Data. ERP averages were not created for participants with fewer than 6 trials of usable
data (Olvet & Hajcak, 2009; Pontifex et al., 2010). This resulted in the exclusion of data from 5 children
because there were not enough error trials to create an average. Thus, the first set of analyses, which
compare correct with error trials, are based on data from 35 children. Children with and without data
did not differ on any other study variables (|t| < 1.6, p > .10). Data from an additional 15 children did
not include enough trials in one of the subcategories (correct response/nonsocial feedback, incorrect
response/nonsocial feedback, correct response/social feedback, incorrect response/social feedback).
Thus, the second set of analyses, which compare the social and nonsocial feedback conditions, are
based on data from 20 children. Again, children with and without data did not differ on any of the study
variables (|t| < 1.01, p > .10).
21
Chapter 3: Results
Following the outline of study goals and hypotheses, results were first examined for overall
performance (Hypotheses 1 -4) and then examined separately for social and nonsocial trials (exploratory
analyses). Results are presented in this order below. Assumptions of homogeneity of variance were met
for all analyses according to Mauchly’s Test of Sphericity.
Response Time Measures
Reaction time and accuracy data for overall performance on the ANT as well as for performance
during social- and nonsocial-feedback trials are presented in Table 1. The number of errors refers to
only errors of commission; therefore percentage of errors, which is adjusted for trials in which children
did not respond, is also presented. Although the pattern of means generally suggests a quicker
response time for error trials relative to correct trials, as is typically observed, this difference was not
significant (t(38) = -1.37, p > .10). The difference in response times was similar for high-fear and low-
fear children (t(37) = 1.39, p > .10). There was a significant difference, however, in response times for
trials following correct (i.e., post-correct) and error (post-error) trials (t(38) = -2.70, p = .01, Cohen’s d =
.22). As seen in Table 1, response times during post-error trials were slower than post-correct response
times. This effect was similar for high-fear and low-fear children (t(37) = 1.18, p > .10), suggesting that
all children were able to adjust behavior following error trials. High-fear and low-fear children also did
not differ on overall percentage of correct responses (t(38) = .61, p > .10).
Overall Performance
Error-related negativity. Figure 2 presents the response-locked ERPs at Fz, Cz, and Pz for
correct and error trials. Consistent with the values presented in Table 2, a 3 (Electrode Site: Fz, Cz, and
Pz) x 2 (Trial Type: Correct and Incorrect) Repeated Measures ANOVA confirmed that errors were
associated with more negative amplitudes than correct responses between -100 ms and +100 ms post-
response (FLin(1, 33) = 11.50, p < .01, η2p = .26) and that negative amplitudes varied as a function of
1 An analysis of sensitivity of the Repeated Measures ANOVA showed that the effect size for the three-way interaction would
need to be between 0.29 and 0.35 for ERN and Pe. 2
Using a Repeated Measures ANOVA to examine group differences returned
a nonsignificant three-way interactions for both ERN (F (1,33) = 0.37, p>.10) and Pe (F(1, 33) = 0.85, p>.10 ).
22
electrode site (FQuad(1, 33) = 9.63, p < .01, η2p = .23). Although the interaction between Electrode Site
and Trial Type did not reach significance (F(1, 33) = .81, p > .10), paired samples t-tests comparing
amplitudes during correct and error trials showed that negative amplitudes during error trials (i.e., ERN)
were significantly greater than negative amplitudes during correct trials at Fz (t(34) = -2.31, p < .05, d =
.52), were marginally greater than negative amplitudes during correct trials at Cz (t(34) = -2.01, p < .10, d
=.46), and did not differ from negative amplitudes during correct trials at Pz (t(33) = -1.65, p > .10).
Based on the lack of evidence for an ERN at Pz, group differences in ERN were examined only at
the Fz and Cz electrode sites. Given limited power for detecting a 3-way interaction (Electrode Site x
Trial Type x Fear Group), group differences in ERN were examined using paired-samples t-tests (Correct
vs. Incorrect Trials) at each electrode site separately for high-fear and low-fear children1,2. Examining
group differences in ERN in this manner provided a test of (a) the presence of ERN separately within
high-fear and low-fear children, (b) the electrode site at which ERN effects, if present, were observed,
and (c) the degree to which ERN in high-fear and low-fear children resembled the adult ERN. This
approach does, however, preclude a direct comparison of ERN between high-fear and low-fear children.
Figure 3 presents the response-locked ERPs separately for high-fear and low-fear children at Fz,
Cz, and Pz during correct and error trials. Again, consistent with the patterns of means presented in
Table 2, the paired-samples analysis showed an ERN for high-fear children at the Fz (t(16) = -1.84, p <
.10, d = .59) but not at the Cz (t(16) = -0.86, p = .05) electrode site. In contrast, low-fear children showed
an ERN response at the Cz electrode (t(16) = -2.08, p = .05, d = .64) but not at Fz (t(16) = -1.38, p > .10).
23
ERN and Behavior. Given some suggestion of group differences in ERN, it is possible that ERN is
associated with different behavioral outcomes in high-fear and low-fear children during the preschool
years. Therefore, correlations between ERN and behavior were examined separately for high-fear and
low-fear children. Prior to this, tests of mean differences in behavior indicated sex differences in
observed shyness/withdrawal during the laboratory visit (t31 = 2.12, p < .05) such that males (M = .30, SD
= .94) showed more shyness/withdrawal during the laboratory visit than did females (M = -.37, SD = .98).
As sex differences are also often seen in measures of effortful control (Else-Quest, Hyde, Goldsmith, &
Van Hulle, 2006; Kochanska, Murray, & Harlan, 2000), sex of child was controlled for in all correlations.
Partial correlations controlling for sex of child are shown in Table 3. Correlations are shown at
Fz and Cz electrodes. For high-fear children, ERN amplitudes were largely unrelated to both observed
and parent-reported measures.
In contrast, for low-fear children, greater ERN was linked to greater effortful control, greater
observed shyness/withdrawal, and less parent-reported fear. A more negative ERN was also associated
with greater post-error slowing. Together, these results suggest that in low-fear children, the ERN is
linked to greater behavioral control as measured by observed, parent-reported, and response time
measures.
Hierarchical linear regressions were used to test the interaction between ERN and Fear Group
for correlations that appeared to be different across the two groups. Therefore, regressions tested four
outcomes in association with the ERN: parent-reported fear (ERN at Cz), parent-reported effortful
control (ERN at Fz), observed shyness/withdrawal (ERN at Fz), and post-error slowing (ERN at Fz).
Regressions were run in three steps. In the first step, sex of child was entered as a covariate along with
fear group (dummy code: 0 = low fear, 1 = high fear). ERN was entered in the second step. The
interaction between ERN and fear group was entered in the third and final step. As has been
recommended, the continuous variable measuring ERN was centered prior to the creation of an
24
interaction term (Aiken & West, 1991). Significant interactions were probed by recoding fear group so
that high-fear children served as the reference group (dummy code: 0 = high fear, 1 = low fear) and
rerunning the regression.
Regressions largely confirmed the differences in associations between ERN and behavior in high-
fear and low-fear children that were suggested by the correlations. The interaction between ERN at Cz
and fear group was significantly associated with parent-reported fear (B = -.11, SE = .04, = -.68, p <
.05). Greater ERN was linked with less parent-reported fear for high-fear (B = .08, SE = .04, = .67, p <
.05) but not for low-fear children (B = -.03, SE = .03, = -.22 p > .10). The interaction between ERN at Fz
and fear group was a marginally-significant predictor of observed shyness/withdrawal during the
laboratory visit (B = .04, SE = .02, = .40 p < .10). Greater ERN was linked with greater
shyness/withdrawal for low-fear (B = -.03, SE = .01, = -.37 p < .10) but not for high-fear children (B =
.02, SE = .02, = .24 p < .10). Similarly, the interaction between ERN at Fz and fear group was
significantly associated with post-error slowing (B = .3.54, SE = 1.65, = .47 p < .05). As suggested in
Table 3, greater ERN at Fz was associated with greater post-error slowing for low-fear (B = -2.35, SE =
1.10 , = -.47 p < .05) but not for high-fear children (B = 1.19, SE = 1.24, = .24 p > .10). In contrast, the
interaction between ERN at Fz and Fear Group was not significant in the model predicting parent-
reported effortful control (B = .02, SE = .01, = .30, p < .05).
Error Positivity. As with the ERN, a 3 (Electrode Site: Fz, Cz, and Pz) x 2 (Trial Type: Correct and
Incorrect) Repeated Measures ANOVA confirmed that errors were associated with more positive
amplitudes than correct responses between 200 ms and 800 ms post-response (FLin(1, 32) = 6.09, p < .01,
η2
p = .16) and that positive amplitudes varied as a function of electrode site (FQuad(1, 32) = 4.16, p = .05,
η2
p = .11). Though the interaction between Electrode Site and Trial Type did not reach significance (F(1,
32) = .05, p > .10 ), paired samples t-tests comparing amplitudes during correct and error trials showed
that positive amplitudes during error trials (i.e., Pe) were significantly greater than positive amplitudes
25
during correct trials at Cz (t(34) = 2.06, p < .05, d =.38), and Pz (t(33) = 2.16, p < .05, d = .46) but did not
differ from correct trials at Fz (t(34) = 1.28, p > .10). This pattern is consistent with previous work
suggesting that the Pe is a slightly more posterior component than the ERN.
Based on the lack of evidence for Pe at Fz, group differences in Pe were examined only at the Cz
and Pz electrode sites. As with ERN, given limited power for detecting a 3-way interaction (Electrode
Site x Trial Type x Fear Group) group differences in Pe were examined using paired-samples t-tests
(Correct vs. Incorrect Trials) at each electrode site separately for high-fear and low-fear children.
Consistent with the patterns of neural activity presented in Figure 3 and in Table 2, the Paired-
samples analysis showed a Pe for high-fear children at the Pz electrode (t(16) = 1.98, p < .10, d = .69),
but not at Cz (t(16) = .42, p > .10). In contrast, low-fear children showed a Pe at the Cz electrode (t(16) =
2.84, p < .05, d = .54), but not at Pz (t(16) = 1.01, p > .10).
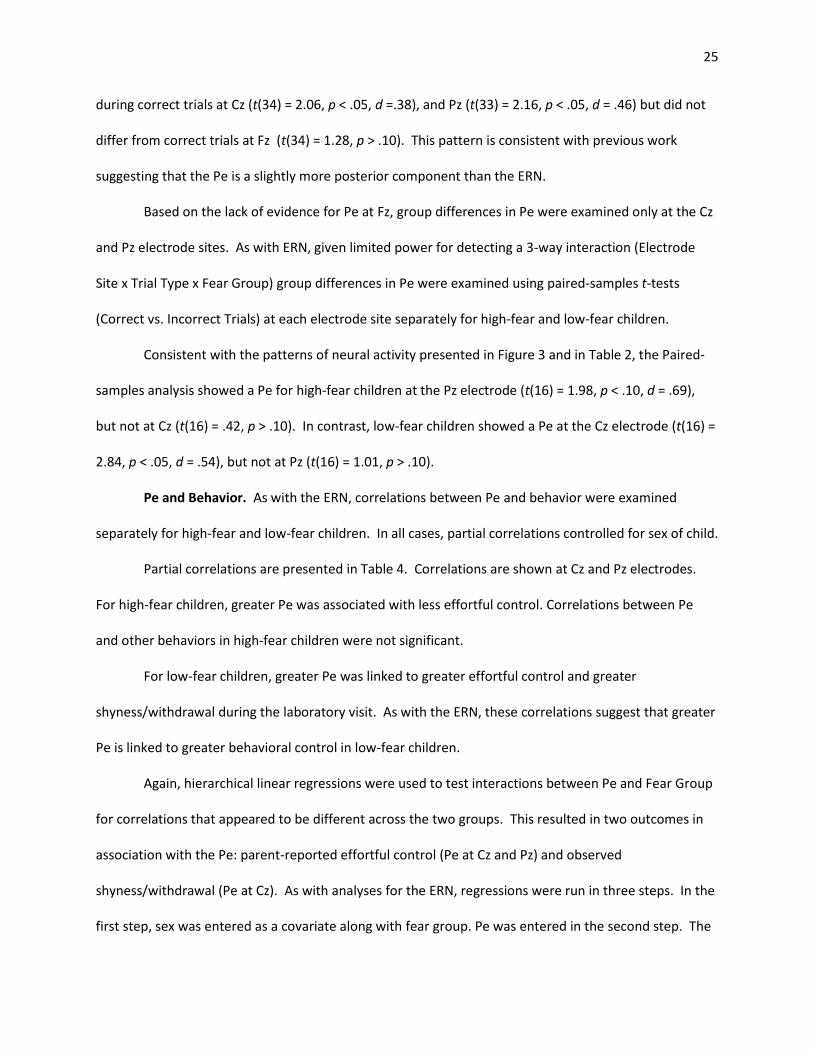
Pe and Behavior. As with the ERN, correlations between Pe and behavior were examined
separately for high-fear and low-fear children. In all cases, partial correlations controlled for sex of child.
Partial correlations are presented in Table 4. Correlations are shown at Cz and Pz electrodes.
For high-fear children, greater Pe was associated with less effortful control. Correlations between Pe
and other behaviors in high-fear children were not significant.
For low-fear children, greater Pe was linked to greater effortful control and greater
shyness/withdrawal during the laboratory visit. As with the ERN, these correlations suggest that greater
Pe is linked to greater behavioral control in low-fear children.
Again, hierarchical linear regressions were used to test interactions between Pe and Fear Group
for correlations that appeared to be different across the two groups. This resulted in two outcomes in
association with the Pe: parent-reported effortful control (Pe at Cz and Pz) and observed
shyness/withdrawal (Pe at Cz). As with analyses for the ERN, regressions were run in three steps. In the
first step, sex was entered as a covariate along with fear group. Pe was entered in the second step. The
26
interaction between Pe and fear group was entered in the third and final step. As has been
recommended, the continuous variable measuring Pe was centered prior to the creation of an
interaction term. The interaction between fear group and Pe at Cz predicting parent-reported effortful
control was nonsignificant (B = -.02, SE = .01, = -.32, p > .10) as were the interactions between Pe at Pz
and fear group predicting parent-reported effortful control (B = -.01, SE = .01, = -.32, p > .10), and Pe at
Cz predicting observed shyness/withdrawal (B = -.02, SE = .02, = -.19, p > .10).
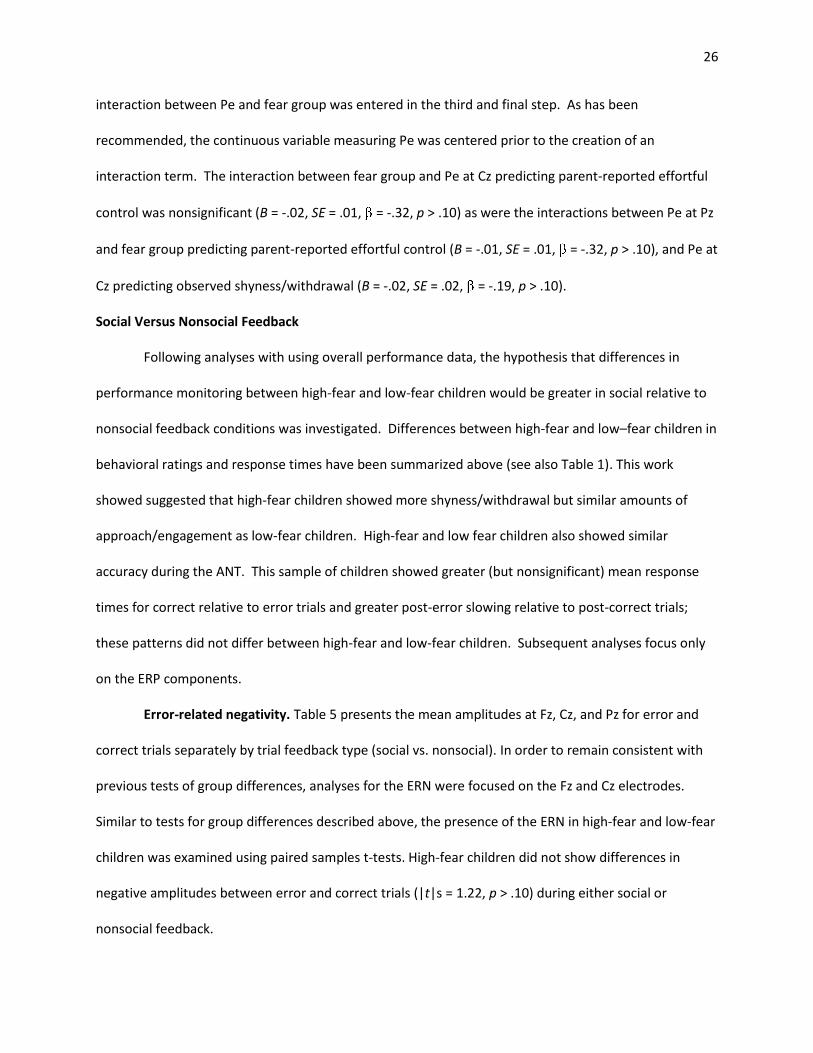
Social Versus Nonsocial Feedback
Following analyses with using overall performance data, the hypothesis that differences in
performance monitoring between high-fear and low-fear children would be greater in social relative to
nonsocial feedback conditions was investigated. Differences between high-fear and low–fear children in
behavioral ratings and response times have been summarized above (see also Table 1). This work
showed suggested that high-fear children showed more shyness/withdrawal but similar amounts of
approach/engagement as low-fear children. High-fear and low fear children also showed similar
accuracy during the ANT. This sample of children showed greater (but nonsignificant) mean response
times for correct relative to error trials and greater post-error slowing relative to post-correct trials;
these patterns did not differ between high-fear and low-fear children. Subsequent analyses focus only
on the ERP components.
Error-related negativity. Table 5 presents the mean amplitudes at Fz, Cz, and Pz for error and
correct trials separately by trial feedback type (social vs. nonsocial). In order to remain consistent with
previous tests of group differences, analyses for the ERN were focused on the Fz and Cz electrodes.
Similar to tests for group differences described above, the presence of the ERN in high-fear and low-fear
children was examined using paired samples t-tests. High-fear children did not show differences in
negative amplitudes between error and correct trials (|t|s = 1.22, p > .10) during either social or
nonsocial feedback.
27
Similarly, low-fear children did not show any significant differences in negative amplitudes at any of the
electrode sites during social or nonsocial trials (|t|s < 1.43, p > .10).
Error Positivity. As with previous tests, analyses for the Pe were focused on the Cz and Pz
electrodes. High-fear children showed only marginal differences in positive amplitudes following errors
at Pz during both social- (ts(9) = -1.95, p < .10) and nonsocial-feedback trials (t(9) = -1.94, p < .10). In
contrast, low-fear children did not show differences in positive amplitudes following errors during
social- or nonsocial-feedback trials at Cz (ts < -1.40, ps > .10) or at Pz (ts < -1.19, ps >.10).
28
Chapter 4: Discussion
Although recent work has suggested the presence of performance-monitoring components in
children at younger ages than previously thought, very little empirical work has been conducted to
investigate the presence of these components as skills of performance-monitoring are developing.
Similarly, previous research has largely ignored the ways that performance-monitoring components are
linked to other behaviors early in life. Moreover, despite suggestions that components such as the ERN
could provide an early biological marker of risk for anxiety problems, differences in ERN between high-
fear children, who may be at risk for anxiety problems, and their low-risk peers have largely gone
unexamined.
Given these gaps in the existing literature, the current study was aimed at refining our
understanding of performance monitoring components early in life. In it, the presence of ERN and Pe in
preschoolers at 4.5 years of age was examined along with links between components of error
monitoring and behaviors in very young children. Support was found for many, though not all, of the
study hypotheses. Specifically, both ERN and Pe were observed in preschool children. For high-fear
children, the ERN appeared to be more anterior and the Pe more posterior than was observed in their
low-fear peers. Behavioral differences emerged such that greater ERN was associated with better
behavioral control in low-fear children, but was not associated with behavior for high-fear children. The
discussion will focus on findings for study hypotheses, each in turn, before being extended to
implications for findings, study limitations, and suggested directions for future research.
ERN and Pe are Visible in Preschool-aged Children
The current study provided evidence for the presence of the ERN and Pe in a group of
preschool-aged children. Greater negative amplitudes were seen for error relative to correct trials
during the time window associated with ERN while greater positive amplitudes were seen for error
relative to correct trials during the time window associated with the Pe. Similarly, the differences in
29
neural activity during errors mirrored the typical distribution of performance monitoring components in
adults, though they were more broadly distributed in this sample of young children. Specifically,
children in the current study showed ERN responses at Fz and Cz rather than Fz only and showed Pe
responses at Cz and Pz rather than at Cz only. These findings are consistent with Hypothesis 1. Though
not hypothesized, additional distinctions between this sample and previous work with adults were seen
as apparent differences in amplitudes and variability in ERP components. That is, children in the current
study appeared to have smaller and more variable ERPs than adults. This idea is discussed in further
detail below.
Through separate cross-sectional designs, a handful of work in the last five years has provided
evidence for the existence of the ERN and Pe in children younger than age 10. These studies have
included children between 4 and 8 (Brooker, Buss, & Dennis, 2011), 5 and 7 (Torpey, Hajcak, & Klein,
2009), and 7 and 8 (Kim et al., 2007; Wiersema et al., 2007) years of age. Although some of this work
has controlled for age within analyses, no studies to date have been conducted with children who were
all in their preschool years. The sample of the current study offered two advantages over previous
samples that include broader age ranges. First, by replicating previous work, the current study added
increasing confidence that components of performance monitoring are visible early in life. Second,
samples that include children with a smaller range of ages may be more important for elucidating links
between neural components of performance monitoring and measures of individual differences. Recent
work by Crone and Ridderinkhoff (2011) suggests that studies with smaller age ranges will be necessary
in order to disentangle effects associated with individual differences from effects in which the impact of
development is blurred by the inclusion of older children who can drive significant results, though it is
important to note that age also serves as an imperfect proxy for development.
As with past work, the nature of performance monitoring components in such a young sample
varies slightly from what is typically observed in work with adults. Evidence for ERN was seen at both Fz
30
and Cz electrode sites. Similar to other findings in young children (Torpey et al., 2009), this type of
distribution may be interpreted as a more broadly distributed, posterior ERN in children relative to
adults, in whom ERN is often found to be maximal at Fz (e.g., Falkenstein, Hohnsbein, Hoormann, &
Blanke, 1991; Hajcak et al., 2003). Our study also found a broader, more posterior distribution for the
Pe, with evidence for error positivity at both Cz and Pz. Developmental differences are less frequently
observed for the Pe than for the ERN, but are plausible given the young age of participants in the current
sample. A developmental shift in maxima to more anterior brain regions has been interpreted as an
indication that components of error monitoring are still maturing in children at this age. Theories of
neurodevelopment posit that early-developing areas of the bran, such as the striatum, are involved in
cognitive processing before being overtaken by later-maturing, more anterior structures such as the ACC
(Bachevalier and Mishkin, 1984; Goldman, Rosvold, Vest, & Galkin, 1971). This change in primary
processing centers may underlie observed patterns of change from posterior to anterior neural activity
during cognitive tasks as children age and may help to explain the more parietal distributions of
performance-monitoring components in this relatively immature sample.
In addition to differences in the distribution of ERN and Pe, it is worthwhile to note that although
the ERN amplitudes reported here were similar to those previously reported for children in this age
group (Brooker, Buss, & Dennis, 2011; Torpey, Hajcak, & Klein, 2009), many were slightly smaller than
has been reported in work with adults (e.g., Hajcak, MacDonald, & Simons, 2003; 2004). In fact, this
difference replicates the small amount of developmental work that has been done on the ERN (e.g.,
Davies, et al., 2004; Ladouceur et al., 2004; 2007). Smaller amplitudes in children are likely associated
with more diffuse brain activity in early childhood. According to work by Huttenlocher (1990), neuronal
density in the frontal cortex is still 10% above mean-level values for adults in children who are 7 years of
age. As children mature and neural systems become more localized and efficient, cortical neurons are
pruned. This process continues well into middle childhood.
31
In addition, the variability seen in ERN and Pe amplitudes was much higher than that typically
observed in adults, but was comparable to other studies of young children (e.g., Torpey et al., 2009).
While there have been no known empirical tests of ERP variability (Luck, 2005), there are a number of
reasons that highly variable ERPs in young children might have been expected. First, from a
methodological perspective, the highly-constrained testing environment of ERP research, which
necessitates long periods of sitting still and many repetitions of trials for the same task, is not always
conducive to developmental populations. Problems with signal-to-noise ratio, the presence of artifacts,
movement, and high rates of data loss have been well articulated by pioneers in the use of EEG with
children (DeBoer, Scott, & Nelson, 2005; 2007). Second, from a developmental perspective, different
rates of maturation can lead to differences in the morphology and timing of ERP components and
changes in the structure and orientation of neural generators for ERPs of interest (DeBoer, Scott, &
Nelson, 2005). This may, in turn, result in apparent differences in amplitude across the ages.
Changing variability in performance-monitoring ERPs is important given that a number of the effects
in the current study were observed at the trend level. While small effect sizes might have been
anticipated given that cognitive control is still relatively immature at this age, it may also have been the
case that effects were muted by person-to-person variation in the timing and amplitudes of ERN and Pe.
For example, given that group-level analyses as performed here rely on the grand-average within
groups, high levels of within-group variability in peak latency may have obscured differences in ERP
amplitudes. Possibilities such as these should be considered as work in this domain progresses.
Distributions of ERN and Pe Differ between High- and Low-fear Children
Contrary to study Hypothesis 2, amplitude differences for components of performance
monitoring were not observed between high-fear and low-fear children. However, consistent with
Hypothesis 2, there were indications that the distribution of the ERN in high-fear children was more
similar to that seen in adults than the distribution of the ERN seen in low-fear children. As do adults,
32
high-fear child showed evidence for an ERN at Fz whereas low-fear children showed a less “adult-like”
response at Cz. Contrary to Hypothesis 3, a difference in distribution was also seen for the Pe. In
contrast with the ERN, low-fear children showed a more “adult-like” Pe while high-fear children showed
potentially less mature neural activity. Findings are discussed in turn below.
While null results are notoriously difficult to interpret, the lack of differences in ERN and Pe
amplitude between high-fear and low-fear children may have been seen for a number of reasons. First,
there may not have been enough power in the current sample to detect group differences, particularly
given that effect sizes were small. Second, it may be the case that group-level differences in
performance monitoring are not yet present at 4.5 years of age. That is, given that the neural correlates
of performance monitoring and cognitive control are undergoing rapid development at this age, group
differences may not be reliably elicited in preschoolers.
Although group differences in amplitude were not apparent, differences in the distribution of
performance-monitoring components were observed for high-fear and low-fear children. High-fear
children showed an ERN response at more frontal electrodes than did low-fear children. Previous work
has suggested - but not tested – the idea that the ERN develops earlier in children who are at risk for
anxiety problems, such as high-fear children, relative to children who are not at risk (Ladouceur et al.,
2007). One proxy for earlier versus later development of the ERN is to evaluate the degree to which it
resembles adult-like ERN (e.g., Segalowitz & Davies, 2004). Given that ERN in adults is frequently
observed at the Fz electrode site (Falkenstein, Hohnsbein, Hoormann, & Blanke, 1991; Hajcak et al.,
2003; though see Nieuwenhuis et al., 2001 for exception), the observable ERN at Fz in high-fear children
may suggest a more mature ERN relative to that seen in low-fear children. Thus, the current study
represents the first empirical test and partial confirmation of Ladouceur’s hypothesis of an early-
developing ERN in a group of preschoolers.
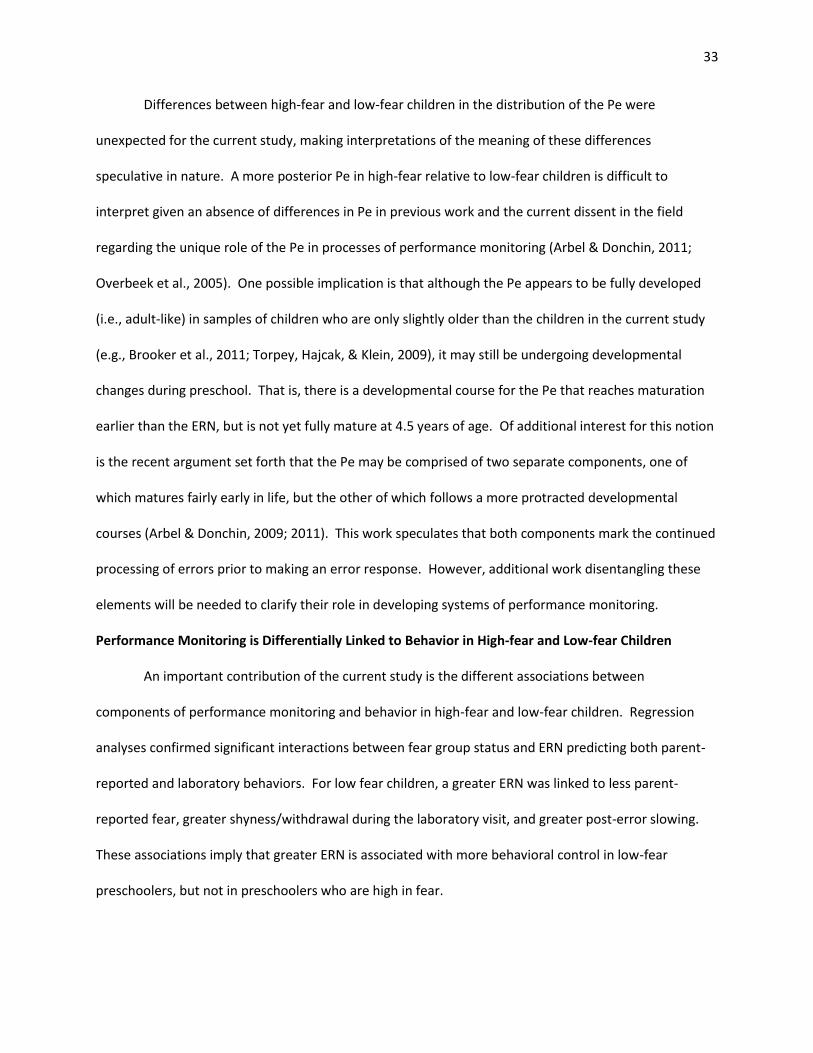
33
Differences between high-fear and low-fear children in the distribution of the Pe were
unexpected for the current study, making interpretations of the meaning of these differences
speculative in nature. A more posterior Pe in high-fear relative to low-fear children is difficult to
interpret given an absence of differences in Pe in previous work and the current dissent in the field
regarding the unique role of the Pe in processes of performance monitoring (Arbel & Donchin, 2011;
Overbeek et al., 2005). One possible implication is that although the Pe appears to be fully developed
(i.e., adult-like) in samples of children who are only slightly older than the children in the current study
(e.g., Brooker et al., 2011; Torpey, Hajcak, & Klein, 2009), it may still be undergoing developmental
changes during preschool. That is, there is a developmental course for the Pe that reaches maturation
earlier than the ERN, but is not yet fully mature at 4.5 years of age. Of additional interest for this notion
is the recent argument set forth that the Pe may be comprised of two separate components, one of
which matures fairly early in life, but the other of which follows a more protracted developmental
courses (Arbel & Donchin, 2009; 2011). This work speculates that both components mark the continued
processing of errors prior to making an error response. However, additional work disentangling these
elements will be needed to clarify their role in developing systems of performance monitoring.
Performance Monitoring is Differentially Linked to Behavior in High-fear and Low-fear Children
An important contribution of the current study is the different associations between
components of performance monitoring and behavior in high-fear and low-fear children. Regression
analyses confirmed significant interactions between fear group status and ERN predicting both parent-
reported and laboratory behaviors. For low fear children, a greater ERN was linked to less parent-
reported fear, greater shyness/withdrawal during the laboratory visit, and greater post-error slowing.
These associations imply that greater ERN is associated with more behavioral control in low-fear
preschoolers, but not in preschoolers who are high in fear.
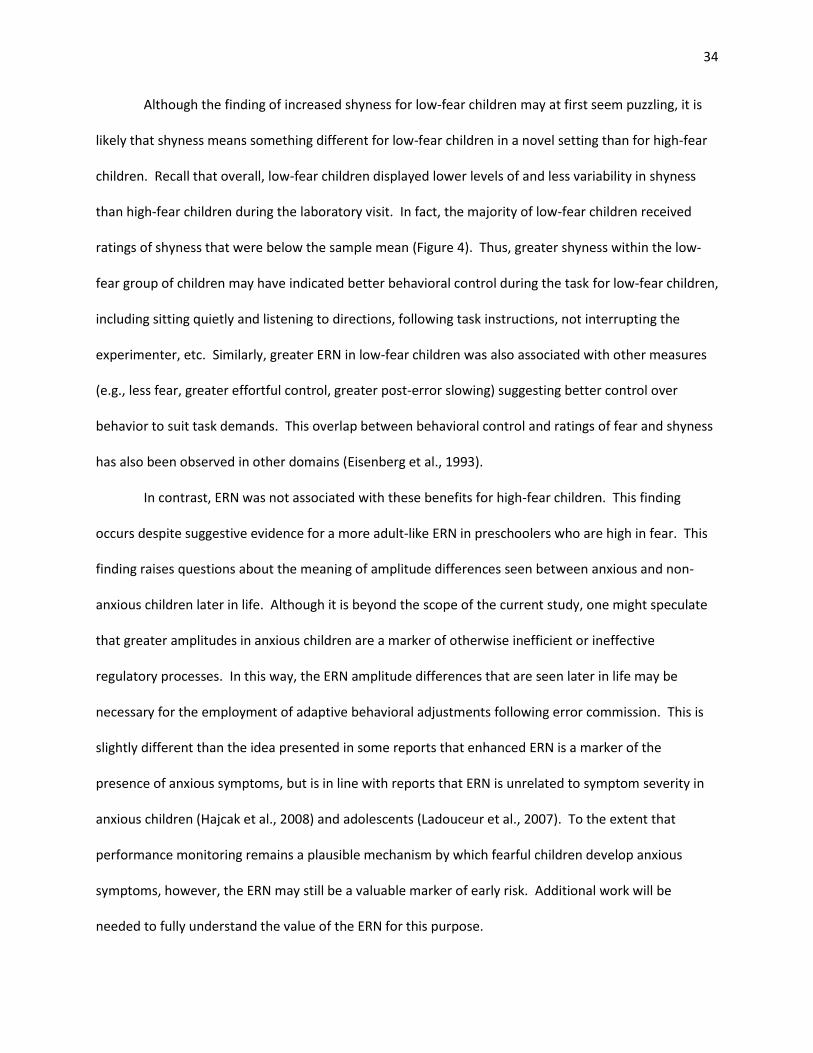
34
Although the finding of increased shyness for low-fear children may at first seem puzzling, it is
likely that shyness means something different for low-fear children in a novel setting than for high-fear
children. Recall that overall, low-fear children displayed lower levels of and less variability in shyness
than high-fear children during the laboratory visit. In fact, the majority of low-fear children received
ratings of shyness that were below the sample mean (Figure 4). Thus, greater shyness within the low-
fear group of children may have indicated better behavioral control during the task for low-fear children,
including sitting quietly and listening to directions, following task instructions, not interrupting the
experimenter, etc. Similarly, greater ERN in low-fear children was also associated with other measures
(e.g., less fear, greater effortful control, greater post-error slowing) suggesting better control over
behavior to suit task demands. This overlap between behavioral control and ratings of fear and shyness
has also been observed in other domains (Eisenberg et al., 1993).
In contrast, ERN was not associated with these benefits for high-fear children. This finding
occurs despite suggestive evidence for a more adult-like ERN in preschoolers who are high in fear. This
finding raises questions about the meaning of amplitude differences seen between anxious and non-
anxious children later in life. Although it is beyond the scope of the current study, one might speculate
that greater amplitudes in anxious children are a marker of otherwise inefficient or ineffective
regulatory processes. In this way, the ERN amplitude differences that are seen later in life may be
necessary for the employment of adaptive behavioral adjustments following error commission. This is
slightly different than the idea presented in some reports that enhanced ERN is a marker of the
presence of anxious symptoms, but is in line with reports that ERN is unrelated to symptom severity in
anxious children (Hajcak et al., 2008) and adolescents (Ladouceur et al., 2007). To the extent that
performance monitoring remains a plausible mechanism by which fearful children develop anxious
symptoms, however, the ERN may still be a valuable marker of early risk. Additional work will be
needed to fully understand the value of the ERN for this purpose.
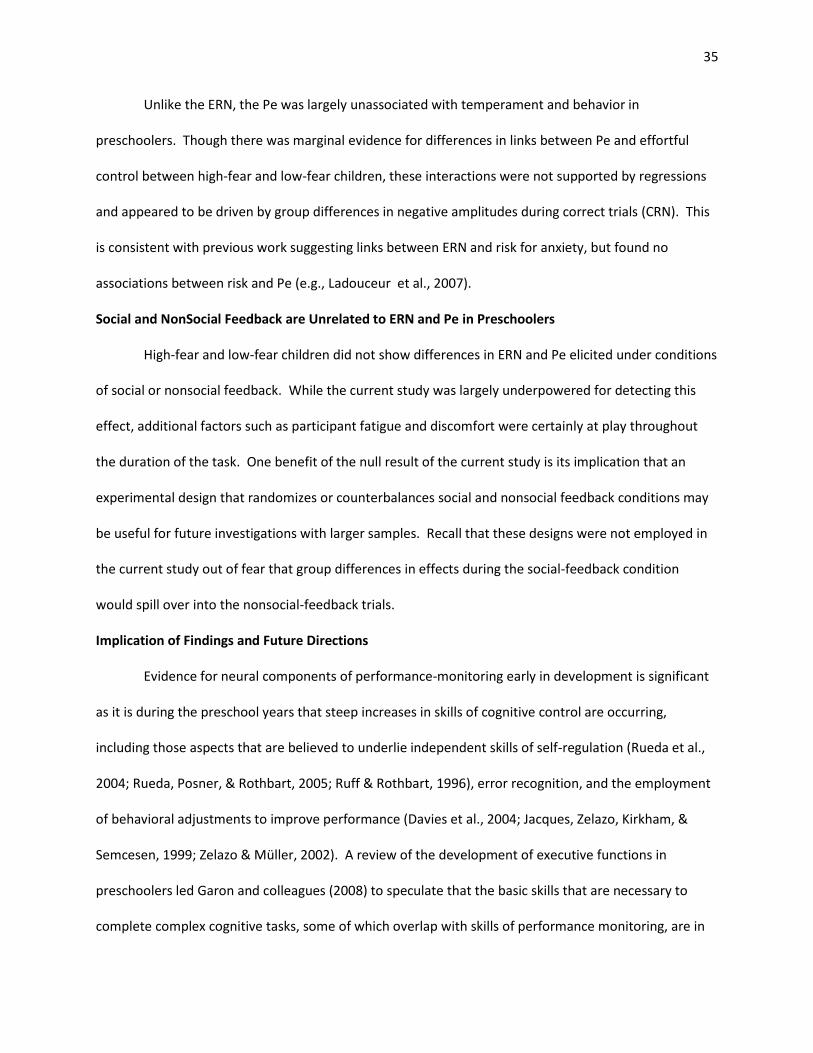
35
Unlike the ERN, the Pe was largely unassociated with temperament and behavior in
preschoolers. Though there was marginal evidence for differences in links between Pe and effortful
control between high-fear and low-fear children, these interactions were not supported by regressions
and appeared to be driven by group differences in negative amplitudes during correct trials (CRN). This
is consistent with previous work suggesting links between ERN and risk for anxiety, but found no
associations between risk and Pe (e.g., Ladouceur et al., 2007).
Social and NonSocial Feedback are Unrelated to ERN and Pe in Preschoolers
High-fear and low-fear children did not show differences in ERN and Pe elicited under conditions
of social or nonsocial feedback. While the current study was largely underpowered for detecting this
effect, additional factors such as participant fatigue and discomfort were certainly at play throughout
the duration of the task. One benefit of the null result of the current study is its implication that an
experimental design that randomizes or counterbalances social and nonsocial feedback conditions may
be useful for future investigations with larger samples. Recall that these designs were not employed in
the current study out of fear that group differences in effects during the social-feedback condition
would spill over into the nonsocial-feedback trials.
Implication of Findings and Future Directions
Evidence for neural components of performance-monitoring early in development is significant
as it is during the preschool years that steep increases in skills of cognitive control are occurring,
including those aspects that are believed to underlie independent skills of self-regulation (Rueda et al.,
2004; Rueda, Posner, & Rothbart, 2005; Ruff & Rothbart, 1996), error recognition, and the employment
of behavioral adjustments to improve performance (Davies et al., 2004; Jacques, Zelazo, Kirkham, &
Semcesen, 1999; Zelazo & Müller, 2002). A review of the development of executive functions in
preschoolers led Garon and colleagues (2008) to speculate that the basic skills that are necessary to
complete complex cognitive tasks, some of which overlap with skills of performance monitoring, are in
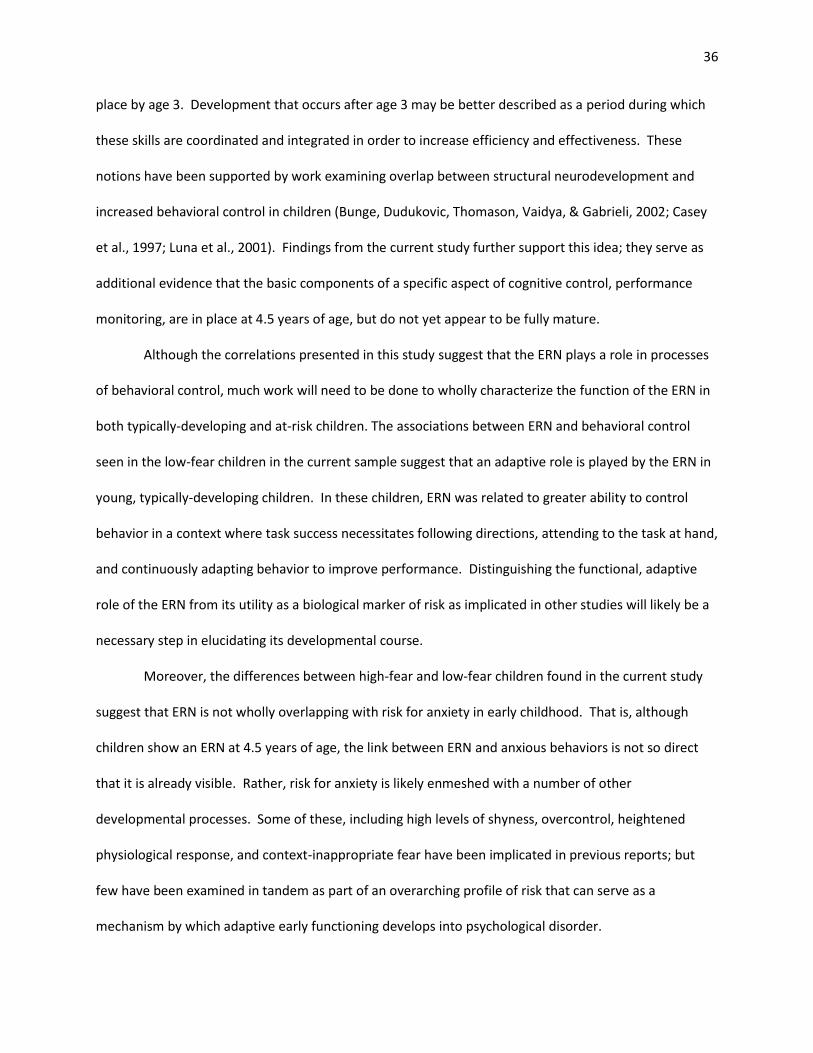
36
place by age 3. Development that occurs after age 3 may be better described as a period during which
these skills are coordinated and integrated in order to increase efficiency and effectiveness. These
notions have been supported by work examining overlap between structural neurodevelopment and
increased behavioral control in children (Bunge, Dudukovic, Thomason, Vaidya, & Gabrieli, 2002; Casey
et al., 1997; Luna et al., 2001). Findings from the current study further support this idea; they serve as
additional evidence that the basic components of a specific aspect of cognitive control, performance
monitoring, are in place at 4.5 years of age, but do not yet appear to be fully mature.
Although the correlations presented in this study suggest that the ERN plays a role in processes
of behavioral control, much work will need to be done to wholly characterize the function of the ERN in
both typically-developing and at-risk children. The associations between ERN and behavioral control
seen in the low-fear children in the current sample suggest that an adaptive role is played by the ERN in
young, typically-developing children. In these children, ERN was related to greater ability to control
behavior in a context where task success necessitates following directions, attending to the task at hand,
and continuously adapting behavior to improve performance. Distinguishing the functional, adaptive
role of the ERN from its utility as a biological marker of risk as implicated in other studies will likely be a
necessary step in elucidating its developmental course.
Moreover, the differences between high-fear and low-fear children found in the current study
suggest that ERN is not wholly overlapping with risk for anxiety in early childhood. That is, although
children show an ERN at 4.5 years of age, the link between ERN and anxious behaviors is not so direct
that it is already visible. Rather, risk for anxiety is likely enmeshed with a number of other
developmental processes. Some of these, including high levels of shyness, overcontrol, heightened
physiological response, and context-inappropriate fear have been implicated in previous reports; but
few have been examined in tandem as part of an overarching profile of risk that can serve as a
mechanism by which adaptive early functioning develops into psychological disorder.
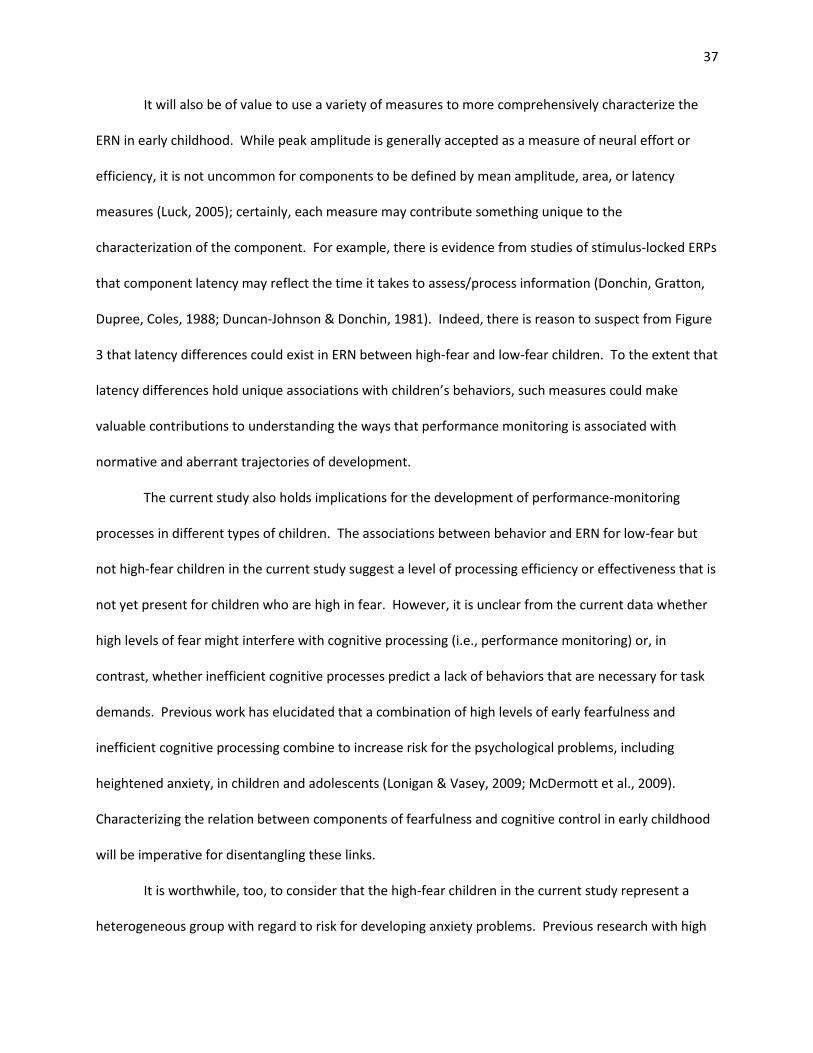
37
It will also be of value to use a variety of measures to more comprehensively characterize the
ERN in early childhood. While peak amplitude is generally accepted as a measure of neural effort or
efficiency, it is not uncommon for components to be defined by mean amplitude, area, or latency
measures (Luck, 2005); certainly, each measure may contribute something unique to the
characterization of the component. For example, there is evidence from studies of stimulus-locked ERPs
that component latency may reflect the time it takes to assess/process information (Donchin, Gratton,
Dupree, Coles, 1988; Duncan-Johnson & Donchin, 1981). Indeed, there is reason to suspect from Figure
3 that latency differences could exist in ERN between high-fear and low-fear children. To the extent that
latency differences hold unique associations with children’s behaviors, such measures could make
valuable contributions to understanding the ways that performance monitoring is associated with
normative and aberrant trajectories of development.
The current study also holds implications for the development of performance-monitoring
processes in different types of children. The associations between behavior and ERN for low-fear but
not high-fear children in the current study suggest a level of processing efficiency or effectiveness that is
not yet present for children who are high in fear. However, it is unclear from the current data whether
high levels of fear might interfere with cognitive processing (i.e., performance monitoring) or, in
contrast, whether inefficient cognitive processes predict a lack of behaviors that are necessary for task
demands. Previous work has elucidated that a combination of high levels of early fearfulness and
inefficient cognitive processing combine to increase risk for the psychological problems, including
heightened anxiety, in children and adolescents (Lonigan & Vasey, 2009; McDermott et al., 2009).
Characterizing the relation between components of fearfulness and cognitive control in early childhood
will be imperative for disentangling these links.
It is worthwhile, too, to consider that the high-fear children in the current study represent a
heterogeneous group with regard to risk for developing anxiety problems. Previous research with high
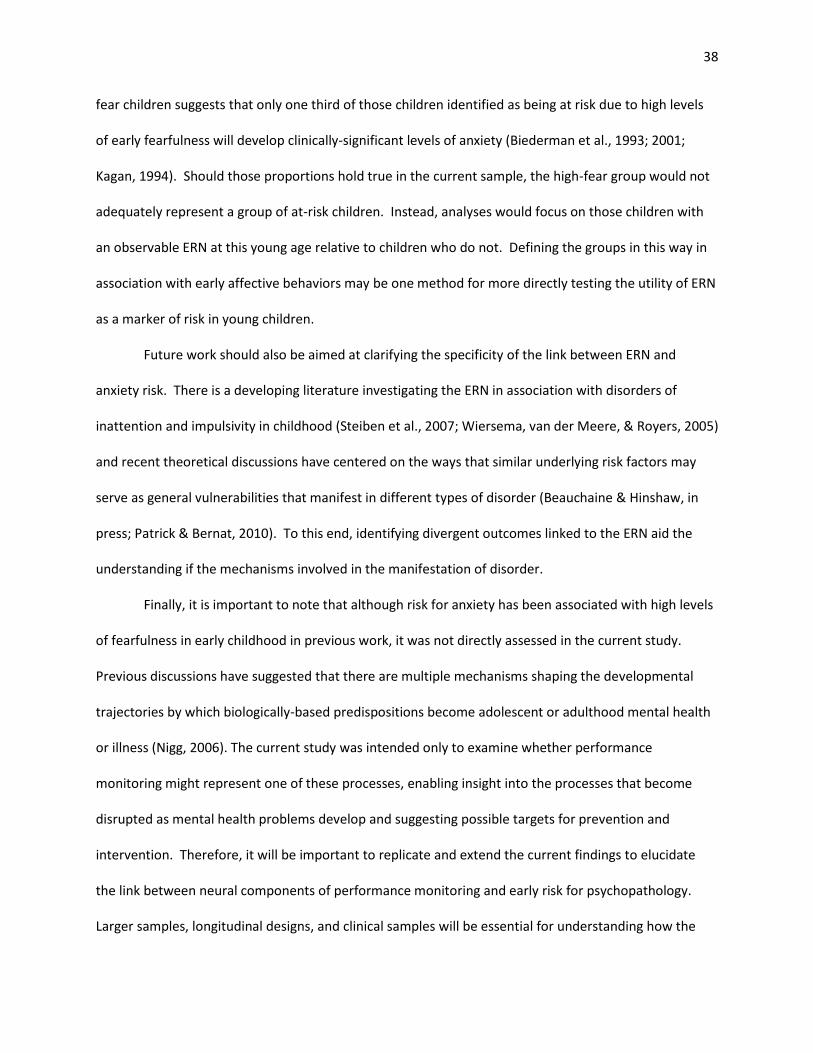
38
fear children suggests that only one third of those children identified as being at risk due to high levels
of early fearfulness will develop clinically-significant levels of anxiety (Biederman et al., 1993; 2001;
Kagan, 1994). Should those proportions hold true in the current sample, the high-fear group would not
adequately represent a group of at-risk children. Instead, analyses would focus on those children with
an observable ERN at this young age relative to children who do not. Defining the groups in this way in
association with early affective behaviors may be one method for more directly testing the utility of ERN
as a marker of risk in young children.
Future work should also be aimed at clarifying the specificity of the link between ERN and
anxiety risk. There is a developing literature investigating the ERN in association with disorders of
inattention and impulsivity in childhood (Steiben et al., 2007; Wiersema, van der Meere, & Royers, 2005)
and recent theoretical discussions have centered on the ways that similar underlying risk factors may
serve as general vulnerabilities that manifest in different types of disorder (Beauchaine & Hinshaw, in
press; Patrick & Bernat, 2010). To this end, identifying divergent outcomes linked to the ERN aid the
understanding if the mechanisms involved in the manifestation of disorder.
Finally, it is important to note that although risk for anxiety has been associated with high levels
of fearfulness in early childhood in previous work, it was not directly assessed in the current study.
Previous discussions have suggested that there are multiple mechanisms shaping the developmental
trajectories by which biologically-based predispositions become adolescent or adulthood mental health
or illness (Nigg, 2006). The current study was intended only to examine whether performance
monitoring might represent one of these processes, enabling insight into the processes that become
disrupted as mental health problems develop and suggesting possible targets for prevention and
intervention. Therefore, it will be important to replicate and extend the current findings to elucidate
the link between neural components of performance monitoring and early risk for psychopathology.
Larger samples, longitudinal designs, and clinical samples will be essential for understanding how the
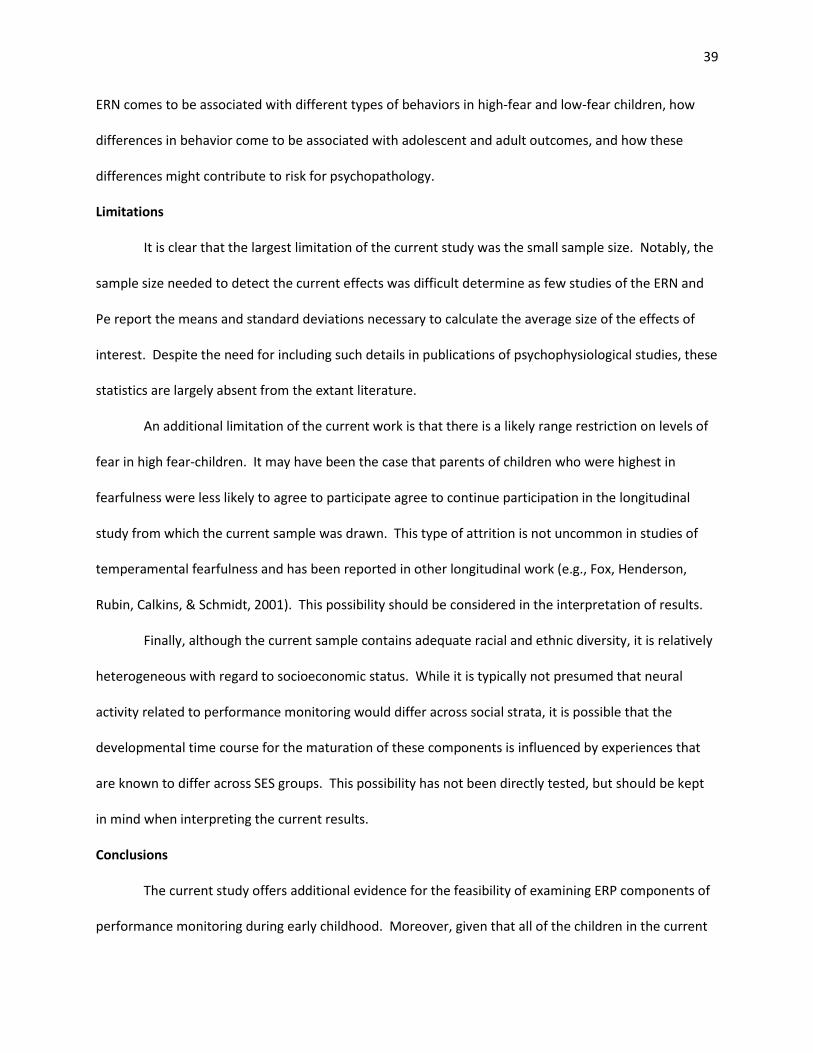
39
ERN comes to be associated with different types of behaviors in high-fear and low-fear children, how
differences in behavior come to be associated with adolescent and adult outcomes, and how these
differences might contribute to risk for psychopathology.
Limitations
It is clear that the largest limitation of the current study was the small sample size. Notably, the
sample size needed to detect the current effects was difficult determine as few studies of the ERN and
Pe report the means and standard deviations necessary to calculate the average size of the effects of
interest. Despite the need for including such details in publications of psychophysiological studies, these
statistics are largely absent from the extant literature.
An additional limitation of the current work is that there is a likely range restriction on levels of
fear in high fear-children. It may have been the case that parents of children who were highest in
fearfulness were less likely to agree to participate agree to continue participation in the longitudinal
study from which the current sample was drawn. This type of attrition is not uncommon in studies of
temperamental fearfulness and has been reported in other longitudinal work (e.g., Fox, Henderson,
Rubin, Calkins, & Schmidt, 2001). This possibility should be considered in the interpretation of results.
Finally, although the current sample contains adequate racial and ethnic diversity, it is relatively
heterogeneous with regard to socioeconomic status. While it is typically not presumed that neural
activity related to performance monitoring would differ across social strata, it is possible that the
developmental time course for the maturation of these components is influenced by experiences that
are known to differ across SES groups. This possibility has not been directly tested, but should be kept
in mind when interpreting the current results.
Conclusions
The current study offers additional evidence for the feasibility of examining ERP components of
performance monitoring during early childhood. Moreover, given that all of the children in the current
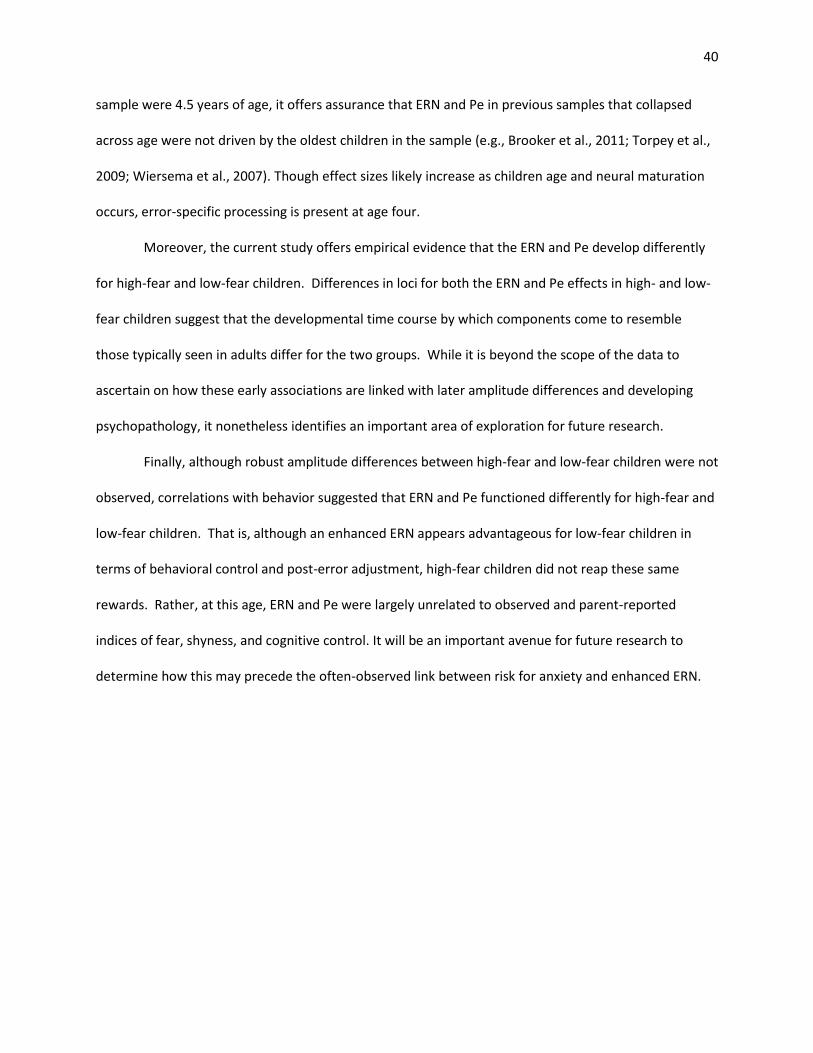
40
sample were 4.5 years of age, it offers assurance that ERN and Pe in previous samples that collapsed
across age were not driven by the oldest children in the sample (e.g., Brooker et al., 2011; Torpey et al.,
2009; Wiersema et al., 2007). Though effect sizes likely increase as children age and neural maturation
occurs, error-specific processing is present at age four.
Moreover, the current study offers empirical evidence that the ERN and Pe develop differently
for high-fear and low-fear children. Differences in loci for both the ERN and Pe effects in high- and low-
fear children suggest that the developmental time course by which components come to resemble
those typically seen in adults differ for the two groups. While it is beyond the scope of the data to
ascertain on how these early associations are linked with later amplitude differences and developing
psychopathology, it nonetheless identifies an important area of exploration for future research.
Finally, although robust amplitude differences between high-fear and low-fear children were not
observed, correlations with behavior suggested that ERN and Pe functioned differently for high-fear and
low-fear children. That is, although an enhanced ERN appears advantageous for low-fear children in
terms of behavioral control and post-error adjustment, high-fear children did not reap these same
rewards. Rather, at this age, ERN and Pe were largely unrelated to observed and parent-reported
indices of fear, shyness, and cognitive control. It will be an important avenue for future research to
determine how this may precede the often-observed link between risk for anxiety and enhanced ERN.
41
References
Adleman, N.E., Menon, V., Blasey, C.M., White, C.D., Warsofsky, I.S., Glover, G.H., & Reiss, A.L. (2002). A developmental fMRI study of the stroop color-word task. NeuroImage, 16, 61-75. Arbel, Y., & Donchin, E. (2009). Parsing the componential structure of post-error ERPs: A principal component analysis of ERPs following errors. Psychophysiology, 46, 1288–1298.
Arbel, Y., & Donchin, E. (2011). When a child errs: The ERN and the Pe complex in children. Psychophysiology, 48, 55-63. Bachevalier, J., & Mishkin, M. (1984). An early and a late developing system for learning retention in infant monkeys. Behavioral Neuroscience, 98, 770-778. Bar-Haim, Y., Lamy, D., Pergamin, L., Bakermans-Kranenburg, M.J., & van IJzendoorn, M.H. (2007). Threat-related attentional bias in anxious and nonanxious individuals: A meta-analytic study. Psychological Bulletin, 133, 1-24. Bayley, N. (1969). Bayley Scales of Mental Development. New York: Psychological Corporation. Beauchaine, T. P., & Hinshaw, S. P. (in press). Comorbidity of attention-deficit/hyperactivity disorder and early-onset conduct disorder: Biological, environmental, and developmental mechanisms. Clinical Psychology: Science and Practice. Bell-Dolan, D.J., Last, C.G., & Strauss, C.C. (1990). Symptoms of anxiety disorders in normal children. Journal of the American Academy of Child and Adolescent Psychiatry, 29, 759-765. Biederman, J., Hirshfeld-Becker, D.R., Rosenbaum, J.F., Hérot, C., Friedman, D., Snidman, N., Kagan, J., & Faraone, S. (2001). Further evidence of association between behavioral inhibition and social anxiety in children. American Journal of Psychiatry, 158, 1673-1679. Biederman, J., Rosenbaum, J.F., Bolduc-Murphy, E.A., Faraone, S.V., Chaloff, J., Hirshfeld, D.R., & Kagan, J. (1993). A 3-year follow-up of children with and without behavioral inhibition. Journal of the American Academy of Child and Adolescent Psychiatry, 32, 814-821. Borkovec, T. (1994). The nature, functions, and origins of worry. In G.C.L. Davey & F. Tallis (Eds.), Worrying: Perspectives in theory, assessment, and treatment, (pp.5-33). England: John Wiley and Sons. Botvinick, M.M., Braver, T.S., Barch, D.M., Carter, C.S., & Cohen, J.D. (2001). Conflict monitoring and cognitive control. Psychological Review, 108, 624-652. Brooker, R.J., Buss, K.A., & Dennis, T.A. (2011). Error-monitoring brain activity is associated with affective behaviors in young children. Developmental Cognitive Neuroscience, 1, 141-152. Bunge, S.A., Dudukovic, N.M., Thomason, M.E., Vaidya, C.J., & Gabrieli, J.D.E. (2002). Immature frontal lobe contributions to cognitive control in children: Evidence from fMRI. Neuron, 33, 301-311.
42
Buss, K.A. (in press). Which fearful toddlers should we worry about? Effects of context on observed fear and risk for anxiety. Developmental Psychology. Buss, K.A., Davidson, R.J., Kalin, N.H., & Goldsmith, H.H. (2004). Context specific freezing and associated physiological reactivity as a dysregulated fear response. Developmental Psychology, 40, 583-594. Buss, K.A., Schumacher, J.R.M., Dolski, I., Kalin, N.H., Goldsmith, H.H., & Davidson, R.J. (2003). Right frontal brain activity, cortisol, and withdrawal behavior in 6-month-old infants. Behavioral Neuroscience, 117, 11-20. Casey, B.J., Trainor, R.J., Orendi, J.L., Nystrom, L.E., Giedd, J.N., Castellanos, F.X., Haxby, J.V., Noll, D.C., Cohen, J.D., Forman, S.D., Dahl, R.E., & Rapoport, J.L. (1997). A developmental functional MRI study of prefrontal activation during performance of a Go-No-Go task. Journal of Cognitive Neuroscience, 9, 835-847. Caviness, Jr., V.S., Kennedy, D.N., Richelme, C., Rademacher, J., & Filipek, P.A. (1996). Cerebral Cortex, 6, 726-736. Clark, J.V., & Arkowitz, H. (1975). Social anxiety and self-evaluation of interpersonal performance. Psychological Reports, 36, 211-221. Cole, P.M., Zahn-Waxler, C., Fox, N.A., Usher, B.A., & Welsch, J.D. (1996). Individual differences in emotion regulation and behavior problems in preschool children. Journal of Abnormal Psychology, 105, 518-529. Crone, E.A., & Ridderinkhof, K.R. (2011). The developing brain: From theory to neuroimaging and back. Developmental Cognitive Neuroscience, 1, 101-109. Crowley, M.J., Wu, J., Crutcher, C., Bailey, C.A., Lejuez, C.W., & Mayes, L.C. (2010). Risk-taking and the feedback negativity response to loss among at-risk adolescents. Developmental Neuroscience, 31, 137-148. Davidson, R.J., Abercrombie, H., Nitschke, J.B., & Putnam, K. (1999). Regional brain function, emotion and disorders of emotion. Current Opinion in Neurobiology, 9, 228-234. Davidson, R.J., Marshall, J.R., Tomarken, A.J., & Henriques, J.B. (2000). While a phobic waits: Regional brain electrical and autonomic activity in social phobics during anticipation of public speaking. Biological Psychiatry, 47, 85-95. Davies, P.L., Segalowitz, S.J., & Gavin, W.J. (2004). Development of error-monitoring event-related potentials in adolescents. Annals of the New York Academy of Sciences, 1021, 324-328. DeBoer, T., Scott, L.S., & Nelson, C.A. (2005). ERPs in developmental populations. In T.C. Handy (Ed.), Event-related potentials: A methods handbook (pp. 263-298). Cambridge, MA: The MIT Press. DeBoer, T., Scott, L.S., & Nelson, C.A. (2007). Methods for acquiring and analyzing infant event-related potentials. In M. de Hann (Ed.), Infant EEG and event-related potentials: Studies in developmental psychology (pp. 5–38). New York: Psychology Press.
43
Dehane, S., Posner, M.I., & Tucker, D.M. (1994). Localization of a neural system for error detection and compensation. Psychological Science, 5, 303-305. Delorme, A., & Makeig, S. (2004). EEGLAB: An open source toolbox for analysis of single-trial EEG dynamics. Journal of Neuroscience Methods, 134, 9-21. Donchin, E., Gratton, G., Dupree, D., & Coles, M.G.H. (1988). After a rash action: Latency and amplitude of the P300 following fast guesses. In G. C.Galbraith, M. L.Kietzman, & E.Donchin (Eds.), Neurophysiology and psychophysiology: Experimental and clinical applications (pp. 173–188). Hillsdale, NJ: Erlbaum. Duncan-Johnson, C., & Donchin, E. (1981). The relation of P300 latency to reaction time as function of expectancy. In H. H.Kornhuber & L.Deecke (Eds.), Motivation, motor and sensory processes of the brain: Electrical potentials, behavior and clinical use. Progress in Brain Research (pp. 717– 722). Amsterdam: Elsevier-North Holland. Eisenberg, N., Fabes, R.A., Bernzweig, J., Karbon, M., Poulin, R., & Hanish, L. (1993). The relations of emotionality and regulation to preschoolers’ social skills and sociomentric status. Child Development, 64, 1418-1438. Else-Quest, N.M., Hyde, J.S., Goldsmith, H.H., & Van Hulle, C.A. (2006). Gender differences in temperament: A meta-analysis. Psychological Bulletin, 1323, 33-72. Eppinger, B., Mock, B., & Kray, J. (2009). Developmental differences in learning and error processing: Evidence from ERPs. Psychophysiology, 46, 1043-1053. Ernst, M., Nelson, E.E., McClure, E.B., Monk, C.S., Munson, S., Eshel, N., Zarahn, E., Leibenluft, E., Zametkin, A., Towbin, K., Blair, J., Charney, D., & Pine, D.S. (2004). Neuropsychologia, 42, 1585- 1597. Eysenck, M.W., & Calvo, M.G. (1992). Anxiety and performance: The processing efficiency theory. Cognition and Emotion, 6, 409–434. Eysenck, M.W., Derakshan, N., Santos, R., & Calvo, M.G. (2007). Anxiety and cognitive performance: Attentional control theory. Emotion, 7, 336-353. Falkenstein, M., Hohnsbein, J., & Hoormann, J., & Blanke, L. (1990). Effects of errors in choice reaction tasks on the ERP under focused and divided attention. In C. Brunia, A. Gailard, & A. Kok (Eds), Psychological Brain Research (pp.192-195). Tilburg, Netherlands: Tilburg University Press. Falkenstein, M., Hohnsbein, J., & Hoormann, J., & Blanke, L. (1991). Effects of crossmodal divided attention on late ERP components. II. Error processing in choice reaction tasks. Electroencephalography and Clinical Neurophysiology, 78, 447–455. Falkenstein, M., Hoormann, J., Christ, S., & Hohnsbein, J. (2000). ERP components on reaction errors and their functional significance: A tutorial. Biological Psychology, 51, 87-107.
44
Fan, J., McCandliss, B.D., Sommer, T., Raz, A., & Posner, M.I. (2002). Testing the efficiency and independence of attentional networks. Journal of Cognitive Neuroscience, 14, 340-347. Fox, E., Russo, R., Bowles, & Dutton, K. (2001). Do threatening stimuli draw or hold visual attention in subclinical anxiety? Journal of Experimental Psychology General, 130, 681-700. Fox, E., Russo, R., & Dutton, K. (2002). Attentional bias for threat: Evidence for delayed disengagement from emotional faces. Cognition and Emotion, 16, 355–379. Fox, N.A., Henderson, H.A., Marshall, P.J., Nichols, K.E., & Ghera, M.M. (2005). Behavioral inhibition: Linking biology and behavior within a developmental framework. Annual Review of Psychology, 56, 235-262. Fox, N.A., Henderson, H.A., Rubin, K.H., Calkins, S.D., & Schmidt, L.A. (2001). Continuity and discontinuity of behavioral inhibition and exuberance: Psychophysiological and behavioral influences across the first four years of life. Child Development, 72, 1-21. Garon, N., Bryson, S.E., & Smith, I.M. (2008). Executive function in preschoolers: A review using an integrative framework. Psychological Bulletin, 134, 31-60. Gehring, W.J., Goss, B., Coles, M.G.H., Meyer, D.E., & Donchin, E. (1993). A neural system for error detection and compensation. Psychological Science, 4, 385-390. Gehring, W.J., Himle, J., & Nisenson, L.G. (2000). Action-monitoring dysfunction in obsessive-compulsive disorder. Psychological Science, 11, 1-6. Gehring, W.J., & Knight, R.T. (2000). Prefrontal-cingulate interactions in action monitoring. Nature Neuroscience, 3, 516-520. Gehring, W. J. & Willoughby, A. R. (2004). Are all medial frontal negativities created equal? Toward a richer empirical basis for theories of action monitoring. In M. Ullsperger & M. Falkenstein (Eds.), Errors, Conflicts, and the Brain. Current Opinions on Performance Monitoring (pp. 14-20). Leipzig: Max Planck Institute of Cognitive Neuroscience. Goldman, P.S., Rosvold, H.E., Vest, B., & Galkin, T.W. (1971). Analysis of the delayed-alternation deficit produced by dorsolateral prefrontal lesions in the rhesus monkey. Journal of Comparative and Physiological Psychology, 77, 212-220. Goldsmith, H.H., Buss, A.H., Plomin, R., Rothbart, M.K., Thomas, A., Chess, S., Hinde, R.A., & McCall, R.B. (1987). Roundtable: What is temperament? Four approaches. Child Development, 58, 505-529. Goldsmith, H. H., Reilly, H. H., Lemery, K. S., Longley, S., & Prescott, A. (1994). Manual for the Preschool
Laboratory Temperament Assessment Battery (Lab-TAB). Unpublished manual, University of Wisconsin—Madison.
Gurley, D., Cohen, P., Pine, D.S., & Brook, J. (1996). Discriminating anxiety and depression in youth: A
role for diagnostic criteria. Journal of Affective Disorders, 39, 191-200.
45
Hajcak, G., Franklin, M.E., Foa, E.B., & Simons, R.F. (2008). Increased error-related brain activity in pediatric obsessive-compulsive disorder before and after treatment. American Journal of Psychiatry, 165, 116-123. Hajcak, G., MacDonald, N., & Simons, R.F. (2003). To err is autonomic: Error-related brain potentials, ANS activity, and post-error compensatory behavior. Psychophysiology, 40, 895-903. Hajcak, G., MacDonald, N., & Simons, R.F. (2004). Error-related psychophysiology and negative affect. Brain and Cognition, 56, 189-197. Hajcak, G. & Simons, R.F. (2002). Error-related brain activity in obsessive-compulsive undergraduates. Psychiatry Research, 110, 63-72 Hardin, M.G., Perez-Edgar, K., Guyer, A.E., Pine, D.S., Fox, N.A., & Ernst, M. (2006). Reward and punishment sensitivity in shy and non-shy adults: Relations between social and motivated behavior. Personality and Individual Differences, 40, 699-711. Hogan, A.M., Vargha-Khadem, F., Kirkham, F.J., & Baldeweg, T. (2005). Maturation of action monitoring from adolescence to adulthood. Developmental Science, 8, 525-534. Holroyd, C.B., & Coles, M.G.H. (2002). The neural basis of human error processing: Reinforcement learning, dopamine, and the error-related negativity. Psychological Review, 109, 679-709. Huttenlocher, P.R. (1990). Morphometric study of human cerebral cortex development. Neuropsychologia, 28, 517-527. Jacques, S., Zelazo, P.D., Kirkham, N.Z., & Semcesen, T.K. (1999). Rule selection versus rule execution in preschoolers: An error-detection approach. Developmental Psychology, 35, 770-780. Jonkman, L.M., van Melis, J.J.M., Kemner, C., & Markus, C.R. (2007). Methylphenidate improves deficient error evaluation in children with ADHD: An event-related brain potential study. Biological Psychology, 76, 217-229. Kagan, J. (1994). The nature of the child. New York: Basic Books. Kagan, J., & Snidman, N. (1999). Early predictors of adult anxiety disorders. Biological Psychiatry, 46, 1536-1541. Kim, E.Y., Iwaki, N., Imashioya, H., Uno, H., & Fujita, T. (2007). Error-related negativitiy in a visual go/no- go task: Children vs. adults. Developmental Neuropsychology, 31, 181-191. Knutson, B., Adams, C.M., Fong, G.W., & Hommer, D. (2001). Anticipation of increasing monetary reward selectively recruits nucleus accumbens. Journal of Neuroscience, 21, RC159. Kochanska, G., Murray, K.T., & Harlan, E.T. (2000). Effortful control in early childhood: Continuity and change, antecedents, and implications for social development. Developmental Psychology, 36, 220-232.
46
Ladouceur, C.D., Dahl, R.E., Birmaher, B., Axelson, D.A., & Ryan, N.D. (2006). Increased error-related negativity (ERN) in childhood anxiety disorders: ERP and source localization. Journal of Child Psychology and Psychiatry, 47, 1073-1082. Ladouceur, C.D., Dahl, R.E., & Carter, C.S. (2004). ERP correlates of action monitoring in adolescence. Annals of the New York Academy of Sciences, 1021, 329-336. Ladouceur, C.D., Dahl, R.E., & Carter, C.S. (2007). Development of action monitoring through adolescence into adulthood: ERP and source localization. Developmental Science, 10, 874-891. Leuthold, H., & Sommer, W. (1999). ERP correlates of error processing in spatial S-R compatibility tasks. Clinical Neurophysiology, 110, 342-457. Lonigan, C.J., & Vasey, M.W. (2009). Negative affectivity, effortful control, and attention to threat- relevant stimuli. Journal of Abnormal Child Psychology, 37, 387-399. Luck, S.J. (2005). An introduction to the event-related potential technique. Cambridge, MA: MIT Press. Luna, B., Thulborn, K.R., Munoz, D.P., Merriam, E.P., Garver, K.E., Minshew, N.J., Keshavan, M.S., Genovese, C.R., Eddy, W.F., & Sweeney, J.A. (2001). Maturation of widely distributed brain function subserves cognitive development. Neuroimage, 13, 786-793. Luu, P., Flaisch, T., & Tucker, D.M. (2000). Medial frontal cortex in action monitoring. The Journal of Neuroscience, 20, 464-469. Luu, P., & Pederson, S.M. (2004). The anterior cingulate cortex: Regulating actions in context. In M. I. Posner (Ed.), Cognitive neuroscience of attention (pp.232-244). New York: Guilford Press. Luu, P., Tucker, D.M., Derryberry, D., Reed, M., & Poulsen, C. (2003). Electrophysiological responses to errors and feedback in the process of action regulation. Psychological Science, 14, 47-53. Martin McDermott, J. (2008). The response-monitoring mechanism: Influence of feedback and temperament (Unpublished doctoral dissertation). University of Maryland, College Park, MD. Mash, E.J., & Barkley, R.A. (2003). Child Psychopathology. New York: Guilford Press. Mathews, A., & Mackintosh, B. (1998). A cognitive model of selective processing in anxiety. Cognitive Therapy and Research, 22, 539 – 560. Messer, S. (1970). The effect of anxiety over intellectual performance on reflection-impulsivity in children. Child Development, 41, 723-735. McDermott, J.M., Perez-Edgar, K., Henderson, H.A., Chronis-Tuscano, A., Pine, D.S., & Fox, N. (2009). A history of childhood behavioral inhibition and enhanced response monitoring in adolescence are linked to clinical anxiety. Biological Psychiatry, 65, 445-448. Mogg, K., & Bradley, B.P. (1998). A cognitive-motivational analysis of anxiety. Behaviour and Research
47
Therapy, 36, 809-848. Mogg, K., Bradley, B.P., De Bono, J., & Painter, M. (1997). Time course of attentional bias for threat information in non-clinical anxiety. Behavioral Research and Therapy, 35, 297-303. Monk, C.S., & Pine, D.S. (2004). Childhood anxiety disorders: A cognitive neurobiological perspective. In D.S. Charney & E. Nestler (Eds). Neurobiology of Mental Illness (pp.1022–1048). Oxford University Press; New York. Nieuwenhuis, S., Nielen, M.M., Mol, N., Hajcak, G., & Veltman, D.J. (2005). Performance monitoring in obsessive-compulsive disorder. Psychiatry Research, 134, 111-122. Nieuwenhuis, S., Ridderinkhof, K.R., Blom, J., Band, G.P.H., & Kok, A. (2001). Error-related brain potentials are differentially related to awareness of response errors: Evidence from an antisaccade task. Psychophysiology, 38, 752-760. Nigg, J. (2006). Temperament and developmental psychopathology. Journal of Child Psychology and Psychiatry, 47, 395-422. Olvet, D.M., & Hajcak, G. (2008). The error-related negativity (ERN) and psychopathology: Toward an endophenotype. Clinical Psychology Review, 28, 1343-1354. Olvet, D.M., & Hajcak, G. (2009). The stability of error-related brain activity with increasing trials. Psychophysiology, 46, 1-5. Overbeek, T.J.M., Nieuwenhuis, S., & Ridderinkhof, K.R. (2005). Dissociable components of error processing: On the functional significance of the Pe. Journal of Psychophysiology, 19, 319-329. Pailing, P.E., & Segalowitz, S.J. (2004). The error-related negativity as a state and trait measure: Motivation, personality, and ERPs in response to errors. Psychophysiology, 41, 84-95. Pailing, P.E., Segalowitz, S.J., Dywan, J., & Davies, P.L. (2002). Error negativity and response control. Psychophysiology, 39, 198-206. Patrick, C.J., & Bernat, E.M. (2010). Neuroscientific foundations of psychopathology. In T. Millon, R.F. Krueger, & E. Simonsen (Eds.), Contemporary directions in psychopathology: Scientific foundations of the DSM-V and ICD-11 (pp. 419-452). New York: The Guilford Press. Pérez-Edgar, K., Bar-Haim, Y., Martin McDermott, J., Chronis-Tuscano, A., Pine, D.S., & Fox, N.A. (2010a). Attention biases to threat and behavioral inhibition in early childhood shape adolescent social withdrawal. Emotion, 10, 349-357. Pérez-Edgar, K., Martin McDermott, J.N., Korelitz, K., Degnan, K.A., Curby, T.W., Pine, D.S., & Fox, N.A. (2010b). Patterns of sustained attention in infancy shape the developmental trajectory of social behavior from toddlerhood through adolescence. Develomental Psychology, 46, 1723-1730. Pontifex, M.B., Scudder, M.R., Brown, M.L., O’Leary, K.C., Wu, C., Themanson, J.R., & Hillman, C.H.
48
(2010). On the number of trials necessary for stabilization of error-related brain activity across the lifespan. Psychophysiology, 47, 767-773.
Posner, M.I. & Rothbart, M.K. (2000). Developing mechanisms of self-regulation. Development and Psychopathology, 12, 427-441.
Putnam, S.P., & Rothbart, M.K. (2006). Development of short and very short forms of the Children's Behavior Questionnaire. Journal of Personality Assessment, 87 (1), 103-113.
Rueda, M.R., Fan, J., McCandliss, B., Halparin, J., Gruber, D., Lercari, L., & Posner, M. (2004). Development of attentional networks in childhood. Neuropsychologia, 42, 1029-1040. Rueda, M.R., Posner, M.I., & Rothbart, M.K. (2005). The development of executive attention: Contributions to the emergence of self-regulation. Developmental Neuropsychology, 28, 573-594.
Ruff, H.A., & Rothbart, M.K. (1996). Attention in early development: Themes and variations. New York: Oxford University Press. Santesso, D.L., Segalowitz, S.J. & Schmidt, L.A. (2005). Diminished error-related negativity in 10-year-old children with poor social behavior. Biological Psychology, 70, 79-87. Santesso, D.L., Segalowitz, S.J. & Schmidt, L.A. (2006). Error-related electrocortical responses in 10-year- old children and young adults. Developmental Science, 9, 473-481. Scheffers, M.K., & Coles, M.G.H. (2000). Performance monitoring in a confusing world: Error-related brain activity, judgments of response accuracy, and types of errors. Journal of Experimental Psychology: Human Perception and Performance, 26, 141-151.
Segalowitz, S.J., & Davies, P.L. (2004). Charting the maturation of the frontal lobe: An electrophysiological strategy. Brain and Cognition, 55, 116-133. Segalowitz, S.J., Santesso, D.L., Murphy, T.I., Homan, D., Chantziantoniou, D.K., & Khan, S. (2010). Retest reliability of medial frontal negativities during performance monitoring. Psychophysiology, 47, 260-270. Shaffer, D., Fisher, P., Dulcan, M.K., Davis, D., Piacentini, J., Schwab-Stone, M., Lahey, B., Bourdon, K., Jensen, P., Bird, H., Canino, G., & Regier, D. (1996). The NIMH Diagnositc Interview Schedule for Children, Version 2.3. (DISC 2.3): Description, acceptability, prevalence rates, and performance in the MECA study. Journal of the American Academy of Child and Adolescent Psychiatry, 49, 865-877. Steiben, J., Lewis, M.D., Granic, I., Zelazo, P.D., Segalowitz, S., & Pepler, D. (2007). Neurophysiological mechanisms of emotion regulation for subtypes of externalizing children. Development and Psychopathology, 19, 455-480. Stifter, C.A., & Corey, J.M. (2001). Vagal regulation and observed social behavior in infancy. Social Development, 10, 189-201.
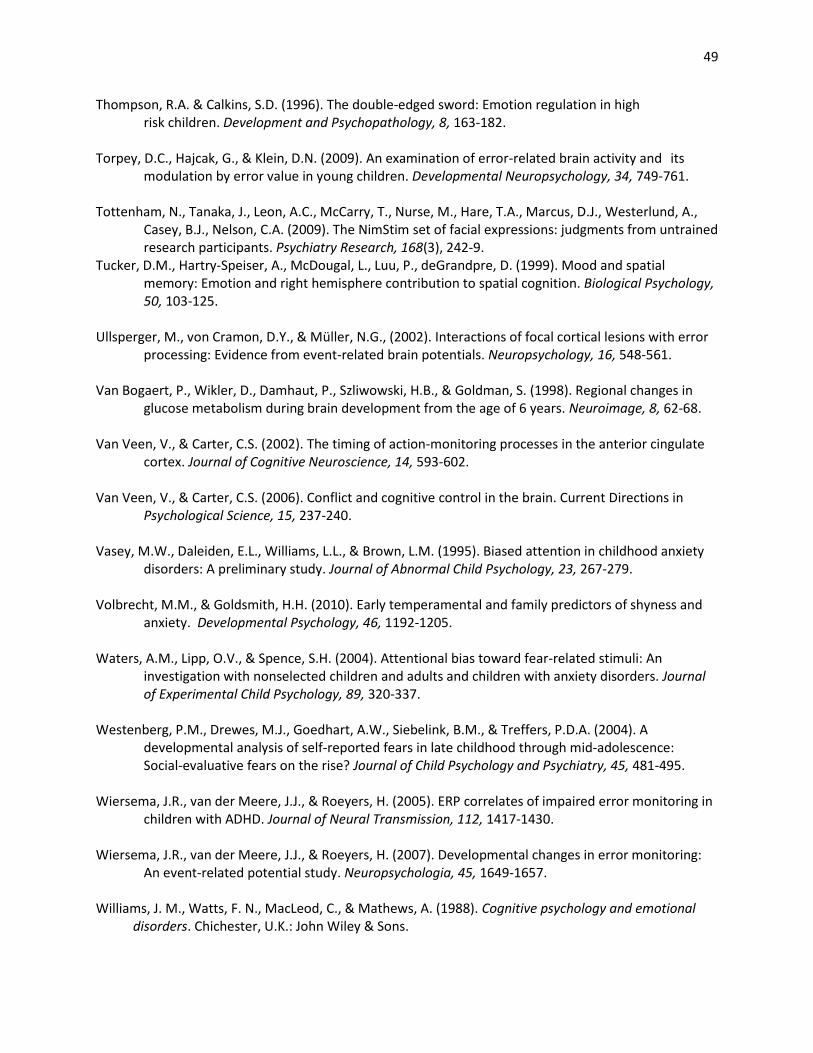
49
Thompson, R.A. & Calkins, S.D. (1996). The double-edged sword: Emotion regulation in high risk children. Development and Psychopathology, 8, 163-182. Torpey, D.C., Hajcak, G., & Klein, D.N. (2009). An examination of error-related brain activity and its modulation by error value in young children. Developmental Neuropsychology, 34, 749-761. Tottenham, N., Tanaka, J., Leon, A.C., McCarry, T., Nurse, M., Hare, T.A., Marcus, D.J., Westerlund, A., Casey, B.J., Nelson, C.A. (2009). The NimStim set of facial expressions: judgments from untrained research participants. Psychiatry Research, 168(3), 242-9. Tucker, D.M., Hartry-Speiser, A., McDougal, L., Luu, P., deGrandpre, D. (1999). Mood and spatial memory: Emotion and right hemisphere contribution to spatial cognition. Biological Psychology, 50, 103-125. Ullsperger, M., von Cramon, D.Y., & Müller, N.G., (2002). Interactions of focal cortical lesions with error processing: Evidence from event-related brain potentials. Neuropsychology, 16, 548-561. Van Bogaert, P., Wikler, D., Damhaut, P., Szliwowski, H.B., & Goldman, S. (1998). Regional changes in glucose metabolism during brain development from the age of 6 years. Neuroimage, 8, 62-68. Van Veen, V., & Carter, C.S. (2002). The timing of action-monitoring processes in the anterior cingulate cortex. Journal of Cognitive Neuroscience, 14, 593-602. Van Veen, V., & Carter, C.S. (2006). Conflict and cognitive control in the brain. Current Directions in Psychological Science, 15, 237-240. Vasey, M.W., Daleiden, E.L., Williams, L.L., & Brown, L.M. (1995). Biased attention in childhood anxiety disorders: A preliminary study. Journal of Abnormal Child Psychology, 23, 267-279. Volbrecht, M.M., & Goldsmith, H.H. (2010). Early temperamental and family predictors of shyness and anxiety. Developmental Psychology, 46, 1192-1205. Waters, A.M., Lipp, O.V., & Spence, S.H. (2004). Attentional bias toward fear-related stimuli: An investigation with nonselected children and adults and children with anxiety disorders. Journal of Experimental Child Psychology, 89, 320-337. Westenberg, P.M., Drewes, M.J., Goedhart, A.W., Siebelink, B.M., & Treffers, P.D.A. (2004). A developmental analysis of self-reported fears in late childhood through mid-adolescence: Social-evaluative fears on the rise? Journal of Child Psychology and Psychiatry, 45, 481-495. Wiersema, J.R., van der Meere, J.J., & Roeyers, H. (2005). ERP correlates of impaired error monitoring in children with ADHD. Journal of Neural Transmission, 112, 1417-1430. Wiersema, J.R., van der Meere, J.J., & Roeyers, H. (2007). Developmental changes in error monitoring: An event-related potential study. Neuropsychologia, 45, 1649-1657. Williams, J. M., Watts, F. N., MacLeod, C., & Mathews, A. (1988). Cognitive psychology and emotional disorders. Chichester, U.K.: John Wiley & Sons.

50
Williams, J. M., Watts, F. N., MacLeod, C., & Mathews, A. (1997). Cognitive psychology and emotional disorders. (2nd ed.) Chichester, U.K.: John Wiley & Sons. Zelazo, P., & Müller, U. (2002). Executive function in typical and atypical development. In U. Goswami (Ed.), Handbook of childhood cognitive development (pp. 445-469). Oxford, England: Blackwell Publishers.
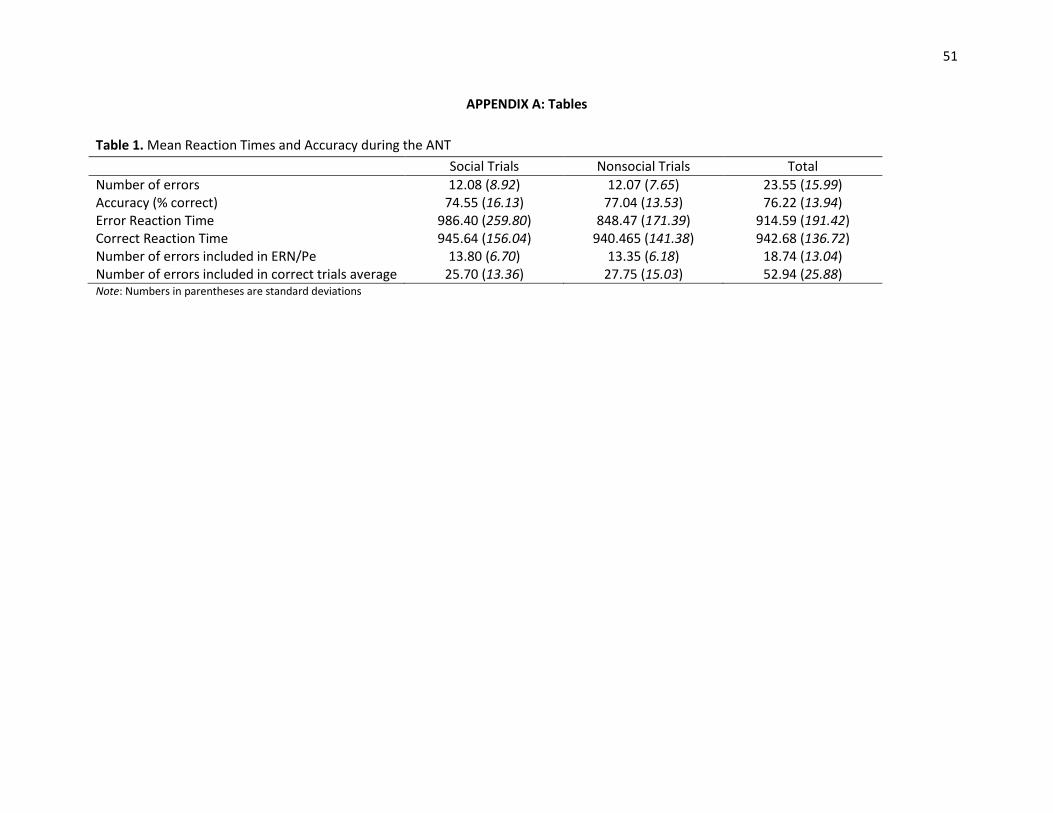
51
APPENDIX A: Tables
Table 1. Mean Reaction Times and Accuracy during the ANT
Social Trials Nonsocial Trials Total
Number of errors 12.08 (8.92) 12.07 (7.65) 23.55 (15.99) Accuracy (% correct) 74.55 (16.13) 77.04 (13.53) 76.22 (13.94) Error Reaction Time 986.40 (259.80) 848.47 (171.39) 914.59 (191.42) Correct Reaction Time 945.64 (156.04) 940.465 (141.38) 942.68 (136.72) Number of errors included in ERN/Pe 13.80 (6.70) 13.35 (6.18) 18.74 (13.04) Number of errors included in correct trials average 25.70 (13.36) 27.75 (15.03) 52.94 (25.88) Note: Numbers in parentheses are standard deviations
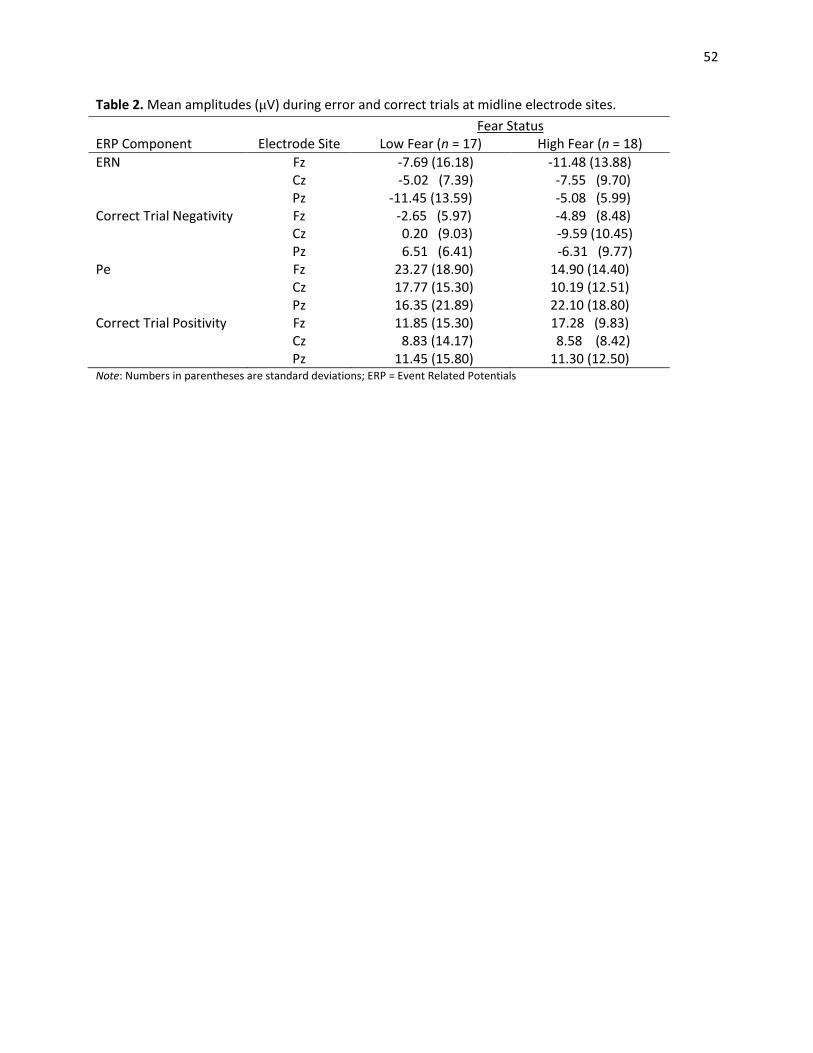
52
Table 2. Mean amplitudes (μV) during error and correct trials at midline electrode sites.
Fear Status ERP Component Electrode Site Low Fear (n = 17) High Fear (n = 18)
ERN Fz -7.69 (16.18) -11.48 (13.88) Cz -5.02 (7.39) -7.55 (9.70) Pz -11.45 (13.59) -5.08 (5.99) Correct Trial Negativity Fz -2.65 (5.97) -4.89 (8.48) Cz 0.20 (9.03) -9.59 (10.45) Pz 6.51 (6.41) -6.31 (9.77) Pe Fz 23.27 (18.90) 14.90 (14.40) Cz 17.77 (15.30) 10.19 (12.51) Pz 16.35 (21.89) 22.10 (18.80) Correct Trial Positivity Fz 11.85 (15.30) 17.28 (9.83) Cz 8.83 (14.17) 8.58 (8.42) Pz 11.45 (15.80) 11.30 (12.50) Note: Numbers in parentheses are standard deviations; ERP = Event Related Potentials
53
Table 3. Partial Correlations Between ERN and Observed and Parent-Reported Behavior in (a) Low-fear and (b) High-fear Children
(a).
Parent-Reported Fear
Parent-Reported Shyness
Parent-Reported Effortful Control
Observed Shyness/Withdrawal
Observed Positive Engagement
Post-Error Slowing
Cognitive control
ERN at Fz -.33 .14 -.65* -.56
* .07 -.60
* .08
ERN at Cz .58* -.30 .00 .23 -.04 .07 -.02
(b).
Parent-Reported Fear
Parent-Reported Shyness
Parent-Reported Effortful Control
Observed Shyness/Withdrawal
Observed Positive Engagement
Post-Error Slowing
Cognitive control
ERN at Fz .14 -.02 -.10 -.19 -.23 .17 .23
ERN at Cz -.22 .34 -.23 .01 -.03 -.35 .14
Note: *p < .05
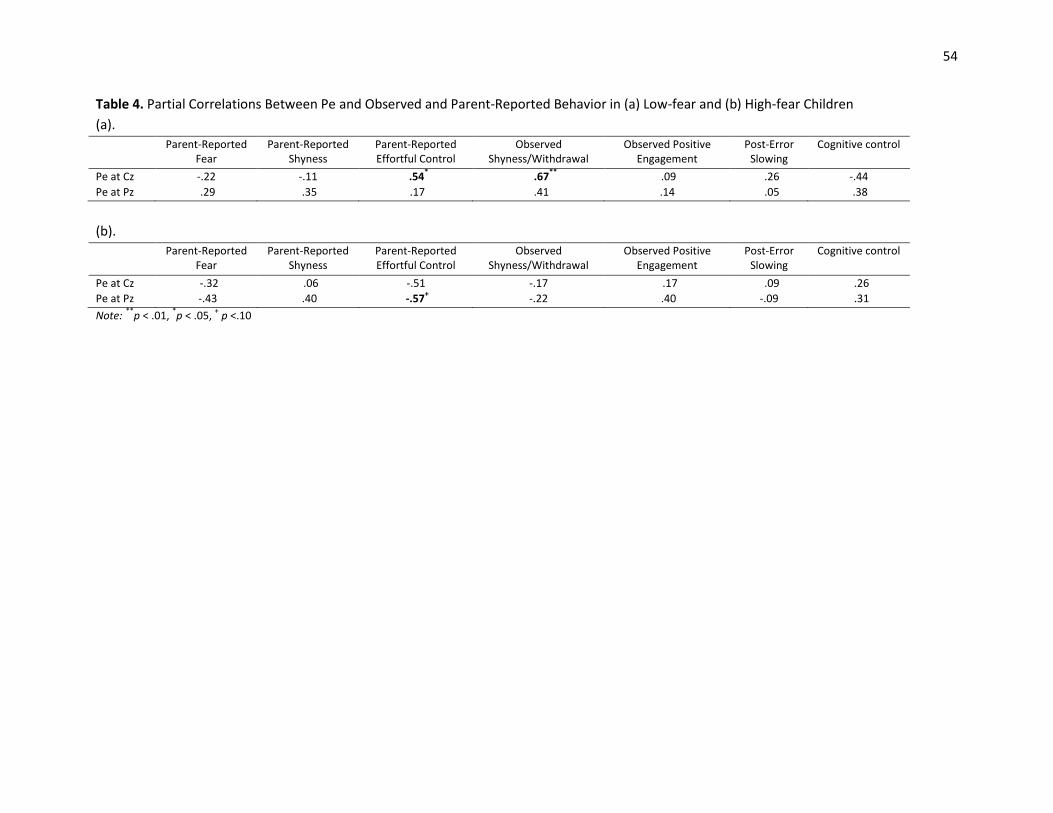
54
Table 4. Partial Correlations Between Pe and Observed and Parent-Reported Behavior in (a) Low-fear and (b) High-fear Children
(a).
Parent-Reported Fear
Parent-Reported Shyness
Parent-Reported Effortful Control
Observed Shyness/Withdrawal
Observed Positive Engagement
Post-Error Slowing
Cognitive control
Pe at Cz -.22 -.11 .54* .67
** .09 .26 -.44
Pe at Pz .29 .35 .17 .41 .14 .05 .38
(b).
Parent-Reported Fear
Parent-Reported Shyness
Parent-Reported Effortful Control
Observed Shyness/Withdrawal
Observed Positive Engagement
Post-Error Slowing
Cognitive control
Pe at Cz -.32 .06 -.51 -.17 .17 .09 .26
Pe at Pz -.43 .40 -.57+ -.22 .40 -.09 .31
Note: **p < .01,
*p < .05,
+ p <.10
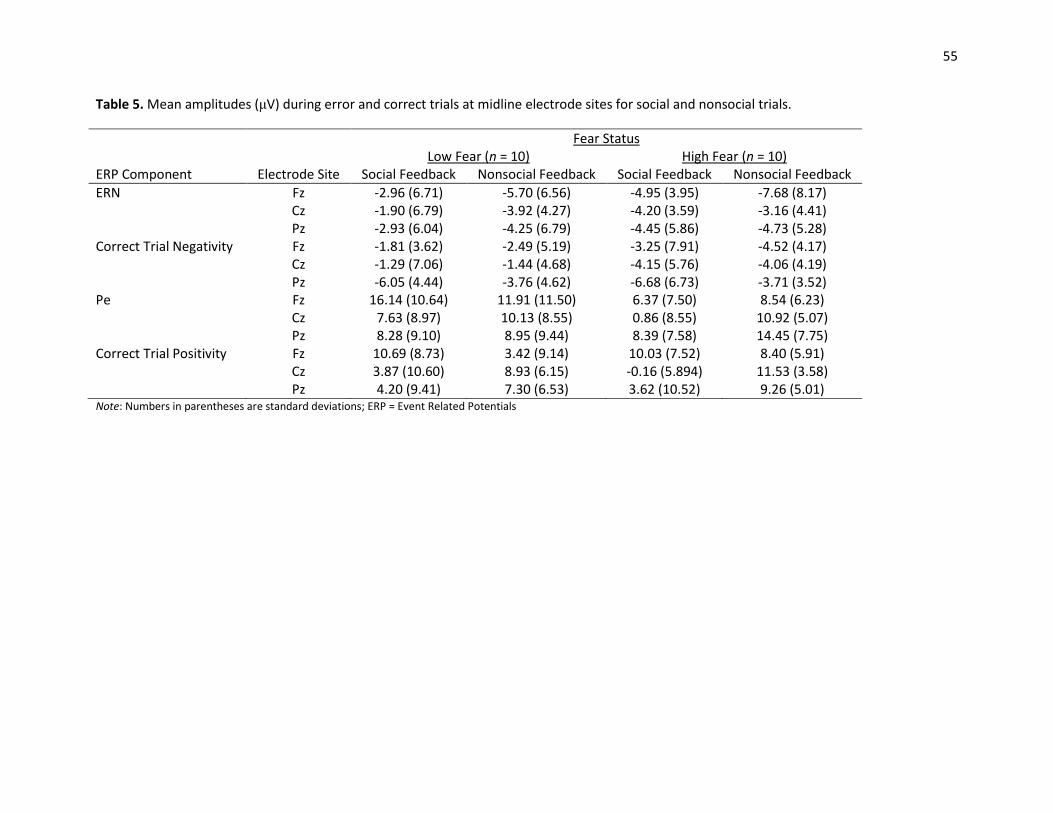
55
Table 5. Mean amplitudes (μV) during error and correct trials at midline electrode sites for social and nonsocial trials.
Fear Status Low Fear (n = 10) High Fear (n = 10) ERP Component Electrode Site Social Feedback Nonsocial Feedback Social Feedback Nonsocial Feedback
ERN Fz -2.96 (6.71) -5.70 (6.56) -4.95 (3.95) -7.68 (8.17) Cz -1.90 (6.79) -3.92 (4.27) -4.20 (3.59) -3.16 (4.41) Pz -2.93 (6.04) -4.25 (6.79) -4.45 (5.86) -4.73 (5.28) Correct Trial Negativity Fz -1.81 (3.62) -2.49 (5.19) -3.25 (7.91) -4.52 (4.17) Cz -1.29 (7.06) -1.44 (4.68) -4.15 (5.76) -4.06 (4.19) Pz -6.05 (4.44) -3.76 (4.62) -6.68 (6.73) -3.71 (3.52) Pe Fz 16.14 (10.64) 11.91 (11.50) 6.37 (7.50) 8.54 (6.23) Cz 7.63 (8.97) 10.13 (8.55) 0.86 (8.55) 10.92 (5.07) Pz 8.28 (9.10) 8.95 (9.44) 8.39 (7.58) 14.45 (7.75) Correct Trial Positivity Fz 10.69 (8.73) 3.42 (9.14) 10.03 (7.52) 8.40 (5.91) Cz 3.87 (10.60) 8.93 (6.15) -0.16 (5.894) 11.53 (3.58) Pz 4.20 (9.41) 7.30 (6.53) 3.62 (10.52) 9.26 (5.01) Note: Numbers in parentheses are standard deviations; ERP = Event Related Potentials
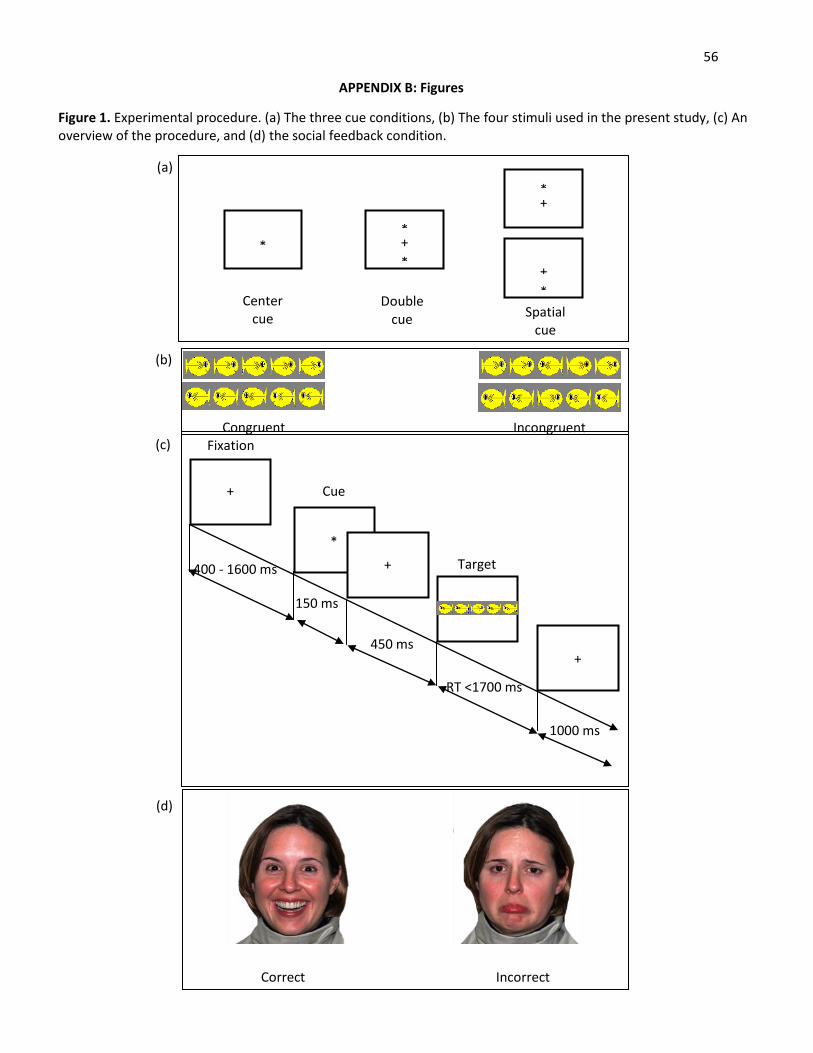
56
Figure 1. Experimental procedure. (a) The three cue conditions, (b) The four stimuli used in the present study, (c) An overview of the procedure, and (d) the social feedback condition.
(d)
(a)
400 - 1600 ms
150 ms
450 ms
RT <1700 ms
1000 ms
Fixation
*
+
Cue
Target
+
+
(c)
(b)
Incongruent Congruent
Correct Incorrect
+
+
*
Center cue
+
*
*
*
*
Double cue
Spatial cue
APPENDIX B: Figures
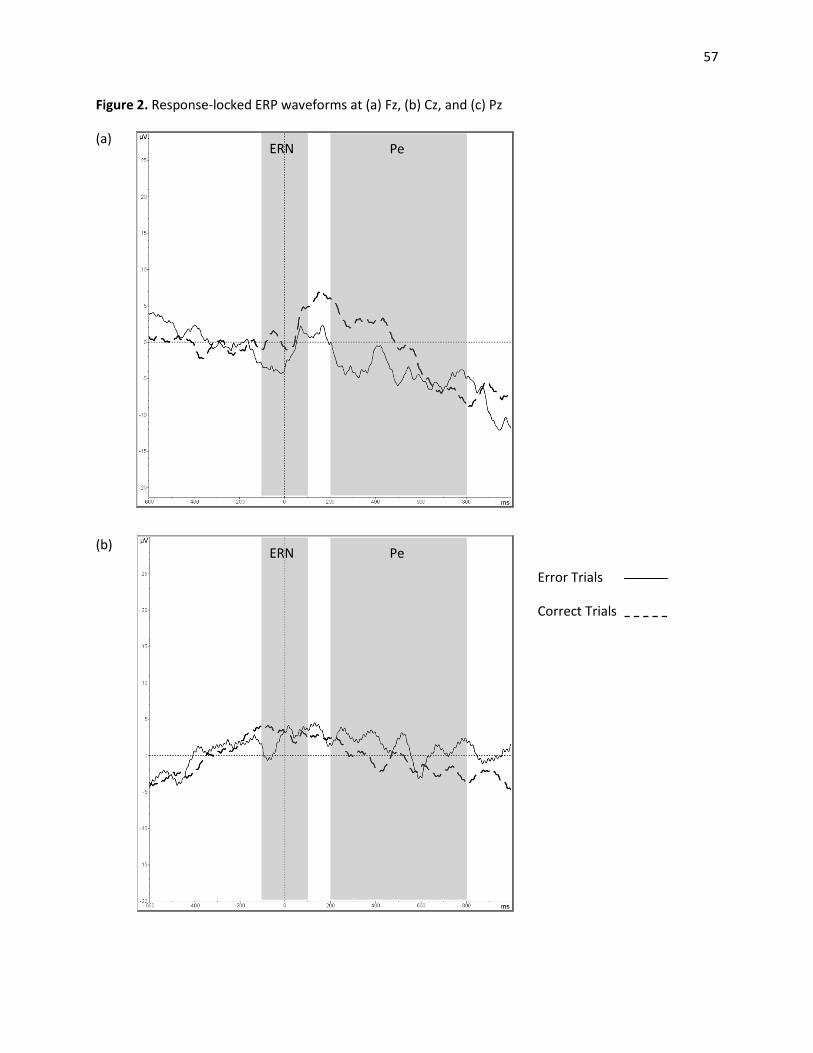
57
Figure 2. Response-locked ERP waveforms at (a) Fz, (b) Cz, and (c) Pz
(a)
(b)
ERN Pe
Error Trials
Correct Trials
Pe ERN
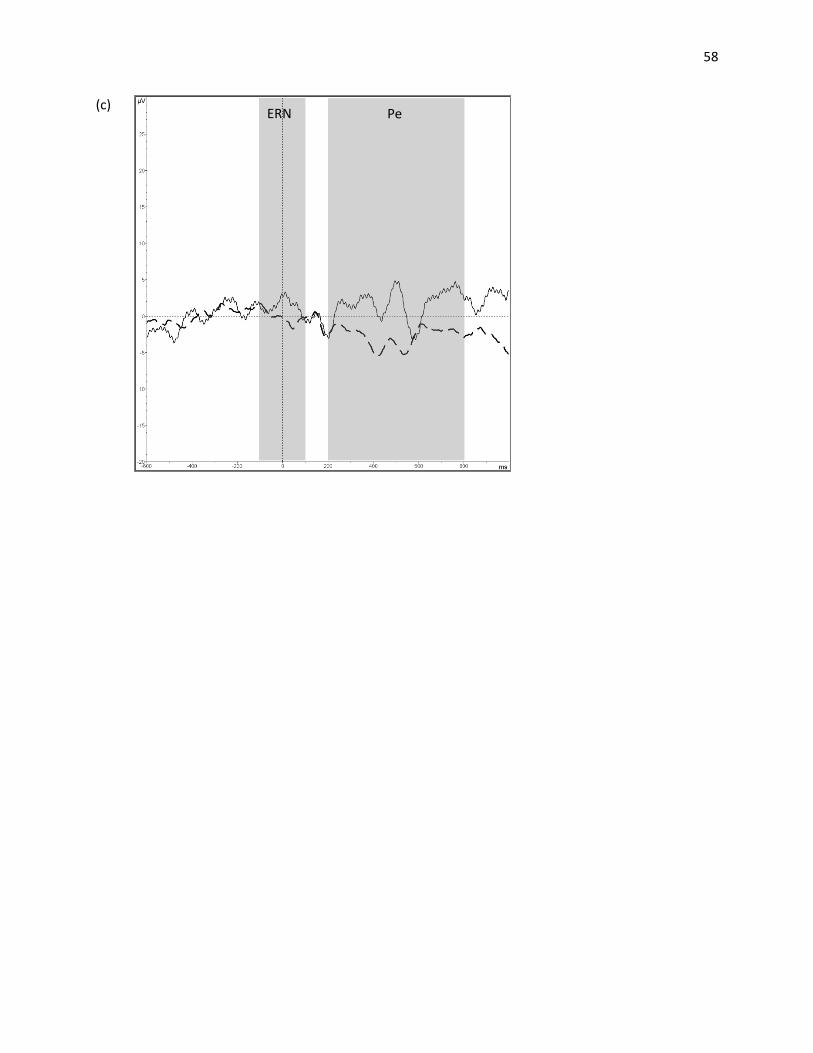
58
(c) ERN Pe
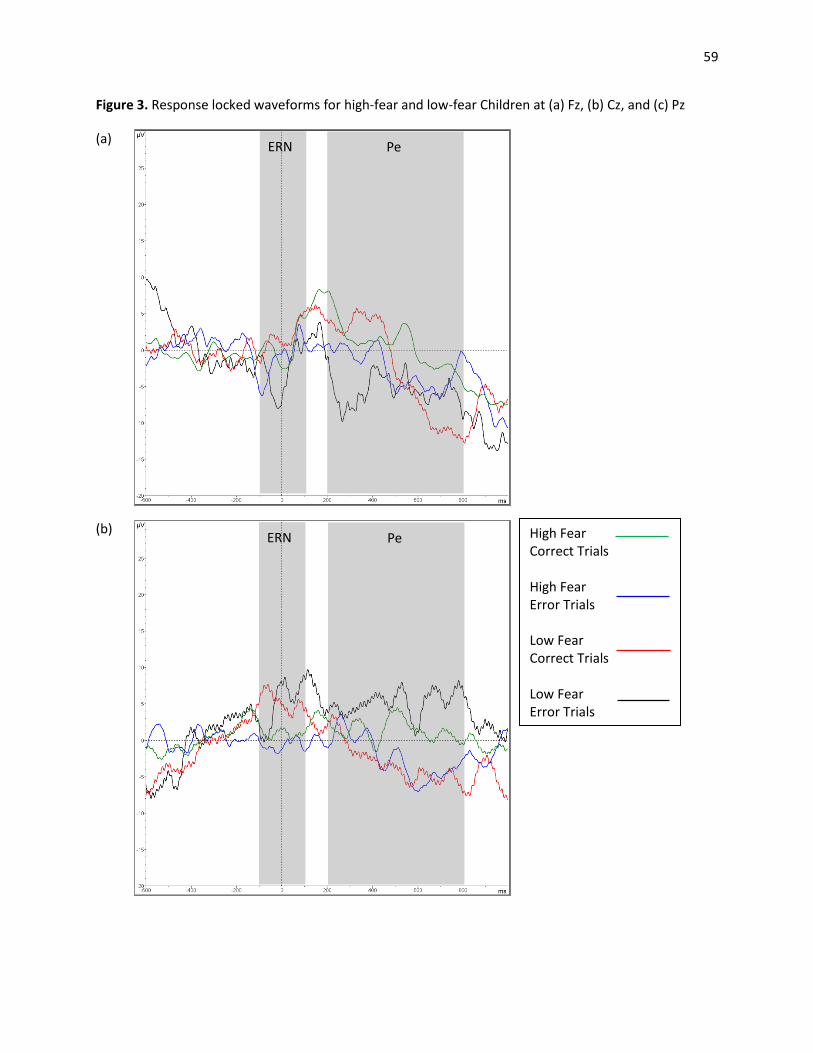
59
Figure 3. Response locked waveforms for high-fear and low-fear Children at (a) Fz, (b) Cz, and (c) Pz
(a)
(b)
High Fear Correct Trials High Fear Error Trials Low Fear Correct Trials Low Fear Error Trials
ERN Pe
ERN Pe
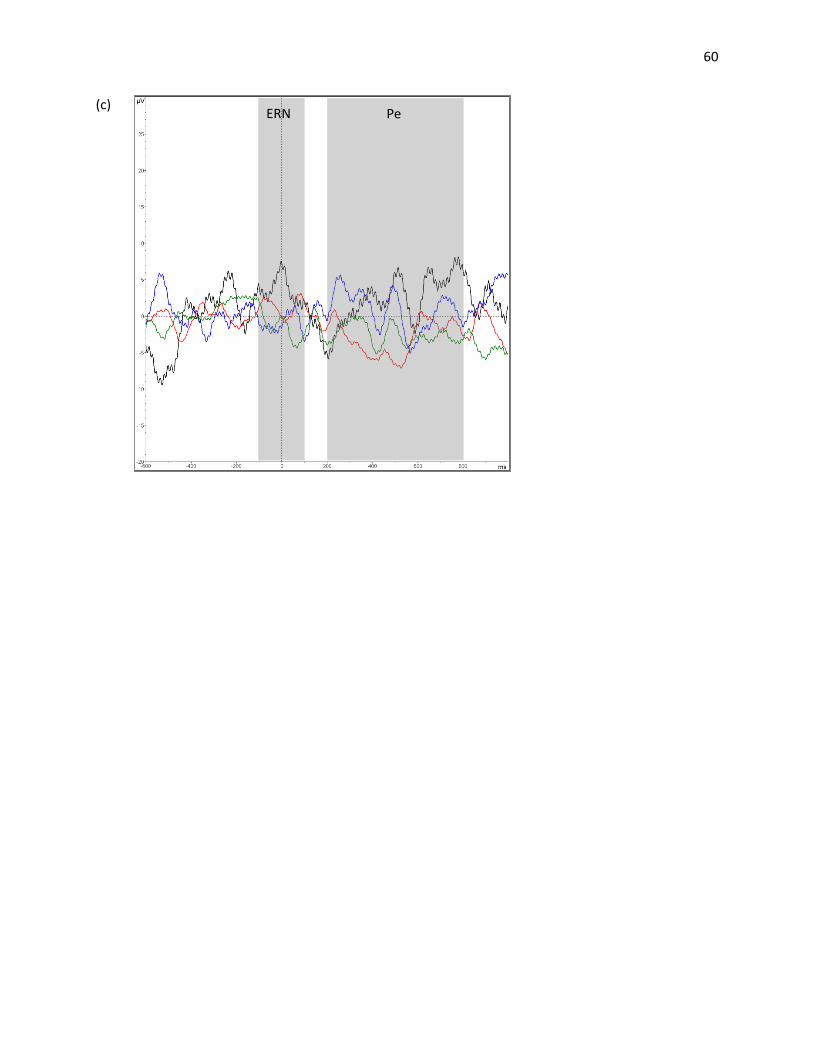
60
(c) ERN Pe
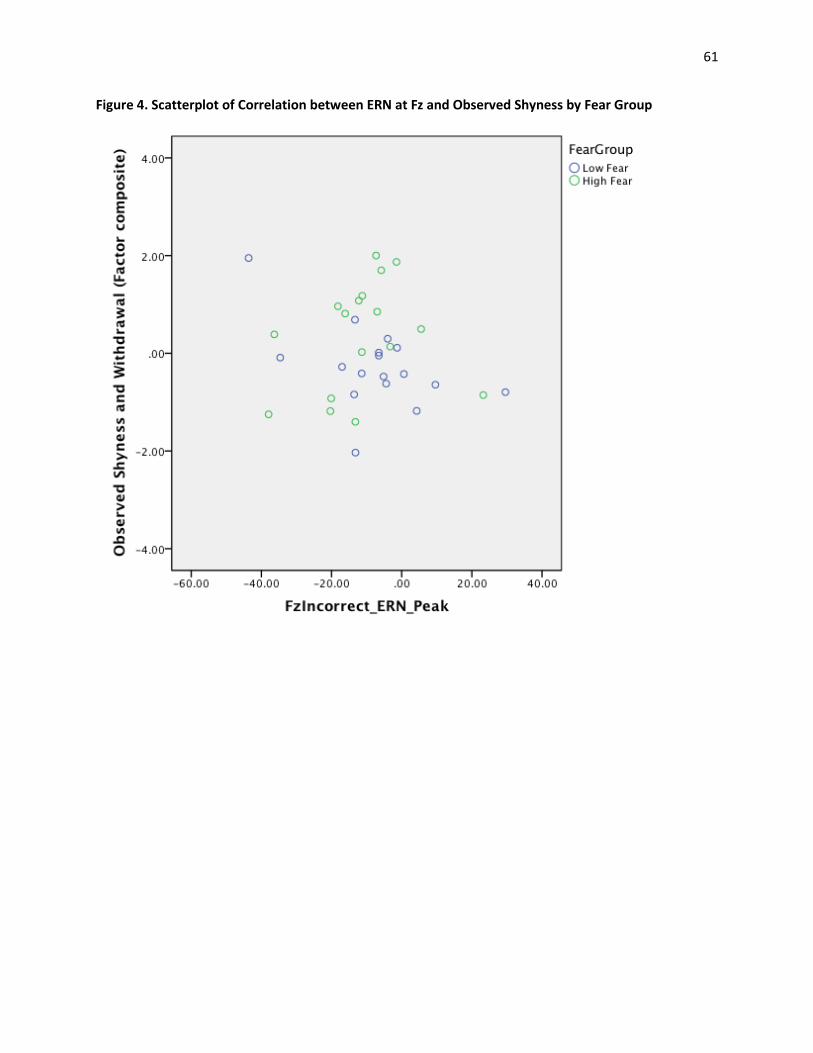
61
Figure 4. Scatterplot of Correlation between ERN at Fz and Observed Shyness by Fear Group
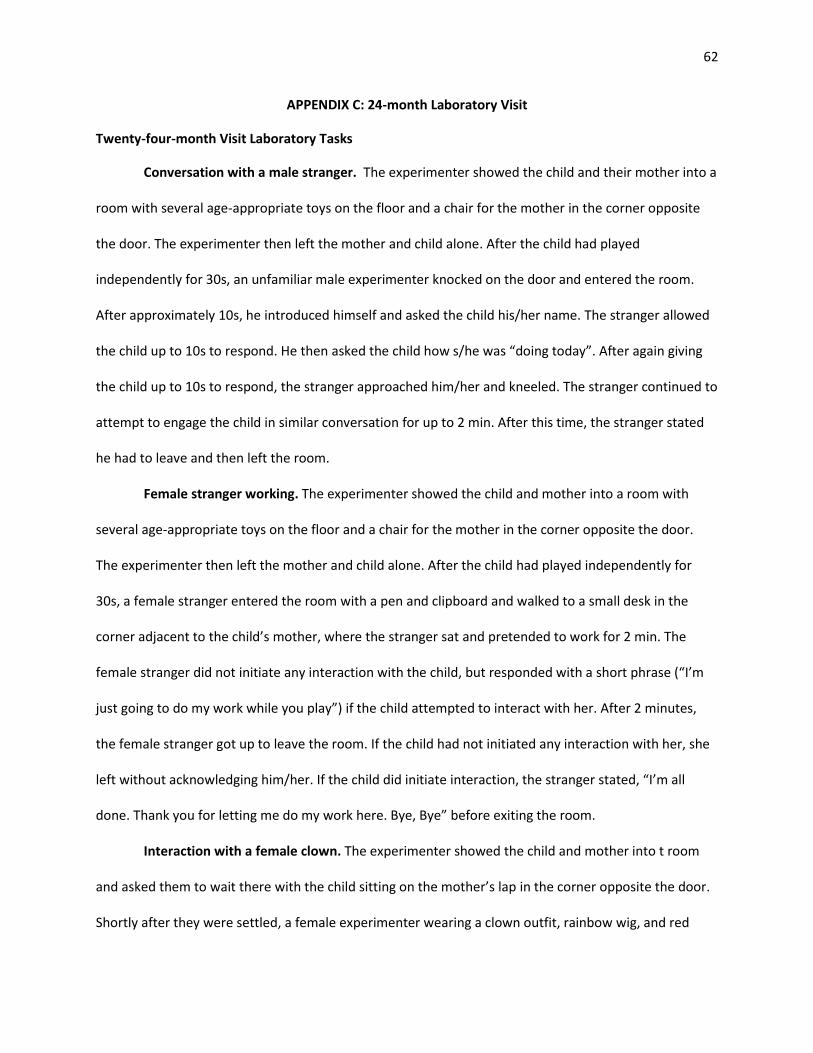
62
APPENDIX C: 24-month Laboratory Visit
Twenty-four-month Visit Laboratory Tasks
Conversation with a male stranger. The experimenter showed the child and their mother into a
room with several age-appropriate toys on the floor and a chair for the mother in the corner opposite
the door. The experimenter then left the mother and child alone. After the child had played
independently for 30s, an unfamiliar male experimenter knocked on the door and entered the room.
After approximately 10s, he introduced himself and asked the child his/her name. The stranger allowed
the child up to 10s to respond. He then asked the child how s/he was “doing today”. After again giving
the child up to 10s to respond, the stranger approached him/her and kneeled. The stranger continued to
attempt to engage the child in similar conversation for up to 2 min. After this time, the stranger stated
he had to leave and then left the room.
Female stranger working. The experimenter showed the child and mother into a room with
several age-appropriate toys on the floor and a chair for the mother in the corner opposite the door.
The experimenter then left the mother and child alone. After the child had played independently for
30s, a female stranger entered the room with a pen and clipboard and walked to a small desk in the
corner adjacent to the child’s mother, where the stranger sat and pretended to work for 2 min. The
female stranger did not initiate any interaction with the child, but responded with a short phrase (“I’m
just going to do my work while you play”) if the child attempted to interact with her. After 2 minutes,
the female stranger got up to leave the room. If the child had not initiated any interaction with her, she
left without acknowledging him/her. If the child did initiate interaction, the stranger stated, “I’m all
done. Thank you for letting me do my work here. Bye, Bye” before exiting the room.
Interaction with a female clown. The experimenter showed the child and mother into t room
and asked them to wait there with the child sitting on the mother’s lap in the corner opposite the door.
Shortly after they were settled, a female experimenter wearing a clown outfit, rainbow wig, and red
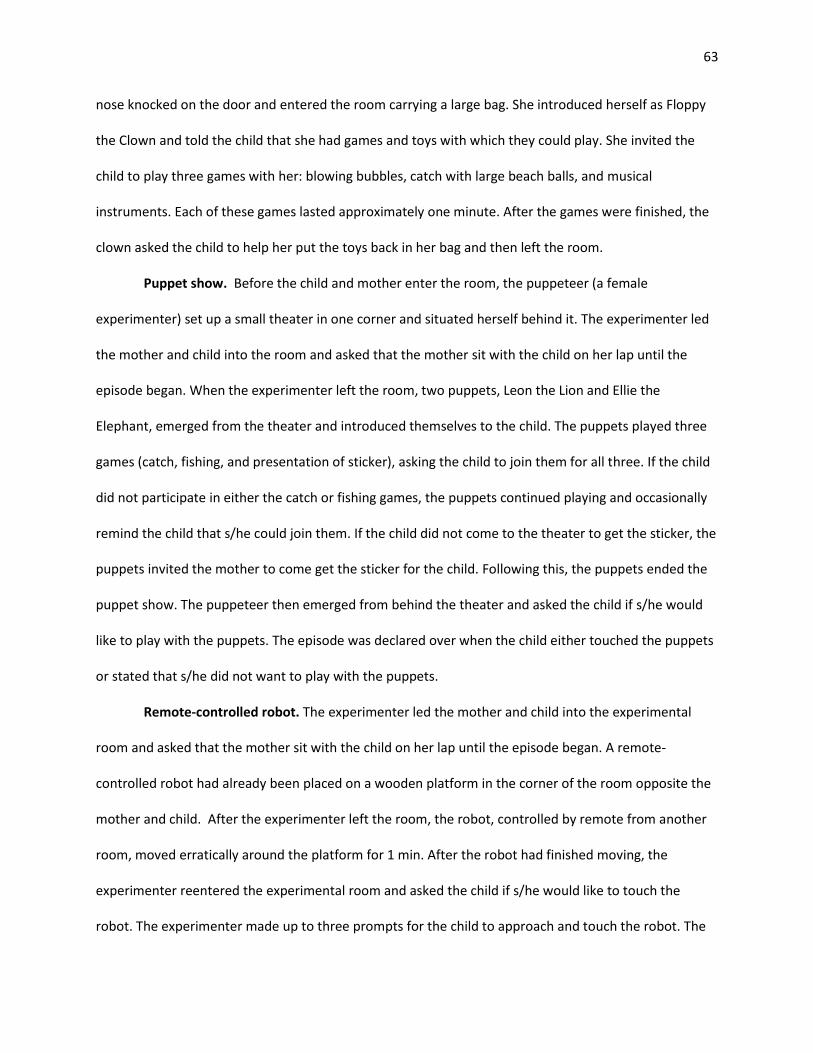
63
nose knocked on the door and entered the room carrying a large bag. She introduced herself as Floppy
the Clown and told the child that she had games and toys with which they could play. She invited the
child to play three games with her: blowing bubbles, catch with large beach balls, and musical
instruments. Each of these games lasted approximately one minute. After the games were finished, the
clown asked the child to help her put the toys back in her bag and then left the room.
Puppet show. Before the child and mother enter the room, the puppeteer (a female
experimenter) set up a small theater in one corner and situated herself behind it. The experimenter led
the mother and child into the room and asked that the mother sit with the child on her lap until the
episode began. When the experimenter left the room, two puppets, Leon the Lion and Ellie the
Elephant, emerged from the theater and introduced themselves to the child. The puppets played three
games (catch, fishing, and presentation of sticker), asking the child to join them for all three. If the child
did not participate in either the catch or fishing games, the puppets continued playing and occasionally
remind the child that s/he could join them. If the child did not come to the theater to get the sticker, the
puppets invited the mother to come get the sticker for the child. Following this, the puppets ended the
puppet show. The puppeteer then emerged from behind the theater and asked the child if s/he would
like to play with the puppets. The episode was declared over when the child either touched the puppets
or stated that s/he did not want to play with the puppets.
Remote-controlled robot. The experimenter led the mother and child into the experimental
room and asked that the mother sit with the child on her lap until the episode began. A remote-
controlled robot had already been placed on a wooden platform in the corner of the room opposite the
mother and child. After the experimenter left the room, the robot, controlled by remote from another
room, moved erratically around the platform for 1 min. After the robot had finished moving, the
experimenter reentered the experimental room and asked the child if s/he would like to touch the
robot. The experimenter made up to three prompts for the child to approach and touch the robot. The
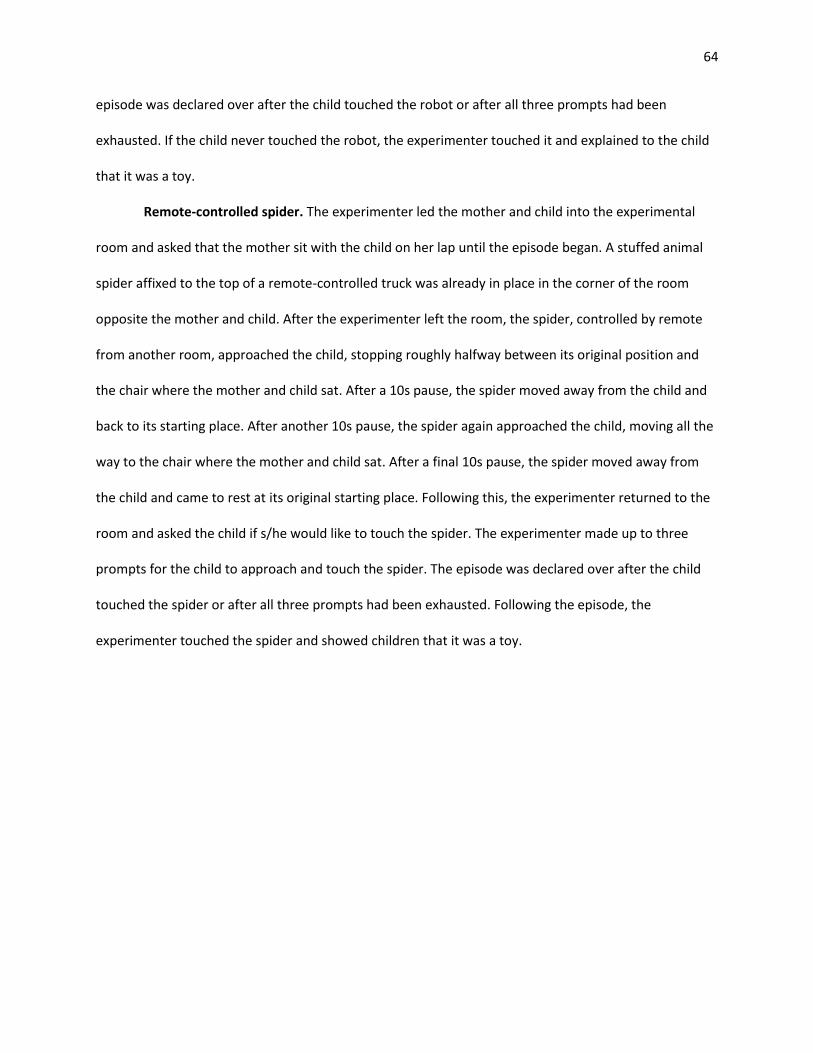
64
episode was declared over after the child touched the robot or after all three prompts had been
exhausted. If the child never touched the robot, the experimenter touched it and explained to the child
that it was a toy.
Remote-controlled spider. The experimenter led the mother and child into the experimental
room and asked that the mother sit with the child on her lap until the episode began. A stuffed animal
spider affixed to the top of a remote-controlled truck was already in place in the corner of the room
opposite the mother and child. After the experimenter left the room, the spider, controlled by remote
from another room, approached the child, stopping roughly halfway between its original position and
the chair where the mother and child sat. After a 10s pause, the spider moved away from the child and
back to its starting place. After another 10s pause, the spider again approached the child, moving all the
way to the chair where the mother and child sat. After a final 10s pause, the spider moved away from
the child and came to rest at its original starting place. Following this, the experimenter returned to the
room and asked the child if s/he would like to touch the spider. The experimenter made up to three
prompts for the child to approach and touch the spider. The episode was declared over after the child
touched the spider or after all three prompts had been exhausted. Following the episode, the
experimenter touched the spider and showed children that it was a toy.

65
APPENDIX D: 54-month Affect
Behavior Rating Scale
1. Responsiveness to persons (circle one) 1 Behavior towards persons is not different from behavior towards objects.
2 Responds briefly to social approach but when not approached directly by persons does not attend to
them.
3 Responds to social approach and persons present, but less than half the time.
4 Responds to social approach and continues interest in persons present.
5 Behavior seems to be continuously affected by awareness of persons present.
2. Responsiveness to examiner (circle one)
1 Avoiding or withdrawn
2 Hesitant
3 Accepting
4 Friendly
5 Inviting (initiating, demanding)
3. Reaction to the new or strange (e.g., strangers, strange surroundings, test materials) (circle one)
1 Accepts the entire situation with no evidence of fear, caution or inhibition of actions.
2 Some slight vigilance, and restrained behavior in the first few minutes.
3 Behavior is affected by the new and strange, but just moderately and temporarily.
4 Shows evidence of being bothered by the strange situation or persons much of the time.
5 Strong indication of fear of the strange, to the extent that the child cannot be brought to play or
respond to the examiner or tasks.
4. Degree of happiness (circle one)
1 Child seems unhappy throughout the episode.
2 At times rather unhappy, but may respond happily to interesting procedures.
3 Moderately happy or contented; may become upset, but recovers fairly easily.
4 Generally appears to be in a happy state of well-being.
5 Radiates happiness; nothing is upsetting; animated.
5. Responsiveness to objects; toys or test materials (circle one)
1 Does not look at or in any way indicate interest in objects.
2 When given materials, glances at them and holds them briefly but does not explore them.
3 Plays with materials when presented; discards or loses interest in each after a brief reaction.
4 Sustained interest in the objects/test materials, in each new one in turn as presented.
5 Reluctantly relinquishes objects/test materials.
6. Tendency to persist in attending to any one object, person or activity. (circle one)
1 Fleeting attention span.
2 Attends to a toy, task, or person, but is easily distracted.
3 Moderated attention to each new toy, person, or situation; soon ready for another.
4 Continues interest in persons, tasks or things for rather long periods.

66
5 Long-continued absorption in a toy, activity or person.
7. Behavior constancy in adequacy of response to demands of the home visit (circle one)
1 Tires quickly and easily.
2 Grows restless fairly soon after beginning task.
3 Adequate tolerance for most of the task; only restless towards the end.
4 Holds up well throughout the episode.
5 Continues to respond well and with interest throughout the duration of the task.
8. Amount of gross bodily movement (circle one)
1 Stays quietly in one place, with practically no self-initiated movement.
2 Usually quiet and inactive but responds appropriately when some level of activity is called for.
3 Moderate activity.
4 In action during much of the episode.
5 Hyperactive; not at all quiet or sedentary during task..
9. The ease with which a child is stimulated; reactivity may be positive or negative in tone (circle one)
1 Unreactive; pays little attention to environment and responds only to strong or repeated
stimulation.
2 Some tendency to be unreactive to the changes in the environment (objects, tasks, etc.)
3 Moderately alert and responsive in reaction to what is happening in the environment.
4 Quickly shows awareness of changes in test materials and situations.
5 Very reactive; startles and reacts quickly; seems keenly sensitive to things going on around him.
10. Irritability
1 No irritability; passively responds to all stimulation.
2 Irritability to aversive stimulation, but control is maintained quickly.
3 Irritability to aversive and non-aversive stimulation, but returns to lower states with some
assistance.
4 Irritable to most stimulation.
5 Irritable to all degrees of stimulation encountered throughout task
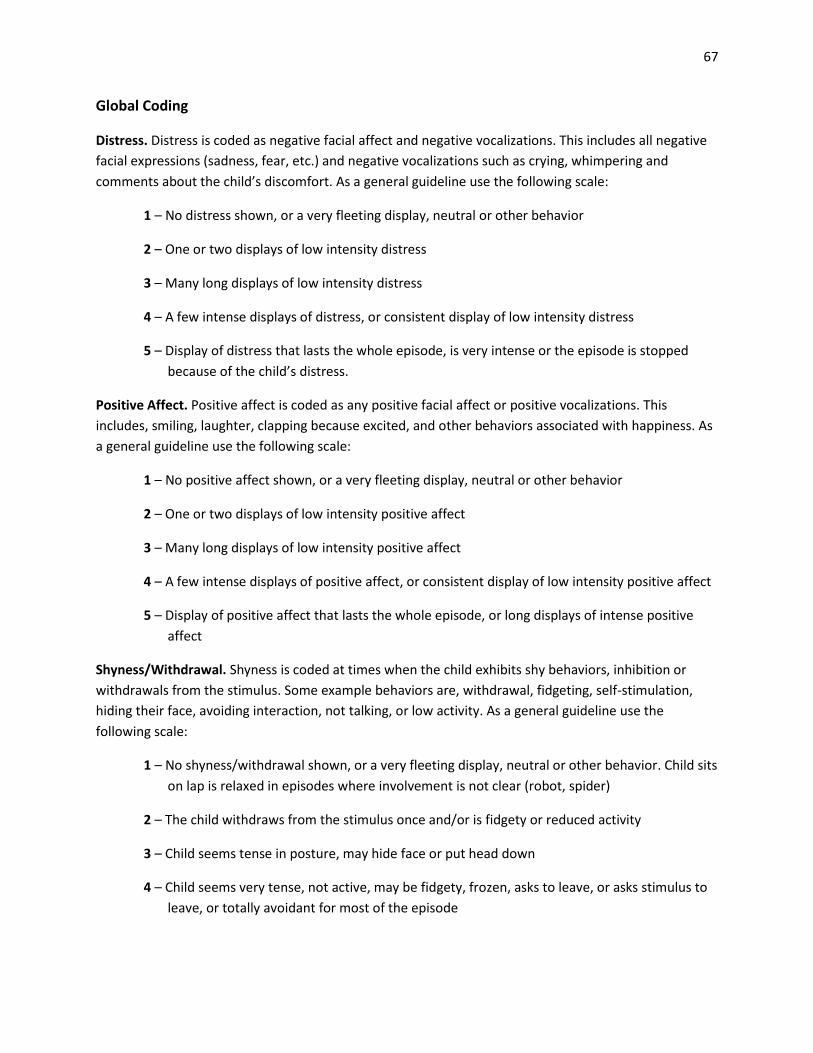
67
Global Coding
Distress. Distress is coded as negative facial affect and negative vocalizations. This includes all negative
facial expressions (sadness, fear, etc.) and negative vocalizations such as crying, whimpering and
comments about the child’s discomfort. As a general guideline use the following scale:
1 – No distress shown, or a very fleeting display, neutral or other behavior
2 – One or two displays of low intensity distress
3 – Many long displays of low intensity distress
4 – A few intense displays of distress, or consistent display of low intensity distress
5 – Display of distress that lasts the whole episode, is very intense or the episode is stopped
because of the child’s distress.
Positive Affect. Positive affect is coded as any positive facial affect or positive vocalizations. This
includes, smiling, laughter, clapping because excited, and other behaviors associated with happiness. As
a general guideline use the following scale:
1 – No positive affect shown, or a very fleeting display, neutral or other behavior
2 – One or two displays of low intensity positive affect
3 – Many long displays of low intensity positive affect
4 – A few intense displays of positive affect, or consistent display of low intensity positive affect
5 – Display of positive affect that lasts the whole episode, or long displays of intense positive
affect
Shyness/Withdrawal. Shyness is coded at times when the child exhibits shy behaviors, inhibition or
withdrawals from the stimulus. Some example behaviors are, withdrawal, fidgeting, self-stimulation,
hiding their face, avoiding interaction, not talking, or low activity. As a general guideline use the
following scale:
1 – No shyness/withdrawal shown, or a very fleeting display, neutral or other behavior. Child sits
on lap is relaxed in episodes where involvement is not clear (robot, spider)
2 – The child withdraws from the stimulus once and/or is fidgety or reduced activity
3 – Child seems tense in posture, may hide face or put head down
4 – Child seems very tense, not active, may be fidgety, frozen, asks to leave, or asks stimulus to
leave, or totally avoidant for most of the episode

68
5 – Child is extremely shy, freezes, never leaves the mother’s lap, totally avoidant or resistant of
stimulus throughout the whole episode- to be used in extreme cases of shyness and
hesitancy.
Boldness/Approach. Boldness is coded as any attempts of the child to interact with the stimulus or
control the episode. This includes, approaching the stimulus, the child taking the initiative to do tasks or
interact on their own, controlling the movement or procedures of the stimulus, and appearing
comfortable. Overall, a child’s manner of approach should be considered when coding for boldness. As a
general guideline use the following scale:
1 – No boldness shown, or a very fleeting display, neutral or other behavior- child sits on the
mother’s lap, or does nothing throughout the whole episode
2 – Child completes tasks/ interacts with stimulus with coaching from mother or experimenter,
playing with toys but not taking initiative with the stimulus
3 – Child gets off mother’s lap on their own, and/or takes the initiative to approach stimulus, or
remains by the stimulus for the episode
4 – Child approaches more than once, or interacts with stimulus by talking for most of the
episode, may be controlling the situation a little
5 – Child takes a lot of initiative, talking to or touching stimulus seems very comfortable with
situation, makes several attempts to engage the stimulus may be controlling the movement
or procedures of the stimulus.
Vigor of Activity. Vigor of activity is how active the child is while playing. It is coded for instances when
the child is actively playing with a toy/activity or the stimulus. Higher scores will be given to children
who show high intensity while playing. Intensity for vigor of activity is rated on the following scale:
1 – No attempts to play. No physical movement or activity.
2 – One or two brief displays of low intensity activity.
3 – Many long displays of low intensity activity.
4 – A few intense displays of activity or consistent display of low intensity activity that lasts the
entire minute.
5 – High intensity activity for the entire minute.

69
APPENDIX E: 54-month Parent-Report Questionnaire Measures
General Information Questionnaire (Demographics) Date filled out: _____________
1. Number of brothers and sisters in the family (not including child participating in study): ___ brothers; ___ sisters
Name Birthdate ( mon. / day/ year ) Names and birthdates of brothers: _____________________ _____________________ _____________________ _____________________ _____________________ _____________________ Names and birthdates of sisters: _____________________ _____________________ _____________________ _____________________ _____________________ _____________________ 2. Is the child participating currently residing with his/her biological mother and father? ___ Yes ___ No (if No), please explain: __________________________
___________________________________________________________ ___________________________________________________________ 3. Father' s date of birth: ___, ___, ____ 4. Mother’s date of birth: ___, ___, ____ month day year month day year 5. Father's race: (check all that apply) 6. Mother’s race: (check all that apply)
_____ Caucasian _____ Caucasian _____ African-American _____ African-American _____ Hispanic _____ Hispanic _____ Asian-American _____ Asian-American _____ American Indian _____ American Indian _____ Other ______________ _____ Other _____________
7. Child's race: (check all that apply)
_____ Caucasian _____ African-American _____ Hispanic _____ Asian-American _____ American Indian _____ Other ______________

70
8. Occupation of the father Job title (give detailed title): _____________________________________
___________________________________________________________ Job description or duties: _______________________________________ ___________________________________________________________ ___________________________________________________________ Is/was job:__ full time; __part time (check one)
9. Do you expect to change your type of work in the foreseeable future? YES or NO (circle one) If YES, please explain.
___________________________________________________________ ___________________________________________________________ 10. Occupation of the mother Job title (give detailed title): _____________________________________
___________________________________________________________ Job description or duties: _______________________________________ ___________________________________________________________ ___________________________________________________________ Is/was job:__ full time; __part time (check one) 11. Do you expect to change your type of work in the future? YES or NO (circle one) If YES, please explain.
___________________________________________________________ ___________________________________________________________
12. Number of years of formal schooling. On the line below, circle the number of years of
formal schooling of the father and draw a box around the number of years of formal schooling of the mother.
________________________________________________________________________ 6 7 8 9 10 11 12 13 14 15 16 17 18 19 20+ some high high trade or technical college graduate school school school, or some graduate training degree graduate college (M.D., J.D.,D.D.S., Ph.D.) 13. Marital Status: ___Married ___Divorced ___Single ___Widowed ___Living with partner Has your marital status changed since your last visit (if applicable)?___Yes ___No ___NA 14. (optional) Income: Please indicate total family income before taxes. (Check one)
_____ $15,000 or less _____ $41,000 to $50,000 _____ $16,000 to $20,000 _____ $51,000 to $60,000 _____ $21,000 to $30,000 _____ above $60,000 _____ $31,000 to $40,000

71
Child Behavior Questionnaire – Short Form Effortful Control (4 subscales)
Attentional Focusing (6 items) 16R. When practicing an activity, has a hard time keeping her/his mind on it. 21R. Will move from one task to another without completing any of them. 62. When drawing or coloring in a book, shows strong concentration 71. When building or putting something together, becomes very involved in what s/he is
doing, and works for long periods. 84R. Is easily distracted when listening to a story. 89. Sometimes becomes absorbed in a picture book and looks at it for a long time.
Inhibitory Control (6 items) 38. Can wait before entering into new activities if s/he is asked to. 45. Prepares for trips and outings by planning things s/he will need. 53R. Has trouble sitting still when s/he is told to (at movies, church, etc.). 67. Is good at following instructions. 73. Approaches places s/he has been told are dangerous slowly and cautiously. 81. Can easily stop an activity when s/he is told "no."
Perceptual Sensitivity (6 items) 5. Notices the smoothness or roughness of objects s/he touches. 13. Notices it when parents are wearing new clothing. 24. Seems to listen to even quiet sounds. 32. Comments when a parent has changed his/her appearance. 47. Is quickly aware of some new item in the living room. 83R. Doesn't usually notice odors, such as perfume, smoke, cooking, etc.
Low Intensity Pleasure (8 items) 26. Enjoys taking warm baths. 39. Enjoys "snuggling up" next to a parent. 57. Enjoys just being talked to. 65. Enjoys looking at picture books. 72. Likes being sung to. 76. Likes the sound of words, as in nursery rhymes. 86. Enjoys sitting on parent's lap. 94. Enjoys gentle rhythmic activities, such as rocking or swaying.
Fear (6 items) 17. Is afraid of burglars or the "boogie man." 23. Is afraid of loud noises. 35R. Is not afraid of the dark. 41. Is afraid of fire. 63. Is afraid of the dark.
72
68R. Is rarely frightened by "monsters" seen on TV or at movies.
Shyness (6 items) 11R. Seems to be at ease with almost any person. 37. Is sometimes shy even around people s/he has known a long time. 42. Sometimes seems nervous when talking to adults s/he has just met. 52. Acts shy around new people. 60R. Is comfortable asking other children to play. 70. Sometimes turns away shyly from new acquaintances.
______________________________________________________________________________ Note: Items designated by “R” are reverse-scored and should be re-coded so that 1 becomes 7, 2 becomes 6, 3 becomes 5, 4 remains 4, 5 becomes 3, 6 becomes 2 and 7 becomes 1.
Rebecca J. Brooker Education 2008-2011 Ph.D. (Developmental) The Pennsylvania State University 2006-2008 M.S. (Developmental) The Pennsylvania State University 2005-2006 No Degree (Developmental) University of Missouri-Columbia 2003-2005 No Degree (Counseling) Drake University 1999-2003 B.A. (Psychology) Central College Papers and Publications
Peer-Reviewed Manuscripts Brooker, R.J., & Buss, K.A. (2010). Dynamic measures of RSA predict distress and regulation in toddlers.
Developmental Psychobiology, 52, 372-382.
Brooker, R.J., Buss, K.A., & Dennis, T.A. (2011). Error-monitoring brain activity is associated with affective behaviors in young children. Developmental Cognitive Neuroscience, 1, 141-152. Brooker, R.J., Neiderhiser, J.M., Kiel, E.J., Leve, L.D., Shaw, D.S., & Reiss, D. (In Press). Attention control moderates associations between infants’ risk for anxiety and social inhibition. Infancy. Buss, K.A., Brooker, R.J., & Leuty, M. (2008). Girls most of the time, boys some of the time: Gender differences in toddlers’ use of maternal proximity and comfort seeking. Infancy, 13, 1-29. Buss, K.A., Dennis, T.A., Brooker, R.J., & Sippel, L.M. (2011). An ERP study of conflict monitoring in 4- to 8-year-old children: Associations with temperament. Developmental Cognitive Neuroscience, 1, 131-140. Conference Presentations
Papers Buss, K.A., Brooker, R.J., & Dennis, T.A. (2010) Fearful behavior links and age differences in ERP biomarkers
for conflict and performance monitoring in young children. Paper to be presented at annual convention of the Association for Psychological Science. Boston, MA.
Brooker, R.J., & Buss, K.A. (2010). Contributions of inhibitory control to trajectories of fear between 24
and 60 months. Paper presented at the biennial International Conference on Infant Studies. Baltimore, MD.
Posters Brooker, R.J., & Buss, K.A. (2011). Is there evidence for early-developing error-related negativities in shy children? Poster presented at the annual meeting of the Society for Research in Child Development, Montreal, Quebec. Brooker, R.J., Buss, K.A., & Eddinger, R.E. (2010). EEG Asymmetry, attention control, and risk for anxiety in early childhood. Poster presented at the annual meeting of the Society for Psychophysiological Research, Portland, OR. Brooker, R.J., Hartz, K.A., Deweese, B.N., & Buss, K.A. (2008). Dynamic measures of RSA, emotional
distress, and regulation in toddlers. Poster presented at the annual meeting of the Society for Psychophysiological Research, Austin, TX.
Honors and Awards •SRCD Student Travel Award, Society for Research in Child Development (2011) •College of Liberal Arts Dissertation Support Award , Penn State College of the Liberal Arts (2009) •Doctoral Dissertation Funding Award, Robert & Ruth Faris Child Psychology Fund (2009) •Departmental Travel Award, The Pennsylvania State University (2006, 2007, 2008, 2009) •Developmental Area Fellowship, University of Missouri – Columbia (2005-2006) •Central College Distinguished Scholar Fellowship, Central College (1999-2003) •Alpha Zeta Mu National Honor Society, Central College Chapter (2001-2003)