Embed Size (px)
Citation preview

Performance MonitorPerformanceMonitor Interface to the PI System
Interface to the PI System
Version 1.4.0.0Rev E

How to Contact Us
OSIsoft, Inc.
777 Davis St., Suite 250
San Leandro, CA 94577 USA
Telephone
(01) 510-297-5800 (main phone)
(01) 510-357-8136 (fax)
(01) 510-297-5828 (support phone)
Houston, TX
Johnson City, TN
Mayfield Heights, OH
Phoenix, AZ
Savannah, GA
Seattle, WA
Yardley, PA
Worldwide Offices
OSIsoft Australia
Perth, Australia
Auckland, New Zealand
OSI Software GmbH
Altenstadt, Germany
OSI Software Asia Pte Ltd.
Singapore
OSIsoft Canada ULC
Montreal, Canada
OSIsoft, Inc. Representative Office
Shanghai, People’s Republic of China
OSIsoft Japan KK
Tokyo, Japan
OSIsoft Mexico S. De R.L. De C.V.
Mexico City, Mexico
Sales Outlets and Distributors Brazil Middle East/North Africa Republic of South Africa Russia/Central Asia
South America/Caribbean Southeast Asia South Korea Taiwan
WWW.OSISOFT.COM
OSIsoft, Inc. is the owner of the following trademarks and registered trademarks: PI System, PI ProcessBook, Sequencia, Sigmafine, gRecipe, sRecipe, and RLINK. All terms mentioned in this book that are known to be trademarks or service marks have been appropriately capitalized. Any trademark that appears in this book that is not owned by OSIsoft, Inc. is the property of its owner and use herein in no way indicates an endorsement, recommendation, or warranty of such party’s products or any affiliation with such party of any kind.
RESTRICTED RIGHTS LEGENDUse, duplication, or disclosure by the Government is subject to restrictions as set forth in subparagraph (c)(1)(ii) of the Rights in Technical Data and Computer Software clause at DFARS 252.227-7013
Unpublished – rights reserved under the copyright laws of the United States.
© 2000-2007 OSIsoft, Inc. PI_PIPerfmon.doc

Table of Contents
Introduction......................................................................................................................1Reference Manuals........................................................................................................1
Supported Features........................................................................................................1
Diagram of Hardware Connection..................................................................................4
Principles of Operation...................................................................................................7Full and Basic Versions..................................................................................................7
Limitations......................................................................................................................7
Installation Checklist.......................................................................................................9
Interface Installation......................................................................................................11User Account................................................................................................................11
Naming Conventions and Requirements......................................................................11
Interface Directories.....................................................................................................12
The PIHOME Directory Tree.....................................................................................12
Interface Installation Directory..................................................................................12
Interface Installation Procedure....................................................................................12
Installing the Interface as a Windows Service..............................................................12
Installing the Interface Service with PI Interface Configuration Utility......................13
Installing the Interface Service Manually..................................................................15
Files Installed for Full Version...................................................................................16
Files Installed for Basic Version................................................................................16
PointSource....................................................................................................................19
PI Point Configuration...................................................................................................21Performance Counter Path...........................................................................................21
Point Attributes.............................................................................................................22
Tag............................................................................................................................22
PointSource..............................................................................................................22
PointType..................................................................................................................23
Location1..................................................................................................................23
Performance Monitor Interface to the PI System iii
Location2..................................................................................................................23
Location3..................................................................................................................23
Location4..................................................................................................................23
Location5..................................................................................................................23
InstrumentTag...........................................................................................................23
ExDesc.....................................................................................................................23
Scan..........................................................................................................................24
Shutdown..................................................................................................................24
Convers....................................................................................................................25
PIPerfCreator Utility.......................................................................................................27
PI SMT 3 add-in..............................................................................................................31Monitoring a Remote Node..........................................................................................33
Performance Point Configuration................................................................................35Configuring Performance Points with PI ICU (Windows).............................................35
Configuring Performance Points Manually...................................................................36
I/O Rate Tag Configuration...........................................................................................39Monitoring I/O Rates on the Interface Node.................................................................39
Configuring I/O Rate Tags with PI ICU (Windows).......................................................39
Configuring I/O Rate Tags Manually............................................................................41
Configuring the PI Point on the PI Server.................................................................41
Configuration on the Interface Node.........................................................................41
Startup Command File...................................................................................................43Configuring the Interface with PI ICU...........................................................................43
piperfmon Interface Tab...............................................................................................45
Command-line Parameters..........................................................................................46
Sample PIPerfMon.bat File..........................................................................................51
Interface Node Clock.....................................................................................................53
Security...........................................................................................................................55Windows.......................................................................................................................55
Starting / Stopping the Interface..................................................................................57Starting Interface as a Service.....................................................................................57
Stopping Interface Running as a Service.....................................................................57
Other Command-line Parameters................................................................................57
Performance Monitor Interface to the PI System iv
Which Performance Counters to Monitor....................................................................59
Buffering.........................................................................................................................67Configuring Buffering with PI ICU (Windows)...............................................................67
Configuring Buffering Manually....................................................................................70
Example piclient.ini File................................................................................................72
Appendix A: Troubleshooting......................................................................................73Common Problems.......................................................................................................73
Error Codes..................................................................................................................75
Informational Messages............................................................................................75
Warning Messages...................................................................................................75
Error Messages........................................................................................................75
Revision History.............................................................................................................77
Performance Monitor Interface to the PI System v
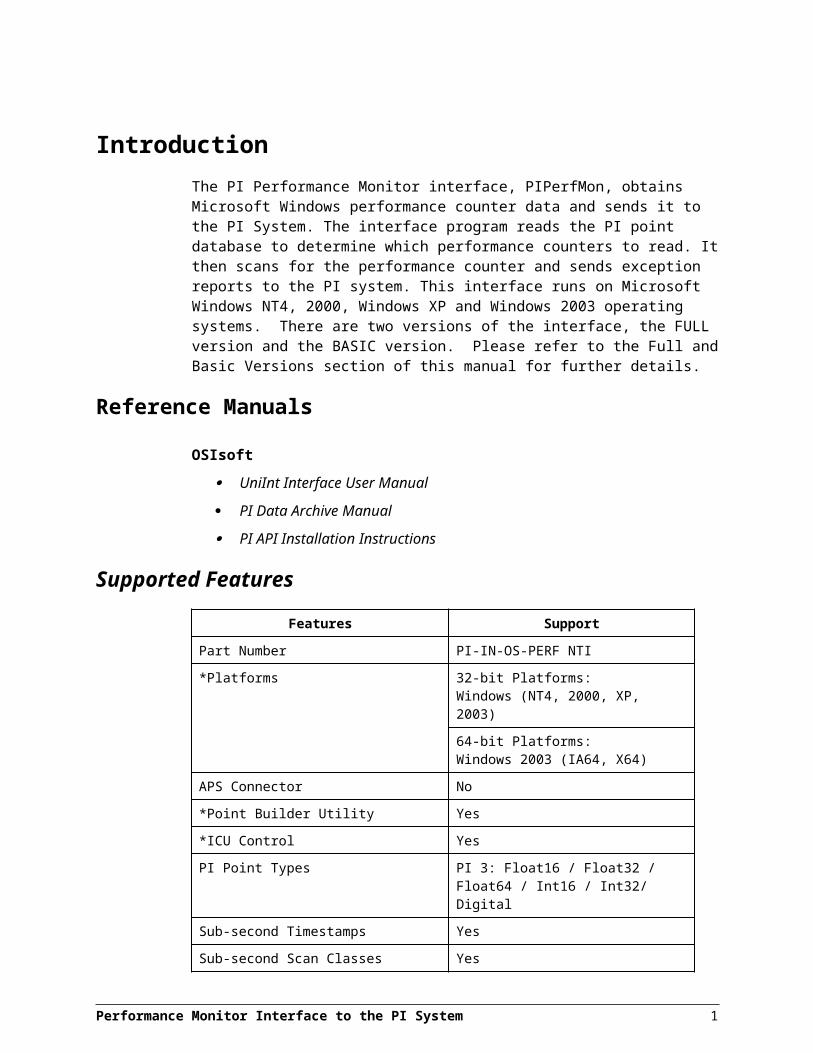
IntroductionThe PI Performance Monitor interface, PIPerfMon, obtains Microsoft Windows performance counter data and sends it to the PI System. The interface program reads the PI point database to determine which performance counters to read. It then scans for the performance counter and sends exception reports to the PI system. This interface runs on Microsoft Windows NT4, 2000, Windows XP and Windows 2003 operating systems. There are two versions of the interface, the FULL version and the BASIC version. Please refer to the Full and Basic Versions section of this manual for further details.
Reference Manuals
OSIsoft UniInt Interface User Manual
PI Data Archive Manual
PI API Installation Instructions
Supported FeaturesFeatures Support
Part Number PI-IN-OS-PERF NTI
*Platforms 32-bit Platforms: Windows (NT4, 2000, XP, 2003)
64-bit Platforms:Windows 2003 (IA64, X64)
APS Connector No
*Point Builder Utility Yes
*ICU Control Yes
PI Point Types PI 3: Float16 / Float32 / Float64 / Int16 / Int32/ Digital
Sub-second Timestamps Yes
Sub-second Scan Classes Yes
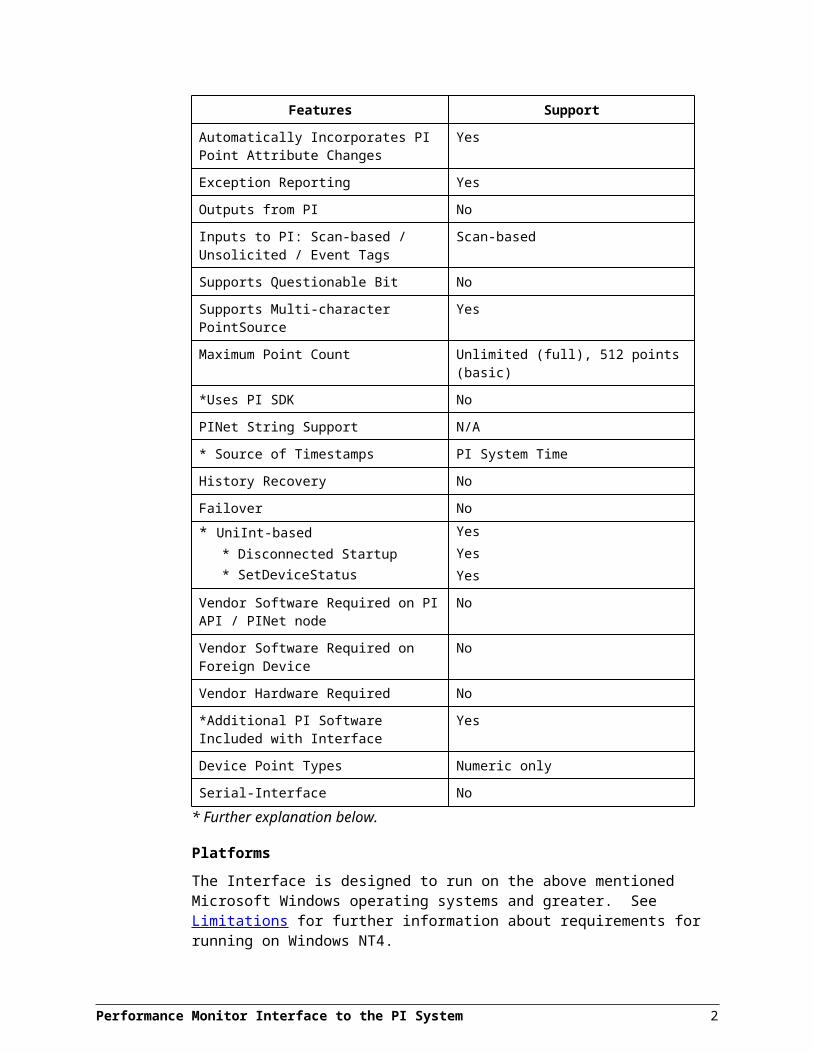
Automatically Incorporates PI Point Attribute Changes
Yes
Exception Reporting Yes
Outputs from PI No
Inputs to PI: Scan-based / Unsolicited / Event Tags
Scan-based
Supports Questionable Bit No
Supports Multi-character PointSource Yes
Performance Monitor Interface to the PI System 1
Features Support
Maximum Point Count Unlimited (full), 512 points (basic)
*Uses PI SDK No
PINet String Support N/A
* Source of Timestamps PI System Time
History Recovery No
Failover No
* UniInt-based* Disconnected Startup* SetDeviceStatus
YesYesYes
Vendor Software Required on PI API / PINet node
No
Vendor Software Required on Foreign Device
No
Vendor Hardware Required No
*Additional PI Software Included with Interface
Yes
Device Point Types Numeric only
Serial-Interface No
* Further explanation below.
PlatformsThe Interface is designed to run on the above mentioned Microsoft Windows operating systems and greater. See Limitations for further information about requirements for running on Windows NT4.
Point Builder UtilityThe point builder utility can only create 32bit performance counters.
ICU ControlThe ICU Control is not supported on IA64.
Uses PI SDKThe PI SDK and the PI API are bundled together and must be installed on each PI Interface node. This Interface does not specifically make PI SDK calls.
Source of TimestampsThe interface uses the PI System timestamp.
UniInt-basedUniInt stands for Universal Interface. UniInt is not a separate product or file; it is an OSIsoft-developed template used by developers, and is integrated into many interfaces, including this interface. The purpose of UniInt is to keep a consistent feature set and
Performance Monitor Interface to the PI System 2
behavior across as many of OSIsoft’s interfaces as possible. It also allows for the very rapid development of new interfaces. In any UniInt-based interface, the interface uses some of the UniInt-supplied configuration parameters and some interface-specific parameters. UniInt is constantly being upgraded with new options and features.
The UniInt Interface User Manual is a supplement to this manual.
Disconnected StartupThe interface now supports startup without a connection to the PI server. Previously a PI server connection was required in order to obtain a list of which PI points belonged to an interface. Now this information is stored in a local cache. This cache is synchronized with the PI server point database. This not only reduces the time required for interface startup but also prevents data loss if starting the interface when the PI server is unavailable. Refer to the New Interface Features PR1 Manual for a more complete discussion on disconnected startup. Note this functionality requires PI API 1.6.1.x or later and is only supported for PI 3.x servers.
Device Status Point Support (SetDeviceStatus)The Interface is built with UniInt 4.3.0.31. New functionality has been added to support interface health points. The health point with the point attribute Exdesc = [UI_DEVSTAT], is used to represent the status of the source devices. The following events can be written into the point:
a) "Good" - the interface is properly communicating and reading data from the devices. If no data collection points have been defined, this indicates the interface has successfully started.
b) "3 | n devices(s) in error | Device1,...,DeviceN" - the interface has determined that the listed device(s) are offline. A device is considered offline when all its scan classes fail to retrieve data.
The event "2 | Connected / No Data | " is not used by this interface.
Note: In some cases, it may be possible for a device to be incorrectly reported as offline. Please see the section Performance Counter Path for further details.
Please refer to the UniInt Interface User Manual for more information on how to configure health points.
Additional PI SoftwareThe interface provides a performance counter point creation utility, PIPerfCreator, to help facilitate the creation of performance monitor points. This is a stand-alone application that requires that the PI SDK be installed on the same machine as the utility. The details of the utility will be discussed later in this document.
Performance Monitor Interface to the PI System 3
Introduction
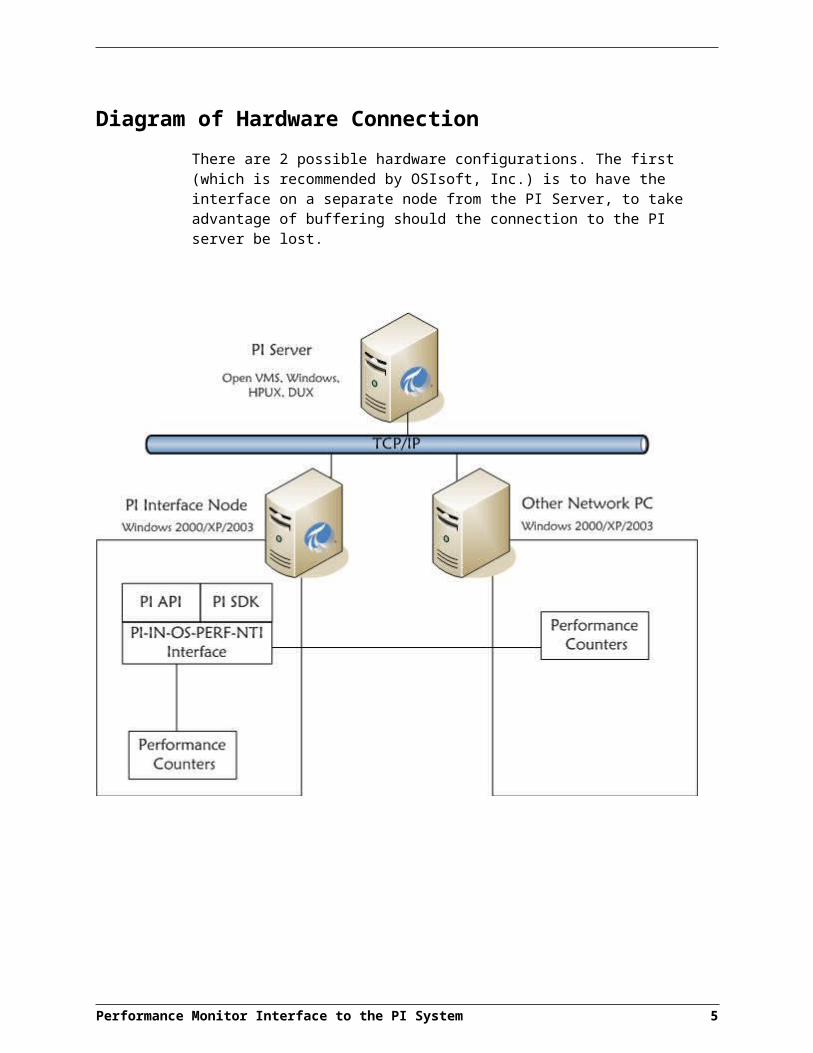
Diagram of Hardware ConnectionThere are 2 possible hardware configurations. The first (which is recommended by OSIsoft, Inc.) is to have the interface on a separate node from the PI Server, to take advantage of buffering should the connection to the PI server be lost.
4
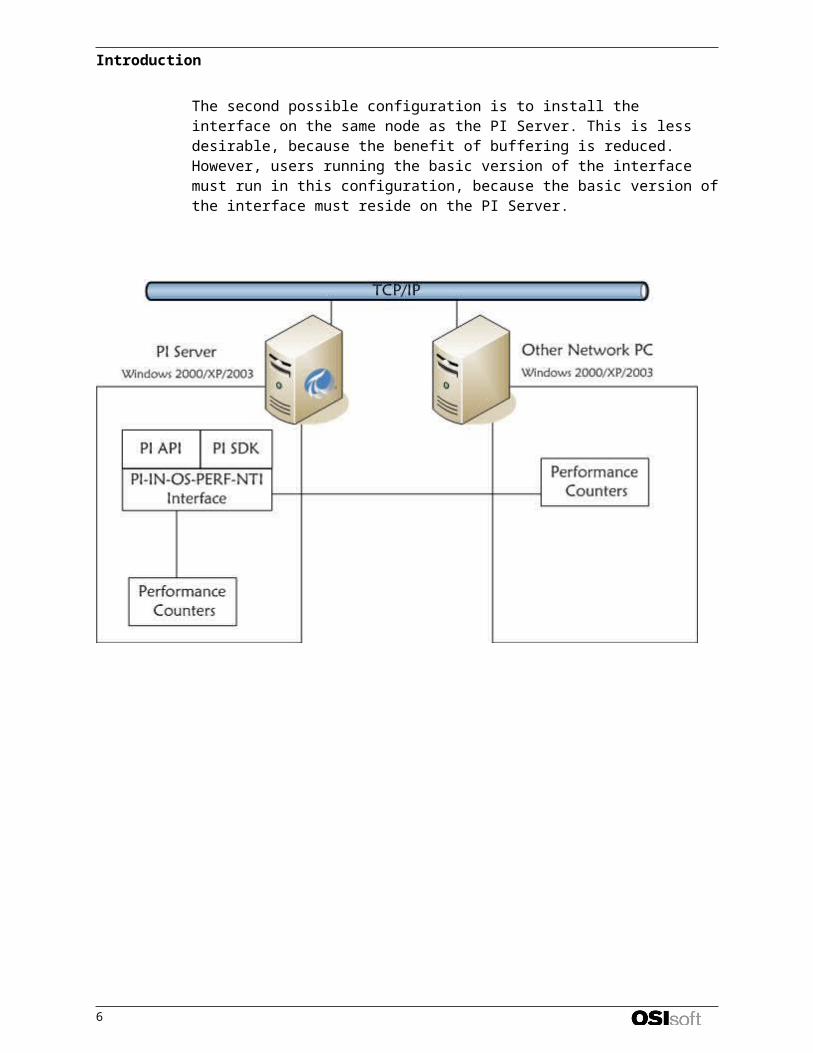
The second possible configuration is to install the interface on the same node as the PI Server. This is less desirable, because the benefit of buffering is reduced. However, users running the basic version of the interface must run in this configuration, because the basic version of the interface must reside on the PI Server.
Performance Monitor Interface to the PI System 5
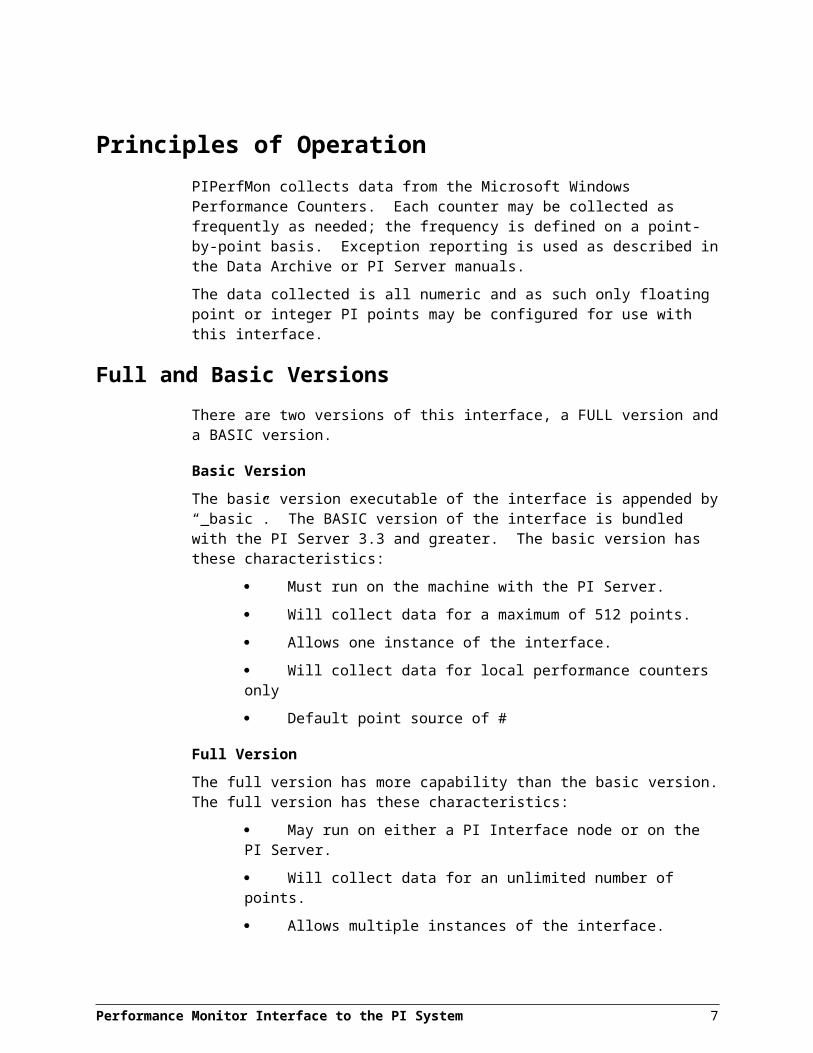
Principles of OperationPIPerfMon collects data from the Microsoft Windows Performance Counters. Each counter may be collected as frequently as needed; the frequency is defined on a point-by-point basis. Exception reporting is used as described in the Data Archive or PI Server manuals.
The data collected is all numeric and as such only floating point or integer PI points may be configured for use with this interface.
Full and Basic VersionsThere are two versions of this interface, a FULL version and a BASIC version.
Basic VersionThe basic version executable of the interface is appended by “_basic”. The BASIC version of the interface is bundled with the PI Server 3.3 and greater. The basic version has these characteristics:
Must run on the machine with the PI Server.
Will collect data for a maximum of 512 points.
Allows one instance of the interface.
Will collect data for local performance counters only
Default point source of #
Full VersionThe full version has more capability than the basic version. The full version has these characteristics:
May run on either a PI Interface node or on the PI Server.
Will collect data for an unlimited number of points.
Allows multiple instances of the interface.
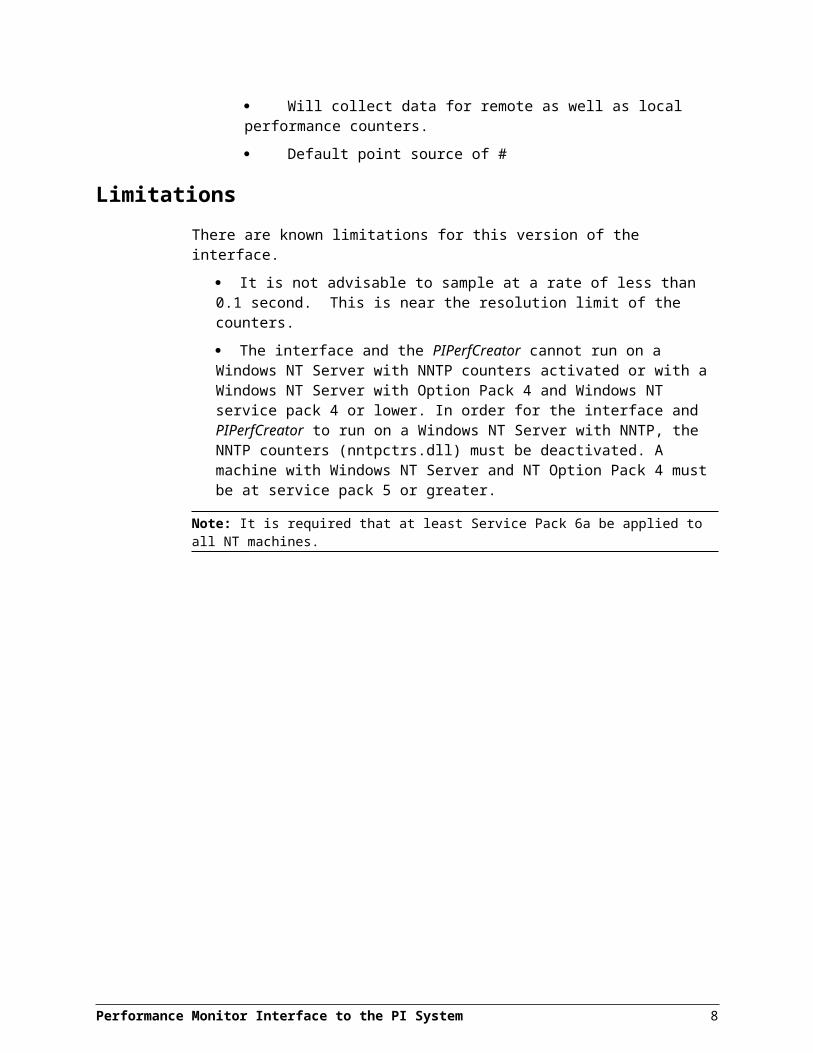
Will collect data for remote as well as local performance counters.
Default point source of #
LimitationsThere are known limitations for this version of the interface.
It is not advisable to sample at a rate of less than 0.1 second. This is near the resolution limit of the counters.
The interface and the PIPerfCreator cannot run on a Windows NT Server with NNTP counters activated or with a Windows NT Server with Option Pack 4 and Windows NT service pack 4 or lower. In order for the interface and PIPerfCreator to run on a Windows NT Server with NNTP, the NNTP counters (nntpctrs.dll) must be
Performance Monitor Interface to the PI System 7
deactivated. A machine with Windows NT Server and NT Option Pack 4 must be at service pack 5 or greater.
Note: It is required that at least Service Pack 6a be applied to all NT machines.
Performance Monitor Interface to the PI System 8
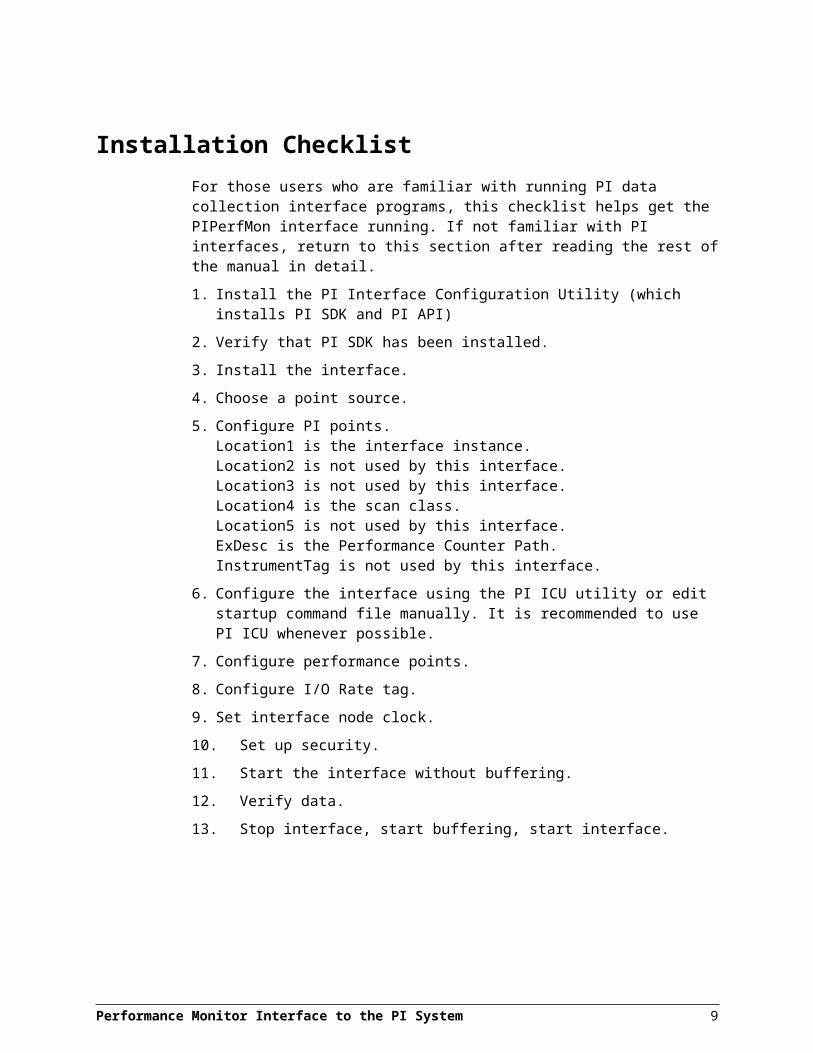
Installation ChecklistFor those users who are familiar with running PI data collection interface programs, this checklist helps get the PIPerfMon interface running. If not familiar with PI interfaces, return to this section after reading the rest of the manual in detail.
1. Install the PI Interface Configuration Utility (which installs PI SDK and PI API)
2. Verify that PI SDK has been installed.
3. Install the interface.
4. Choose a point source.
5. Configure PI points. Location1 is the interface instance.Location2 is not used by this interface.Location3 is not used by this interface.Location4 is the scan class.Location5 is not used by this interface.ExDesc is the Performance Counter Path.InstrumentTag is not used by this interface.
6. Configure the interface using the PI ICU utility or edit startup command file manually. It is recommended to use PI ICU whenever possible.
7. Configure performance points.
8. Configure I/O Rate tag.
9. Set interface node clock.
10. Set up security.
11. Start the interface without buffering.
12. Verify data.
13. Stop interface, start buffering, start interface.
Performance Monitor Interface to the PI System 9
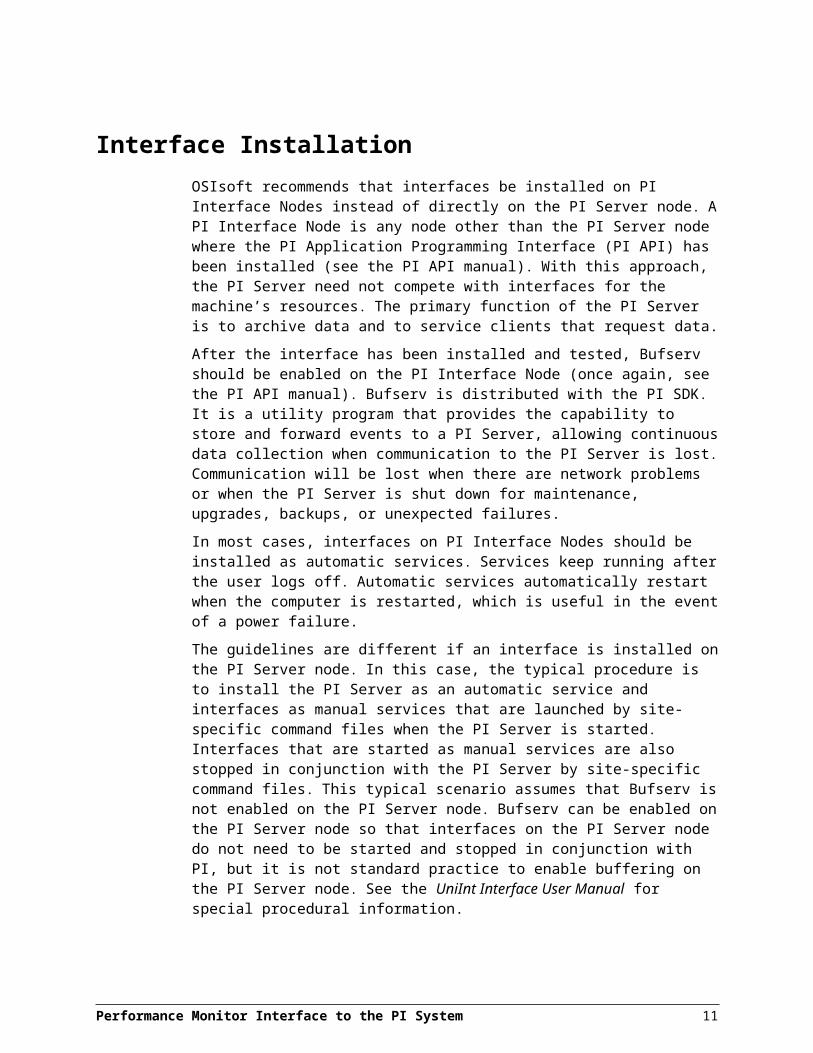
Interface InstallationOSIsoft recommends that interfaces be installed on PI Interface Nodes instead of directly on the PI Server node. A PI Interface Node is any node other than the PI Server node where the PI Application Programming Interface (PI API) has been installed (see the PI API manual). With this approach, the PI Server need not compete with interfaces for the machine’s resources. The primary function of the PI Server is to archive data and to service clients that request data.
After the interface has been installed and tested, Bufserv should be enabled on the PI Interface Node (once again, see the PI API manual). Bufserv is distributed with the PI SDK. It is a utility program that provides the capability to store and forward events to a PI Server, allowing continuous data collection when communication to the PI Server is lost. Communication will be lost when there are network problems or when the PI Server is shut down for maintenance, upgrades, backups, or unexpected failures.
In most cases, interfaces on PI Interface Nodes should be installed as automatic services . Services keep running after the user logs off. Automatic services automatically restart when the computer is restarted, which is useful in the event of a power failure.
The guidelines are different if an interface is installed on the PI Server node. In this case, the typical procedure is to install the PI Server as an automatic service and interfaces as manual services that are launched by site-specific command files when the PI Server is started. Interfaces that are started as manual services are also stopped in conjunction with the PI Server by site-specific command files. This typical scenario assumes that Bufserv is not enabled on the PI Server node. Bufserv can be enabled on the PI Server node so that interfaces on the PI Server node do not need to be started and stopped in conjunction with PI, but it is not standard practice to enable buffering on the PI Server node. See the UniInt Interface User Manual for special procedural information.
User AccountThe service will run using the Local System account unless otherwise specified. For the full version of this interface, if this account does not have privileges to obtain performance counters on a remote computer, the service will have be changed to start using an account with sufficient privileges. To open the Services control panel for Windows 2000, click Start, point to Settings, and then click Control Panel. Double-click Administrative Tools, and then double-click Services. For Window NT, click Start, point to Settings, and then click Control Panel. Double-click on Services. Then, double-click on PI Performance Monitor Interface (full version) and select the Log On tab. Change this service’s Log on As:, from the System Account to an account that is desired.
Naming Conventions and RequirementsIn the installation procedure below, it is assumed that the name of the interface executable is PIPerfMon.exe and that the startup command file is called PIPerfMon.bat.
Performance Monitor Interface to the PI System 11
Interface Directories
The PIHOME Directory TreeThe PIHOME directory tree is defined by the PIHOME entry in the pipc.ini configuration file. This pipc.ini file is an ASCII text file, which is located in the %windir% directory. A typical pipc.ini file contains the following lines:[PIPC]PIHOME=c:\Program Files\pipc
The above lines define the \pipc directory as the root of the PIHOME directory tree on the C: drive. OSIsoft recommends using \Program Files\pipc as the root directory name. The PIHOME directory does not need to be on the C: drive.
Interface Installation DirectoryPlace all copies of the interface into a single directory. The suggested directory is:PIHOME\Interfaces\PIPerfMon\
Replace PIHOME with the corresponding entry in the pipc.ini file.
Interface Installation ProcedureThe PIPerfMon interface setup program uses the services of the Microsoft Windows Installer. Windows Installer is a standard part of Windows 2000. When running on Windows NT 4.0 systems, the PIPerfMon setup program will install the Windows Installer itself if necessary. To install, run the PIPerfMon_x.x.x.x.exe installation kit.
Installing the Interface as a Windows ServiceThe PIPerfMon Interface service can be created, preferably, with the PI Interface Configuration Utility, or can be created manually.
Performance Monitor Interface to the PI System 12
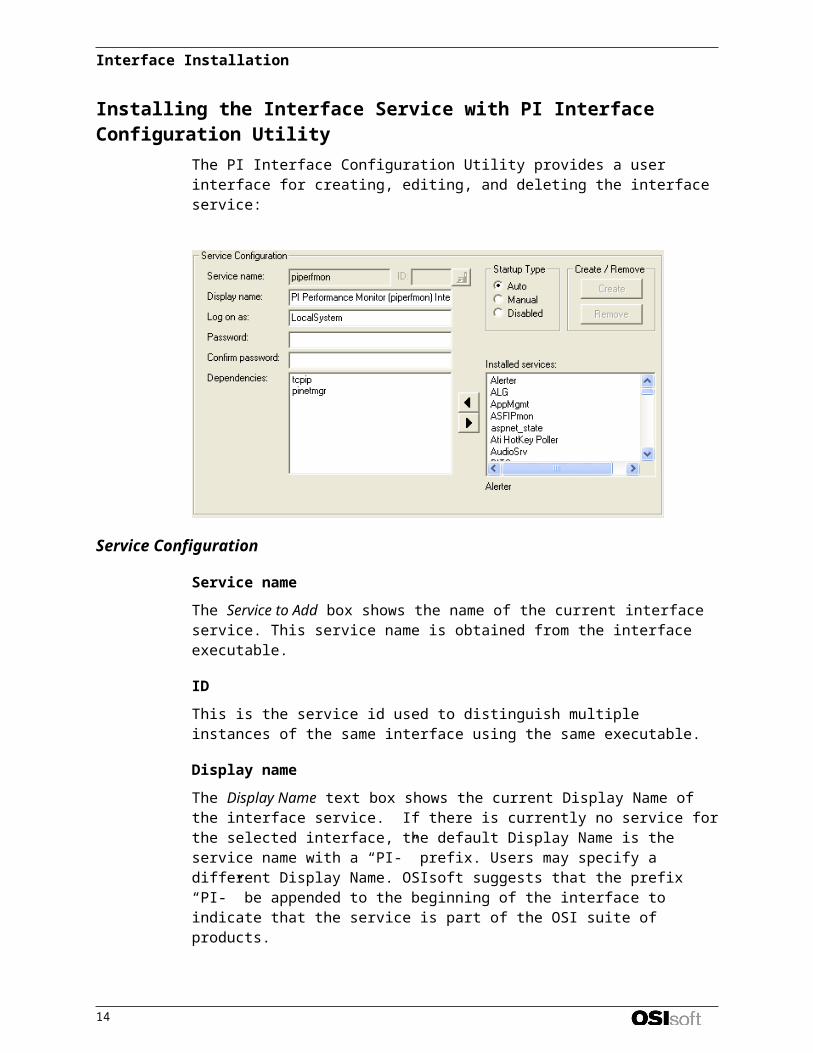
Installing the Interface Service with PI Interface Configuration UtilityThe PI Interface Configuration Utility provides a user interface for creating, editing, and deleting the interface service:
Service Configuration
Service nameThe Service to Add box shows the name of the current interface service. This service name is obtained from the interface executable.
IDThis is the service id used to distinguish multiple instances of the same interface using the same executable.
Display nameThe Display Name text box shows the current Display Name of the interface service. If there is currently no service for the selected interface, the default Display Name is the service name with a “PI-” prefix. Users may specify a different Display Name. OSIsoft suggests that the prefix “PI-” be appended to the beginning of the interface to indicate that the service is part of the OSI suite of products.
Log on asThe Log on as text box shows the current “Log on as” Windows User Account of the interface service. If the service is configured to use the Local System account, the Log on as text box will show “LocalSystem.” Users may specify a different Windows User account for the service to use.
PasswordIf a Windows User account is entered in the Log on as text box, then a password must be provided in the Password text box, unless the account requires no password.
Performance Monitor Interface to the PI System 13
Interface Installation
Confirm passwordIf a password is entered in the Password text box, then it must be confirmed in the Confirm Password text box.
Startup TypeThe Startup Type indicates whether the interface service will start automatically or needs to be started manually on reboot.
If the Auto option is selected, the service will be installed to start automatically when the machine reboots.
If the Manual option is selected, the interface service will not start on reboot, but will require someone to manually start the service.
If the Disabled option is selected, the service will not start at all.
Generally, interface services are set to start automatically.
DependenciesThe Installed services list is a list of the services currently installed on this machine. Services upon which this Interface is dependent should be moved into the Dependencies
list using the button. For example, if API Buffering is running, then “bufserv” should be selected from the list at the right and added to the list on the left. Often interface services also depend on a vendor program, such as the Fisher-Rosemount
chipservice. To remove a service from the list of dependencies, use the button, and the service name will be removed from the “Dependencies” list.
When the PI Interface is started (as a service), the services listed in the dependency list will be verified as running (or an attempt will be made to start them). If the dependent service(s) cannot be started for any reason, then the PI interface service will not run.
Note: Please see the PI Log and Operating System Event Logger for messages that may indicate the cause for any server not running as expected.
- Add ButtonTo add a dependency from the list of Installed services, select the dependency name, and click the Add button.
- Remove ButtonTo remove a selected dependency, highlight the service name in the Dependencies list, and click the Remove button.
The full name of the service selected in the Installed services list is displayed below the Installed services list box.
CreateThe Create button adds the displayed service with the specified Dependencies and with the specified Startup Type.
14
Remove The Remove button removes the displayed service. If the service is not currently installed, or if the service is currently running, this button will be grayed out.
Start or Stop ServiceTo Start or Stop an interface service, use the Start button and a Stop button on the ICU toolbar. If this interface service is not currently installed, these buttons will remain grayed out until the service is added. If this interface service is running, the Stop button is available. If this service is not running, the Start button is available.
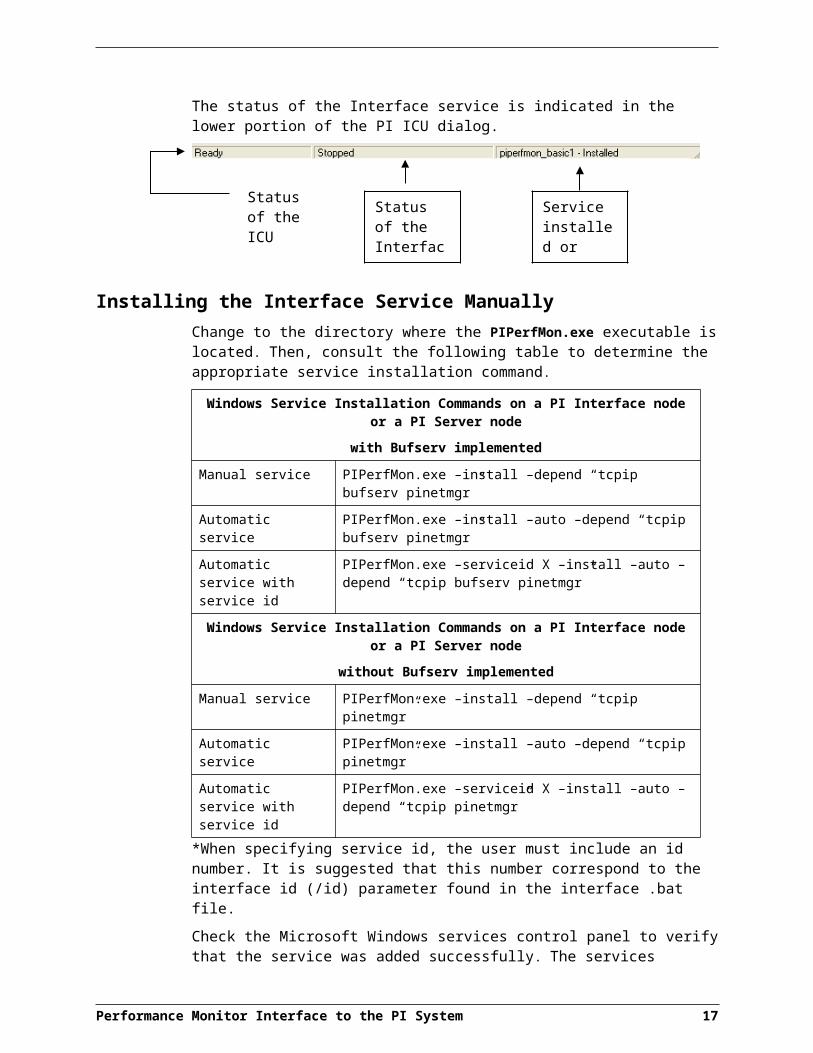
The status of the Interface service is indicated in the lower portion of the PI ICU dialog.
Installing the Interface Service ManuallyChange to the directory where the PIPerfMon.exe executable is located. Then, consult the following table to determine the appropriate service installation command.
Windows Service Installation Commands on a PI Interface node or a PI Server node
with Bufserv implemented
Manual service PIPerfMon.exe –install –depend “tcpip bufserv pinetmgr”
Automatic service PIPerfMon.exe –install –auto –depend “tcpip bufserv pinetmgr”
Automatic service with service id
PIPerfMon.exe –serviceid X –install –auto –depend “tcpip bufserv pinetmgr”
Windows Service Installation Commands on a PI Interface node or a PI Server nodewithout Bufserv implemented
Manual service PIPerfMon.exe –install –depend “tcpip pinetmgr”
Automatic service PIPerfMon.exe –install –auto –depend “tcpip pinetmgr”
Automatic service with service id
PIPerfMon.exe –serviceid X –install –auto –depend “tcpip pinetmgr”
*When specifying service id, the user must include an id number. It is suggested that this number correspond to the interface id (/id) parameter found in the interface .bat file.
Check the Microsoft Windows services control panel to verify that the service was added successfully. The services control panel can be used at any time to change the interface from an automatic service to a manual service or vice versa.
Performance Monitor Interface to the PI System 15
Status of the ICU Status of the
Interface Service
Service installed or uninstalled
Interface Installation
Files Installed for Full VersionThe full version performance monitor interface installation will install the following files:
File Description
PIPerfMon.exe PIPerfMon Interface executable file
PIPerfMon.bat_new Sample startup command file
PDH.dll Performance Data Helper (dynamic linked library) (NT4.0 only)
PIPerfCreator.exe Performance counter path utility
PIPerfMonDLL.dll PIPerfMon utility dll
PIPerfMon.doc Interface documentation
PIPerfMon_ReleaseNotes.txt Interface release notes
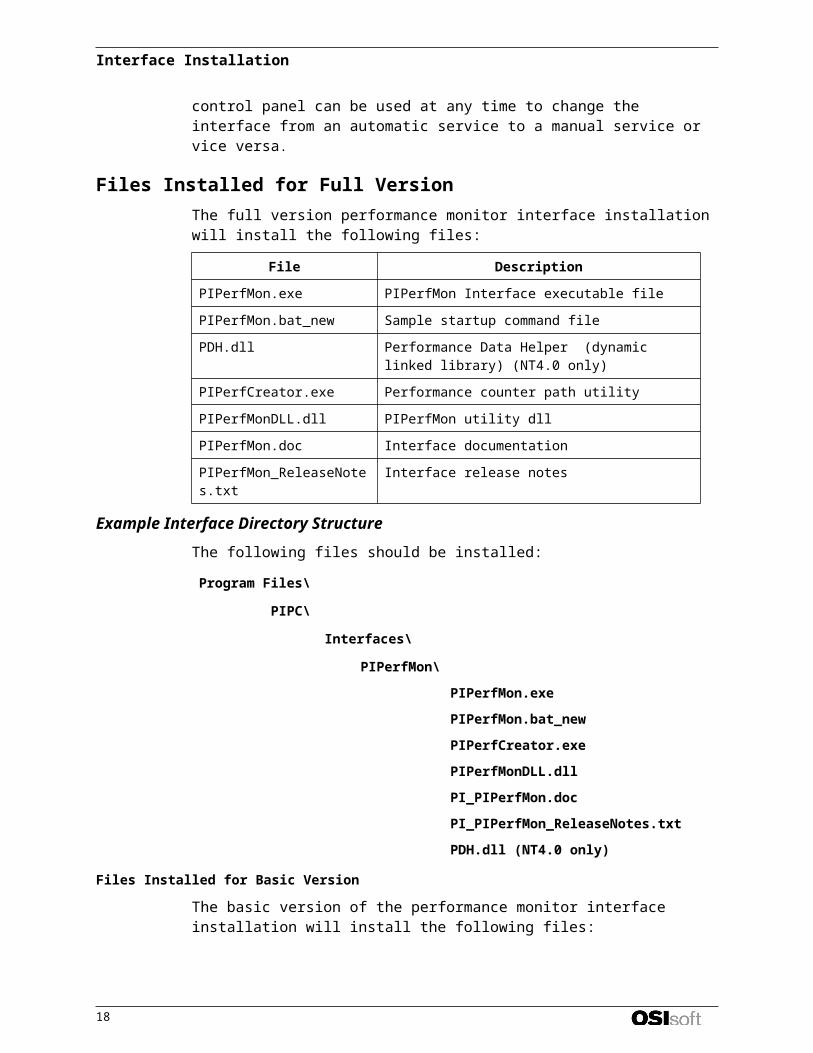
Example Interface Directory StructureThe following files should be installed:
Program Files\
PIPC\
Interfaces\
PIPerfMon\
PIPerfMon.exe
PIPerfMon.bat_new
PIPerfCreator.exe
PIPerfMonDLL.dll
PI_PIPerfMon.doc
PI_PIPerfMon_ReleaseNotes.txt
PDH.dll (NT4.0 only)
Files Installed for Basic Version
The basic version of the performance monitor interface installation will install the following files:
File Description
PIPerfMon_basic.exe PIPerfMon Interface executable file
PIPerfMon_basic.bat_new Sample startup command file
PDH.dll Performance Data Helper (dynamic linked library) (NT4.0 only)
PIPerfCreator.exe Performance counter path utility
PIPerfMonDLL.dll PIPerfMon utility dll
PIPerfMon.doc Interface documentation
PIPerfMon_ReleaseNotes.txt Interface release notes
16
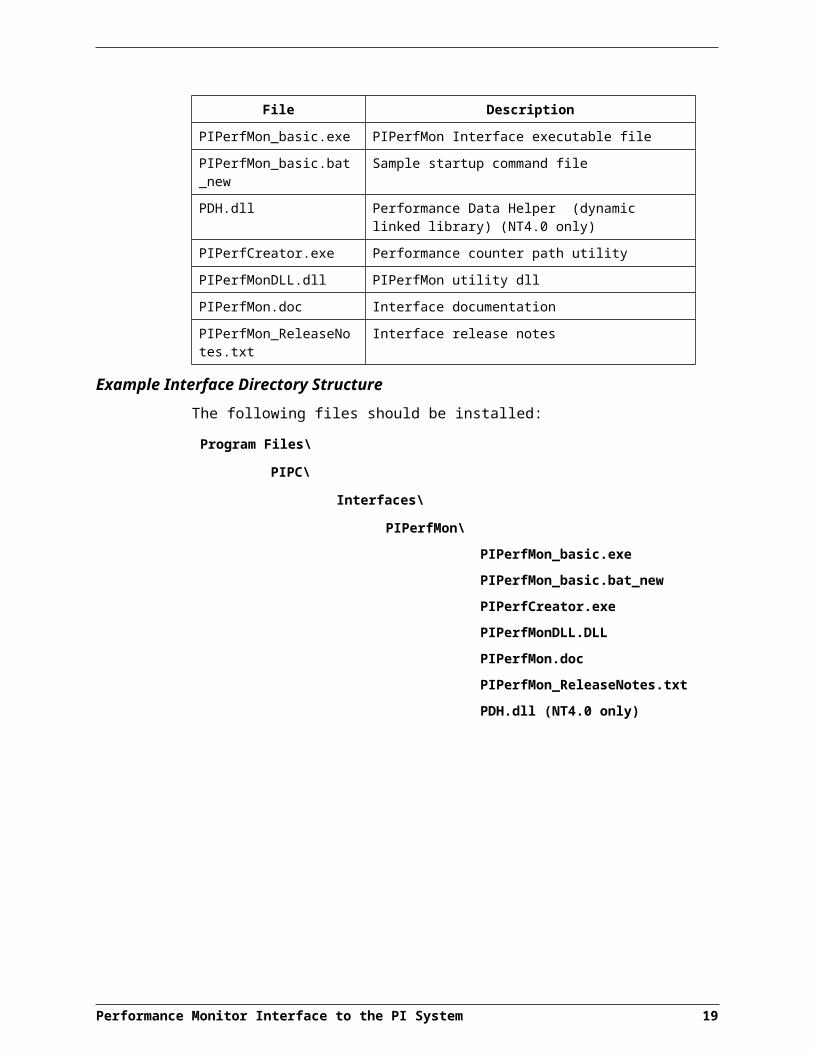
Example Interface Directory StructureThe following files should be installed:
Program Files\
PIPC\
Interfaces\
PIPerfMon\
PIPerfMon_basic.exe
PIPerfMon_basic.bat_new
PIPerfCreator.exe
PIPerfMonDLL.DLL
PIPerfMon.doc
PIPerfMon_ReleaseNotes.txt
PDH.dll (NT4.0 only)
Performance Monitor Interface to the PI System 17
PointSource
The PointSource is a unique, single or multi-character string that is used to identify the PI point as a point that belongs to a particular interface. For example, the string PerfMon may be used to identify points that belong to the PIPerfMon Interface. To implement this, the PointSource attribute would be set to PerfMon for every PI Point that is configured for the PIPerfMon Interface. Then, if /ps=PerfMon is used on the startup command-line of the PIPerfMon Interface, the Interface will search the PI Point Database upon startup for every PI point that is configured with a PointSource of PerfMon. Before an interface loads a point, the interface usually performs further checks by examining additional PI point attributes to determine whether a particular point is valid for the interface. For additional information, see the /ps parameter.
Case-sensitivity for PointSource AttributesIf the interface is running on a PINet node, use a capital letter (or a case-insensitive character such as a number, a question mark, etc.) for the PointSource attribute when defining points. For all other scenarios, the case of the PointSource is insignificant.
In all cases, the PointSource character that is supplied with the /ps command-line parameter is not case sensitive. That is, /ps=P and /ps=p are equivalent. It is only necessary to be careful with the case of the PointSource during point definition and only if the Interface will be running on a PINet node communicating to a PI Server.
Reserved Point SourcesSeveral subsystems and applications that ship with PI are associated with default PointSource characters. The Totalizer Subsystem uses the PointSource character T, the Alarm Subsystem uses G and @, Random uses R, RampSoak uses 9, and the Performance Equations Subsystem uses C. Do not use these PointSource characters or change the default point source characters for these applications. Also, if a PointSource character is not explicitly defined when creating a PI point; the point is assigned a default PointSource character of Lab (PI 3). Therefore, it would be confusing to use Lab as the PointSource character for an interface.
Note: Do not use a point source character that is already associated with another interface program. However it is acceptable to use the same point source for multiple instances of an interface.
Performance Monitor Interface to the PI System 19
PI Point ConfigurationA PI point or tag is associated with a single performance counter. A counter is unit of performance associated with the performance object. It provides data related to a single item of the system. A machine’s performance objects include physical components, such as processors, disks, and memory. There are also system objects, such as processes and threads. Each object is related to a functional element within the computer and has a set of standard counters assigned to it. For example the % Processor Time is a performance counter that measures the amount of processor time a performance object, such as the Processor, utilizes.
Performance Counter PathThis interface needs the performance counter path in order to obtain data for the specific performance counter. A performance counter path is the identifier of a counter for inclusion in gathering performance data. The counter names must be formatted a specific way in order to be properly recognized. The format is:\\Machine\PerfObject(ParentInstance/ObjectInstance#InstanceIndex)\Counter
\\MachineThe \\Machine portion is optional; if included, it specifies the name of the machine. If the machine name is not included, the local machine that the interface is running on is used.
\PerfObjectThe \PerfObject component is required; it specifies the performance object that contains the counter. If the object supports variable instances, then an instance string must also be specified.
(ParentInstance/ObjectInstance#InstanceIndex)The format of the (ParentInstance/ObjectInstance#InstanceIndex) portion depends on the type of object specified. If the object has simple instances, then the format is just the instance name in parentheses. For example, an instance for the Process object would be the process name such as (Explorer) or (MyApp).
When collecting data for these types of performance counters, the interface is unable to determine the validity of the instance specified in the parentheses. Therefore, although the performance counter may appear to be correctly formatted, data collection from it may fail if the instance does not exist on the machine at the time the interface attempts to collect data from it.
For example, the performance counter, \\MyMachine\LogicalDisk(D:)\% Free Space, will be accepted by the interface because it is correctly formatted. However, if the logical disk, D:, does not exist on MyMachine during data collection, the data collection will fail.
If these are the only types of performance counters monitored on a machine, the machine
Performance Monitor Interface to the PI System 21
may be incorrectly identified as being offline if the instances specified in all the performance counters do not exist on the machine.
\CounterThe \Counter portion is required and it specifies the performance counter. For example the Process object has counters such as % Processor Time and Interrupts/Sec.
PIPerfCreatorObtaining and knowing the performance counter path for every performance counter is a daunting task. Therefore, this interface includes the PIPerfCreator utility (referenced later). This program can be used to obtain the performance counter path and create the performance counter points.
Point AttributesUse the point attributes below to define the PI Point configuration for the Interface, including specifically what data to transfer.
TagA tag is a label or name for a point. Any tag name can be used in accordance to the normal PI point naming conventions.
LengthThe length of the Tag field is limited by the version of the PI API, the version of the PI Server, and sometimes by a specific Interface. The table below explains this in more detail. When the maximum possible lengths differ for the software installed on site, the shortest length applies.
PI API PI Server Maximum Length
1.6 or higher 3.4.370.x or higher 1023
1.6 or higher Below 3.4.370.x 255
Below 1.6 3.4.370.x or higher 255
Below 1.6 Below 3.4.370.x 255
PointSourceThe PointSource is a single or multi-character string which is used to identify the PI point as a point that belongs to a particular interface. For additional information, see the /ps command-line parameter and the “Point Source” section.
Performance Monitor Interface to the PI System 22
PointTypeFloat16, float32, int16, int32, and digital point types are supported on PI 3 Servers. For more information on the individual point types, see PI Data Archive for NT and UNIX.
Location1This parameter is used to specify the interface number, which corresponds to the /id=# parameter in the PIPerfMon.bat (PIPerfMon_basic.bat for the basic version) file. Valid interface numbers are integer values 1 to 99, inclusive.
Location2Location2 is not used by this interface.
Location3Location3 is not used by this interface.
Location4Location4 defines the scan class for the PI point. The scan class determines the frequency at which input points are scanned for new values. For more information, see the description of the /f parameter in the section called “The Startup Command File”.
Location5Location5 is not used by this interface.
InstrumentTagInstrumentTag is not used by this interface.
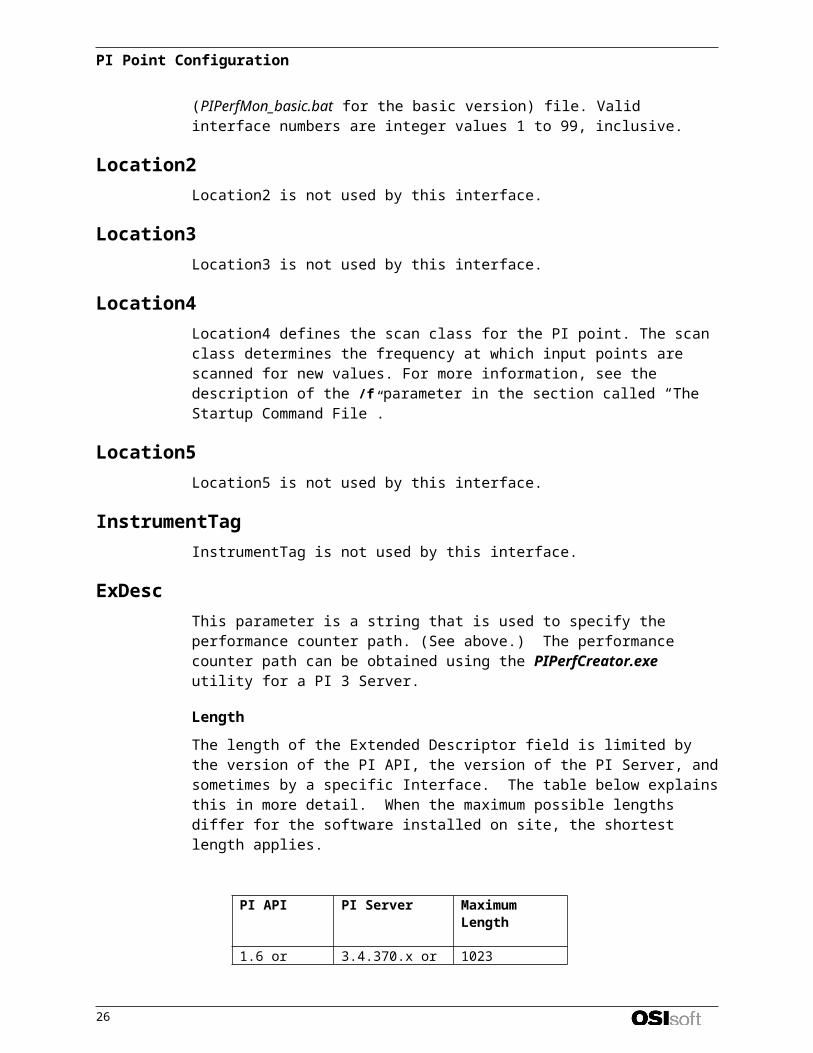
ExDescThis parameter is a string that is used to specify the performance counter path. (See above.) The performance counter path can be obtained using the PIPerfCreator.exe utility for a PI 3 Server.
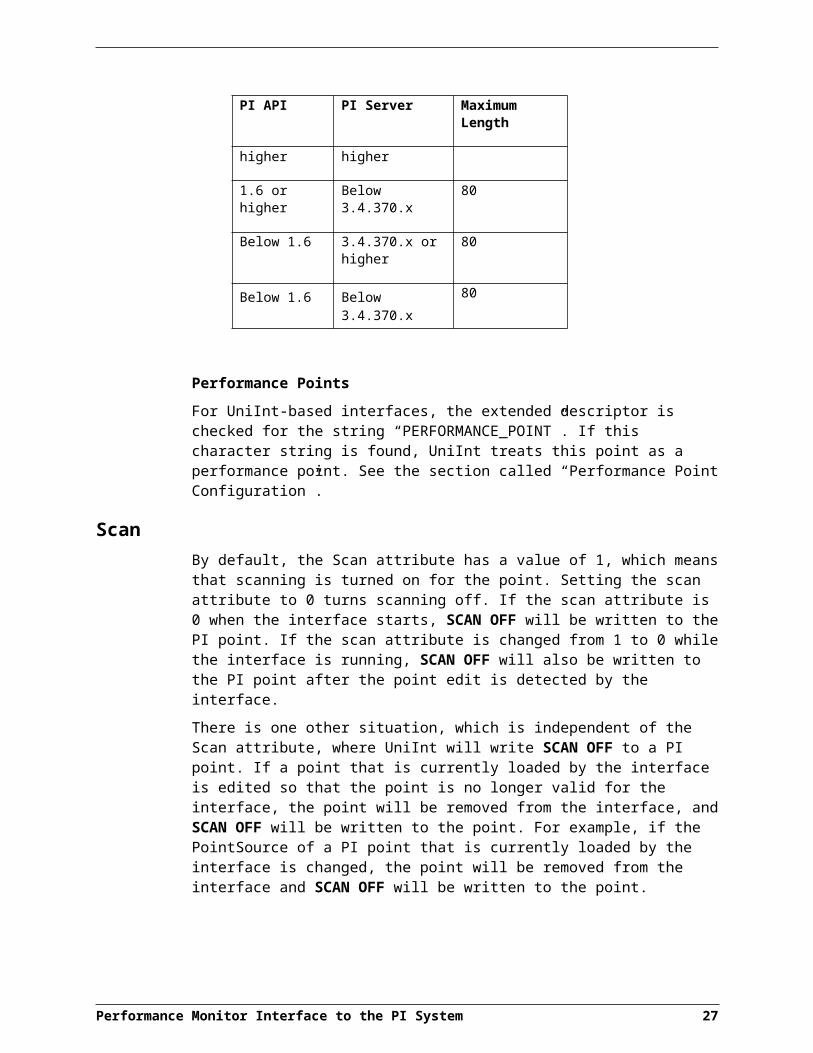
LengthThe length of the Extended Descriptor field is limited by the version of the PI API, the version of the PI Server, and sometimes by a specific Interface. The table below explains this in more detail. When the maximum possible lengths differ for the software installed on site, the shortest length applies.
PI API PI Server Maximum Length
1.6 or higher 3.4.370.x or higher 1023
1.6 or higher Below 3.4.370.x 80
Below 1.6 3.4.370.x or higher 80
Performance Monitor Interface to the PI System 23
PI Point Configuration
PI API PI Server Maximum Length
Below 1.6 Below 3.4.370.x 80
Performance Points For UniInt-based interfaces, the extended descriptor is checked for the string “PERFORMANCE_POINT”. If this character string is found, UniInt treats this point as a performance point. See the section called “Performance Point Configuration”.
ScanBy default, the Scan attribute has a value of 1, which means that scanning is turned on for the point. Setting the scan attribute to 0 turns scanning off. If the scan attribute is 0 when the interface starts, SCAN OFF will be written to the PI point. If the scan attribute is changed from 1 to 0 while the interface is running, SCAN OFF will also be written to the PI point after the point edit is detected by the interface.
There is one other situation, which is independent of the Scan attribute, where UniInt will write SCAN OFF to a PI point. If a point that is currently loaded by the interface is edited so that the point is no longer valid for the interface, the point will be removed from the interface, and SCAN OFF will be written to the point. For example, if the PointSource of a PI point that is currently loaded by the interface is changed, the point will be removed from the interface and SCAN OFF will be written to the point.
ShutdownThe Shutdown attribute is 1 (true) by default. The default behavior of the PI Shutdown subsystem is to write the SHUTDOWN digital state to all PI points when PI is started. The timestamp that is used for the SHUTDOWN events is retrieved from a file that is updated by the Snapshot Subsystem. The timestamp is usually updated every 15 minutes, which means that the timestamp for the SHUTDOWN events will be accurate to within 15 minutes in the event of a power failure. For additional information on shutdown events, refer to PI Server manuals.
Note: The SHUTDOWN events that are written by the PI Shutdown subsystem are independent of the SHUTDOWN events that are written by the interface when the /stopstat=Shutdown command-line parameter is specified.
SHUTDOWN events can be disabled from being written to PI when PI is restarted by setting the Shutdown attribute to 0 for each point. Alternatively, the default behavior of the PI Shutdown Subsystem can be changed to write SHUTDOWN events only for PI points that have their Shutdown attribute set to 0. To change the default behavior, edit the \PI\dat\Shutdown.dat file, as discussed in PI Server manuals.
BufservIt is undesirable to write shutdown events when Bufserv is being used. Bufserv is a utility program that provides the capability to store and forward events to a PI Server, allowing continuous data collection when the Server is down for maintenance, upgrades, backups,
24

and unexpected failures. That is, when PI is shut down, Bufserv will continue to collect data for the interface, making it undesirable to write SHUTDOWN events to the PI points for this interface.
ConversThis parameter is used to scale the input into the PI Server. The default is set to 1. The input is multiplied by this number and then sent to PI.
Performance Monitor Interface to the PI System 25
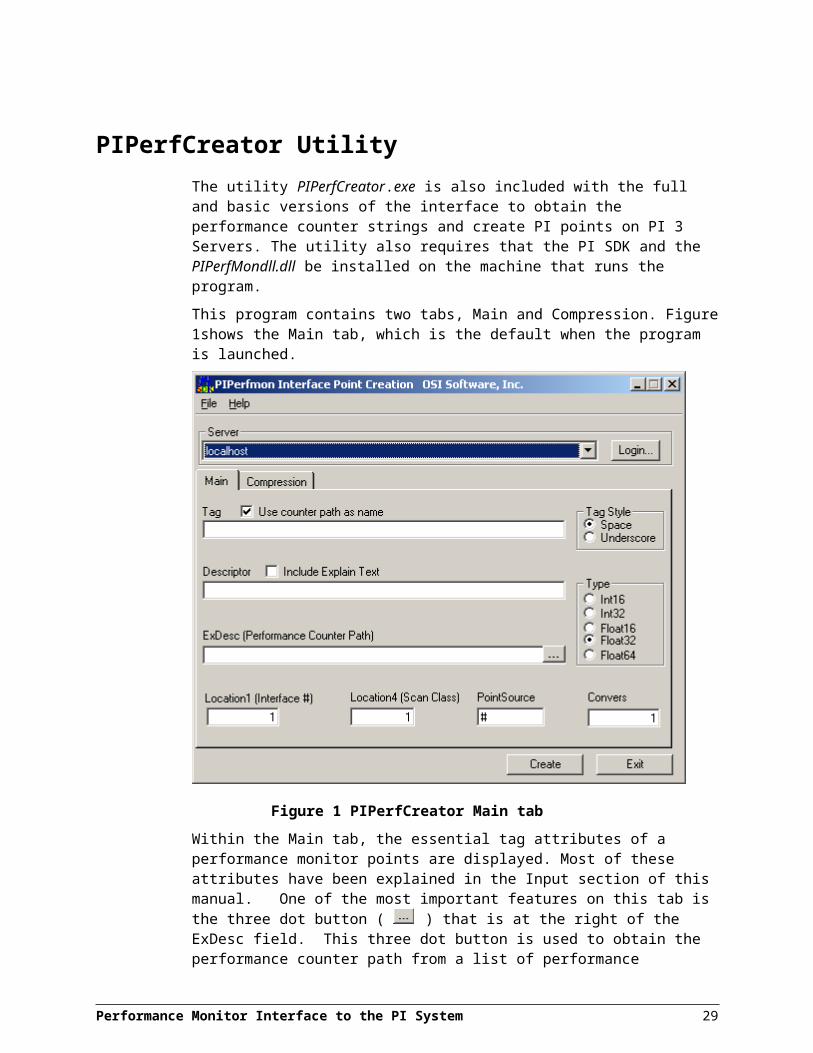
PIPerfCreator UtilityThe utility PIPerfCreator.exe is also included with the full and basic versions of the interface to obtain the performance counter strings and create PI points on PI 3 Servers. The utility also requires that the PI SDK and the PIPerfMondll.dll be installed on the machine that runs the program.
This program contains two tabs, Main and Compression. Figure 1shows the Main tab, which is the default when the program is launched.
Figure 1 PIPerfCreator Main tab
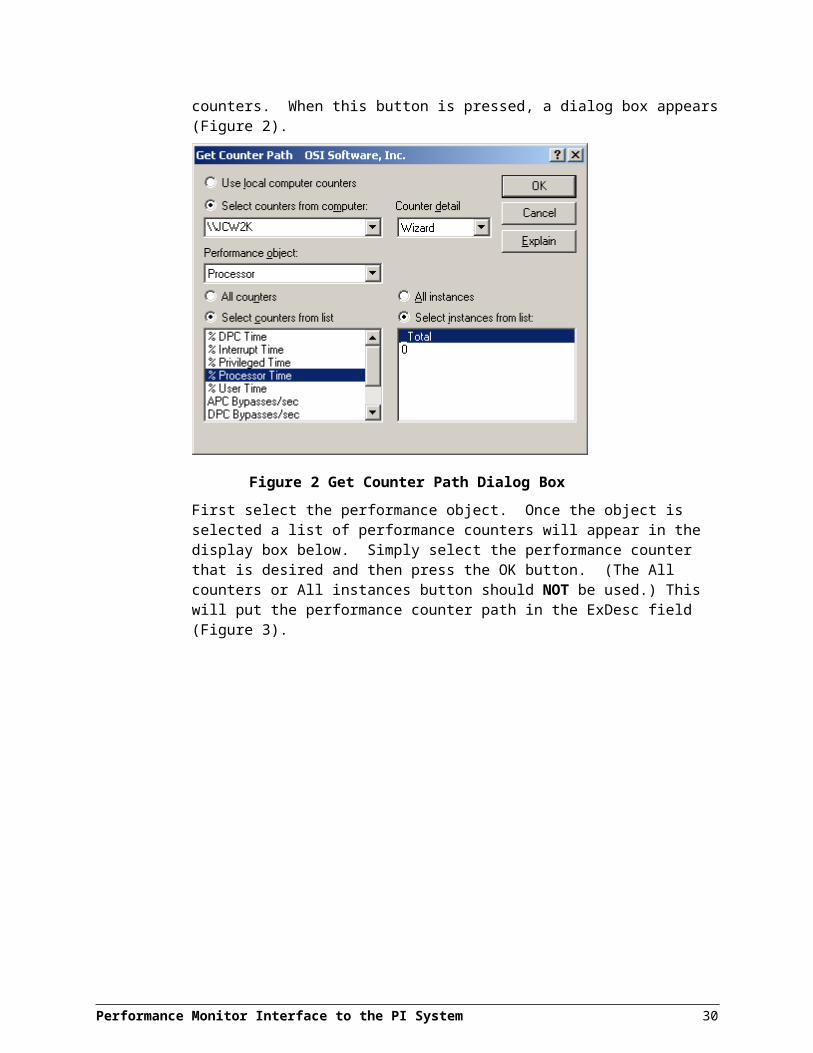
Within the Main tab, the essential tag attributes of a performance monitor points are displayed. Most of these attributes have been explained in the Input section of this manual. One of the most important features on this tab is the three dot button ( ) that is at the right of the ExDesc field. This three dot button is used to obtain the performance counter path from a list of performance counters. When this button is pressed, a dialog box appears (Figure 2).
Performance Monitor Interface to the PI System 27
Figure 2 Get Counter Path Dialog Box
First select the performance object. Once the object is selected a list of performance counters will appear in the display box below. Simply select the performance counter that is desired and then press the OK button. (The All counters or All instances button should NOT be used.) This will put the performance counter path in the ExDesc field (Figure 3).
Performance Monitor Interface to the PI System 28
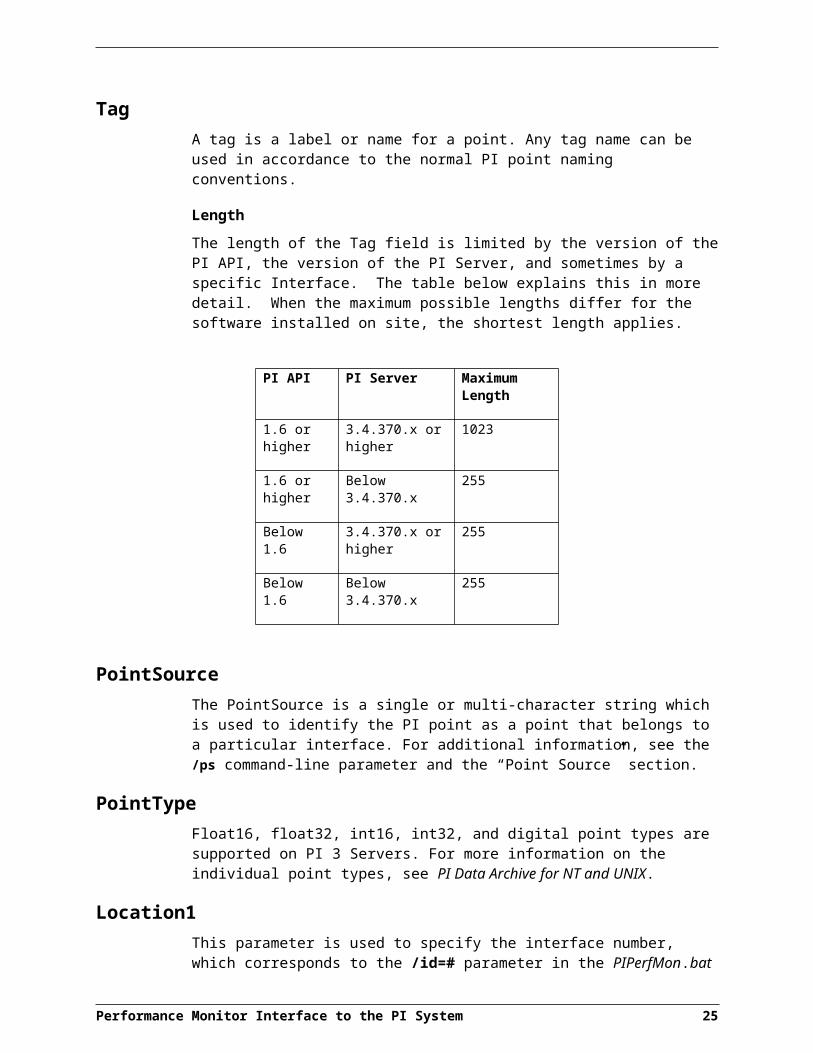
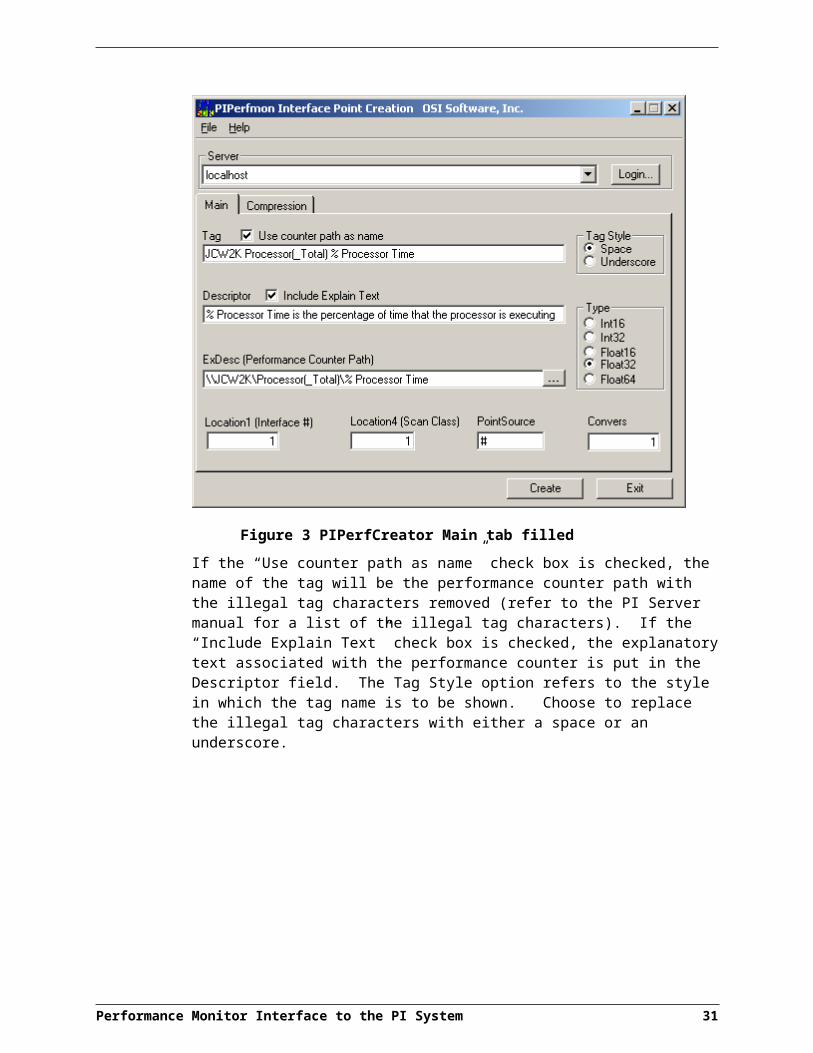
Figure 3 PIPerfCreator Main tab filled
If the “Use counter path as name” check box is checked, the name of the tag will be the performance counter path with the illegal tag characters removed (refer to the PI Server manual for a list of the illegal tag characters). If the “Include Explain Text” check box is checked, the explanatory text associated with the performance counter is put in the Descriptor field. The Tag Style option refers to the style in which the tag name is to be shown. Choose to replace the illegal tag characters with either a space or an underscore.
Performance Monitor Interface to the PI System 29
PIPerfCreator Utility
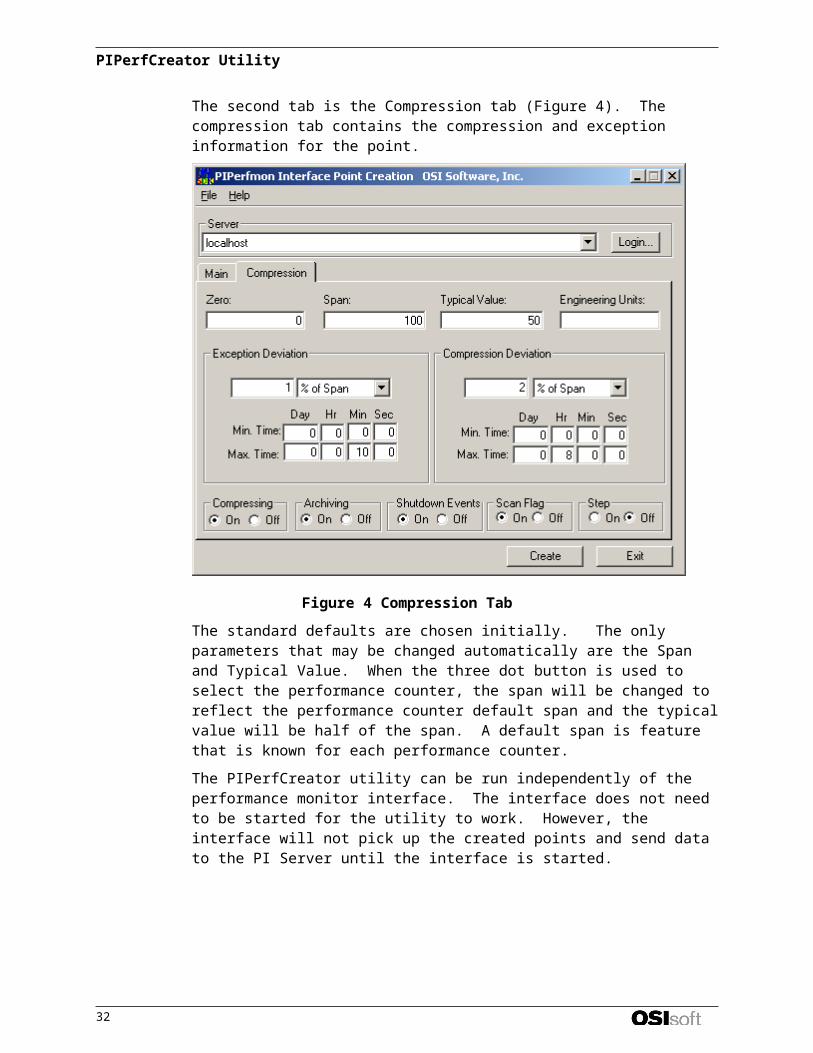
The second tab is the Compression tab (Figure 4). The compression tab contains the compression and exception information for the point.
Figure 4 Compression Tab
The standard defaults are chosen initially. The only parameters that may be changed automatically are the Span and Typical Value. When the three dot button is used to select the performance counter, the span will be changed to reflect the performance counter default span and the typical value will be half of the span. A default span is feature that is known for each performance counter.
The PIPerfCreator utility can be run independently of the performance monitor interface. The interface does not need to be started for the utility to work. However, the interface will not pick up the created points and send data to the PI Server until the interface is started.
30
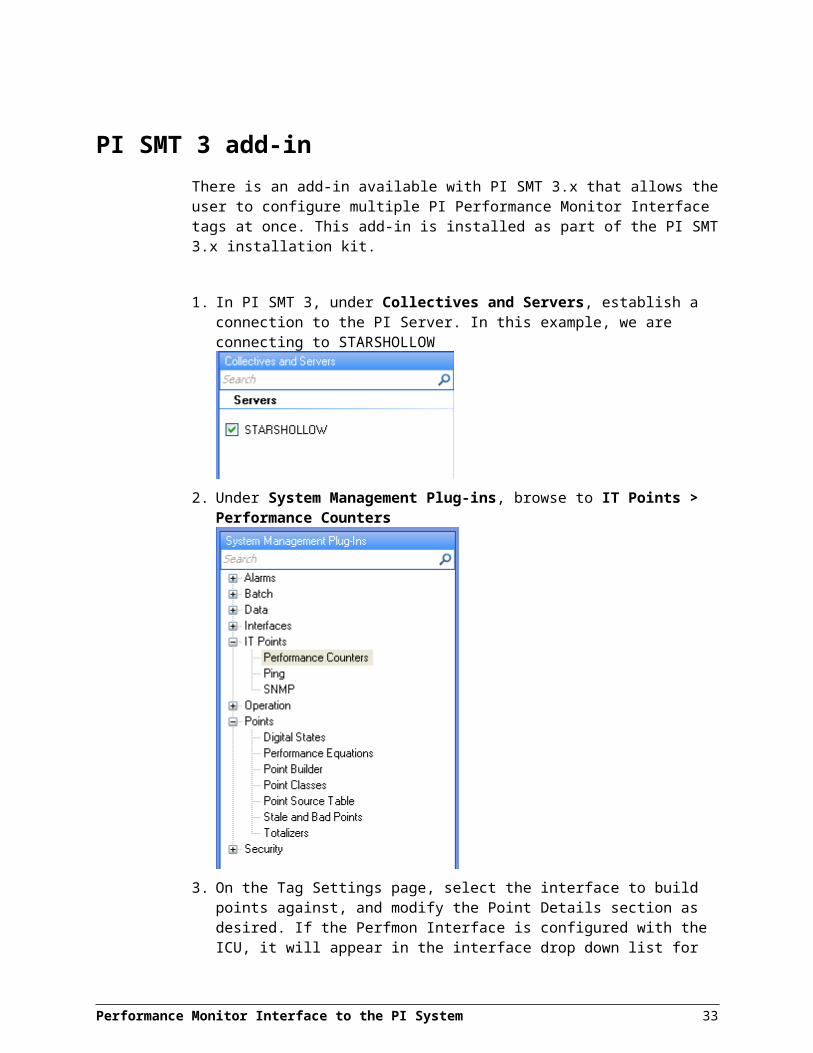
PI SMT 3 add-inThere is an add-in available with PI SMT 3.x that allows the user to configure multiple PI Performance Monitor Interface tags at once. This add-in is installed as part of the PI SMT 3.x installation kit.
1. In PI SMT 3, under Collectives and Servers, establish a connection to the PI Server. In this example, we are connecting to STARSHOLLOW
2. Under System Management Plug-ins, browse to IT Points > Performance Counters
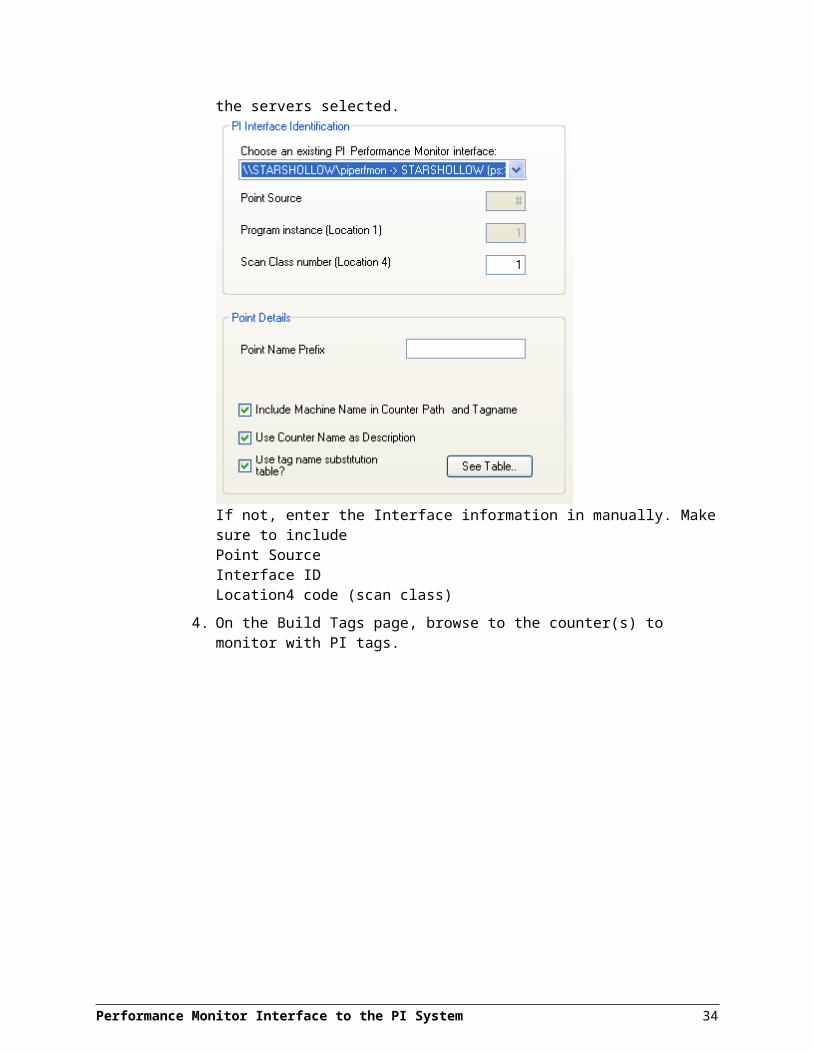
3. On the Tag Settings page, select the interface to build points against, and modify the Point Details section as desired. If the Perfmon Interface is configured with the ICU, it will appear in the interface drop down list for the servers selected.
Performance Monitor Interface to the PI System 31
If not, enter the Interface information in manually. Make sure to includePoint SourceInterface IDLocation4 code (scan class)
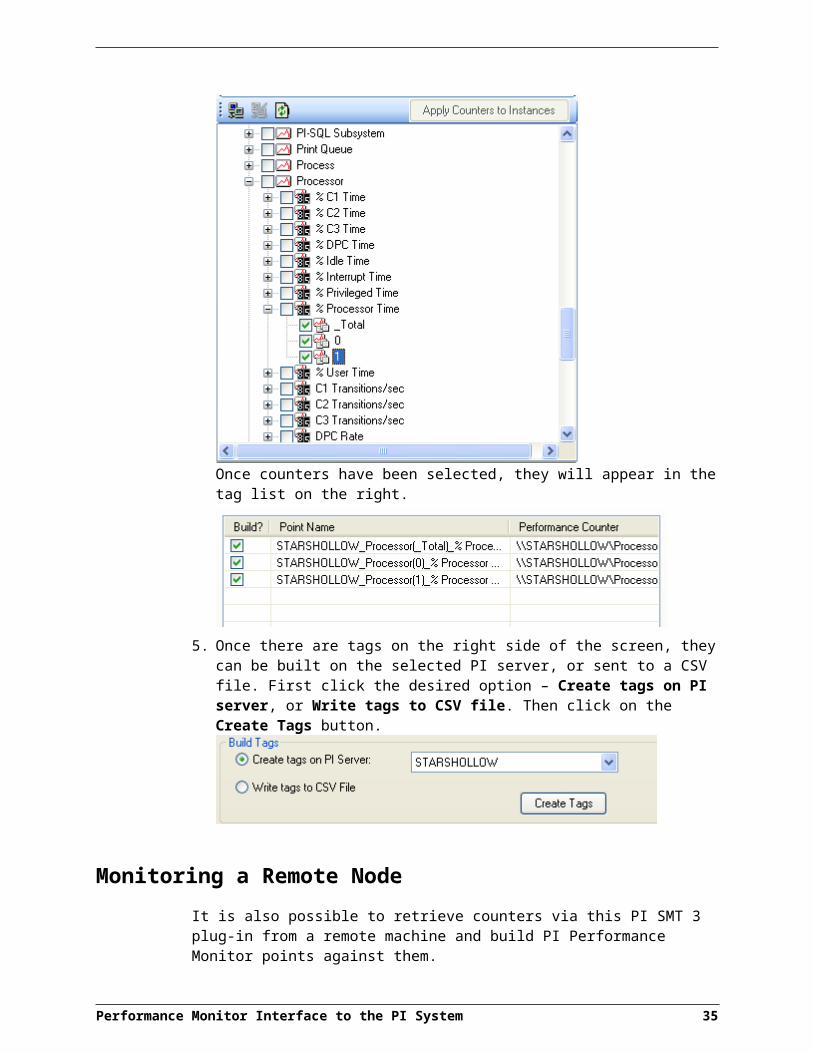
4. On the Build Tags page, browse to the counter(s) to monitor with PI tags.
Performance Monitor Interface to the PI System 32
Once counters have been selected, they will appear in the tag list on the right.
5. Once there are tags on the right side of the screen, they can be built on the selected PI server, or sent to a CSV file. First click the desired option – Create tags on PI server, or Write tags to CSV file. Then click on the Create Tags button.
Monitoring a Remote NodeIt is also possible to retrieve counters via this PI SMT 3 plug-in from a remote machine and build PI Performance Monitor points against them.
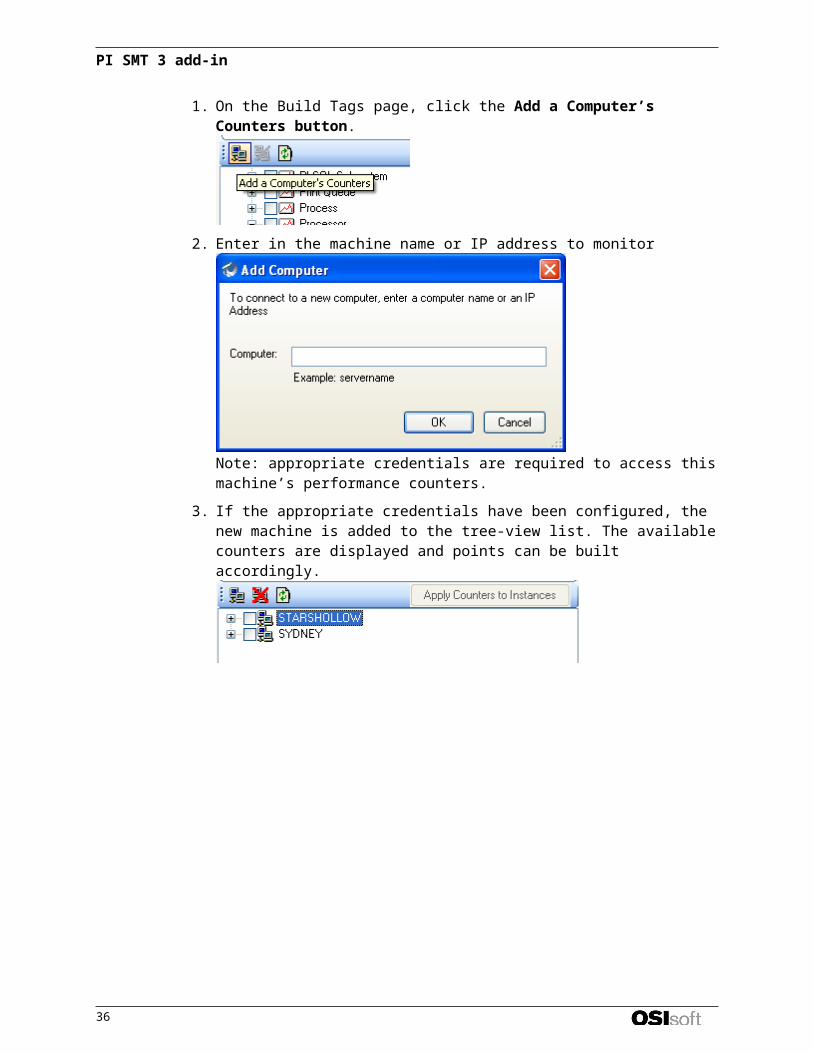
1. On the Build Tags page, click the Add a Computer’s Counters button.
2. Enter in the machine name or IP address to monitor
Note: appropriate credentials are required to access this machine’s performance counters.
3. If the appropriate credentials have been configured, the new machine is added to the tree-view list. The available counters are displayed and points can be built
Performance Monitor Interface to the PI System 33
PI SMT 3 add-in
accordingly.
34
Performance Point ConfigurationPerformance points can be configured to monitor the amount of time in seconds that an interface takes to complete a scan for a particular scan class. The closer the scan completion time is to 0 seconds, the better the performance. The scan completion time is recorded to millisecond resolution
Note: These are NOT the Performance Counters, but a mechanism for monitoring the operation of the interface.
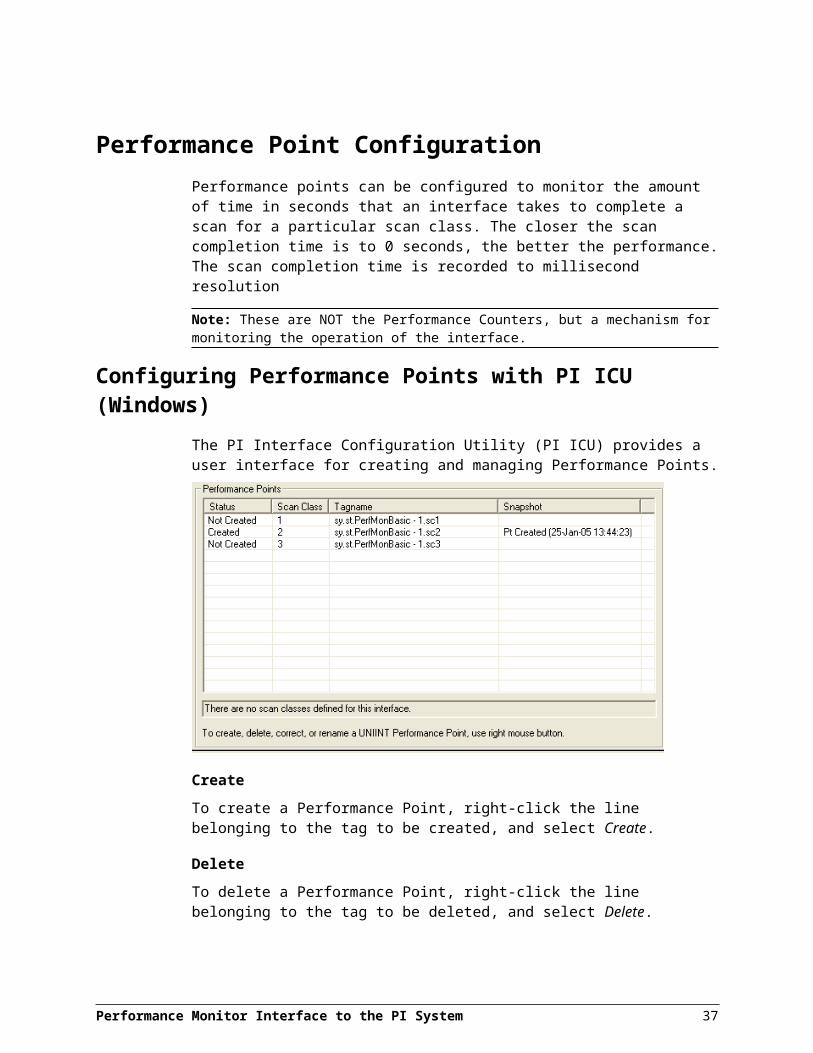
Configuring Performance Points with PI ICU (Windows)The PI Interface Configuration Utility (PI ICU) provides a user interface for creating and managing Performance Points.
CreateTo create a Performance Point, right-click the line belonging to the tag to be created, and select Create.
DeleteTo delete a Performance Point, right-click the line belonging to the tag to be deleted, and select Delete.
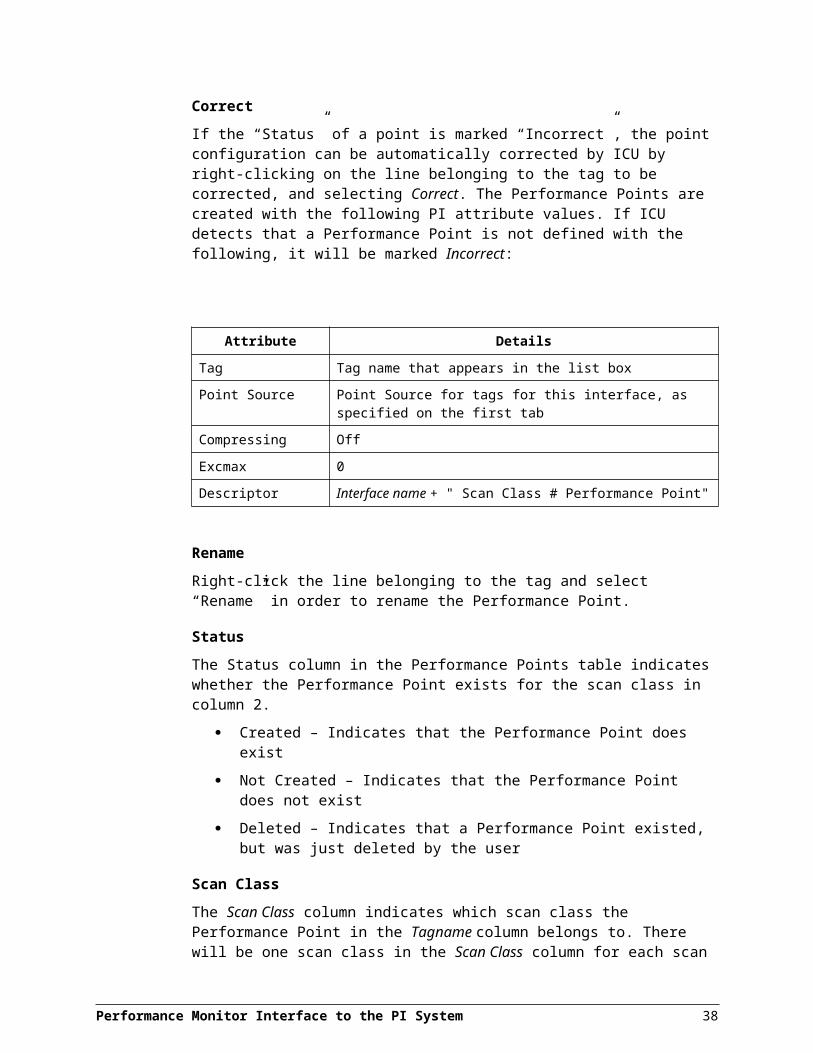
CorrectIf the “Status” of a point is marked “Incorrect”, the point configuration can be automatically corrected by ICU by right-clicking on the line belonging to the tag to be corrected, and selecting Correct. The Performance Points are created with the following PI attribute values. If ICU detects that a Performance Point is not defined with the following, it will be marked Incorrect:
Performance Monitor Interface to the PI System 35
Attribute Details
Tag Tag name that appears in the list box
Point Source Point Source for tags for this interface, as specified on the first tab
Compressing Off
Excmax 0
Descriptor Interface name + " Scan Class # Performance Point"
RenameRight-click the line belonging to the tag and select “Rename” in order to rename the Performance Point.
StatusThe Status column in the Performance Points table indicates whether the Performance Point exists for the scan class in column 2.
Created – Indicates that the Performance Point does exist
Not Created – Indicates that the Performance Point does not exist
Deleted – Indicates that a Performance Point existed, but was just deleted by the user
Scan ClassThe Scan Class column indicates which scan class the Performance Point in the Tagname column belongs to. There will be one scan class in the Scan Class column for each scan class listed in the Scan Classes combo box on the UniInt Parameters tab.
TagnameThe Tagname column holds the Performance Point tag name.
SnapshotThe Snapshot column holds the snapshot value of each Performance Point that exists in PI. The Snapshot column is updated when the Performance Points/Counters tab is clicked, and when the interface is first loaded.
Performance Monitor Interface to the PI System 36
Configuring Performance Points ManuallyPerformance point configuration is the same on all operating system platforms. Performance points are configured as follows.
1. Set the extended descriptor to:PERFORMANCE_POINTor to:PERFORMANCE_POINT=interface_idwhere interface_id corresponds to the identifier that is specified with the /id parameter on the startup command line of the interface. The character string PERFORMANCE_POINT is case insenstive. The interface_id does not need to be specified if there is only one copy of an interface that is associated with a particular point source.
2. Set Location4 to correspond to the scan class whose performance is to be monitored. For example, to monitor scan class 2, set Location4 to 2. See the /f parameter for a description of scan classes.
3. Set the PointSource attribute to correspond to the /ps parameter on the startup command line of the interface.
4. Set the PointType attribute to float32.
Performance Monitor Interface to the PI System 37
I/O Rate Tag ConfigurationAn I/O Rate point can be configured to receive 10-minute averages of the total number of exceptions per minute that are sent to PI by the interface. An exception is a value that has passed the exception specifications for a given PI point. Since 10-minute averages are taken, the first average is not written to PI until 10 minutes after the interface has started. One I/O Rate tag can be configured for each copy of the interface that is in use.
Monitoring I/O Rates on the Interface NodeFor Windows nodes, the 10-minute rate averages (in events/minute) can be monitored with a client application such as ProcessBook.
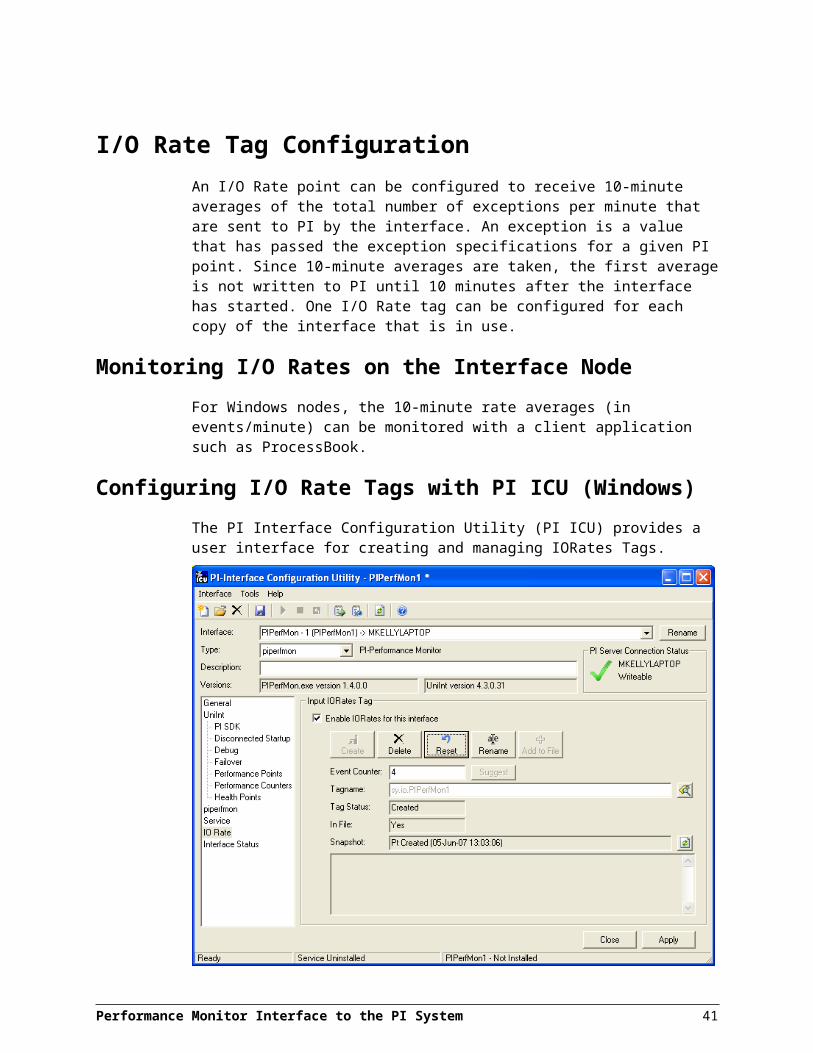
Configuring I/O Rate Tags with PI ICU (Windows)The PI Interface Configuration Utility (PI ICU) provides a user interface for creating and managing IORates Tags.
PI ICU currently allows for one I/O Rate tag to be configured for each copy of the interface that is in use. Some interfaces allow for multiple I/O Rates tags.
Performance Monitor Interface to the PI System 39
Enable IORates for this InterfaceThe Enable IORates for this interface check box enables or disables IORates for the current interface. To disable IORates for the selected interface, uncheck this box. To enable IORates for the selected interface, check this box.
Event CounterThe Event Counter correlates a tag specified in the iorates.dat file with this copy of the interface. The command line equivalent is /ec=x, where x is the same number that is assigned to a tag name in the iorates.dat file.
TagnameThe tag name listed under the Tagname column is the name of the IORates tag.
Tag StatusThe Tag Status column indicates whether the IORates tag exists in PI. The possible states are:
Created – This status indicates that the tag exist in PI
Not Created – This status indicates that the tag does not yet exist in PI
Deleted – This status indicates that the tag has just been deleted
Unknown – This status indicates that the ICU is not able to access the PI Server
In FileThe In File column indicates whether the IORates tag listed in the tag name and the event counter is in the IORates.dat file. The possible states are:
Yes – This status indicates that the tag name and event counter are in the IORates.dat file
No – This status indicates that the tag name and event counter are not in the IORates.dat file
SnapshotThe Snapshot column holds the snapshot value of the I/O Rate tag, if the I/O Rate tag exists in PI. The Snapshot column is updated when the IORates/Status Tags tab is clicked, and when the Interface is first loaded.
Button Menu OptionsCreateCreate the suggested IORates tag with the tag name indicated in the Tagname column.
DeleteDelete the IORates tag listed in the Tagname column.
ResetResets the IO Rate configuration as PI ICU suggests.
Performance Monitor Interface to the PI System 40
RenameAllows the user to specify a new name for the IORates tag listed in the Tagname column.
Add to FileAdds the tag to the IORates.dat file with the event counter listed in the Event Counter Column.
Search Allows the user to search the PI Server for a previously defined IORates tag.
Refresh Snapshots Used to update the snapshot values.
Configuring I/O Rate Tags ManuallyThere are two configuration steps.
1. Configuring the PI Point on the PI Server
2. Configuration on the Interface Node
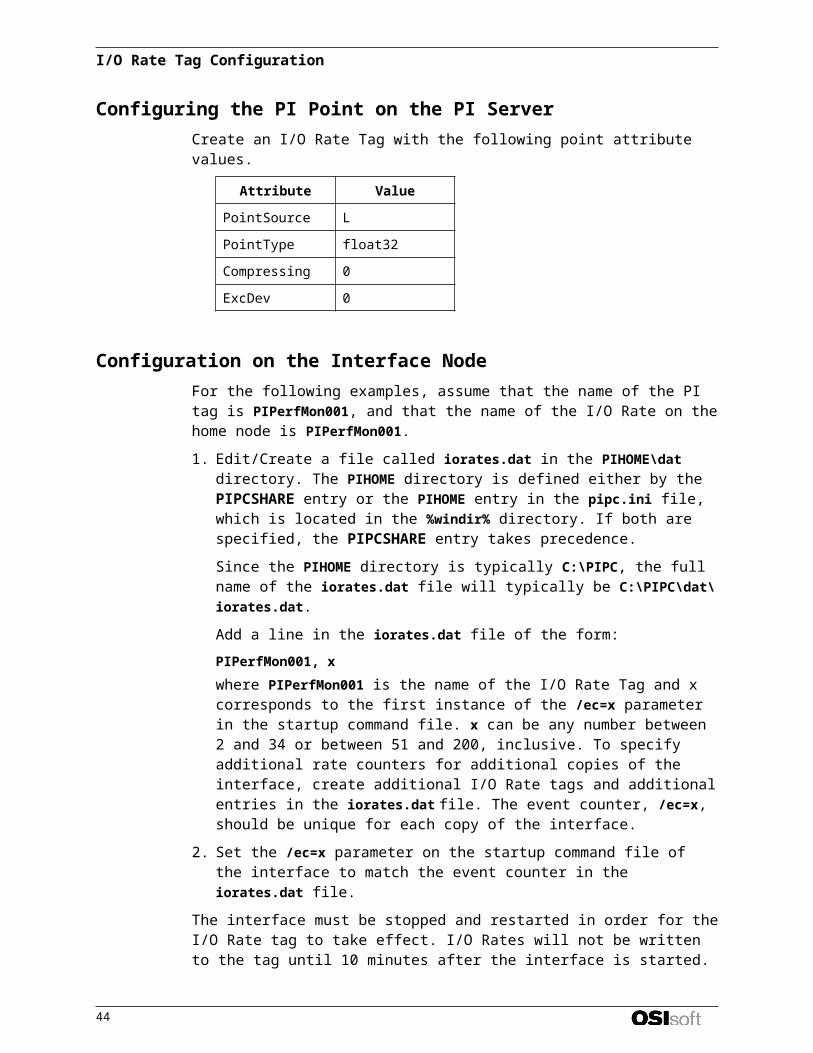
Configuring the PI Point on the PI ServerCreate an I/O Rate Tag with the following point attribute values.
Attribute Value
PointSource L
PointType float32
Compressing 0
ExcDev 0
Configuration on the Interface NodeFor the following examples, assume that the name of the PI tag is PIPerfMon001, and that the name of the I/O Rate on the home node is PIPerfMon001.
1. Edit/Create a file called iorates.dat in the PIHOME\dat directory. The PIHOME directory is defined either by the PIPCSHARE entry or the PIHOME entry in the pipc.ini file, which is located in the %windir% directory. If both are specified, the PIPCSHARE entry takes precedence.
Since the PIHOME directory is typically C:\PIPC, the full name of the iorates.dat file will typically be C:\PIPC\dat\iorates.dat.
Add a line in the iorates.dat file of the form:PIPerfMon001, x
Performance Monitor Interface to the PI System 41
I/O Rate Tag Configuration
where PIPerfMon001 is the name of the I/O Rate Tag and x corresponds to the first instance of the /ec=x parameter in the startup command file. x can be any number between 2 and 34 or between 51 and 200, inclusive. To specify additional rate counters for additional copies of the interface, create additional I/O Rate tags and additional entries in the iorates.dat file. The event counter, /ec=x, should be unique for each copy of the interface.
2. Set the /ec=x parameter on the startup command file of the interface to match the event counter in the iorates.dat file.
The interface must be stopped and restarted in order for the I/O Rate tag to take effect. I/O Rates will not be written to the tag until 10 minutes after the interface is started.
42
Startup Command FileCommand-line parameters can begin with a / or with a -. For example, the /ps=M and –ps=M command-line parameters are equivalent.
For Windows, command file names have a .bat extension. The Windows continuation character (^) allows one to use multiple lines for the startup command. The maximum length of each line is 1024 characters (1 kilobyte). The number of parameters is unlimited, and the maximum length of each parameter is 1024 characters.
Configuring the Interface with PI ICU
Note: PI ICU requires PI 3.3 or greater.
The PI Interface Configuration Utility provides a graphical user interface for configuring PI interfaces. If the interface is configured by the PI ICU, the batch file of the interface (PIPerfMon.bat) will be maintained by the PI ICU and all configuration changes will be kept in that file. The procedure below describes the necessary steps for using PI ICU to configure the PIPerfMon Interface.
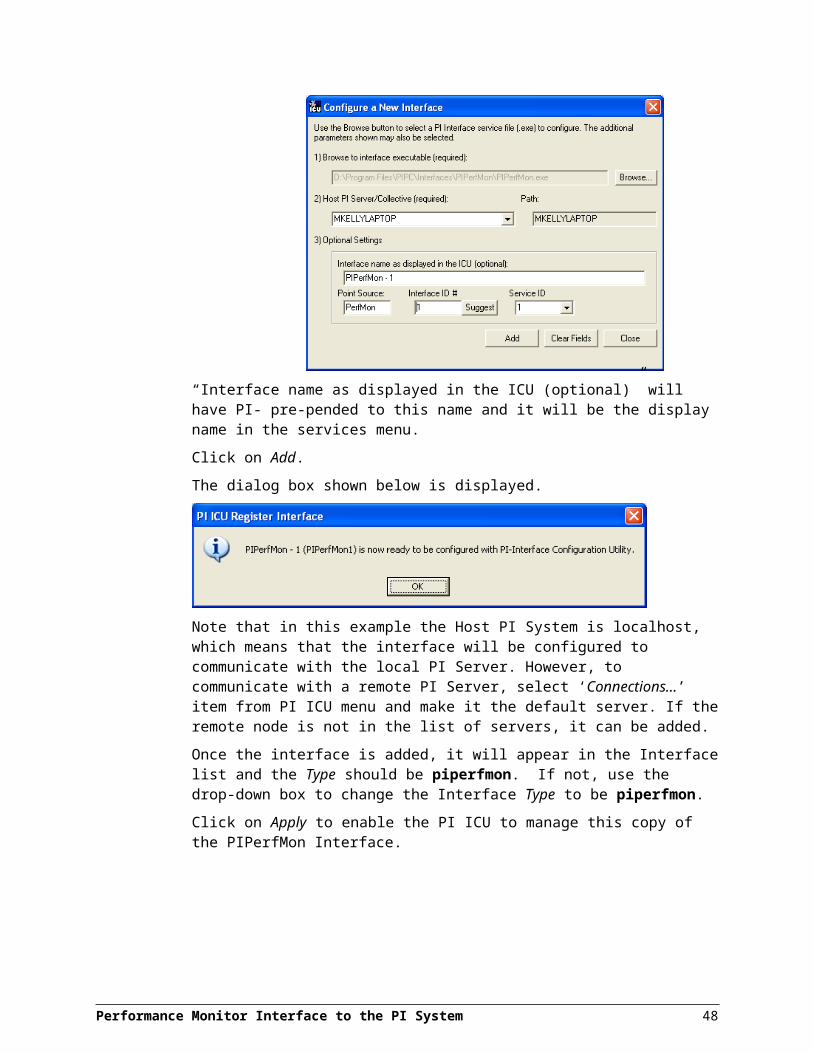
From the PI ICU menu, select Interface, New, and then Browse to the PIPerfMon.exe executable file. Then, enter values for Point Source and Interface ID#. A window such as the following results:
“Interface name as displayed in the ICU (optional)” will have PI- pre-pended to this name and it will be the display name in the services menu.
Click on Add.
The dialog box shown below is displayed.
Performance Monitor Interface to the PI System 43
Note that in this example the Host PI System is localhost, which means that the interface will be configured to communicate with the local PI Server. However, to communicate with a remote PI Server, select ‘Connections…’ item from PI ICU menu and make it the default server. If the remote node is not in the list of servers, it can be added.
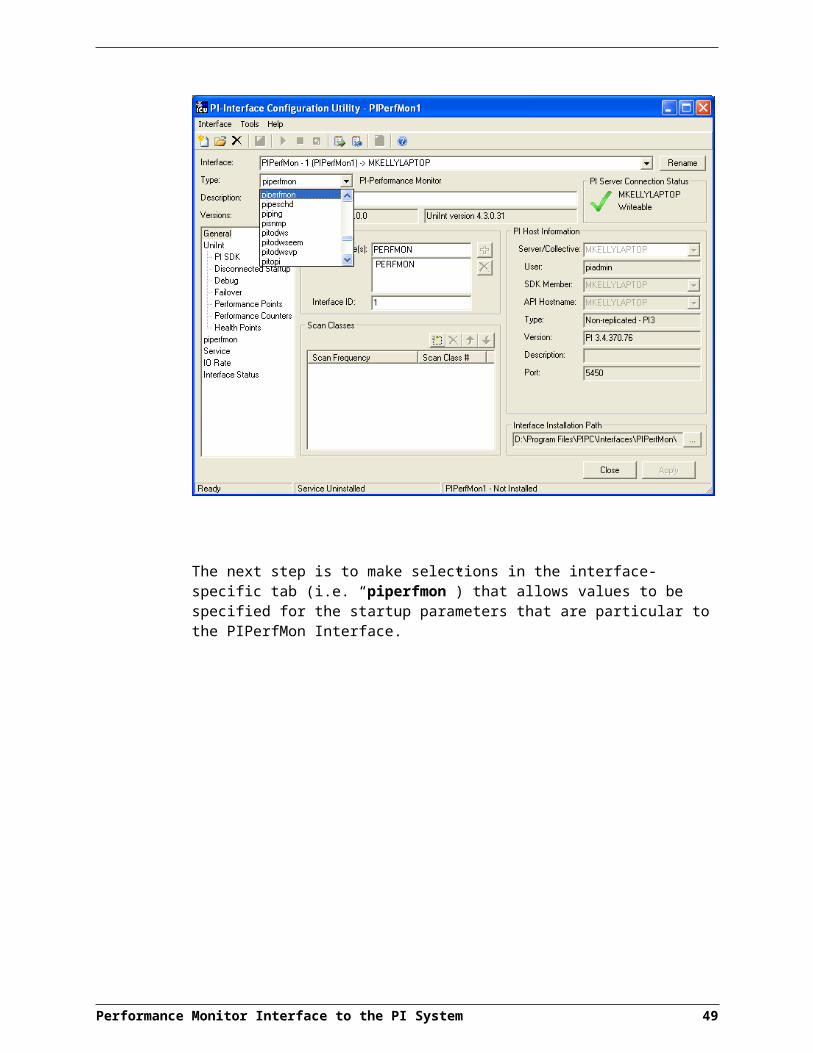
Once the interface is added, it will appear in the Interface list and the Type should be piperfmon. If not, use the drop-down box to change the Interface Type to be piperfmon.
Click on Apply to enable the PI ICU to manage this copy of the PIPerfMon Interface.
The next step is to make selections in the interface-specific tab (i.e. “piperfmon”) that allows values to be specified for the startup parameters that are particular to the PIPerfMon Interface.
Performance Monitor Interface to the PI System 44
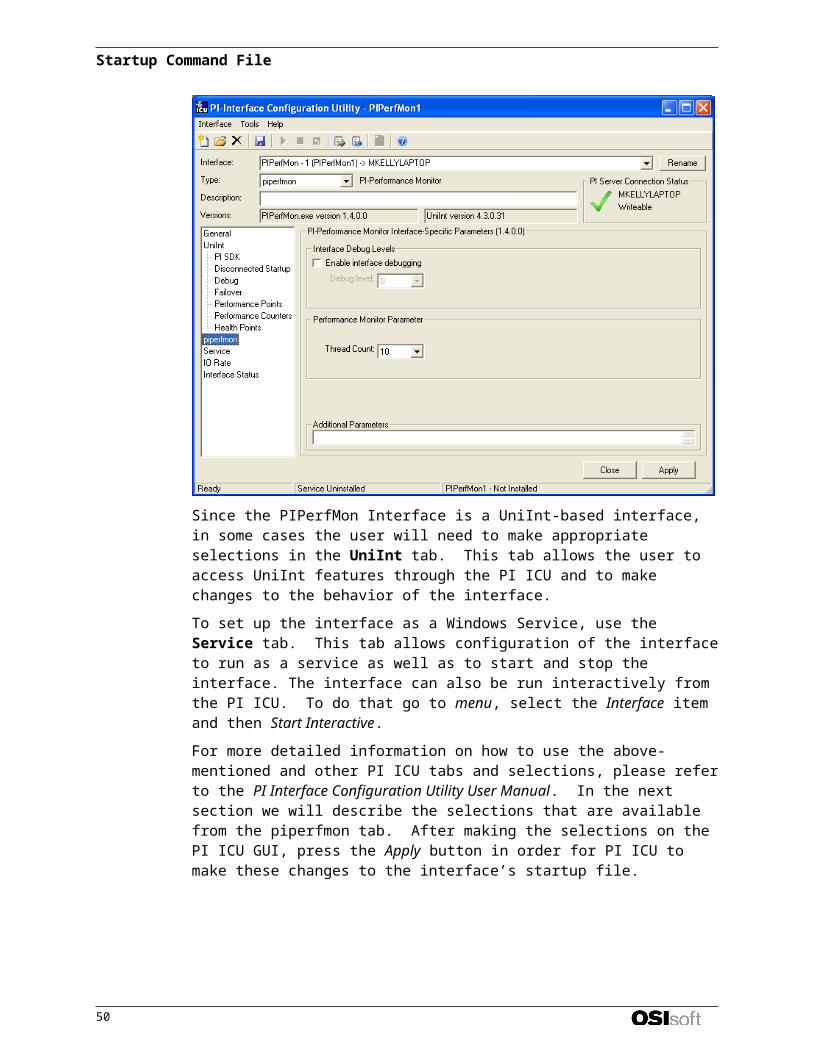
Since the PIPerfMon Interface is a UniInt-based interface, in some cases the user will need to make appropriate selections in the UniInt tab. This tab allows the user to access UniInt features through the PI ICU and to make changes to the behavior of the interface.
To set up the interface as a Windows Service, use the Service tab. This tab allows configuration of the interface to run as a service as well as to start and stop the interface. The interface can also be run interactively from the PI ICU. To do that go to menu, select the Interface item and then Start Interactive.
For more detailed information on how to use the above-mentioned and other PI ICU tabs and selections, please refer to the PI Interface Configuration Utility User Manual. In the next section we will describe the selections that are available from the piperfmon tab. After making the selections on the PI ICU GUI, press the Apply button in order for PI ICU to make these changes to the interface’s startup file.
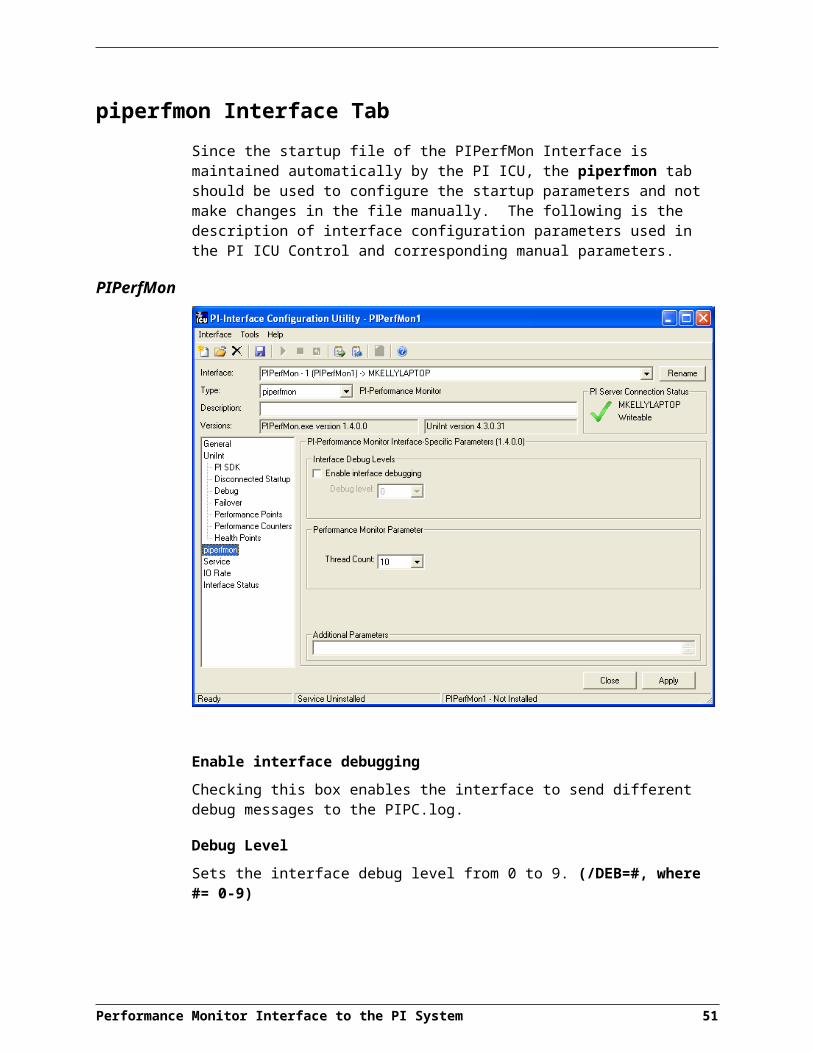
piperfmon Interface TabSince the startup file of the PIPerfMon Interface is maintained automatically by the PI ICU, the piperfmon tab should be used to configure the startup parameters and not make changes in the file manually. The following is the description of interface configuration parameters used in the PI ICU Control and corresponding manual parameters.
Performance Monitor Interface to the PI System 45
Startup Command File
PIPerfMon
Enable interface debugging Checking this box enables the interface to send different debug messages to the PIPC.log.
Debug Level Sets the interface debug level from 0 to 9. (/DEB=#, where #= 0-9)
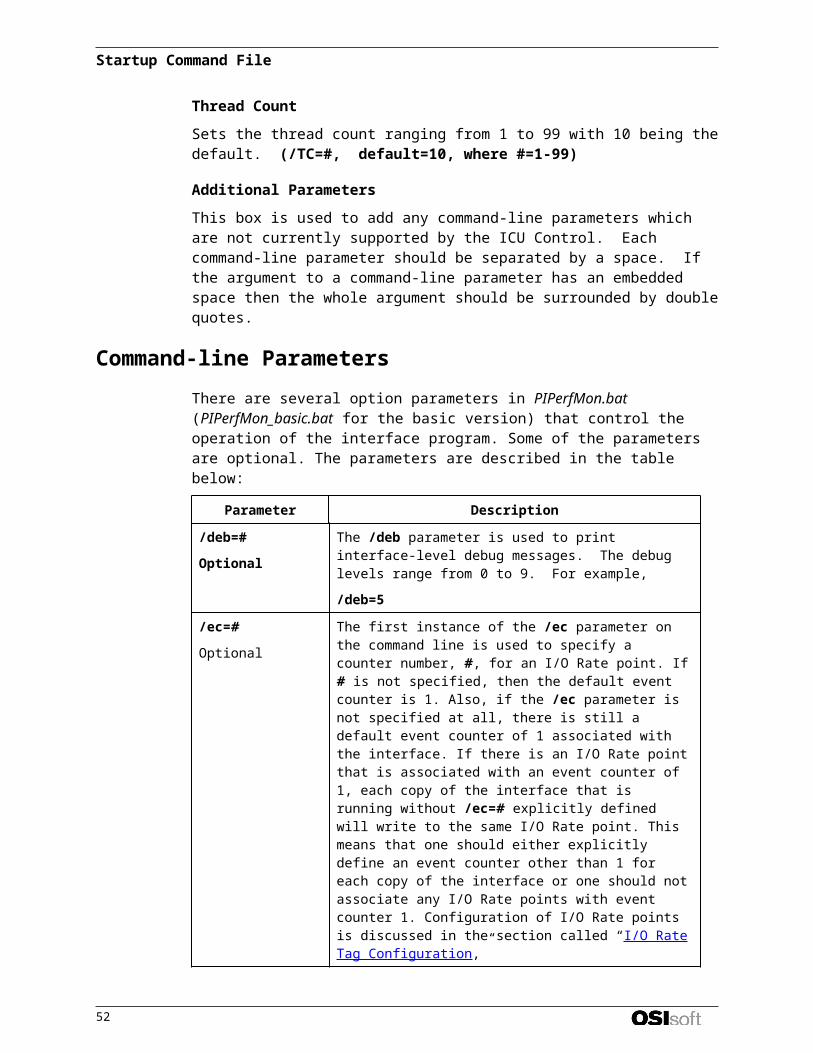
Thread Count Sets the thread count ranging from 1 to 99 with 10 being the default. (/TC=#, default=10, where #=1-99)
Additional Parameters This box is used to add any command-line parameters which are not currently supported by the ICU Control. Each command-line parameter should be separated by a space. If the argument to a command-line parameter has an embedded space then the whole argument should be surrounded by double quotes.
Command-line ParametersThere are several option parameters in PIPerfMon.bat (PIPerfMon_basic.bat for the basic version) that control the operation of the interface program. Some of the parameters are optional. The parameters are described in the table below:
46
Parameter Description
/deb=#
OptionalThe /deb parameter is used to print interface-level debug messages. The debug levels range from 0 to 9. For example,
/deb=5
/ec=#
Optional
The first instance of the /ec parameter on the command line is used to specify a counter number, #, for an I/O Rate point. If # is not specified, then the default event counter is 1. Also, if the /ec parameter is not specified at all, there is still a default event counter of 1 associated with the interface. If there is an I/O Rate point that is associated with an event counter of 1, each copy of the interface that is running without /ec=# explicitly defined will write to the same I/O Rate point. This means that one should either explicitly define an event counter other than 1 for each copy of the interface or one should not associate any I/O Rate points with event counter 1. Configuration of I/O Rate points is discussed in the section called “I/O Rate Tag Configuration,”
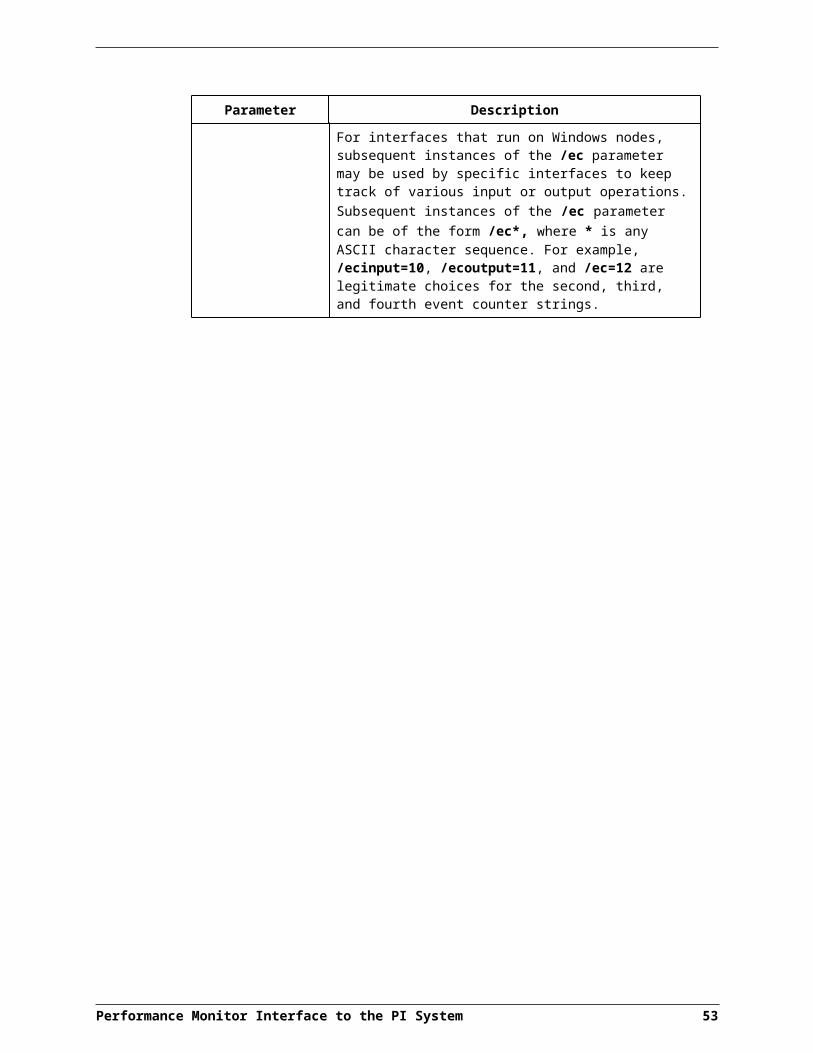
For interfaces that run on Windows nodes, subsequent instances of the /ec parameter may be used by specific interfaces to keep track of various input or output operations. Subsequent instances of the /ec parameter can be of the form /ec*, where * is any ASCII character sequence. For example, /ecinput=10, /ecoutput=11, and /ec=12 are legitimate choices for the second, third, and fourth event counter strings.
Performance Monitor Interface to the PI System 47
Startup Command File
Parameter Description
/f=SSor/f=SS,SSor /f=HH:MM:SSor/f=HH:MM:SS,hh:mm:ss
Required
The /f parameter defines the time period between scans in terms of hours (HH), minutes (MM), and seconds (SS). The scans can be scheduled to occur at discrete moments in time with an optional time offset specified in terms of hours (hh), minutes (mm), and seconds (ss). If HH and MM are omitted, then the time period that is specified is assumed to be in seconds.
Each instance of the /f parameter on the command line defines a scan class for the interface. There is no limit to the number of scan classes that can be defined. The first occurrence of the /f parameter on the command line defines the first scan class of the interface, the second occurrence defines the second scan class, and so on. PI Points are associated with a particular scan class via the Location4 PI Point attribute. For example, all PI Points that have Location4 set to 1 will receive input values at the frequency defined by the first scan class. Similarly, all points that have Location4 set to 2 will receive input values at the frequency specified by the second scan class, and so on.
Two scan classes are defined in the following example:/f=00:01:00,00:00:05 /f=00:00:07or, equivalently:/f=60,5 /f=7The first scan class has a scanning frequency of 1 minute with an offset of 5 seconds, and the second scan class has a scanning frequency of 7 seconds. When an offset is specified, the scans occur at discrete moments in time according to the formula:
scan times = (reference time) + n(frequency) + offset
where n is an integer and the reference time is midnight on the day that the interface was started. In the above example, frequency is 60 seconds and offset is 5 seconds for the first scan class. This means that if the interface was started at 05:06:06, the first scan would be at 05:06:10, the second scan would be at 05:07:10, and so on. Since no offset is specified for the second scan class, the absolute scan times are undefined.
The definition of a scan class does not guarantee that the associated points will be scanned at the given frequency. If the interface is under a large load, then some scans may occur late or be skipped entirely. See the section called “Performance Point Configuration” for more information on skipped or missed scans.
Sub-second Scan Classes
One can also specify sub-second scan classes on the command line such as
/f=0.5 /f=0.1
where the scanning frequency associated with the first scan class is 0.5 seconds and the scanning frequency associated with the second scan class is 0.1 seconds.
Similarly, sub-second scan classes with sub-second offsets can be defined, such as
/f=0.5,0.2 /f=1,0Wall Clock Scheduling
48

Parameter DescriptionScan classes that strictly adhere to wall clock scheduling are now possible. This feature is available for interfaces that run on Windows and/or UNIX. Previously, wall clock scheduling was possible, but not across daylight savings time. For example, /f=24:00:00,08:00:00 corresponds to 1 scan a day starting at 8 AM. However, after a Daylight Savings Time change, the scan would occur either at 7 AM or 9 AM, depending upon the direction of the time shift. To schedule a scan once a day at 8 AM (even across daylight savings time), one should use /f=24:00:00,00:08:00,L. The ,L at the end of the scan class tells UniInt to use the new wall clock scheduling algorithm.
/host=host:port
Required
The /host parameter is used to specify the PI Home node. Host is the IP address of the PI Sever node or the domain name of the PI Server node. Port is the port number for TCP/IP communication. The port is always 5450 for a PI 3 Server. It is recommended to explicitly define the host and port on the command line with the /host parameter. Nevertheless, if either the host or port is not specified, the interface will attempt to use defaults.
Defaults:
The default port name and server name is specified in the pilogin.ini or piclient.ini file. The piclient.ini file is ignored if a pilogin.ini file is found. Refer to the PI API Installation Instructions manual for more information on the piclient.ini and pilogin.ini files.
Examples:The interface is running on an API node, the domain name of the PI 3 home node is Marvin, and the IP address of Marvin is 206.79.198.30. Valid /host parameters would be:/host=marvin/host=marvin:5450 /host=206.79.198.30/host=206.79.198.30:5450
/id=x
Required
The /id parameter is used to specify the interface identifier.
The interface identifier is a string that is no longer than 9 characters in length. UniInt concatenates this string to the header that is used to identify error messages as belonging to a particular interface. See the section called “Informational Messages” for more information.
UniInt always uses the /id parameter in the fashion described above. This interface also uses the /id parameter to identify a particular interface copy number that corresponds to an integer value that is assigned to Location1. For this interface, one should use only numeric characters in the identifier. For example,
/id=1
Performance Monitor Interface to the PI System 49
Startup Command File
Parameter Description
/ps=x
Required
The /ps parameter specifies the point source for the interface. X is not case sensitive and can be any single or multi-character string. For example, /ps=P and /ps=p are equivalent.
The point source that is assigned with the /ps parameter corresponds to the PointSource attribute of individual PI Points. The interface will attempt to load only those PI points with the appropriate point source.
/q
Optional
When the /q parameter is present, Snapshots and exceptions are queued before they are sent to the PI Server node.
The maximum queue size is close to 4000 bytes. The queue is flushed between scans if it is not filled.
/stopstator/stopstat=digstate
Default:/stopstat=”Intf shut”
Optional
If the /stopstat parameter is present on the startup command line, then the digital state I/O Timeout will be written to each PI Point when the interface is stopped.
If /stopstat=digstate is present on the command line, then the digital state, digstate, will be written to each PI Point when the interface is stopped. The digstate must be in the system digital state table. UniInt uses the first occurrence in the table.
If neither /stopstat nor /stopstat=digstate is specified on the command line, then no digital states will be written when the interface is shut down.
Examples:/stopstat=”Intf shut”
The entire parameter is enclosed within double quotes when there is a space in digstate.
/tc=x
Default=10
Optional
The /tc parameter is used to specify the number of threads used by the interface. The number of threads range from 1 to 99. The default is 10 if the /tc parameter is not specified. For example,
/tc=5
50
Sample PIPerfMon.bat FileThe following is a sample full version interface startup command file (PIPerfMon.bat).REM=======================================================================REM PIPerfMon.batREMREM Sample startup file for the Performance Monitor InterfaceREMREM=======================================================================REMREM OSIsoft strongly recommends using PI ICU to modify startup files.REMREM Sample command lineREM .\PIPerfMon /ps=# /Q /id=1 /host=XXXXXX:5450 ^ /f=00:00:05 /f=00:01:00REMREM End of PIPerfMon.bat File
Performance Monitor Interface to the PI System 51
Interface Node ClockMake sure that the time and time zone settings on the computer are correct. To confirm, run the Date/Time applet located in the Windows Control Panel. If the locale where the interface node resides observes Daylight Saving Time, check the box marked “Automatically adjust clock for daylight saving changes”. For example,
In addition, make sure that the TZ environment variable is not defined. All of the currently defined environment variables can be viewed by opening a Command Prompt window and typing set. That is,
C:> set
Make sure that the TZ environment variable is not defined. All of the currently defined environment variables can be viewed by opening a Command Prompt window and typing set. Confirm that TZ is not in the resulting list. If it is, run the System applet of the Control Panel, click the Environment tab, and remove TZ from the list of environment variables.
Performance Monitor Interface to the PI System 53
Security
Windows The PI Firewall Database and the PI Proxy Database must be configured so that the interface is allowed to write data to the PI Server. See “Modifying the Firewall Database” and “Modifying the Proxy Database” in the PI Server manuals.
Note that the Trust Database, which is maintained by the Base Subsystem, replaces the Proxy Database used prior to PI version 3.3. The Trust Database maintains all the functionality of the proxy mechanism while being more secure.See “Trust Login Security” in the chapter “PI System Management” of the PI Universal Data Server System Management Guide.
If the interface cannot write data to the PI Server because it has insufficient privileges, a –10401 error will be reported in the pipc.log file. If the interface cannot send data to a PI2 Serve, it writes a –999 error. See the section “Appendix A: Error and Informational Messages” for additional information on error messaging.
PI Server v3.3 and Higher
Security configuration using piconfigFor PI Server v3.3 and higher, the following example demonstrates how to edit the PI Trust table:C:\PI\adm> piconfig@table pitrust@mode create@istr Trust,IPAddr,NetMask,PIUsera_trust_name,192.168.100.11,255.255.255.255,piadmin@quit
For the above,
Trust: An arbitrary name for the trust table entry; in the above example,
a_trust_name
IPAddr: the IP Address of the computer running the Interface; in the above example,
192.168.100.11
NetMask: the network mask; 255.255.255.255 specifies an exact match with IPAddr
PIUser: the PI user the Interface to be entrusted as; piadmin is usually an appropriate user
Security Configuring using Trust EditorThe Trust Editor plug-in for PI System Management Tools 3.x may also be used to edit the PI Trust table.
See the PI System Management chapter in the PI Server manual for more details on security configuration.
Performance Monitor Interface to the PI System 55
PI Server v3.2For PI Server v3.2, the following example demonstrates how to edit the PI Proxy table:C:\PI\adm> piconfig@table pi_gen,piproxy@mode create@istr host,proxyaccountpiapimachine,piadmin@quitIn place of piapimachine, put the name of the PI Interface node as it is seen by PI Server.
Performance Monitor Interface to the PI System 56
Starting / Stopping the InterfaceThis section describes starting and stopping the interface once it has been installed as a service. See the UniInt Interface User Manual to run the interface interactively.
Starting Interface as a ServiceIf the interface was installed a service, it can be started from the services control panel or with the command:PIPerfMon.exe –start
To start the interface service with PI ICU, use the button on the PI ICU toolbar.
A message will inform the user of the status of the interface service. Even if the message indicates that the service has started successfully, double check through the Services control panel applet. Services may terminate immediately after startup for a variety of reasons, and one typical reason is that the service is not able to find the command-line parameters in the associated .bat file. Verify that the root name of the .bat file and the .exe file are the same, and that the .bat file and the .exe file are in the same directory. Further troubleshooting of services might require consulting the pipc.log file, Windows Event Viewer, or other sources of log messages. See the section “Appendix A: Error and Informational Messages,” for additional information.
Stopping Interface Running as a ServiceIf the interface was installed a service, it can be stopped at any time from the services control panel or with the command:PIPerfMon.exe –stopThe service can be removed by:PIPerfMon.exe –remove
To stop the interface service with PI ICU, use the button on the PI ICU toolbar.
Other Command-line ParametersOther command line parameters are listed as:
-query Query the PIPerfMon Service
-help Print usage statement
-v Display UniInt and PI API version information (does not disturb normal interface operation)
The –depend option is only valid with the –install action
Performance Monitor Interface to the PI System 57
Which Performance Counters to MonitorThe following tables, which have been republished with permission from Microsoft, provide a guideline on what Microsoft believes is important counters to monitor. For more information about these tables, please refer to the Microsoft® Windows® 2000 Resource Kit documentation under the Performance Monitoring section.
The following table describes the minimum counters to monitor when looking for a specific problem.
Object Problem Counters
DiskUsage
LogicalDisk\% Free Space LogicalDisk\% Disk TimePhysicalDisk\Disk Reads/secPhysicalDisk\Disk Writes/sec
Use diskperf –y to enable disk counters and diskperf –n to disable them. To specify the type of counters to activate, include d for physical disk drives and v for logical disk drives or storage volumes. When the operating system starts up, it automatically sets the diskperf command with the –yd switch to activate physical disk counters. Type diskperf –yv to activate logical disk counters. For more information about using the diskperf command, type diskperf -? At the command prompt.The % Disk Time counter must be interpreted carefully. Because the _Total instance of this counter might not accurately reflect utilization on multiple-disk systems, it is important to use the % Idle Time counter as well. Note that these counters cannot display a value exceeding 100 percent.
Bottlenecks LogicalDisk\Avg. Disk Queue Length PhysicalDisk\Avg. Disk Queue Length (all instances)
Memory Usage Memory\Available BytesMemory\Cache Bytes
Memory\Committed Bytes and Memory\Commit Limit can also be used to detect problems with virtual memory.
Performance Monitor Interface to the PI System 59
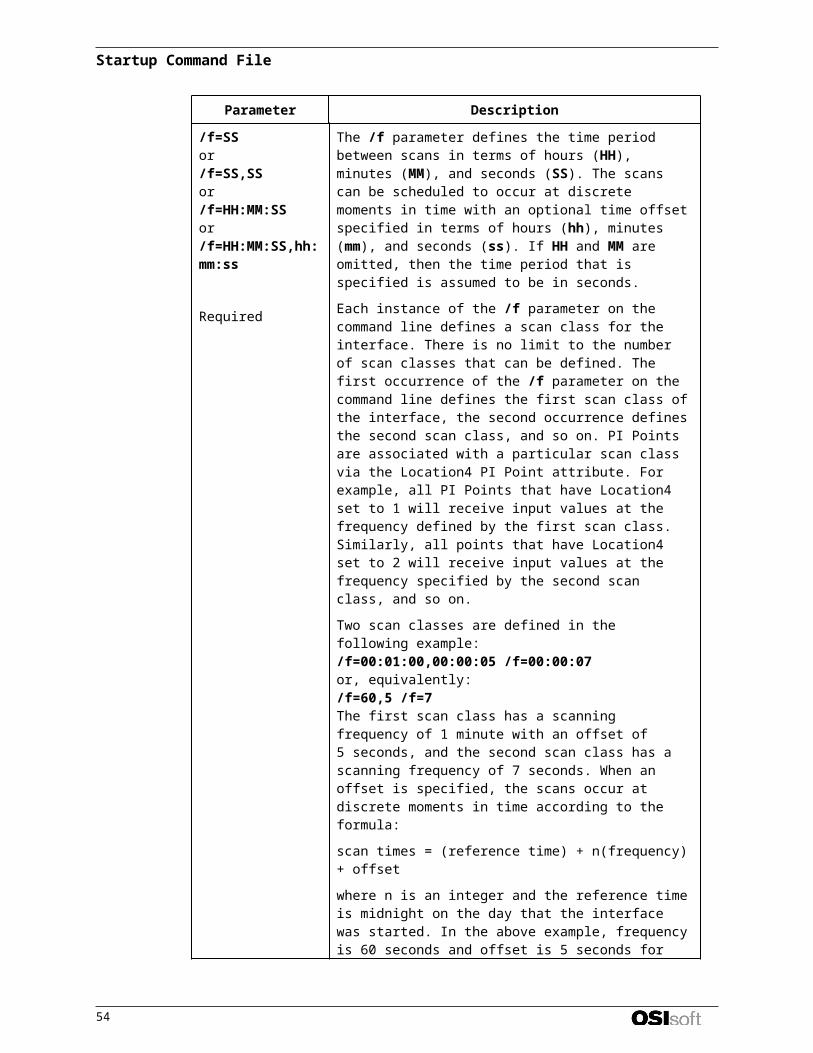
Object Problem Counters
Bottlenecks or leaks
Memory\Pages/sec Memory\Page Faults/secMemory\Pages Input/secMemory\Page Reads/secMemory\Transition Faults/secMemory\Pool Paged BytesMemory\Pool Nonpaged Bytes
Although not specifically Memory object counters, the following are also useful for memory analysis:Paging File\% Usage Object (all instances)Cache\Data Map Hits %Server\Pool Paged Bytes and Server\Pool Nonpaged Bytes
Network
UsageNetwork Segment: % Net Utilization(Network Packet Protocol driver for Network Monitor must be installed).
Throughput
(TCP/IP)
Network Interface\Bytes total/secNetwork Interface\Packets/secServer\Bytes Total/sec or Server\Bytes Sent/sec and Server\Bytes Received/sec
Processor
Usage Processor\% Processor Time (all instances)
BottlenecksSystem\Processor Queue Length (all instances)Processor\Interrupts/secSystem\Context switches/sec
The following table shows the recommended thresholds for the minimum set of system counters.
Resource Object\Counter Suggested Threshold Comments
Disk
LogicalDisk\% Free Space 15 percent None
LogicalDisk\% Disk Time 90 percent None
PhysicalDisk\ Disk Reads/sec, PhysicalDisk\ Disk Writes/sec
Depends on manufacturer’s specifications
Check the specified transfer rate for the disks to verify that this rate does not exceed the specifications. In general, Ultra Wide SCSI disks can handle 50 to 70 I/O operations per second.
PhysicalDisk\ Current Disk Queue Length
Number of spindles plus 2
This is an instantaneous counter; observe its value over several intervals. For an average over time, use PhysicalDisk\Avg. Disk Queue Length.
Memory Memory\ Available Bytes Less than 4 MB Research memory usage and add
memory if needed.
Performance Monitor Interface to the PI System 60
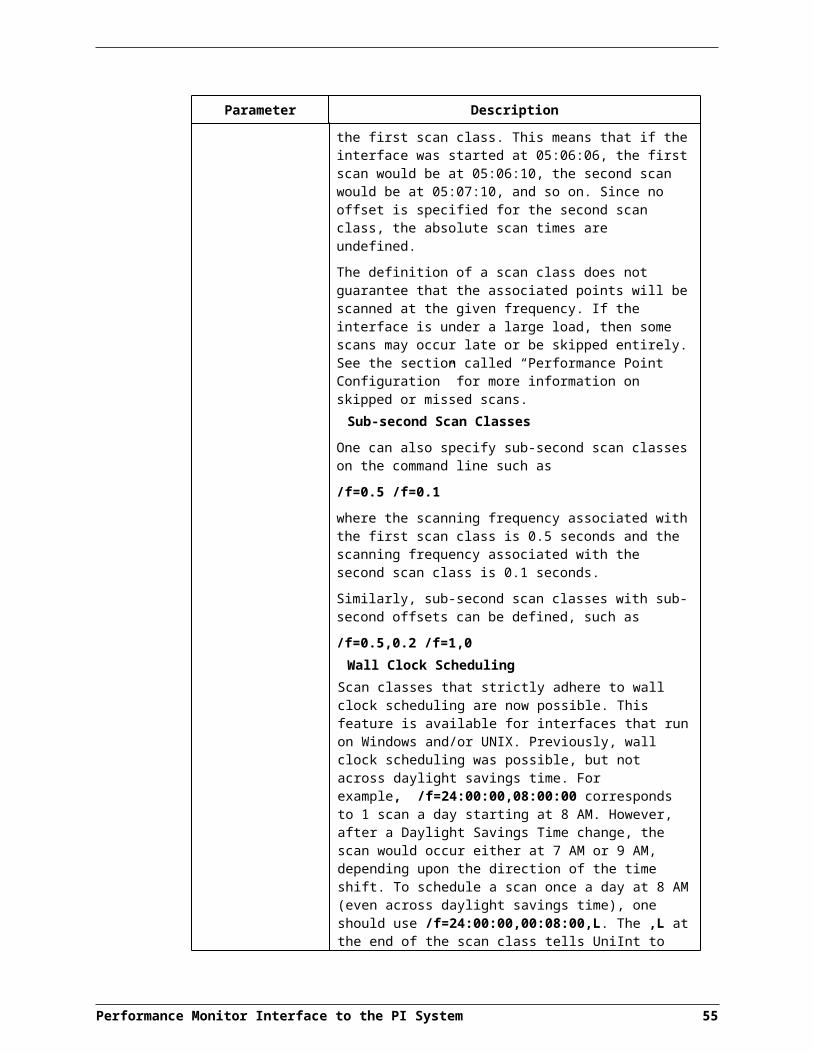
Resource Object\Counter Suggested Threshold Comments
Memory\ Pages/sec 20 Research paging activity.
NetworkNetwork Segment\% Net Utilization
Depends on type of network
Must determine the threshold based on the type of network available. For Ethernet networks, for example, 30 percent is the recommended threshold.
Paging File
Paging File\% Usage
Above 70 percent
Review this value in conjunction with Available Bytes and Pages/sec to understand paging activity on the computer.
Processor
Processor\% Processor Time 85 percent
Find the process that is using a high percentage of processor time. Upgrade to a faster processor or install an additional processor.
Processor\ Interrupts/sec
Depends on processor; for current CPUs, use a threshold of 1500 interrupts per second
A dramatic increase in this counter value without a corresponding increase in system activity indicates a hardware problem. Identify the network adapter or disk controller card causing the interrupts. May need to install an additional adapter or controller card.
Server
Server\Bytes Total/sec
If the sum of Bytes Total/sec for all servers is roughly equal to the maximum transfer rates of the network, may need to segment the network.
Server\Work Item Shortages 3
If the value reaches this threshold, consider tuning the InitWorkItems or MaxWorkItems entries in the registry (in HKEY_LOCAL_MACHINE \SYSTEM \CurrentControlSet \Services \lanmanserver \Parameters
Server Work Queues\Queue Length
4
If the value reaches this threshold, there might be a processor bottleneck. This is an instantaneous counter; observe its value over several intervals.
Multiple Processors
System\Processor Queue Length
2This is an instantaneous counter; observe its value over several intervals.
Performance Monitor Interface to the PI System 61
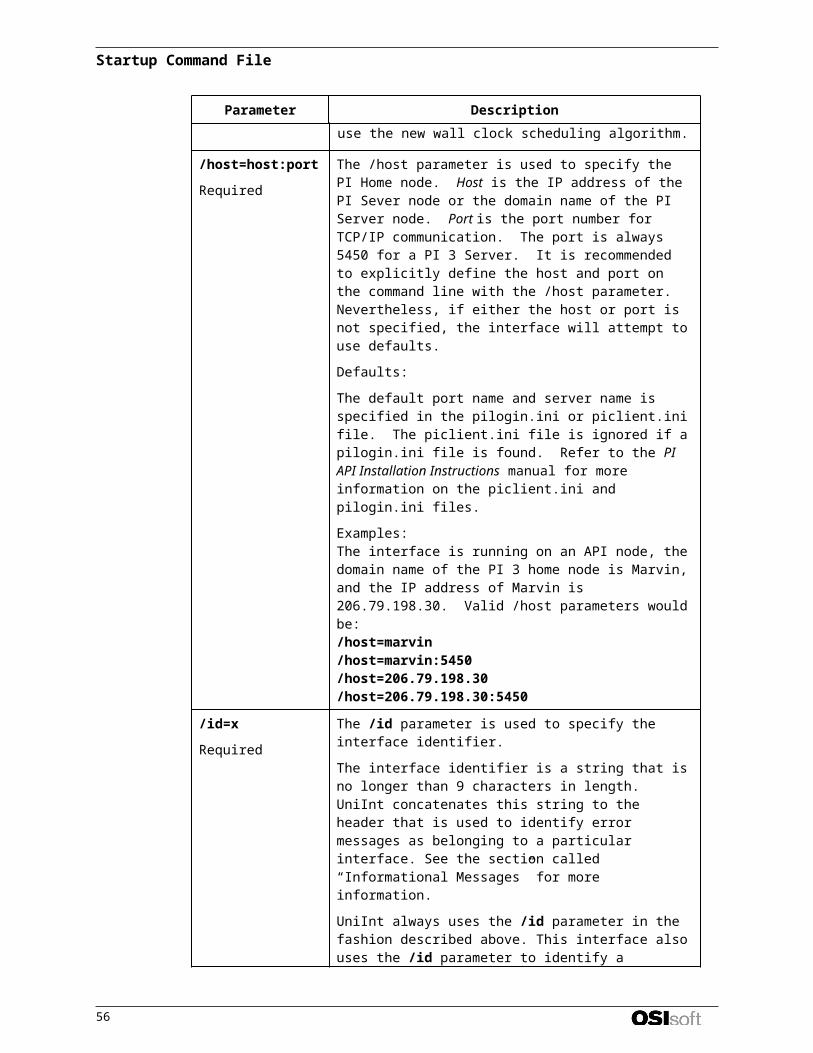
Which Performance Counters to Monitor
The following table gives a description of the Task Manager items in the Process tab. If there is a corresponding performance counter, it is also listed.
Task Manager Process Tab Description System Monitor Process
Object Counters
Base Priority
The base priority of the process, which determines the order in which its threads are scheduled for the processor. The base priority is set by the process code, not the operating system. The operating system sets and changes the dynamic priorities of threads in the process within the range of the base.
Priority Base
CPU Time The total processor time, in seconds, used by the process since it was started. None
CPU UsageThe percentage of time the threads of the process used the processor since the last update.
% Processor Time
GDI Objects
The number of Graphics Device Interface (GDI) objects currently used by a process. A GDI object is an object from the GDI library of application programming interfaces (APIs) for graphics output devices.
None
Handle Count The number of object handles in the process’s object table. Handle Count
I/O Other
The number of input/output operations generated by a process that are neither reads nor writes, including file, network, and device I/Os. An example of this type of operation would be a control function. I/O Others directed to CONSOLE (console input object) handles are not counted.
I/O Other Operations/sec
I/O Other Bytes
The number of bytes transferred in input/output operations generated by a process that are neither reads nor writes, including file, network, and device I/Os. An example of this type of operation would be a control function. I/O Other Bytes directed to CONSOLE (console input object) handles are not counted.
I/O Other Bytes/sec
I/O Read Bytes
The number of bytes read in input/output operations generated by a process, including file, network, and device I/Os. I/O Read Bytes directed to CONSOLE (console input object) handles are not counted.
I/O Read Bytes/sec
I/O Reads
The number of read input/output operations generated by a process, including file, network, and device I/Os. I/O Reads directed to CONSOLE (console input object) handles are not counted.
I/O Read Operations/sec
62
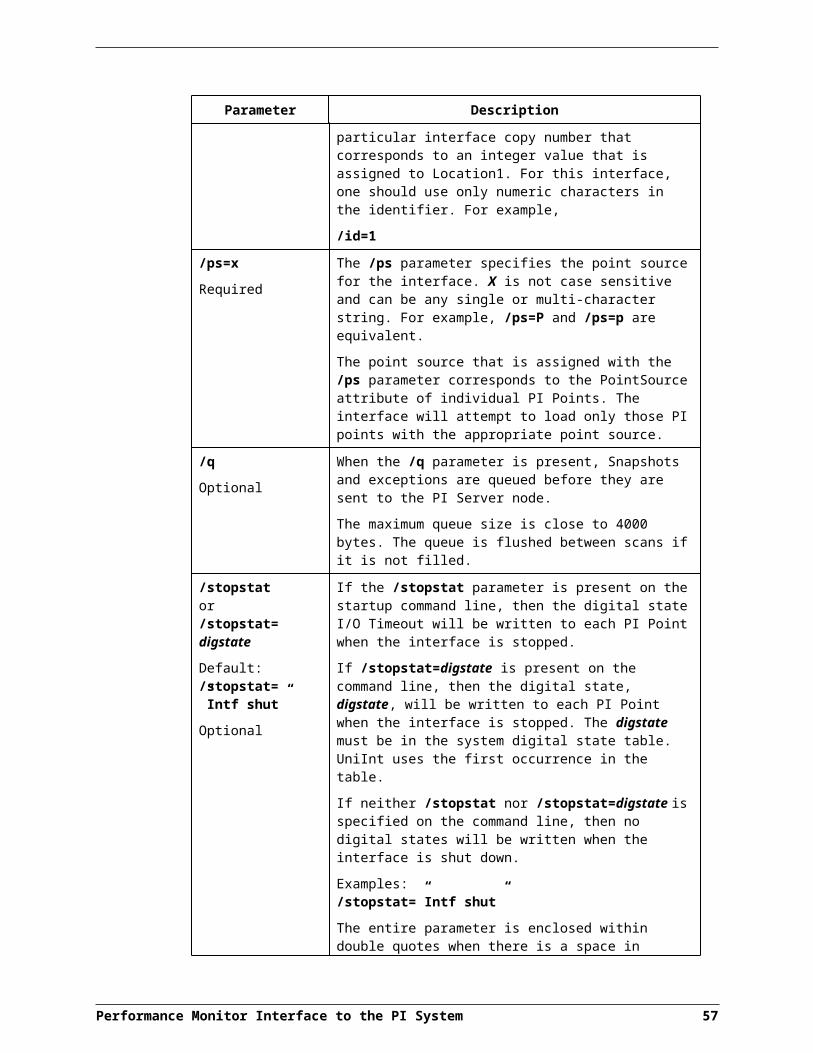
Task Manager Process Tab Description System Monitor Process
Object Counters
I/O Write Bytes
The number of bytes written in input/output operations generated by a process, including file, network, and device I/Os. I/O Write Bytes directed to CONSOLE (console input object) handles are not counted.
I/O Write Bytes/sec
I/O Writes
The number of write input/output operations generated by a process, including file, network, and device I/Os. I/O Writes directed to CONSOLE (console input object) handles are not counted.
I/O Write Operations/sec
Image Name Name of the process. The process name in the Instances box
Memory Usage The amount of main memory, in kilobytes, used by the process. Working Set
Memory Usage Delta
The change in memory use, in kilobytes, since the last update. Unlike System Monitor, Task Manager displays negative values.
None
Non-paged Pool
The amount of memory, in kilobytes, used by a process. Operating system memory that is never paged to disk. Paging is the moving of infrequently used parts of a program’s working memory from RAM to another storage medium, usually the hard disk.
Pool Non-paged Bytes
Page Faults
The number of times that data had to be retrieved from disk for this process because it was not found in memory. This value is accumulated from the time the process is started.
NonePage faults/sec is the rate of page faults over time.
Page Faults Delta
The change in the number of page faults since the last update. None
Paged Pool
The amount of system-allocated virtual memory, in kilobytes, used by a process. The paged pool is virtual memory available to be paged to disk. Paging is the moving of infrequently used parts of a program’s working memory from RAM to another storage medium, usually the hard disk. The paged pool includes all of user memory and a portion of system memory.
Pool Paged Bytes
Peak Memory Usage
The peak amount of physical memory resident in a process since it started. None
PID (Process Identifier)
Numerical ID assigned to the process while it runs. ID Process
Thread Count The number of threads running in the process. Thread Count
Performance Monitor Interface to the PI System 63
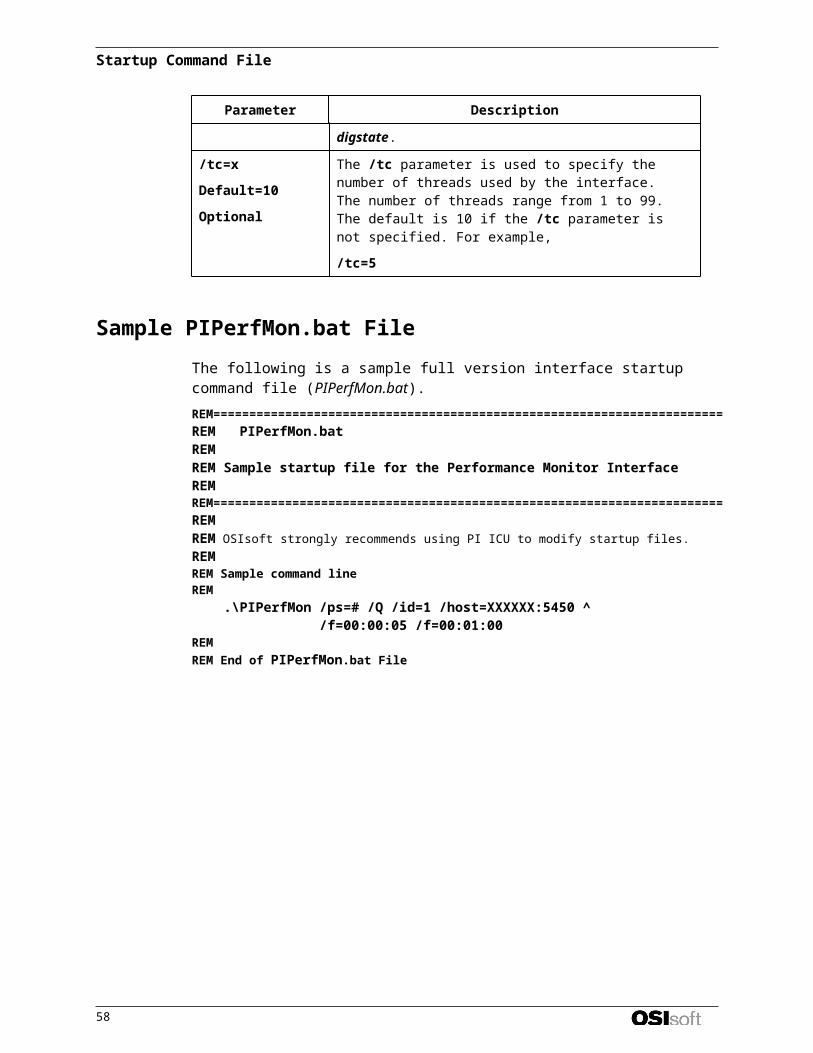
Which Performance Counters to Monitor
Task Manager Process Tab Description System Monitor Process
Object Counters
USER Objects
The number of USER objects currently being used by a process. A USER object is an object from Window Manager, which includes windows, menus, cursors, icons, hooks, accelerators, monitors, keyboard layouts, and other internal objects.
None
Virtual Memory Size
The amount of virtual memory, or address space, committed to a process. Private Bytes
The following table gives a description of the Task Manager items in the Performance tab. If there is a corresponding performance counters it is also listed
Task Manager Performance
TabDescription System Monitor Counters
CPU Usage The percentage of time the processor is running a thread other than the Idle thread.
Processor\% Processor Time
MEM Usage The amount of virtual memory used, in kilobytes. Memory\Committed Bytes
Total Handles The number of object handles in the tables of all processes.
Process(_Total)\Handle Count
Total Threads The number of running threads, including one Idle thread per processor.
Process(_Total)\Thread Count
Total Processes The number of active processes, including the Idle process.
Object\Processes is the same, but excludes the Idle process.
Physical Memory: Total
Amount of physical, random access memory, in kilobytes, installed in the computer.
None
Physical Memory: Available
Amount of physical memory available to processes, in kilobytes. It includes zeroed, free, and standby memory.
Memory\Available Bytes
Physical Memory: File Cache
Amount of physical memory, in kilobytes, released to the file cache on demand. Memory\Cache Bytes
Commit Charge: Total
Size of virtual memory in use by all processes, in kilobytes. Memory\Committed Bytes
Commit Charge: Limit
Amount of virtual memory, in kilobytes, that can be committed to all processes without enlarging the paging file.
Memory\Commit Limit
Commit Charge: Peak
The maximum amount of virtual memory, in kilobytes, used in the session. The commit peak can exceed the commit limit if virtual memory is expanded.
None
64
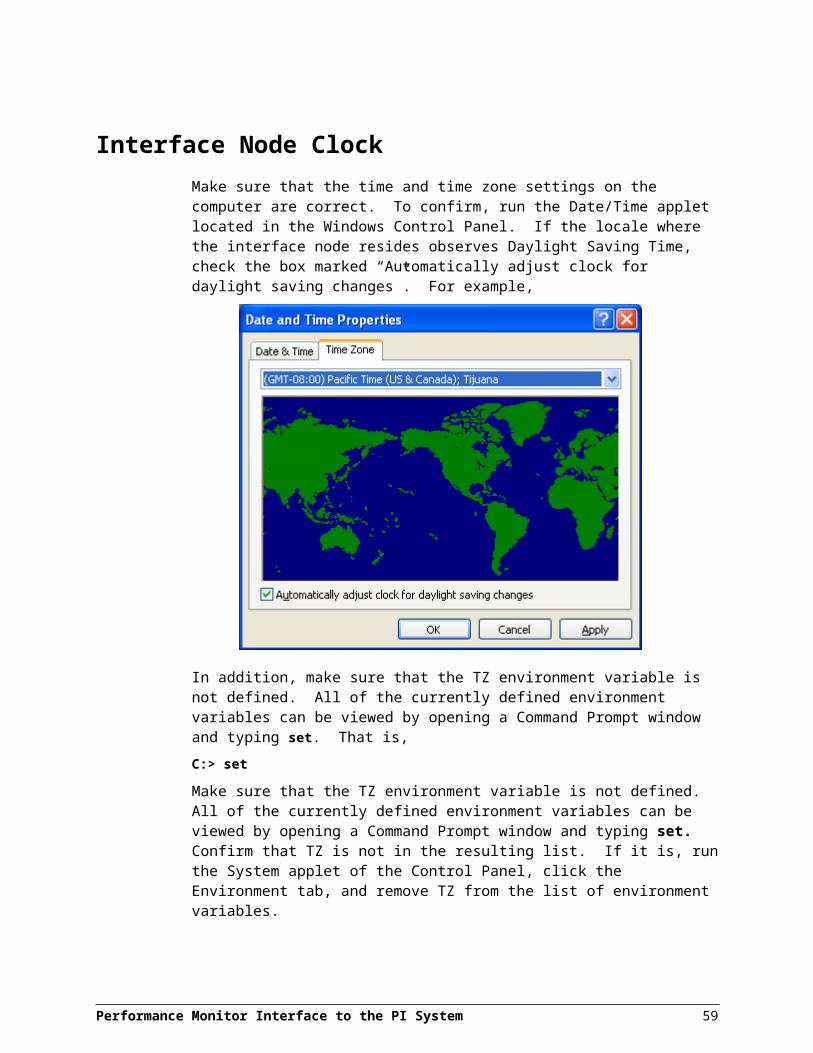
Task Manager Performance
TabDescription System Monitor Counters
Kernel Memory: Total
Sum of paged and non-paged memory, in kilobytes.
None(Sum of Pool Paged Bytes and Pool Non-paged Bytes)
Kernel Memory: Paged
Size of the paged pool, in kilobytes, allocated to the operating system. Memory\Pool Paged Bytes
Kernel Memory: Non-paged
Size of the non-paged pool, in kilobytes, allocated to the operating system.
Memory\Pool Non-paged Bytes
Performance Monitor Interface to the PI System 65
BufferingFor complete information on buffering, please refer to the PI API Installation InstructionPerformance Monitor Interface to the PI System.
PI Interface Node buffering consists of a buffering process which runs continuously on the local node, a PI API library whose calls can send data to this buffering process, and a utility program for examining the state of buffering and controlling the buffering process.
Note: Change the Local Security Policy on Windows XP. 1. Open “Administrative Tools” from the control panel. 2. Open “Local Security Policy” from administrative tools. 3. Browse to “Security Options” under “Local Policies.” 4. Double click on “System Objects: Default owner for objects created by members of the Administrators group.” 5. Change the dropdown from “Object Creator” to “Administrators group.”
The behavior of Bufserv should now be the same on Windows XP as it was for Windows NT 4 and 2000.
Configuring Buffering with PI ICU (Windows)Buffering is enabled through the PI Interface Configuration Utility’s Tools>API Buffering… menu. Unless buffering is explicitly enabled, the PI API will not buffer data, sending data directly to the home node.
The API Buffering… dialog allows the user to view and configure the parameters associated with the PI API Buffering (bufserv) process. The user can start and stop the PI API Buffering process from the Service tab:
Performance Monitor Interface to the PI System 67
Service TabThe Service tab allows for some PI API Buffering service configuration. For further configuration changes, use the Services applet.
Service nameThe Service name displays the name of the PI API Buffering Service.
Display nameThe Display name displays the full name associated with the PI API Buffering service.
Log on asLog on as indicates the Windows user account under which the PI API Buffering service is setup to start automatically on reboot, or manually.
PasswordPassword is the name of the password for the Windows user account entered in the Log on as: above.
Confirm passwordReenter the password to verify it has been typed correctly both times.
DependenciesThe Dependencies lists the Windows services on which the PI API Buffering service is dependent.
Dependent servicesThe Dependent services area lists the Windows services that depend on bufserv to function correctly.
Start / Stop ServiceThe Start / Stop buttons allow for the PI API Buffering service to be started and stopped. If the service is not created, this box will show Not Installed.
After a change is made to any of the settings on the Settings tab, the OK button must be clicked to save these settings, and then the service must be stopped and restarted for the changes to be picked up by bufserv.
Service Startup TypeThe Startup Type indicates whether the PI API Buffering service is setup to start automatically on reboot or manually on reboot, or is disabled.
If the Auto option is selected, the service will be installed to start automatically when the machine reboots.
If the Manual option is selected, the interface service will not start on reboot, but will require someone to manually start the service.
If the Disabled option is selected, the service will not start at all.
Generally, the PI API Buffering service is set to start automatically.
Performance Monitor Interface to the PI System 68
Create/Remove ServiceThe Create / Remove buttons allow for the creation or removal of the PI API Buffering service. Clicking the Create button will cause the service to be created using the Log on as and passwords given. Once the service is created the Start / Stop buttons will be activated.
Settings TabThe Settings tab allows for configuration of the 7 configurable settings used by PI API Buffering. Default values are used if no other value is provided.
Enable BufferingEnable the PI API Buffering feature.
Maximum File SizeMaximum buffer file size in kilobytes before buffering fails and discards events. Default value is 100,000. Range is 1 to 2,000,000.
The Use Default button places the default value into the text box. To keep this value, click the Apply button.
Send RateSend rate is the time to wait between sending up to MAXTRANSFEROBJS to the server (milliseconds). Default value is 100. Range is 0 to 2,000,000.
The Use Default button places the default value into the text box. To keep this value, click the Apply button.
Performance Monitor Interface to the PI System 69
Buffering
Primary Memory Buffer SizePrimary memory buffer size is the size in bytes of the Primary memory buffer. Default value is 32768. Range is 64 to 2,000,000.
The Use Default button places the default value into the text box. To keep this value, click the Apply button.
Secondary Memory Buffer SizeSecondary memory buffer size is the size in bytes of the Secondary memory buffer. Default value is 32768. Range is 64 to 2,000,000.
The Use Default button places the default value into the text box. To keep this value, click the Apply button.
Max Transfer ObjectsMax transfer objects is the maximum number of events to send between each SENDRATE pause. Default value is 500. Range is 1 to 2,000,000.
The Use Default button places the default value into the text box. To keep this value, click the Apply button.
Pause RateWhen buffers are empty the buffering process will wait for this number of seconds before attempting to send more data to the home node. Default value is 2. Range is 0 to 2,000,000.
The Use Default button places the default value into the text box. To keep this value, click the Apply button.
Retry RateWhen the buffering process discovers the home node is unavailable it will wait this number of seconds before attempting to reconnect. Default value is 120. Range is 0 to 2,000,000.
The Use Default button places the default value into the text box. To keep this value, click the Apply button.
Max Theoretical Send RateThis is the theoretical max send rate which is calculated like this:max = MAXTRANSFEROBJS / SENDRATE * 1000Default value is 5000. This value is automatically calculated for the user and can not be changed.
There are no additional steps needed to install buffering after installing the PI API. The delivered PI API library supports both buffered and un-buffered calls.
Configuring Buffering ManuallyBuffering is enabled through the use of a configuration file, piclient.ini. Unless this file is modified to explicitly enable buffering, the PI API will not buffer data, sending data directly to the home node.
70
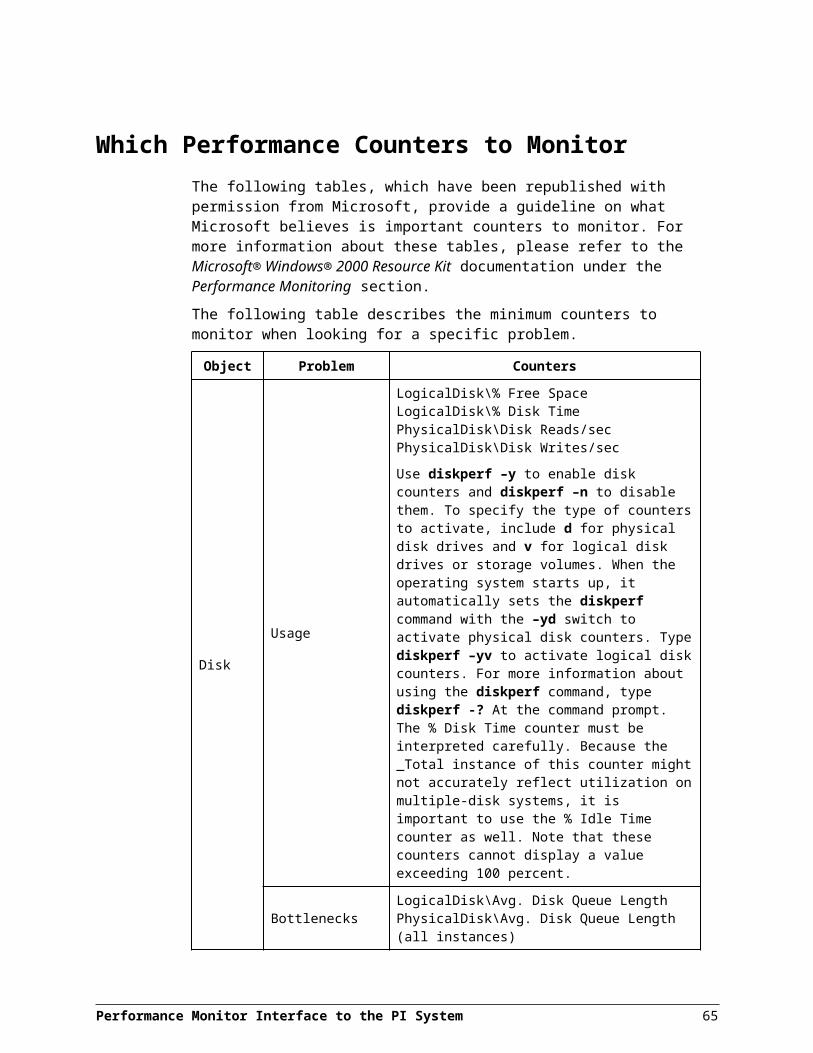
There are no additional steps needed to install buffering after installing the PI API. The delivered PI API library supports both buffered and un-buffered calls.
Note: When buffering is configured to be on, the bufserv process must be started before other programs using the PI API, so that these programs can access the shared buffering resources. Any program that makes a connection to a PI Server has this requirement even if it does not write to PI.
Configuration of buffering is achieved through entries in the piclient.ini file. The file is found in the .dat subdirectory of the PIHOME directory (typically c:\pipc\dat) under Windows. This file follows the conventions of Microsoft Windows initialization files with sections, keywords within sections, and values for keywords. All buffering settings are entered in a section called [APIBUFFER]. To modify settings, simply edit the piclient.ini file in a text editor (Notepad on Windows) to the desired values.
The following settings are available for buffering configuration:
Keywords Values Default Description
BUFFERING 0, 1 0 Turn off/on buffering. OFF = 0, ON = 1,
PAUSERATE 0 – 2,000,000 2 When buffers are empty the buffering process will wait for this long before attempting to send more data to the home node (seconds)
RETRYRATE 0 – 2,000,000 120 When the buffering process discovers the home node is unavailable it will wait this long before attempting to reconnect (seconds)
MAXFILESIZE 1 – 2,000,000 100,000 Maximum buffer file size before buffering fails and discards events. (Kbytes)
MAXTRANSFEROBJS 1 – 2,000,000 500 Maximum number of events to send between each SENDRATE pause.
BUF1SIZE 64 – 2,000,000 32768 Primary memory buffer size. (bytes)
BUF2SIZE 64 – 2,000,000 32768 Secondary memory buffer size. (bytes)
SENDRATE 0 – 2,000,000 100 The time to wait between sending up to MAXTRANSFEROBJS to the server (milliseconds)
Performance Monitor Interface to the PI System 71
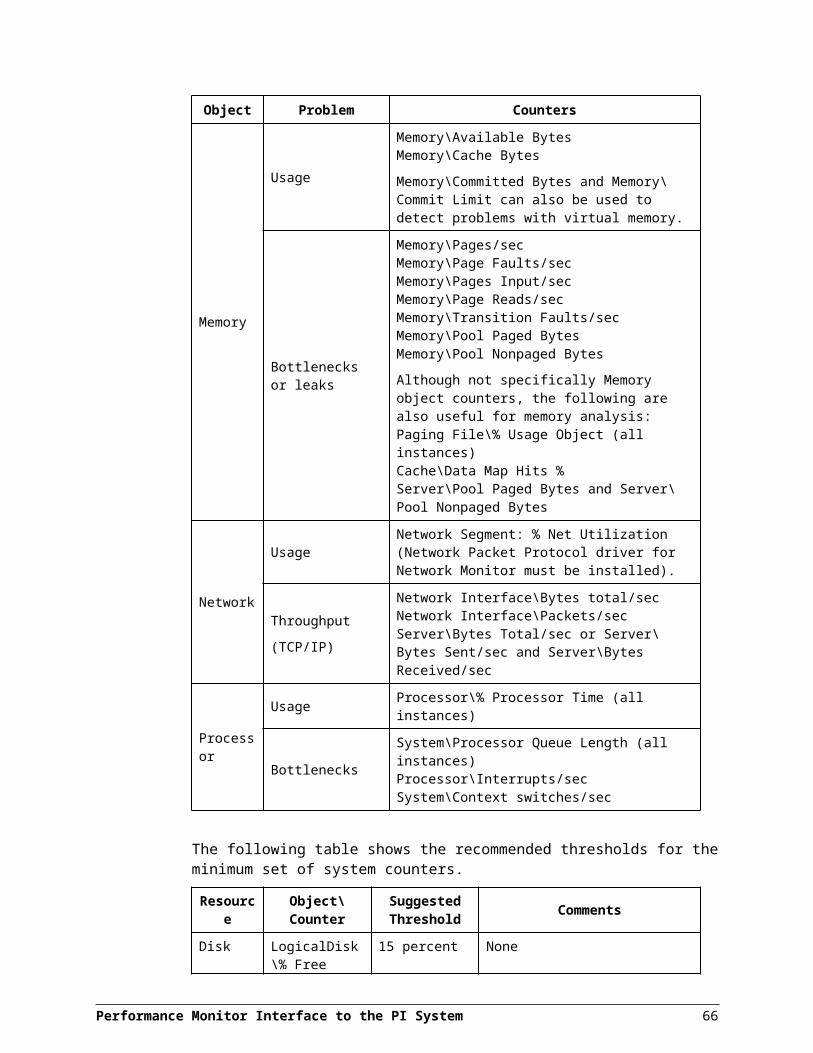
Buffering
In addition to the [APIBUFFER] section, the [PISERVER] section may be used to define the default PI server and an optional time offset change that may occur between the client and server.
Keywords Values Default Description
PIHOMENODE string none Windows default server is in pilogin.ini
DSTMISMATCH 0 – 2,000,000 0 The time that the server and client local time offset is allowed to jump. Typically, 3600 if the nodes are in time zones whose DST rules differ (seconds)
Example piclient.ini File
Windows On Windows, the default server information is stored in the pilogin.ini file so the piclient.ini would only have the [APIBUFFER] section. The BUFFERING=1 indicates that buffering is on. The MAXFILESIZE entry in Kbytes of 100000 allows up to 100 Megabytes of data storage. Do not use commas or other separators in the numeric entries. The retry rate is set to 600 seconds, meaning “Wait 10 minutes after losing a connection before retrying”.
On Windows a piclient.ini file might look like:[APIBUFFER]BUFFERING=1MAXFILESIZE=100000; The PI API connection routines have a 1 minute default timeout.RETRYRATE=600
72
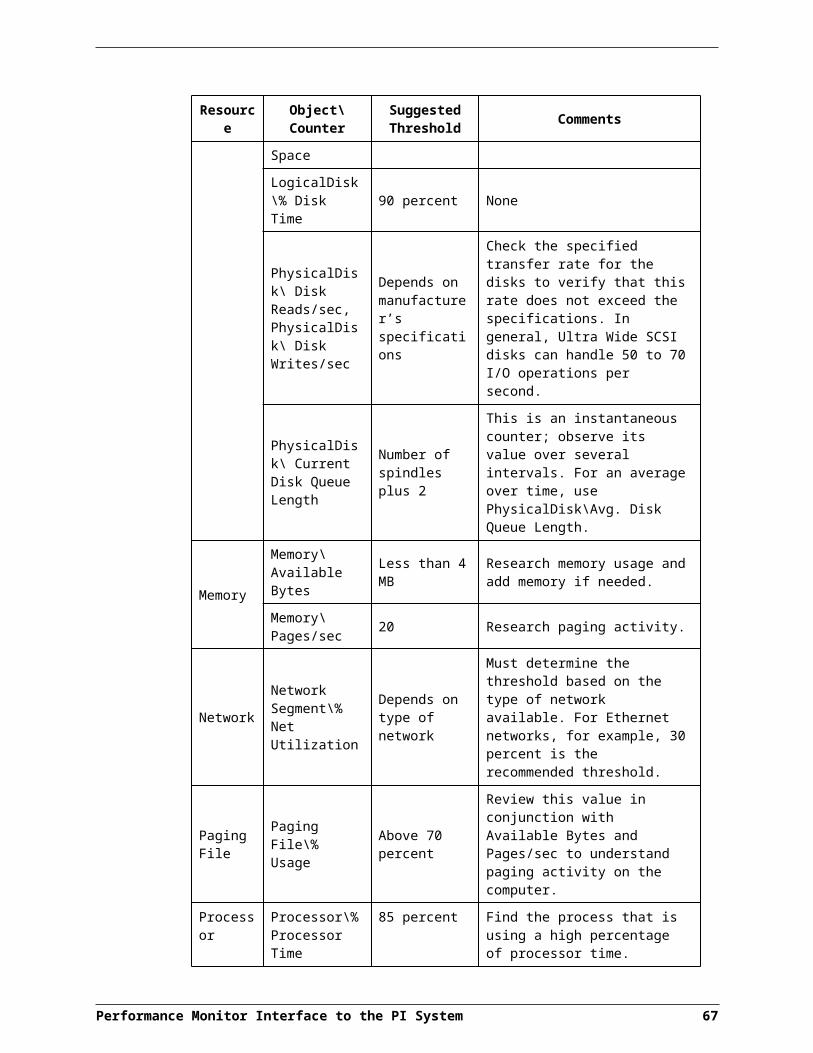
Appendix A:Troubleshooting
One of the best ways to diagnose if there is a problem with the interface is to check the behavior of the Microsoft utility NT Performance Monitor (Sysmon for Windows 2000). The interface will be able to collect the same counters as the NT Performance Monitor or the Windows 2000 Sysmon utility.
Common ProblemsThe following is a list of common problems and misunderstandings about the PIPerfMon Interface.
Symptom Resolution
The remote computer being monitored is offline.
The interface will continue trying to monitor the instance and will find it when the computer is restarted.
I am unable to obtain remote counters.
The interface is installed to run with the system account privileges as a service and the user account for interactive. Go to The PIPerfMon Service section for a description of the solution for services. Log on to the computer with a user account with sufficient privileges to run the interface interactively.
The application or thread being monitored has stopped.
The interface continues trying to monitor the instance and will find it when the process or thread is restarted.
All values for my disks are zero.
The counters for the Physical and Logical Disk objects don’t work until the Disk Performance Statistics Driver in the I/O Manager disk stack is installed. Use the Diskperf utility to install the Disk Performance Statistics Driver, and then restart the computer.
I have several disks, but values are only shown for the first disk in the set.
When Diskperf was used, the standard option was specified, diskperf –y, which places the statistics collector above the fault tolerant driver, FTDISK. The statistics collector cannot see the different physical instances of the disk. Run Diskperf using the diskperf –ye option, then restart the computer. This places the statistics collector below the fault tolerant driver so it can see physical disks before they are combined into a volume set.
Performance Monitor Interface to the PI System 73
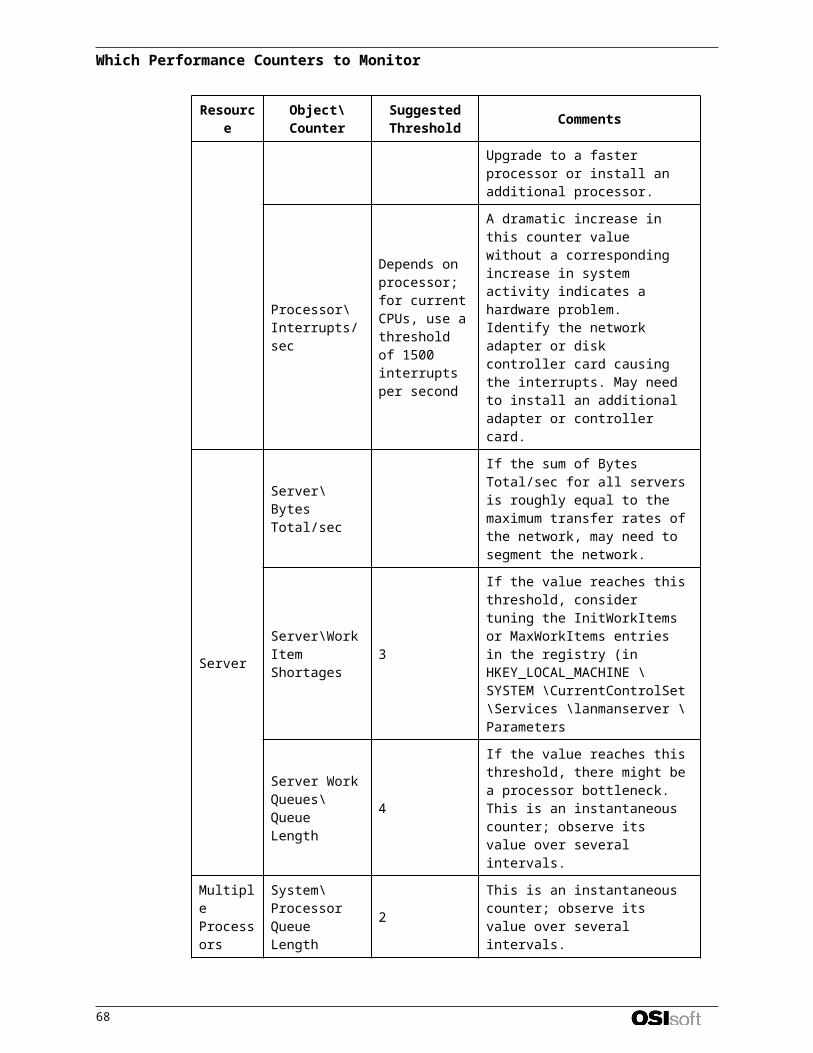
Symptom Resolution
%Disk Read Time and %Disk Write Time don’t sum to %Disk Time
All disk counters include time in the queue. When the queue gets long, the read and write time both include that time and don’t sum to 100.
%Disk Read Time:_Total and %Disk Write Time_Total sum to more than 100% because there is more than one instance of the physical or logical disk.
The percentage counters are limited, by definition to 100% and cannot display higher values. Use the Avg. Disk Read Queue Length, Avg. Disk Write Queue Length, and Avg. Disk Queue Length counters instead. These report on the same data as the %Disk Time counters, but display the values in decimals that can exceed 1.0.
Why is there a _Total instance on the ID counters? What would a total ID Thread counter show?
Items in the Instances box are the same for all counters of an object.
When an instance has no meaning, as in the case of _Total for IDs, a zero value is displayed for the counter.
Process: Pool Non-paged Bytes:_Total doesn’t equal Memory: Pool Non-paged Bytes
The Memory: Pool Non-paged Bytes value comes from an internal counter that counts each byte. The Process: Pool Non-paged Bytes counters are estimates from the Object Manager. The Object Manager counts accesses, not space, so its counts include requests to duplicate object handles as well as space for the object.
Ignore the static value of the counters and, instead, monitor any changes in the values
Where is the Processor Queue Length Counter?
It’s a System object counter. There is just one processor queue for all processors.
Counter values for instances of an object are greater than those for the total
The %Disk Time and %Processor Time counters are limited, by definition, to 100%. If there are multiple disks or processors, each could equal 100%, but the total counter cannot display the sum.
Monitor the physical instances separately. For disks, use the Avg. Disk Queue Length counters instead of the %Disk Time counters. These display the totals as decimal, not percentages, so they can exceed 1.0.
For processors, use the System: %Total Processor Time counter. This averages the active time of each processor over all processors.
Error CodesThe following are some common error codes from the interface and what they mean.
Informational Messages These messages are normal and do not require action.
Error Code Description Interpretation
0x00000000L The returned data is valid PDH_CSTATUS_VALID_DATA
Performance Monitor Interface to the PI System 74
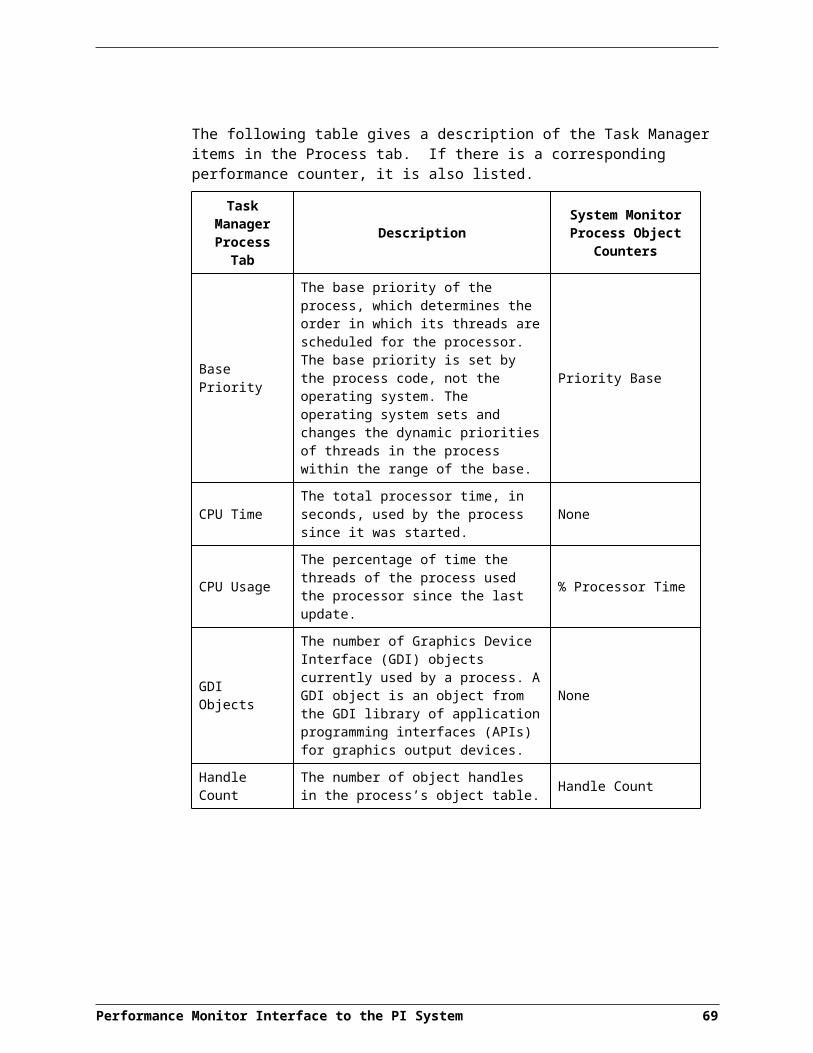
0x00000001L The return data value is valid and different from the last sample
PDH_CSTATUS_NEW_DATA
Warning MessagesThese messages are returned when the function has completed successfully but the results may be different than expected.
Error Code Description Interpretation
0x800007D0L Unable to connect to specified machine or machine is off line.
PDH_CSTATUS_NO_MACHINE
0x800007D1L The specified instance is not present
PDH_CSTATUS_NO_INSTANCE
0x800007D5L No data to return PDH_NO_DATA
0x800007D6L A counter with a negative denominator value was detected
PDH_CALC_NEGATIVE_DENOMINATOR
0x800007D7L A counter with a negative timebase value was detected
PDH_CALC_NEGATIVE_TIMEBASE
0x800007D8L A counter with a negative value was detected
PDH_CALC_NEGATIVE_VALUE
0x800007D9L The user cancelled the dialog box
PDH_DIALOG_CANCELLED
Error Messages These messages are returned when the function could not be complete as requested and some corrective action may be required by the caller or the user.
Error Code Description Interpretation
0xC0000BB8L The specified object is not found on the system
PDH_CSTATUS_NO_OBJECT
0xC0000BB9L The specified counter could not be found
PDH_CSTATUS_NO_COUNTER
0xC0000BBAL The returned data is not valid
PDH_CSTATUS_INVALID_DATA
0xC0000BBBL A PDH function could not allocate enough temporary memory to complete the operation. Close some applications or extend the pagefile and retry the function
PDH_MEMORY_ALLOCATION_FAILURE
0xC0000BBCL The handle is not a valid PDH object
PDH_INVALID_HANDLE
Performance Monitor Interface to the PI System 75
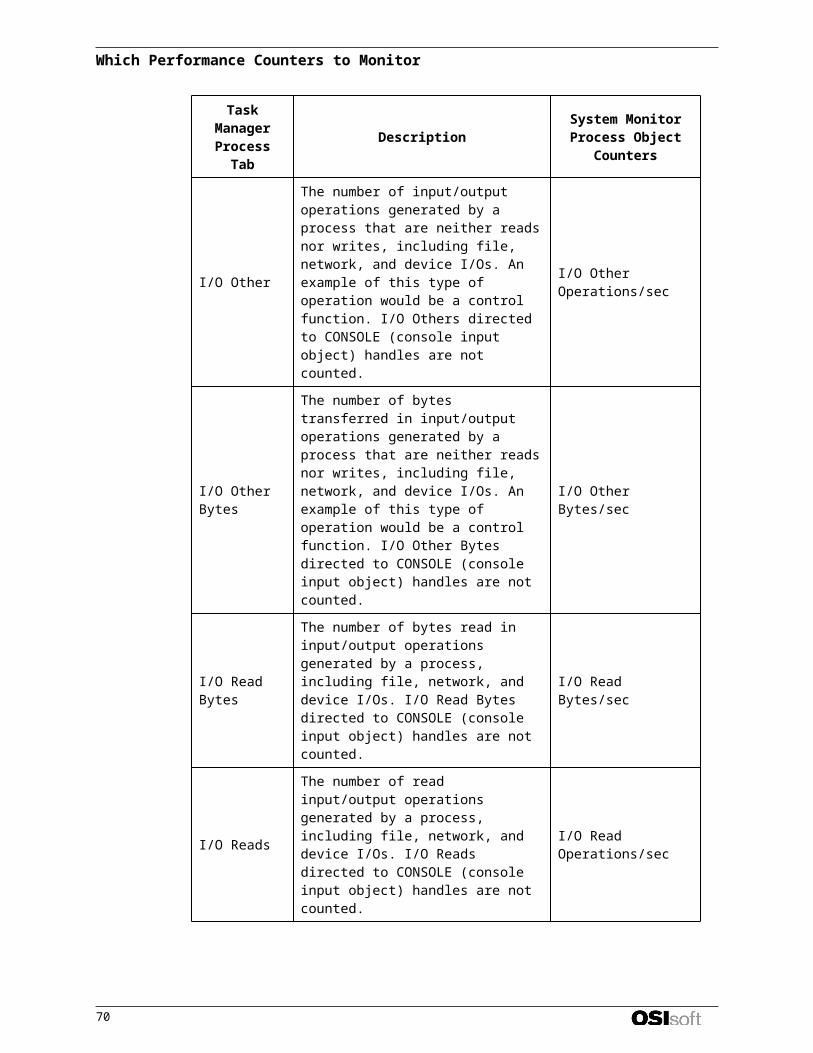
Appendix A: Troubleshooting
Error Code Description Interpretation
0xC0000BBFL No counter was specified PDH_CSTATUS_NO_COUNTERNAME
0xC0000BC0L Unable to parse the counter path. Check the format and syntax of the specified path
PDH_CSTATUS_BAD_COUNTERNAME
0xC0000BC3L Unable to connect to the requested machine
PDH_CANNOT_CONNECT_MACHINE
0xC0000BC4L The specified counter path could not be interpreted
PDH_INVALID_PATH
0xC0000BC5L The instance name could not be read from the specified counter path
PDH_INVALID_INSTANCE
0xC0000BC6L The data is not valid PDH_INVALID_DATA
0xC0000BC7L The dialog box data block was missing or invalid
PDH_NO_DIALOG_DATA
0xC0000BC8L Unable to read the counter and/or explain text from the specified machine
PDH_CANNOT_READ_NAME_STRINGS
0xC0000BCCL No more data is available PDH_NO_MORE_DATA
0xC0000BD4L Unable to find the specified string in the list of performance name and explain text strings
PDH_STRING_NOT_FOUND
76
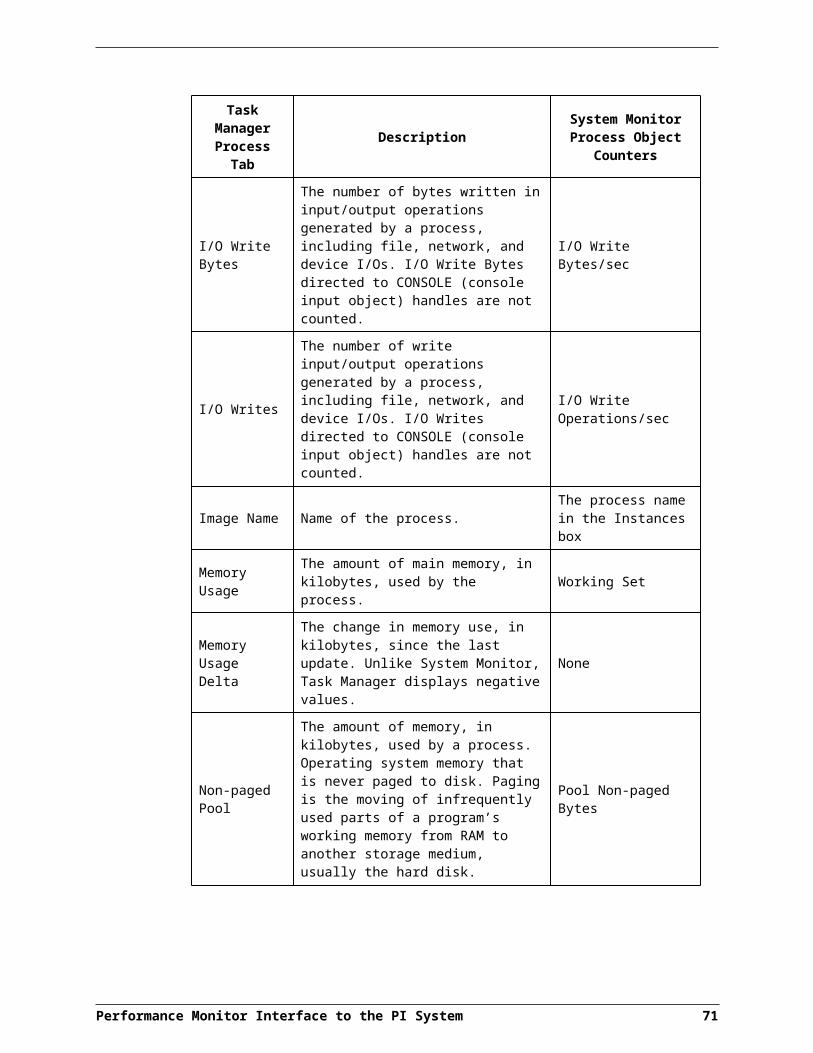
Revision HistoryDate Author Comments
10-Dec-99 JCW First Copy of Interface Manual Started
4-May-00 JCW First Released
15-Sep-00 JCW Added PWD file documentation
12-Dec-00 JCW Edited for 1.0.1 version
25-Jan-01 JCW Added Monitoring Basics section
8-Mar-01 JCW Added service startup user account documentation
25-Sep-01 JCW Modifications for version 1.0.3
11-Feb-02 RCP Added PIPERFMON ICU Control to Startup Command File section.
11-Feb-02 RCP Added PIPERFMON ICU Control to Startup Command File section.
27-Feb-02 HAB Corrected reference to /db – should be /dbUniInt.
19-Apr-02 HAB Added new ICU Control screen shot (1.0.2, doc rev A)
16-Oct-02 CG Used skeleton 1.11; fixed headers & footers
31-Dec-02 JCW This doc is for 1.0.3 and greater
16-Sep-03 CG Rev C: Added OSIsoft logo to footer; adjusted version; fixed copyright
25-Aug-04 JCW Version 1.1.0.x Rev C: Basic version now supports 512 counters
2-Sep-04 CG Version 1.1.0.x Rev D: Updated contact page; removed installation reference to dlls; changed references to “Appendix A: Error and Informational Messages” to “Appendix A: Troubleshooting;” added release notes to list of installed files
25-Jan-05 MKelly Updated section on ICU control. Added three items to the supported features table from the Interface Skeleton 1.15. Updated Table of Contents and fixed headers and footers.
07-Feb-05 JWong Updated for digital point types
16-Feb-05 Chrys Version 1.2.0.8 Rev B: Updated version on title page; fixed supported features table to note that there is a point builder
07-Feb07 Janelle Version 1.3.0.0 Rev C: Updated manual to skeleton 2.5.4; updated hardware diagram, added buffering section; removed PI2 references; added PI SMT add in section
13-Mar-07 Pchow Version 1.4.0.0 Rev A: Added SetDeviceStatus description in Supported Features and set DisconnectedStartup support to yes.
Updated description for /ec in “Command-line Parameters”.
Performance Monitor Interface to the PI System 77
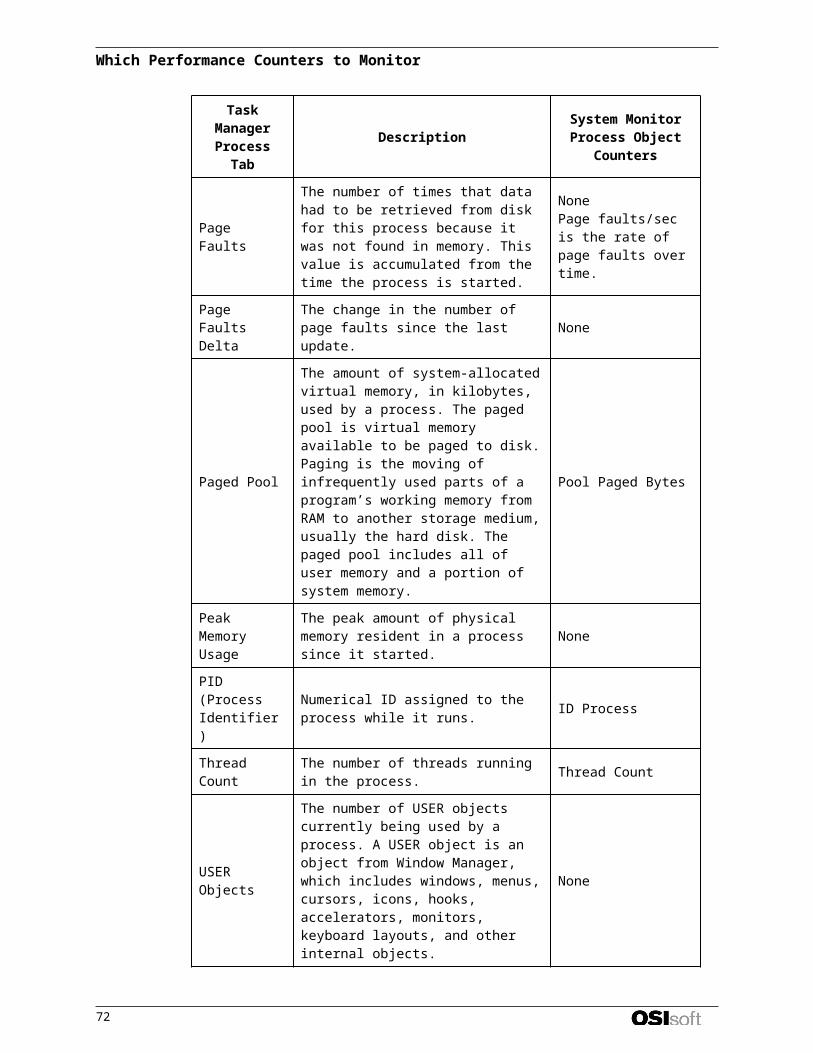
19-Apr-07 Pchow Version 1.4.0.0 Rev B: Update description for SetDeviceStatus in Supported Features.
Changed the min value for the /deb command-line parameter from 1 to 0 in the Command-line Parameters section to match the value specified when configuring with the ICU.
24-Apr-07 Pchow Version 1.4.0.0 Rev C: Update description for SetDeviceStatus in Supported Features.
Included note in the Performance Counter Path section to describe a scenario where a device may be identified as being offline due to a non-existent performance counter instance.
08-May-07 Pchow Version 1.4.0.0 Rev D: Removed localhost from the section Sample PIPerfMon.bat File.
5-Jun-07 MKelly Version 1.4.0.0, Rev E: Updated ICU Control and IO Rates screenshots. Fixed headers and footers.
Performance Monitor Interface to the PI System 78