Embed Size (px)
Citation preview
Computer Measurement Group, India 1Computer Measurement Group, India 1
www.cmgindia.org
Performance Modeling
Tutorial for Practitioners
Dr. Subhasri Duttagupta, TCS
Computer Measurement Group, India 2Computer Measurement Group, India
What you can get from this session
Performance Engineers
• Can learn how to do better performance analysis
Performance Analyst
• Can learn what has the maximum impact on
performance of the system and identify potential
bottlenecks
Capacity Planning Architect
• Can learn how to size the system for potential user
growth in the next few years
Computer Measurement Group, India 3
Outline
Load Testing as the starting point
Tools that use load testing results
Basics of Queuing Networks
Simple Modeling Tool
Model Building Exercise using
SPECjAppServer2002
When things are not looking right
Computer Measurement Group, India 4
Should know at the end of this session
Throughput, response time, think time
and the relationship among them
Common techniques of Modeling
Simulation, Analytical Modeling,
Statistical analysis
What contributes to system bottleneck
Steps involved in modeling
Computer Measurement Group, India 5Computer Measurement Group, India
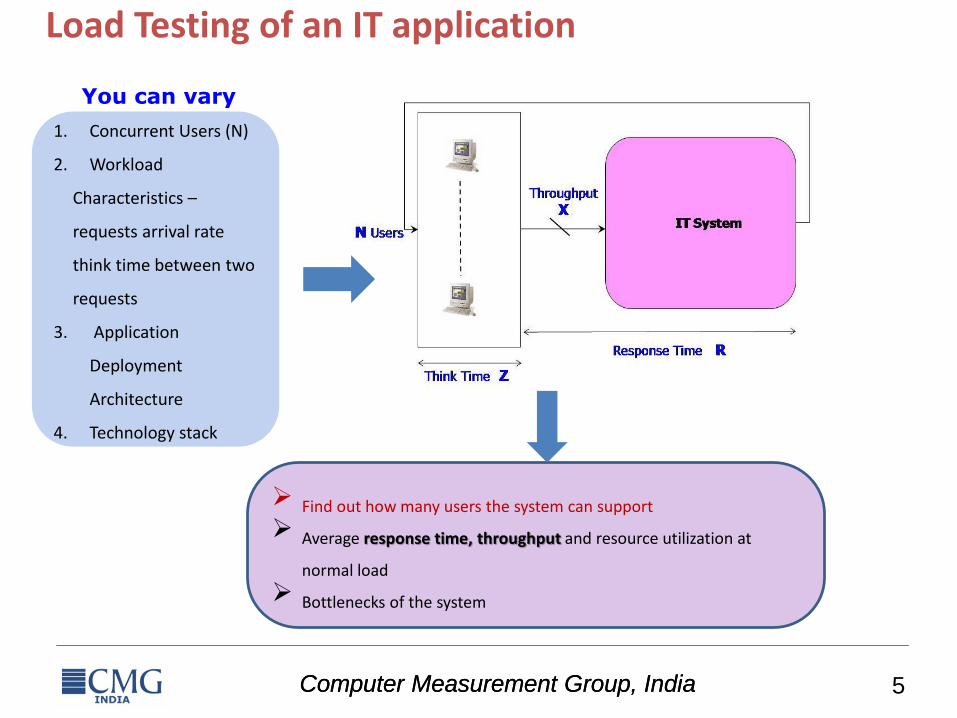
Find out how many users the system can support
Average response time, throughput and resource utilization at
normal load
Bottlenecks of the system
Load Testing of an IT application
1. Concurrent Users (N)
2. Workload
Characteristics –
requests arrival rate
think time between two
requests
3. Application
Deployment
Architecture
4. Technology stack
You can vary
Computer Measurement Group, India 6Computer Measurement Group, India
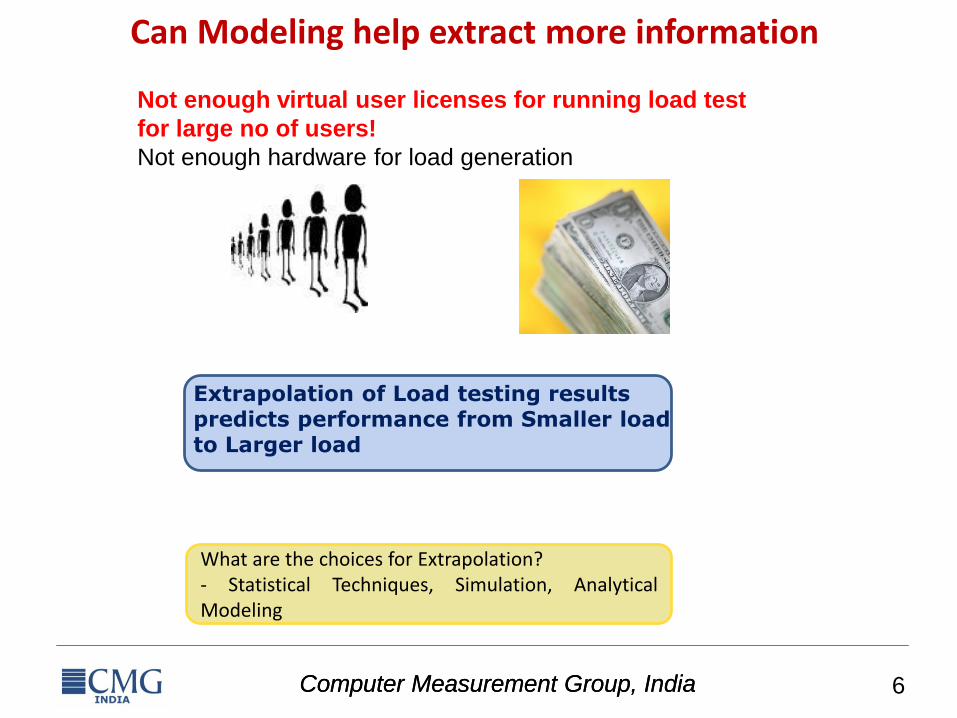
Can Modeling help extract more information
Not enough virtual user licenses for running load test
for large no of users!
Not enough hardware for load generation
LiExtrapolation of Load testing results predicts performance from Smaller load to Larger load
What are the choices for Extrapolation?- Statistical Techniques, Simulation, AnalyticalModeling
Computer Measurement Group, India 7Computer Measurement Group, India
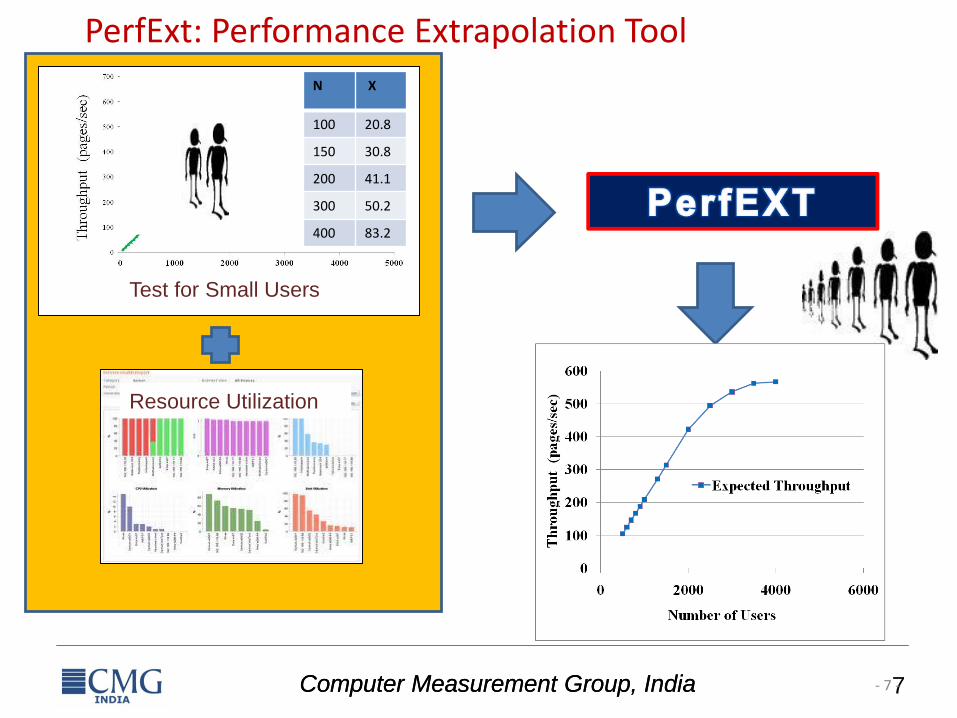
PerfExt: Performance Extrapolation Tool
- 7 -
N X
100 20.8
150 30.8
200 41.1
300 50.2
400 83.2
Test for Small Users
Resource Utilization
Computer Measurement Group, India 8
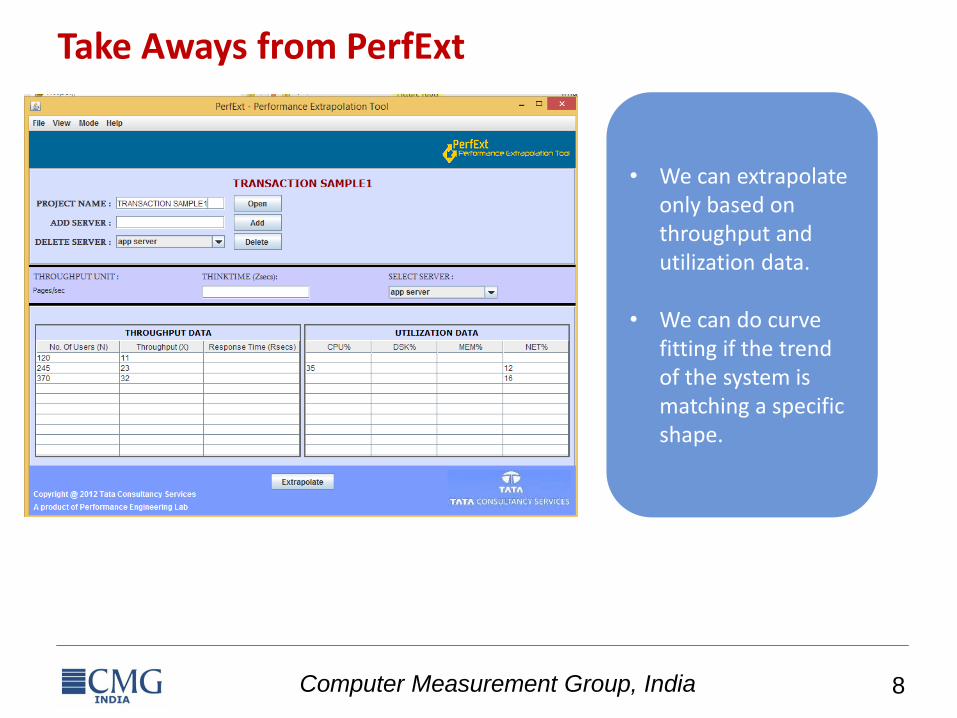
Take Aways from PerfExt
• We can extrapolate only based on throughput and utilization data.
• We can do curve fitting if the trend of the system is matching a specific shape.
Computer Measurement Group, India 9
PerfCenterLite: An alternate approach
• Download from
http://www.cse.iitb.ac.in/panda/perfcenterlite
• Underlying engine is PerfCenter – simulation based
• Input specification
– Software architecture • Tier details
• Sequence for transactions
– Load testing data
– Target environment details • Based on Speed-up factor between test and target machine
– Uses optimization technique to derive service demand
Computer Measurement Group, India 10
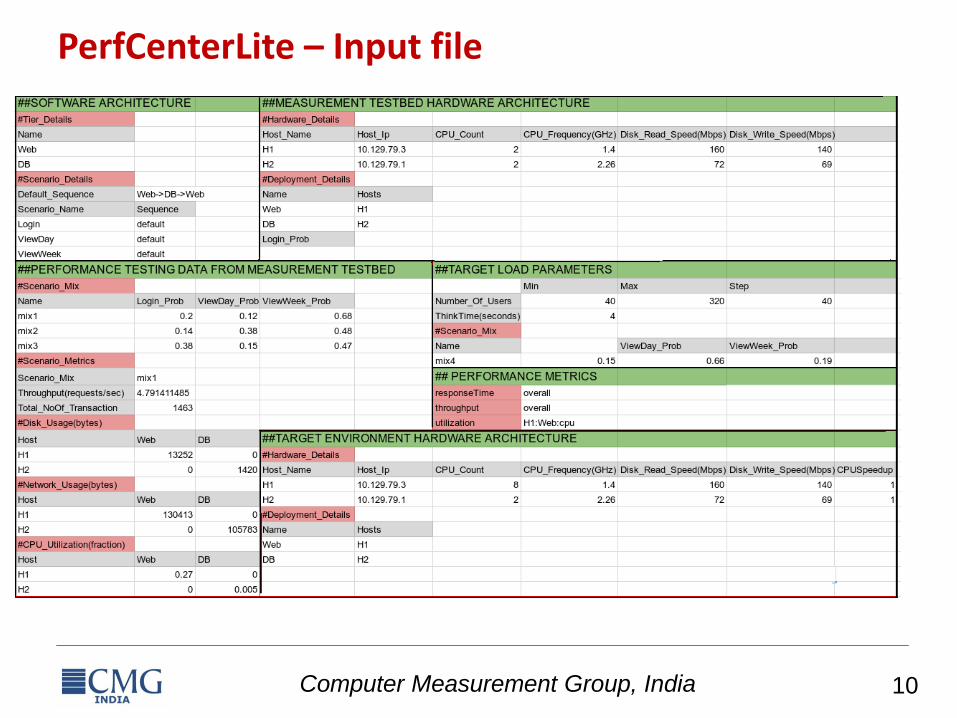
PerfCenterLite – Input file
Computer Measurement Group, India 11
Outline
Load Testing as the starting point
Tools that use load testing results
Basics of Queuing Networks
Simple Modeling Tool
Model Building Exercise using
SPECjAppServer2002
When things are not looking right
Computer Measurement Group, India 12Computer Measurement Group, India
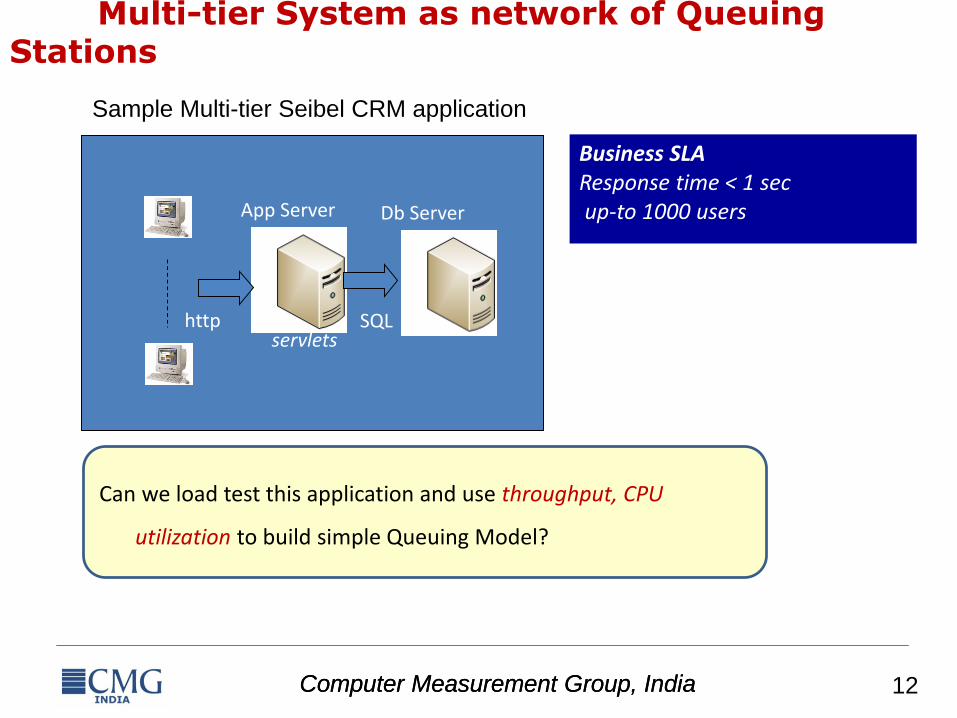
Multi-tier System as network of Queuing Stations
Can we load test this application and use throughput, CPU
utilization to build simple Queuing Model?
http SQL
App Server
servlets
Db Server
Business SLAResponse time < 1 secup-to 1000 users
Sample Multi-tier Seibel CRM application
Computer Measurement Group, India 13
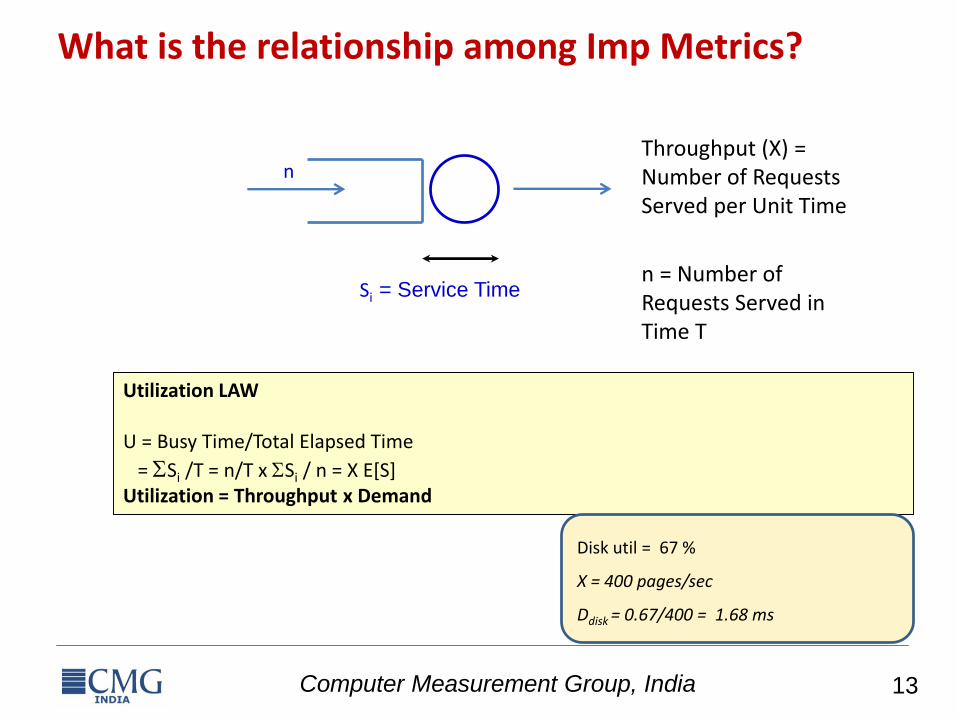
What is the relationship among Imp Metrics?
Throughput (X) = Number of Requests Served per Unit Time
Utilization LAW
U = Busy Time/Total Elapsed Time
= Si /T = n/T x Si / n = X E[S]Utilization = Throughput x Demand
n
Si = Service Timen = Number of Requests Served in Time T
Disk util = 67 %
X = 400 pages/sec
Ddisk = 0.67/400 = 1.68 ms
Computer Measurement Group, India 14
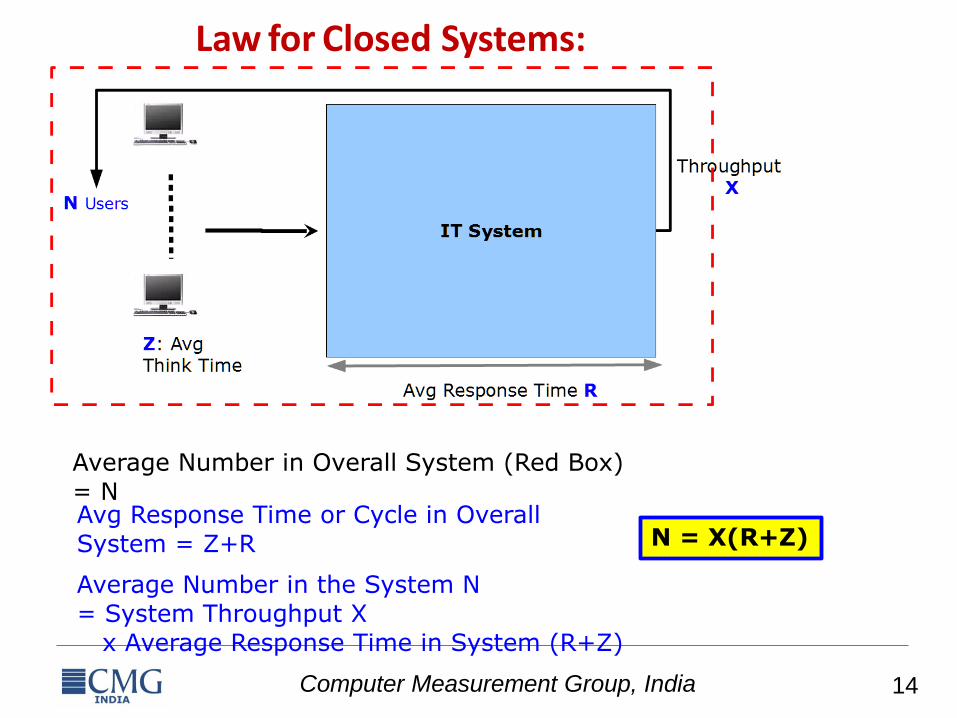
Little's Law for Closed Systems:
Average Number in Overall System (Red Box) = NAvg Response Time or Cycle in Overall System = Z+R N = X(R+Z)
Average Number in the System N= System Throughput X
x Average Response Time in System (R+Z)
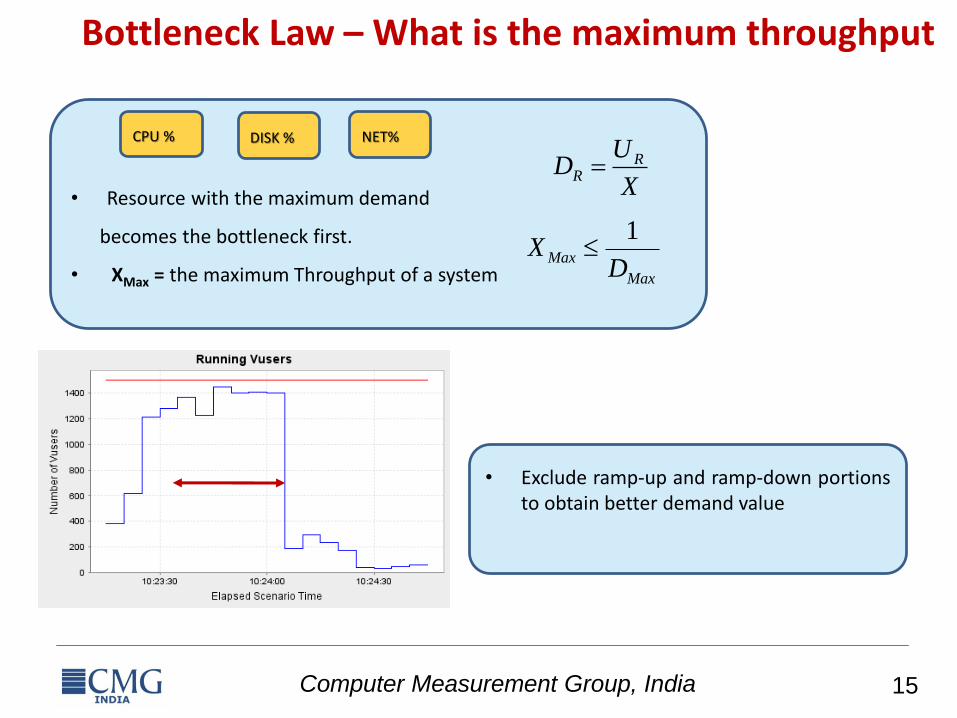
Computer Measurement Group, India 15
• Exclude ramp-up and ramp-down portionsto obtain better demand value
Bottleneck Law – What is the maximum throughput
• Resource with the maximum demand
becomes the bottleneck first.
• XMax = the maximum Throughput of a system
X
UD R
R
CPU % DISK %
Max
MaxD
X1
NET%
Computer Measurement Group, India 16Computer Measurement Group, India
JMT: Powerful Java Modelling Tool
• Developed since 2002 by 10+ generations of PG and UG students at Politecnico di Milano and Imperial College London
• http://jmt.sourceforge.net/
• JMT is open source: GPL v2
– size: ~4,000 classes; 21MB code; ~200k lines
• Download the jar file and simply run
java –jar JMT.tar
• M.Bertoli, G.Casale, G.Serazzi.JMT: performance engineering tools for system modeling.ACM SIGMETRICS Performance Evaluation Review, Volume 36 Issue 4, New York, US, March 2009, 10-15, ACM press
Computer Measurement Group, India 17Computer Measurement Group, India
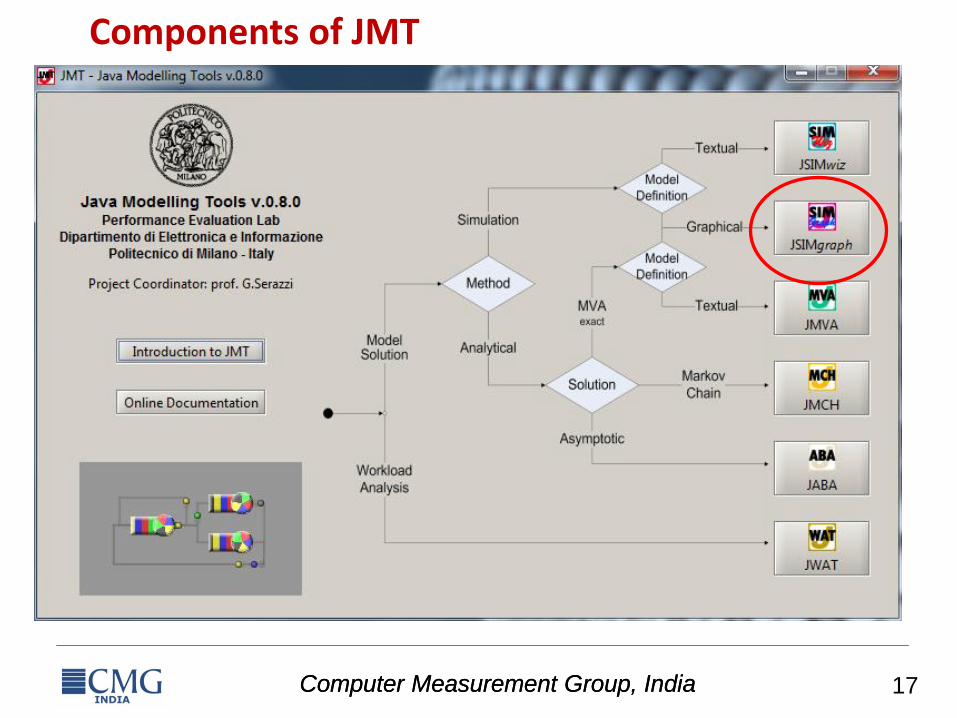
Components of JMT
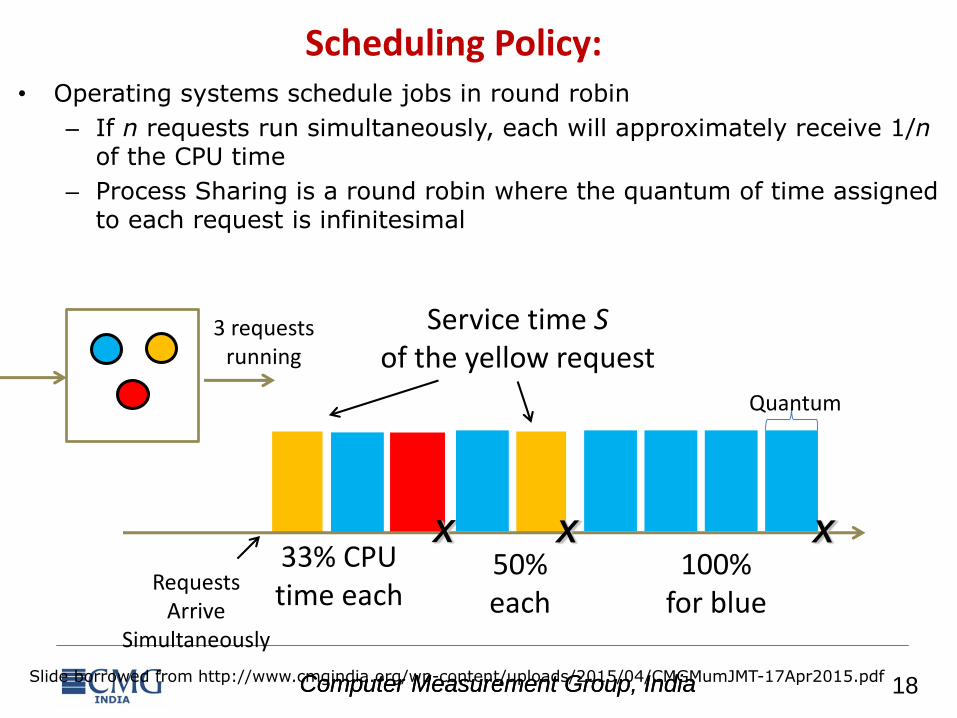
Computer Measurement Group, India 18Computer Measurement Group, India
Scheduling Policy: PS• Operating systems schedule jobs in round robin
– If n requests run simultaneously, each will approximately receive 1/nof the CPU time
– Process Sharing is a round robin where the quantum of time assigned to each request is infinitesimal
X X
Service time Sof the yellow request
33% CPUtime each
50% each
100%for blue
X
Quantum
RequestsArrive
Simultaneously
3 requests running
Slide borrowed from http://www.cmgindia.org/wp-content/uploads/2015/04/CMGMumJMT-17Apr2015.pdf
Computer Measurement Group, India 19Computer Measurement Group, India
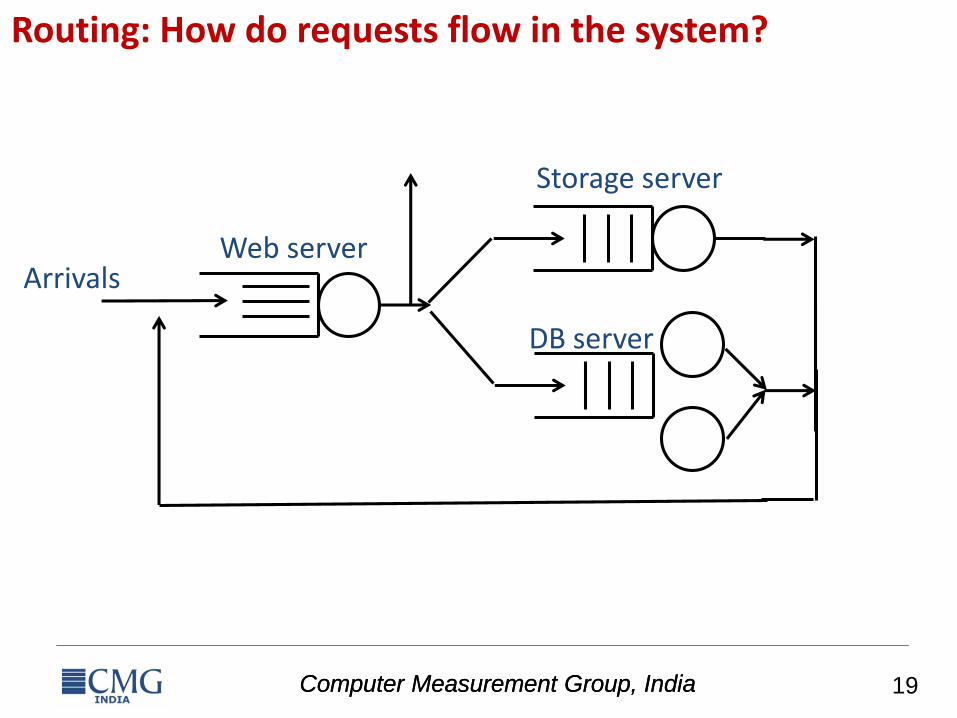
Routing: How do requests flow in the system?
ArrivalsWeb server
Storage server
DB server
Computer Measurement Group, India 20Computer Measurement Group, India
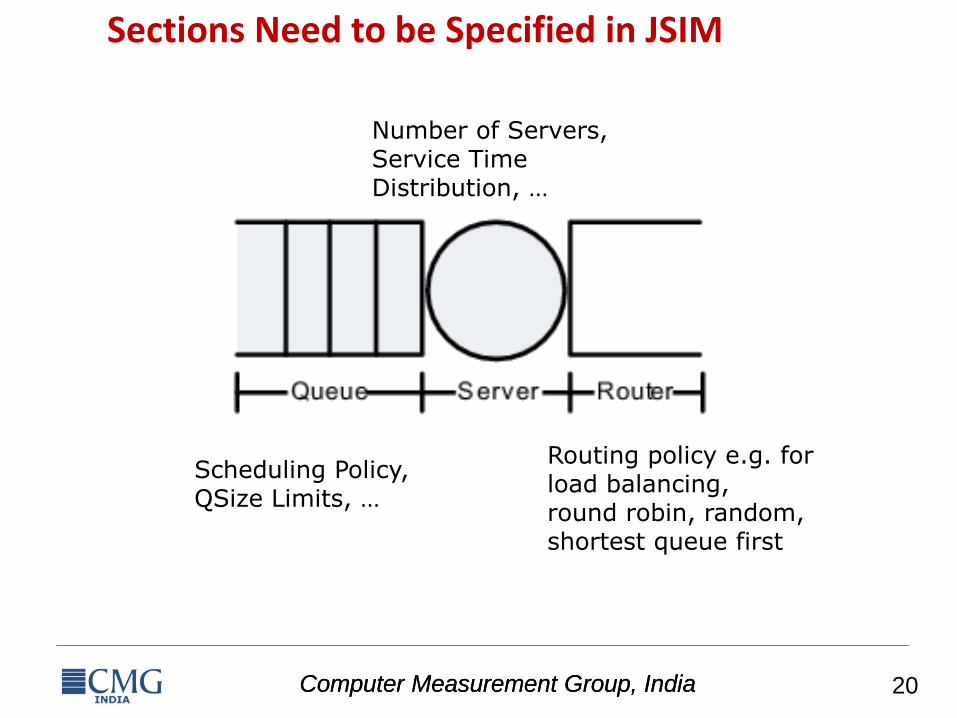
Three Sections Need to be Specified in JSIM
Scheduling Policy,QSize Limits, …
Number of Servers, Service Time Distribution, …
Routing policy e.g. for load balancing, round robin, random, shortest queue first
Computer Measurement Group, India 21Computer Measurement Group, India
How Long to Run the Simulation?
• Since think times and service times are random variables, we will have response time and throughput also as random variables
• Simulation with a different random seed may not give exactly the same output
• Likewise simulation for double the time may not give exactly the same answer
• So for convergence we need to be X% certain that the performance metric’s estimate is within an error of Y%
• For example, 99% confidence that average response time estimated thus far is within 10% of the true average
Computer Measurement Group, India 22Computer Measurement Group, India
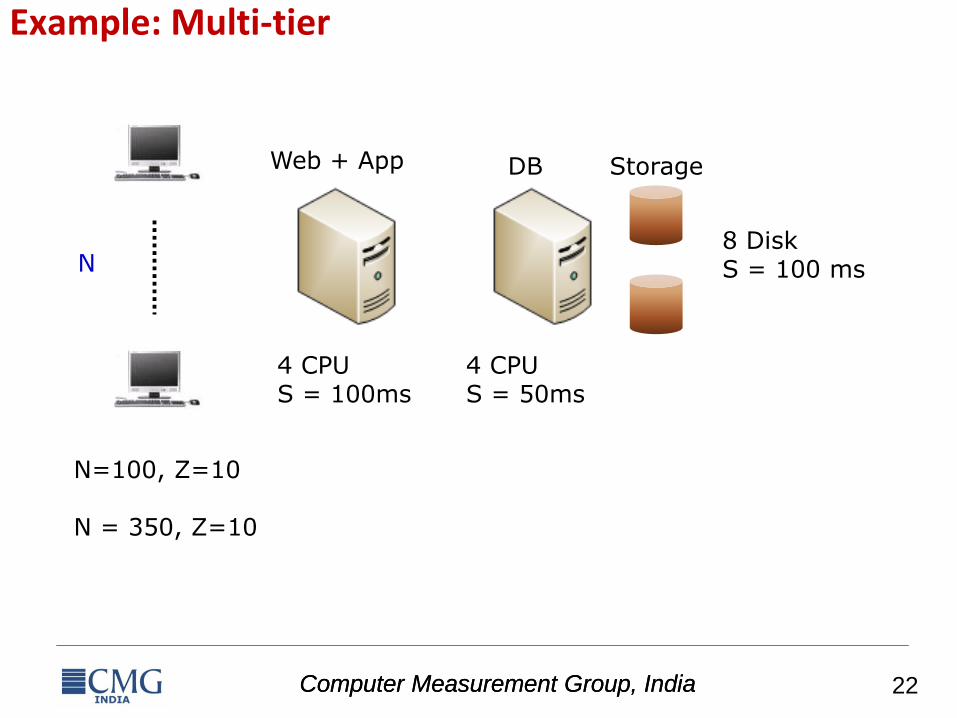
Example: Multi-tier
N
Web + App DB Storage
N=100, Z=10
N = 350, Z=10
4 CPUS = 100ms
4 CPUS = 50ms
8 DiskS = 100 ms
Computer Measurement Group, India 23Computer Measurement Group, India
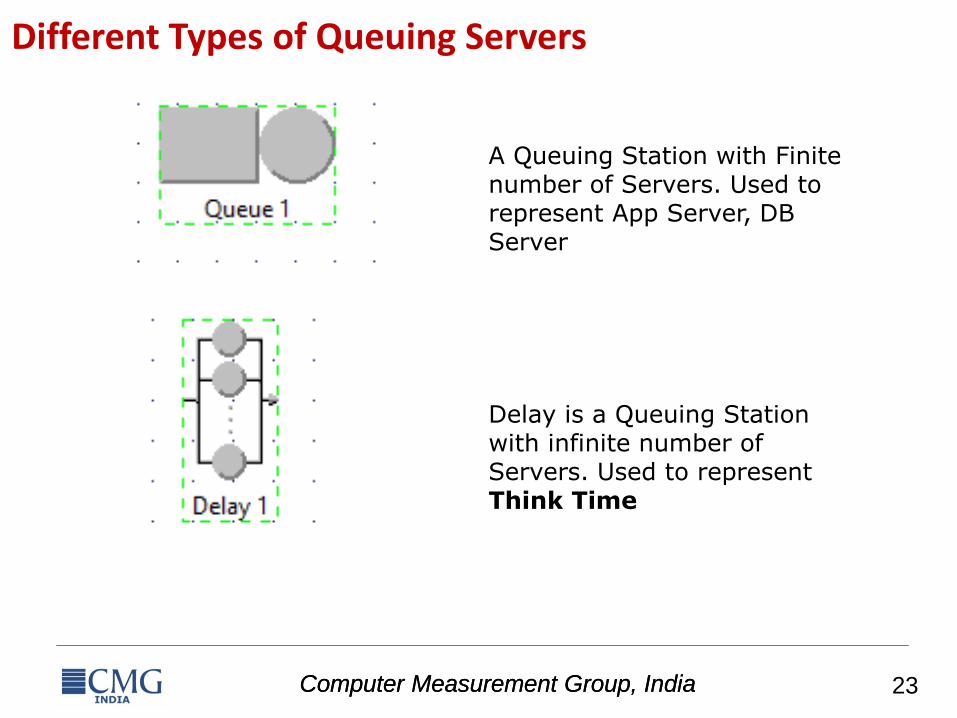
Different Types of Queuing Servers
A Queuing Station with Finite number of Servers. Used to represent App Server, DB Server
Delay is a Queuing Station with infinite number of Servers. Used to represent Think Time
Computer Measurement Group, India 24Computer Measurement Group, India
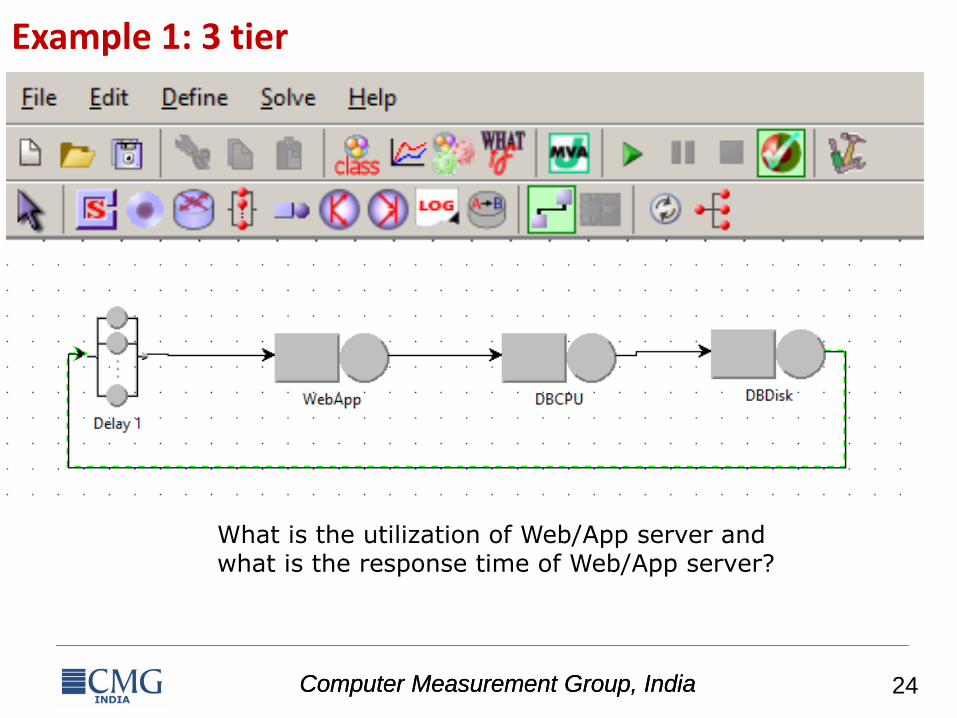
Example 1: 3 tier
What is the utilization of Web/App server and what is the response time of Web/App server?
Computer Measurement Group, India 25Computer Measurement Group, India
Computer Measurement Group, India 26Computer Measurement Group, India
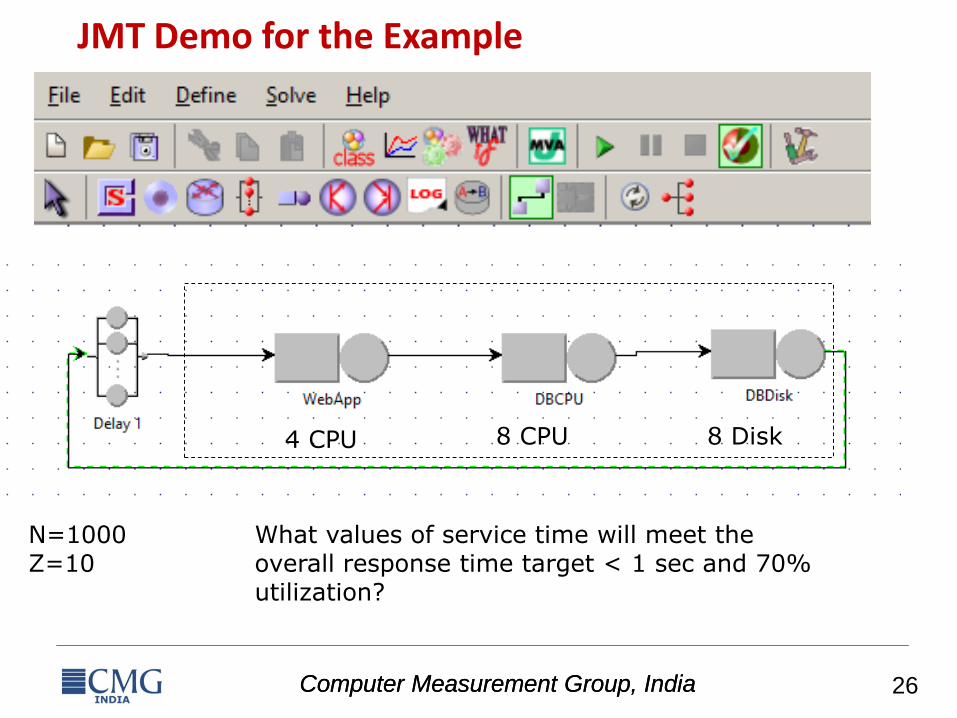
JMT Demo for the Example
N=1000Z=10
What values of service time will meet the overall response time target < 1 sec and 70% utilization?
4 CPU 8 CPU 8 Disk
Computer Measurement Group, India 27Computer Measurement Group, India
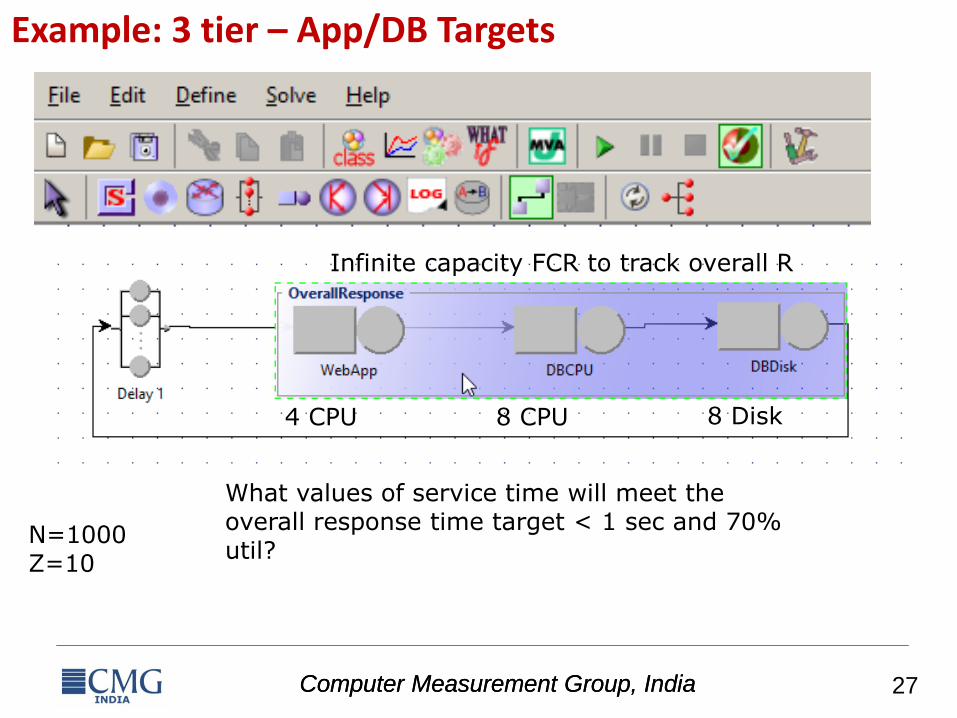
Example: 3 tier – App/DB Targets
N=1000Z=10
What values of service time will meet the overall response time target < 1 sec and 70% util?
4 CPU 8 CPU 8 Disk
Infinite capacity FCR to track overall R
Computer Measurement Group, India 28Computer Measurement Group, India
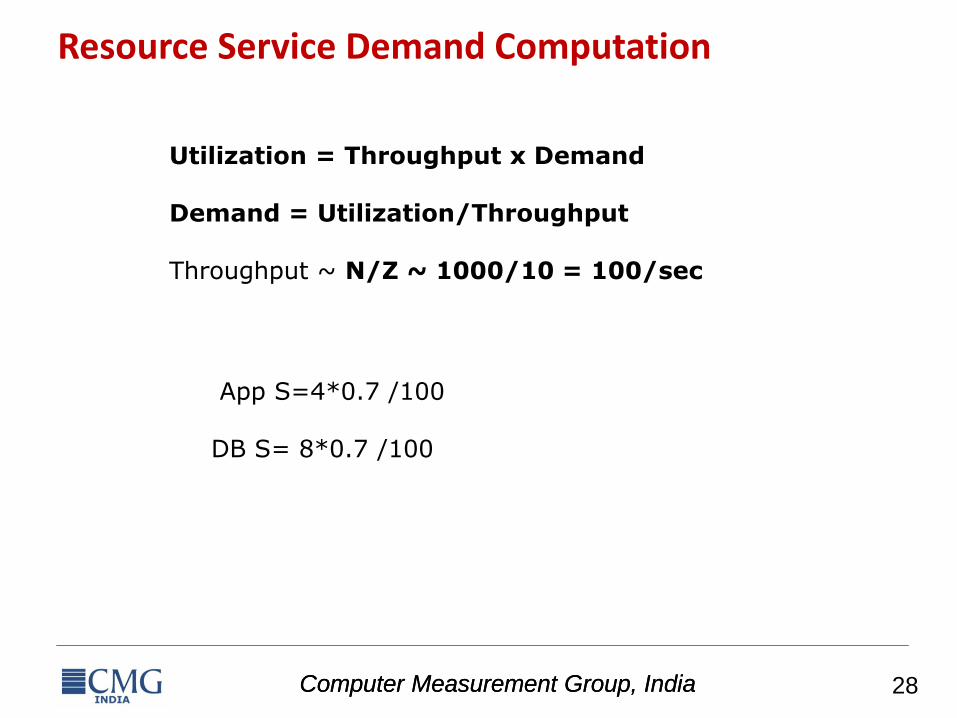
Resource Service Demand Computation
App S=4*0.7 /100
DB S= 8*0.7 /100
Utilization = Throughput x Demand
Demand = Utilization/Throughput
Throughput ~ N/Z ~ 1000/10 = 100/sec

Computer Measurement Group, India 29
Outline
Load Testing as the starting point
Tools that use load testing results
Basics of Queuing Networks
Simple Modeling Tool
Model Building Exercise using a J2EE
Application
When things are not looking right
Computer Measurement Group, India 30
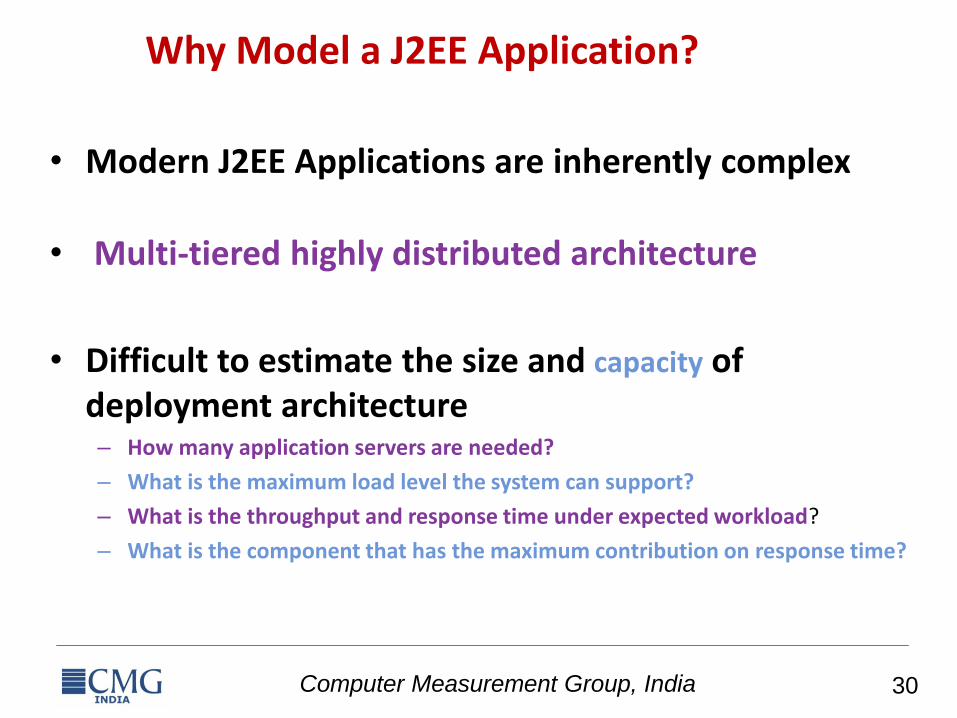
Why Model a J2EE Application?
• Modern J2EE Applications are inherently complex
• Multi-tiered highly distributed architecture
• Difficult to estimate the size and capacity of deployment architecture– How many application servers are needed?
– What is the maximum load level the system can support?
– What is the throughput and response time under expected workload?
– What is the component that has the maximum contribution on response time?
Computer Measurement Group, India 31
What are the possible alternatives?
• Possible Choices are
– Based on intuitions
– Ask an expert
– Based on ad-hoc procedures
– General rule of thumb
– Use Analytical modeling approach – Formal and Systematic Approach
Computer Measurement Group, India 32
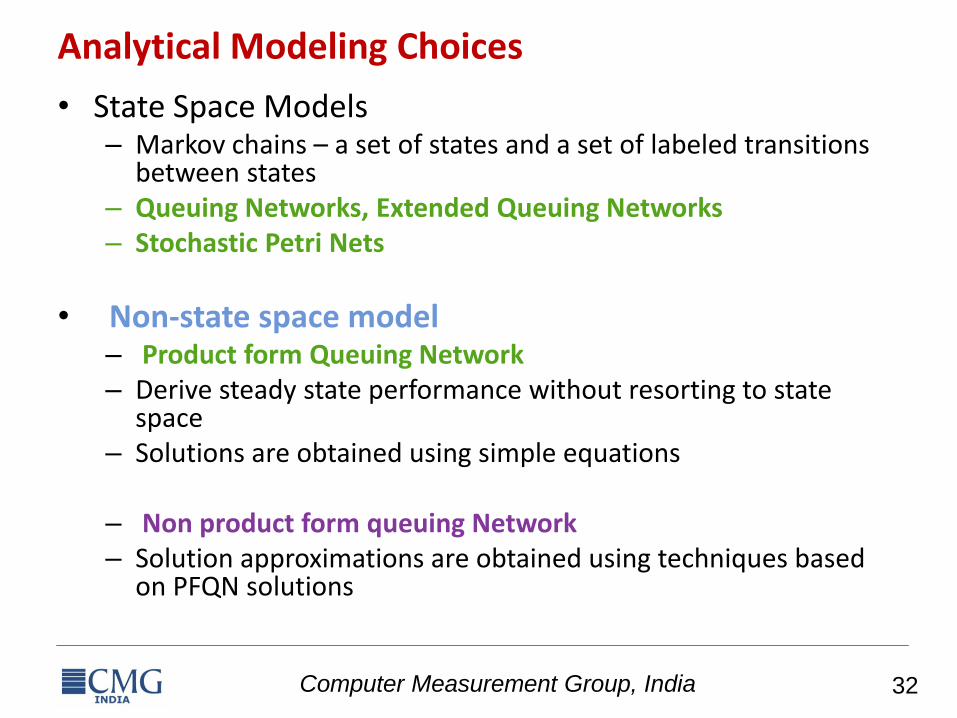
Analytical Modeling Choices
• State Space Models– Markov chains – a set of states and a set of labeled transitions
between states– Queuing Networks, Extended Queuing Networks– Stochastic Petri Nets
• Non-state space model– Product form Queuing Network– Derive steady state performance without resorting to state
space– Solutions are obtained using simple equations
– Non product form queuing Network– Solution approximations are obtained using techniques based
on PFQN solutions
Computer Measurement Group, India 33
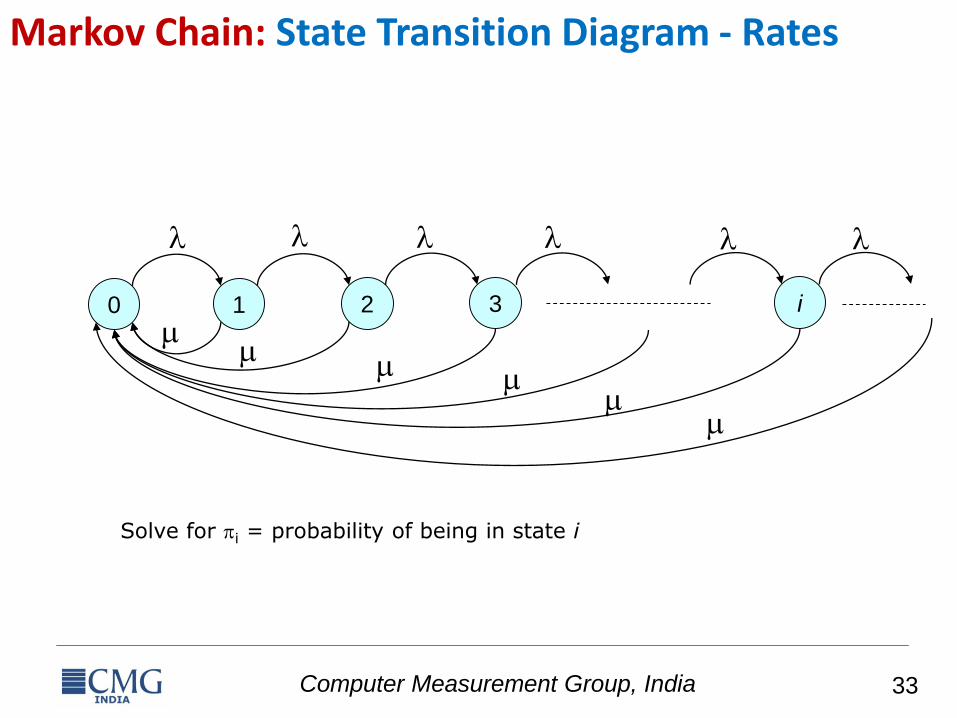
0 1 2 3 i
Markov Chain: State Transition Diagram - Rates
Solve for i = probability of being in state i
Computer Measurement Group, India 34
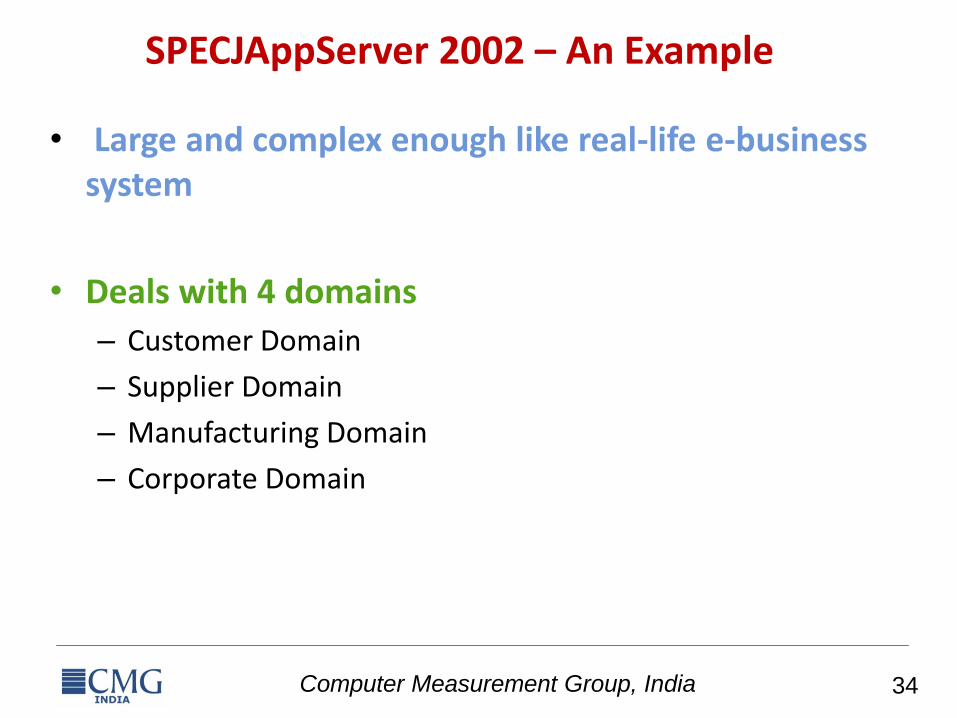
SPECJAppServer 2002 – An Example
• Large and complex enough like real-life e-business system
• Deals with 4 domains
– Customer Domain
– Supplier Domain
– Manufacturing Domain
– Corporate Domain
Computer Measurement Group, India 35
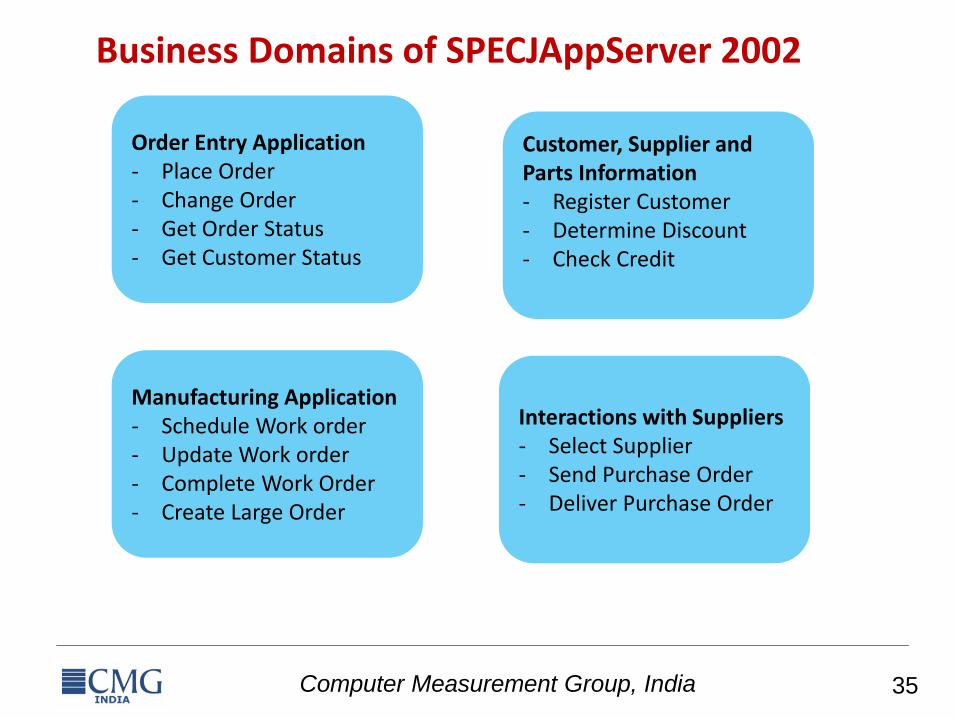
Business Domains of SPECJAppServer 2002
Order Entry Application- Place Order- Change Order- Get Order Status- Get Customer Status
Manufacturing Application- Schedule Work order- Update Work order- Complete Work Order- Create Large Order
Customer, Supplier and Parts Information- Register Customer- Determine Discount- Check Credit
Interactions with Suppliers- Select Supplier- Send Purchase Order- Deliver Purchase Order
Computer Measurement Group, India 36
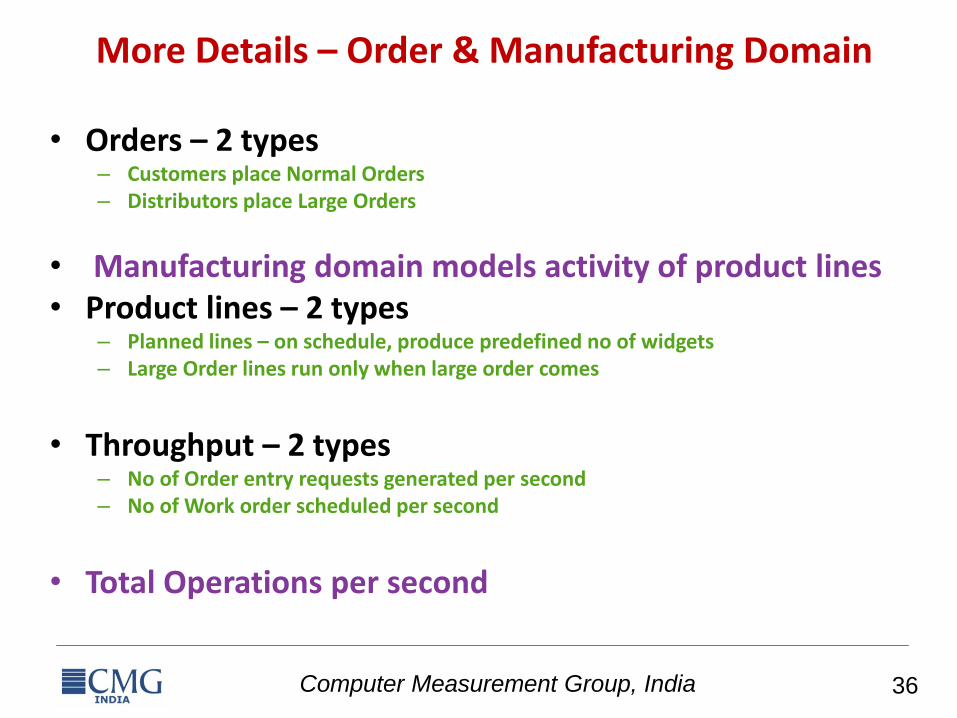
More Details – Order & Manufacturing Domain
• Orders – 2 types– Customers place Normal Orders– Distributors place Large Orders
• Manufacturing domain models activity of product lines• Product lines – 2 types
– Planned lines – on schedule, produce predefined no of widgets– Large Order lines run only when large order comes
• Throughput – 2 types– No of Order entry requests generated per second– No of Work order scheduled per second
• Total Operations per second
Computer Measurement Group, India 37
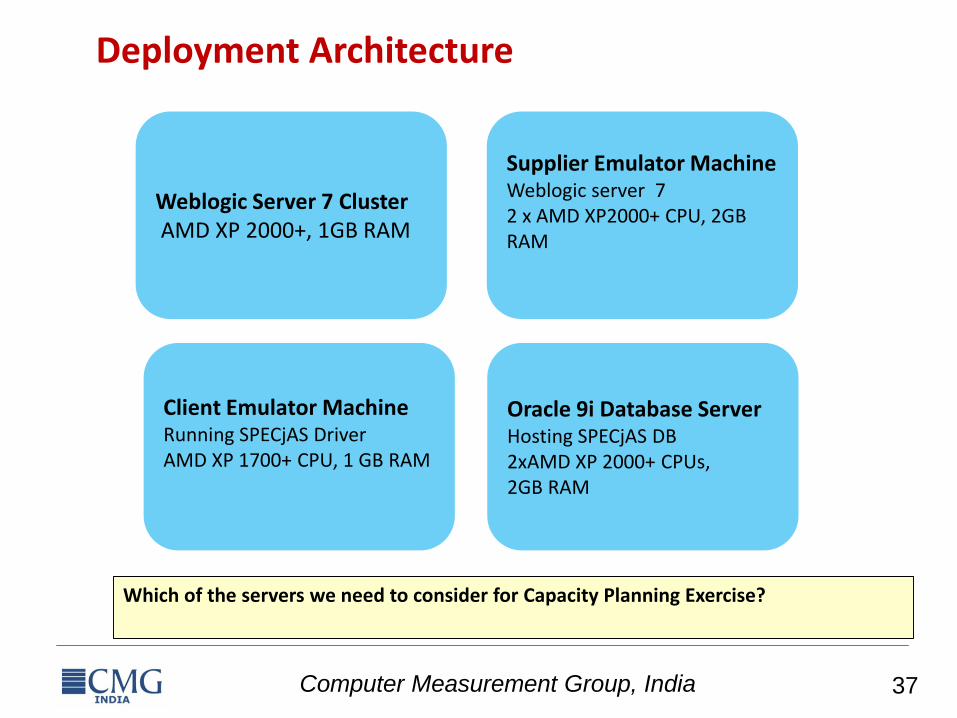
Deployment Architecture
Weblogic Server 7 ClusterAMD XP 2000+, 1GB RAM
Client Emulator MachineRunning SPECjAS DriverAMD XP 1700+ CPU, 1 GB RAM
Supplier Emulator MachineWeblogic server 7 2 x AMD XP2000+ CPU, 2GB RAM
Oracle 9i Database ServerHosting SPECjAS DB2xAMD XP 2000+ CPUs,2GB RAM
Which of the servers we need to consider for Capacity Planning Exercise?
Computer Measurement Group, India 38
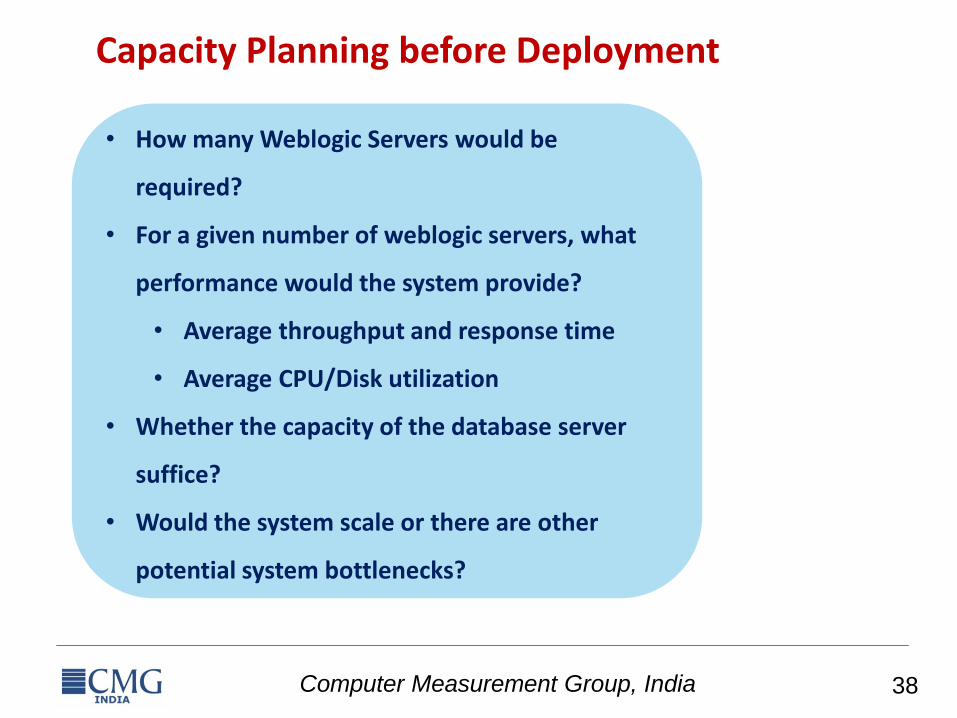
Capacity Planning before Deployment
• How many Weblogic Servers would be
required?
• For a given number of weblogic servers, what
performance would the system provide?
• Average throughput and response time
• Average CPU/Disk utilization
• Whether the capacity of the database server
suffice?
• Would the system scale or there are other
potential system bottlenecks?
Computer Measurement Group, India 39
1st step: Workload Characterization
• Identify the type of requests served by system (Request classes)
• Identify software and hardware resources required by each class
• Measure the total amount of system resource required for each request and each resource (Service Demand)
• Give an indication of the number of max requestseach class may receive (Workload Intensity)
Computer Measurement Group, India 40Computer Measurement Group, India
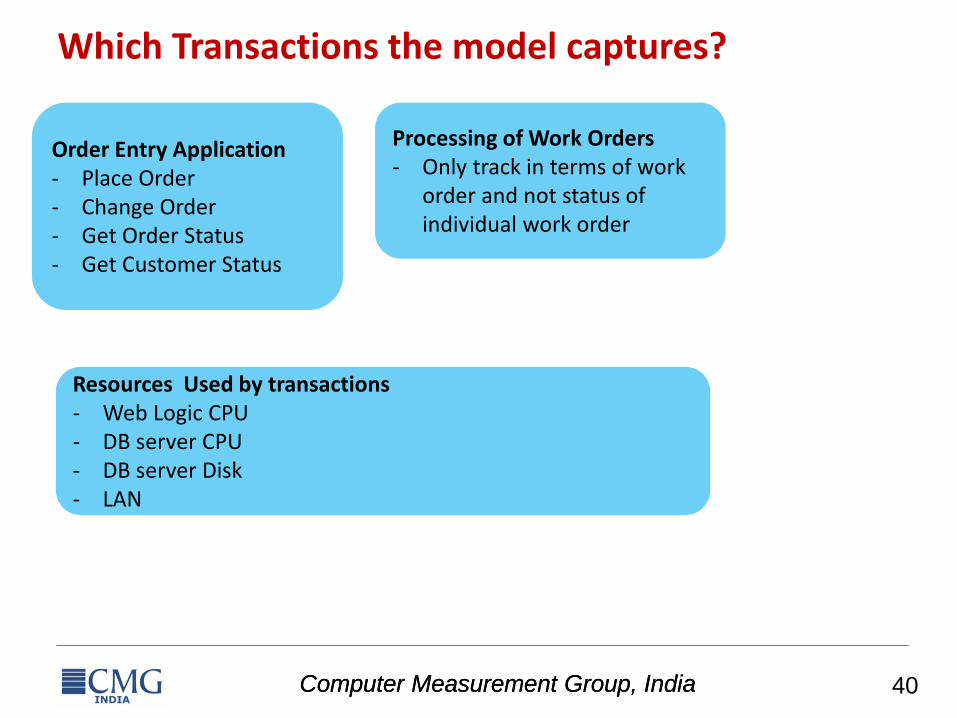
Which Transactions the model captures?
Order Entry Application - Place Order- Change Order- Get Order Status- Get Customer Status
Processing of Work Orders - Only track in terms of work
order and not status of individual work order
Resources Used by transactions- Web Logic CPU - DB server CPU- DB server Disk- LAN
Computer Measurement Group, India 41
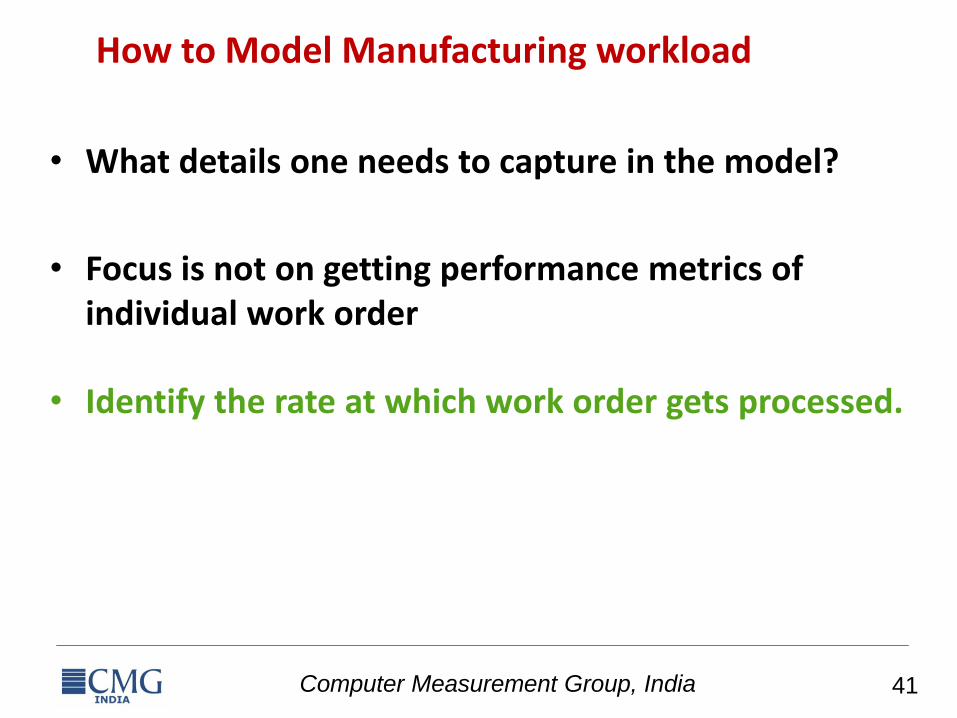
How to Model Manufacturing workload
• What details one needs to capture in the model?
• Focus is not on getting performance metrics of individual work order
• Identify the rate at which work order gets processed.
Computer Measurement Group, India 42
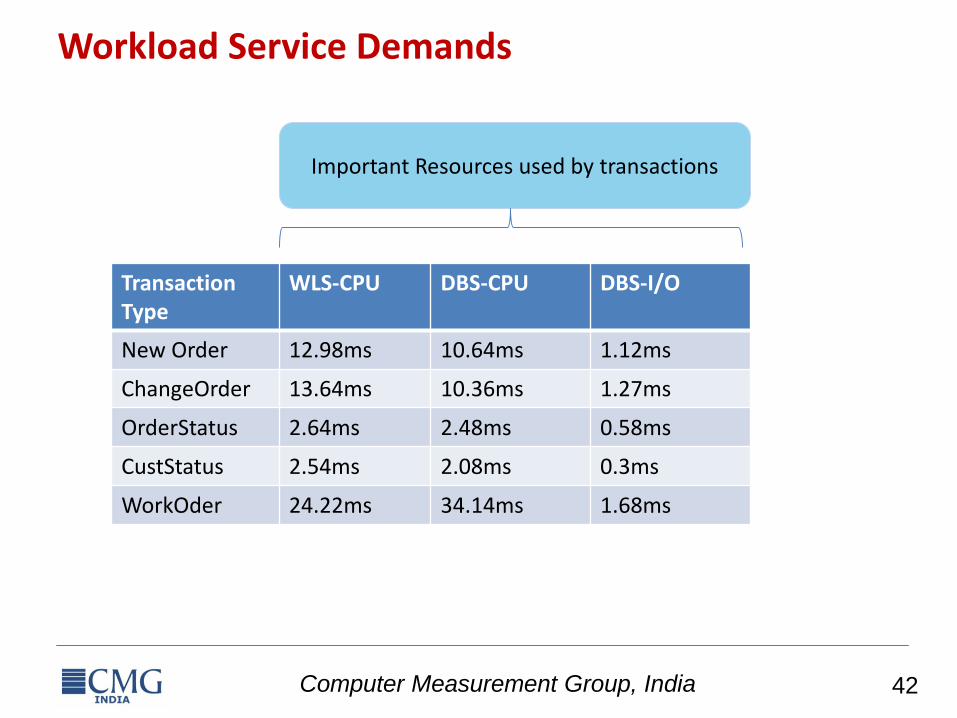
Workload Service Demands
Transaction Type
WLS-CPU DBS-CPU DBS-I/O
New Order 12.98ms 10.64ms 1.12ms
ChangeOrder 13.64ms 10.36ms 1.27ms
OrderStatus 2.64ms 2.48ms 0.58ms
CustStatus 2.54ms 2.08ms 0.3ms
WorkOder 24.22ms 34.14ms 1.68ms
Important Resources used by transactions
Computer Measurement Group, India 43
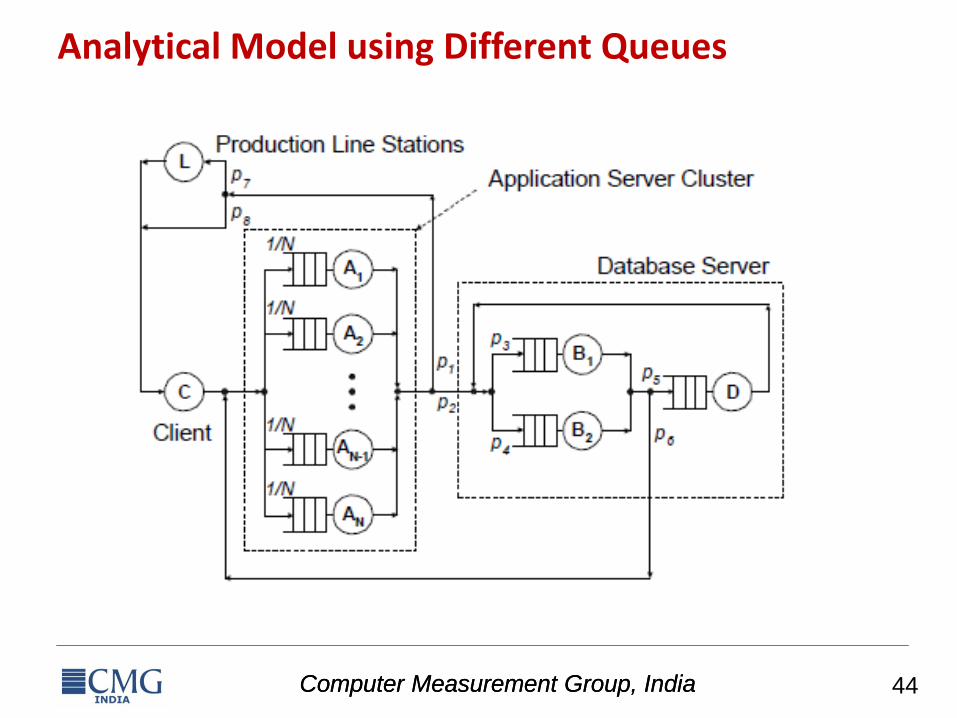
Different Queues used
• SPECjAppServer Driver: Infinite server queue to model client machine. Service time = client think time
• WebLogic Servers: Processor Sharing to model CPUs of N WebLogic servers
• Database – Processor Sharing Queues to model two CPUs of the Database server
• Production Line Stations: Infinite Serer Queue is used to model the virtual stations in the manufacturing domain. service time = average delay at production line stations
Computer Measurement Group, India 44Computer Measurement Group, India
Analytical Model using Different Queues
Computer Measurement Group, India 45
Next Step: Deciding Routing Probabilities
• At customer machine request waits for specified think-time
• What is the routing probabilities among the queues?
• Assume all Web logic servers are equal probable
– Probability = 1/N
• Database server CPUs can be chosen with equally probability
Computer Measurement Group, India 46
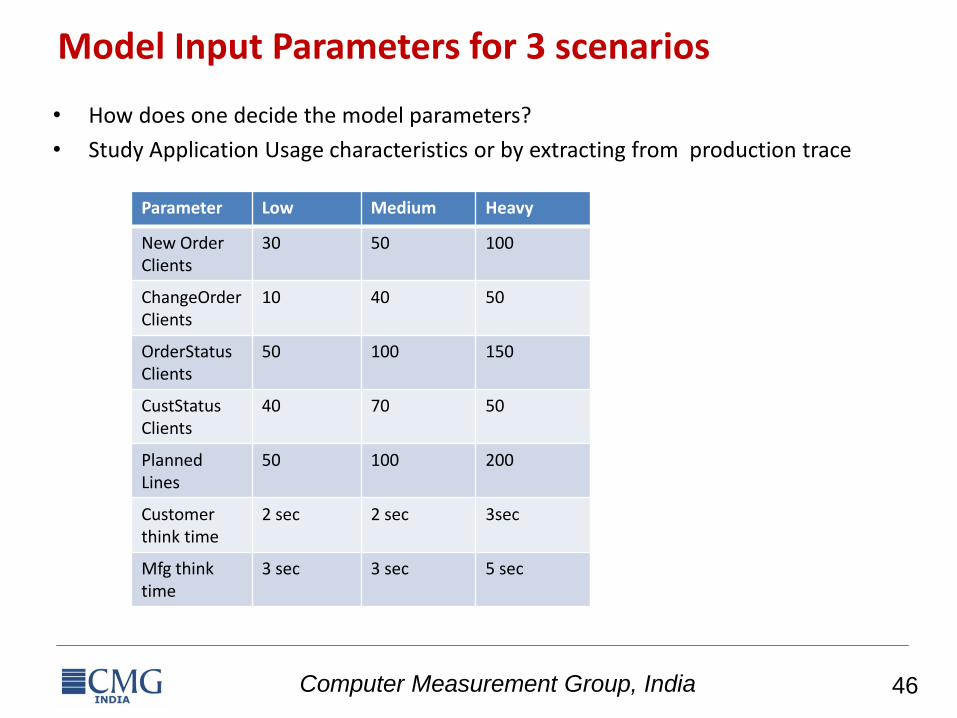
Model Input Parameters for 3 scenarios
• How does one decide the model parameters?
• Study Application Usage characteristics or by extracting from production trace
Parameter Low Medium Heavy
New Order Clients
30 50 100
ChangeOrderClients
10 40 50
OrderStatusClients
50 100 150
CustStatusClients
40 70 50
PlannedLines
50 100 200
Customer think time
2 sec 2 sec 3sec
Mfg think time
3 sec 3 sec 5 sec
Computer Measurement Group, India 47
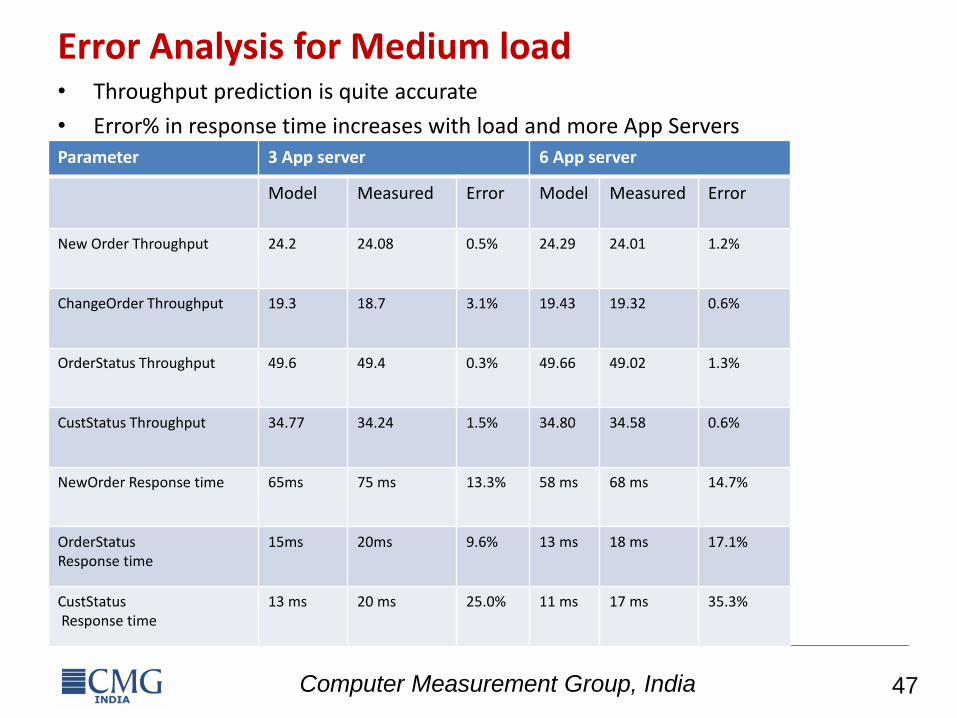
Error Analysis for Medium load • Throughput prediction is quite accurate
• Error% in response time increases with load and more App ServersParameter 3 App server 6 App server
Model Measured Error Model Measured Error
New Order Throughput 24.2 24.08 0.5% 24.29 24.01 1.2%
ChangeOrder Throughput 19.3 18.7 3.1% 19.43 19.32 0.6%
OrderStatus Throughput 49.6 49.4 0.3% 49.66 49.02 1.3%
CustStatus Throughput 34.77 34.24 1.5% 34.80 34.58 0.6%
NewOrder Response time 65ms 75 ms 13.3% 58 ms 68 ms 14.7%
OrderStatusResponse time
15ms 20ms 9.6% 13 ms 18 ms 17.1%
CustStatusResponse time
13 ms 20 ms 25.0% 11 ms 17 ms 35.3%
Computer Measurement Group, India 48
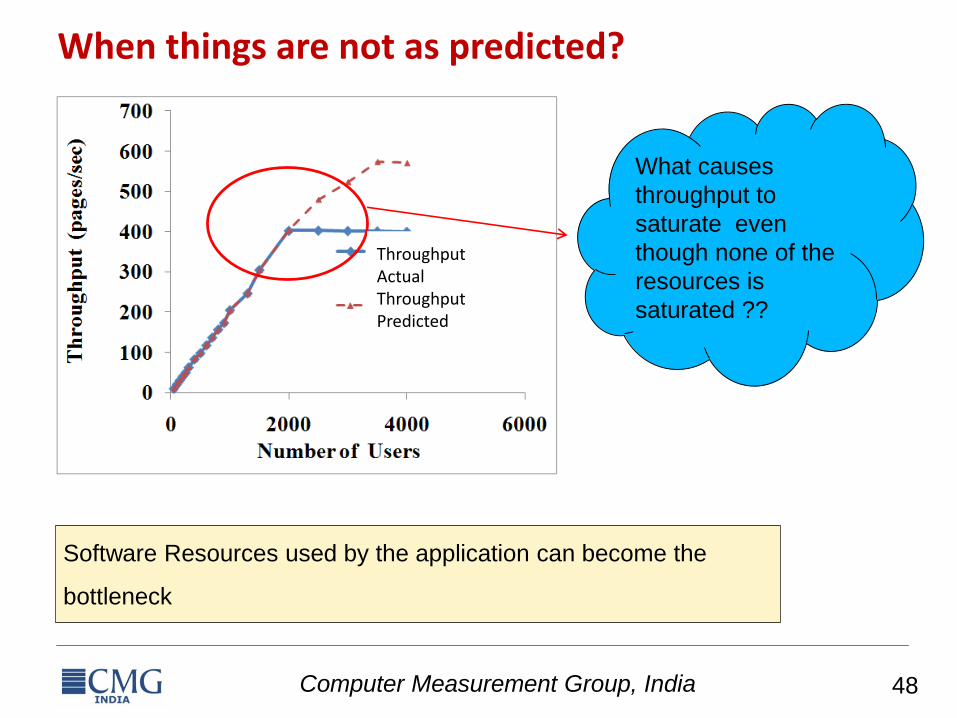
When things are not as predicted?
What causes
throughput to
saturate even
though none of the
resources is
saturated ??
Software Resources used by the application can become the
bottleneck
Throughput ActualThroughput Predicted
Computer Measurement Group, India 49
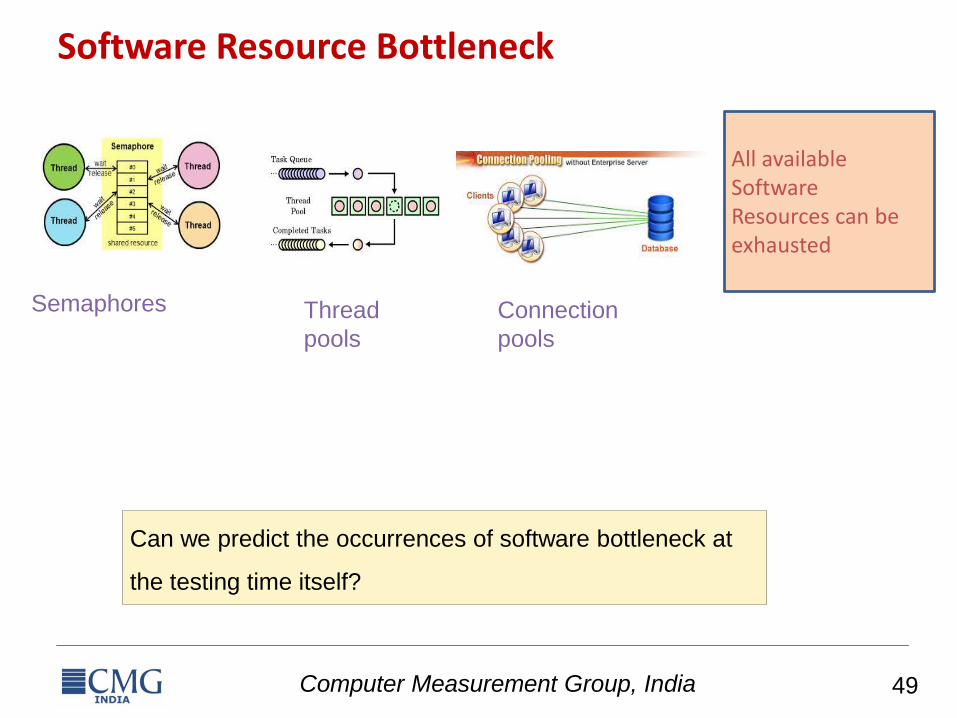
Software Resource Bottleneck
Can we predict the occurrences of software bottleneck at
the testing time itself?
Semaphores Connection
pools
All available Software Resources can be exhausted
Thread
pools
Computer Measurement Group, India 50
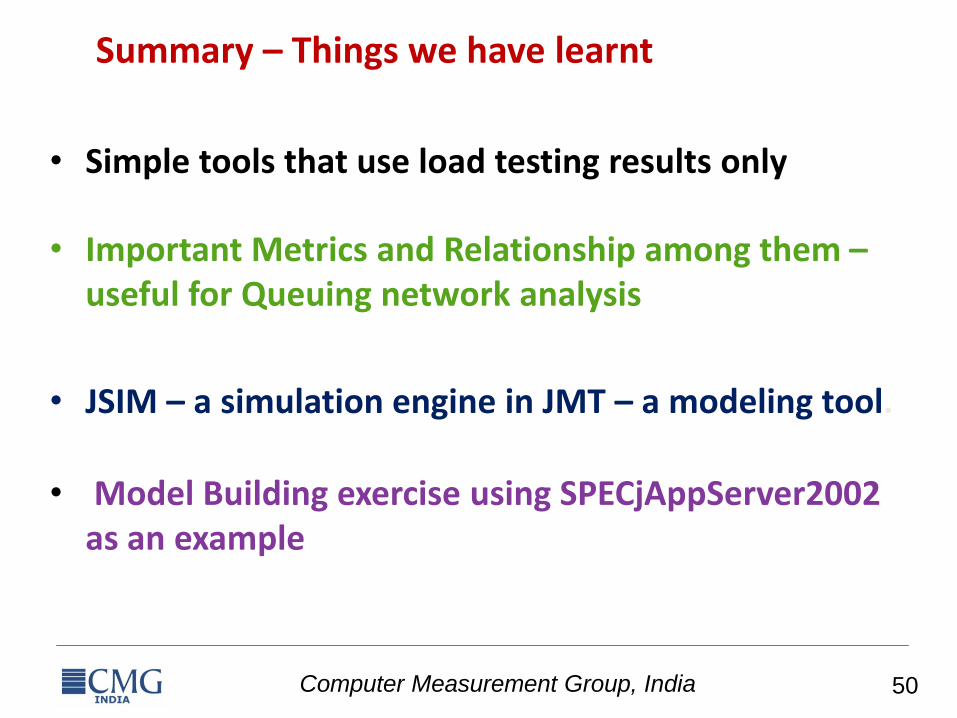
Summary – Things we have learnt
• Simple tools that use load testing results only
• Important Metrics and Relationship among them –useful for Queuing network analysis
• JSIM – a simulation engine in JMT – a modeling tool.
• Model Building exercise using SPECjAppServer2002 as an example
Computer Measurement Group, India 51
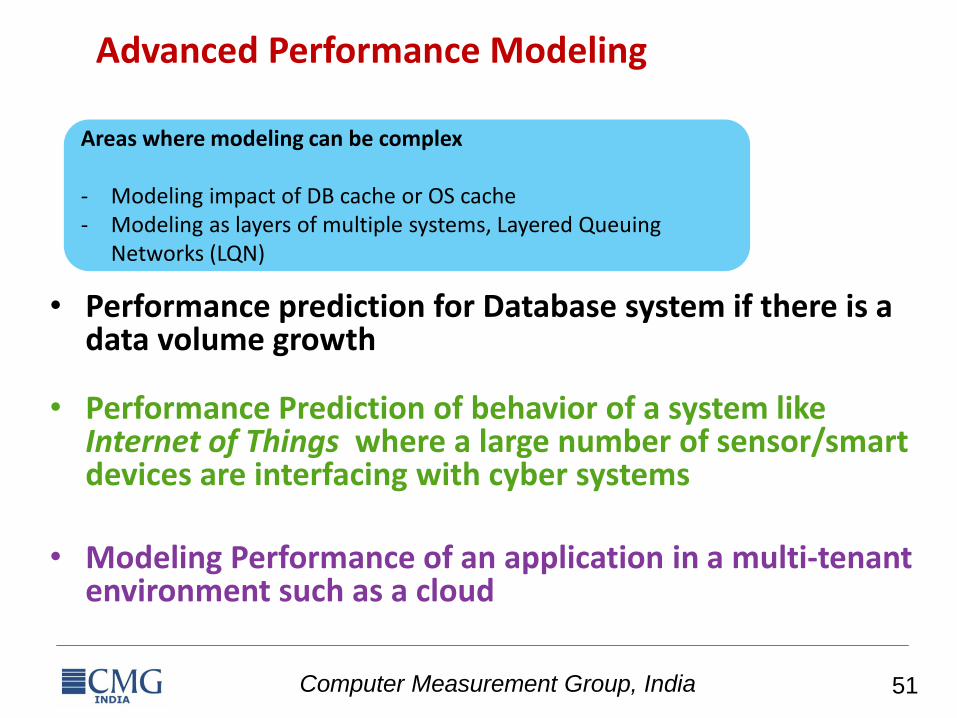
Advanced Performance Modeling
• Performance prediction for Database system if there is a data volume growth
• Performance Prediction of behavior of a system like Internet of Things where a large number of sensor/smart devices are interfacing with cyber systems
• Modeling Performance of an application in a multi-tenant environment such as a cloud
Areas where modeling can be complex
- Modeling impact of DB cache or OS cache- Modeling as layers of multiple systems, Layered Queuing
Networks (LQN)
Computer Measurement Group, India 52
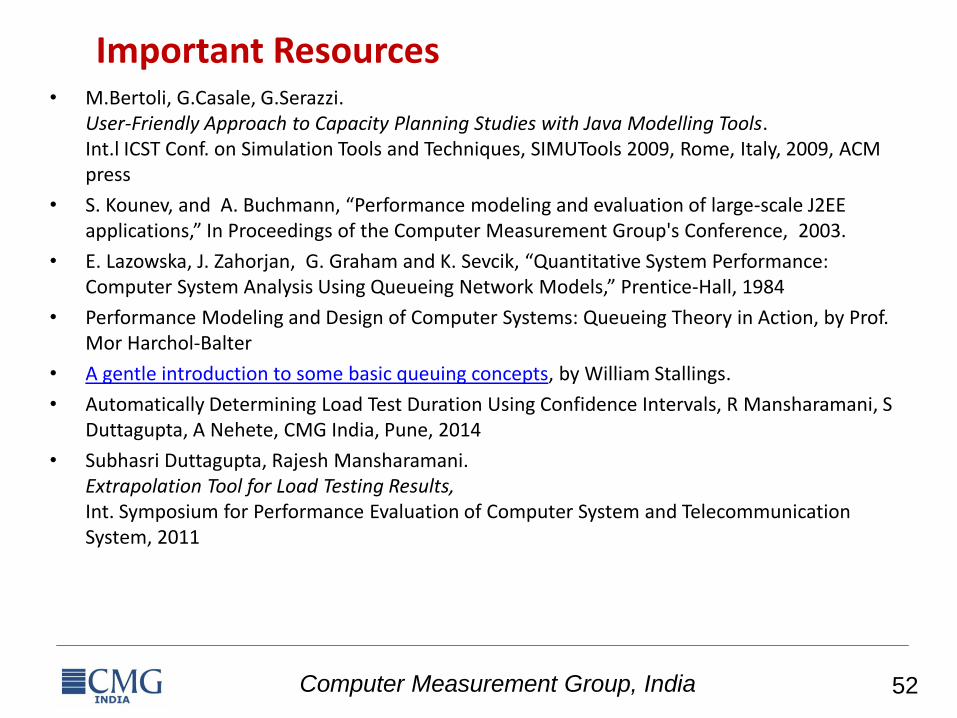
Important Resources• M.Bertoli, G.Casale, G.Serazzi.
User-Friendly Approach to Capacity Planning Studies with Java Modelling Tools.Int.l ICST Conf. on Simulation Tools and Techniques, SIMUTools 2009, Rome, Italy, 2009, ACM press
• S. Kounev, and A. Buchmann, “Performance modeling and evaluation of large-scale J2EE applications,” In Proceedings of the Computer Measurement Group's Conference, 2003.
• E. Lazowska, J. Zahorjan, G. Graham and K. Sevcik, “Quantitative System Performance: Computer System Analysis Using Queueing Network Models,” Prentice-Hall, 1984
• Performance Modeling and Design of Computer Systems: Queueing Theory in Action, by Prof. Mor Harchol-Balter
• A gentle introduction to some basic queuing concepts, by William Stallings.
• Automatically Determining Load Test Duration Using Confidence Intervals, R Mansharamani, S Duttagupta, A Nehete, CMG India, Pune, 2014
• Subhasri Duttagupta, Rajesh Mansharamani.Extrapolation Tool for Load Testing Results,Int. Symposium for Performance Evaluation of Computer System and Telecommunication System, 2011
Computer Measurement Group, India 53Computer Measurement Group, India
T
5
3
Q & A


![Security – Make No Compromises 3228C/3235C/3245C - RicohPrinter Controller Specifications [Standard] CPU: RM7065C 600MHz RAM: 1GB (shared) Page Description PCL 5c, PCL 6, RPCS (standard);](https://img.pdfslide.us/doc/110x75/61160cfc58231e364a010bf2/security-a-make-no-compromises-3228c3235c3245c-ricoh-printer-controller-specifications.jpg)


![i1 Professional Color ManageMent solutions...Macintosh® Macos X 10.5.8 or 10.6 [ with latest upgrades installed ], Intel® cPu, 1gb of available raM, 2gb of available hard disk space,](https://img.pdfslide.us/doc/110x75/5fba07d43b23180c0f57b1c3/i1-professional-color-management-solutions-macintosh-macos-x-1058-or-106.jpg)