Embed Size (px)
Citation preview

Performance Model & Tools Summary
Hung-Hsun Su
UPC Group, HCS lab
2/5/2004

Models
Amdahl’s law, Scaled-speedup, LogP, cLogP, BSP Parametric micro-level (PM, 1994)
Predict execution time, identify bottleneck, compare machines Incorporate precise details of interprocessor communication, memory
operations, auxiliary instructions and effects of communication and computation schedules
Derive analytical formulas experimental measurement of sample cases estimate misc. overhead refine formula predict execution time using formula
ZPL (1998) Model incorporated into language design Scalar performance, concurrency and interprocessor communication Identify interacting regions to determine how the data/processor is
mapped Once mapping is know, the cost is calculated by Also try to compare alternative solutions through formula

Models “Analytical Modeling of Parallel Programs”
Execution time, Total Parallel Overhead, Speedup, Efficiency, Cost Isoefficiency function
Determines the ease with which it can achieve speedups increasing in proportion to number of processors (small highly scalable)
Determine if system is “cost-optimal” if [(Num. Proc) * Tp] vs Ts is proportional to each other Calculation of lower bound is use to determine the degree of concurrency
Minimum execution time and cost-optimal execution time Asymptotic Analysis
Analyzing performance using kernel performance Define coupling (interaction) between kernels that tries to improve the accuracy
Overhead Model Generalized Amdahl’s law model Lost Cycles Analysis
Agarwal network model Wire, switch delays, message size, communication latency (contention not considered)
Closed queueing network model Task graph that gives the synchronization constraints and use a closed queuing model to describe
contention delay Predict mean response time and resource utilization
Anita W. Tam Model Application – establishes a relationship between message generation rate and communication latency Network Model – provide average message latency as function of message generation rate of nodes
together with other system parameters

EPPA*
*All information regarding EPPA taken from http://parallel.vub.ac.be/research/parallel_performance/
EPPA
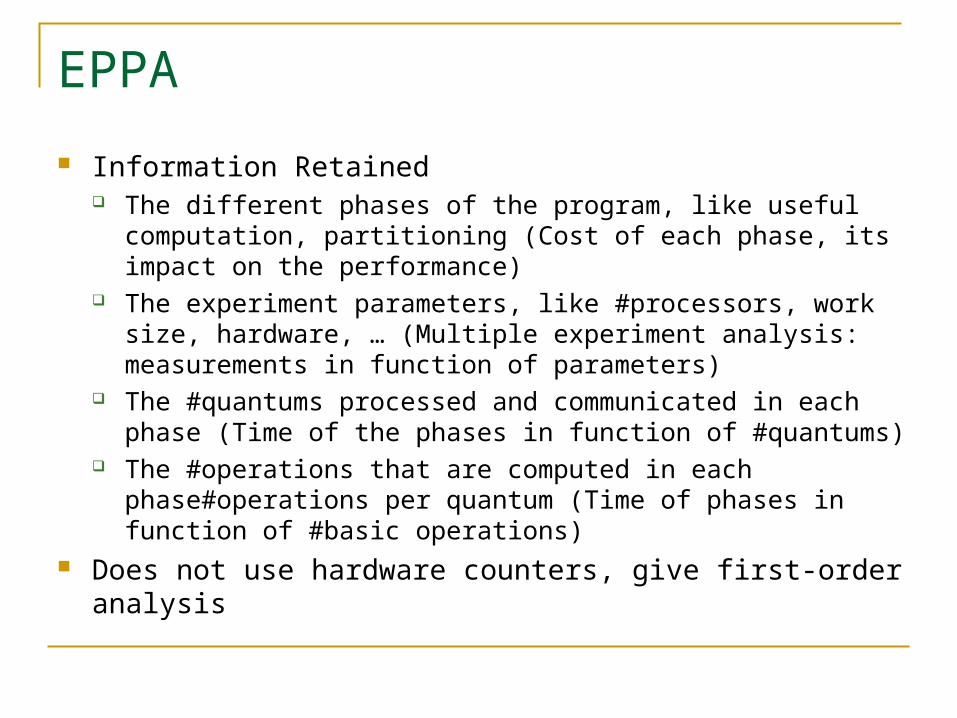
Information Retained The different phases of the program, like useful computation,
partitioning (Cost of each phase, its impact on the performance) The experiment parameters, like #processors, work size,
hardware, … (Multiple experiment analysis: measurements in function of parameters)
The #quantums processed and communicated in each phase (Time of the phases in function of #quantums)
The #operations that are computed in each phase#operations per quantum (Time of phases in function of #basic operations)
Does not use hardware counters, give first-order analysis

EPPA
EPPA
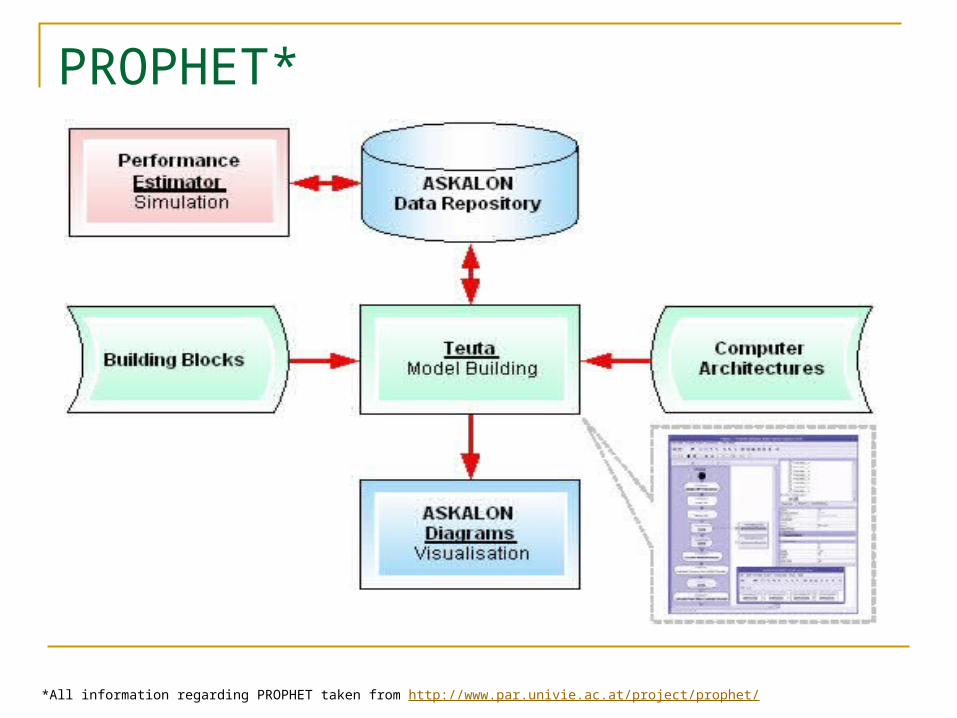
PROPHET*
*All information regarding PROPHET taken from http://www.par.univie.ac.at/project/prophet/

PROPHET
prediction of the performance behavior of parallel and distributed applications on cluster and grid architectures
Based on a UML model of an application and a simulator for a target architecture, one can predict the execution behavior of the application model

SCALEA*
*All information regarding SCALEA taken from http://www.par.univie.ac.at/project/scalea/

SCALEA
Profile/Trace Analysis Inclusive/Exclusive Analysis Load balancing Analysis Metric Ratio Analysis Execution Summary
Overhead analysis Region to Overhead Overhead to region
Analysis functions

AKSUM*
*All information regarding AKSUM taken from http://www.par.univie.ac.at/project/aksum/

AKSUM
Automatic performance bottleneck analysis tool Performance properties are normalized
Performance property name Threshold Reference code region

Prediction Tools
P3T performance estimator for HPF programs closely integrated with
VFCS The core part of P3T is centered around a set of parallel program
parameters (transfer time, number of transfers, computation time, etc.
Carnival attempt to automate the cause-and-effect inference process for
performance phenomena Network Weather Service
uses numerical models and monitored readings of current conditions to dynamically forecast the performance that various network and computational resources can deliver over a given time frame

Knowledge-based Tools
Autopilot aims at dynamically optimizing the performance of parallel
applications. Kappa-PI
knowledge-based performance analyzer for parallel MPI and PVM programs. The basic principle of the tool is to analyse the efficiency of an application and provide the programmer with some indications about the most important performance problem found in the execution

Organizations
APART - IST Working Group on Automatic Performance Analysis: Real Tools http://www.fz-juelich.de/apart-2/
Parallel Tools Consortium http://www.ptools.org/

Interesting Ideas
Tool that facilitate going from one system to another