Embed Size (px)
Citation preview


Performance Metrics and Their Link to Value
2
Performance Metrics and Their Link to Value
Published by
Farient Advisors
55 E. 59th Street, Suite 12B
New York, NY 10022
646-626-6920
www.Farient.com
Sponsored by
The State Board of Administration of Florida
Authors
Robin Ferracone, Chief Executive Officer, Farient Advisors
Jack Zwingli, Leader, Information Services, Farient Advisors
Copyright © 2013 Farient Advisors LLC, which is solely responsible for its content. All rights reserved. No part of this
report may be reproduced, stored in a retrieval system, or transmitted in any form, by any means, without written
permission.

Performance Metrics and Their Link to Value
3
Background on Research Provider
Farient Advisors LLC is an independent executive compensation and performance consultancy which helps
clients make performance enhancing and defensible executive compensation decisions that are in the best
interests of their shareholders. Farient provides a comprehensive array of executive compensation and
performance advisory services, including compensation strategy and planning, program design, decision
support, process support, and other services including board of director compensation, technical reviews,
investor communications, and assistance in transactional situations. In addition, based on its extensive data
base covering the Russell 3000, Farient offers a proprietary performance and pay Alignment Model to help
assess, improve, and convey pay and performance alignment. Farient Advisors was founded in 2007 and
has offices in Los Angeles and New York. Farient also is affiliated with Kepler Associates, a London-based
firm.
Background on Data Provider
Data for this research report is provided by Incentive Lab, a financial data and science firm that focuses on
providing clients with superior data and essential insight into their executive compensation practices.
Incentive Lab’s proprietary compensation data and their team of world-class academicians and analysts
deliver unparalleled depth and insight into executive compensation.

Performance Metrics and Their Link to Value
4
Table of Contents
Executive Summary ............................................................................................................................................ 5
Key Findings and Conclusions ........................................................................................................................ 5
Recommended Actions .................................................................................................................................. 6
Introduction ....................................................................................................................................................... 7
Profile of Data and Research Universe .......................................................................................................... 8
Chapter I: Trends in Equity Compensation ...................................................................................................... 13
Equity Award Types...................................................................................................................................... 13
Performance-based Equity .......................................................................................................................... 14
Pay Mix ......................................................................................................................................................... 17
Chapter II: Trends in Performance Metrics ...................................................................................................... 18
Performance Metrics in Equity LTIs ............................................................................................................. 18
Specific Financial Performance Metrics ....................................................................................................... 19
Performance Metrics by Industry, Size, and Valuation Premiums .............................................................. 21
Chapter III: Trends in Relative vs. Absolute Benchmarks ................................................................................ 26
Absolute and Relative Performance Benchmarks ....................................................................................... 26
Comparisons Used for Relative Benchmarks ............................................................................................... 27
Relative Performance-based Equity LTIs by Industry, Size, and Valuation Premium .................................. 28
Chapter IV: Metrics Most Correlated with TSR ................................................................................................ 30
Chapter V: The Extent to Which Companies Are Using Metrics That Best Correlate with TSR ....................... 34
Which Metrics Correlate Best to TSR by Industry? ...................................................................................... 39
What Are the Greatest Areas of Improvement for Each Industry? ............................................................. 40
Key Takeaways ................................................................................................................................................. 43
Key Findings and Conclusions ...................................................................................................................... 43
Recommended Actions ................................................................................................................................ 44

Performance Metrics and Their Link to Value
5
Executive Summary
One clear outcome from Say on Pay voting on executive compensation has been a focus on pay for
performance. To determine how well executives are aligned to the long-term performance of their
companies, investors are evaluating to what extent executive compensation, particularly for the CEO, is
linked to company performance, as opposed to being based on the passage of time – what is sometimes
referred to as “pay for pulse.”
As the prevalence of performance-based compensation rises, it is incumbent upon boards to become
increasingly discerning about how that performance is being measured. The performance metrics selected,
as determined by the company and its board of directors, are deemed to be the best measures of corporate
success. Investors and other interested stakeholders wish to validate that these metrics are in fact linked to
Total Shareholder Return, or TSR.
Shareholders are increasingly augmenting the discussion on how much compensation is performance-based
with how that performance is being measured. They want to understand what metrics are used in
performance-based long-term incentive (LTI) plans, why those measures were chosen, and how
performance against those measures impacts shareholder value.
This groundbreaking research covers 1,800 companies, 24 Industry Groups, and fourteen years of data
(from 1998-2011). It identifies the primary metrics used in executive compensation plans, overall and by
industry, company size, and valuation premiums, and then tests these metrics to determine whether the
metrics being used have the highest impact on TSR results. It provides the most definitive answer to date
on a critical question: “Are companies choosing their long-term incentive (LTI) metrics wisely for the most
sustainable benefit to shareholders?”
Key Findings and Conclusions
Executive compensation design has moved towards long-term incentive (LTI) components in an
attempt to align management interests with those of long-term shareholders; further, those LTIs
are now largely performance-based
Among companies using performance-based LTIs, most (53%) use a mix of TSR and financial
measures in their equity LTI plans; others (28%) use financial measures only; and a smaller minority
(15%) use TSR only. This use rate puts a premium on getting the financial measures right
In aggregate, performance metrics are generally well-aligned with shareholder value. Earnings
Growth, followed by Returns and Revenue Growth, has the greatest impact on TSR. In general, this
matches the use patterns for financial metrics in LTIs: Earnings Growth is the most popular financial
measure, followed by Returns and Revenue Growth. TSR (usually measured on a relative basis) is
used as a direct measure of shareholder value in over 40% of companies with performance-based
LTIs
Many industries have a number of metrics to choose from. Half of the 24 Industry Groups have at
least three metric categories with strong correlations
Performance Metrics and Their Link to Value
6
However, the optimal use of measures differs considerably by industry. Industry Group, in general,
as an indicator of business model, has the strongest influence on performance metrics used, with
size and valuation premiums having little impact on metric selection
The good news is that half of the 24 Industry Groups use metrics that most highly correlate to
value, and also use TSR as a direct measure of shareholder value
The bad news is that the other half of Industry Groups could use some improvement. The
companies in these industries either are not using the metrics that are most strongly correlated to
value or, when the overall correlations of financial metrics to shareholder value are poor, they are
not sufficiently using TSR as a direct measure of shareholder performance. More specifically, the
most significant improvement opportunities in these industries include:
- Greater need to use TSR directly when correlations to value are poor
- Need to balance growth with a greater use of efficiency measures, like Returns and/or Margins
- Greater need to take capital investments into account, not just the earnings from those investments
- Recognition that Revenue Growth can be a close second in correlation to value compared to
Earnings Growth, offering the opportunity to supplement Earnings with Revenue Growth if
indicated by the company’s strategy and growth opportunities
Recommended Actions
We predict that metrics will become increasingly important and visible as investors and executives try to
better align executive incentives with shareholder interests. This analysis suggests some key steps that
investors and companies should take in order to improve that alignment. These include:
Companies should undertake their own analysis to determine which measures of performance have
the most influence on their shareholder value. In this regard, various measurement definitions
(e.g., how depreciation, capital expenditures, asset definitions, and other items are treated) could
make a significant difference to shareholder value and should be given careful consideration
Companies should try to find two or three key metrics that appropriately balance growth and
returns and demonstrate a proven link to value. However, if overall correlations to value are poor,
or only one financial metric correlates to value, then companies should choose a single financial
metric, non-financial metrics, and/or TSR, and should support this choice with a strong rationale
Investors are likely to increase engagement activities around executive compensation in general,
and specifically on performance metrics. In communicating with investors, companies should
present (and investors should expect) compelling evidence as to how various measures of
performance will lead to enhanced shareholder value
* * * * *
We hope that this analysis is illuminating for investors and companies alike, and that it contributes to the
quality of the dialog around how incentive programs, and the metrics that drive them, can enhance
shareholder value and support the alignment between pay and performance.

Performance Metrics and Their Link to Value
7
Introduction
One clear outcome from Say on Pay voting on executive compensation has been a focus on pay for
performance. To determine how well executives are aligned to the long-term performance of their
companies, investors are evaluating the extent to which executive compensation, particularly for the CEO,
is linked to company performance, as opposed to being based on the passage of time – what is sometimes
referred to as “pay for pulse.”
Performance is viewed by most investors as encompassing results over the long term, defined as three
years or more. Executive compensation design has moved towards long-term incentives (LTIs) in an attempt
to align management interests with those of long-term shareholders. According to research conducted by
Farient Advisors, equity LTIs (stock options, restricted stock (or units), and performance shares (or units))
now comprise over half of total compensation for CEOs in the S&P 1500, as shown in the graph below.
(1) Based on Summary Compensation Table data
The prevalence of performance-based equity (i.e., equity that vests based on performance vs. time) has
shifted dramatically over the past decade, with approximately 70% of companies offering performance-
based equity today, up from 20% ten years ago. As the prevalence of performance-based compensation
rises, it is incumbent upon boards to become increasingly discerning about how that performance is being
measured. The performance metrics selected, as determined by the company and its board of directors, are
deemed to be the best measures of corporate success. Investors and other interested stakeholders wish to
validate that these metrics are in fact linked to Total Shareholder Return (TSR), defined as stock price
appreciation plus dividends, as if those dividends had been reinvested in the company’s stock.
12%
21%
11%
56%
2011 Pay Mix (1)
S&P 1500 Companies
Base Salary
Cash Incentives (Bonuses/Cash LTIs)
All Other (incl. Pension/Deferred)
Equity LTIs

Performance Metrics and Their Link to Value
8
To conduct this research, we identified the primary metrics being used in executive compensation plans,
overall and by industry, company size, and valuation premiums. We then tested the extent to which those
metrics correspond to TSR to help answer the question, “Are companies choosing the right performance
metrics?”
TSR is not the only measure of performance, of course, but it is a primary focus of shareholders and
management. The box on page 8 provides a perspective on how TSR is viewed by investors and companies.
Profile of Data and Research Universe
The database used for this research was largely provided by Incentive Lab, which collects and analyzes data
on performance metrics. Data from 1998-2011 were used in the research, capturing the top 750 companies
in market capitalization for each year covered, for what comprised a database of over 1,800 companies.
Data on performance metrics were supplemented by additional data provided by Farient Advisors on
executive pay trends. Farient conducted an in-depth analysis based on its experience analyzing and
developing pay programs and performance measurement systems that link to shareholder value.
In conducting this research, Farient analyzed companies by Industry (as indicated by their 2- and 4-digit
Global Industrial Classification Standard Codes (GICS)), size (as indicated by market capitalization), and
valuation premiums (i.e., the premium of the market value over the book value of the company ). This
research is intended to identify patterns, trends, and data relationships across the broad categories, but not
to draw conclusions about specific companies. All data collected pertain to that for the Named Executive
Officers, as disclosed in company proxy reports to shareholders.
As indicated in the charts below, the companies in the performance measurement data set span all
industries, as well as a wide range of sizes (based on market capitalization) and valuation premiums (based
on market-to-book ratio). The valuation premiums split companies evenly into three equal groups – Growth
(i.e., those with valuation premiums of 2.7 or higher), Value (i.e., those with valuation premiums of 1.5 or
lower) and Neither (i.e., those with valuation premiums higher than 1.5 but lower than 2.7).
8%
7%
10%
17%
5%10%
18%
18%
3%4%
% of Companies by Industry (GICS) Sector
Energy
Materials
Industrial
Consumer Discretionary
Consumer Staples
Health Care
Financials
Information Technology
Telecomm Services
Utilities
22%
49%
29%
% of Companies by Market Capitalization
Small Cap <$1B
Mid Cap $1B-$5B
Large Cap >$5B

Performance Metrics and Their Link to Value
9
Choosing the Right Performance Measures A Portfolio Approach to Performance Measurement
The board is elected directly by shareholders to grow the value of the enterprise, and in doing so, to protect shareholder interests. In turn, the board hires CEOs and their top teams to make it happen. These top managers are agents who perform their jobs on behalf of the investors. Within this context, the most important indicator of long-term success, and ultimately of executive performance, is total shareholder return (TSR). The potential for generating a competitive TSR, relative to the risks taken, is the most important reason investors buy shares in a company. TSR is a good indicator of whether and how much value is being created by a company’s top management team. It also is a good, overall measure of performance outcomes.
At the same time, the sustained financial results of the company generally drive TSR. Because each business is different, not all financial measures link to shareholder value in the same way. The key is to find which financial measures of performance have the most influence on value, and then tie incentives to these measures. There is value in tying incentives to financial measures, and not just directly to TSR, since executives generally have better line-of-sight to the financial performance of the company than to stock price performance. In the long run, tying executives to the right financial measures essentially holds executives accountable for TSR.
Supplementing TSR and financial measures with strategic measures that indicate sustainability of success—things like customer satisfaction, operational achievements, employee engagement, and risk — can be important as well. These factors might not show up in the current stock price, but they likely will over time. Supplementing TSR with financial and strategic measures is a “portfolio approach” to performance measurement, depicted in the exhibit below. It shows how long-term TSR is a strong factor in assessing executive performance and pay, since it is most directly aligned with shareholder interests, and measures the ultimate result for shareholders. But it also shows that no one measure likely will tell the whole story.
Excerpt from Fair Pay, Fair Play: Aligning Executive Performance and Pay, Jossey Bass, 2010
Performance Measures
Overall Management Performance
Total Shareholder
Return
Absolute Performance Goals Financial Sustainable
- Strategic - Governance - Environmental - Operational - Risk Management - Workforce - Others
Relative Performance Goals TSR Financial Market

Performance Metrics and Their Link to Value
10
Organization of Research Results
We have organized our findings broadly into five chapters: (1) trends in equity compensation; (2) trends in
the use of various performance metrics; (3) trends in relative vs. absolute benchmarks; (4) metrics most
correlated with TSR; and (5) the extent to which companies are using metrics most correlated with TSR.
Chapter I: Trends in Equity Compensation
Specifically, the Trends in Equity Compensation chapter is arranged as follows:
Equity award types – trends in the use of stock options compared to “full-value” shares, which are
defined to include both restricted shares or units (time-based) and performance-based shares or
units, and current use by industry, size, and valuation premiums
- Full-value shares are shares that vest (i.e., are earned) on the basis of either continued
employment with the company over a given period of time, and/or on the basis of meeting
pre-determined performance conditions
- Stock options provide the right to purchase a share of stock at a given price over a given
period of time, subject to vesting restrictions (usually time-based, but can be performance-
based), thereby providing the recipient the opportunity to earn an amount equal to the
appreciation in that stock
Performance-based Equity – trends in use of performance-based (vs. time-based) equity and
current use by industry, size, and valuation premium
Pay Mix – current use of different pay components (e.g., salary, cash incentives and LTIP awards) by
industry
Chapter II: Trends in Performance Metrics
To analyze trends in performance metrics, we grouped specific metrics into the broader categories, shown
below, to simplify our discussion and presentation of metrics, where appropriate. These broader
categories, or Metric Types, will be used to summarize results throughout this report.
Specifically, the Trends in Performance Metrics chapter is arranged as follows:
Performance Metrics – trends in the use of various metrics
Specific Financial Performance Metrics – trends in the use of specific financial metrics
Performance Metrics by industry, size, and valuation premiums – current use of various metrics by
industry, size, and valuation premiums
The following table summarizes the broader Metric Types and the more specific Metrics used in this report.

Performance Metrics and Their Link to Value
11
Chapter III: Trends in Relative vs. Absolute Benchmarks
Specifically, the Trends in Relative vs. Absolute Benchmarks chapter is arranged as follows:
Absolute and Relative Performance Benchmarks – trends in use of absolute vs. relative benchmarks
for determining the number of performance shares earned
Comparisons Used for Relative Benchmarks– trends in the type of benchmark used (peer group vs.
index (or companies in the index))
Relative Performance-based Equity Awards – current use of relative benchmarks by industry, size,
and valuation premiums
Chapter IV: Metrics Most Correlated with TSR
To determine which metrics are most correlated with TSR, we analyzed the correlations between financial
measures of performance and TSR over 3- and 5-year rolling periods, using the 1998 to 2011 data set. To
conduct the correlation analysis, we tested over 20 specific financial measures. Non-financial metrics, such
as “Individual Performance” and “Other,” were not included in the analysis. We also tested static as well as
Metric Type Metric
TSR Total Shareholder Returns: Stock Price Appreciations, including Dividends
Earnings Growth Earnings: Income Before Extraordinary Items
EBITDA: Earnings Before Interest, Taxes, Depreciation, and Amortization
EBIT: Earnings Before Interest and Taxes
EBT: Earnings Before Taxes
EPS: Earnings Per Share
Earnings Margins Various Earnings Measures (EBITDA, EBIT, etc.) ÷ Revenues
Returns ROA: Return on Assets
ROE: Return on Equity
ROIC: return on Invested Capital
EVA Economic Value Added: Net Operating Profit After Tax - Capital Charge
Cash Flow Cash Flow from Operations
Funds from Operations
Free Cash Flow growth
Revenues (Sales) Revenues (Sales)
Sales Contracts
Same Store Sales
Individual Individual Performance
Other Book Value
Cost Reduction
Customer Satisfaction
Debt-related
FDA Approval
IPO of Subsidiary
Operational
Working Capital
Others

Performance Metrics and Their Link to Value
12
dynamic growth measures. For example, we tested both earnings as a percent of sales (a static measure) as
well as earnings growth (a dynamic measure).
Specifically, this chapter explores the correlation results, i.e., which measures of performance correlate
most closely with TSR by the 24 GICS Industry Groups. It is important to note that correlation does not infer
causality. Since we are measuring correlations between financial metrics and TSR over contemporaneous
time periods, some of the correlations may be due to a large number of companies adopting the same
metrics and executives increasing their focus to deliver better results on those metrics. In addition, we
recognize that there is a bias in the correlation analysis, since growth measures, like Earnings Growth and
Revenue Growth, are dynamic measures, just like TSR. Dynamic measures gauge performance from period
to period, while static measures gauge performance within a period. Correlating dynamic measures with
TSR, which is itself a dynamic measure, vs. correlating static measures with TSR, favorably advantages the
dynamic measures in the analysis.
Chapter V: The Extent to Which Companies Are Using Metrics That Best Correlate with TSR
To determine the extent to which companies are using metrics that most closely correlate to TSR, we
compared the list of most frequently used performance metrics to the list of metrics that most closely
correlate to TSR by Industry Group.
In this final chapter, we show which industries generally are using and which are not using those measures
that most closely relate to shareholder value. In addition, we share our observations on areas for
improvement by Industry Group.
Key Takeaways
In our closing remarks, we discuss the key takeaways from our analysis for investors as well as issuers.

Performance Metrics and Their Link to Value
13
Chapter I: Trends in Equity Compensation
Equity Award Types
In the late 1990s, stock options were the equity vehicle of choice. Nearly all companies (95%) offered stock
options. The popularity of stock options was, in part, driven by the run-up of stock prices in the 1980s and
90s, making these vehicles tremendously valuable to many recipients. In addition, stock options, unlike full
value shares, did not have to be charged to earnings, which was an added benefit in the eyes of many
companies. As a result, the use of full value shares (i.e., restricted shares and performance shares (or units))
was minority practice (39%).
But all of that changed in the early 2000s due primarily to three factors. First, the stock market plummeted
in 2000 and 2001, causing options to have less real and perceived value among recipients. Second, in 2006,
the Financial Accounting Standards Board required stock options to be charged to earnings, making them
no longer seem “free.” And third, following the deep economic recession of 2008 and 2009, investors were
less enthusiastic about encouraging executives to take on increased risks though the issuance of high risk
compensation vehicles like stock options. In the aggregate, this “perfect storm” caused a significant decline
in the use of stock options, coupled with an increase in the use of less risky equity vehicles in the form of
full value shares.
Today, the tables are turned. About 95% of companies use full value shares, while approximately two-thirds
of companies use stock options, as shown in the table below.
95%
64%
39%
94%
0%
10%
20%
30%
40%
50%
60%
70%
80%
90%
100%
1998 1999 2000 2001 2002 2003 2004 2005 2006 2007 2008 2009 2010 2011
Pe
rce
nt
of
Tota
l C
om
pan
ies
Usi
ng
Equ
ity
Aw
ard
s
Trends in the Use of Equity Vehicles
% Options % Full value shares

Performance Metrics and Their Link to Value
14
From an industry perspective, the use of full value shares is consistently high across all Industry Sectors,
with 90% or more of companies using full value shares across all Sectors. Options, on the other hand, are
much more prevalent in some industries compared to others. For example, options have the lowest
prevalence in the Utilities, Financial Services, and Telecommunications industries. This is because Utilities,
Telecommunications, and some Industry Groups within Financial Services, such as Real Estate, offer
relatively high dividend yields. Stock options do not give credit for dividends, whereas full value shares do.
This, in turn, explains the low incidence of stock options in these industries. In addition, financial services
companies are highly sensitive to managing the extent to which their incentive programs encourage risk-
taking. As a result, restricted stock is a more palatable pay vehicle since it is inherently less risky than stock
options.
The use of options appears most closely linked to industry, rather than to company size and valuation
premiums (at least within the universe of companies included in this analysis). As a result, the strategic and
financial business characteristics of the organization seem to be more important than size or valuation in
explaining the use of equity incentive vehicles.
Performance-based Equity
While the percentage of companies using time-based equity awards has remained relatively stable, the use
of performance-based awards has risen sharply since 2002. Most of the time-based awards are in the form
of stock options and full value restricted shares, while most of the performance-based awards are in the
0%
10%
20%
30%
40%
50%
60%
70%
80%
90%
100%
% o
f A
ll C
om
pan
ies
wit
h L
TIP
s
Prevalence of Equity LTIs - Options vs. Full Value Shares2011 data, by GICS Sector, Market Cap and Growth/Value
% Options % Full value shares

Performance Metrics and Their Link to Value
15
form of performance shares. A decade ago, approximately 20% of S&P 1500 companies offered equity LTIs
that vested on the basis of performance. Today, nearly two-thirds of companies offer such awards. If long-
term cash awards are included, the percentage of companies offering performance LTIs is approximately
70%. Interestingly, the use of performance shares (units) is generally supplementing the use of time-based
options and restricted shares, not replacing them.
The more prevalent use of performance plans is driven by a number of factors:
1. Pay for Performance – there is greater pressure by investors to align pay with performance. This
makes sense given the increase in executive compensation over the years, largely through the
addition of long-term incentives, and the drive by investors to make those LTIs count for something
2. Sustainability – there is a heightened interest among investors to ensure that performance is
sustainable. Putting greater performance focus on long-term incentives is a way to deliver pay only
when performance is sustainable
3. Financial – under IRS code 162(m), compensation over $1 million to the Named Executive Officers
(excluding the CFO) is deductible by the company only if that compensation is considered to be
“performance-based.” Performance-based full value shares, if structured properly, are deductible,
while restricted shares are not
4. Management focus – companies see performance-based equity as a way to focus executives on
long-term performance
96%
89%
22%
64%
0%
10%
20%
30%
40%
50%
60%
70%
80%
90%
100%
1998 1999 2000 2001 2002 2003 2004 2005 2006 2007 2008 2009 2010 2011
Pe
rce
nt
of
Tota
l C
om
pan
ies
Usi
ng
Equ
ity
Aw
ard
s
Prevalence of LTIP Equity Awards by Type
% Time-based % Performance-based

Performance Metrics and Their Link to Value
16
5. Diversification – companies also see performance equity as a way to diversify risk by rewarding for
long-term financial, strategic, and/or other performance factors, as well as stock price performance
(which is captured by the equity vehicle itself)
As shown in the graph below, time-based equity is used by nearly all companies across all industries, sizes,
and valuation premiums. In contrast, the use of performance-based equity varies considerably. Generally,
companies in industries with more stable and predictable business models (e.g., Consumer Staples) and
those in industries in which relative benchmarks can more readily be identified (e.g., Utilities) tend to make
higher use of performance-based equity. However, there are some industries in which less emphasis is put
on performance-based equity. Financial Services and Energy are two examples, but for different reasons.
Financial Services traditionally has used equity as a way to reward for short-term performance that has
already occurred. Energy, on the other hand, is heavily affected by commodity prices, and in these cases,
performance-based equity may not be viewed as an effective incentive.
In the case of performance-based equity, size matters. Larger cap companies tend to make greater use of
performance-based equity than smaller-cap companies. This likely is the case for two reasons: (1) it is
generally easier to set long-term goals in larger, more mature environments, rendering performance-based
equity a more effective incentive, and (2) investors are putting greater pressure on larger vs. smaller cap
companies to strengthen their pay for performance alignment since large cap companies have such a
disproportionate impact on the performance of their portfolios.
0%
10%
20%
30%
40%
50%
60%
70%
80%
90%
100%
% o
f A
ll C
om
pan
ies
wit
h L
TIP
s
Incidence of Time-based vs. Performance-based LTIP2011 data, by GICS Sector and Market Cap
% Time-based % Performance-based

Performance Metrics and Their Link to Value
17
Pay Mix
As noted earlier, pay mix has been trending toward a greater use of equity LTI compensation. In addition,
pay mix varies by industry. The heaviest users of equity LTI are the Information Technology and
Telecommunications Industry Sectors, with over half of total compensation value delivered through equity
vehicles. The lightest users of equity incentives are the Industrials, Materials, and Utilities Sectors, with less
than 40% of total compensation value delivered through equity vehicles.
14%
23% 23%
11%
21%16% 14%
9%
17%
26%
11%
15% 14%
13%
13%
15%15%
16%
10%
13%
28%
21%29%
27%
24%25%
24%
21%20%
19%
25% 13%
13%
17%
18%
15%
29%
25%25%
11%
14%22%
13%
20%
17%
16%
9%
19%
26% 29%
8% 6% 8%13%
6%
13%9% 10%
2% 2%
0%
10%
20%
30%
40%
50%
60%
70%
80%
90%
100%
2011 Performance-Adjusted Compensation by Pay Component
Stock Options
Performance Shares
Restricted Stock
Cash Incentives
Salary
Pension/Other
Equ
ity incen
tivesV
ariable
Pay
Fixed P
ay
Performance Metrics and Their Link to Value
18
Chapter II: Trends in Performance Metrics
Performance Metrics in Equity LTIs
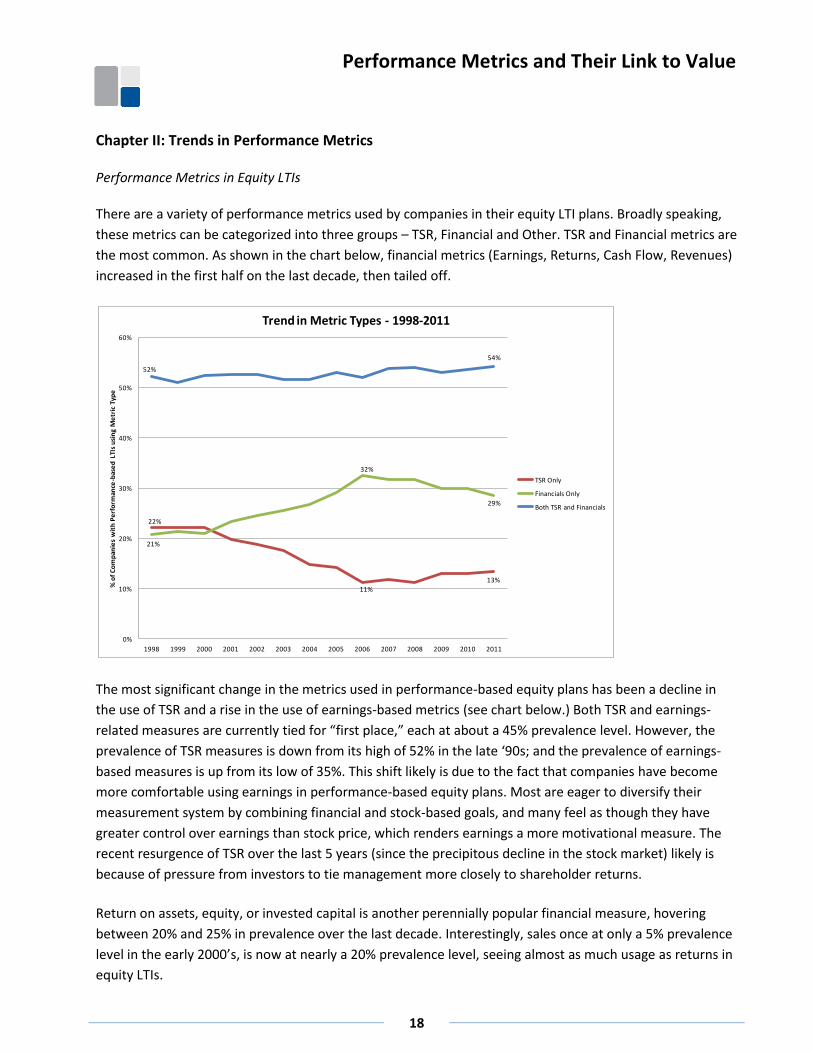
There are a variety of performance metrics used by companies in their equity LTI plans. Broadly speaking,
these metrics can be categorized into three groups – TSR, Financial and Other. TSR and Financial metrics are
the most common. As shown in the chart below, financial metrics (Earnings, Returns, Cash Flow, Revenues)
increased in the first half on the last decade, then tailed off.
The most significant change in the metrics used in performance-based equity plans has been a decline in
the use of TSR and a rise in the use of earnings-based metrics (see chart below.) Both TSR and earnings-
related measures are currently tied for “first place,” each at about a 45% prevalence level. However, the
prevalence of TSR measures is down from its high of 52% in the late ‘90s; and the prevalence of earnings-
based measures is up from its low of 35%. This shift likely is due to the fact that companies have become
more comfortable using earnings in performance-based equity plans. Most are eager to diversify their
measurement system by combining financial and stock-based goals, and many feel as though they have
greater control over earnings than stock price, which renders earnings a more motivational measure. The
recent resurgence of TSR over the last 5 years (since the precipitous decline in the stock market) likely is
because of pressure from investors to tie management more closely to shareholder returns.
Return on assets, equity, or invested capital is another perennially popular financial measure, hovering
between 20% and 25% in prevalence over the last decade. Interestingly, sales once at only a 5% prevalence
level in the early 2000’s, is now at nearly a 20% prevalence level, seeing almost as much usage as returns in
equity LTIs.
22%
11%
13%
21%
32%
29%
52%
54%
0%
10%
20%
30%
40%
50%
60%
1998 1999 2000 2001 2002 2003 2004 2005 2006 2007 2008 2009 2010 2011
% o
f C
om
pan
ies
wit
h P
erf
orm
ance
-bas
ed
LTI
s u
sin
g M
etr
ic T
ype
Trend in Metric Types - 1998-2011
TSR Only
Financials Only
Both TSR and Financials

Performance Metrics and Their Link to Value
19
“Other” metrics often are more specific financial/accounting metrics, such as inventory levels, but also
include non-financial, operational and other metrics, as summarized in the table below:
Examples of “Other” Metrics
In aggregate, “Other” metrics have been on the rise in recent years, probably because they tell a story
about the specific strategic initiatives on which companies are focusing. Moreover, investors have made it
clear that they appreciate a strong tie to the strategic priorities of the organization.
Specific Financial Performance Metrics
The following charts provide a more detailed look at trends in the use of specific metrics. We look at the
trend in the two broadest categories of metrics, Earnings and Returns. In terms of earnings metrics, the
36%
47%
52%
44%
0%
10%
20%
30%
40%
50%
60%
1998 1999 2000 2001 2002 2003 2004 2005 2006 2007 2008 2009 2010 2011
% o
f C
om
pan
ies
wit
h P
erf
orm
ance
-bas
ed
LTI
s u
sin
g M
etr
ic T
ype
Trend in Metric Types - 1998-2011
Earnings
TSR
Returns
Other
Sales
Cash Flow
Margin
EVA
Individual Perf.
Common Category % of "Other"(1) General Industry-Specific
Retained Earnings Net Earned Premiums (Insurance)
Working Capital Inventory Turn Ratio (Retail)
Market Share Product Design Recognition (Semiconductors)
Succession Planning Product Quality (Capital Goods)
Efficiency Incidence Rate (Capital Goods)
Productivity Gains Efficiency Ratio (Utilities)
Varies Integrity (Utilities)
Varies Approval of Strategic Plan (Semiconductors)
(1) Estimated based on a detailed review of several industry groups
Examples
Financial/Accounting 40%
Non-Financial/Strategic 30%
Operations 22%
Other 8%
Performance Metrics and Their Link to Value
20
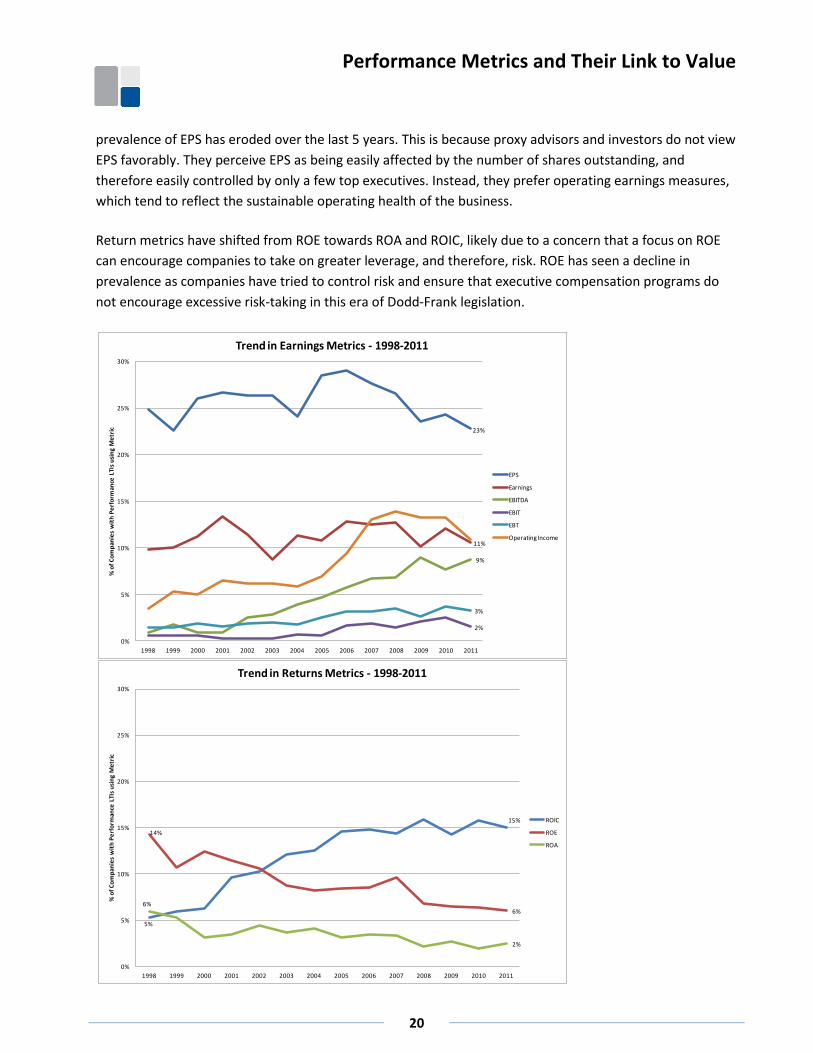
prevalence of EPS has eroded over the last 5 years. This is because proxy advisors and investors do not view
EPS favorably. They perceive EPS as being easily affected by the number of shares outstanding, and
therefore easily controlled by only a few top executives. Instead, they prefer operating earnings measures,
which tend to reflect the sustainable operating health of the business.
Return metrics have shifted from ROE towards ROA and ROIC, likely due to a concern that a focus on ROE
can encourage companies to take on greater leverage, and therefore, risk. ROE has seen a decline in
prevalence as companies have tried to control risk and ensure that executive compensation programs do
not encourage excessive risk-taking in this era of Dodd-Frank legislation.
23%
11%
9%
2%
3%
0%
5%
10%
15%
20%
25%
30%
1998 1999 2000 2001 2002 2003 2004 2005 2006 2007 2008 2009 2010 2011
% o
f C
om
pan
ies
wit
h P
erf
orm
ance
LTI
s u
sin
g M
etr
ic
Trend in Earnings Metrics - 1998-2011
EPS
Earnings
EBITDA
EBIT
EBT
Operating Income
5%
15%
14%
6%6%
2%
0%
5%
10%
15%
20%
25%
30%
1998 1999 2000 2001 2002 2003 2004 2005 2006 2007 2008 2009 2010 2011
% o
f C
om
pan
ies
wit
h P
erf
orm
ance
LTI
s u
sin
g M
etr
ic
Trend in Returns Metrics - 1998-2011
ROIC
ROE
ROA

Performance Metrics and Their Link to Value
21
Performance Metrics by Industry, Size, and Valuation Premiums
The top two metric types – Earnings and TSR – are generally consistent across sectors. Financial Services
and Information Technology are notable exceptions, with “Other” and Sales, respectively, being the most
prevalent second metric types, as shown in the three charts below. Information Technology companies use
Sales (i.e., top line growth) as a prevalent measure because these types of companies often are challenged
to build market share quickly.
(Percentages set to 100%, to make the industry sectors comparable; companies can have multiple metrics)
As shown in the following summary table, TSR is well represented as a performance metric, with 9 of the 10
industry sectors having TSR as the first or second most prevalent metric.
Rank of Metric Type by Industry Sector
21%37% 54%
57% 59% 39% 37% 40% 28% 52% 43%
50% 39%49%
36% 46%32% 40%
28%26%
89%40%
21%
23%
37%
27% 29%23%
30%
25% 19%
49%
28%
17%
35%
39%
20% 30%14%
23%
9% 12%
27%
21%
2%11%
23%18%
23%25%
7%
34%16%
2%
18%
10% 11%
18%16%
10% 11% 8%
9%16%
14%
12%
0%
10%
20%
30%
40%
50%
60%
70%
80%
90%
100%
% o
f To
tal
Pe
rfo
rman
ce-b
ase
d L
TIP
Me
tric
s U
sed
Metric Type by Industry SectorResults shown based on a proportional distribution to add to 100%
Vague
EVA
Individual Perf.
Margin
Cash Flow
Sales
Returns
Other
TSR
Earnings
Metric
Type Rank Energy Materials Industrial
Consumer
Discretionary
Consumer
Staples Health Care Financials
Information
Technology
Telecomm
Services Utilities Grand Total
First TSR TSR (tie) TSR (tie) Earnings Earnings Earnings TSR Earnings TSR TSR Earnings
Second Returns Returns (tie) Earnings (tie) TSR TSR TSR Other Sales Earnings (tie) Earnings TSR
Third Other Earnings Returns Returns Sales Sales Earnings TSR Returns (tie) Other Returns
Cash Flow (tie)
TSR Earnings Returns

Performance Metrics and Their Link to Value
22
To further explain any differences among industries, it is helpful to analyze the use of metrics at the
Industry Group level, which breaks down the ten Industry Sectors into 24 Industry Groups. At this level, the
reasons for the differences across industries become clearer. For example, the Financial Services Sector can
be divided into four Industry Groups: Banks, Diversified Financials, Insurance, and Real Estate, as shown in
the chart below. Companies within all Financial Services Groups, except Real Estate, focus on earnings, TSR,
“Other,” and Return-based measures. Insurance companies focus on “Other” measures that usually include
Book Value growth. Book Value growth, similar to ROE, measures the cumulative build-up of equity in the
business, which is a good indicator of financial health.
Similarly, ROE also is a good financial measure for Banks, as Banks need to leverage their balance sheet with
low-cost debt in order to earn a fair Return on Assets. Real Estate, however, is a different matter. Real
Estate companies are characterized by a high usage of TSR and “Other” measures, typically Funds From
Operations (FFO) or Adjusted Funds from Operations (AFFO). FFO is defined as Earnings before
Depreciation and Amortization, less gains on depreciable property sales. This measure makes sense for Real
Estate businesses since property rarely loses its value. AFFO goes a step further in that it subtracts out
capital expenditures required to maintain the properties. As a result, FFO and AFFO are better measures of
sustainable operating performance than Earnings for Real Estate businesses.
0%
10%
20%
30%
40%
50%
60%
70%
80%
90%
100%
% o
f To
tal
Pe
rfo
rman
ce-b
ase
d L
TIP
Me
tric
s U
sed
Metric Type by GIC GroupResults shown based on a proportional distribution to add to 100%
Vague
EVA
Individual Perf.
Margin
Cash Flow
Sales
Returns
Other
TSR
Earnings

Performance Metrics and Their Link to Value
23
A more specific look at this data set is contained in the tables below. Each table shows the top five metrics
used by companies in each of the 24 Industry Groups. Industry Groups are organized within the broader
Industry Sectors by row. The “%” column indicates the percentage of companies that use each metric
among those which have performance-based equity plans. The percentage numbers sum to more than
100% since companies use multiple metrics in their equity LTI plans.

Performance Metrics and Their Link to Value
24
Most Commonly Used Equity LTI Performance Metrics, Overall and by Industry Group
Organized Within Industry Sectors
Metrics % of Co's Common Metric Key
TSR 40% TSR
Other 26% Earnings
EPS 25% Returns
Sales 18%
Operating Income 17%
Metrics % of Co's Metrics % of Co's Metrics % of Co's Metrics % of Co's
TSR 50% TSR 39% TSR 26% TSR 89%
Other 21% EPS 22% Other 19% Other 43%
ROIC 14% ROIC 26% EBITDA 18% EPS 37%
Cash Flow 10% Other 21% Sales 16% Earnings 25%
Operating Income 8% Earnings 12% Cash Flow 16% Operational 21%
Metrics % of Co's Metrics % of Co's Metrics % of Co's
TSR 51% TSR 43% TSR 52%
Other 36% EPS 36% ROIC 35%
EPS 35% Other 34% Other 32%
ROIC 25% Sales 27% Earnings 29%
Sales 26% ROIC 20% EPS 26%
Metrics % of Co's Metrics % of Co's Metrics % of Co's Metrics % of Co's Metrics % of Co's
TSR 48% EPS 52% TSR 34% TSR 32% TSR 31%
Cash Flow 35% TSR 50% EPS 26% EPS 24% Other 31%
ROIC 30% Sales 42% Other 19% Cash Flow 24% EPS 28%
Other 30% Other 36% ROIC 15% EBITDA 17% Earnings 28%
Earnings 30% Operating Income 34% Earnings 15% Other 12% EBITDA 21%
Metrics % of Co's Metrics % of Co's Metrics % of Co's
ROIC 35% TSR 50% TSR 56%
EPS 35% EPS 50% Sales 38%
TSR 30% Other 33% Operating Income 38%
Sales 26% ROIC 24% ROIC 31%
Earnings 22% Operating Income 22% EPS 31%
Metrics % of Co's Metrics % of Co's
EPS 33% TSR 34%
TSR 30% Other 26%
Sales 25% Sales 26%
Other 17% EPS 20%
Earnings 14% Earnings 15%
Metrics % of Co's Metrics % of Co's Metrics % of Co's Metrics % of Co's
EPS 33% TSR 39% Other 43% TSR 58%
ROE 31% EPS 27% TSR 42% Funds From Oper. 32%
TSR 27% Other 23% EPS 29% Other 25%
Other 25% ROE 18% Operating Income 28% Individual 14%
Earnings 13% Earnings 16% ROE 26% Operating Income 6%
Metrics % of Co's Metrics % of Co's Metrics % of Co's
Sales 33% TSR 34% Sales 40%
TSR 24% Sales 32% Other 36%
EPS 20% Other 25% TSR 30%
Operating Income 18% EPS 22% Operating Income 28%
Other 17% Operating Income 21% Earnings 23%
Co
nsu
me
r St
aple
sH
eal
th C
are
Fin
anci
als
Info
rmat
ion
Tech
no
logy
Sin
gle
-Gro
up
Sect
ors
Health Care Equip & Services
Automobiles and Components Consumer Durables & Apparel Consumer Services
Software & Services
Banks
Semiconductors & EquipmentTech Hardware & Equipment
Diversified Financials Insurance Real Estate
Materials
Pharma, Biotech & Life Sci
Retailing
Transportation
Media
UtilitiesTelecommunication Services
Food & Staples Retailing Food, Beverage & Tobacco Household & Personal Pdts
Energy
Capital Goods Commercial & Prof Services
Grand Total
Ind
ust
rial
Co
nsu
me
r
Dis
cre
tio
nar
y

Performance Metrics and Their Link to Value
25
While we see differences in the use of metrics by Industry Sector and Group, in contrast, we do not see
near as many differences by company size or valuation premiums, as shown in the charts below. On the
margin, however, large cap companies tend to use Returns more frequently than small cap companies, and
small cap companies tend to use Sales more often than mid to large cap companies. Similarly, TSR is used
more frequently by companies with lower valuation premiums, while Sales is used more frequently by
companies with higher valuation premiums.
In summary, it is clear that Industry Group, as an indicator of business model, has a more significant impact
on metric selection than company size or valuation premiums, at least across the universe of companies
contained in this study. Given our earlier discussion of why companies in certain industries tend to rely on
different metrics, these patterns make intuitive sense.
0%
10%
20%
30%
40%
50%
60%
70%
80%
90%
100%
Small Cap <$1B Mid Cap $1B-$5B Large Cap >$5B
% o
f P
erf
orm
ance
-bas
ed
LTI
P M
etr
ics
Use
d
Metric Type by Market Capitalization
Vague
EVA
Individual Perf.
Margin
Cash Flow
Sales
Return
Other
TSR
Earnings
0%
10%
20%
30%
40%
50%
60%
70%
80%
90%
100%
Value Neither Growth
% o
f P
erf
orm
ance
-bas
ed
LTI
P M
etr
ics
Use
d
Metric Type by Growth/ValueBased on Market-to-Book Ratio
Vague
EVA
Individual Performance
Margin
Cash Flow
Sales
Return
Other
TSR
Earnings

Performance Metrics and Their Link to Value
26
Chapter III: Trends in Relative vs. Absolute Benchmarks
Absolute and Relative Performance Benchmarks
Investors evaluate their portfolio companies on the basis of both absolute and relative TSR. Companies
often debate whether to pay their executives on the basis of absolute or relative performance, or both,
where absolute performance is measured on the basis of internal goals, usually an internal plan or
standard, and relative performance is measured against an externally-derived benchmark, such as a peer
group, an index, the company’s cost of capital, or other benchmark.
As shown in the chart below, absolute benchmarks tend to be more widely used than relative benchmarks.
Today, 80% of companies with performance-based equity plans use absolute measures and just under half
use relative measures. (These numbers sum to over 100% since some companies use both absolute and
relative measures in their equity plans.) The recent increase in the use of relative benchmarks is due to the
influence of proxy advisors and investors as advocates of relative measures.
A compelling case can be made for using either absolute or relative measures. The appropriateness of using
each often depends upon the unique circumstances of each company, as shown in the chart below. But
perhaps the primary explanation for using absolute measures is that they provide a greater focus on
specific performance outcomes, and therefore, have greater motivational value for use in incentive plans.
34%
45%
66%
80%
0%
10%
20%
30%
40%
50%
60%
70%
80%
90%
100%
1998 1999 2000 2001 2002 2003 2004 2005 2006 2007 2008 2009 2010 2011
% o
f C
om
pan
ies
wit
h P
erf
orm
ance
-bas
ed
LTI
P A
war
ds
Prevalence of Absolute and Relative Benchmarksfor Companies with Performance-based Equity
Relative Metrics Absolute Metrics

Performance Metrics and Their Link to Value
27
Absolute vs. Relative Benchmarks
Comparisons Used for Relative Benchmarks
The comparisons used for relative benchmarks have been trending toward a greater use of peer groups vs.
broad indices or other comparative benchmarks. Today, approximately two-thirds of companies with
performance-based equity plans use peer groups for performance comparisons, while one-third use the
S&P 500 index or other external benchmark. The trend toward peer groups is probably due to the fact that
companies expend considerable effort identifying credible peers that are representative of the company’s
business model and are subject to the same externalities as the company. It is worth noting that many
organizations use the companies in a particular index, rather than the index itself, in order to more easily
derive the 25th, 50th, and 75th percentiles for purposes of benchmarking performance.
Definition ▪Benchmark based on internal plans or standards ▪Benchmarks based on external references, such as a peer group,
index, or the cost of capital
When To Use ▪Companies with robust goal-setting processes ▪Companies with credible peer sets
▪Companies for which long-term standards of performance have
been developed and are accepted and understood
▪Companies subject to external uncontrollable variables, like
commodity prices or economic cycles
Companies focused on specific longer-run outcomes ▪Companies not more or less volatile than peer set
Advantages ▪Serves as a good focusing and communication tool ▪Achieves better pay for perofrmance alignment over time
▪Can be tailored to the unique requirements of the business ▪Forces competitive awareness
▪ Is motivational and highly relevant to management ▪Does not force public disclosure of internal information
Disadvantages ▪Requires organization to set longer-term goals, which can be
challenging, particulaly in volatile or uncertain environments
▪Can give false readings on performance if volatility is different from
comparator set
Absolute Benchmarks Relative Benchmarks
6358 57 55
6887
114 121 141 167 169 181 221 228
1819
1414
15
16
21 26 3539 41 37
40 47
35 3741 44
4142
45 48 56 60 63 70 76 73
0%
10%
20%
30%
40%
50%
60%
70%
80%
90%
100%
1998 1999 2000 2001 2002 2003 2004 2005 2006 2007 2008 2009 2010 2011
% o
f C
om
pan
ies
wit
h a
Re
lati
ve P
erf
orm
ance
-bas
ed
Aw
ard
Benchmark Used for Relative Awards
Peer Group S&P 500 Other Index

Performance Metrics and Their Link to Value
28
As suggested in the graph below, which superimposes the prevalence of TSR and Earnings metrics onto the
prevalence of relative and absolute benchmarks, a relative benchmark is most often used with TSR
measures, and an absolute benchmark (like a financial plan or a growth standard) is most often used with
Earnings measures.
The trend in the increase in the use of relative metrics is related to the trend in the type of metrics used in
recent years. As noted in the chart below, as TSR use has increased, the use of relative metrics showed
nearly identical rise. Concurrently, the drop in the use of earnings metrics mirrors the decline in absolute
metric use.
Relative Performance-based Equity LTIs by Industry, Size, and Valuation Premium
As shown in the chart below, the use of relative benchmarks varies significantly across industries, and also
by company size and valuation premiums. About half of large cap companies use relative benchmarks
compared to 36% for small cap companies; companies with low valuation premiums (47%) are more likely
to use relative benchmarks than those with high valuation premiums (36%). This makes sense since smaller,
high value, companies likely need to support their valuation premiums with more aggressive, internally
generated standards compared to the standards that would be set using external references.
0%
10%
20%
30%
40%
50%
60%
70%
80%
90%
100%
1998 1999 2000 2001 2002 2003 2004 2005 2006 2007 2008 2009 2010 2011
% o
f C
om
pan
ies
wit
h P
erf
orm
ance
-bas
ed
LTI
P A
war
ds
A Comparison of the Trend in Metric Use by Type (Earnings, TSR)With the Trend in Relative and Absolute Metric Use
TSR Metrics Earnings Metrics Relative Metrics Absolute Metrics

Performance Metrics and Their Link to Value
29
The use of TSR and relative benchmarks also is evident by industry. For example, as shown in the chart
below, companies in the Utilities Sector often use relative TSR in their equity LTIs since most are able to find
a robust set of credible peers, and TSR is a comprehensive measure that takes short- and long-term
considerations into account. Energy companies often use relative benchmarks in order to strip out the
effects of commodity prices on performance, something that they cannot control. In contrast, companies in
the Consumer Discretionary Sector are more likely to rely on absolute measures, often in recognition of
their unique business models and/or growth characteristics.
82%
62%
46%
26%28%
32%
47%
30%
50%
91%
36%
43%
51%47%
37%
0%
10%
20%
30%
40%
50%
60%
70%
80%
90%
100%
% o
f C
om
pan
ies
Wit
h a
Re
lati
ve P
erf
orm
ance
-bas
ed
Aw
ard
Relative Benchmarks in Equity LTIs By GICS Sector, Market Cap and Growth/Value

Performance Metrics and Their Link to Value
30
Chapter IV: Metrics Most Correlated with TSR
The increased use of performance-based LTIs makes it more important than ever for companies to select
appropriate performance metrics, i.e., metrics that correlate to shareholder value and align executives with
shareholder interests. To determine which financial measures have the greatest impact on shareholder
value, we tested the correlation of various financial measures to value for each of the 24 Industry Groups.
For ease of presentation, we grouped the measures into five measurement categories as follows:
1. Earnings Growth – 3-year compound annual growth rates (CAGR) for Net Income, various
definitions of Operating Income, and Earnings Per Share (EPS)
2. Revenue Growth – 3-year compound annual growth rate (CAGR) for Revenue
3. Returns – ROA, ROIC, ROE, and other measures (Operating and Net, but before Extraordinary
Items) that were divided by Assets. Returns can be important in that they take the investment, i.e.,
the balance sheet, into account
4. Cash Flow – Operating Cash Flow minus Capital Expenditures, measured either in terms of growth
or in terms of return (i.e., divided by assets). Cash Flow is important because it takes investment,
i.e., CapEx, into account
5. Earnings Margins – various Earnings measures (with combinations of Earnings before and after
Depreciation, Amortization, Interest, and Taxes – e.g., EBITDA), divided by Sales
We ranked the five categories of measures above from 1 to 5 for each Industry Group based upon which
measures have the greatest influence on TSR, as indicated by their correlation to value. Correlation
coefficients can range from -1.00 to 1.00, with positive numbers indicating a positive correlation – the
higher the number, the stronger the correlation. 1.00 is a perfect positive correlation; 0.00 is no correlation;
and -1.00 is a perfect negative correlation. We counted measures with correlation coefficients of > .25 that
also were statistically significant.
The table on the following page serves as a “quick guide” to indicate on which measures companies in a
given industry might focus. It shows the rank order of the correlations for each measurement category by
Industry Group, as well as the correlation coefficient that corresponds to how well each measure is
correlated with shareholder value in that Industry Group. In some cases, there were ties in the rankings of
metric types.Ranges of correlation coefficients are shown when more than one measure in the category
(e.g., both Net Income and Operating Income Growth) had a good correlation to value. Comments are
provided for each Industry Group to add insight.

Performance Metrics and Their Link to Value
31
Correlation of Measures of Performance to TSR - 1998 – 2011
GICS Sector/Industry Group Rank Correlation Rank Correlation Rank Correlation Rank Correlation Rank Correlation
▪ Overall, Industry Group has low correlations
▪ ROIC has the strongest correlation among Return measures
Energy 2 .29 - .32 1 .31 - .36 3 .21 - .23 ▪ Margin measures have a stronger correlation net of depreciation
(i.e., counting depreciation charges)
Materials 1 .44 - .51 2 .43 3 .29 - .42 4 .39 5 .30-.33 ▪ ROA has strongest correlation among Return measures
Industrials ▪ ROA has strongest correlation among Return measures
Capital Goods 1 .46 - .53 2 .39 3 .32 - .35 5 .30 4 .33 ▪ Margin measures have a stronger correlation net of depreciation
1 .45 - .53 2 .38 3 .26 - .29 ▪ Margin measures are strong both before and after depreciation
Transportation 2 .35 - .43 1 .48 - .57 4 .28 - .33 3 .27 - .36 ▪ All 3 Returns measures have high correlation; ROIC has the highest use
Consumer Discretionary ▪ ROE has stronger correlation among Return measures indicating some
Automobile and Components 1 .43 - .59 3 .43 2 .30 - .45 4 .35 tolerance for leverage
▪ Margin measures are strong both before and after depreciation
Consumer Durables & Apparel 1 .58 - .67 2 .66 4 .46 - .55 3 .57 ▪ ROE has low correlation suggesting low tolerance for leverage
▪ Revenue Growth plays a role in shareholder value
Consumer Services 1 .56 - .58 2 .31 4 .23 - .26 3 .28 ▪ Margin measures have a stronger correlation net of depreciation
▪ Industry Group has poor correlations, possibly because of diverse companies
Media 1 .30 - .36 2 .30 ▪ Cash Flow Margins show solid correlations
▪ Operating Income growth plays a role in shareholder value
▪ ROA and ROIC are equally strongly correlated to TSR, ROE less so
Retailing 1 .56 - .68 2 .49 3 .30 - .41 4 .31 - .36 ▪ Margin measures are strong both before and after depreciation
Consumer Staples ▪ Margin measures are strong both before and after depreciation
Food & Staples Retailing 1 .52 - .60 4 .37 3 .30 - .39 2 .55 5 .28 - .35 ▪ ROE is negatively correlated, suggesting the importance of operating the
business well, as opposed to leveraging the balance sheet
Food, Beverage & Tobacco 1 .51 - .61 2 .50 3 .28 ▪ Revenue Growth plays a role in shareholder value
▪ Capital expenditures is important
Household & Personal Pdts 4 .54 - .63 5 .61 2 .55 - .65 1 .52 - .68 3 .31 - .64 ▪ Margin measures are strong both before and after depreciation
▪ ROE is negatively correlated, suggesting no value for leverage
▪ Revenue growth plays a role in shareholder value
Health Care
Health Care Equipment & Svcs 1 .41 - .51 2 .34 3 .28 ▪ Growth measures are of greatest importance
▪ Overall, Industry Group has low correlations, possibly because of the
1 .39 - .46 2 .24 diversity of companies represented
Financials
Banks 1 .39 - .41 ▪ Overall, Industry Group has low correlations
▪ ROE correlates well to Market-to-Book value
Diversified Financials 1 .41 - .49 3 .36 3 .28 - .36 2 .25 - .38 ▪ Net Margins are important (efficiency vs. top line growth)
Insurance 2 .24 - .41 1 .39 - .51 3 .38 ▪ ROE has stronger correlation among return measures indicating some
tolerance for leverage
Real Estate 1 .29 - .33 1 .29 - .33 ▪ Growth in Operating Cash Flow (Funds From Operations) plays a role
▪ Overall, Industry Group has low correlations
Information Technology ▪ Margin measures are strong both before and after depreciation
Software & Services 3 .35 - .41 1 .46 3 .35 - .41 1 .36 - .46 ▪ Capital expenditures are important
Tech Hardware & Equipment 1 .41 - .52 2 .48 4 .23 - .46 2 .24 - .48 5 .35 - .42 ▪ Revenue and Earnings Growth play a role in shareholder value
▪ Cash Flow Return measures show strong correlation; indicating importance
3 .34 - .38 4 .34 2 .25 - .45 1 .41 - .49 5 .22 - .32 of CapEx
▪ Margins and Cash Flow Return measures are important before and after
Telecommunication Services 4 .23 - .36 3 .32 - .37 2 .42 - .44 1 .31 - .54 depreciation
▪ Capital expenditures are important
Utilities 1 .22 - .29 2 .27 3 .23 - .24 ▪ Overall, Industry Group has low correlations
Commercial & Professional Svcs
Pharma, Biotech & Life Science
Semiconductors
Earnings Growth Returns Cash Flow Earnings Margins
Comments
Revenue Growth

Performance Metrics and Their Link to Value
32
Summary Incidence of Rankings
A number of insights can be gleaned from this analysis:
First, as shown in the graph below, Earnings Growth measures have the strongest correlation
to value (TSR). Earnings Growth was ranked #1 in 17 of the 24 industry groups (with one tie). It
was not unusual to see all three Earnings Growth metrics that were tested – EPS, Net Income
and Operating Income – near or at the top of the correlation results. Revenue Growth was
often the second most highly correlated metric.
Second, certain Industry Groups have significantly higher or lower correlation results overall, as
summarized in the following table (which is based on the industries with the overall highest and
lowest correlation coefficients). Some of these groups, like Pharmaceuticals, Biotechnology & Life
Sciences, are comprised of very different businesses. It is fair to say that correlation analysis is best
conducted on a well-constructed peer set of similar companies. The more disparate the peer set,
Rank
1
2
3
4
5
None
TOTAL 24 24 24 24 24
0 8 6 11 8
0 1 0 1 4
2 2 3 3 2
2 2 8 2 7
3 10 4 4 1
17 1 3 3 2
Earnings
Growth
Revenue
Growth Returns Cash Flow
Earnings
Margins
0
5
10
15
20
Earnings Growth Revenue Growth Returns Cash Flow Earnings Margins
Co
un
t o
f In
du
stry
Gro
up
s b
y R
ank
Incidence of RankingsMetric Types with the Highest Correlation to TSR
Rank = 1 Rank = 2

Performance Metrics and Their Link to Value
33
the more likely that the correlations will be poor. Poor correlations also likely are due to the fact
that financial measures do not necessarily do a good job of predicting value in certain types of
companies, such as early stage life sciences companies
Third, measurement definitions are important. For example, ROE (or Book Value growth) vs.
ROA/ROIC has a high correlation to value in some industries, like Insurance, but not in others, such
as Household and Personal Products. This suggests that prudent leverage earns a premium to value
in some industries (e.g., Insurance), but imposes a discount to value in others. (We have noted
where such differences exist in the Comments section to the table on page 33.) This likely is due to
the fact that leverage is critical to the business model in certain industries, like Banks, but is not
critical to the business model in other industries. In fact, if leverage is too high in those other
industries, like Household and Personal Products, it only introduces greater risk
Finally, many industries have a number of metrics to choose from when looking to support
shareholder value. Half of the 24 industries have at least three metric categories with strong
correlations. Six industries (i.e., Materials, Capital Goods, Food & Staples Retailing, Household &
Personal Products, Technology Hardware & Equipment, and Semiconductors and Semiconductor
Equipment) have all five metric categories to choose from. On the other hand, four industries (i.e.,
Media, Pharmaceuticals, Biotechnology & Life Sciences, Banks, and Real Estate) have only one or
two metric categories to choose from. Industries with weak correlation results or a limited set of
metrics to choose from could benefit from using TSR directly as a valid metric
Highest Overall Correlations (8) Lowest Overall Correlations (5)
Transportation Energy
Automobiles & Components Media
Consumer Services Pharmaceuticals, Biotechnology & Life Sciences
Consumer Durables and Apparel Banks
Retailing Real Estate
Food & Staples Retailing Utilities
Food, Beverage & Tobacco
Household & Personal Products

Performance Metrics and Their Link to Value
34
Chapter V: The Extent to Which Companies Are Using Metrics That Best Correlate with TSR
The ultimate question, of course, is whether companies are in fact using measures of performance that
correlate to value. While TSR (usually relative TSR) is measured directly in many LTI compensation plans,
companies have increasingly gravitated toward the use of absolute financial metrics in equity LTI plans. The
question is: “Have they chosen those metrics wisely?”
The table below shows a comparison between the rank order of the prevalence of metrics used and the
rank order of which metrics correlate most closely to shareholder value. It also shows the level to which
each industry ties its equity LTIs directly to TSR. Some industries link at least 50% of their equity LTIs directly
to TSR. These industries include: Utilities (89%); Real Estate (58%); Household & Personal Products (56%);
Transportation (52%); Capital Goods (51%); Energy (50%); Consumer Durables and Apparel (50%); and
Food, Beverage and Tobacco (50%).
As indicated in the table below, some industries demonstrate a clear alignment between the metrics most
frequently used in LTI equity plans and shareholder value. Half of the 24 Industry Groups show solid to
strong alignment in that the metrics used most often also are those that best correlate to value. The other
half could benefit from some improvement. It is important to note that these statements do not apply to
individual companies. Rather, they point more generally to those industries in which improvement
opportunities might exist.
Good (12) Moderate (8) Weak (4)
Energy Transportation Telecommunications
Materials Consumer Services Food & Staples Retailing
Capital Goods Media Pharma, Biotech & Life Sciences
Commercial & Prof Svcs Household & Personal Products Semiconductors
Automobiles & Components Banks
Consumer Durables & Apparel Insurance
Retailing Real Estate
Food, Beverage & Tobacco Software & Services
Health Care Equipment
Diversified Financials
Technology Hardware & Equip
Utilities
Strength of Alignment - Performance Metrics vs. TSR

Performance Metrics and Their Link to Value
35
More specifically, the use of metrics (ranked from highest (=1) to lowest prevalence), compared to the
correlation of metrics (ranked from highest (=1) to lowest correlated), for each Industry Group is shown in
the table on the following page. The best matched industries in terms of use/correlation are shown in
green; the weakest matched industries are shown in red; and the ones in the middle are shown in yellow.
In order to earn a Good (green) rating, companies in the Industry Group had to most often use the highest
correlated metrics, or if the correlations were poor, had to have a high prevalence of direct TSR usage. For
example, Consumer Durables and Apparel companies use Earnings Growth and Revenue Growth most
often, which also are most highly correlated to value. Measures for Utility companies have an overall poor
correlation to value, but these companies compensate for those poor correlations by using TSR as a direct
measure of value.
In order to garner a Weak (red) rating, companies in the Industry Group needed to most often use
measures that were not the most highly correlated to value, and/or if the correlations were poor, did not
make significant use of TSR as a direct measure of value. For example, Telecommunications Services uses
Earnings Growth most often, but efficiency measures like Margins and Free Cash Flow are better indicators
of value. In addition, only 26% of companies in the Telecommunications industry use TSR as a direct
measure of value. Measures in Pharmaceuticals, Biotechnology & Life Sciences have an overall low
correlation to value, and only 34% of these companies use TSR as a direct measure of value.
Those industries rated as Moderate (yellow) had a less serious mismatch between metrics usage and
correlation, coupled with moderate prevalence (i.e., between 34% and 49%) in the use of TSR.

Performance Metrics and Their Link to Value
36
Relationship of Metrics Used in Equity LTIs vs. Those That Best Correlate with TSR - 1998 and 2011
Use Rank Corr Rank Use Rank Corr Rank Use Rank Corr Rank Use Rank Corr Rank
Earnings Growth 1 2 1 1 1 4 1 1
Revenue Growth 3 2 2
Returns 1 1 2 3 4 3 2 2
Cash Flow 3 3 4 2 2 3
Earnings Margins 3 5 1 3
TSR Prevalence
Improvement Opportunities ▪
Other Comments ▪ ▪ ▪ ▪
Use Rank Corr Rank Use Rank Corr Rank Use Rank Corr Rank
Earnings Growth 1 1 1 1 1 2
Revenue Growth 3 2 2 2 3
Returns 2 3 3 2 1
Cash Flow 5 5 3 4 4
Earnings Margins 4 4 3 4 3
TSR Prevalence
Improvement Opportunities ▪ ▪
Other Comments ▪ ▪
Use Rank Corr Rank Use Rank Corr Rank Use Rank Corr Rank Use Rank Corr Rank Use Rank Corr Rank
Earnings Growth 1 1 1 1 1 1 1 1 1 1
Revenue Growth 3 2 2 3 2 3 3 2
Returns 2 2 3 4 2 4 2 3
Cash Flow 3 4 4 2 2
Earnings Margins 4 5 3 3 4
TSR Prevalence
Improvement Opportunities ▪ ▪ ▪ ▪ ▪
Other Comments ▪ ▪ ▪
Growth metrics need
to recognize length of
commodity cycles
Increase focus on
TSR
Could also increase
focus on Revenue
Growth
Low direct use of
TSR despite low
correlations
Low direct use of
TSR
Retailing
34% 32% 31%
Increase focus on
Margins, FCF (CapEx),
and TSR
High direct use of
TSR
High direct use of
TSR
High direct use of
TSR
Low direct use of
TSR
48% 50%
Could also increase
focus on Revenue
Growth
Could also increase
focus on Margins
Could also increase
focus on Revenue
Growth and TSR
High direct use of
TSR
Consumer Discretionary Auto & Components Cons Dur & Apparel Consumer Svcs Media
51% 43% 52%
Could also increase
focus on revenue
growth
Increase focus on
Returns
Single-Group Sectors Energy Materials Telecom Services Utilities
Very high direct use
of TSR
Industrials Capital Goods Comm'l & Prof Svcs Transportation
50% 39% 26% 89%

Performance Metrics and Their Link to Value
37
Relationship of Metrics Used in Equity LTIs vs. Those That Best Correlate with TSR - 1998 and 2011
(continued)
Use Rank Corr Rank Use Rank Corr Rank Use Rank Corr Rank
Earnings Growth 1 1 1 1 1 4
Revenue Growth 3 4 3 2 2 5
Returns 2 3 2 3 3 2
Cash Flow 2 4 4 1
Earnings Margins 5 3
TSR Prevalence
Improvement Opportunities ▪ ▪ ▪
Other Comments ▪ ▪ ▪
▪
Use Rank Corr Rank Use Rank
Earnings Growth 1 1 1 1
Revenue Growth 2 2 2
Returns 3 3
Cash Flow 4
Earnings Margins
TSR Prevalence
Improvement Opportunities ▪ ▪
Other Comments ▪ ▪
Corr Rank
Pharma, Biotech, LS
High correlations
mitigate need for
direct tie to TSR
Could also increase
focus on Revenue
Growth
Could also increase
focus on the balance
sheet (Returns and FCF)
Strong overall metric
correlations allows for
use of most metrics;
Increase focus on
FCF (CapEx)
High direct use of
TSR
High direct use of TSR
Relatively low direct
use of TSR despite
mediocre and limited
correlations
Health Care Health Care Equip
30% 34%
Increase focus on
TSR
Increase focus on
TSR
Low direct use of TSR
despite mediocre
correlations
Consumer Staples Food & Staples Retail Food, Bev & Tobacco HH & Pers Pdcts
30% 50% 56%

Performance Metrics and Their Link to Value
38
Relationship of Metrics Used in Equity LTIs vs. Those That Best Correlate with TSR - 1998 and 2011
(continued)
Use Rank Corr Rank Use Rank Corr Rank Use Rank Corr Rank Use Rank Corr Rank
Earnings Growth 1 1 1 1 1 2 2 1
Revenue Growth 3 3
Returns 1 * 2 3 2 1
Cash Flow 3 1 1
Earnings Margins 2
TSR Prevalence
Improvement Opportunities ▪
*
Other Comments ▪ ▪ ▪
Use Rank Corr Rank Use Rank Corr Rank Use Rank Corr Rank
Earnings Growth 1 3 1 1 2 3
Revenue Growth 2 1 2 2 1 4
Returns 3 4 2
Cash Flow 3 4 2 1
Earnings Margins 3 1 5 5 3 5
TSR Prevalence
Improvement Opportunities ▪ ▪ ▪
Other Comments ▪ ▪
Metrics used generally match metrics correlated with value
Improvement opportunities exist
Significant divergence between metrics used and those correlated to value
Note: Use Ranks require a minimum usage of 10%
Low direct use of
TSR
Low direct use of
TSR
24% 34% 28%
Increase focus on
Margins and TSR
Increase focus on
the balance sheet
(FCF and Returns)
Increase focus on
the balance sheet
(FCF and Returns)
Low direct use of
TSR despite low
correlations
Use of Returns may
be understated
since BV growth was
not tracked
Information Technology Software & Services Hardware & Equip Semiconductors
27% 39% 42% 58%
Increase use of TSR
ROE has strong ROE has high correlation
to Market-to-Book ratio
High direct use of
TSR
Financials Banks Diversified Financials Insurance Real Estate

Performance Metrics and Their Link to Value
39
Which Metrics Correlate Best to TSR by Industry?
The table below summarizes the tables from the previous pages to show which metrics have the best
correlation to TSR for each industry group. The top two metric types are indicated in the table below
(denoted as 1 or 2), showing growth metrics with the strongest correlation to shareholder value.
Metrics Best Correlated to TSR by Industry
To determine which industries had good, moderate or weak alignment, we compared metrics used most
frequently against the metrics with the best correlation to TSR. Divergence between usage and correlation
led to an assessment of where opportunities for improvement exist.
Industry Sector Industry Group
Earnings
Growth
Revenue
Growth Returns
Cash Flow
(CapEx)
Earnings
Margins
Energy 2 1
Materials 1 2
Telecommunication Services 2 1
Utilities 1 2
Capital Goods 1 2
Commercial & Professional Services 1 2
Transportation 2 1
Automobiles and Components 1 2
Consumer Durables and Apparel 1 2
Consumer Services 1 2
Media 1 2
Retailing 1 2
Food & Staples Retailing 1 2
Food, Beverage & Tobacco 1 2
Household & Personal Products 2 1
Health Care Equipment & Services 1 2
Pharma, Biotech & Life Sciences 1 2
Banks 1
Diversified Financials 1 2
Insurance 2 1
Real Estate 1 1
Software & Services 1 1
Technology Hardware & Equipment 1 2 2
Semiconductors 2 1
Metrics used generally match metrics correlated with value (TSR)
Improvement opportunities exist
Significant divergence between metrics used and those correlated to value
1 or 2 Metric types most highly correlated to TSR - Best and second best correlation
Health Care
Financials
Information
Technology
Single-Group
Sectors
Industrials
Consumer
Discretionary
Consumer
Staples
Which Metrics Correlate Best to TSR?

Performance Metrics and Their Link to Value
40
What Are the Greatest Areas of Improvement for Each Industry?
While some improvements already may have been made given the time horizon of this analysis (i.e.,
covering the years 1998-2011), patterns in the data suggest that opportunities for improvement still exist.
These improvements vary by industry, as shown in the table below. They include:
Greater need to use TSR directly when correlations to value are poor
Need to balance growth with a greater use of efficiency measures, like Returns and/or Margins
Greater need to take capital investments into account, not just the earnings from those
investments
Recognition that Revenue Growth can be a close second in correlation to value compared to
Earnings Growth, offering the opportunity to supplement Earnings with Revenue Growth if
indicated by the company’s strategy and growth opportunities
Improvement Opportunities in the Use of Metrics by Industry
Industry Sector Industry Group
TSR
(direct)
Earnings
Growth
Revenue
Growth Returns
Cash Flow
(CapEx)
Earnings
Margins
Energy
Materials
Telecommunication Services
Utilities
Capital Goods
Commercial & Professional Services
Transportation
Automobiles and Components
Consumer Durables and Apparel
Consumer Services
Media
Retailing
Food & Staples Retailing
Food, Beverage & Tobacco
Household & Personal Products
Health Care Equipment & Services
Pharma, Biotech & Life Sciences
Banks
Diversified Financials
Insurance
Real Estate
Software & Services
Technology Hardware & Equipment
Semiconductors
Metrics used generally match metrics correlated with value (TSR)
Improvement opportunities exist
Significant divergence between metrics used and those correlated to value
Health Care
Financials
Information
Technology
To Improve Alignment, Increase Focus On:
Single-Group
Sectors
Industrials
Consumer
Discretionary
Consumer
Staples

Performance Metrics and Their Link to Value
41
Finally, it is important to acknowledge that certain industries may have been rational in not using metrics
that correlated to value over the entire 1998-2011 timeframe, i.e., the period included in the study. This
could have been due to the fact that the metrics correlating most strongly to value change over time
and/or with the economic cycles – what works well in growth markets does not necessarily work well in
recessionary environments. For example, in the Semiconductor & Semiconductor Equipment industry,
Revenue Growth was the leading financial metric used over the time period studied (1998-2011). While
Revenue Growth was most strongly correlated to TSR during the growth cycles, Returns and Cash Flows
were better metrics to use during the recessionary periods. This underscores the fact that certain
companies may be best served focusing on different metrics in different economic situations.

Performance Metrics and Their Link to Value
42
Questions on Performance Metrics
Key questions for management, boards, and shareholders to ask in evaluating the
effectiveness of performance metrics and their link to value include:
How did the company choose its metrics?
What evidence does the company have that performance against these metrics will
lead to shareholder value creation?
Are there any exogenous variables (e.g., economic conditions, commodity prices,
etc.) that the company is trying to remove from the performance assessment in the
short-term? In the long-term?
How often are performance metrics evaluated to validate their effectiveness,
particularly when external conditions (market, economic, etc.) shift?
If the company is using relative benchmarks, how did they establish the comparator
group?
Was an evaluation of competitive practices used in determining company
performance metrics?
Within broad categories of metrics (e.g., Earnings, Returns), how are specific metrics
(e.g., EBITDA, ROE) defined? For example, if the company is using ROE, instead of an
unlevered return measure, what evidence does it have that leverage will be
rewarded?
How are performance goals set?
What adjustments to the measures are allowed?
If non-financial performance metrics are used, how are they selected and
measured?
Is the rationale for performance metric selection and goal-setting appropriately and
clearly disclosed to shareholders?

Performance Metrics and Their Link to Value
43
Key Takeaways
Say on Pay has brought a clear focus to executive pay, and to pay for performance, in particular. As
investors, executives, and boards try to better align executive incentives with shareholder interests,
performance metrics (and the goal-setting processes that accompany those metrics) will come under
greater scrutiny. This analysis highlights some clear takeaways to help improve the alignment between
performance metrics and shareholder value.
Key Findings and Conclusions
Executive compensation design has moved towards long-term incentive (LTI) components in an
attempt to align management interests with those of long-term shareholders; further, those LTIs
are now largely performance-based
Among companies using performance-based LTIs, most (53%) use a mix of TSR and financial
measures in their equity LTI plans; others (28%) use financial measures only; and a smaller minority
(15%) use TSR only. This use rate puts a premium on getting the financial measures right
In aggregate, performance metrics are generally well-aligned with shareholder value. Earnings
Growth, followed by Returns and Revenue Growth, has the greatest impact on TSR. In general, this
matches the use patterns for financial metrics in LTIs: Earnings Growth is the most popular financial
measure, followed by Returns and Revenue Growth. TSR (usually measured on a relative basis) is
used as a direct measure of shareholder value in over 40% of companies with performance-based
LTIs
Many industries have a number of metrics to choose from. Half of the 24 Industry Groups studied
have at least three metric categories with strong correlations
However, the optimal use of measures differs considerably by industry. Industry Group, in general,
as an indicator of business model, has the strongest influence on performance metrics used, with
size and valuation premiums having little impact on metric selection
The good news is that half of the 24 Industry Groups use metrics that most highly correlate to
value, and also use TSR as a direct measure of shareholder value
The bad news is that the other half of Industry Groups could use some improvement. The
companies in these industries either are not using the metrics that are most strongly correlated to
value or, when the overall correlations of financial metrics to shareholder value are poor, they are
not sufficiently using TSR as a direct measure of shareholder performance. More specifically, the
most significant improvement opportunities in these industries include:
- Greater need to use TSR directly when correlations to value are poor
- Need to balance growth with a greater use of efficiency measures, like Returns and/or Margins
- Greater need to take capital investments into account, not just the earnings from those investments
- Recognition that Revenue Growth can be a close second in correlation to value compared to
Earnings Growth, offering the opportunity to supplement Earnings with Revenue Growth if
indicated by the company’s strategy and growth opportunities

Performance Metrics and Their Link to Value
44
Recommended Actions
We predict that metrics will become increasingly important and visible as investors and executives try to
better align executive incentives with shareholder interests. This analysis suggests some key steps that
investors and companies should take in order to improve that alignment. These include:
Companies should undertake their own analysis to determine which measures of performance have
the most influence on their shareholder value. In this regard, various measurement definitions
(e.g., how depreciation, capital expenditures, asset definitions, and other items are treated) could
make a significant difference to shareholder value and should be given careful consideration
Companies should try to find two or three key metrics which appropriately balance growth and
returns and demonstrate a proven link to value. However, if overall correlations to value are poor,
then companies should link directly to TSR. If only one financial metric correlates to value, then
companies should choose that single financial metric, perhaps supplemented by relevant non-
financial metrics, and/or TSR, and should support this choice with a strong rationale
Investors are likely to increase engagement activities around executive compensation in general,
and specifically on performance metrics. In communicating with investors, companies should
present (and investors should expect) compelling evidence as to how performance on various
measures will lead to enhanced shareholder value
* * * * *
We hope that this analysis is illuminating for investors and companies alike, and that it contributes to the
quality of the dialog around how incentive programs, and the metrics that drive them, can enhance
shareholder value and support the alignment between pay and performance.

Performance Metrics and Their Link to Value
45