Embed Size (px)
Citation preview

BEST PRACTICES IN EVALUATING TRANSIT PERFORMANCE
FOR URBAN FIXED ROUTE
SYSTEMS
JUNE 3, 2014

PRESENTATION AGENDA
• Purpose of the Study• MAP‐21 Requirements• Study Tasks
– National Best Practices
– Florida Case Studies
• Findings• Toolbox• Discussion

PURPOSE OF STUDY • Best Practices in Evaluating Transit Performance
– To assist Florida transit agencies in understanding useful and common performance measures
– Develop an inventory of what is collected at FL transit agencies, to whom, and how often data are reported
– Develop a toolbox of performance measures, useful for monitoring agency performance
– Identify specific measures that may meet the requirements of MAP‐21
BEST PRACTICES IN EVALUATING TRANSIT PERFORMANCE 3

• US DOT – establish performance measures & formal definition for ‘state of good repair’
• State and MPO ‐ transportation plans must include transit‐related performance measures and performance targets; both urban & rural
• Transit Agency – Develop Asset Management Plan, Measures & Targets
• Capital asset inventory, condition assessment, decision support tools, investment prioritization, etc.
– Safety Plan, Measures and Targets• Method to identify/evaluate risks, strategies to minimize exposure, timeline for annual review of SP, performance targets, assigned safety officer, etc.
– Transit Services for Seniors and Individuals with Disabilities (FTA 5310)• Qualitative and quantitative information – quality of service, ridership, accessibility improvements and other measures
MAP-21 NEW REQUIREMENTS
BEST PRACTICES IN EVALUATING TRANSIT PERFORMANCE 4

STUDY TASKS
• Literature review of Previously Conducted Studies – National Case Studies identifying best practices and overview of MAP‐21 requirements
• Survey FL transit agencies to understand existing best practices for collection and use of performance measures specific to Florida
• Identify 4 Florida Case Studies that have unique and successful methods
• Develop Toolbox for transit agencies
BEST PRACTICES IN EVALUATING TRANSIT PERFORMANCE 5

NATIONAL BEST PRACTICES
• Literature Review:– TCRP Report 88, 141– NCHRP Report 446, 708, Digest 361
• Findings:– Agencies must have clear goals & objectives FIRST
• Develop performance measure system to achieve goals & objectives• Reports provide several examples of goals & appropriate measures
BEST PRACTICES IN EVALUATING TRANSIT PERFORMANCE 6

NATIONAL BEST PRACTICES
In order to help state DOTs select appropriate performance measures, NCHRP RRD 361 provides a list of characteristics of good performance measures. These characteristics appear to have been derived from the state DOT interviews and are as follows:• Trackable over Time – Measures can be consistently used over many years.• Storytelling Potential – Measures should be meaningful and convincing, particularly over
the long term. They should "help weave a storyline around public transportation performance in the state."
• Meaningful for Types of Service Measured – The set of performance measures should include non‐traditional measures (e.g., community measures) so as to represent social values and quality of life concerns.
• Relation to Statewide Public Transportation Goals – Measures should allow the DOT to track progress towards achieving goals.
• Available Data – Measures should be calculable from data that are reliably available statewide.
BEST PRACTICES IN EVALUATING TRANSIT PERFORMANCE 7

NATIONAL CASE STUDIES• Six Case Studies:
– Large, Medium, Small transit agencies
• Washington Area Metropolitan Transit Authority (WMATA)• Denver Regional Transportation District (RTD)• Capital Metro, Austin, TX• Lane Transit District (LTD), Eugene, OR• Transfort, Fort Collins, CO• Merced County Transit, Merced, CA
BEST PRACTICES IN EVALUATING TRANSIT PERFORMANCE 8

NATIONAL CASE STUDIES - WMATA
Goals Performance Indicators
Build and maintain a premier safety culture and system • Customer and employee injury rates• On‐time performance• Customer satisfaction• Operating expense on budget• Connecting communities• Crime rates• Escalator availability• Capital funds invested• Meet board‐established service criteria
Meet or exceed customer expectations by consistently delivering quality service
Improve regional mobility and connect communities
Ensure financial stability and invest in our people and assets
BEST PRACTICES IN EVALUATING TRANSIT PERFORMANCE
Goals and Indicators‐Metro’s Strategic Business Plan
Source: WMATA, Momentum: The Next Generation of Metro
9

NATIONAL CASE STUDIES - RTD
Goal Objectives Performance MeasuresTo meet the present transportation needs of the District by providing safe transportation service
• Reduce vehicle accident ratio
• Increase preventive maintenance
• Reduce passenger accident ratio
• Improve light rail safety• Improve employee
safety
• Vehicle accident involvements per 100,000 miles –preventable
• Percentage of preventive maintenance inspections incurred as scheduled every 6,000 miles – systemwide
• Passenger accident ratio per 100,000 miles – systemwide• Reportable light rail/auto accidents per month• Reportable light rail/auto accidents per 100,000 miles –
preventable• Operator or passenger assault ratio per 100,000 boardings• Average response time to emergency dispatch calls
BEST PRACTICES IN EVALUATING TRANSIT PERFORMANCE
RTD Denver Performance Measurement Standards
Source: RTD, compiled from 2012 Adopted Budget
Goal Objectives Performance MeasuresTo meet the present transportation needs of the District by providing cost‐effect and efficient transportation service
• Maintain cost recovery ratios
• Increase ridership• Increase farebox and
EcoPass revenue• Improve route efficiency• Monitor selected internal
functions for efficiency• Maintain cost effective
and efficient transportation services
• Hire and train competent personnel
• Operating cost recovery ratio• Overall ridership increase• Fare revenue• EcoPass revenue• Total operating revenue• Number of audits• Bus operator – vacancies• Bus operator – over headcount• Bus mechanic – vacancies• Bus mechanic – over headcount• Stock‐out level
10

NATIONAL CASE STUDIES - TRANSFORT
BEST PRACTICES IN EVALUATING TRANSIT PERFORMANCE
Source: Transfort, Service Standards and Policies
Category Performance Measures
Ridership and Economic
• Passengers/hour• Passengers/mile• Passengers/revenue hour• Passenger/revenue mile
Vehicle Load• Seated capacity• Passenger load
Vehicle Headway• Service frequency• Headway
Category Performance Measures
On‐Time Performance• On‐time performance• Percent of routes scheduled to clock headways• Delay ratio
Distribution of Transit Amenities• Percentage of stops with shelter and benches• Fleet cleaning• Passenger environment
Transit Security• Passenger safety• Ratio of police officers to transit vehicles• Number of vehicles with specified safety devices
Transfort’s Current Transit Performance Measures
11
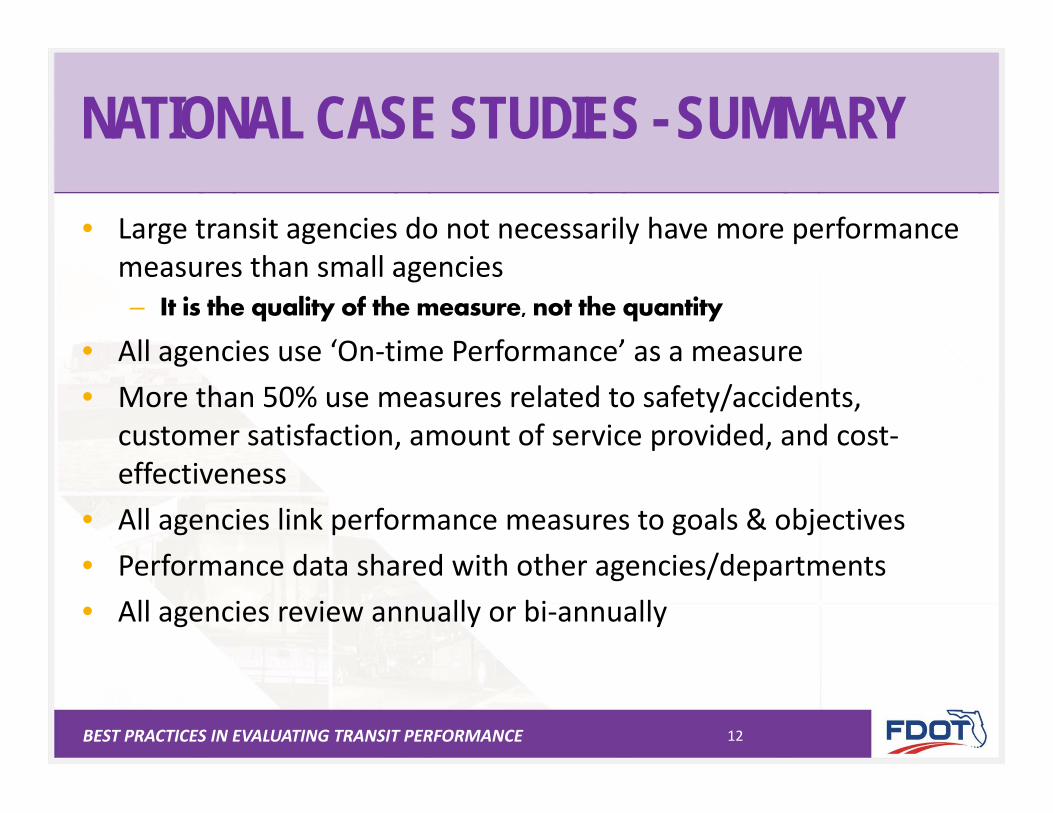
NATIONAL CASE STUDIES - SUMMARY• Large transit agencies do not necessarily have more performance
measures than small agencies– It is the quality of the measure, not the quantity
• All agencies use ‘On‐time Performance’ as a measure• More than 50% use measures related to safety/accidents,
customer satisfaction, amount of service provided, and cost‐effectiveness
• All agencies link performance measures to goals & objectives• Performance data shared with other agencies/departments• All agencies review annually or bi‐annually
BEST PRACTICES IN EVALUATING TRANSIT PERFORMANCE 12
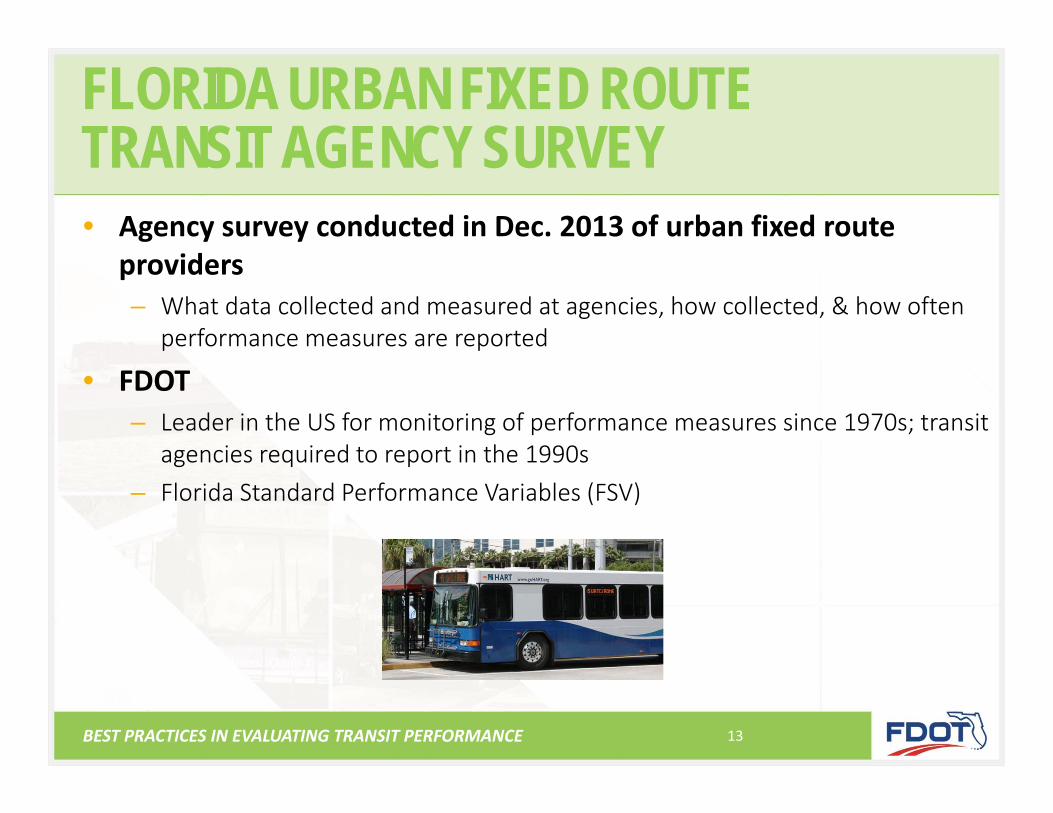
• Agency survey conducted in Dec. 2013 of urban fixed route providers– What data collected and measured at agencies, how collected, & how often
performance measures are reported
• FDOT– Leader in the US for monitoring of performance measures since 1970s; transit
agencies required to report in the 1990s– Florida Standard Performance Variables (FSV)
FLORIDA URBAN FIXED ROUTE TRANSIT AGENCY SURVEY
BEST PRACTICES IN EVALUATING TRANSIT PERFORMANCE 13

• Four Case Studies:– Large, Medium, Small transit agencies
• Miami Dade Transit (MDT)• Jacksonville Transportation Authority (JTA)• Lee County Transit (LeeTran)• Council on Aging of St. Lucie, Inc. (COASL)
FLORIDA CASE STUDIES
BEST PRACTICES IN EVALUATING TRANSIT PERFORMANCE 14

Source: MDT Department Scorecard FY 13‐14
BEST PRACTICES IN EVALUATING TRANSIT PERFORMANCE
FLORIDA CASE STUDIES - MDT
Name Period Actual Target Variance
On‐time Performance/Schedule Adherence – Bus (2) Mar ‘1483.72%
(1,352/1,615)78.00% 5.72%
On‐time Performance/Schedule Adherence – Bus (3) Mar ‘1476.34%
(4,645/6,085)78.00% ‐1.66%
On‐time Performance/Schedule Adherence – Bus (9) Mar ‘1478.73%
(3,005/3,817)78.00% 0.73%
On‐time Performance/Schedule Adherence – Bus (10) Mar ‘1479.26%
(1,754/2,213)78.00% 1.26%
Route‐Level On‐Time Performance ScorecardTransit Data MDT
Age of Fleet (yrs.) Fleet DataFarebox Revenue Electronic fareboxesMaintenance Expenses Maintenance recordsNumber of accidents/ incidents/ collisions Accident and incident recordsNumber of boardings Electronic fareboxesNumber of system failures Maintenance recordsOperating Expenses Combination of various technologyOther Non‐Fare Revenue Combination of various technologyPassenger Miles Combination of various technologyPassenger Trips Automatic passenger counters (APC)Revenue Hours Combination of various technologyRevenue Miles Combination of various technologyRoute Miles Other in‐house documents
Customer
Objective MeasureFY‐To‐Date Target
Minimize traffic congestion Percentage completion a design project N/AProvide reliable transit service Peak vehicle requirement – weekday 100%
On‐time performance (Metrorail) 95%On‐time performance– weekday – bus (Overall system) 78%Mean distance between failures (Bus) 4,000Mean distance between disruptions (Rail) 39,000Mean distance between disruptions (Mover) 1,500
Expand and improve public transportation – operations
Average daily boardings – Rail 295,000Average daily boardings – Bus 1,205,000Average daily boardings – Mover 150,000Total monthly boardings – Bus N/A
Improve mobility of low income individuals, the elderly and the disabled
On‐time performance (STS) 80%Total Monthly boardings (STS) N/A
Ensure security at public transit facilities
Security post inspections 3,000
Ensure excellent customer service for passengers
All complaints per 100K boardings for bus, rail, mover 12All complaints per boardings for paratransit – monthly N/A
MDT’s Data Collection Sources and TechnologyMDT’s Customer Perspective – Objectives and Performance Targets
15

FLORIDA CASE STUDIES - JTA
Source: JTA Transit Development Plan
BEST PRACTICES IN EVALUATING TRANSIT PERFORMANCE
MeasuresOperational Measures
Service• Service Area Population• Service Area Population Density• Passenger Trips• Passenger Miles• Average Passenger Trip Length• Revenue Miles• Revenue Hours• Directional Route Miles
Employee• Total Employee FTEs (full‐time equivalents)• Revenue Hours Per Employee FTE• Passenger Trips Per Employee FTE
Financial Measures
Efficiency• Operating Expenses per Capita• Operating Expenses per Passenger Trip• Operating Expenses per Revenue Mile• Operating Expenses per Revenue Hour• Fare Revenue per Passenger• Farebox Recovery Rate
Expenses and Revenue• Operating Expenses• Maintenance Expenses• Fare Revenue
Fixed Route ‐ Selected Performance Review Measures
16

FLORIDA CASE STUDIES
BEST PRACTICES IN EVALUATING TRANSIT PERFORMANCE
JTA’s Goals and Objectives
Source: JTA Transit Development Plan*CSS: for Customer Satisfaction Survey
Goal Objectives Measures
Excellence in Customer Service
Deliver high quality Connexion services by providing reliable and timely services
On‐time Performance ConnexionPercent of Connexion No‐shows
Ensure JTA buses, Skyway and facilities are comfortable and clean
Fixed Route Load Factor (Access to a seat)Community Shuttle Load Factor (Access to seat)Average Percentage of JTA Bus Fleet Cleaned Daily Bus Cleanliness (CSS)Bus Stop Cleanliness (CSS)
Improve operator courtesy Driver Courtesy (CSS)Provide responsive and clear communications to customers concerns and questions
Concern Resolution (CSS)Customer Service Call Center – Average Speed to Answer (Hold Time)
Customer Service Call Center ‐ Abandon RateConnexion Call Center – Average Speed to Answer (Hold Time)Connexion Call Center – Abandon Rate
17

FLORIDA CASE STUDIES - LEETRAN
BEST PRACTICES IN EVALUATING TRANSIT PERFORMANCE
Source: Lee County Transit TDP
LeeTran’s Goals, Objectives, and InitiativesGoal Objective Initiative
1. Increase the Market Share for Transit
1.1 Increase the number of one‐way fixed‐route passenger trips by an average of five percent annually, from 3 million in FY 2008/09 to 5 million in FY 2020/21
1.1 Continue to maintain existing LeeTran Service levels.
1.2 Meet the fixed‐route performance measures included in Objective 43.1 and Policy 43.3.1 in the Lee Comprehensive Plan, which states that the County will maintain operating standards of 14 passengers per revenue vehicle hour, 1.3 passengers per revenue vehicle mile, and farebox revenues at a minimum of 20% of operating expenses.
1.2 Implement new and expanded services prioritized in the Lee MPO LRTP, the LeeTran TDP, and Vision Plan1.3 Implement the performance monitoring program that addresses performance standards for fixed‐route service.1.4 Develop a Marketing and Education Program by March 2012.1.5 Expand marketing and educational efforts to local universities and colleges.1.6 Explore opportunities for marketing hybrid vehicles and other environmentally‐friendly transit technologies.1.7 Develop and distribute marketing materials that integrate the opinion and transit needs of community business leaders.
18

FLORIDA CASE STUDIES
BEST PRACTICES IN EVALUATING TRANSIT PERFORMANCE
Source: Lee County Transit TDP
Evaluation Levels
19

FLORIDA CASE STUDIES - COASL
BEST PRACTICES IN EVALUATING TRANSIT PERFORMANCE
COASL Goals and Objectives with Corresponding Performance Measure
Source: Regional Transit Development Plan for the Port St. Lucie Urbanized Area 2010‐2019
Goal Objectives Unit of Measure2. Increase the availability and use of public transportation services through mobility enhancements, expanded fixed‐route service, and more inter‐country fixed bus routes.
Increase the number of fixed‐route passenger trips by 50% between FY 2010 and FY 2019.
Percent increase in fixed‐route rider
Increase the number of inter‐county bus routes from one to three by 2019.Number of inter‐county bus routes
Add at least one vanpool to the commuter services program each year through the 2019 TDP planning horizon.
Number of new vanpools
By 2019, reduce demand for paratransit by 25 % as fixed‐route services are improved for customers to utilize.
Percent decrease in paratransit trips
20

• Each transit agency provided a link from performance measures to goals and objectives that are consistent with county and local strategic transportation plans such as long range transportation plans, transportation improvement program and comprehensive development master plan.
• Large and medium‐sized agencies use technological software. Small transit agencies continue to efficiently collect data that feeds into performance measures. The key to manual data collection is to focusing on the basic data needed to calculate key measures.
• Most agencies collect safety and asset management data and report performance measures that can be used to comply with MAP‐21 requirements. All agencies reported with confidence that the agency would be able to quickly adapt to the MAP‐21 performance reporting changes, once the final ruling is released.
• Quality of measures counts.
FLORIDA CASE STUDY SUMMARY
BEST PRACTICES IN EVALUATING TRANSIT PERFORMANCE 21

TOOLBOX
• Why is this Toolbox useful for your Transit Agency?– Successful Florida examples that have unique approaches for tracking and
monitoring performance measures– Sample Goals and Objectives are shown that can be incorporated into the
TDP Planning Process and other agency plans – Sample performance measures are presented that may meet MAP‐21
Safety/Security and Asset Management requirements
BEST PRACTICES IN EVALUATING TRANSIT PERFORMANCE 22

CATEGORIES FOR PERFORMANCE MEASURES1. Service Effectiveness2. Service Efficiency3. Labor Productivity4. Safety and Security5. Vehicle Utilization and Asset Management
• Categories are based upon national review and FL transit agency survey feedback.
• The 5 categories are a compilation of TCRP, NCHRP, Florida Standard Variables (FSV), and TDP methods.
BEST PRACTICES IN EVALUATING TRANSIT PERFORMANCE 23

TOOLBOX– SNEAK PEEK
BEST PRACTICES IN EVALUATING TRANSIT PERFORMANCE 24

• Thank you!
• Panel members:Michelle Davis Hines, Special Projects Administrator, Miami‐Dade Transit (MDT)
Marianne Arbore, Transit Director, Council on Aging of St. Lucie (COASL)
DISCUSSION