Embed Size (px)
Citation preview

AFRL-PR-WP-TP-2006-262
PERFORMANCE MEASUREMENTS OF DIRECT AIR INJECTION IN A CAVITY-BASED FLAMEHOLDER FOR A SUPERSONIC COMBUSTOR (POSTPRINT) S.G. Edens, P.I. King, M.R. Gruber, and K.-Y. Hsu OCTOBER 2006
Approved for public release; distribution is unlimited.
STINFO COPY
The U.S. Government is joint author of the work and has the right to use, modify, reproduce, release, perform, display, or disclose the work. PROPULSION DIRECTORATE AIR FORCE MATERIEL COMMAND AIR FORCE RESEARCH LABORATORY WRIGHT-PATTERSON AIR FORCE BASE, OH 45433-7251
i
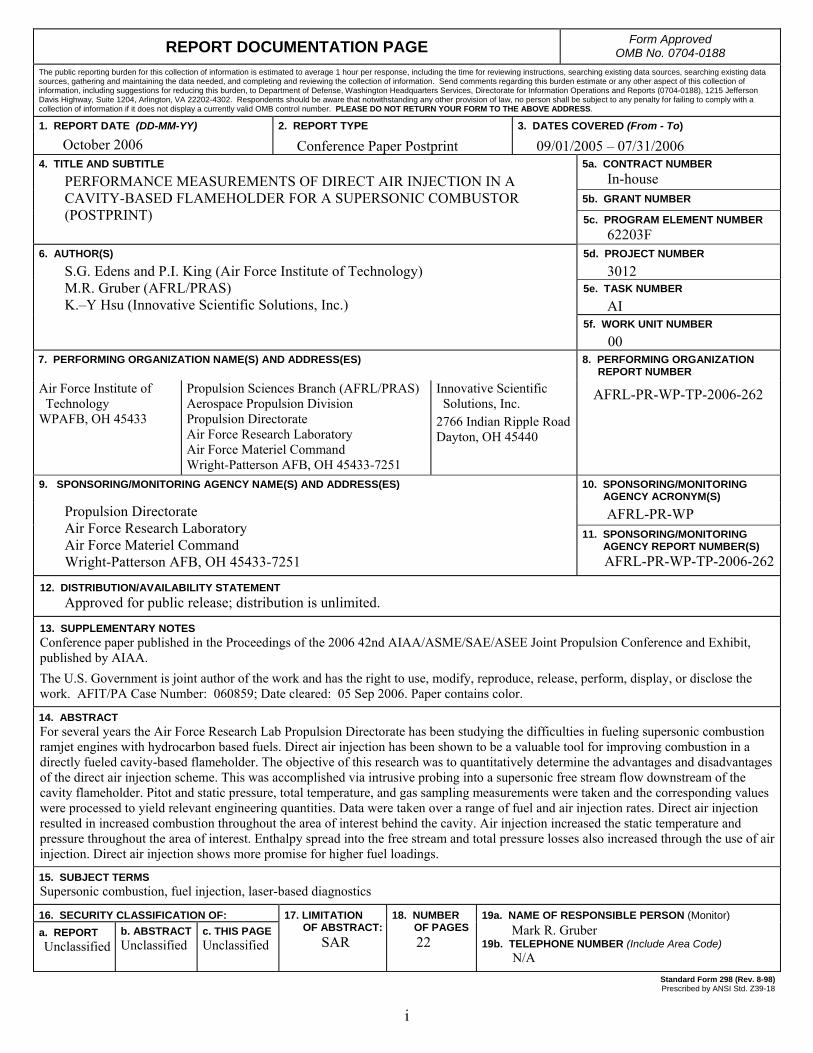
REPORT DOCUMENTATION PAGE Form Approved OMB No. 0704-0188
The public reporting burden for this collection of information is estimated to average 1 hour per response, including the time for reviewing instructions, searching existing data sources, searching existing data sources, gathering and maintaining the data needed, and completing and reviewing the collection of information. Send comments regarding this burden estimate or any other aspect of this collection of information, including suggestions for reducing this burden, to Department of Defense, Washington Headquarters Services, Directorate for Information Operations and Reports (0704-0188), 1215 Jefferson Davis Highway, Suite 1204, Arlington, VA 22202-4302. Respondents should be aware that notwithstanding any other provision of law, no person shall be subject to any penalty for failing to comply with a collection of information if it does not display a currently valid OMB control number. PLEASE DO NOT RETURN YOUR FORM TO THE ABOVE ADDRESS.
1. REPORT DATE (DD-MM-YY) 2. REPORT TYPE 3. DATES COVERED (From - To)
October 2006 Conference Paper Postprint 09/01/2005 – 07/31/2006 5a. CONTRACT NUMBER
In-house 5b. GRANT NUMBER
4. TITLE AND SUBTITLE
PERFORMANCE MEASUREMENTS OF DIRECT AIR INJECTION IN A CAVITY-BASED FLAMEHOLDER FOR A SUPERSONIC COMBUSTOR (POSTPRINT) 5c. PROGRAM ELEMENT NUMBER
62203F 5d. PROJECT NUMBER
3012 5e. TASK NUMBER
AI
6. AUTHOR(S)
S.G. Edens and P.I. King (Air Force Institute of Technology) M.R. Gruber (AFRL/PRAS) K.–Y Hsu (Innovative Scientific Solutions, Inc.)
5f. WORK UNIT NUMBER
00 7. PERFORMING ORGANIZATION NAME(S) AND ADDRESS(ES) 8. PERFORMING ORGANIZATION
REPORT NUMBER Air Force Institute of Technology WPAFB, OH 45433
Propulsion Sciences Branch (AFRL/PRAS) Aerospace Propulsion Division Propulsion Directorate Air Force Research Laboratory Air Force Materiel Command Wright-Patterson AFB, OH 45433-7251
Innovative Scientific Solutions, Inc. 2766 Indian Ripple Road Dayton, OH 45440
AFRL-PR-WP-TP-2006-262
9. SPONSORING/MONITORING AGENCY NAME(S) AND ADDRESS(ES) 10. SPONSORING/MONITORING AGENCY ACRONYM(S)
AFRL-PR-WP Propulsion Directorate Air Force Research Laboratory Air Force Materiel Command Wright-Patterson AFB, OH 45433-7251
11. SPONSORING/MONITORING AGENCY REPORT NUMBER(S) AFRL-PR-WP-TP-2006-262
12. DISTRIBUTION/AVAILABILITY STATEMENT Approved for public release; distribution is unlimited.
13. SUPPLEMENTARY NOTES Conference paper published in the Proceedings of the 2006 42nd AIAA/ASME/SAE/ASEE Joint Propulsion Conference and Exhibit, published by AIAA. The U.S. Government is joint author of the work and has the right to use, modify, reproduce, release, perform, display, or disclose the work. AFIT/PA Case Number: 060859; Date cleared: 05 Sep 2006. Paper contains color. 14. ABSTRACT For several years the Air Force Research Lab Propulsion Directorate has been studying the difficulties in fueling supersonic combustion ramjet engines with hydrocarbon based fuels. Direct air injection has been shown to be a valuable tool for improving combustion in a directly fueled cavity-based flameholder. The objective of this research was to quantitatively determine the advantages and disadvantages of the direct air injection scheme. This was accomplished via intrusive probing into a supersonic free stream flow downstream of the cavity flameholder. Pitot and static pressure, total temperature, and gas sampling measurements were taken and the corresponding values were processed to yield relevant engineering quantities. Data were taken over a range of fuel and air injection rates. Direct air injection resulted in increased combustion throughout the area of interest behind the cavity. Air injection increased the static temperature and pressure throughout the area of interest. Enthalpy spread into the free stream and total pressure losses also increased through the use of air injection. Direct air injection shows more promise for higher fuel loadings.
15. SUBJECT TERMS Supersonic combustion, fuel injection, laser-based diagnostics
16. SECURITY CLASSIFICATION OF: 19a. NAME OF RESPONSIBLE PERSON (Monitor) a. REPORT Unclassified
b. ABSTRACT Unclassified
c. THIS PAGE Unclassified
17. LIMITATION OF ABSTRACT:
SAR
18. NUMBER OF PAGES
22 Mark R. Gruber 19b. TELEPHONE NUMBER (Include Area Code)
N/A
Standard Form 298 (Rev. 8-98) Prescribed by ANSI Std. Z39-18
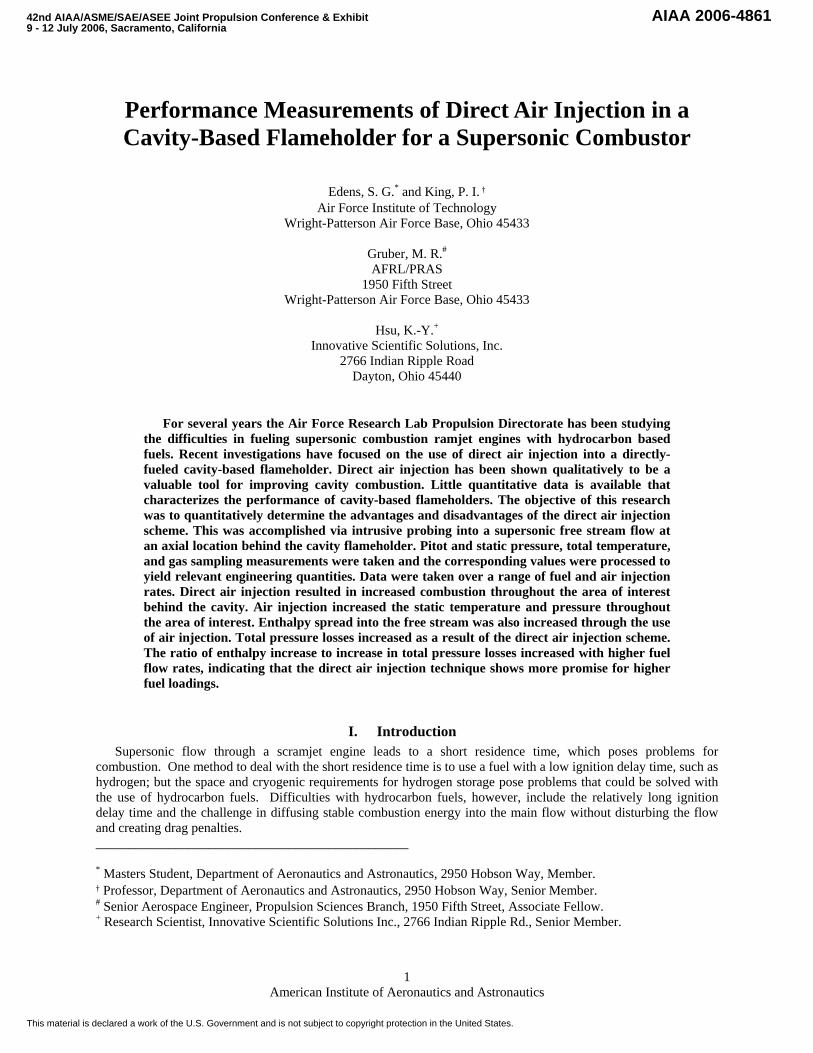
Performance Measurements of Direct Air Injection in a Cavity-Based Flameholder for a Supersonic Combustor
Edens, S. G.* and King, P. I. †
Air Force Institute of Technology Wright-Patterson Air Force Base, Ohio 45433
Gruber, M. R.#
AFRL/PRAS 1950 Fifth Street
Wright-Patterson Air Force Base, Ohio 45433
Hsu, K.-Y.+
Innovative Scientific Solutions, Inc. 2766 Indian Ripple Road
Dayton, Ohio 45440
For several years the Air Force Research Lab Propulsion Directorate has been studying the difficulties in fueling supersonic combustion ramjet engines with hydrocarbon based fuels. Recent investigations have focused on the use of direct air injection into a directly-fueled cavity-based flameholder. Direct air injection has been shown qualitatively to be a valuable tool for improving cavity combustion. Little quantitative data is available that characterizes the performance of cavity-based flameholders. The objective of this research was to quantitatively determine the advantages and disadvantages of the direct air injection scheme. This was accomplished via intrusive probing into a supersonic free stream flow at an axial location behind the cavity flameholder. Pitot and static pressure, total temperature, and gas sampling measurements were taken and the corresponding values were processed to yield relevant engineering quantities. Data were taken over a range of fuel and air injection rates. Direct air injection resulted in increased combustion throughout the area of interest behind the cavity. Air injection increased the static temperature and pressure throughout the area of interest. Enthalpy spread into the free stream was also increased through the use of air injection. Total pressure losses increased as a result of the direct air injection scheme. The ratio of enthalpy increase to increase in total pressure losses increased with higher fuel flow rates, indicating that the direct air injection technique shows more promise for higher fuel loadings.
I. Introduction Supersonic flow through a scramjet engine leads to a short residence time, which poses problems for combustion. One method to deal with the short residence time is to use a fuel with a low ignition delay time, such as hydrogen; but the space and cryogenic requirements for hydrogen storage pose problems that could be solved with the use of hydrocarbon fuels. Difficulties with hydrocarbon fuels, however, include the relatively long ignition delay time and the challenge in diffusing stable combustion energy into the main flow without disturbing the flow and creating drag penalties. _______________________________________________ * Masters Student, Department of Aeronautics and Astronautics, 2950 Hobson Way, Member. † Professor, Department of Aeronautics and Astronautics, 2950 Hobson Way, Senior Member. # Senior Aerospace Engineer, Propulsion Sciences Branch, 1950 Fifth Street, Associate Fellow. + Research Scientist, Innovative Scientific Solutions Inc., 2766 Indian Ripple Rd., Senior Member.
American Institute of Aeronautics and Astronautics
1
42nd AIAA/ASME/SAE/ASEE Joint Propulsion Conference & Exhibit9 - 12 July 2006, Sacramento, California
AIAA 2006-4861
This material is declared a work of the U.S. Government and is not subject to copyright protection in the United States.
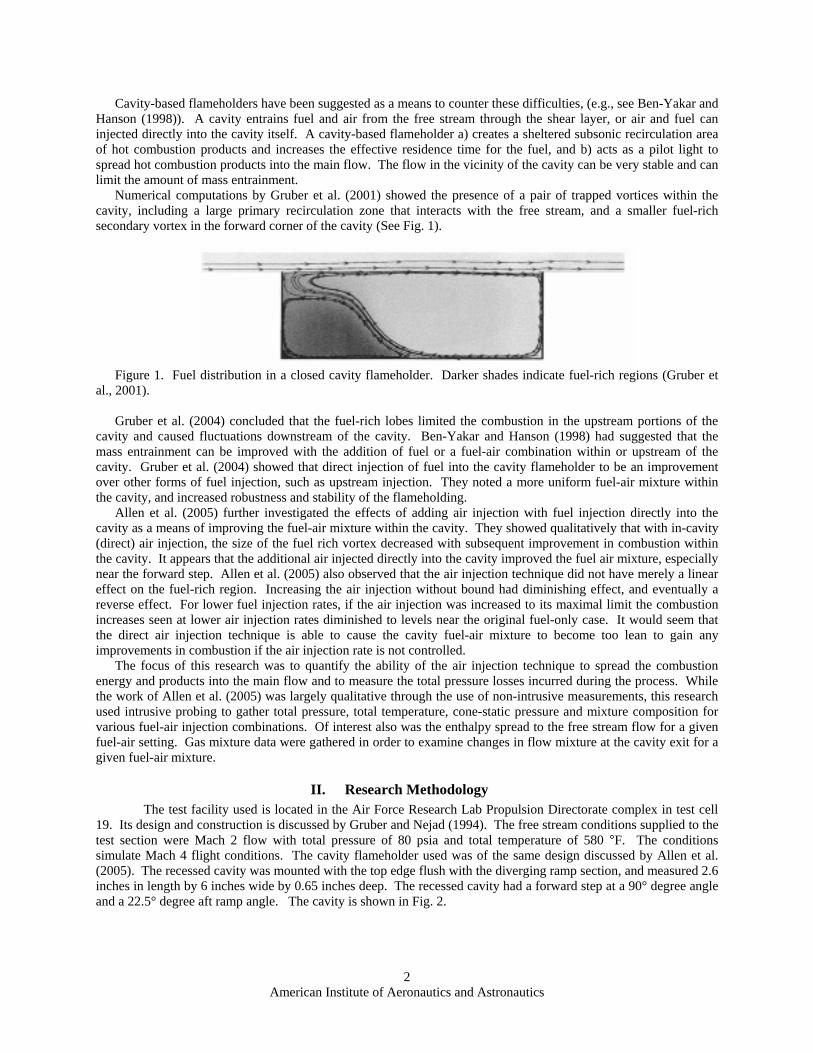
Cavity-based flameholders have been suggested as a means to counter these difficulties, (e.g., see Ben-Yakar and Hanson (1998)). A cavity entrains fuel and air from the free stream through the shear layer, or air and fuel can injected directly into the cavity itself. A cavity-based flameholder a) creates a sheltered subsonic recirculation area of hot combustion products and increases the effective residence time for the fuel, and b) acts as a pilot light to spread hot combustion products into the main flow. The flow in the vicinity of the cavity can be very stable and can limit the amount of mass entrainment. Numerical computations by Gruber et al. (2001) showed the presence of a pair of trapped vortices within the cavity, including a large primary recirculation zone that interacts with the free stream, and a smaller fuel-rich secondary vortex in the forward corner of the cavity (See Fig. 1).
Figure 1. Fuel distribution in a closed cavity flameholder. Darker shades indicate fuel-rich regions (Gruber et
al., 2001).
Gruber et al. (2004) concluded that the fuel-rich lobes limited the combustion in the upstream portions of the cavity and caused fluctuations downstream of the cavity. Ben-Yakar and Hanson (1998) had suggested that the mass entrainment can be improved with the addition of fuel or a fuel-air combination within or upstream of the cavity. Gruber et al. (2004) showed that direct injection of fuel into the cavity flameholder to be an improvement over other forms of fuel injection, such as upstream injection. They noted a more uniform fuel-air mixture within the cavity, and increased robustness and stability of the flameholding. Allen et al. (2005) further investigated the effects of adding air injection with fuel injection directly into the cavity as a means of improving the fuel-air mixture within the cavity. They showed qualitatively that with in-cavity (direct) air injection, the size of the fuel rich vortex decreased with subsequent improvement in combustion within the cavity. It appears that the additional air injected directly into the cavity improved the fuel air mixture, especially near the forward step. Allen et al. (2005) also observed that the air injection technique did not have merely a linear effect on the fuel-rich region. Increasing the air injection without bound had diminishing effect, and eventually a reverse effect. For lower fuel injection rates, if the air injection was increased to its maximal limit the combustion increases seen at lower air injection rates diminished to levels near the original fuel-only case. It would seem that the direct air injection technique is able to cause the cavity fuel-air mixture to become too lean to gain any improvements in combustion if the air injection rate is not controlled. The focus of this research was to quantify the ability of the air injection technique to spread the combustion energy and products into the main flow and to measure the total pressure losses incurred during the process. While the work of Allen et al. (2005) was largely qualitative through the use of non-intrusive measurements, this research used intrusive probing to gather total pressure, total temperature, cone-static pressure and mixture composition for various fuel-air injection combinations. Of interest also was the enthalpy spread to the free stream flow for a given fuel-air setting. Gas mixture data were gathered in order to examine changes in flow mixture at the cavity exit for a given fuel-air mixture.
II. Research Methodology The test facility used is located in the Air Force Research Lab Propulsion Directorate complex in test cell
19. Its design and construction is discussed by Gruber and Nejad (1994). The free stream conditions supplied to the test section were Mach 2 flow with total pressure of 80 psia and total temperature of 580 °F. The conditions simulate Mach 4 flight conditions. The cavity flameholder used was of the same design discussed by Allen et al. (2005). The recessed cavity was mounted with the top edge flush with the diverging ramp section, and measured 2.6 inches in length by 6 inches wide by 0.65 inches deep. The recessed cavity had a forward step at a 90° degree angle and a 22.5° degree aft ramp angle. The cavity is shown in Fig. 2.
American Institute of Aeronautics and Astronautics
2
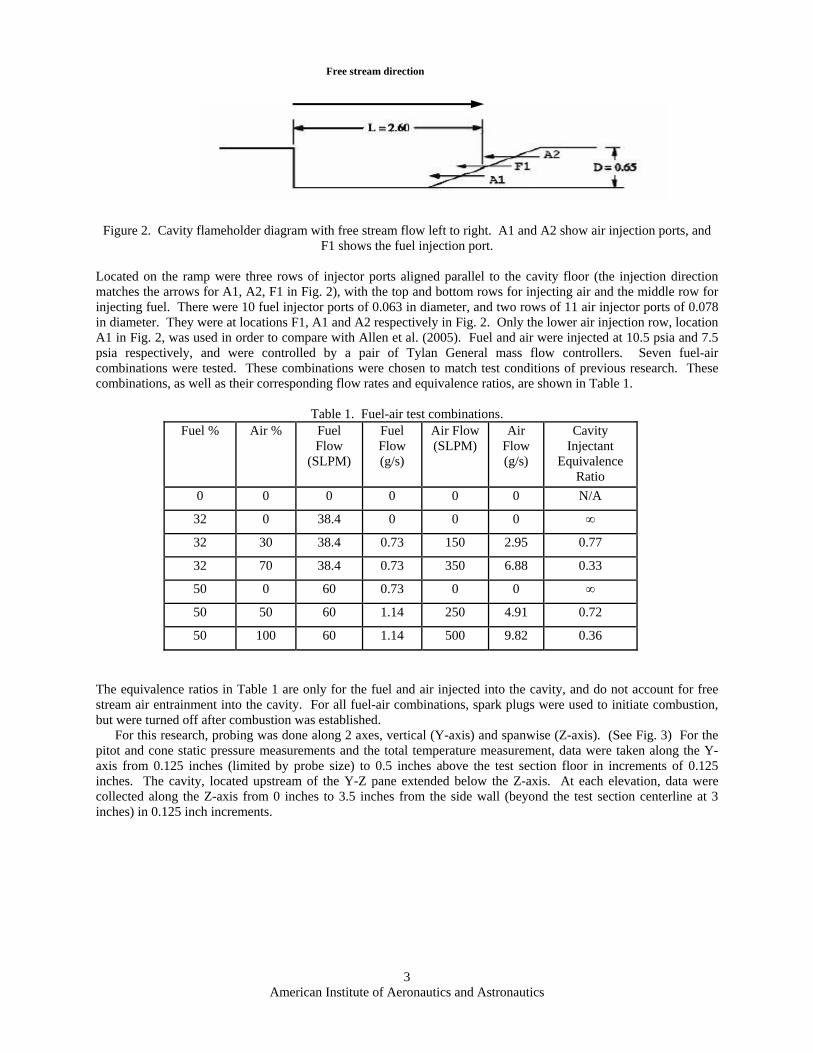
Free stream direction
Figure 2. Cavity flameholder diagram with free stream flow left to right. A1 and A2 show air injection ports, and F1 shows the fuel injection port.
Located on the ramp were three rows of injector ports aligned parallel to the cavity floor (the injection direction matches the arrows for A1, A2, F1 in Fig. 2), with the top and bottom rows for injecting air and the middle row for injecting fuel. There were 10 fuel injector ports of 0.063 in diameter, and two rows of 11 air injector ports of 0.078 in diameter. They were at locations F1, A1 and A2 respectively in Fig. 2. Only the lower air injection row, location A1 in Fig. 2, was used in order to compare with Allen et al. (2005). Fuel and air were injected at 10.5 psia and 7.5 psia respectively, and were controlled by a pair of Tylan General mass flow controllers. Seven fuel-air combinations were tested. These combinations were chosen to match test conditions of previous research. These combinations, as well as their corresponding flow rates and equivalence ratios, are shown in Table 1.
Table 1. Fuel-air test combinations. Fuel % Air % Fuel
Flow (SLPM)
Fuel Flow (g/s)
Air Flow (SLPM)
Air Flow (g/s)
Cavity Injectant
Equivalence Ratio
0 0 0 0 0 0 N/A
32 0 38.4 0 0 0 ∞
32 30 38.4 0.73 150 2.95 0.77
32 70 38.4 0.73 350 6.88 0.33
50 0 60 0.73 0 0 ∞
50 50 60 1.14 250 4.91 0.72
50 100 60 1.14 500 9.82 0.36
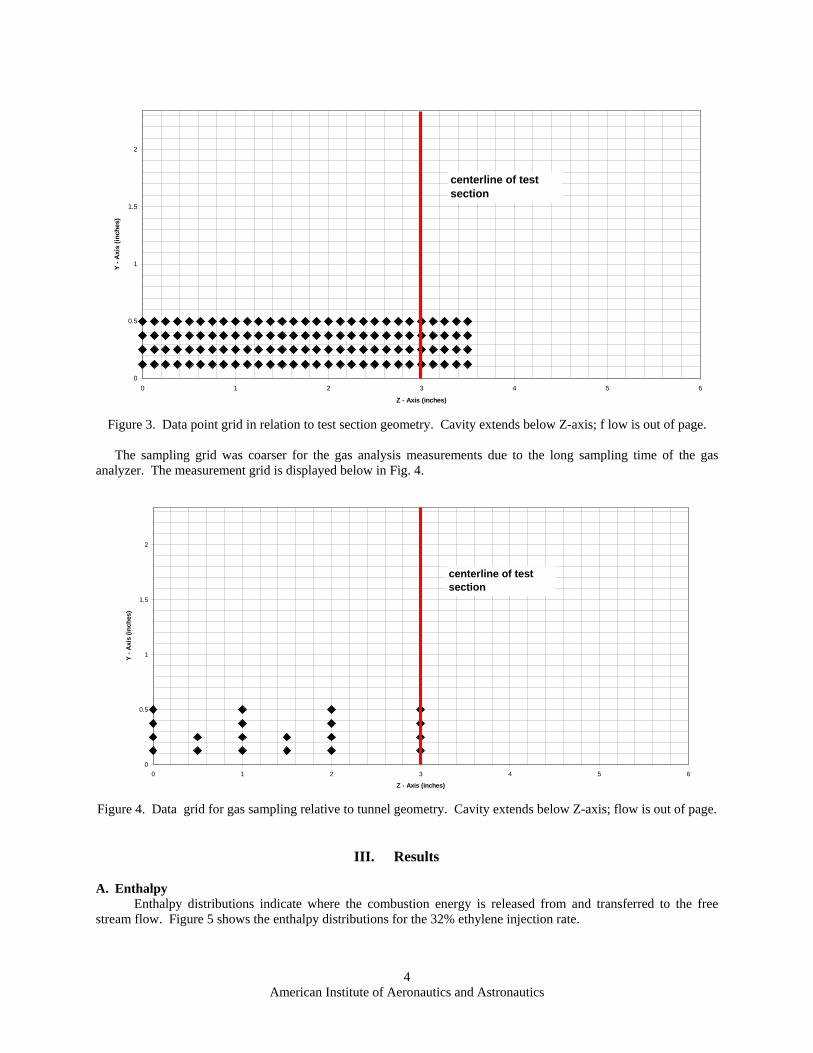
The equivalence ratios in Table 1 are only for the fuel and air injected into the cavity, and do not account for free stream air entrainment into the cavity. For all fuel-air combinations, spark plugs were used to initiate combustion, but were turned off after combustion was established. For this research, probing was done along 2 axes, vertical (Y-axis) and spanwise (Z-axis). (See Fig. 3) For the pitot and cone static pressure measurements and the total temperature measurement, data were taken along the Y-axis from 0.125 inches (limited by probe size) to 0.5 inches above the test section floor in increments of 0.125 inches. The cavity, located upstream of the Y-Z pane extended below the Z-axis. At each elevation, data were collected along the Z-axis from 0 inches to 3.5 inches from the side wall (beyond the test section centerline at 3 inches) in 0.125 inch increments.
American Institute of Aeronautics and Astronautics
3
0
0.5
1
1.5
2
0 1 2 3 4 5 6
Z - Axis (inches)
Y - A
xis
(inch
es)
centerline of test section
Figure 3. Data point grid in relation to test section geometry. Cavity extends below Z-axis; f low is out of page.
The sampling grid was coarser for the gas analysis measurements due to the long sampling time of the gas analyzer. The measurement grid is displayed below in Fig. 4.
0
0.5
1
1.5
2
0 1 2 3 4 5 6
Z - Axis (inches)
Y - A
xis
(inch
es)
centerline of test section
Figure 4. Data grid for gas sampling relative to tunnel geometry. Cavity extends below Z-axis; flow is out of page.
III. Results
A. Enthalpy Enthalpy distributions indicate where the combustion energy is released from and transferred to the free
stream flow. Figure 5 shows the enthalpy distributions for the 32% ethylene injection rate.
American Institute of Aeronautics and Astronautics
4
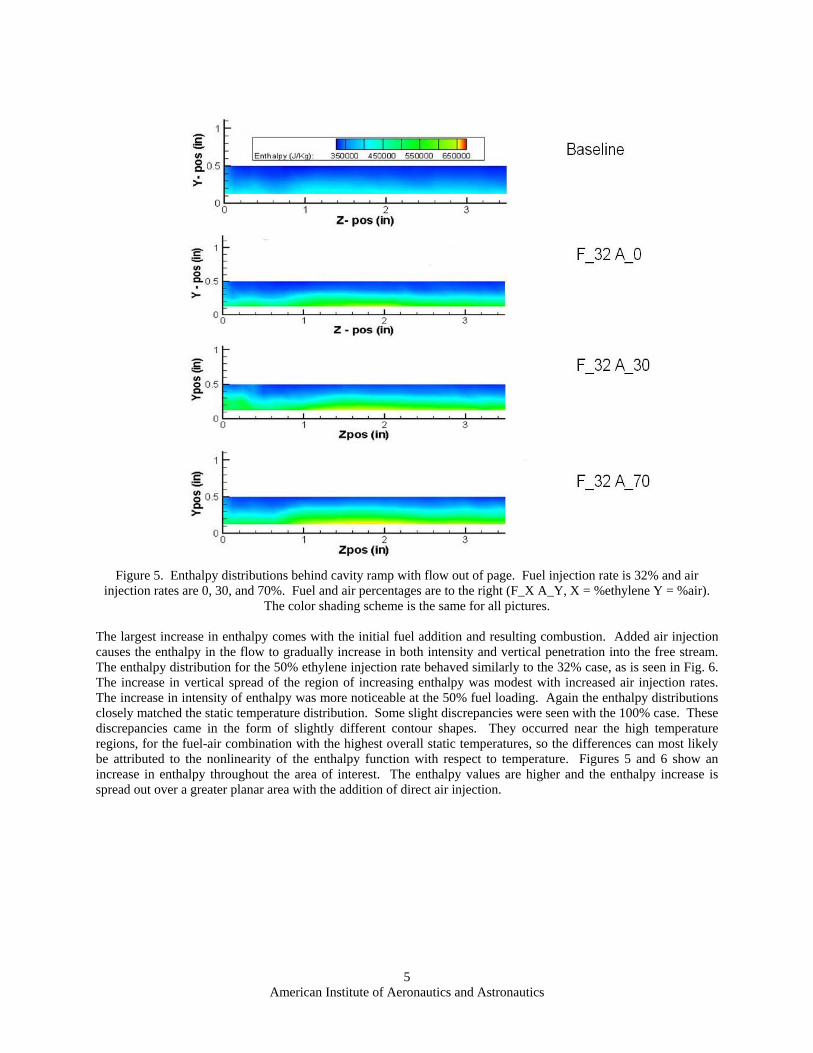
Figure 5. Enthalpy distributions behind cavity ramp with flow out of page. Fuel injection rate is 32% and air
injection rates are 0, 30, and 70%. Fuel and air percentages are to the right (F_X A_Y, X = %ethylene Y = %air). The color shading scheme is the same for all pictures.
The largest increase in enthalpy comes with the initial fuel addition and resulting combustion. Added air injection causes the enthalpy in the flow to gradually increase in both intensity and vertical penetration into the free stream. The enthalpy distribution for the 50% ethylene injection rate behaved similarly to the 32% case, as is seen in Fig. 6. The increase in vertical spread of the region of increasing enthalpy was modest with increased air injection rates. The increase in intensity of enthalpy was more noticeable at the 50% fuel loading. Again the enthalpy distributions closely matched the static temperature distribution. Some slight discrepancies were seen with the 100% case. These discrepancies came in the form of slightly different contour shapes. They occurred near the high temperature regions, for the fuel-air combination with the highest overall static temperatures, so the differences can most likely be attributed to the nonlinearity of the enthalpy function with respect to temperature. Figures 5 and 6 show an increase in enthalpy throughout the area of interest. The enthalpy values are higher and the enthalpy increase is spread out over a greater planar area with the addition of direct air injection.
American Institute of Aeronautics and Astronautics
5
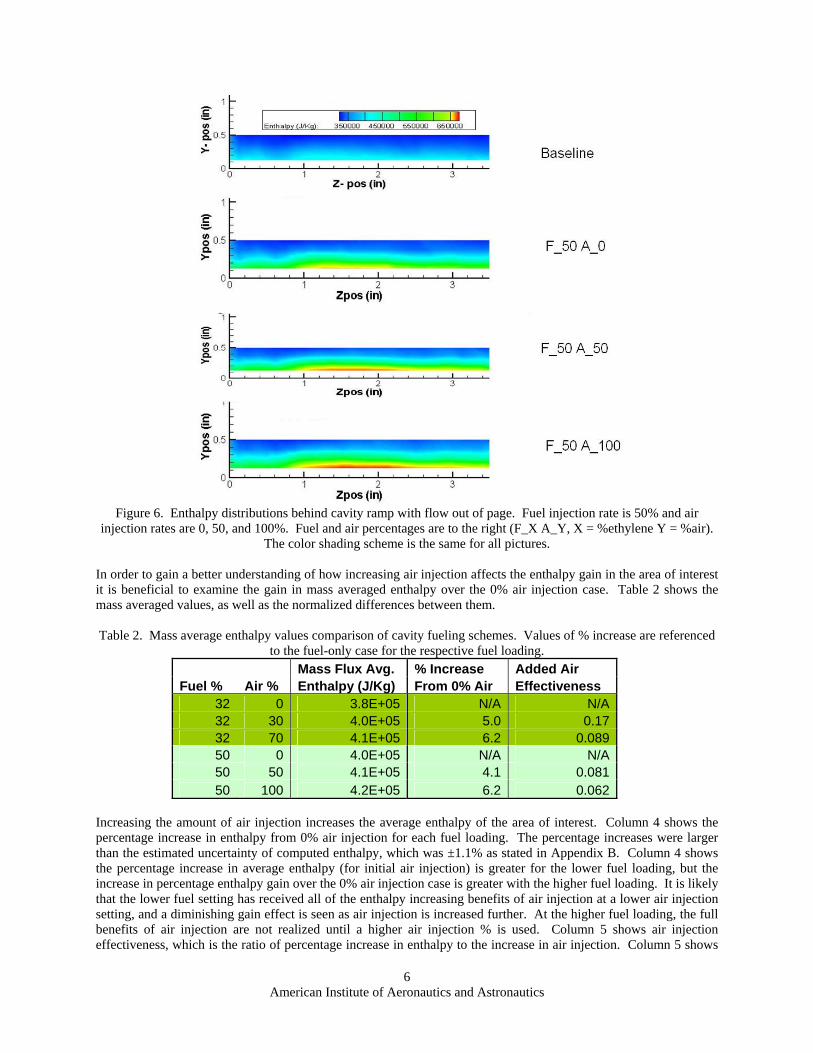
Figure 6. Enthalpy distributions behind cavity ramp with flow out of page. Fuel injection rate is 50% and air
injection rates are 0, 50, and 100%. Fuel and air percentages are to the right (F_X A_Y, X = %ethylene Y = %air). The color shading scheme is the same for all pictures.
In order to gain a better understanding of how increasing air injection affects the enthalpy gain in the area of interest it is beneficial to examine the gain in mass averaged enthalpy over the 0% air injection case. Table 2 shows the mass averaged values, as well as the normalized differences between them.
Table 2. Mass average enthalpy values comparison of cavity fueling schemes. Values of % increase are referenced
to the fuel-only case for the respective fuel loading. Mass Flux Avg. % Increase Added Air Fuel % Air % Enthalpy (J/Kg) From 0% Air Effectiveness
32 0 3.8E+05 N/A N/A 32 30 4.0E+05 5.0 0.17 32 70 4.1E+05 6.2 0.089 50 0 4.0E+05 N/A N/A 50 50 4.1E+05 4.1 0.081 50 100 4.2E+05 6.2 0.062
Increasing the amount of air injection increases the average enthalpy of the area of interest. Column 4 shows the percentage increase in enthalpy from 0% air injection for each fuel loading. The percentage increases were larger than the estimated uncertainty of computed enthalpy, which was ±1.1% as stated in Appendix B. Column 4 shows the percentage increase in average enthalpy (for initial air injection) is greater for the lower fuel loading, but the increase in percentage enthalpy gain over the 0% air injection case is greater with the higher fuel loading. It is likely that the lower fuel setting has received all of the enthalpy increasing benefits of air injection at a lower air injection setting, and a diminishing gain effect is seen as air injection is increased further. At the higher fuel loading, the full benefits of air injection are not realized until a higher air injection % is used. Column 5 shows air injection effectiveness, which is the ratio of percentage increase in enthalpy to the increase in air injection. Column 5 shows
American Institute of Aeronautics and Astronautics
6
that the ability of air injection to increase the enthalpy of the area of interest is greatest for the lower fuel loading. Column 5 also shows that the benefits of increased air injection begin to diminish at a lower air injection setting for the lower fuel loading. Thus while air injection appears less effective at increasing combustive heat release at higher fuel loadings on a per-unit-mass basis, the higher fuel loading appears to benefit more from increasing air injection rate. That is the higher fuel loading stands to gain more from increasing air injection, even if each unit mass of injected air effects the higher fuel loading less than the lower fuel loading. It seems clear then that the air injection method is directly affecting the cavity combustion by improving the fuel-air mixture within the cavity, and thus leading to greater enthalpy spread into the area of interest.
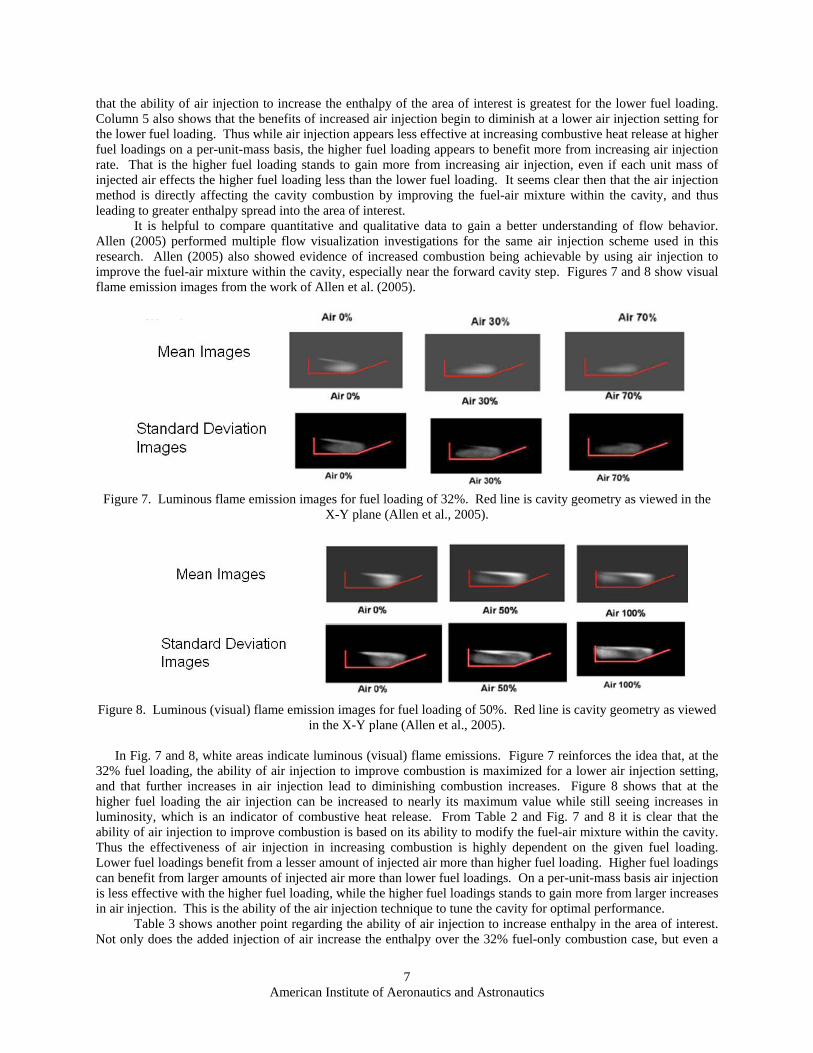
It is helpful to compare quantitative and qualitative data to gain a better understanding of flow behavior. Allen (2005) performed multiple flow visualization investigations for the same air injection scheme used in this research. Allen (2005) also showed evidence of increased combustion being achievable by using air injection to improve the fuel-air mixture within the cavity, especially near the forward cavity step. Figures 7 and 8 show visual flame emission images from the work of Allen et al. (2005).
Figure 7. Luminous flame emission images for fuel loading of 32%. Red line is cavity geometry as viewed in the
X-Y plane (Allen et al., 2005).
Figure 8. Luminous (visual) flame emission images for fuel loading of 50%. Red line is cavity geometry as viewed
in the X-Y plane (Allen et al., 2005).
In Fig. 7 and 8, white areas indicate luminous (visual) flame emissions. Figure 7 reinforces the idea that, at the 32% fuel loading, the ability of air injection to improve combustion is maximized for a lower air injection setting, and that further increases in air injection lead to diminishing combustion increases. Figure 8 shows that at the higher fuel loading the air injection can be increased to nearly its maximum value while still seeing increases in luminosity, which is an indicator of combustive heat release. From Table 2 and Fig. 7 and 8 it is clear that the ability of air injection to improve combustion is based on its ability to modify the fuel-air mixture within the cavity. Thus the effectiveness of air injection in increasing combustion is highly dependent on the given fuel loading. Lower fuel loadings benefit from a lesser amount of injected air more than higher fuel loading. Higher fuel loadings can benefit from larger amounts of injected air more than lower fuel loadings. On a per-unit-mass basis air injection is less effective with the higher fuel loading, while the higher fuel loadings stands to gain more from larger increases in air injection. This is the ability of the air injection technique to tune the cavity for optimal performance.
Table 3 shows another point regarding the ability of air injection to increase enthalpy in the area of interest. Not only does the added injection of air increase the enthalpy over the 32% fuel-only combustion case, but even a
American Institute of Aeronautics and Astronautics
7
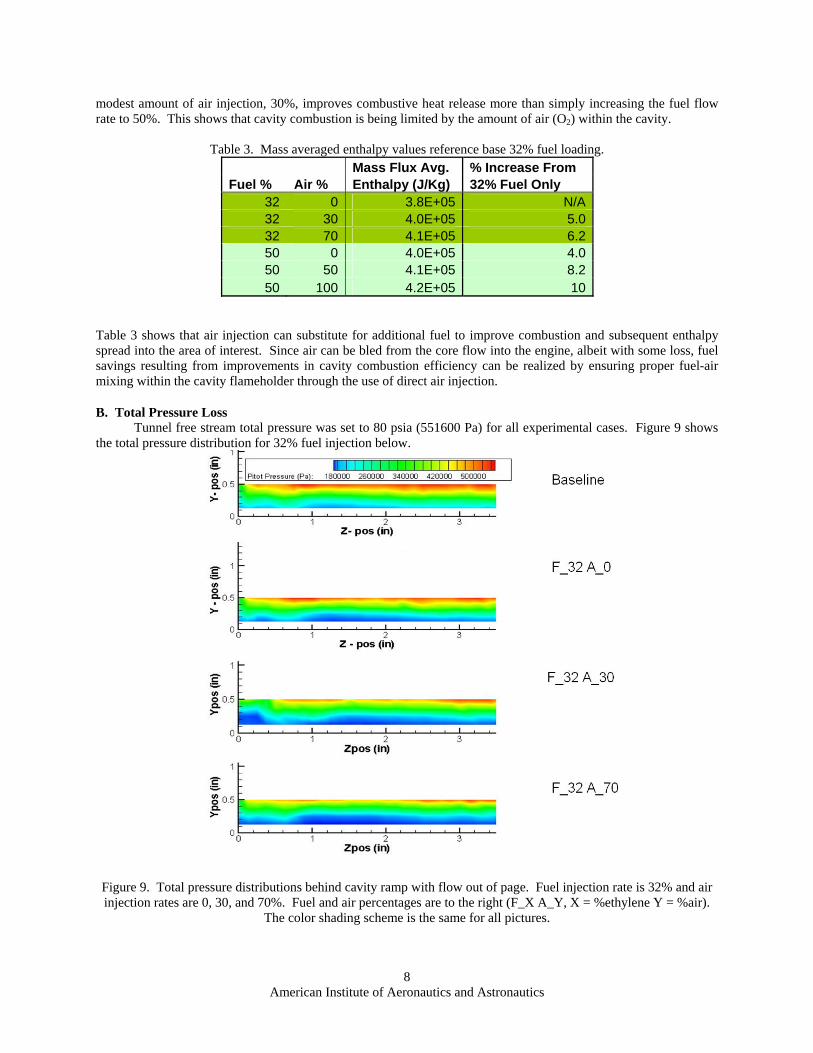
modest amount of air injection, 30%, improves combustive heat release more than simply increasing the fuel flow rate to 50%. This shows that cavity combustion is being limited by the amount of air (O2) within the cavity.
Table 3. Mass averaged enthalpy values reference base 32% fuel loading.
Mass Flux Avg. % Increase From Fuel % Air % Enthalpy (J/Kg) 32% Fuel Only
32 0 3.8E+05 N/A 32 30 4.0E+05 5.0 32 70 4.1E+05 6.2 50 0 4.0E+05 4.0 50 50 4.1E+05 8.2 50 100 4.2E+05 10
Table 3 shows that air injection can substitute for additional fuel to improve combustion and subsequent enthalpy spread into the area of interest. Since air can be bled from the core flow into the engine, albeit with some loss, fuel savings resulting from improvements in cavity combustion efficiency can be realized by ensuring proper fuel-air mixing within the cavity flameholder through the use of direct air injection.
B. Total Pressure Loss Tunnel free stream total pressure was set to 80 psia (551600 Pa) for all experimental cases. Figure 9 shows
the total pressure distribution for 32% fuel injection below.
Figure 9. Total pressure distributions behind cavity ramp with flow out of page. Fuel injection rate is 32% and air injection rates are 0, 30, and 70%. Fuel and air percentages are to the right (F_X A_Y, X = %ethylene Y = %air).
The color shading scheme is the same for all pictures.
American Institute of Aeronautics and Astronautics
8
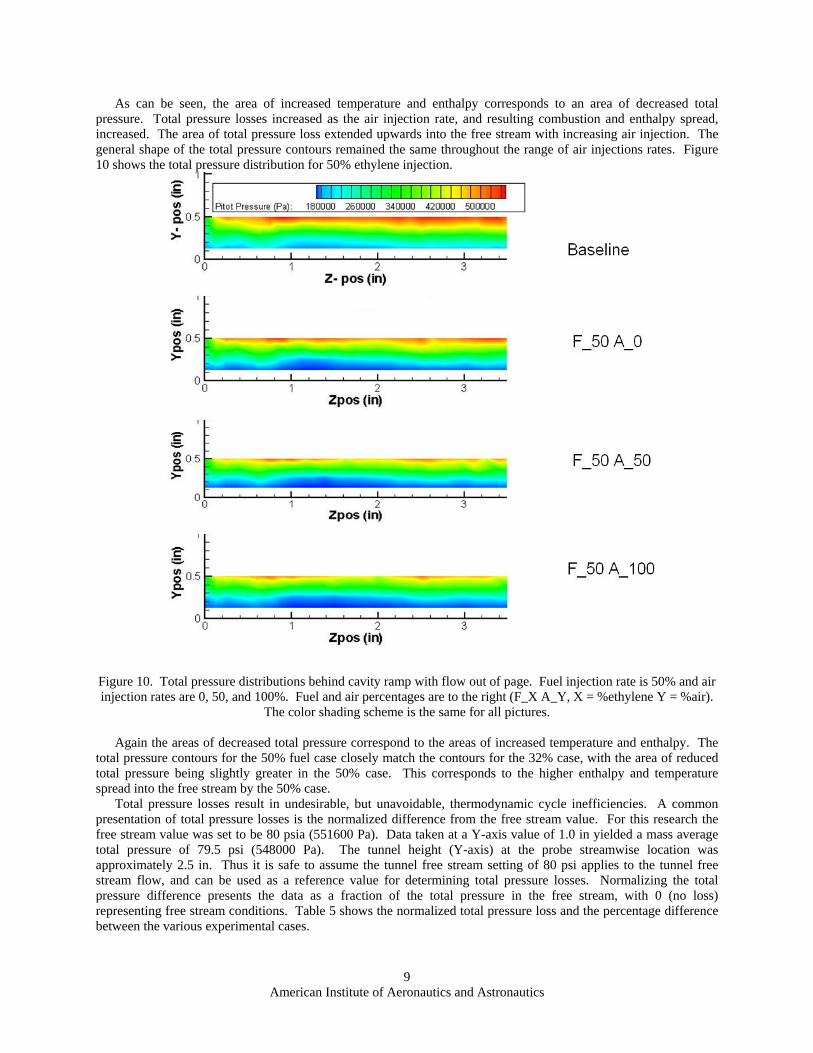
As can be seen, the area of increased temperature and enthalpy corresponds to an area of decreased total pressure. Total pressure losses increased as the air injection rate, and resulting combustion and enthalpy spread, increased. The area of total pressure loss extended upwards into the free stream with increasing air injection. The general shape of the total pressure contours remained the same throughout the range of air injections rates. Figure 10 shows the total pressure distribution for 50% ethylene injection.
Figure 10. Total pressure distributions behind cavity ramp with flow out of page. Fuel injection rate is 50% and air injection rates are 0, 50, and 100%. Fuel and air percentages are to the right (F_X A_Y, X = %ethylene Y = %air).
The color shading scheme is the same for all pictures.
Again the areas of decreased total pressure correspond to the areas of increased temperature and enthalpy. The total pressure contours for the 50% fuel case closely match the contours for the 32% case, with the area of reduced total pressure being slightly greater in the 50% case. This corresponds to the higher enthalpy and temperature spread into the free stream by the 50% case.
Total pressure losses result in undesirable, but unavoidable, thermodynamic cycle inefficiencies. A common presentation of total pressure losses is the normalized difference from the free stream value. For this research the free stream value was set to be 80 psia (551600 Pa). Data taken at a Y-axis value of 1.0 in yielded a mass average total pressure of 79.5 psi (548000 Pa). The tunnel height (Y-axis) at the probe streamwise location was approximately 2.5 in. Thus it is safe to assume the tunnel free stream setting of 80 psi applies to the tunnel free stream flow, and can be used as a reference value for determining total pressure losses. Normalizing the total pressure difference presents the data as a fraction of the total pressure in the free stream, with 0 (no loss) representing free stream conditions. Table 5 shows the normalized total pressure loss and the percentage difference between the various experimental cases.
American Institute of Aeronautics and Astronautics
9
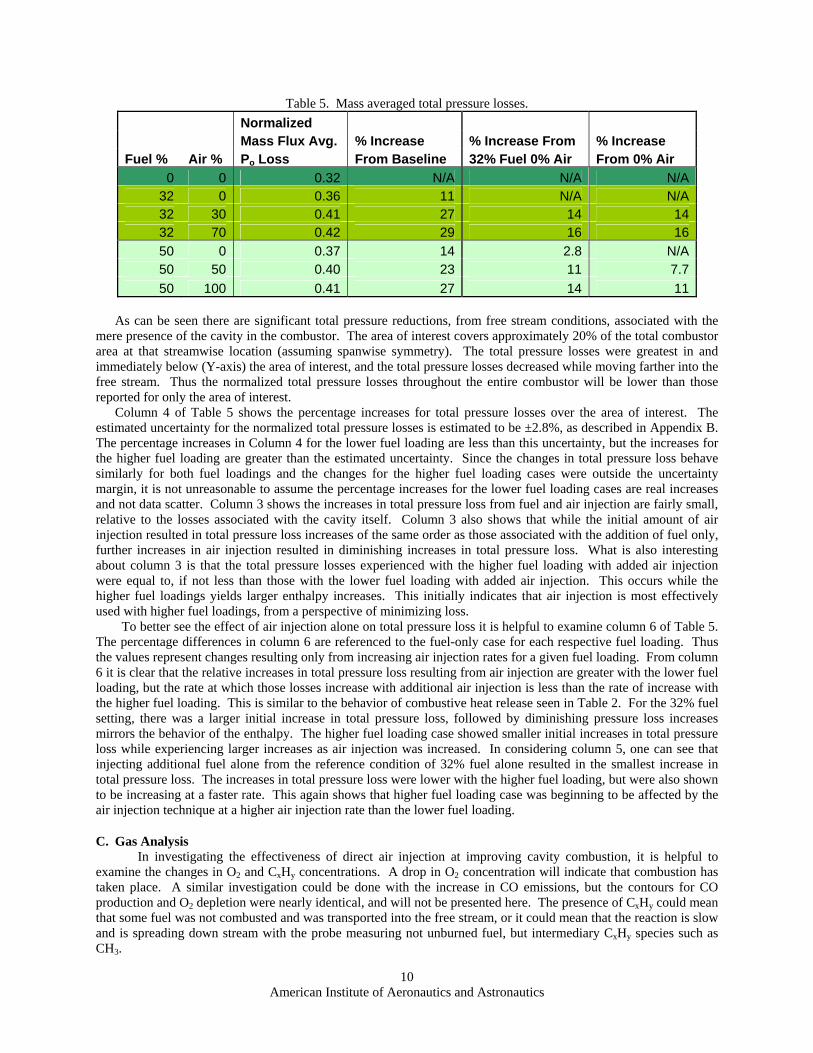
Table 5. Mass averaged total pressure losses. Normalized Mass Flux Avg. % Increase % Increase From % Increase Fuel % Air % Po Loss From Baseline 32% Fuel 0% Air From 0% Air
0 0 0.32 N/A N/A N/A32 0 0.36 11 N/A N/A32 30 0.41 27 14 1432 70 0.42 29 16 1650 0 0.37 14 2.8 N/A50 50 0.40 23 11 7.750 100 0.41 27 14 11
As can be seen there are significant total pressure reductions, from free stream conditions, associated with the
mere presence of the cavity in the combustor. The area of interest covers approximately 20% of the total combustor area at that streamwise location (assuming spanwise symmetry). The total pressure losses were greatest in and immediately below (Y-axis) the area of interest, and the total pressure losses decreased while moving farther into the free stream. Thus the normalized total pressure losses throughout the entire combustor will be lower than those reported for only the area of interest.
Column 4 of Table 5 shows the percentage increases for total pressure losses over the area of interest. The estimated uncertainty for the normalized total pressure losses is estimated to be ±2.8%, as described in Appendix B. The percentage increases in Column 4 for the lower fuel loading are less than this uncertainty, but the increases for the higher fuel loading are greater than the estimated uncertainty. Since the changes in total pressure loss behave similarly for both fuel loadings and the changes for the higher fuel loading cases were outside the uncertainty margin, it is not unreasonable to assume the percentage increases for the lower fuel loading cases are real increases and not data scatter. Column 3 shows the increases in total pressure loss from fuel and air injection are fairly small, relative to the losses associated with the cavity itself. Column 3 also shows that while the initial amount of air injection resulted in total pressure loss increases of the same order as those associated with the addition of fuel only, further increases in air injection resulted in diminishing increases in total pressure loss. What is also interesting about column 3 is that the total pressure losses experienced with the higher fuel loading with added air injection were equal to, if not less than those with the lower fuel loading with added air injection. This occurs while the higher fuel loadings yields larger enthalpy increases. This initially indicates that air injection is most effectively used with higher fuel loadings, from a perspective of minimizing loss.
To better see the effect of air injection alone on total pressure loss it is helpful to examine column 6 of Table 5. The percentage differences in column 6 are referenced to the fuel-only case for each respective fuel loading. Thus the values represent changes resulting only from increasing air injection rates for a given fuel loading. From column 6 it is clear that the relative increases in total pressure loss resulting from air injection are greater with the lower fuel loading, but the rate at which those losses increase with additional air injection is less than the rate of increase with the higher fuel loading. This is similar to the behavior of combustive heat release seen in Table 2. For the 32% fuel setting, there was a larger initial increase in total pressure loss, followed by diminishing pressure loss increases mirrors the behavior of the enthalpy. The higher fuel loading case showed smaller initial increases in total pressure loss while experiencing larger increases as air injection was increased. In considering column 5, one can see that injecting additional fuel alone from the reference condition of 32% fuel alone resulted in the smallest increase in total pressure loss. The increases in total pressure loss were lower with the higher fuel loading, but were also shown to be increasing at a faster rate. This again shows that higher fuel loading case was beginning to be affected by the air injection technique at a higher air injection rate than the lower fuel loading.
C. Gas Analysis In investigating the effectiveness of direct air injection at improving cavity combustion, it is helpful to
examine the changes in O2 and CxHy concentrations. A drop in O2 concentration will indicate that combustion has taken place. A similar investigation could be done with the increase in CO emissions, but the contours for CO production and O2 depletion were nearly identical, and will not be presented here. The presence of CxHy could mean that some fuel was not combusted and was transported into the free stream, or it could mean that the reaction is slow and is spreading down stream with the probe measuring not unburned fuel, but intermediary CxHy species such as CH3.
American Institute of Aeronautics and Astronautics
10
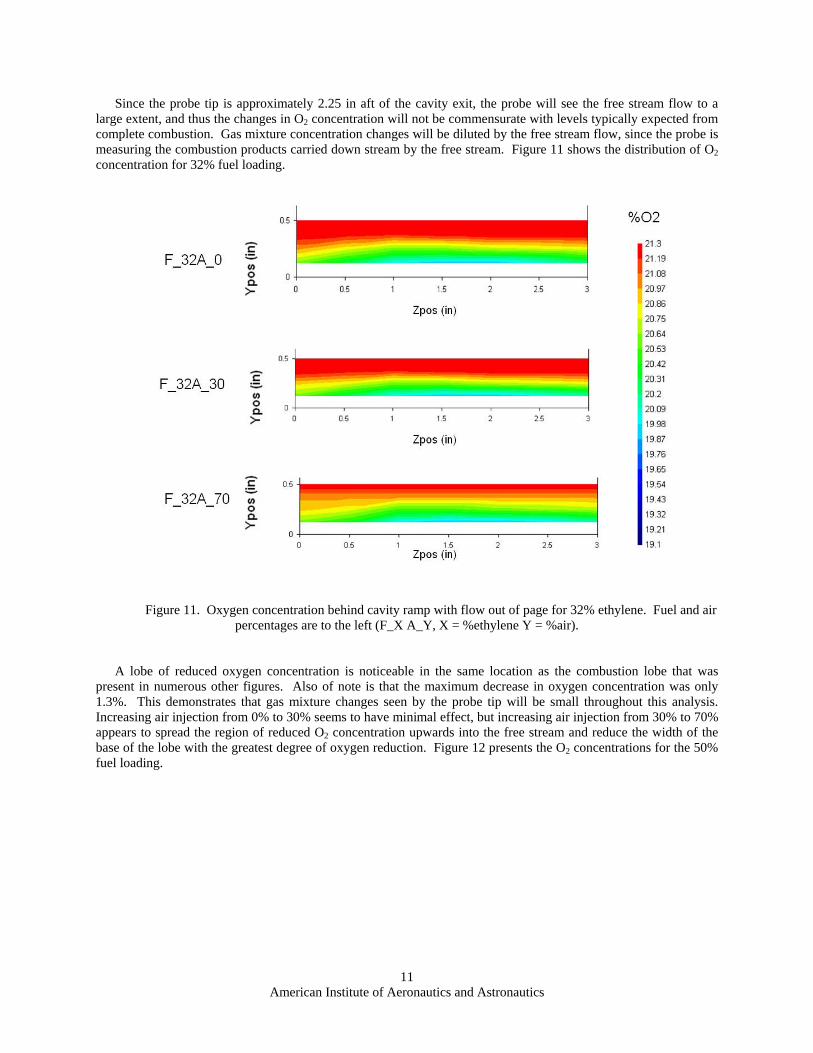
Since the probe tip is approximately 2.25 in aft of the cavity exit, the probe will see the free stream flow to a large extent, and thus the changes in O2 concentration will not be commensurate with levels typically expected from complete combustion. Gas mixture concentration changes will be diluted by the free stream flow, since the probe is measuring the combustion products carried down stream by the free stream. Figure 11 shows the distribution of O2 concentration for 32% fuel loading.
Figure 11. Oxygen concentration behind cavity ramp with flow out of page for 32% ethylene. Fuel and air
percentages are to the left (F_X A_Y, X = %ethylene Y = %air).
A lobe of reduced oxygen concentration is noticeable in the same location as the combustion lobe that was present in numerous other figures. Also of note is that the maximum decrease in oxygen concentration was only 1.3%. This demonstrates that gas mixture changes seen by the probe tip will be small throughout this analysis. Increasing air injection from 0% to 30% seems to have minimal effect, but increasing air injection from 30% to 70% appears to spread the region of reduced O2 concentration upwards into the free stream and reduce the width of the base of the lobe with the greatest degree of oxygen reduction. Figure 12 presents the O2 concentrations for the 50% fuel loading.
American Institute of Aeronautics and Astronautics
11
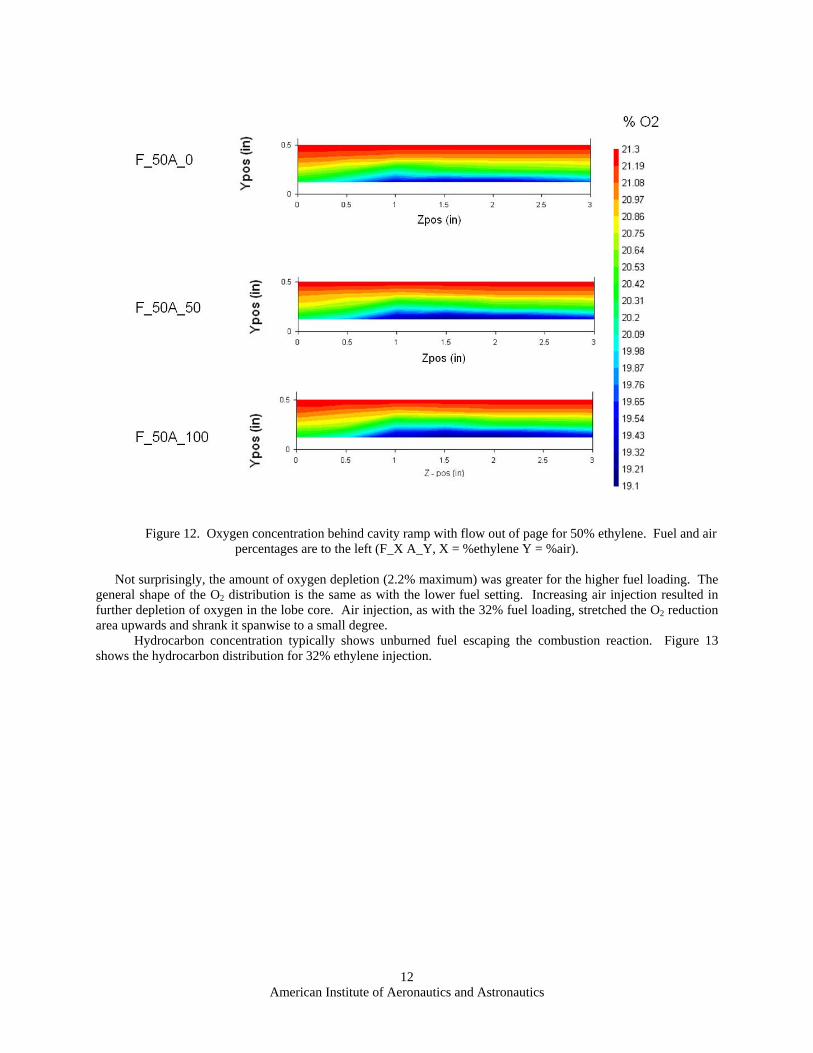
Figure 12. Oxygen concentration behind cavity ramp with flow out of page for 50% ethylene. Fuel and air
percentages are to the left (F_X A_Y, X = %ethylene Y = %air).
Not surprisingly, the amount of oxygen depletion (2.2% maximum) was greater for the higher fuel loading. The general shape of the O2 distribution is the same as with the lower fuel setting. Increasing air injection resulted in further depletion of oxygen in the lobe core. Air injection, as with the 32% fuel loading, stretched the O2 reduction area upwards and shrank it spanwise to a small degree.
Hydrocarbon concentration typically shows unburned fuel escaping the combustion reaction. Figure 13 shows the hydrocarbon distribution for 32% ethylene injection.
American Institute of Aeronautics and Astronautics
12
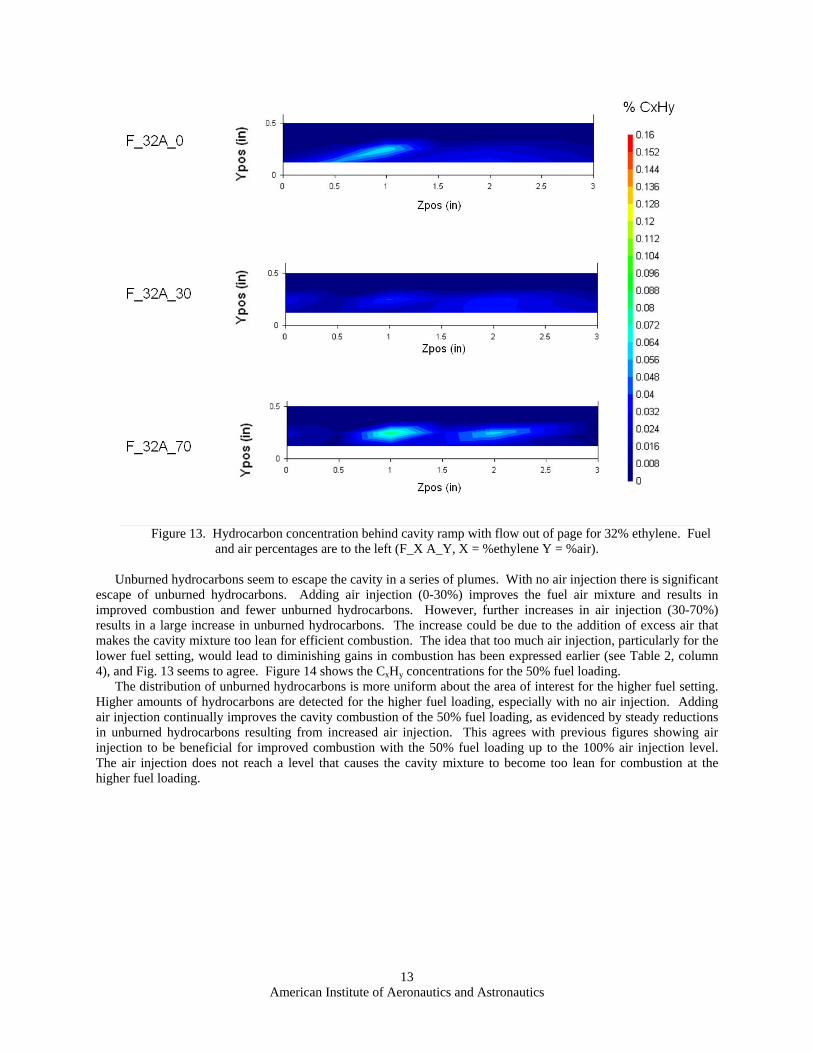
Figure 13. Hydrocarbon concentration behind cavity ramp with flow out of page for 32% ethylene. Fuel
and air percentages are to the left (F_X A_Y, X = %ethylene Y = %air).
Unburned hydrocarbons seem to escape the cavity in a series of plumes. With no air injection there is significant escape of unburned hydrocarbons. Adding air injection (0-30%) improves the fuel air mixture and results in improved combustion and fewer unburned hydrocarbons. However, further increases in air injection (30-70%) results in a large increase in unburned hydrocarbons. The increase could be due to the addition of excess air that makes the cavity mixture too lean for efficient combustion. The idea that too much air injection, particularly for the lower fuel setting, would lead to diminishing gains in combustion has been expressed earlier (see Table 2, column 4), and Fig. 13 seems to agree. Figure 14 shows the CxHy concentrations for the 50% fuel loading.
The distribution of unburned hydrocarbons is more uniform about the area of interest for the higher fuel setting. Higher amounts of hydrocarbons are detected for the higher fuel loading, especially with no air injection. Adding air injection continually improves the cavity combustion of the 50% fuel loading, as evidenced by steady reductions in unburned hydrocarbons resulting from increased air injection. This agrees with previous figures showing air injection to be beneficial for improved combustion with the 50% fuel loading up to the 100% air injection level. The air injection does not reach a level that causes the cavity mixture to become too lean for combustion at the higher fuel loading.
American Institute of Aeronautics and Astronautics
13
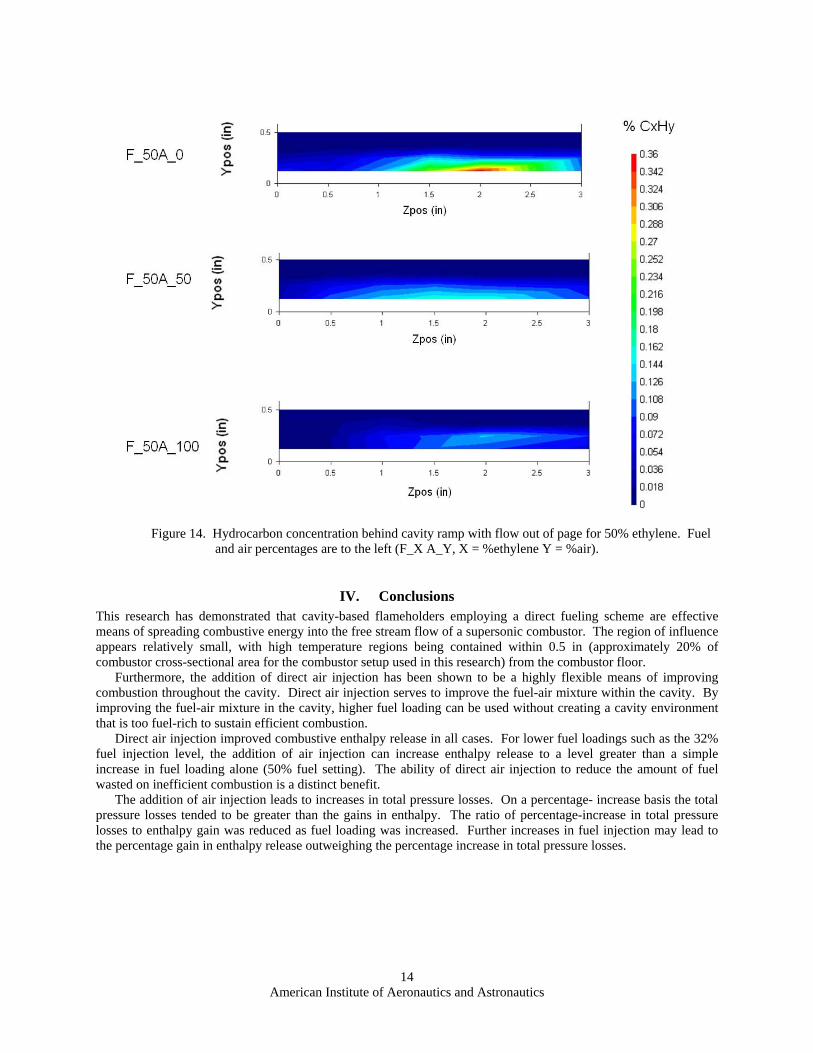
Figure 14. Hydrocarbon concentration behind cavity ramp with flow out of page for 50% ethylene. Fuel
and air percentages are to the left (F_X A_Y, X = %ethylene Y = %air).
IV. Conclusions This research has demonstrated that cavity-based flameholders employing a direct fueling scheme are effective means of spreading combustive energy into the free stream flow of a supersonic combustor. The region of influence appears relatively small, with high temperature regions being contained within 0.5 in (approximately 20% of combustor cross-sectional area for the combustor setup used in this research) from the combustor floor.
Furthermore, the addition of direct air injection has been shown to be a highly flexible means of improving combustion throughout the cavity. Direct air injection serves to improve the fuel-air mixture within the cavity. By improving the fuel-air mixture in the cavity, higher fuel loading can be used without creating a cavity environment that is too fuel-rich to sustain efficient combustion.
Direct air injection improved combustive enthalpy release in all cases. For lower fuel loadings such as the 32% fuel injection level, the addition of air injection can increase enthalpy release to a level greater than a simple increase in fuel loading alone (50% fuel setting). The ability of direct air injection to reduce the amount of fuel wasted on inefficient combustion is a distinct benefit.
The addition of air injection leads to increases in total pressure losses. On a percentage- increase basis the total pressure losses tended to be greater than the gains in enthalpy. The ratio of percentage-increase in total pressure losses to enthalpy gain was reduced as fuel loading was increased. Further increases in fuel injection may lead to the percentage gain in enthalpy release outweighing the percentage increase in total pressure losses.
American Institute of Aeronautics and Astronautics
14
Acknowledgments
The authors would like to acknowledge the contributions of W. Terry, D. Schommer, Todd Barstow and H. Meicenheimer for their technical support on this effort. The support of the Air Force Research Laboratory and the Air Force Institute of Technology are also appreciated.
The views expressed in this article are those of the author and do not reflect the official policy or position of the United States Air Force, Department of Defense, or the U.S. Government.
References Allen, W.H., King, P.I., Gruber, “Fuel-Air Injection Effects on Combustion in Cavity-Based Flameholders in a Supersonic Flow,”AIAA-2005-4105, 41st AIAA/ASME/SAE/ASEE Joint Prop. Conf., Tucson, AZ, 10-13 Jul 2005. Ben-Yakar, A. and Hanson, R. K., “Cavity Flameholders for Ignition and Flame Stabilization in Scramjets: Review and Experimental Study,” AIAA paper 98-3122, July 1998. Gruber, M., Baurle,R., Mathur,T., and Hsu, K., “Fundamental Studies of Cavity-Based Flameholder Concepts for Supersonic Combustors”, AIAA Journal of Propulsion and Power, Vol. 17, No. 1, 2001, pp. 146-153. Gruber, M.R., Donbar, J.M., Carter, C.D. and Hsu, K-Y., “Mixing and Combustion Studies Using Cavity-Based Flameholders in Supersonic Flow,” AIAA Journal of Propulsion and Power Vol. 20 No. 5, 2004, pp.769-778. Gruber, M.R., Nejad, A.S., “Development of a Large-Scale Supersonic Combustion Research Facility,” AIAA paper 94-0544, 32nd Aerospace Sciences Meeting and Exhibit, January 10-13, 1994, Reno, NV.
American Institute of Aeronautics and Astronautics
15