Embed Size (px)
Citation preview
Performance measurement for new mobile data services during generation upgrading period: a case of China’s telecom industryYu Du1* , Xiao H. Zhang2, Zheng R. Li2 and Yi J. Guo3
1 IntroductionIn recent years, mobile data services as the basic supporting service for the development of mobile internet [1–5], big data [6–10], cloud computing [11–15] and IoT (Internet of things) [16–19] have received widespread attention. From the aspect of telecom opera-tors, with the commercialization of 3G and 4G networks, mobile data services are bring-ing more incomes than traditional voice services in many countries, and becoming the concerns of telecom customers [20]. Accordingly, more and more researchers and man-agers are taking an interest in performance measurement for mobile data services, most previous studies aim at users’ behavior, price of services, network quality and so on [21–25], quite few on dynamic measure of overall service performance.
Abstract
For the global telecom operators, mobile data services have gradually taken the part of traditional voice services to become the main revenue growth point. However, during the upgrading period of new generation networks (such as 5G), new mobile data services are still at the stage of exploration; the network capabilities and the application scenarios are unmatured. In this phase, it is incomplete and misleading to simply measure the performance of new services from one dimension, such as data traffic or revenue, and the measurement should be dynamically changed according to the development of the new services. Therefore, telecom operators want to improve the existing performance measurement from the aspect of integrity and dynamics. In this paper, we propose mobile-data-service development index (MDDI) and build a quantitative model to dynamic measure the overall performance of mobile data services. To approach a fuller understanding, we creatively bring investment indicators and networks reliability indicators into performance indicators system and discuss the relationships among subindices and the selection of outcome criteria in MDDI. In the part of empirical research, we use the model to analyze the dynamic characteristics of a new mobile data service in China and summarize the development strategies of every stage. The findings can also give guidelines for new services of 5G and other new generation networks in the future.
Keywords: Performance measurement, Mobile data services, Generation upgrading, 5G, PLS SEM
Open Access
© The Author(s), 2021. Open Access This article is licensed under a Creative Commons Attribution 4.0 International License, which permits use, sharing, adaptation, distribution and reproduction in any medium or format, as long as you give appropriate credit to the original author(s) and the source, provide a link to the Creative Commons licence, and indicate if changes were made. The images or other third party material in this article are included in the article’s Creative Commons licence, unless indicated otherwise in a credit line to the mate-rial. If material is not included in the article’s Creative Commons licence and your intended use is not permitted by statutory regulation or exceeds the permitted use, you will need to obtain permission directly from the copyright holder. To view a copy of this licence, visit http:// creat iveco mmons. org/ licen ses/ by/4. 0/.
RESEARCH
Du et al. J Wireless Com Network (2021) 2021:109 https://doi.org/10.1186/s13638-021-01993-5
*Correspondence: [email protected] 1 Business School, Beijing Language and Culture University, 15 Xueyuan Road, Haidian District, Beijing 100083, ChinaFull list of author information is available at the end of the article

Page 2 of 18Du et al. J Wireless Com Network (2021) 2021:109
However, during the upgrading period of new generation networks, new mobile data services, referred to as “new services,” are still at the stage of exploration, the network capabilities and the application scenarios are unmatured. In this phase, it is incomplete and misleading to simply measure the performance of new services from one dimension, such as data traffic or revenue, and the measurement should be dynamically changed according to the development of the new services. There-fore, telecom operators want to improve the existing performance measurement for mobile data services from the aspect of integrity and dynamics. On the one hand, it can help telecom operators find the operational issues of the news services in time that plays a great role in winning the market and keeping ahead. On the other hands, it can also provide evidence for government to make policy of mobile internet.
The methods of performance measurement for telecom services mainly include data envelopment analysis (DEA), exploratory factor analysis (EFA), principal com-ponents analysis (PCA), structural equation modeling (SEM) and so on. With fruit-ful results, many researchers used DEA method to measure the overall efficiency and performance of telecom services [22–24], but the results cannot help to gain insights on operational details such as service adoption, service usage and network quality. EFA and PCA are also often used in performance measurement, but these methods are only adaptable to the situation where the number of subindices and the relationships among them cannot be obtained through management experience and theory analysis. Compared to other methods, SEM method appears to have an advantage in this aspect [26], especially the PLS SEM method which has been rec-ommended in [27].
In this paper, we propose mobile-data-service development index (MDDI) and build a quantitative model based on PLS SEM to dynamic measure the overall per-formance of mobile data services. To approach a fuller understanding, we creatively bring investment indicators and networks reliability indicators into performance indi-cators system, and discuss the relationships among subindices and the selection of outcome criteria in MDDI. In the part of empirical research, we use the model to ana-lyze the dynamic characteristics of 4G service of one telecom operator in China, and the operational data have been collected from 2013 to 2015, which is the crucial time to the 4G service from start-ups to maturity (The usage of data has been authorized). The research object we chose is one of the global telecom industry leaders and has a demonstration effect to the others. Therefore, the findings and strategy suggestions of empirical research have strong universality. In addition, we try to combine develop-ment laws and management practices of the telecom with the key part of empirical research scheme (such as performance indicators system and evaluation period), and hope to further enhance the universality.
At present, most global telecom operators are deploying the 5G mobile system and networks, which have been gradually applied in business field by leading operators such as Verizon, SKT and China Mobile. Based on synthesis consideration of existing services and technological maturity, 5G services are still mainly personal data services now that are very similar to 4G. Therefore, the strategy suggestions of our empirical research have reference value especially for the telecom operators at the beginning stage of 5G.

Page 3 of 18Du et al. J Wireless Com Network (2021) 2021:109
2 Related work2.1 Performance measurement for mobile data services
More and more researchers and managers are taking an interest in performance meas-urement for mobile data services. To gain comprehensive insights into mobile data services, many researchers study user behavior, pricing model, service adoption and network quality. For example, Oliveira et al. [21] presented a model for analyzing the smartphone users’ behavior on mobile data traffic, and traffic-related activity patterns in different time periods for different types of users. Li et al. [28] proposed a segment-based multi-state Markov (SBMSM) model to predict the sequential user behavior of mobile data services. Yun et al. [22] proposed a pricing model to analyze mobile data service, which focused on the price changing and the quality of service. Ma et al. [23] built a dynamic pricing model for mobile data service, which can help service providers make business plan at the beginning of each period. Ovčjak et al. [24] reviewed 80 pri-mary literatures on the field of mobile data service and focused on the factors that affect adoption behavior of users. Feijóo et al. [25] analyzed the effect of underlying networks on mobile data services, and they put forward the new demands for the existing services and networks by summing up the developing trend of mobile services.
Taken together, most of the previous researches basically aimed at only one part of mobile data service such as adoption behavior, service pricing or underlying networks, but quite few on dynamic measure of overall service performance and development strategy of mobile data services, especially from start-ups to maturity.
2.2 The methods of performance measurement
The methods of performance measurement for telecom services have been extensively studied in the recent years. Many researchers used DEA method to measure the overall efficiency and performance of telecom services. Debnath and Shankar [29] calculated the relative efficiency of Indian telecom operators based on DEA, and then the efficiency rankings of operators were obtained. Yang and Chang [30] used a constant and variable returns-to-scale based method to measure the performance of Taiwan telecom opera-tors from 2001 to 2005. In order to increase the number of decision-making units, DEA window analysis has been introduced into this research. Kumar et al. [31] developed a framework based on fuzzy AHP and DEA model to study the main factors influencing Indian consumers’ buying behavior of telecom services. Existing researches usually used DEA method to measure the overall effectiveness and performance of telecom services; they were difficult to gain insights on operational details such as adoption, usage and network quality.
Exploratory factor analysis and principal components analysis are also often used in performance measurement. Nicoletti et al. [32] established an indicators system based on product market regulations and employment protection legislation. Factor analysis has been used to aggregating detailed indicators into a summary indicator, and com-ponents were weighted according to its contribution to the overall variance in the data. To measure the performance of telecom infrastructure, Al-mutawkkil et al. [33] put for-ward a composite telecommunication index (TI) based on principal components analy-sis, which included a number of telecommunication subindices, such as fixed telephone

Page 4 of 18Du et al. J Wireless Com Network (2021) 2021:109
networks, the Internet and mobile networks. Isip and Ortega [34] proposed a model to measure the service performance in the prepaid mobile services based on exploratory factor analysis, which had three primary dimensions: interaction, environment, out-come and thirty-six variables. This model has been applied in empirical study of Phil-ippines telecommunications industry. Chaudhary and Uprety et al. [35] discussed the service performance of the telecom services based on exploratory factor analysis and fuzzy extent analysis, and the dimensions of service performance include service inter-action quality (SIQ), service environmental quality (SEQ), service grievance handling (SGH) and so on. The researchers found that SGH had the biggest effect on service per-formance by empirical research. These two methods are data driven, and management experience is hard to be referenced during the modeling process. Therefore, they are applicable to the situation that the number of subindices and the relations among them cannot be obtained by management experience and theory analysis.
Structural equation model (SEM) method appears to have an advantage in this aspect [26]. Based on service quality theories, Jing [36] put forward a hypothesis of SEM for the services performance of network access. This model has been built from three aspects: service expectation, service perception and service quality and the key factors affecting the service quality were obtained by hypothesis testing and empirical research. Chat-terjee et al. [37] applied SEM and explores the adoption intention of the new telecom service among the respondents, and results showed that the presence of low-cost alter-natives posed a significant hurdle to the development of the new services. There are generally two kinds of SEM method: partial least square method SEM (PLS SEM) and covariance-based SEM. Gerpott and Ahmadi [27] held the idea that PLS SEM was more advantageous than the latter, because it was more suitable for the condition of extremely non-normal distribution, less demanding minimum sample size requirements and so on. Therefore, PLS SEM has been recommended. On the choice of measurement model, formative measurement model was considered better suited than reflective.
Above all, we can see that many researchers used DEA method to measure the over-all efficiency and performance of telecom services, which were difficult to gain insights on operational details such as adoption, usage and network quality. Exploratory factor analysis and principal components analysis are also often used in performance measure-ment. However, these two methods are data-driven, and management experience is hard to be referenced during the modeling process. PLS SEM has advantages in aspects of practicality and applicability, and has been recommended by many researchers.
3 Conceptual model and research hypothesesOne of the most widely used conceptual models in telecom is “ICT Develop-ment Index (IDI),” which was developed by the International Telecommunication Union (ITU, 2013, pp. 17–22, 209–215). The IDI is the weighted average composi-tion of three subindices, such as “ICT access,” “ICT use” and “ICT skill.” However, some researchers consider IDI is unreasonable, because there is multiple co-linear relation between indicators of index. Moreover, some researchers believe that the indicators in “ICT access” and “ICT use” need to be worth further discussing [38]. Therefore, on the basis of IDI and related research results, we propose a new index named “Mobile-data-service development index (MDDI)” to measure the overall

Page 5 of 18Du et al. J Wireless Com Network (2021) 2021:109
performance of mobile data services. The new conceptual model is grouped into five subindices: INVESTMENT, SUPPLY, ADOPTION, USAGE and REVENUE, and the interaction among them are considered in our model (see Fig. 1).
INVESTMENT describes the telecom investment of networks construction and optimization, which is both an important handgrip to drive the services of telecom operators, and the important foundation of local economic development [39, 40]. More studies are aiming at this field in the recent years; Du et al. [41] proposed a method based on the dynamic DEA model and the sensitivity analysis to measure the network investment performance of telecom operators. Then, they applied the pro-posed method to conduct an empirical research on the operational data of one Chi-nese telecom operator and developed effective investment strategies for the upgrading period of networks. Jung [42] developed a theoretical framework to explain the link between public institutions and telecommunications investment, and a sample of 13 European countries has been estimated by this model. Results were clear in verify-ing a positive association between institutional performance and investment lev-els. Briglauer et al. [43] built a flexible accelerator model to dynamically analyze the investment of broadband service based on the operational data of 23 European opera-tors from 2003 to 2012, and they investigated the effect of market competition and strategy on telecom investment. On the basis of the research findings, we can see that the INVESTMENT could directly affect networks deployment and services develop-ment, especially for the telecom operators in the upgrading period of new generation networks. However, it has been usually neglected by the performance measurement researches. In this study, we introduce the INVESTMENT into conceptual model.
Fig. 1 The conceptual model of MDDI

Page 6 of 18Du et al. J Wireless Com Network (2021) 2021:109
H1 INVESTMENT has a positive effect on MDDI. SUPPLY measures the quality of networks to support mobile data services, ADOPTION is about the user size of mobile data service, and USAGE measures the usage of mobile data services. These three subindices have showed up often in the previous researches [27, 44–46], and we introduce them into conceptual model.
H2 SUPPLY has a positive effect on MDDI.H3 ADOPTION has a positive effect on MDDI.H4 USAGE has a positive effect on MDDI.
REVENUE means the revenue of mobile data service; it is still up for debate whether the subindices about price and revenue should be introduced into conceptual model together. Most researchers agreed that these subindices supposed to be included [33, 47, 48]. Conversely, Gerpott et al. [27] believed that the price was an important driving fac-tor in subscribing and using telecom services, and the revenue was also heavily depend-ent upon the price and the share of the market. The weight of some subindices would be increased when the conceptual model includes the price and revenue subindices. There-fore, it is not reasonable to incorporate them together. In this study, we only introduce REVENUE into conceptual model.
H5 REVENUE has a positive effect on MDDI. Telecom investment of networks construction is important in optimizing the perfor-mance and improving the quality of the networks. Briglauer [49] and Houngbonon [50] found that INVESTMENT has a positive effect on SUPPLY. Thus, this hypothesis is introduced to our conceptual model.
H6 INVESTMENT has a positive effect on SUPPLY. The quality of networks is the core of the competitive capability for the telecom opera-tors in the market. Barzilai [51] and Gerpott [27] found that good networks performance can help them to increase market share, and then drive the usage of mobile data services growth. The similar conclusion was also shown in a study of Communications Commit-tee of the EU [52]; they believed that the coverage of LTE networks was one of the influ-ence factors on take-up rate of mobile broadband services, thus
H7 SUPPLY has a positive effect on ADOPTION.H8 ADOPTION has a positive effect on USAGE.
In telecom, the growth of services usage is an important driver of the revenue. With the empirical research, McCloughan et al. [53] verified the development of telecom services could effectively drive the growth of revenue, thus
H9 USAGE has a positive effect on REVENUE. The telecoms industry is always the important guarantee for regional economic devel-opment. Compared with the traditional voice services, mobile data services played a greater role in boosting economic growth in recent years [54]. Therefore, Gerpott [27] selected the regional GDP as an outcome criteria or target to be predicted when they built the conceptual model for telecom services, in order to enhance the rationality of

Page 7 of 18Du et al. J Wireless Com Network (2021) 2021:109
the measurement. Besides, the feedback loop between them has not been ignored, exist-ing researches [27, 54] have proved that the impact of mobile data services on GDP is stronger than the opposite direction, thus
H10 MDDI has a positive effect on GDP.
4 Research methodology4.1 Data collection
The original dataset contains quarterly performance indicators of 31 provincial compa-nies in one Chinese telecom operator and the quarterly provincial GDP data from 2013 to 2015 (The source of the GDP data comes from China statistics bureau website http:// www. stats. gov. cn/), and the usage of data has been authorized. The telecom operator we chose is one of the global telecom industry leaders and has a demonstration effect to the others. Therefore, the findings and strategy suggestions of empirical research have strong universality.
Data preprocessing is often needed in time-series data analysis and commonly involves three steps: handling missing values, eliminating seasonal effects and normalization. Firstly, we use linear interpolation to replace few missing values in the dataset [55]. Assume, without loss of generality, we have two known points (xi, yi) and (xi+1, yi+1) . Let x be a point such that xi < x < xi+1 , then the y value at x can be estimated by linear interpolation is
Then, the method of Classical Seasonal Decomposition by Moving Averages is used to eliminate seasonal effects in the dataset, which decomposes a time-series data X[t] into seasonal S[t], trend T[t] and random R[t] components (details can be found in [56]), rep-resented as
Finally, we use the Z-Score method to normalize the data. X is the raw data, µ is the mean of data X, and σ is the standard deviation. The score value Z can be calculated as
4.2 Measurements
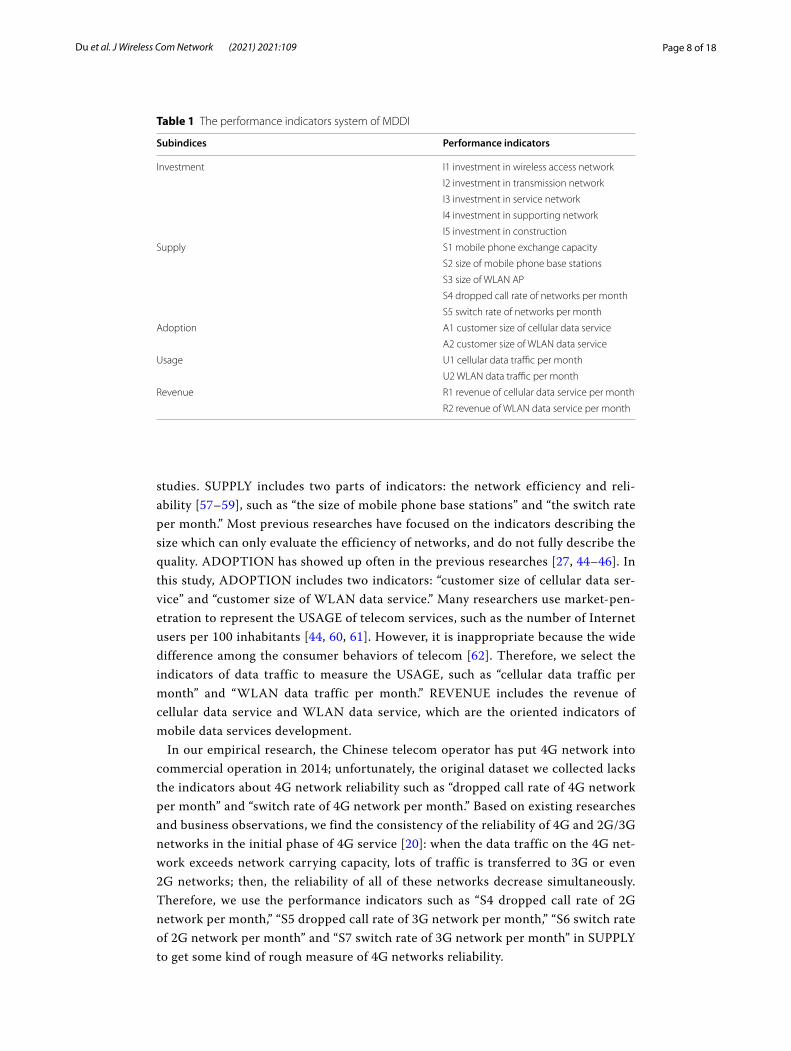
As shown in Table 1, the performance indicators system of MDDI integrates 16 indica-tors, which are grouped into five first-level subindices. The indicators source from exist-ing literature and management practices that adapt to the context of our study.
In INVESTMENT, almost all kinds of networks investment are covered, including wireless access network, transmission network, service network, supporting network and their construction. The investment of network is one of the most important cap-ital expenditures, and also an effective way of enhancing core competitiveness for mobile data services. However, this subarea has been often overlooked in previous
(1)y(x) = yi + (yi+1 − yi)x − xi
xi+1 − xi.
(2)X[t] = T [t] + S[t] + R[t].
(3)Z =X − µ
σ.
Page 8 of 18Du et al. J Wireless Com Network (2021) 2021:109
studies. SUPPLY includes two parts of indicators: the network efficiency and reli-ability [57–59], such as “the size of mobile phone base stations” and “the switch rate per month.” Most previous researches have focused on the indicators describing the size which can only evaluate the efficiency of networks, and do not fully describe the quality. ADOPTION has showed up often in the previous researches [27, 44–46]. In this study, ADOPTION includes two indicators: “customer size of cellular data ser-vice” and “customer size of WLAN data service.” Many researchers use market-pen-etration to represent the USAGE of telecom services, such as the number of Internet users per 100 inhabitants [44, 60, 61]. However, it is inappropriate because the wide difference among the consumer behaviors of telecom [62]. Therefore, we select the indicators of data traffic to measure the USAGE, such as “cellular data traffic per month” and “WLAN data traffic per month.” REVENUE includes the revenue of cellular data service and WLAN data service, which are the oriented indicators of mobile data services development.
In our empirical research, the Chinese telecom operator has put 4G network into commercial operation in 2014; unfortunately, the original dataset we collected lacks the indicators about 4G network reliability such as “dropped call rate of 4G network per month” and “switch rate of 4G network per month.” Based on existing researches and business observations, we find the consistency of the reliability of 4G and 2G/3G networks in the initial phase of 4G service [20]: when the data traffic on the 4G net-work exceeds network carrying capacity, lots of traffic is transferred to 3G or even 2G networks; then, the reliability of all of these networks decrease simultaneously. Therefore, we use the performance indicators such as “S4 dropped call rate of 2G network per month,” “S5 dropped call rate of 3G network per month,” “S6 switch rate of 2G network per month” and “S7 switch rate of 3G network per month” in SUPPLY to get some kind of rough measure of 4G networks reliability.
Table 1 The performance indicators system of MDDI
Subindices Performance indicators
Investment I1 investment in wireless access network
I2 investment in transmission network
I3 investment in service network
I4 investment in supporting network
I5 investment in construction
Supply S1 mobile phone exchange capacity
S2 size of mobile phone base stations
S3 size of WLAN AP
S4 dropped call rate of networks per month
S5 switch rate of networks per month
Adoption A1 customer size of cellular data service
A2 customer size of WLAN data service
Usage U1 cellular data traffic per month
U2 WLAN data traffic per month
Revenue R1 revenue of cellular data service per month
R2 revenue of WLAN data service per month

Page 9 of 18Du et al. J Wireless Com Network (2021) 2021:109
4.3 Experimental design
The research object we chosen is one of the telecom industry leaders both at home and abroad, and has a powerful demonstration effect on others. Therefore, the find-ings and strategy suggestions of empirical research are representative in telecoms. In addition, the laws and experience in telecom industry are considered in the key com-ponent of empirical research, in order to further enhance the universality. For this Chinese telecom operator, years 2013–2015 were the crucial time to operate the 4G services from start-ups to maturity, and most 4G projects implementation such as base station construction and assessment period of operation performance are one year. Therefore, years 2013–2015 could be divided into three annual stages: (1) 2013 was the “preparation stage,” during which the operator begun building large-scale trial 4G networks, and launching pre-commercial service. (2) In 2014 the operator put 4G networks into commercial operation, and obtain one-year window to develop 4G services without competition. Thus, year 2014 was named “the first year and the window stage.” (3) In 2015, the 4G networks construction was basically completed; meanwhile, other competitors began to gradually launch their 4G service. The tel-ecom operator entered “competition stage.”
Based on the literature review, PLS SEM was more suitable for the condition of extremely non-normal distribution, less demanding minimum sample size require-ments and so on, and formative measurement model was considered better suited than reflective. PLS SEM models consist of two components: the structural model and the measurement model [63]. Specifically, in the structural model, the latent variables (LVs) are related with each other according to substantive theory, which is represented as
where Y denotes the matrix for the latent variables, Z is the error terms assumed to be centered, and B is the path coefficients matrix. In the measurement model, the LV is considered to be formed by its observed variables (MVs) following a multiple regression with the formative way, represented as
where yg ( g = 1, . . . ,G ) denote the LVs, Xg ( g = 1, . . . ,G ) denote the MVs, ωg is the weight matrix. In PLS SEM models, B and ωg can be estimated by PLS and ordinary least squares (OLS) algorithms.
We use PLS SEM and formative measurement model to build annual model for each stage, separately, to analyze the dynamic characteristics of 4G service, and then sum up the strategies of each stage for new generation mobile data services from start-ups to maturity. At present, most global telecom operators are deploying the 5G mobile system and networks, which have been gradually applied in business field by leading operators. Based on synthesis consideration of existing services and tech-nological maturity, 5G services are still mainly personal data services now that are very similar to 4G. Therefore, the findings and strategy suggestions of our empirical research have reference value especially for the telecom operators at the beginning stage of 5G.
(4)Y = YB+ Z,
(5)yg = Xgωg + δg , g = 1, . . . ,G,
Page 10 of 18Du et al. J Wireless Com Network (2021) 2021:109
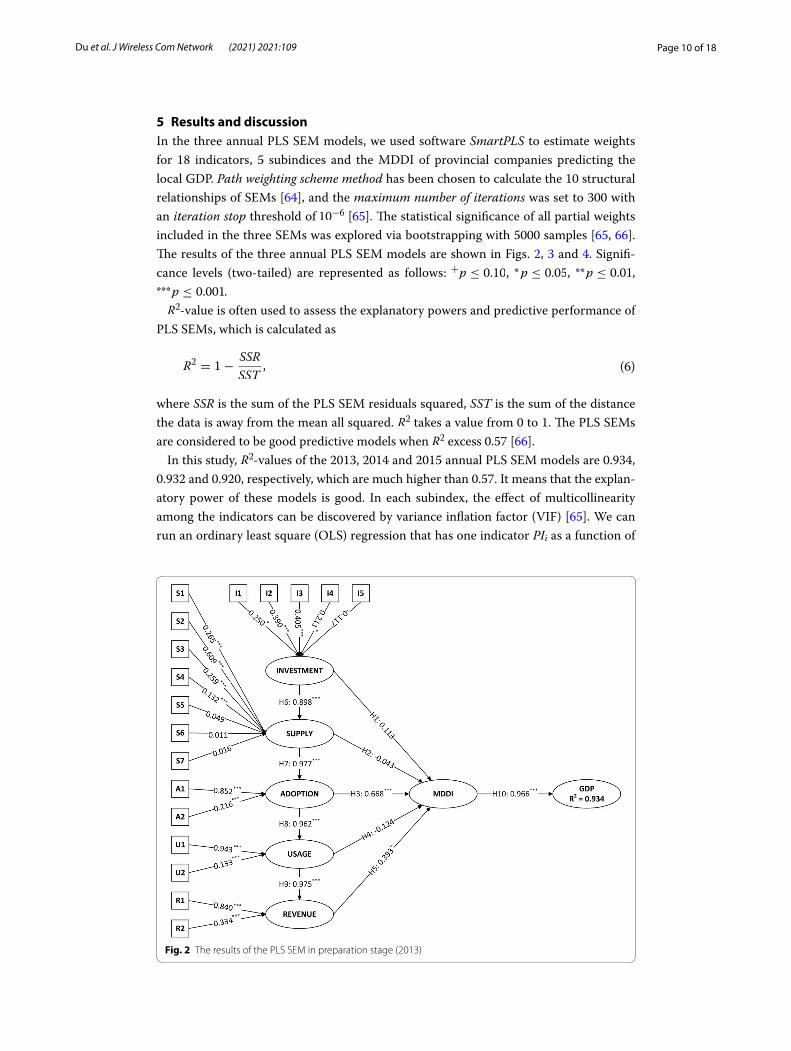
5 Results and discussionIn the three annual PLS SEM models, we used software SmartPLS to estimate weights for 18 indicators, 5 subindices and the MDDI of provincial companies predicting the local GDP. Path weighting scheme method has been chosen to calculate the 10 structural relationships of SEMs [64], and the maximum number of iterations was set to 300 with an iteration stop threshold of 10−6 [65]. The statistical significance of all partial weights included in the three SEMs was explored via bootstrapping with 5000 samples [65, 66]. The results of the three annual PLS SEM models are shown in Figs. 2, 3 and 4. Signifi-cance levels (two-tailed) are represented as follows: +p ≤ 0.10 , * p ≤ 0.05 , **p ≤ 0.01 , ***p ≤ 0.001.R2-value is often used to assess the explanatory powers and predictive performance of
PLS SEMs, which is calculated as
where SSR is the sum of the PLS SEM residuals squared, SST is the sum of the distance the data is away from the mean all squared. R2 takes a value from 0 to 1. The PLS SEMs are considered to be good predictive models when R2 excess 0.57 [66].
In this study, R2-values of the 2013, 2014 and 2015 annual PLS SEM models are 0.934, 0.932 and 0.920, respectively, which are much higher than 0.57. It means that the explan-atory power of these models is good. In each subindex, the effect of multicollinearity among the indicators can be discovered by variance inflation factor (VIF) [65]. We can run an ordinary least square (OLS) regression that has one indicator PIi as a function of
(6)R2= 1−
SSR
SST,
Fig. 2 The results of the PLS SEM in preparation stage (2013)

Page 11 of 18Du et al. J Wireless Com Network (2021) 2021:109
Fig. 3 The results of the PLS SEM in window stage (2014)
Fig. 4 The results of the PLS SEM in competition stage (2015)

Page 12 of 18Du et al. J Wireless Com Network (2021) 2021:109
all the others, R2i is the R2-value of this regression. Then, VIFi related with PIi can be cal-
culated by the following formula
The threshold of VIF is always set to 10. If this threshold is exceeded, multicollinearity can lead to misleading indicator weightings [27, 65]. The highest VIF of the indicators in 2013, 2014 and 2015 annual PLS SEM models are 4.774, 4.171 and 4.272 (as shown in Table 2).
5.1 Measurement model
The weights of indicators in ADOPTION, USAGE and REVENUE of the three annual PLS SEM models are all statistically significant (as shown in Figs. 2, 3, 4), and the weights of the indicators related to cellular data service are higher than the WLAN data service. Notice that 4G services are key components of cellular data service; however, WLAN data services as the traditional services are only accessed in busy areas of cities. Although the 4G services as the new service is the first priority of the telecom operator when it launched, it is shown that the traditional service as the supplement is also indis-pensable. As the indicators in INVESTMENT, I1 and I2 represent the investment of the capability side, and I3 and I4 represent the service side. In the three annual PLS SEM
(7)VIFi =1
1− R2i
.
Table 2 VIFs of the performance indicators in the annual PLS SEMs
VIFs of the annual PLS SEMs
2013 2014 2015
Investment
I1 investment in wireless access network 2.897 3.121 1.581
I2 investment in transmission network 4.136 4.171 1.785
I3 investment in service network 2.022 1.943 1.334
I4 investment in supporting network 2.288 2.135 1.316
I5 investment in construction 3.120 2.261 1.245
Supply
S1 mobile phone exchange capacity 4.443 3.710 4.219
S2 size of mobile phone base stations 4.744 3.760 4.272
S3 size of WLAN AP 1.370 1.276 1.315
S4 dropped call rate of networks per month 1.735 2.312 1.707
S5 switch rate of networks per month 1.533 1.602 1.497
S6 switch rate of 2G network per month 1.826 2.391 1.781
S7 switch rate of 3G network per month 1.378 1.593 1.481
Adoption
A1 customer size of cellular data service 1.618 1.383 1.301
A2 customer size of WLAN data service 1.618 1.383 1.301
Usage
U1 cellular data traffic per month 1.162 1.043 1.025
U2 WLAN data traffic per month 1.162 1.043 1.025
Revenue
R1 revenue of cellular data service per month 1.119 1.086 1.046
R2 revenue of WLAN data service per month 1.119 1.086 1.046

Page 13 of 18Du et al. J Wireless Com Network (2021) 2021:109
models, the weights of I1 and I2 are all significant, and increase year by year. Conversely, the weights of I3 and I4 decline, and even become not significant until 2015. These illus-trate that the investment of service side networks should mainly concentrate in prepara-tion stage when the new services were launched, and the investment in the capability side should gradually increase with the increase of the traffic requirements. In SUPPLY, S1, S2 and S3 are the network efficiency indicators, and the rest are about the network reliability. In the three models, the weights of the efficiency indicators are all statistically significant, and are higher than the reliability indicators. During the initial development of new services, the rapid construction and large coverage are more important than the reliability of the new networks, and need more attention by telecom operators.
5.2 Structural model
From the structural model, we can see that the influence relationships among the 5 sub-indices in the three annual PLS SEM models are all statistically significant; thus, H5, H6, H7 and H8 can be supported, which further illustrates the rationality of the conceptual models. Besides, the direct effects of 5 subindices weight on the MDDI are vary greatly, and the reasonability of three annual stages can be verified. As shown in Figs. 2 and 3, the ADOPTION and the REVENUE significantly impact the MDDI in 2013 and 2014. In 2015, only the ADOPTION has significant effects on the MDDI. According to H5, H6, H7 and H8, we cannot neglect the indirect effects of the subindices on the MDDI.
Therefore, the total effect of the s-th subindex weight, denoted as TWs ( s = 1, . . . , 5 ) should include two aspects, i.e., “direct” and “indirect,” and can be represented as
where Ns is the number of possible influence paths from the s-th subindex to the GDP via the MDDI, Ms,n is the number of path segments on the n-th influence path related with the s-th subindex, PWm ( m = 1, . . . ,Ms,n ) denotes the weight of the m-th path seg-ment, IPn =
∏Ms,n
m=1PWm ( n = 1, . . . ,Ns ) represents the total weight of the n-th influence
path which contains Ms,n path segments. The relative explanatory contribution of the i-th subindex total weight, denoted as ExConi ( i = 1, . . . , 5 ) can be calculated as
As shown in Table 3, the total weights of the 5 subindices in the three annual PLS SEM models are reported in the column named “Total weight,” and the relative explanatory contribution (%) of the subindices is contained in “ExCon” columns.
In Fig. 5, we can see that the explanatory contribution of the INVESTMENT, SUPPLY and ADOPTION is obviously higher than the USAGE and REVENUE by 2013–2015. This illustrates that the investment, network construction and user size of the telecom operators are important influence factors during the upgrading period. But in practice, a large majority of telecom operators focus more on revenue and data traffic of the new services, and the relative KPIs has been set to measure the performance of companies on a regular basis. This seems like a poor choice.
(8)TWs =
Ns∑
n=1
IPn =
Ns∑
n=1
Ms,n∏
m=1
PWm,
(9)ExConi =TWi∑5s=1 TWs
.

Page 14 of 18Du et al. J Wireless Com Network (2021) 2021:109
In the preparation stage, the highest explanatory contribution subindex is the ADOP-TION, followed by the INVESTMENT and SUPPLY. It is shown that keeping the user size is the most important task in the preparation stage of new services. The telecom operators should optimize the existing services to meet the users based-demands, and avoid massive user churns. At the same time, the investment on the networks should be strengthen, preparing for the speedy construction of the new generation networks.
In the first year and the window stage, the explanatory contribution of the SUPPLY is rising, and become the most influential subindex on the MDDI. Meanwhile, the explana-tory contribution of the USAGE also has a significant improvement. In this stage, tel-ecom operators ought to get hold of the opportunity to construct the new generation networks rapidly to form service differentiation and establish competitive advantages. Because of the relatively low pressure of competition in the window stage, the signifi-cance of the ADOPTION actually decreases a bit. However, the data traffic as the most immediate measure of the user experiences should deserve more attention by the tel-ecom operators.
In the competition stage, the explanatory contribution of the SUPPLY is also the highest among the subindices, then the INVESTMENT, ADOPTION, USAGE and REVENUE in order. Moreover, the explanatory contribution of the SUPPLY, INVESTMENT and ADOPTION improved greatly from the previous year. This illustrates that network quality is the core competitiveness of the telecom opera-tors in the competition stage. In order to improve network quality sustainably and
Table 3 Total weights and relative explanatory contributions of the MDDI subindices
Subindices Preparation stage (2013) Window stage (2014) Competition stage (2015)
Total ExCon (%) Rank Total ExCon (%) Rank Total ExCon (%) Rank
Weight Weight Weight
Investment 0.849 26.6 2 0.820 25.0 3 0.770 29.9 2
Supply 0.824 25.8 3 0.879 26.9 1 0.906 35.2 1
Adoption 0.886 27.8 1 0.820 25.0 2 0.708 27.5 3
Usage 0.250 7.8 5 0.355 10.8 5 0.142 5.5 4
Revenue 0.380 11.9 4 0.401 12.3 4 0.049 1.9 5
Fig. 5 The variation in explanatory contributions of the MDDI subindices by 2013–2015

Page 15 of 18Du et al. J Wireless Com Network (2021) 2021:109
meet ever-increasing users demand, a specific focus needs to be set in the networks investment. With the increasing pressure by the competition, the users size and market share should be also concerned in this stage.
6 ConclusionIn this study, we propose mobile-data-service development index (MDDI) and build a quantitative model based on PLS SEM to dynamic measure the overall perfor-mance of mobile data services. To approach a fuller understanding, we creatively bring investment indicators and networks reliability indicators into performance indicators system, and find out that there exist influence relationships among the 5 subindices.
In the part of empirical research, we use the model to analyze the dynamic char-acteristics of 4G service of one telecom operator in China, which is one of the global telecom industry leaders, and has a demonstration effect to the others. In addi-tion, we try to combine development laws and management practices of the tele-com with the key part of empirical research scheme, and hope to further enhance the universality. The findings and strategy suggestions can be summed up as follow: (1) Although the new services are the first priority of the telecom operator when it launched, the traditional services as the supplement are also indispensable. (2) The investment, networks construction and user size are important influence factors of the new services during the upgrading period. But in practice, a large majority of tel-ecom operators focus more on revenue and data traffic. (3) Rapid and complete net-work coverage is more important than the reliability during the upgrading period of the new networks. Thus, compared with the guarantee of quality, telecom operators should first ensure the rapid progress of new generation networks. (4) The invest-ment on service side networks should mainly concentrate in preparation stage, and the investment on the capability side should gradually increase with the develop-ment of the new services. (5) In the preparation stage, keeping the user size is the most important task, and the investment on the new services should be strengthen. (6) In the first year and the window stage, telecom operators ought to get hold of the opportunity to construct the new generation networks rapidly. Data traffic as the most immediate measure of the user experience is also deserved more attention, and the marketing strategy should be adjusted timely depending upon the needs of the user. (7) When the competition stage is coming, a specific focus needs to be set on the network quality, which is the core competitiveness of the telecom operators. Meanwhile, the new services drive the user needs expanding; thus, the user size and follow-up investment should be also concerned.
Because the upgrading period of new generation networks is a regular process, and the development of new services have universality in some degree, we believe the above-mentioned findings and strategy suggestions can give guidelines for new gen-eration networks in the future. At present, 5G networks have been gradually applied in business field by leading operators, and the services are still mainly personal data services now. Therefore, these findings and suggestions have reference value espe-cially for 5G services at the beginning stage.

Page 16 of 18Du et al. J Wireless Com Network (2021) 2021:109
6.1 Recommendations and future research
Future researches should apply the methodology in this study to other cases and periods of new services, to make a further discussion on universality of the conceptual model and try to validate the conclusion. Secondly, “regional GDP” has been selected as an out-come criteria in our conceptual model, which can been replaced by the index of Internet development (such as “China Internet Index System,” “Dow Jones Internet Index” and so on), and research on the influence relationships between mobile data services and Inter-net development.
AbbreviationsMDDI: Mobile-data-service development index; DEA: Data envelopment analysis; EFA: Exploratory factor analysis; PCA: Principal components analysis; SEM: Structural equation modeling; SBMSM: Segment-based multi-state Markov; TI: Telecommunication index; SIQ: Service interaction quality; SEQ: Service environmental quality; SGH: Service grievance handling; PLS SEM: Partial least square method SEM; LV: Latent variable; MV: Observed variable; OLS: Ordinary least squares; VIF: Variance inflation factor.
Authors’ contributionsYD is the main writer of this paper. He proposed the main idea and analyzed the result. XZ gave good suggestions on the innovation of the paper. ZL and YG put forward some suggestions for the design of the experimental part. All authors read and approved the final manuscript.
FundingThe research was supported by the National Natural Science Foundation of China under Grant 61901050.
Availability of data and materialsThe datasets analyzed during the current study are not publicly available since involved a confidentiality agreement but are available from the corresponding author on reasonable request.
Declarations
Competing interestsThe authors declare that they have no competing interests.
Author details1 Business School, Beijing Language and Culture University, 15 Xueyuan Road, Haidian District, Beijing 100083, China. 2 School of Economics and Management, Beijing University of Posts and Telecommunications, 10 Xi Tu Cheng Road, Bei-jing 100876, China. 3 Beijing Key Laboratory of Network System Architecture and Convergence, Beijing University of Posts and Telecommunications, 10 Xi Tu Cheng Road, Beijing 100876, China.
Received: 19 February 2021 Accepted: 16 April 2021
References 1. G. Liu, Y. Huang, F. Wang, J. Liu, Q. Wang, 5G features from operation perspective and fundamental performance
validation by field trial. China Commun. 15(11), 33–50 (2018) 2. E. Rodriguez-Crespo, R. Marco, M. Billon, ICTs impacts on trade: a comparative dynamic analysis for internet, mobile
phones and broadband. Asia Pac. J. Account. Econ. 2018, 1–15 (2018) 3. P. Zhang, Y. Sun, H. Leung, M. Xu, W. Li, A novel approach for QoS prediction based on Bayesian combinational
model. China Commun. 13(11), 269–280 (2016) 4. B. Yi, X. Shen, H. Liu, Z. Zhang, W. Zhang, S. Liu, N. Xiong, Deep matrix factorization with implicit feedback embed-
ding for recommendation system. IEEE Trans. Ind. Inf. 15(8), 4591–4601 (2019) 5. Y. Qu, N. Xiong, RFH: a resilient, fault-tolerant and high-efficient replication algorithm for distributed cloud storage,
in The 41st International Conference on Parallel Processing (2012), pp. 520–529 6. J. Sun, X. Wang, N. Xiong, J. Shao, Learning sparse representation with variational auto-encoder for anomaly detec-
tion. IEEE Access 6, 33353–33361 (2018) 7. B. Lin, F. Zhu, J. Zhang, J. Chen, X. Chen, N. Xiong, J.L. Mauri, A time-driven data placement strategy for a scientific
workflow combining edge computing and cloud computing. IEEE Trans. Ind. Inf. 15(7), 4254–4265 (2019) 8. H. Li, J. Liu, R.W. Liu, N. Xiong, K. Wu, T. Kim, A dimensionality reduction-based multi-step clustering method for
robust vessel trajectory analysis. Sensors 17(8), 1792 (2017) 9. B. Lin, W. Guo, N. Xiong et al., A pretreatment workflow scheduling approach for big data applications in multicloud
environments. IEEE Trans. Netw. Serv. Manag. 13(3), 581–594 (2016) 10. Y. Yao, L.T. Yang, N. Xiong, Anonymity-based privacy-preserving data reporting for participatory sensing. IEEE Inter-
net Things J. 2(5), 381–390 (2015)

Page 17 of 18Du et al. J Wireless Com Network (2021) 2021:109
11. W. Fang, X. Yao, X. Zhao, J. Yin, N. Xiong, A stochastic control approach to maximize profit on service provisioning for mobile cloudlet platforms. IEEE Trans. Syst. Man Cybern. Syst. 48(4), 522–534 (2016)
12. W. Fang, X. Yin, Y. An, N. Xiong, Q. Guo, J. Li, Optimal scheduling for data transmission between mobile devices and cloud. Inf. Sci. 301, 169–180 (2015)
13. W. Fang, Y. Li, H. Zhang, N. Xiong, J. Lai, A.V. Vasilakos, On the throughput-energy tradeoff for data transmission between cloud and mobile devices. Inf. Sci. 283, 79–93 (2014)
14. N. Xiong, A.V. Vasilakos et al., Comparative analysis of quality of service and memory usage for adaptive failure detectors in healthcare systems. IEEE J. Sel. Areas Commun. 27(4), 495–509 (2009)
15. B. Lin, W. Guo, N. Xiong, G. Chen, A.V. Vasilakos, H. Zhang, A pretreatment workflow scheduling approach for big data applications in multi-cloud environments. IEEE Trans. Netw. Serv. Manag. 13(3), 581–594 (2016)
16. M. Wu, L. Tan, N. Xiong, Data prediction, compression, and recovery in clustered wireless sensor networks for envi-ronmental monitoring applications. Inf. Sci. 329, 800–818 (2016)
17. W. Guo, W. Hong, B. Zhang, Y. Chen, N. Xiong, Reliable adaptive data aggregation route strategy for a trade-off between energy and lifetime in WSNs. Sensors 14(9), 16972–16993 (2014)
18. Y. Yao, J. Liu, N. Xiong, Privacy-preserving data aggregation in two-tiered wireless sensor networks with mobile nodes. Sensors 14(11), 21174–21194 (2014)
19. W. Guo, J. Li, G. Chen, Y. Niu, C. Chen, A PSO-optimized real-time fault-tolerant task allocation algorithm in wireless sensor networks. IEEE Trans. Parallel Distrib. Syst. 26(12), 3236–3249 (2015)
20. X. Zhang, Y. Du, Z. Li, Q. Wang, Analyzing the operational performance migration of telecom operators. China Com-mun. 15(6), 139–157 (2018)
21. E.M.R. Oliveira, A.C. Viana, K.P. Naveen, C. Sarraute, Mobile data traffic modeling: revealing temporal facets. Comput. Netw. 112, 176–193 (2017)
22. S.H. Yun, Y. Kim, M. Kim, Quality-adjusted international price comparisons of mobile telecommunications services. Telecommun. Policy 43(4), 339–352 (2019)
23. X. Ma, T. Deng, M. Xue, Z.-J.M. Shen, B. Lan, Optimal dynamic pricing of mobile data plans in wireless communica-tions. Omega 66, 91–105 (2017)
24. B. Ovčjak, M. Heričko, G. Polančič, Factors impacting the acceptance of mobile data services—a systematic literature review. Comput. Hum. Behav. 53, 24–47 (2015)
25. C. Feijómez-Barroso, S. Ramos, Techno-economic implications of the mass-market uptake of mobile data services: requirements for next generation mobile networks. Telemat. Inform. 33(2), 600–612 (2016)
26. V. Kyriakidou, C. Michalakelis, T. Sphicopoulos, Assessment of information and communications technology maturity level. Telecommun. Policy 37(1), 48–62 (2013)
27. T.J. Gerpott, N. Ahmadi, Advancement of indices assessing a nation’s telecommunications development status: a PLS structural equation analysis of over 100 countries. Telecommun. Policy 39(2), 93–111 (2015)
28. Z. Li, X. Zhang, Y. Wang, X. Su, Predicting the sequential behavior of mobile Internet users based on MSM model. Int. J. Mark. Res. 62(6), 743–757 (2020)
29. R.M. Debnath, R. Shankar, Benchmarking telecommunication service in India. Benchmark. Int. J. (2008). https:// doi. org/ 10. 1108/ 14635 77081 09031 69
30. H.-H. Yang, C.-Y. Chang, Using DEA window analysis to measure efficiencies of Taiwan’s integrated telecommunica-tion firms. Telecommun. Policy 33(1–2), 98–108 (2009)
31. A. Kumar, R. Shankar, R.M. Debnath, Analyzing customer preference and measuring relative efficiency in telecom sector: a hybrid fuzzy AHP/DEA study. Telemat. Inform. 32(3), 447–462 (2015)
32. G. Nicoletti, S. Scarpetta, O. Boylaud, Summary indicators of product market regulation with an extension to employ-ment protection legislation (1999)
33. A. Al-mutawkkil, A. Heshmati, J. Hwang, Development of telecommunication and broadcasting infrastructure indi-ces at the global level. Telecommu. Policy 33(3–4), 176–199 (2009)
34. M.I.G. Isip, R.J.B. Ortega, A hierarchical model of service quality in the prepaid mobile telecommunications industry (2018) 35. A. Chaudhary, I. Uprety, Analysis of telecom service quality factors with analytic hierarchy process and fuzzy extent
analysis: a case of public sector unit. Int. J. Bus. Syst. Res. 10(2–4), 162–185 (2016) 36. Z. Jing, Service quality model of network access based on SEM. J. Beijing Univ. Posts Telecommun. Soc. Sci. Ed. 1,
8–20 (2018) 37. S. Chatterjee, B.R. Chaudhuri, D. Dutta, Determinants of adoption of new technology in telecom sector: a structural
equation modeling approach. Glob. Bus. Rev. 20(1), 166–178 (2019) 38. J. James, The ICT development index and the digital divide: How are they related? Technol. Forecast. Soc. Chang.
79(3), 587–594 (2012) 39. G. Harb, The economic impact of the Internet penetration rate and telecom investments in Arab and Middle Eastern
countries. Econ. Anal. Policy 56, 148–162 (2017) 40. A. Coban, F. Yigit, H. Kalkavan, C. Kizil, S.E. Seker, Macroeconomic facts for telecom industry in MINT countries. Proc.
Econ. Finance 39, 156–164 (2016) 41. Y. Du, X. Zhang, Z. Li, L. Wu, Investment performance measurement of new generation mobile communication
networks based on dynamic DEA model. EURASIP J. Wirel. Commun. Netw. 1, 251–257 (2019) 42. J. Jung, Institutions and telecommunications investment. Information Economics and Policy (2020) 43. W. Briglauer, K. Gugler, A. Haxhimusa, Facility-and service-based competition and investment in fixed broadband
networks: lessons from a decade of access regulations in the European Union member states. Telecommun. Policy 40(8), 729–742 (2016)
44. R.L. Katz, P. Koutroumpis, Measuring digitization: a growth and welfare multiplier. Technovation 33(10–11), 314–319 (2013)
45. P. Hanafizadeh, M.R. Hanafizadeh, M. Khodabakhshi, Extracting core ICT indicators using entropy method. Inf. Soc. 25(4), 236–247 (2009)
46. L. Waverman, K. Dasgupta, J. Rajala, Connectivity scorecard 2011 Berkeley Research Group, Communicea and Nokia Siemens Networks, Londres (2011)

Page 18 of 18Du et al. J Wireless Com Network (2021) 2021:109
47. E.V.F.B. Data, The networked readiness index 2014: Benchmarking ICT uptake in a world of big data (2014) 48. M.R. Hanafizadeh, A. Saghaei, P. Hanafizadeh, An index for cross-country analysis of ICT infrastructure and access.
Telecommun. Policy 33(7), 385–405 (2009) 49. W. Briglauer, C. Cambini, T. Fetzer, K. Hüschelrath, The European Electronic Communications Code: a critical appraisal
with a focus on incentivizing investment in next generation broadband networks. Telecommun. Policy 41(10), 948–961 (2017)
50. G.V. Houngbonon, F. Jeanjean, What level of competition intensity maximises investment in the wireless industry? Telecommun. Policy 40(8), 774–790 (2016)
51. K. Barzilai-Nahon, Gaps and bits: conceptualizing measurements for digital divide/s. Inf. Soc. 22(5), 269–278 (2006) 52. Communications Committee, Broadband Access in the EU: 2014 European Commission, Brussels (2014) 53. P. McCloughan, S. Lyons, Accounting for ARPU: new evidence from international panel data. Telecommun. Policy
30(10–11), 521–532 (2006) 54. M.R. Ward, S. Zheng, Mobile telecommunications service and economic growth: evidence from China. Telecommun.
Policy 40(2–3), 89–101 (2016) 55. E. Meijering, A chronology of interpolation: from ancient astronomy to modern signal and image processing. Proc.
IEEE 90(3), 319–342 (2002) 56. M. Kendall Sir, A. Stuart, The Advanced Theory of Statistics (Charles Griffin & Co., Ltd, New York, 1979) 57. G. Kesidis, An Introduction to Communication Network Analysis (Wiley, Berlin, 2007) 58. N. Xiong, X. Jia, L.T. Yang, A.V. Vasilakos, Y. Li, Y. Pan, A distributed efficient flow control scheme for multirate multicast
networks. IEEE Trans. Parallel Distrib. Syst. 21(9), 1254–1266 (2010) 59. N. Xiong, A.V. Vasilakosb et al., A novel self-tuning feedback controller for active queue management supporting TCP
flows. Inf. Sci. 180(11), 2249–2263 (2010) 60. M. Billon, R. Marco, F. Lera-Lopez, Disparities in ICT adoption: a multidimensional approach to study the cross-coun-
try digital divide. Telecommun. Policy 33(10–11), 596–610 (2009) 61. G. Bruno, E. Esposito, A. Genovese, K.L. Gwebu, A critical analysis of current indexes for digital divide measurement.
Inf. Soc. 27(1), 16–28 (2011) 62. G. Sciadas, Monitoring the digital divide... and beyond (2003) 63. A. Monecke, F. Leisch, SemPLS: structural equation modeling using partial least squares. J. Stat. Softw. 48, 1–32
(2012) 64. J.F. Hair, M. Sarstedt, C.M. Ringle, J.A. Mena, An assessment of the use of partial least squares structural equation
modeling in marketing research. J. Acad. Mark. Sci. 40(3), 414–433 (2012) 65. R. Weiber, D. Mühlhaus, Bedeutung Der Strukturgleichungsmodellierung (Springer, Strukturgleichungsmodellierung,
2014), pp. 3–7 66. W.W. Chin, The partial least squares approach to structural equation modeling. Modern Methods Bus. Res. 295(2),
295–336 (1998)
Publisher’s NoteSpringer Nature remains neutral with regard to jurisdictional claims in published maps and institutional affiliations.