Embed Size (px)
Citation preview
Performance Management:Views from Industry
MGT 2206-001-Business AnalyticsVillanova School of Business
2
What is Performance Management? Performance Management is the use of
metrics and indicators, both financial and non-financial, to measure, monitor, and improve organizational performance.
Performance management relates to having various metrics that firm’s can track and use to take action as needed. These metrics might be part of a balanced scorecard, and might be presented in a dashboard. You might be able to drill down and look at these metrics at lower levels in the organization. Also, six sigma and lean management are often related to performance management.
3
Famous Quotes
“If you can’t measure it, you can’t manage it”
“What gets measured and rewarded gets done”
“Measurement and scorecards at the performing level were the single biggest management tool for success”
4
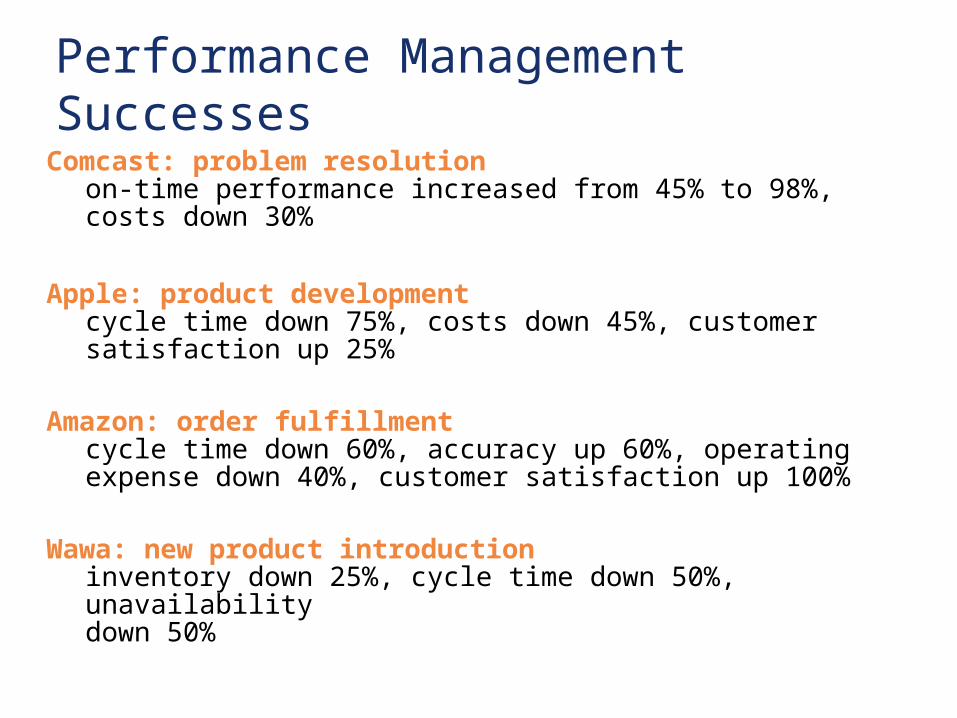
Comcast: problem resolutionon-time performance increased from 45% to 98%, costs down 30%
Apple: product developmentcycle time down 75%, costs down 45%, customer satisfaction up 25%
Amazon: order fulfillmentcycle time down 60%, accuracy up 60%, operating expense down 40%, customer satisfaction up 100%
Wawa: new product introduction inventory down 25%, cycle time down 50%, unavailabilitydown 50%
Performance Management Successes

5
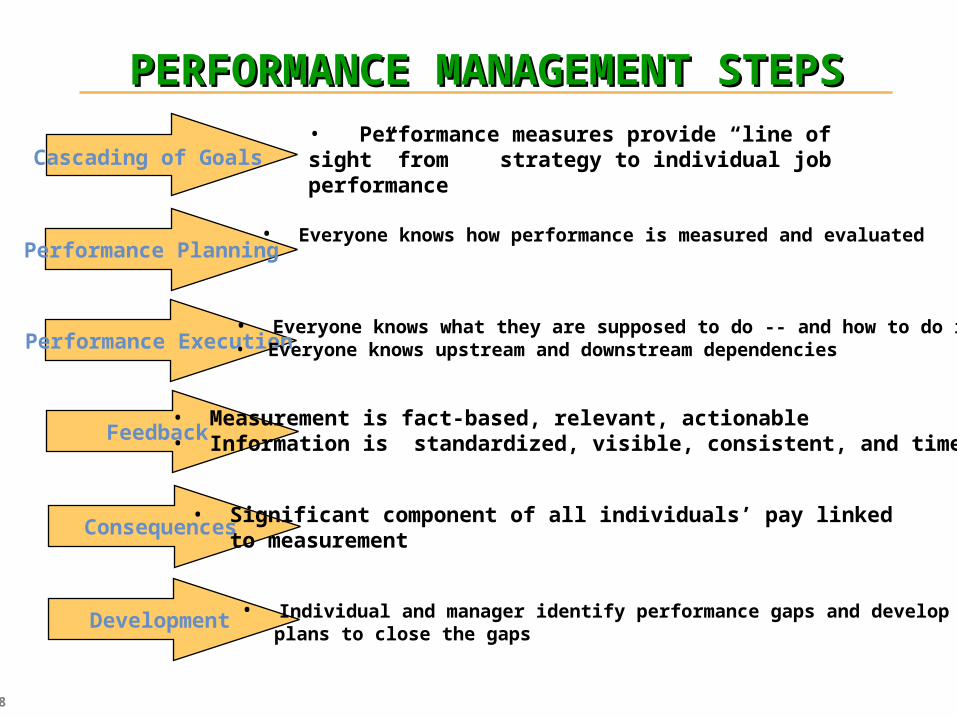
PERFORMANCE MANAGEMENT STEPSPERFORMANCE MANAGEMENT STEPS
Performance Planning
Performance Execution
Feedback
Consequences
Development
Cascading of Goals• Performance measures provide “line of sight” from
strategy to individual job performance
• Everyone knows how performance is measured and evaluated
• Everyone knows what they are supposed to do -- and how to do it!• Everyone knows upstream and downstream dependencies
• Measurement is fact-based, relevant, actionable• Information is standardized, visible, consistent, and timely
• Significant component of all individuals’ pay linked to measurement
• Individual and manager identify performance gaps and develop plans to close the gaps
6
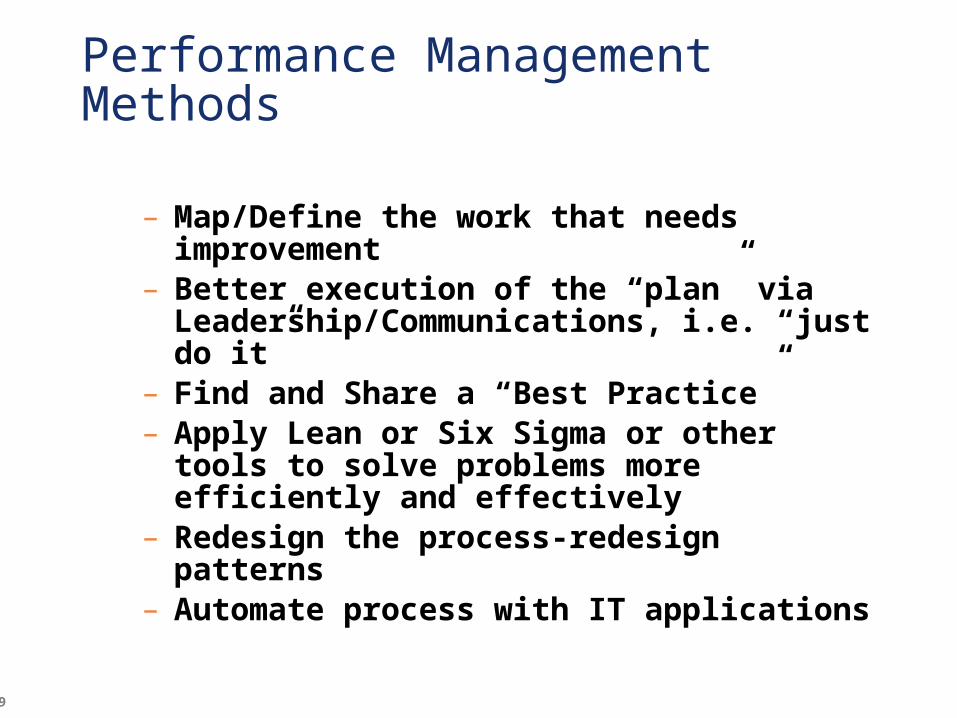
Performance ManagementMethods
– Map/Define/Describe the work that needs improvement
– Better execution of the “plan” via Leadership/Communications, i.e. “just do it”
– Find and Share a “Best Practice”– Apply Lean or Six Sigma or other tools to
solve problems more efficiently and effectively
– Redesign the process-redesign patterns– Automate process with IT applications
7
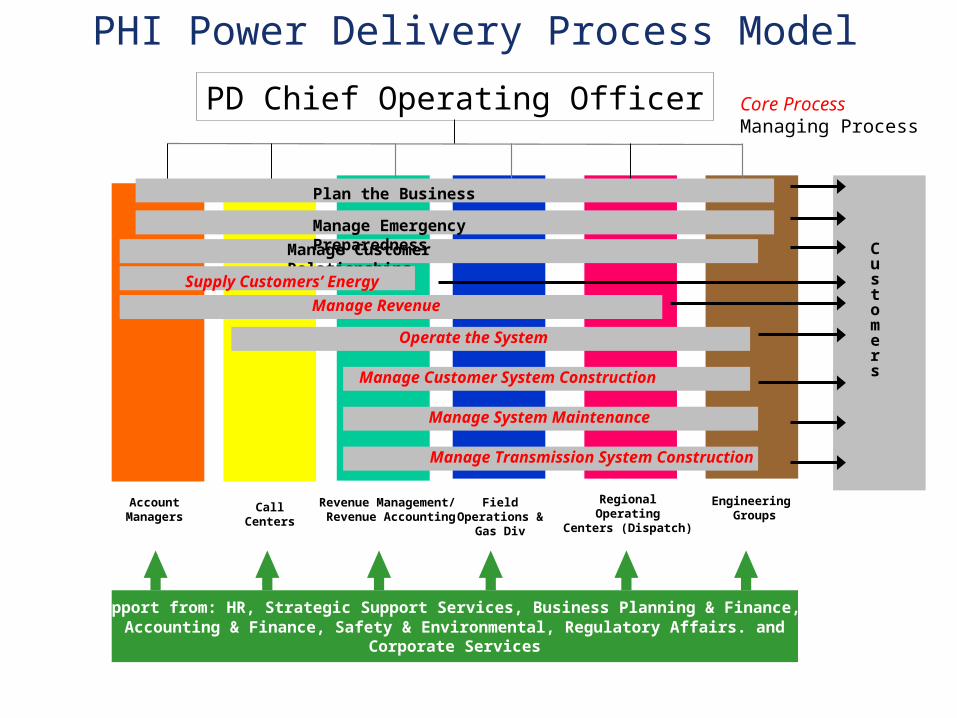
PHI Power Delivery Process Model
Field
Operations &Gas Div
Revenue Management/ Revenue Accounting
AccountManagers
Engineering Groups
Customers
CallCenters
RegionalOperating
Centers (Dispatch)
Manage Revenue
Manage Customer Relationships
Manage System Maintenance
Support from: HR, Strategic Support Services, Business Planning & Finance, IT,Accounting & Finance, Safety & Environmental, Regulatory Affairs. and
Corporate Services
Manage Emergency Preparedness
Manage Customer System Construction
Supply Customers’ Energy
Operate the System
Manage Transmission System Construction
Plan the Business
PD Chief Operating Officer Core ProcessManaging Process
8
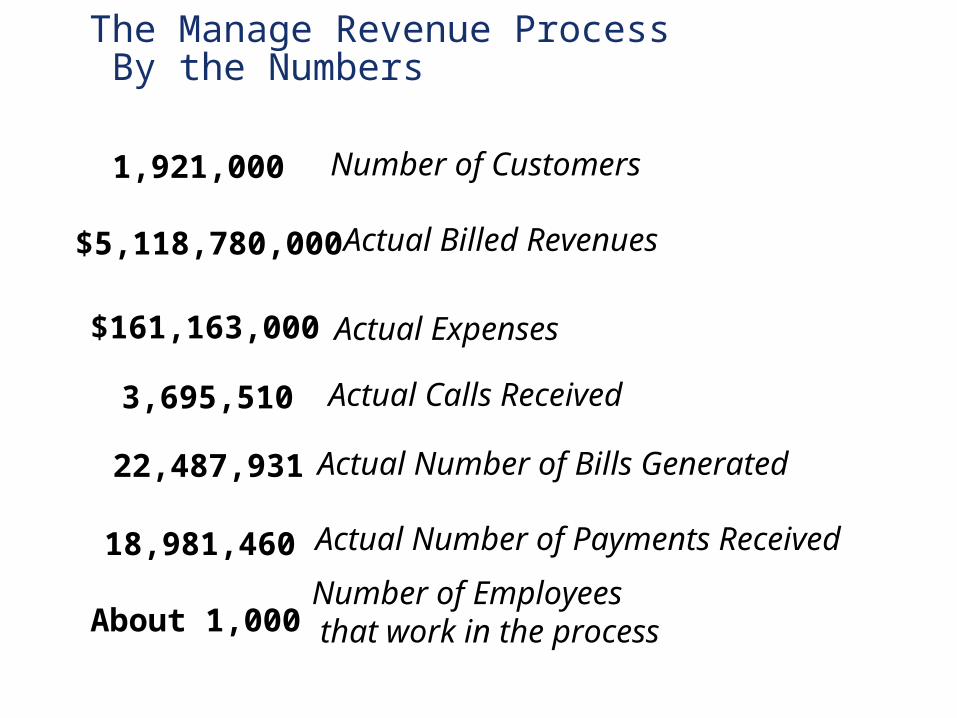
The Manage Revenue Process By the Numbers
1,921,000
$5,118,780,000
$161,163,000
3,695,510
About 1,000
Number of Customers
Actual Billed Revenues
Actual Expenses
Actual Calls Received
Number of Employees that work in the process
18,981,460 Actual Number of Payments Received
Actual Number of Bills Generated22,487,931
9
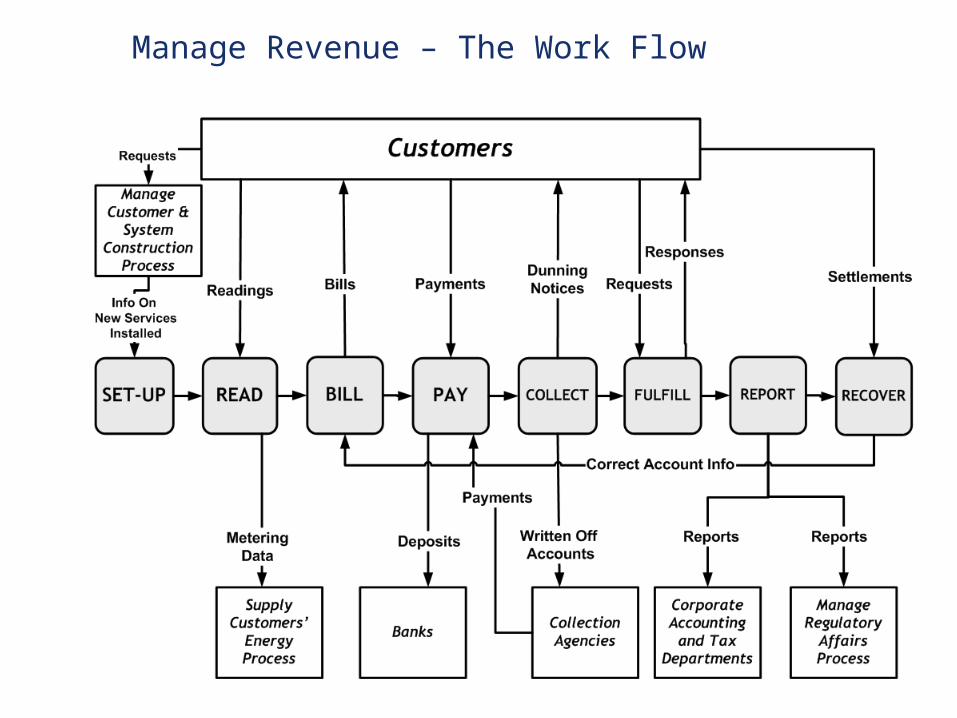
Manage Revenue – The Work Flow
10
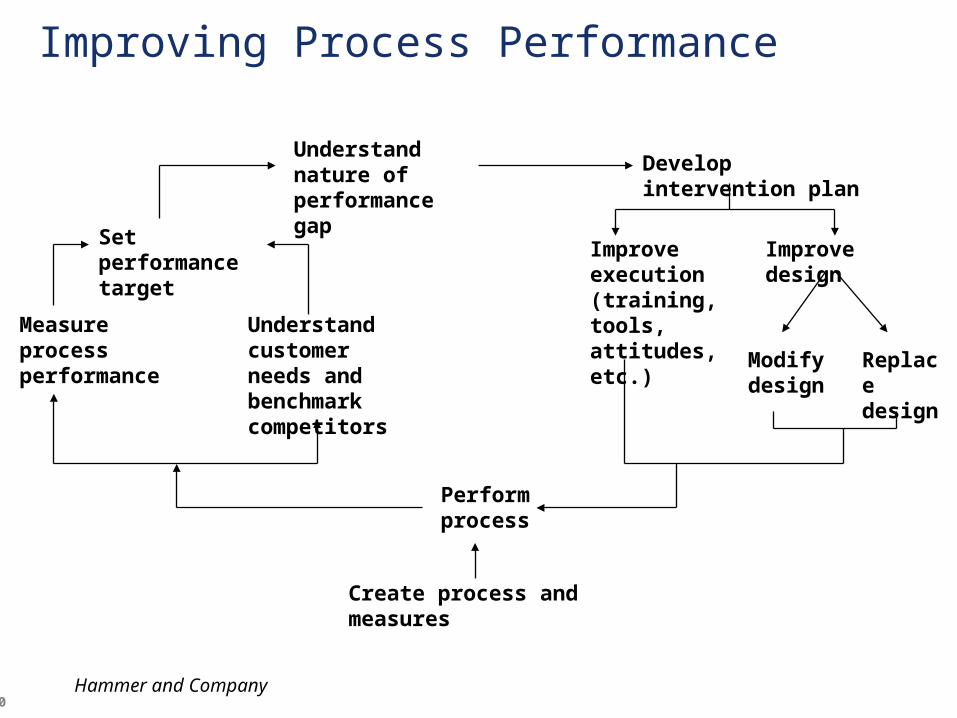
Improving Process Performance
Understand nature of performance gap Develop intervention plan
Improve execution(training, tools, attitudes, etc.)
Improve design
Modify design
Replace design
Perform process
Create process and measures
Understand customer needs and benchmark competitors
Measure process performance
Set performancetarget
Hammer and Company
11
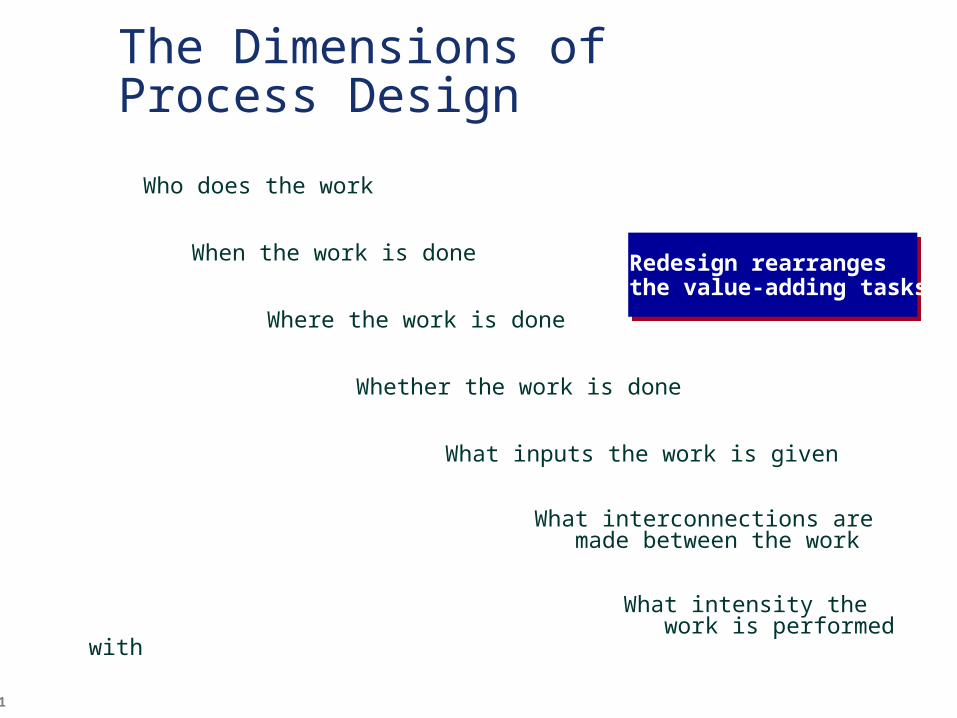
The Dimensions of Process Design
Who does the work
When the work is done
Where the work is done
Whether the work is done
What inputs the work is given
What interconnections are made between the work
What intensity the work is performed with
Redesign rearranges the value-adding tasks
12
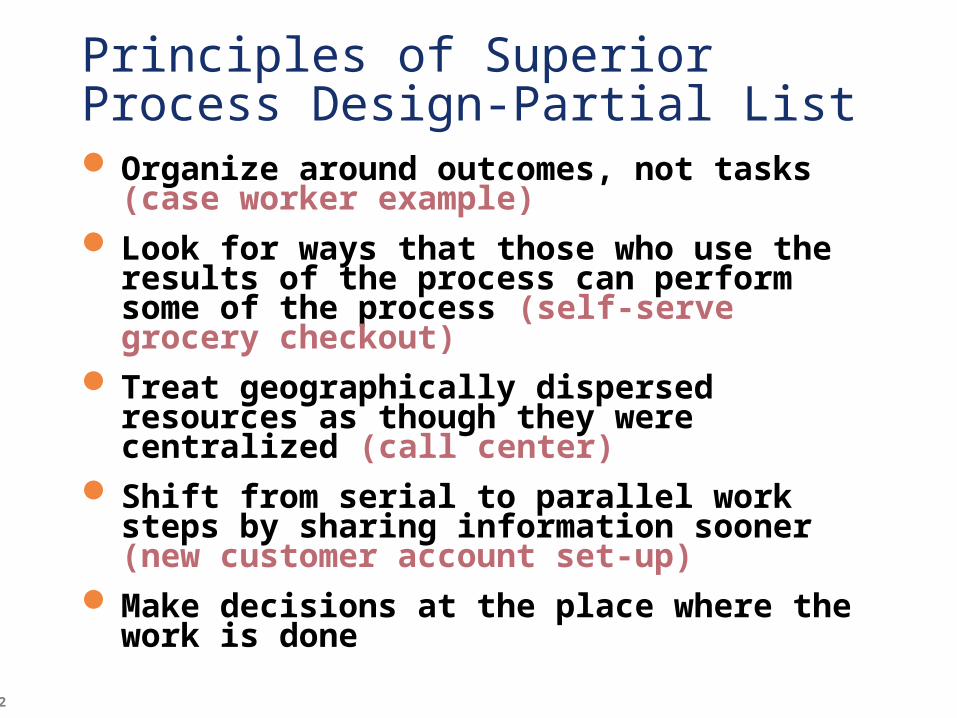
Principles of Superior Process Design-Partial List Organize around outcomes, not tasks (case
worker example) Look for ways that those who use the results
of the process can perform some of the process (self-serve grocery checkout)
Treat geographically dispersed resources as though they were centralized (call center)
Shift from serial to parallel work steps by sharing information sooner (new customer account set-up)
Make decisions at the place where the work is done
13
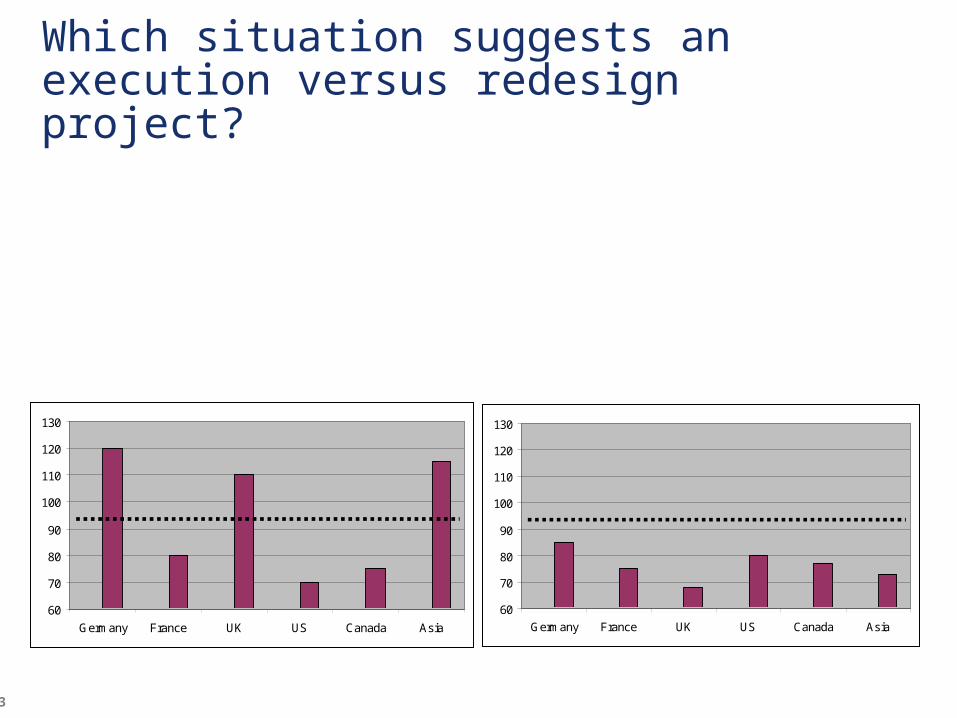
Which situation suggests an execution versus redesign project?
60
70
80
90
100
110
120
130
Germany France UK US Canada Asia
60
70
80
90
100
110
120
130
Germany France UK US Canada Asia
14
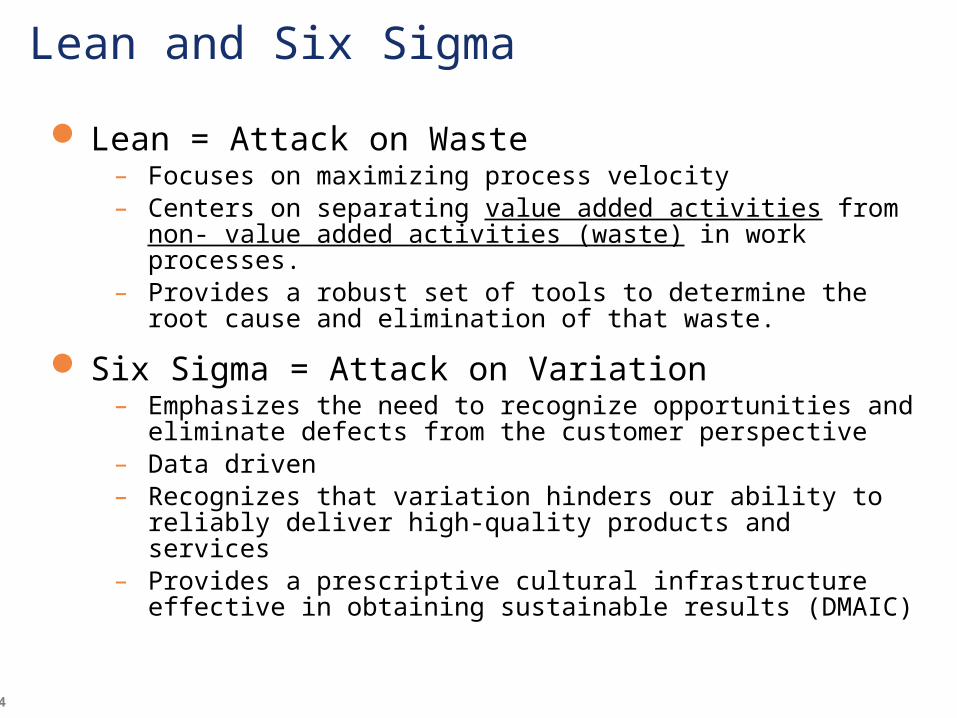
Lean and Six Sigma
Lean = Attack on Waste– Focuses on maximizing process velocity– Centers on separating value added activities from non- value
added activities (waste) in work processes.– Provides a robust set of tools to determine the root cause and
elimination of that waste.
Six Sigma = Attack on Variation– Emphasizes the need to recognize opportunities and eliminate
defects from the customer perspective– Data driven– Recognizes that variation hinders our ability to reliably deliver
high-quality products and services– Provides a prescriptive cultural infrastructure effective in
obtaining sustainable results (DMAIC)
15
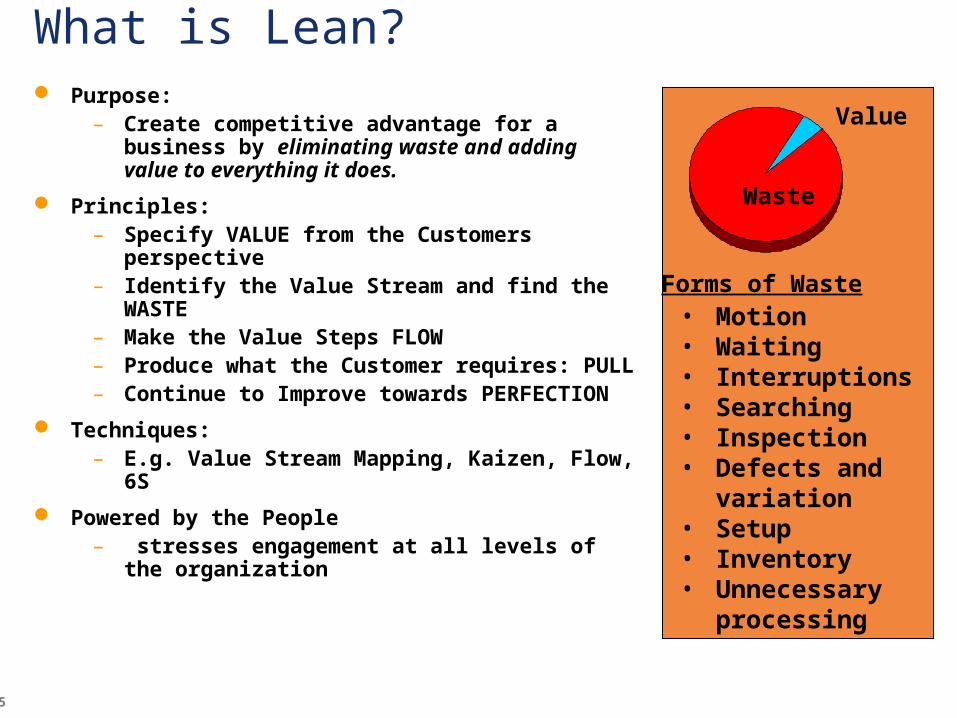
What is Lean? Purpose:
– Create competitive advantage for a business by eliminating waste and adding value to everything it does.
Principles:– Specify VALUE from the Customers
perspective– Identify the Value Stream and find the
WASTE– Make the Value Steps FLOW– Produce what the Customer requires: PULL– Continue to Improve towards PERFECTION
Techniques:– E.g. Value Stream Mapping, Kaizen, Flow, 6S
Powered by the People – stresses engagement at all levels of the
organization
• Motion• Waiting• Interruptions• Searching• Inspection• Defects and
variation• Setup• Inventory• Unnecessary
processing
Waste
Value
Forms of Waste
16
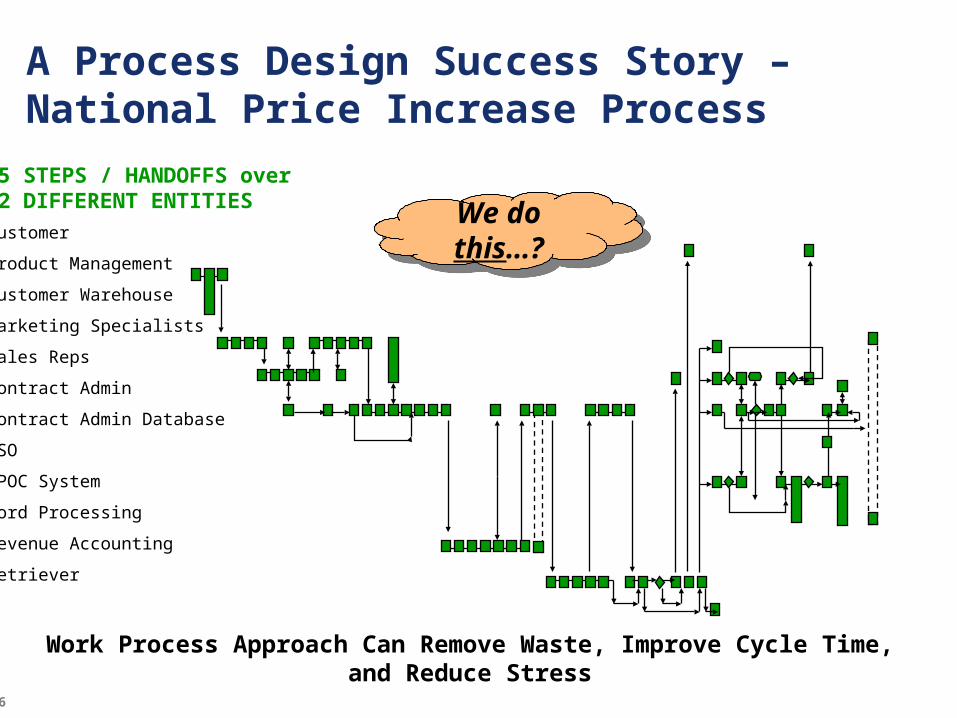
A Process Design Success Story – National Price Increase Process
Customer
Product Management
Customer Warehouse
Marketing Specialists
Sales Reps
Contract Admin
Contract Admin Database
CSO
SPOC System
Word Processing
Revenue Accounting
Retriever
85 STEPS / HANDOFFS over12 DIFFERENT ENTITIES
We do this…?
We do this…?
Work Process Approach Can Remove Waste, Improve Cycle Time, and Reduce Stress
17
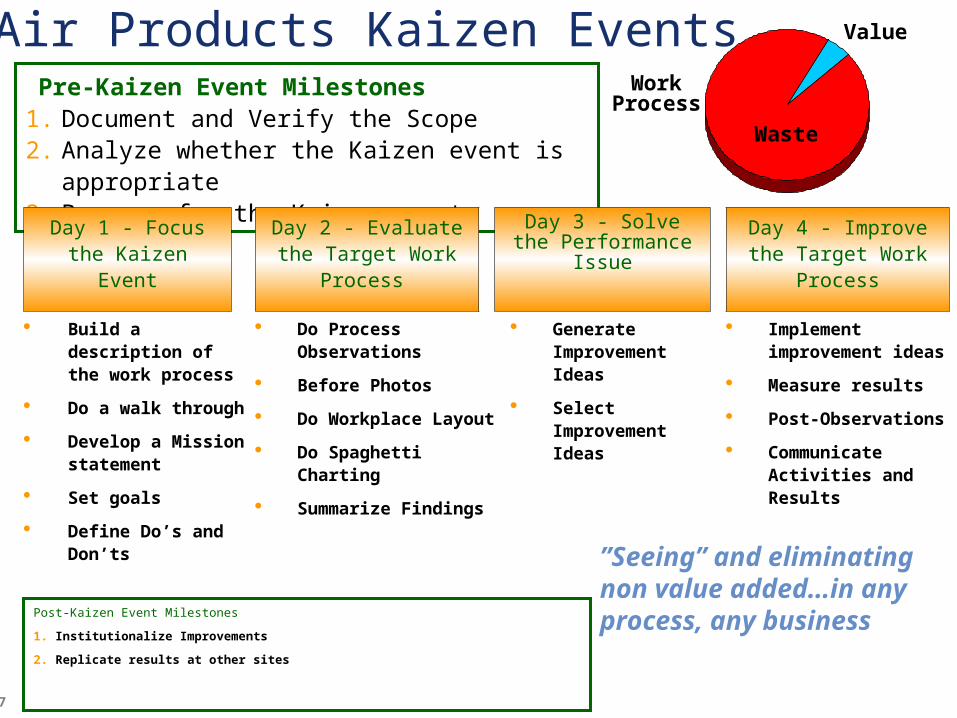
Do Process Observations
Before Photos
Do Workplace Layout
Do Spaghetti Charting
Summarize Findings
Generate Improvement Ideas
Select Improvement Ideas
Implement improvement ideas
Measure results
Post-Observations
Communicate Activities and Results
Post-Kaizen Event Milestones
1. Institutionalize Improvements
2. Replicate results at other sites
Pre-Kaizen Event Milestones
1. Document and Verify the Scope2. Analyze whether the Kaizen event is appropriate3. Prepare for the Kaizen event
Air Products Kaizen Events
Waste
Value
Work Process
Build a description of the work process
Do a walk through
Develop a Mission statement
Set goals
Define Do’s and Don’ts
Day 1 - Focus the Kaizen Event
Day 2 - Evaluate the Target Work Process
Day 3 - Solve the Performance Issue
Day 4 - Improve the Target Work Process
”Seeing” and eliminating non value added…in any process, any business
18
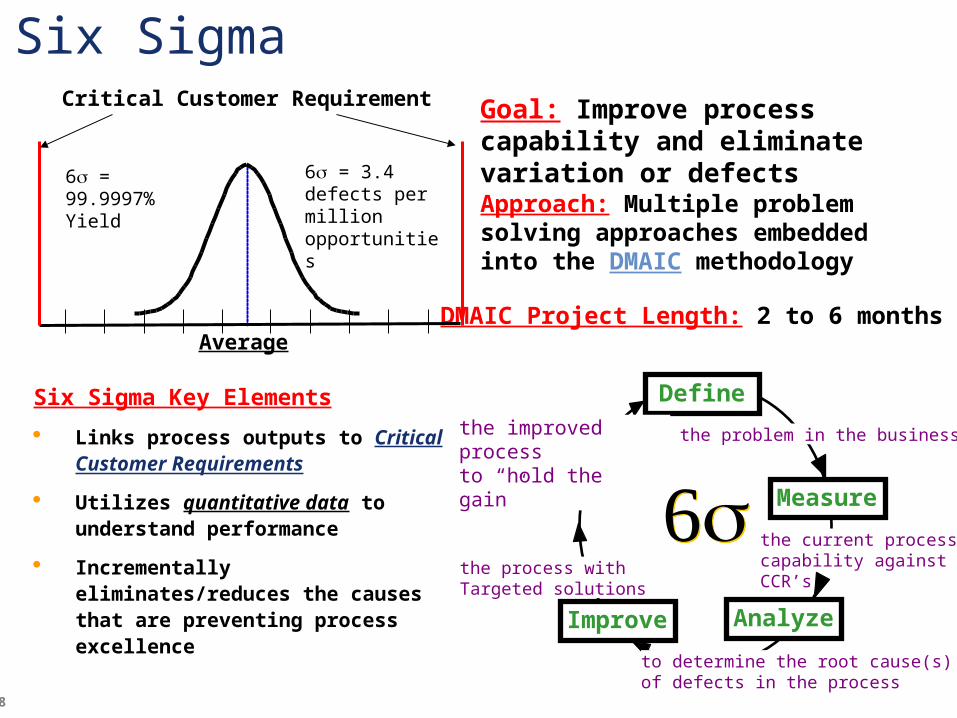
Goal: Improve process capability and eliminate variation or defects
the current process capability against CCR’s
Define
MeasureControl
AnalyzeImprove
the problem in the business
to determine the root cause(s)of defects in the process
the process withTargeted solutions
the improved processto “hold the gain”
Six Sigma
Six Sigma Key Elements
Links process outputs to Critical Customer Requirements
Utilizes quantitative data to understand performance
Incrementally eliminates/reduces the causes that are preventing process excellence
DMAIC Project Length: 2 to 6 months
Approach: Multiple problem solving approaches embedded into the DMAIC methodology
Critical Customer Requirement
Average
6 = 3.4 defects per million opportunities
6 = 99.9997% Yield
19
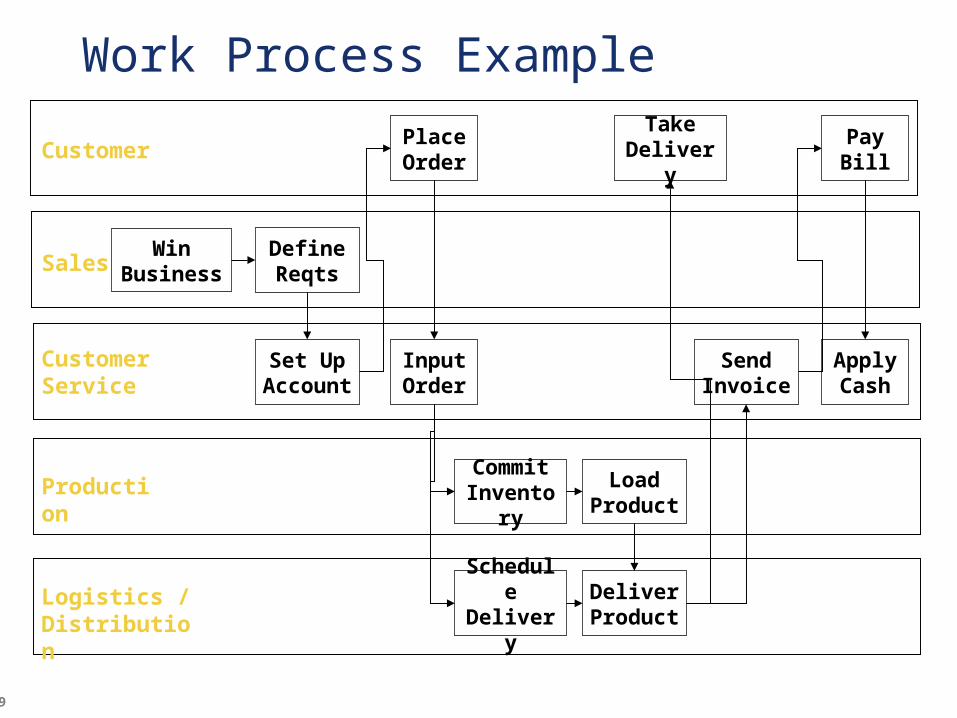
Work Process Example
Place Order
TakeDelivery
PayBill
Sales
CustomerService
Production
Logistics / Distribution
Customer
Win Business
SendInvoice
Set UpAccount
CommitInventory
ScheduleDelivery
DeliverProduct
DefineReqts
InputOrder
ApplyCash
Load Product
20
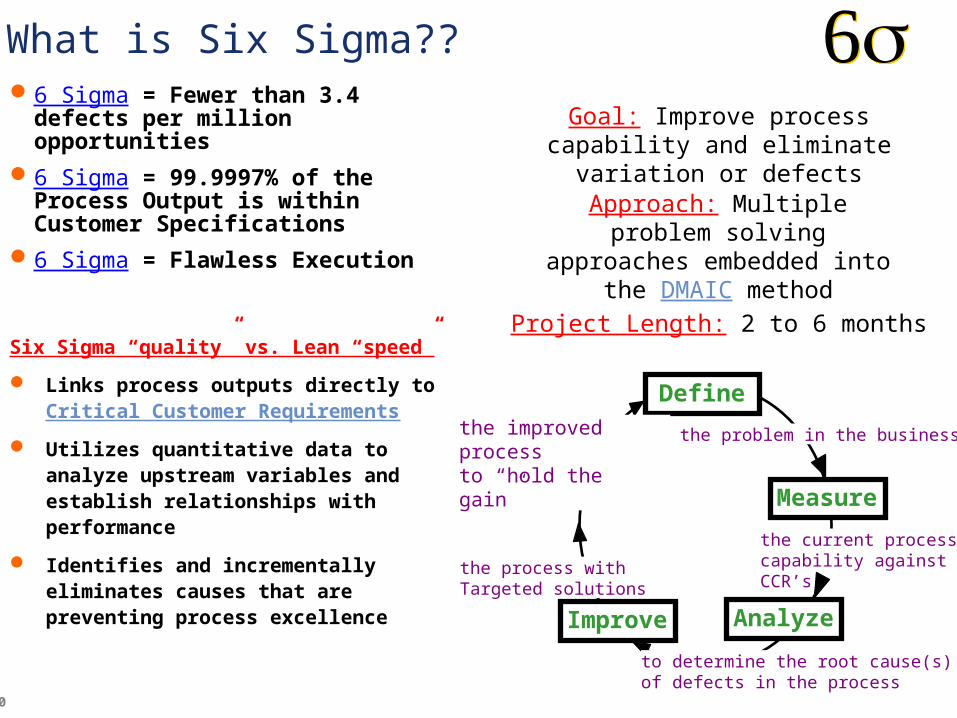
Goal: Improve process capability and eliminate variation or defects
the current process capability against CCR’s
Define
MeasureControl
AnalyzeImprove
the problem in the business
to determine the root cause(s)of defects in the process
the process withTargeted solutions
the improved processto “hold the gain”
What is Six Sigma??
Six Sigma “quality” vs. Lean “speed”
Links process outputs directly to Critical Customer Requirements
Utilizes quantitative data to analyze upstream variables and establish relationships with performance
Identifies and incrementally eliminates causes that are preventing process excellence
6 Sigma = Fewer than 3.4 defects per million opportunities
6 Sigma = 99.9997% of the Process Output is within Customer Specifications
6 Sigma = Flawless Execution
Project Length: 2 to 6 months
Approach: Multiple problem solving approaches embedded
into the DMAIC method
21
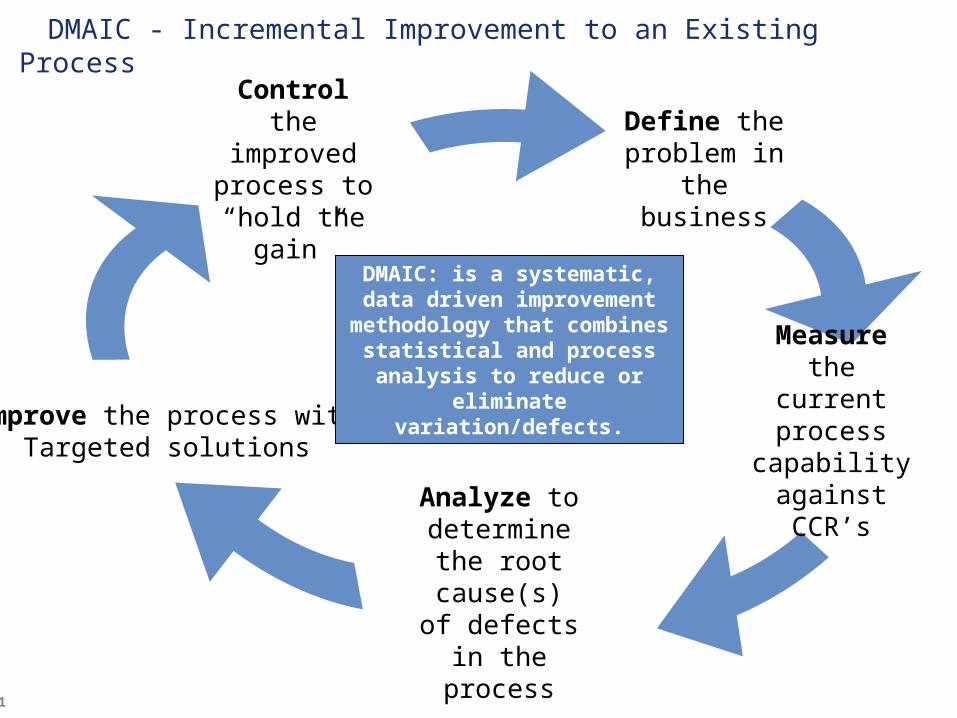
Define the problem in the
business
Improve the process withTargeted solutions
Control the improved process to
“hold the gain”
Measure the current process
capability against CCR’s
Analyze to determine the root cause(s) of defects in the process
DMAIC: is a systematic, data driven improvement
methodology that combines statistical and process analysis
to reduce or eliminate variation/defects.
DMAIC - Incremental Improvement to an Existing Process
22
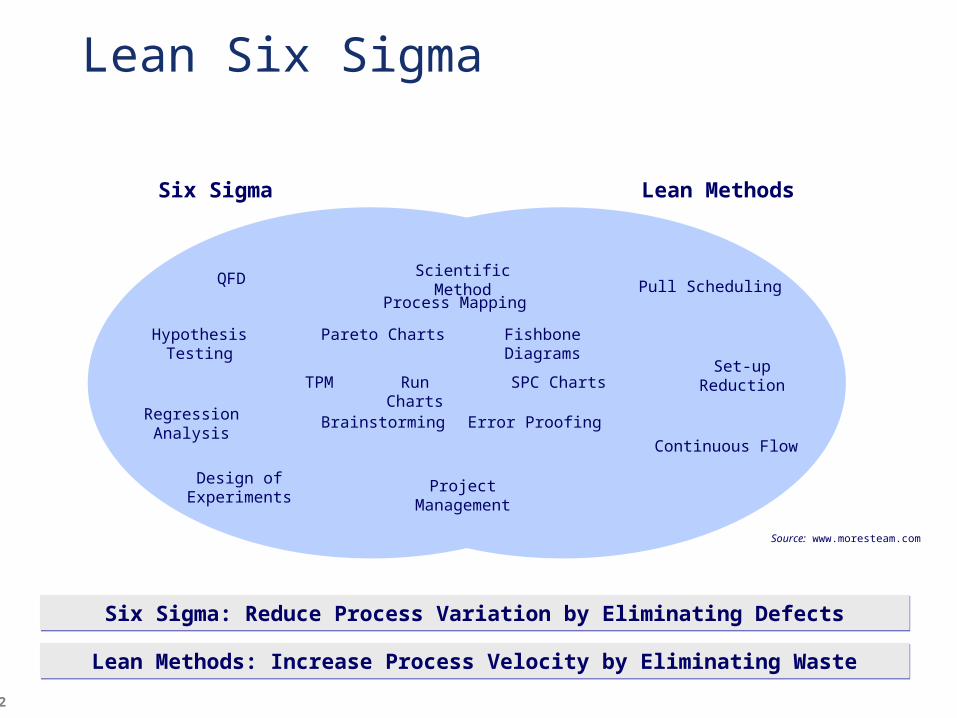
Lean Six Sigma
Hypothesis Testing
Design of Experiments
Pull Scheduling
Set-up Reduction
Continuous Flow
Scientific Method
Process Mapping
Pareto Charts Fishbone Diagrams
TPM Run Charts SPC Charts
Brainstorming Error Proofing
Project Management
QFD
Regression Analysis
Six Sigma Lean Methods
Source: www.moresteam.com
Six Sigma: Reduce Process Variation by Eliminating DefectsSix Sigma: Reduce Process Variation by Eliminating Defects
Lean Methods: Increase Process Velocity by Eliminating WasteLean Methods: Increase Process Velocity by Eliminating Waste
23
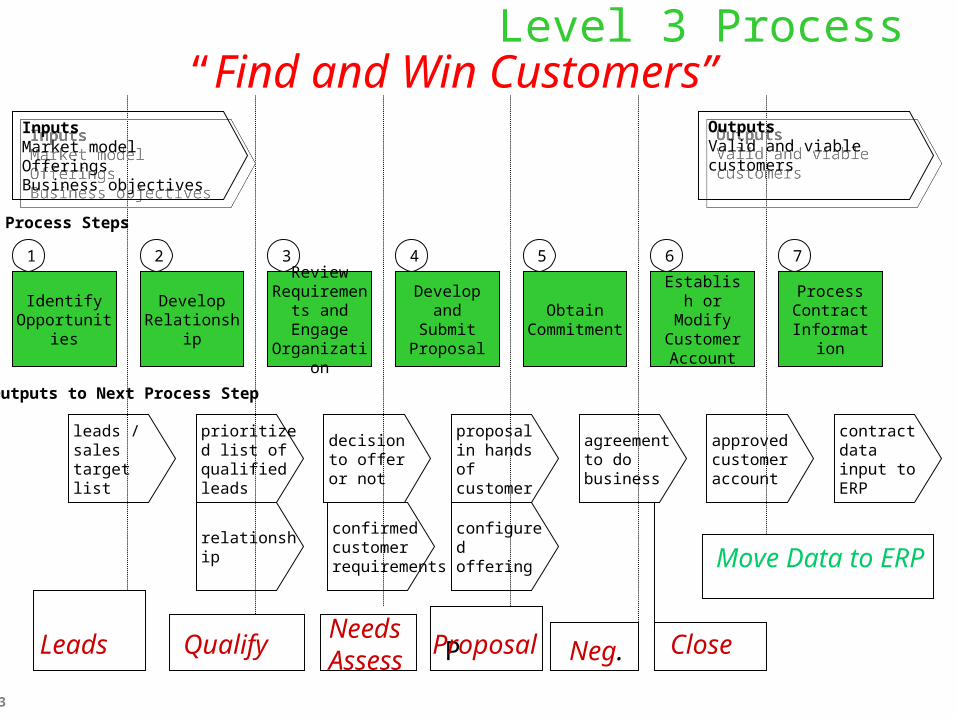
Level 3 Process “Find and Win Customers”
Identify Opportunities
1
leads / sales target list
Develop Relationship
2
prioritized list of qualified leads
Review Requirements and Engage Organization
3
decision to offer or not
Develop and Submit
Proposal
4
proposal in hands of customer
Obtain Commitment
5
agreement to do business
Establish or Modify
Customer Account
6
approved customer account
Process Contract
Information
7
contract data input to ERP
Process Steps
Outputs to Next Process Step
OutputsValid and viable customers
OutputsValid and viable customers
relationshipconfirmed customer requirements
configured offering
Inputs Market modelOfferingsBusiness objectives
Inputs Market modelOfferingsBusiness objectives
Leads QualifyNeedsAssess PProposal Neg. Close
Move Data to ERP
24
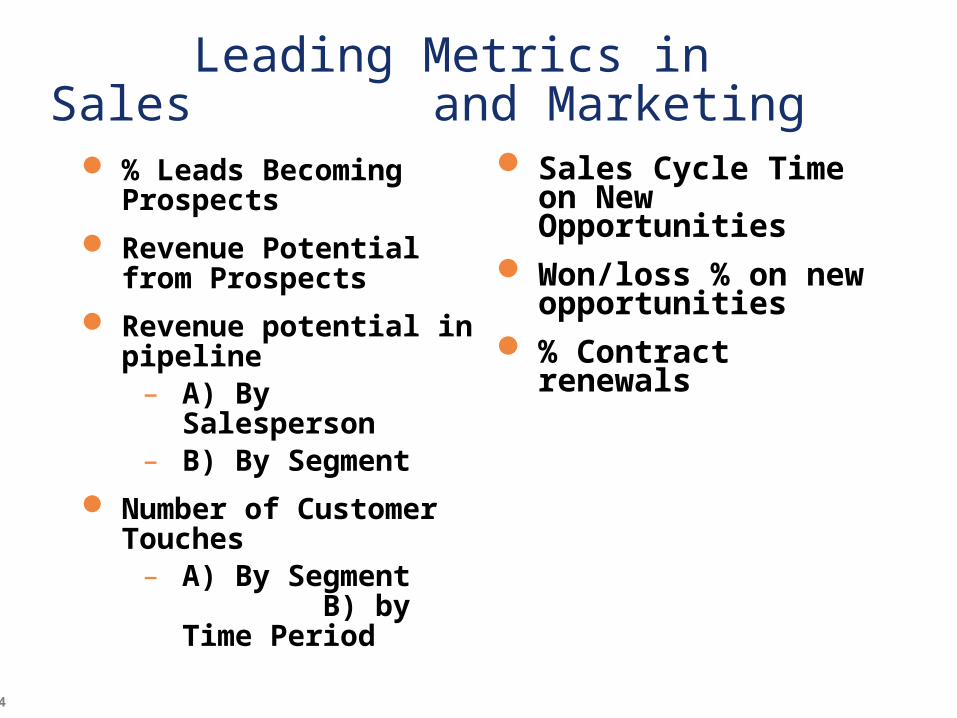
Leading Metrics in Sales and Marketing
% Leads Becoming Prospects
Revenue Potential from Prospects
Revenue potential in pipeline
– A) By Salesperson– B) By Segment
Number of Customer Touches
– A) By Segment B) by Time Period
Sales Cycle Time on New Opportunities
Won/loss % on new opportunities
% Contract renewals
25
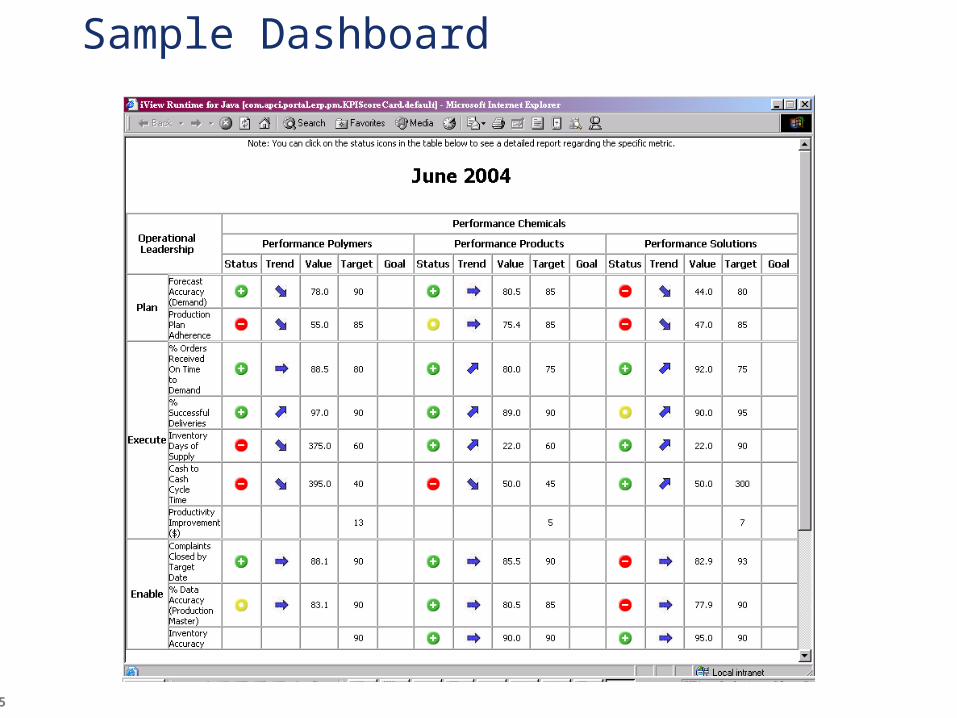
Sample Dashboard

26
“Visibility” of Metric Performance
Scorecard(cross-business comparisons)
Metrics Report(trends and commentary)
Key Measures Link(BW or Excel details)
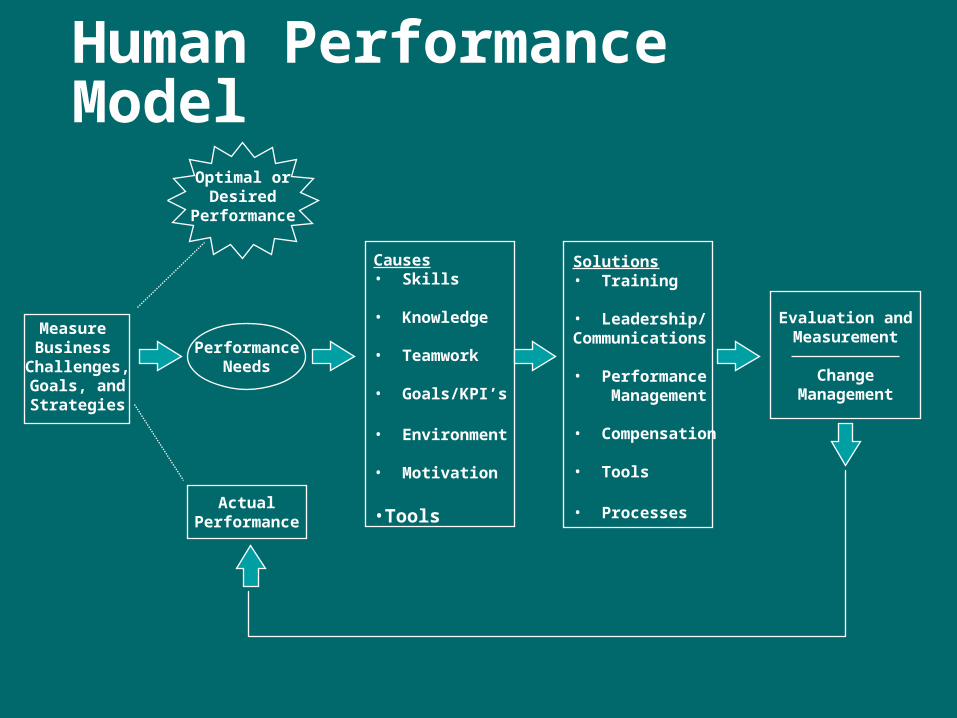
Human Performance Model
Measure Business
Challenges,Goals, andStrategies
PerformanceNeeds
Causes• Skills
• Knowledge
• Teamwork
• Goals/KPI’s
• Environment
• Motivation
•Tools
Solutions• Training
• Leadership/Communications
• Performance Management
• Compensation
• Tools
• Processes
Evaluation andMeasurement
ChangeManagement
Optimal orDesired
Performance
ActualPerformance
28
PERFORMANCE MANAGEMENT STEPSPERFORMANCE MANAGEMENT STEPS
Performance Planning
Performance Execution
Feedback
Consequences
Development
Cascading of Goals• Performance measures provide “line of sight” from
strategy to individual job performance
• Everyone knows how performance is measured and evaluated
• Everyone knows what they are supposed to do -- and how to do it!• Everyone knows upstream and downstream dependencies
• Measurement is fact-based, relevant, actionable• Information is standardized, visible, consistent, and timely
• Significant component of all individuals’ pay linked to measurement
• Individual and manager identify performance gaps and develop plans to close the gaps
29
Performance ManagementMethods
– Map/Define the work that needs improvement
– Better execution of the “plan” via Leadership/Communications, i.e. “just do it”
– Find and Share a “Best Practice”– Apply Lean or Six Sigma or other tools to
solve problems more efficiently and effectively
– Redesign the process-redesign patterns– Automate process with IT applications
Thank You &Good Luck ManagingYour Performance inMGT 2206-001-Business AnalyticsVillanova School of Business