Embed Size (px)
Citation preview

Business Application Research Center
Performance Management –
Current Challenges and Future Directions
A global survey of the maturity of Performance Management processes.
By BARC, July 2009
BARC – Business Application Research Center
2 Performance Management: A Global Survey
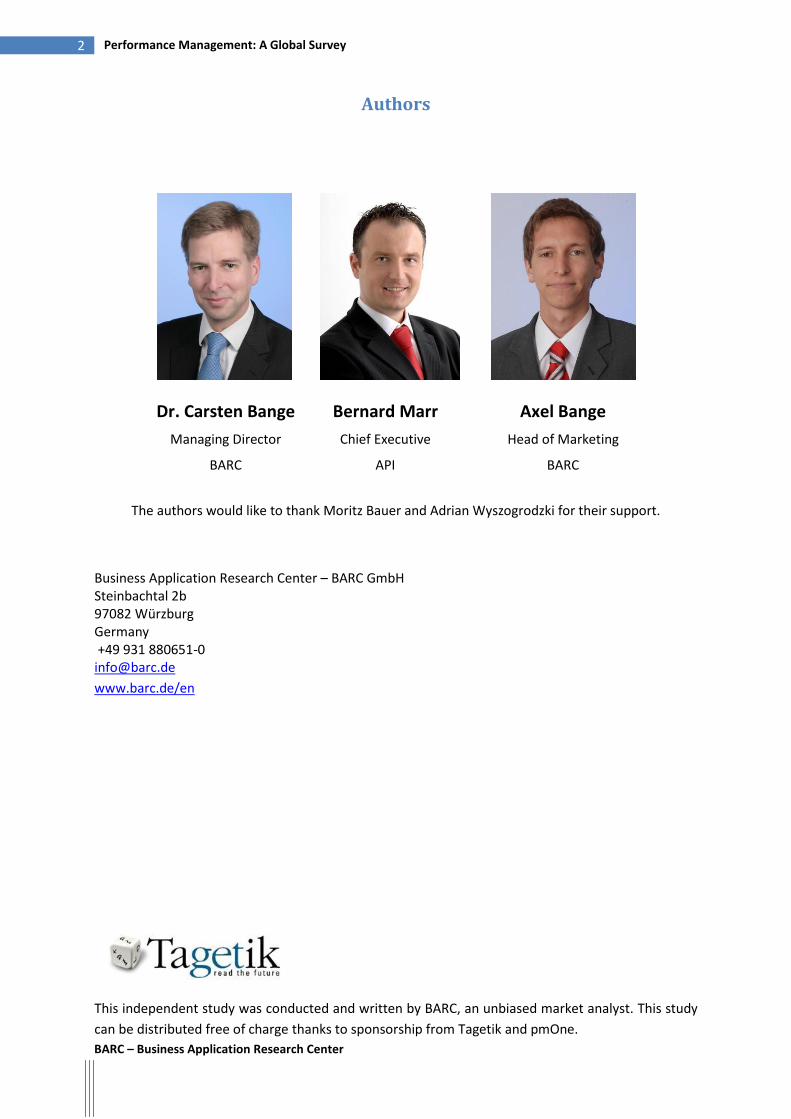
Authors
Dr. Carsten Bange
Managing Director
BARC
Bernard Marr
Chief Executive
API
Axel Bange
Head of Marketing
BARC
The authors would like to thank Moritz Bauer and Adrian Wyszogrodzki for their support.
Business Application Research Center – BARC GmbH Steinbachtal 2b 97082 Würzburg Germany +49 931 880651-0 [email protected]
www.barc.de/en
This independent study was conducted and written by BARC, an unbiased market analyst. This study
can be distributed free of charge thanks to sponsorship from Tagetik and pmOne.
BARC – Business Application Research Center
3 Performance Management: A Global Survey
Contents
Authors .................................................................................................................................................... 2
Contents .................................................................................................................................................. 3
Executive summary ................................................................................................................................. 4
Introduction ............................................................................................................................................. 6
Framework of the empirical study .......................................................................................................... 7
Demographics .......................................................................................................................................... 7
Current Challenges for Performance Management ................................................................................ 9
Status of performance management processes ................................................................................... 13
Improvement of performance management processes ....................................................................... 18
Integration of performance management processes ........................................................................... 20
Conclusion ............................................................................................................................................. 22
BARC stands for neutrality, competence and quality ........................................................................... 23
BARC – Business Application Research Center
4 Performance Management: A Global Survey
Executive summary
Key processes for managing organizational performance include planning and budgeting, financial
consolidation, reporting, compliance and risk management, as well as strategy management. This
global study explores the key challenges organizations face today, the implications of these chal-
lenges on performance management processes, future process improvement priorities as well as
integration levels between the different performance management processes.
This vendor-independent empirical study is based on 553 responses from organizations across a wide
range industries, countries and company sizes. Most respondents were executives from departments
such as finance, IT and general management. The study was conducted between March and May
2009.
The following key messages have emerged from this study:
• Business
– Acceleration of processes (faster reporting, shorter planning cycles, fast close)
across all existing PM processes is the major improvement priority.
– Creation of better links between strategy management and other PM processes is
the major integration priority.
• Organization
– PM processes are becoming more complex, with more people involved and an in-
creasing number of tools used. This requires careful management.
– It is important to better align IT and business so they share a common vision of per-
formance management.
• Technology
– Companies do increasingly use more specialized software tools to automate their
PM processes, as opposed to using basic spreadsheet tools such as Excel.
– There is an increasing need for integrated technology platforms that allow compa-
nies to manage performance across the different PM processes.
These key messages have emerged from the four sections of this study. Here is an overview of the
finding in each of the four sections:
Current Challenges
In light of current challenges, 93 percent of respondents state that complexity of their role
has increased, in fact, 51 percent say complexity has increased by “a lot”.
The main factors that create challenges for organizations today are the current economic
turmoil as well as increased competition.
BARC – Business Application Research Center
5 Performance Management: A Global Survey
Both external and internal changes have a major impact on performance management
processes; key factors that drive performance management activities are:
o desire for more content and more requests for information,
o organizational dynamics from restructuring and new products, and
o more regulations.
In 38 percent of organizations business and IT do not share a common vision of performance
management.
Status of performance management processes
Performance Management has become a strategic process: The number of people involved
in performance management has risen significantly over the last three years (on average by
about 30 percent across all processes).
For individual processes Strategy Management, Compliance Management and Plan-
ning/Budgeting/Forecasting show the highest increases.
Usage of specialized Performance Management software is growing, often replacing
Spreadsheet and ERP applications.
The finance industry is the heaviest user of Performance Management software across all
processes.
Most companies use 1-3 tools for PM, the average is 4.9.
Improvement of performance management processes
More than 80 percent of companies think their PM processes need improvement.
Process improvement is seen as a priority over resource or output considerations.
The most common goals of any improvement initiatives to PM processes are:
o Data quality,
o Implementation of corporate strategy, and
o Reduction of complexity.
Integration of performance management processes
The greatest benefits are thought to be achieved by integrating planning and budgeting with
other PM processes.
The biggest value is seen in integration of planning and budgeting with strategy manage-
ment.
There is a large gap in perceived value and implementations of integrated software platforms
for PM processes.
BARC – Business Application Research Center
6 Performance Management: A Global Survey
Introduction
Performance Management comprises a set of
management processes, often supported by
technology, that help companies to manage
and monitor their performance. This vendor-
independent empirical study takes a closer
look at the current state of performance man-
agement processes in organizations. In the
current economic climate there are many
internal and external challenges facing the
Chief Executive Officers (CEOs), Chief Finance
Officers (CFOs), Chief Information Officers
(CIOs) and all the departments involved in
managing an organization’s performance.
One obvious effect of these challenges is the
rising complexity in managing the business.
Thus, this global study identifies the current
challenges and future directions of the per-
formance management processes in organiza-
tions.
The first part of this study aims to identify the
key challenges managers face today and ex-
amines which internal and external factors
influence the complexity they have to deal
with.
We then explore the impact of these chal-
lenges on performance management
processes. In particular, we take a closer look
at the following five processes that support
the performance management of organiza-
tions:
1. Planning, budgeting and forecasting
2. Legal/financial consolidation and financial
reporting
3. Other reporting
4. Compliance and risk management
5. Strategy management
Important indicators of the current state and
future directions of performance management
processes are the number of people and tools
involved. We therefore asked participants to
indicate how many people are involved in
performance management processes and
what software tools are used to support them.
In the second part we take a look at the key
areas for improvement. In particular, we look
at speed, efficiency and effectiveness of the
processes to pinpoint the major factors that
drive organizations to improve their perfor-
mance management processes. We also ex-
plore the improvement priorities and the initi-
ative already ongoing.
In the third and final part we investigate the
integration and alignment of the various per-
formance management processes. Integration
helps managers to share information and in-
sight across all PM processes to inform deci-
sion making in a more unified and compre-
hensive way. However, different organization-
al units in charge of different processes, and
an increasing number of people and tools
used to support performance management
often have the effect of driving PM processes
apart. More so, if PM is to become a pervasive
activity in organizations it has to enable them
to better execute on strategy and more quick-
ly respond to the challenges they face. With
this in mind, we explore the level of integra-
tion achieved so far and identify the perceived
value of and priorities for the integration of
PM processes.
BARC – Business Application Research Center
7 Performance Management: A Global Survey
Framework of the empirical study
The data used in this empirical study stems from a survey conducted worldwide between March and
May 2009. Participants were contacted through more than 25000 personalized emails, promotion on
relevant web sites and in various newsletters. In addition, hard copy versions of the survey were
handed out at relevant conferences worldwide. The questionnaire was available in English, German,
Spanish, Portuguese, French and Italian.
The objective was to survey people who are stakeholders in performance management processes.
The methodology used was a mixed-mode data collection and a multi-language survey. The ques-
tionnaire was promoted to business professionals worldwide through direct mailings and with media
support. The target groups were general management as well as any IT professionals or business
users involved in performance management processes.
A total of 580 questionnaires were completed. 27 of these were eliminated because they were in-
complete or dubious in nature. As a result the detailed analysis was based on the responses of 553
participants.
To ensure a high level of data quality, the analysts omitted obvious incorrect entries to individual
questions from the final analysis. Respondents did have the option to skip questions entirely without
answering.
This data was evaluated using frequency, cross-table and correlation analyses as well as statistical
hypothesis tests. The analysts were also committed to keeping a high sample level.
Demographics
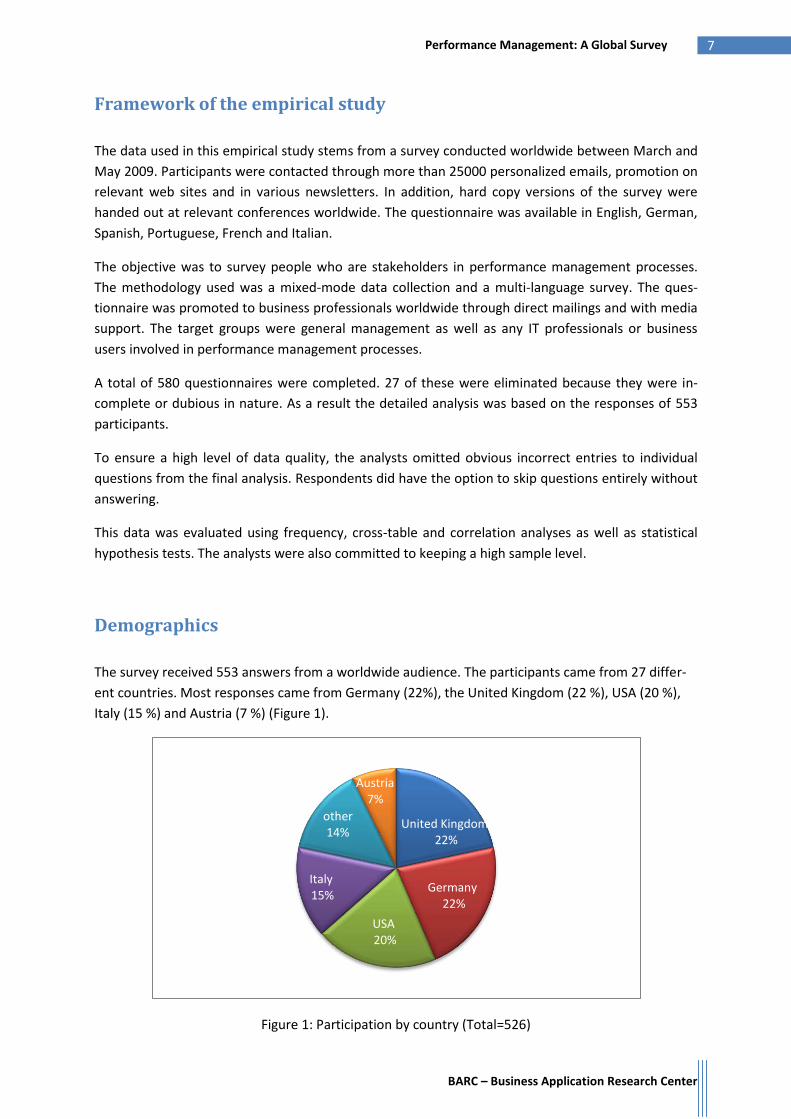
The survey received 553 answers from a worldwide audience. The participants came from 27 differ-
ent countries. Most responses came from Germany (22%), the United Kingdom (22 %), USA (20 %),
Italy (15 %) and Austria (7 %) (Figure 1).
Figure 1: Participation by country (Total=526)
United Kingdom22%
Germany22%
USA20%
Italy15%
other14%
Austria7%
BARC – Business Application Research Center
8 Performance Management: A Global Survey
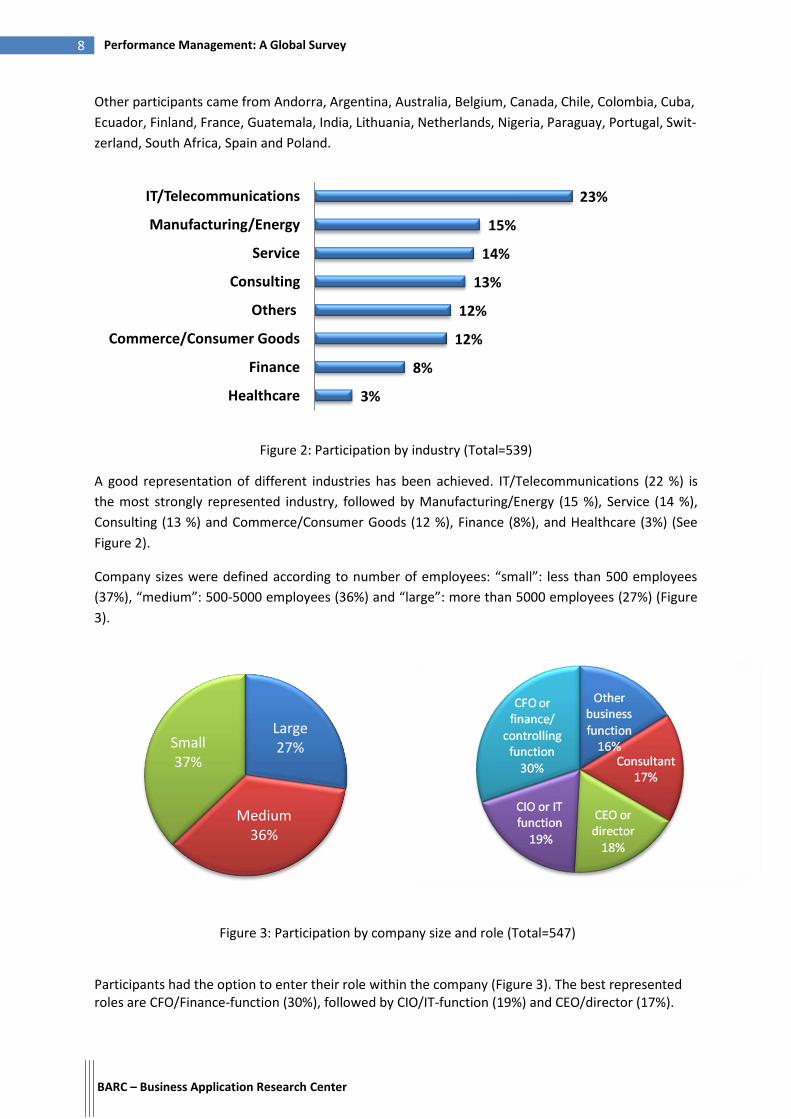
Other participants came from Andorra, Argentina, Australia, Belgium, Canada, Chile, Colombia, Cuba,
Ecuador, Finland, France, Guatemala, India, Lithuania, Netherlands, Nigeria, Paraguay, Portugal, Swit-
zerland, South Africa, Spain and Poland.
Figure 2: Participation by industry (Total=539)
A good representation of different industries has been achieved. IT/Telecommunications (22 %) is
the most strongly represented industry, followed by Manufacturing/Energy (15 %), Service (14 %),
Consulting (13 %) and Commerce/Consumer Goods (12 %), Finance (8%), and Healthcare (3%) (See
Figure 2).
Company sizes were defined according to number of employees: “small”: less than 500 employees
(37%), “medium”: 500-5000 employees (36%) and “large”: more than 5000 employees (27%) (Figure
3).
Figure 3: Participation by company size and role (Total=547)
Participants had the option to enter their role within the company (Figure 3). The best represented roles are CFO/Finance-function (30%), followed by CIO/IT-function (19%) and CEO/director (17%).
23%
15%
14%
13%
12%
12%
8%
3%
IT/Telecommunications
Manufacturing/Energy
Service
Consulting
Others
Commerce/Consumer Goods
Finance
Healthcare
Large 27%
Medium 36%
Small 37%
BARC – Business Application Research Center
9 Performance Management: A Global Survey
Current Challenges for Performance Management
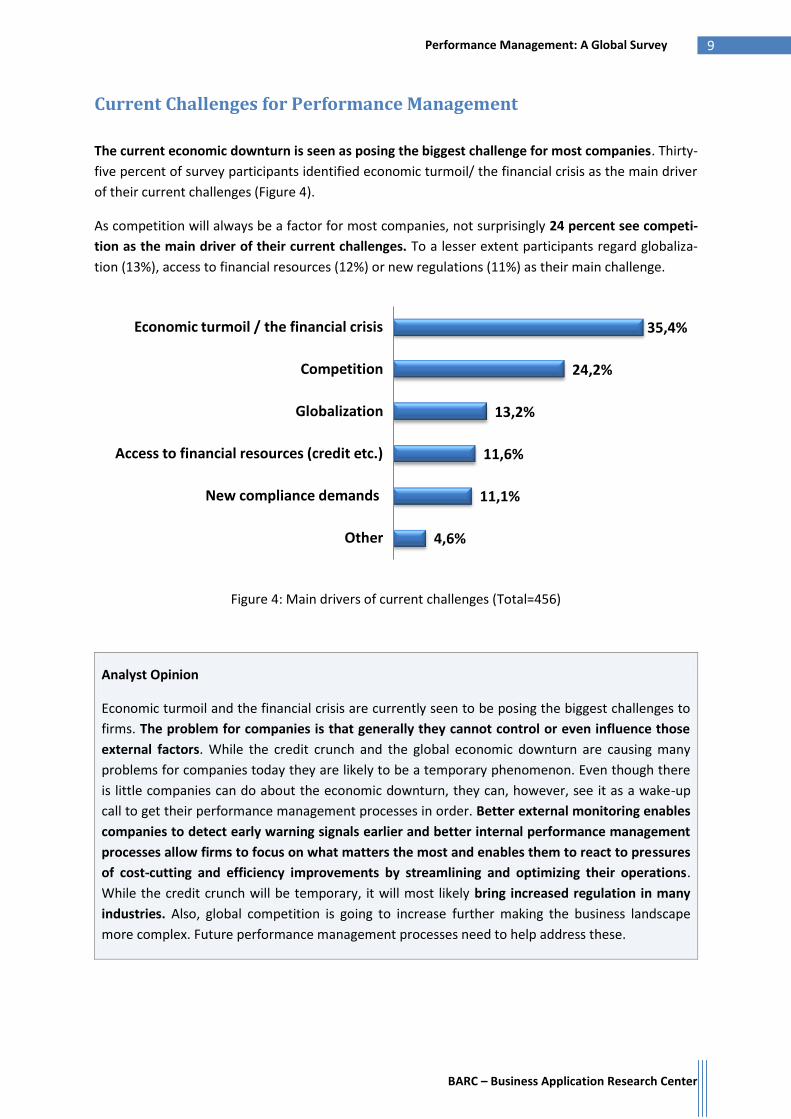
The current economic downturn is seen as posing the biggest challenge for most companies. Thirty-
five percent of survey participants identified economic turmoil/ the financial crisis as the main driver
of their current challenges (Figure 4).
As competition will always be a factor for most companies, not surprisingly 24 percent see competi-
tion as the main driver of their current challenges. To a lesser extent participants regard globaliza-
tion (13%), access to financial resources (12%) or new regulations (11%) as their main challenge.
Figure 4: Main drivers of current challenges (Total=456)
Analyst Opinion
Economic turmoil and the financial crisis are currently seen to be posing the biggest challenges to
firms. The problem for companies is that generally they cannot control or even influence those
external factors. While the credit crunch and the global economic downturn are causing many
problems for companies today they are likely to be a temporary phenomenon. Even though there
is little companies can do about the economic downturn, they can, however, see it as a wake-up
call to get their performance management processes in order. Better external monitoring enables
companies to detect early warning signals earlier and better internal performance management
processes allow firms to focus on what matters the most and enables them to react to pressures
of cost-cutting and efficiency improvements by streamlining and optimizing their operations.
While the credit crunch will be temporary, it will most likely bring increased regulation in many
industries. Also, global competition is going to increase further making the business landscape
more complex. Future performance management processes need to help address these.
35,4%
24,2%
13,2%
11,6%
11,1%
4,6%
Economic turmoil / the financial crisis
Competition
Globalization
Access to financial resources (credit etc.)
New compliance demands
Other
BARC – Business Application Research Center
10 Performance Management: A Global Survey
Internal and external changes
The economic downturn has been identified as posing the biggest challenges to business today. But
what affects the actual performance management processes in companies the most? In order to
answer this, survey participants were asked about external and internal changes that have had an
impact on their performance management processes.
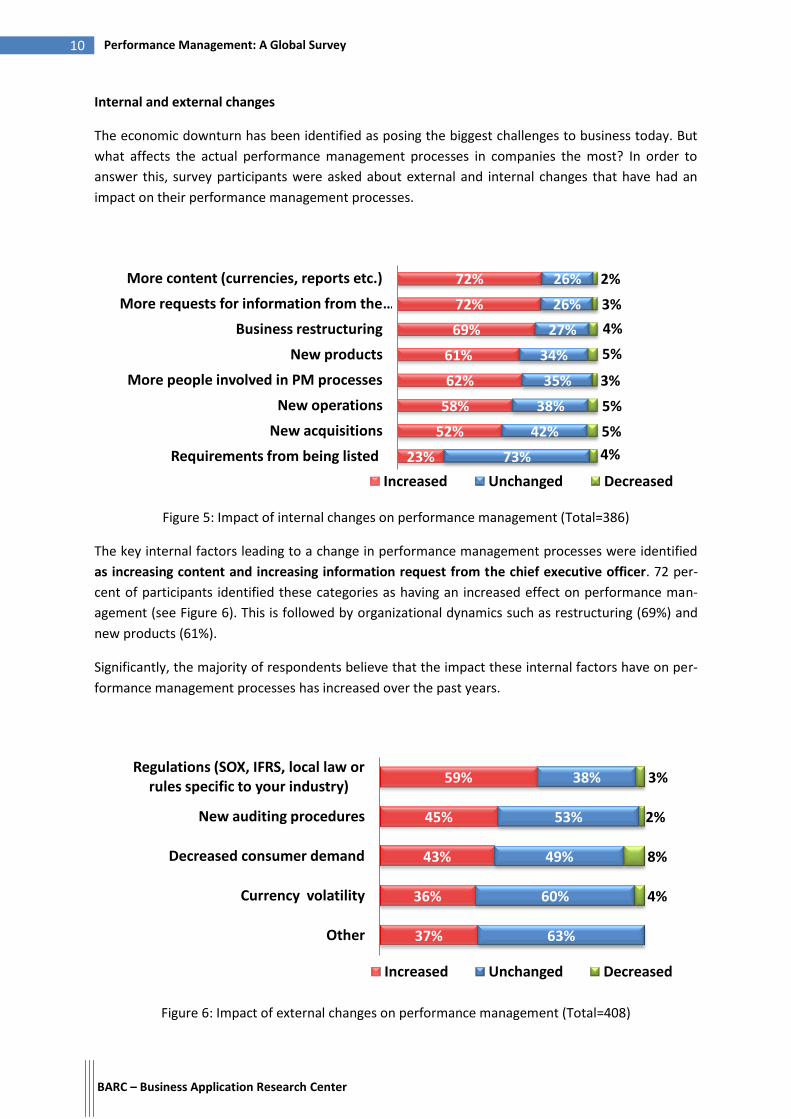
Figure 5: Impact of internal changes on performance management (Total=386)
The key internal factors leading to a change in performance management processes were identified
as increasing content and increasing information request from the chief executive officer. 72 per-
cent of participants identified these categories as having an increased effect on performance man-
agement (see Figure 6). This is followed by organizational dynamics such as restructuring (69%) and
new products (61%).
Significantly, the majority of respondents believe that the impact these internal factors have on per-
formance management processes has increased over the past years.
Figure 6: Impact of external changes on performance management (Total=408)
23%
52%
58%
62%
61%
69%
72%
72%
73%
42%
38%
35%
34%
27%
26%
26%
4%
5%
5%
3%
5%
4%
3%
2%
Requirements from being listed
New acquisitions
New operations
More people involved in PM processes
New products
Business restructuring
More requests for information from the …
More content (currencies, reports etc.)
Increased Unchanged Decreased
37%
36%
43%
45%
59%
63%
60%
49%
53%
38%
4%
8%
2%
3%
Other
Currency volatility
Decreased consumer demand
New auditing procedures
Regulations (SOX, IFRS, local law or rules specific to your industry)
Increased Unchanged Decreased
BARC – Business Application Research Center
11 Performance Management: A Global Survey
The same scenario is repeated for the external factors, where 59 percent of the survey participants
believe that the impact of factors such as Sarbanes Oxley, local laws or industry-specific rules on
their performance management processes has increased (see Figure 6). 45 percent report an in-
creasing impact from new auditing processes while 43 percent identify decreased customer demand
as impacting performance management processes.
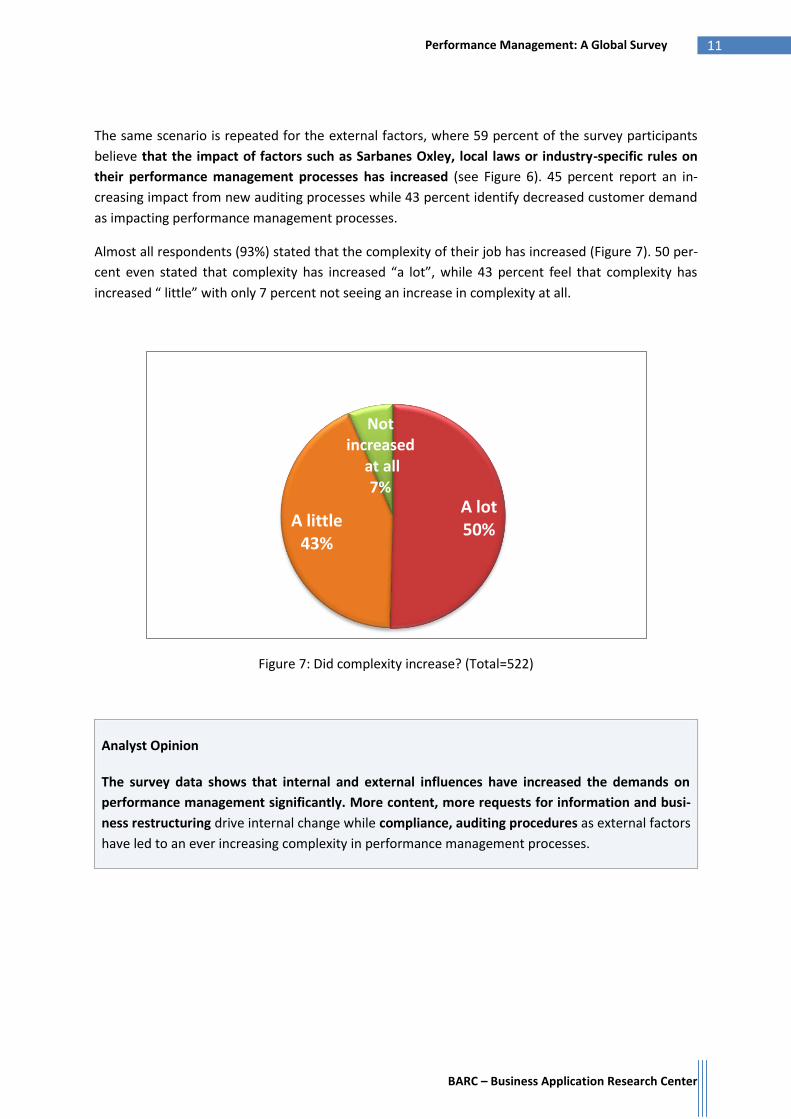
Almost all respondents (93%) stated that the complexity of their job has increased (Figure 7). 50 per-
cent even stated that complexity has increased “a lot”, while 43 percent feel that complexity has
increased “ little” with only 7 percent not seeing an increase in complexity at all.
Figure 7: Did complexity increase? (Total=522)
Analyst Opinion
The survey data shows that internal and external influences have increased the demands on
performance management significantly. More content, more requests for information and busi-
ness restructuring drive internal change while compliance, auditing procedures as external factors
have led to an ever increasing complexity in performance management processes.
A lot 50%A little
43%
Not increased
at all7%
BARC – Business Application Research Center
12 Performance Management: A Global Survey
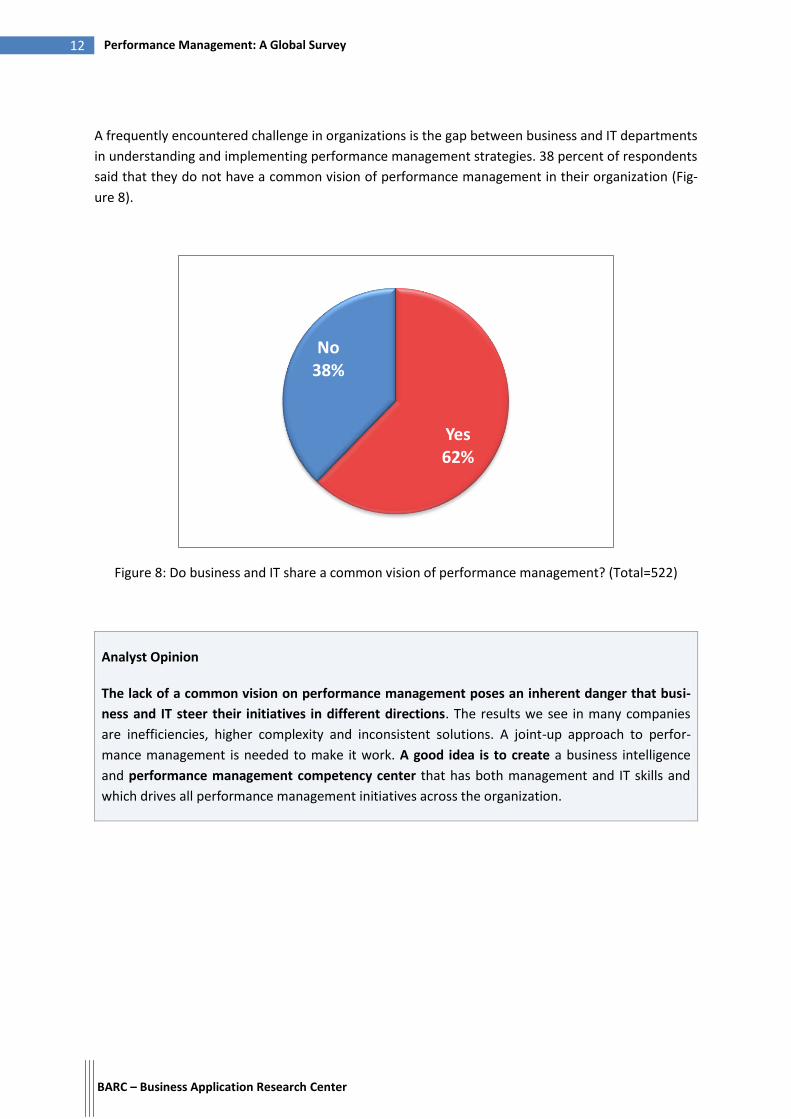
A frequently encountered challenge in organizations is the gap between business and IT departments
in understanding and implementing performance management strategies. 38 percent of respondents
said that they do not have a common vision of performance management in their organization (Fig-
ure 8).
Figure 8: Do business and IT share a common vision of performance management? (Total=522)
Analyst Opinion
The lack of a common vision on performance management poses an inherent danger that busi-
ness and IT steer their initiatives in different directions. The results we see in many companies
are inefficiencies, higher complexity and inconsistent solutions. A joint-up approach to perfor-
mance management is needed to make it work. A good idea is to create a business intelligence
and performance management competency center that has both management and IT skills and
which drives all performance management initiatives across the organization.
Yes62%
No38%
BARC – Business Application Research Center
13 Performance Management: A Global Survey
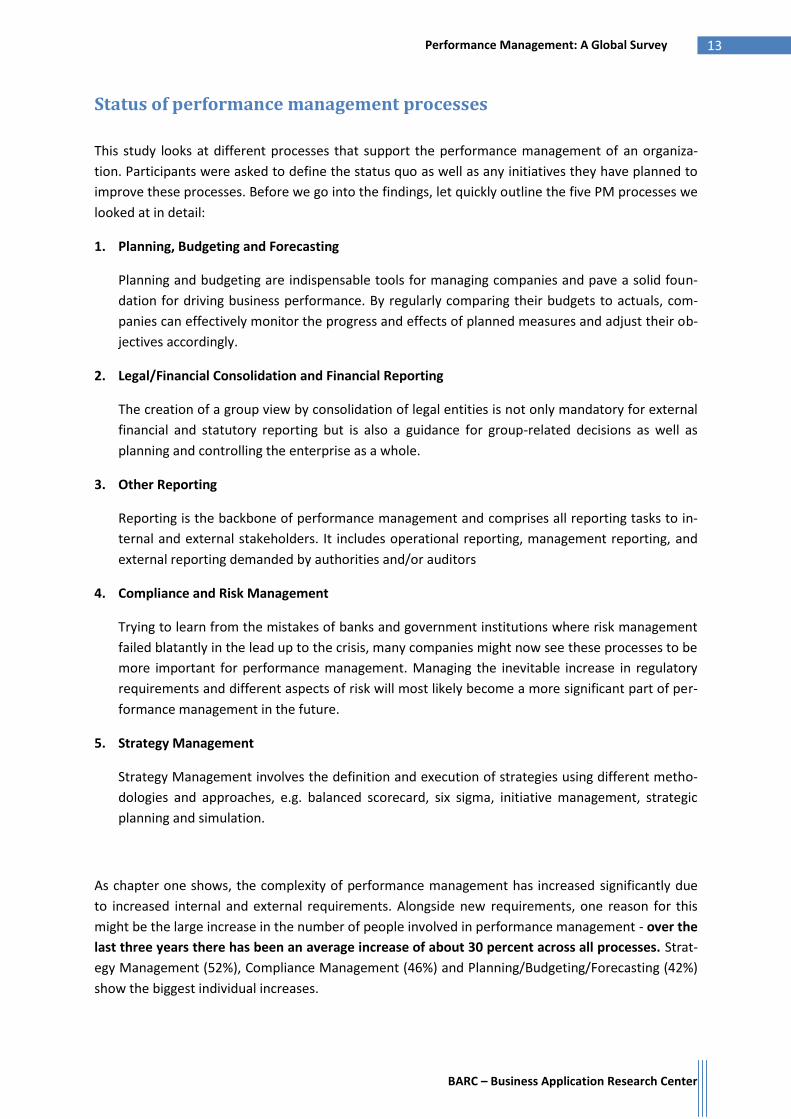
Status of performance management processes
This study looks at different processes that support the performance management of an organiza-
tion. Participants were asked to define the status quo as well as any initiatives they have planned to
improve these processes. Before we go into the findings, let quickly outline the five PM processes we
looked at in detail:
1. Planning, Budgeting and Forecasting
Planning and budgeting are indispensable tools for managing companies and pave a solid foun-
dation for driving business performance. By regularly comparing their budgets to actuals, com-
panies can effectively monitor the progress and effects of planned measures and adjust their ob-
jectives accordingly.
2. Legal/Financial Consolidation and Financial Reporting
The creation of a group view by consolidation of legal entities is not only mandatory for external
financial and statutory reporting but is also a guidance for group-related decisions as well as
planning and controlling the enterprise as a whole.
3. Other Reporting
Reporting is the backbone of performance management and comprises all reporting tasks to in-
ternal and external stakeholders. It includes operational reporting, management reporting, and
external reporting demanded by authorities and/or auditors
4. Compliance and Risk Management
Trying to learn from the mistakes of banks and government institutions where risk management
failed blatantly in the lead up to the crisis, many companies might now see these processes to be
more important for performance management. Managing the inevitable increase in regulatory
requirements and different aspects of risk will most likely become a more significant part of per-
formance management in the future.
5. Strategy Management
Strategy Management involves the definition and execution of strategies using different metho-
dologies and approaches, e.g. balanced scorecard, six sigma, initiative management, strategic
planning and simulation.
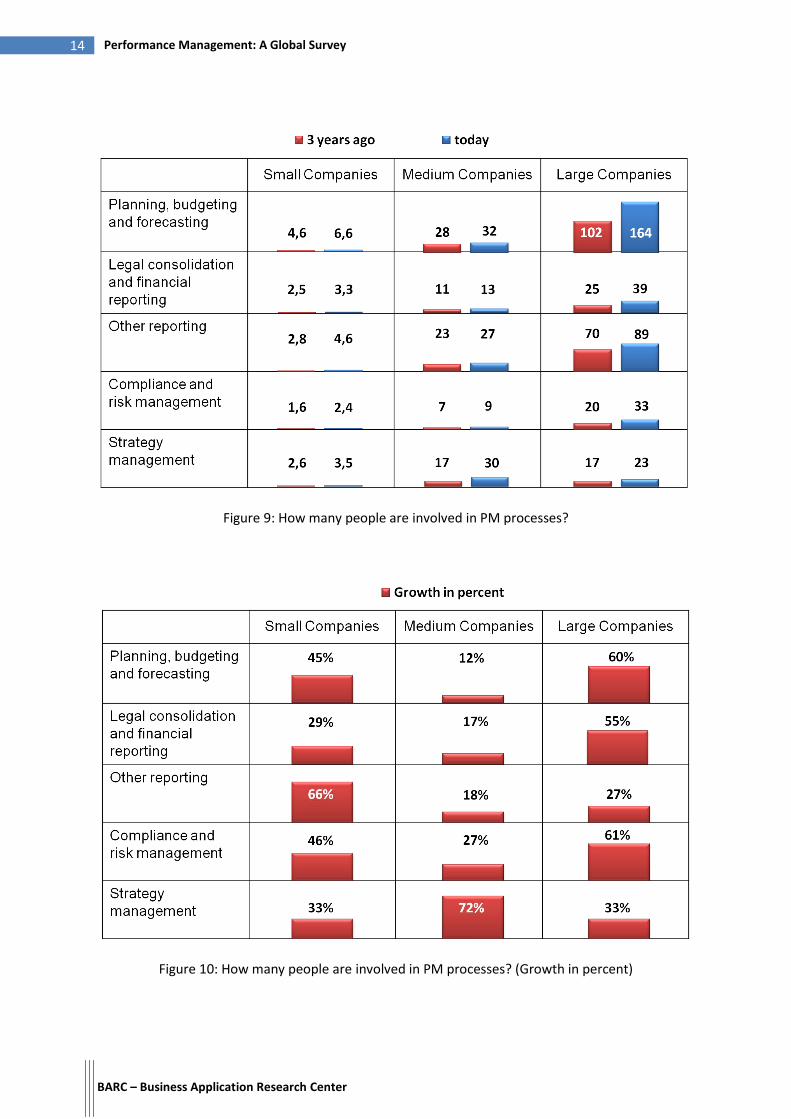
As chapter one shows, the complexity of performance management has increased significantly due
to increased internal and external requirements. Alongside new requirements, one reason for this
might be the large increase in the number of people involved in performance management - over the
last three years there has been an average increase of about 30 percent across all processes. Strat-
egy Management (52%), Compliance Management (46%) and Planning/Budgeting/Forecasting (42%)
show the biggest individual increases.
BARC – Business Application Research Center
14 Performance Management: A Global Survey
Figure 9: How many people are involved in PM processes?
Figure 10: How many people are involved in PM processes? (Growth in percent)
BARC – Business Application Research Center
15 Performance Management: A Global Survey
Looking at the actual number of people involved in PM processes, large increases can be seen across
all processes and across all company sizes (see Figure 10 and 11). Compared to three years ago the
number of people involved in all processes has risen by an average of 30 percent. Very big individual
increases can be seen in small companies for other reporting (66%), in medium-sized companies
for strategy management (72%) and in large companies for planning (60%), legal consolidation
(55%) and compliance (61%).
Analyst Opinion
The fact that more people are involved in performance management shows that companies are
serious about managing performance. The trends reflect the facts that smaller companies are
catching up across many performance management processes, while medium and large firms
focus on some of the gaps and current priorities such as strategy management, compliance and
planning. Over the next few years we expect further expansion of performance management
processes, in particular in medium sized companies who have some catching up to do. However, in
the long-run we would expect to see some consolidation driven by integration and automation. A
smaller more focused team could control the overall processes while a larger group of people will
become end-users of analytics and performance management.
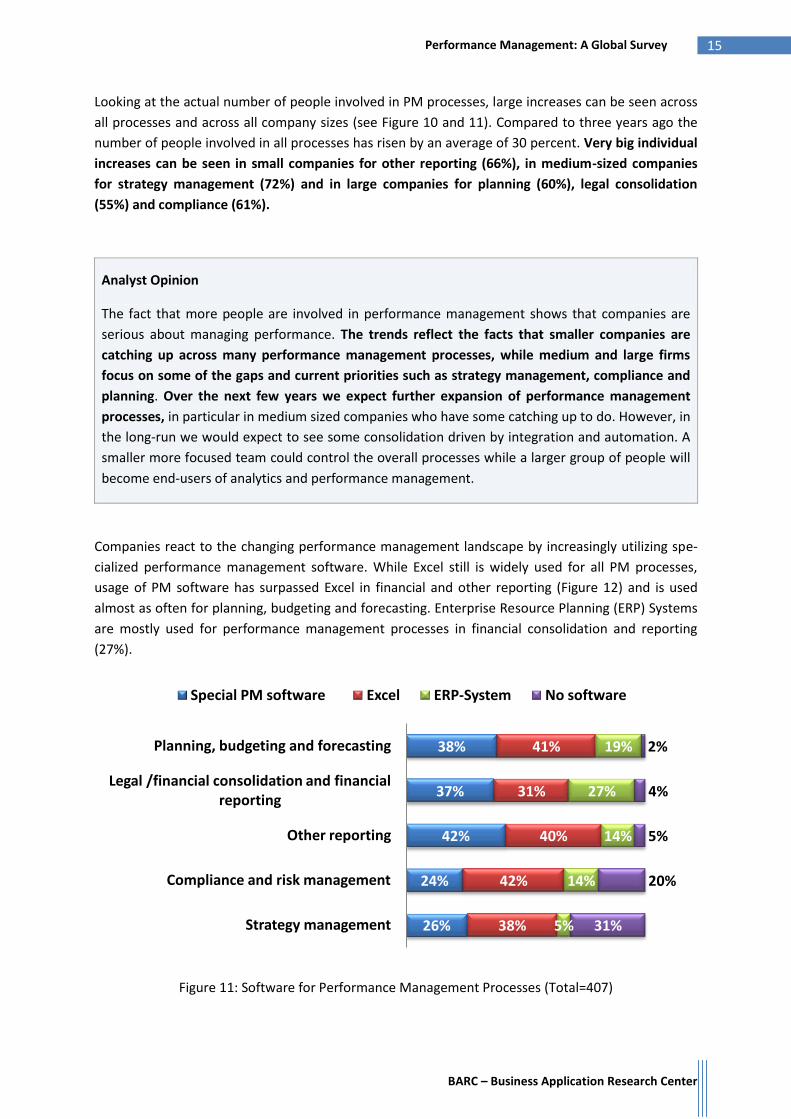
Companies react to the changing performance management landscape by increasingly utilizing spe-
cialized performance management software. While Excel still is widely used for all PM processes,
usage of PM software has surpassed Excel in financial and other reporting (Figure 12) and is used
almost as often for planning, budgeting and forecasting. Enterprise Resource Planning (ERP) Systems
are mostly used for performance management processes in financial consolidation and reporting
(27%).
Figure 11: Software for Performance Management Processes (Total=407)
26%
24%
42%
37%
38%
38%
42%
40%
31%
41%
5%
14%
14%
27%
19%
31%
20%
5%
4%
2%
Strategy management
Compliance and risk management
Other reporting
Legal /financial consolidation and financial reporting
Planning, budgeting and forecasting
Special PM software Excel ERP-System No software
BARC – Business Application Research Center
16 Performance Management: A Global Survey
Twenty percent of companies surveyed do not use any software for compliance and risk manage-
ment and thirty-three percent do not use software for strategy management. Incidentally these are
also the two areas that show the biggest increases in the average number of people involved in the
process (Figure 10). With more people involved the pressure to support these processes by specia-
lized software might also increase in the future.
When cross analyzing software usage with perceived complexity of their roles, it is notable that users
of ERP-Systems complain significantly more about increased complexity.
Analyst opinion
This study shows that Excel is becoming less dominant as the key software tool to manage perfor-
mance. This is good to see considering the advantages specialized PM software applications offer.
In some areas such as legal and financial consolidation and reporting there are more companies
using specialized PM software tools than spreadsheet applications. For planning, budgeting and
forecasting it is almost the same level of companies using Excel and specialized PM software. We
expect this trend to continue as more companies purchase specialized applications that allow
them to unleash the power of performance management processes.
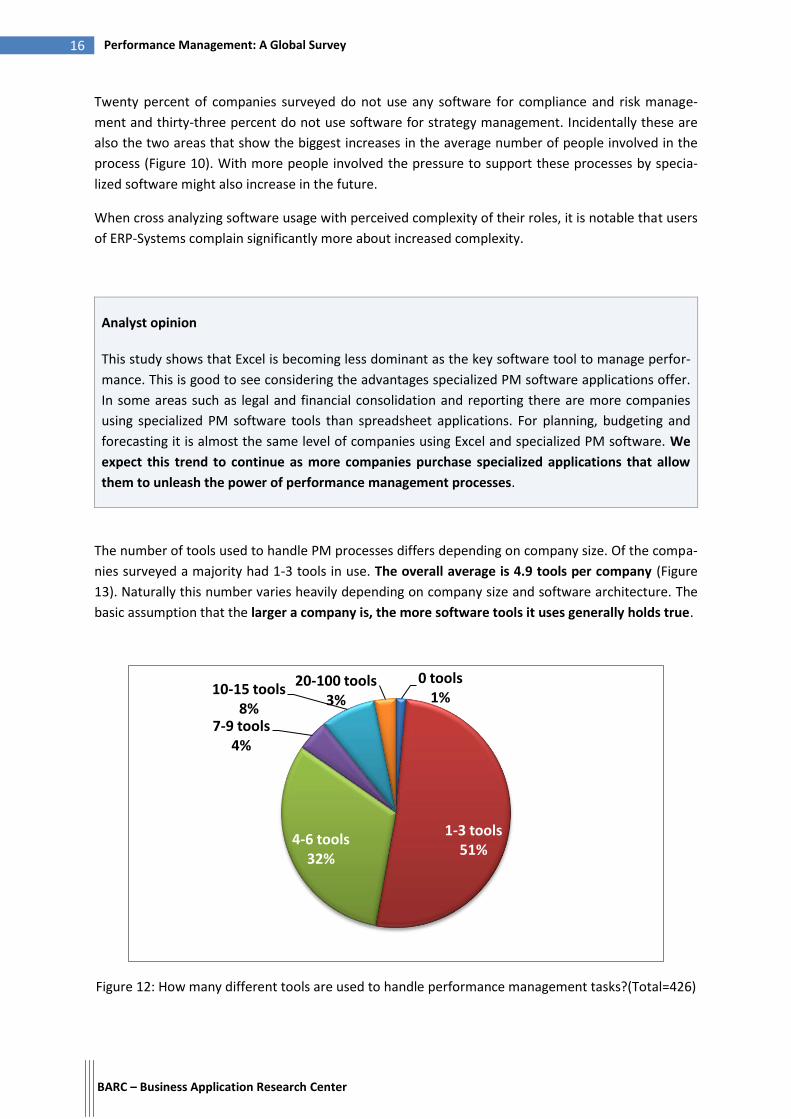
The number of tools used to handle PM processes differs depending on company size. Of the compa-
nies surveyed a majority had 1-3 tools in use. The overall average is 4.9 tools per company (Figure
13). Naturally this number varies heavily depending on company size and software architecture. The
basic assumption that the larger a company is, the more software tools it uses generally holds true.
Figure 12: How many different tools are used to handle performance management tasks?(Total=426)
0 tools1%
1-3 tools51%
4-6 tools32%
7-9 tools4%
10-15 tools8%
20-100 tools3%
BARC – Business Application Research Center
17 Performance Management: A Global Survey
Analyst opinion
The more tools companies use for performance management the bigger the problems get. Data
transfer between systems as well as different methodologies, processes and user interfaces of
different tools lead to many challenges in running and administering the overall PM and data man-
agement infrastructure. We expect to see more consolidation and implementations of integrated
enterprise performance management solutions, replacing different point solutions.
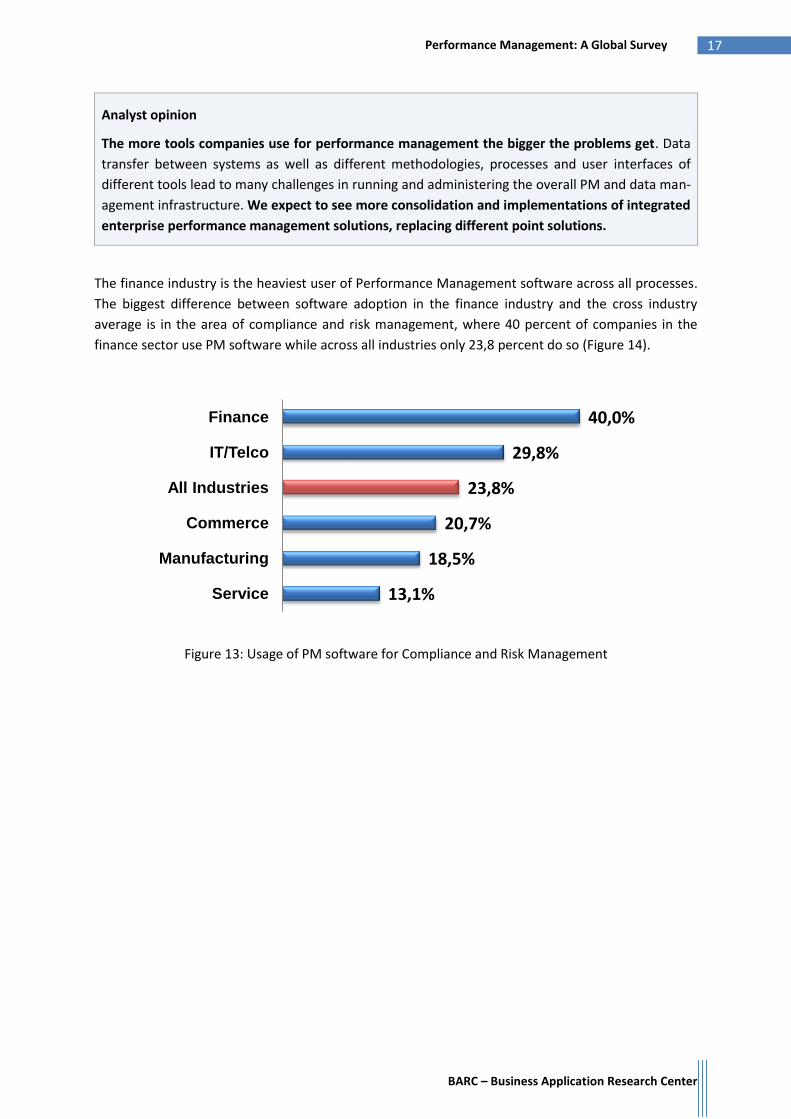
The finance industry is the heaviest user of Performance Management software across all processes.
The biggest difference between software adoption in the finance industry and the cross industry
average is in the area of compliance and risk management, where 40 percent of companies in the
finance sector use PM software while across all industries only 23,8 percent do so (Figure 14).
Figure 13: Usage of PM software for Compliance and Risk Management
40,0%
29,8%
23,8%
20,7%
18,5%
13,1%
Finance
IT/Telco
All Industries
Commerce
Manufacturing
Service
BARC – Business Application Research Center
18 Performance Management: A Global Survey
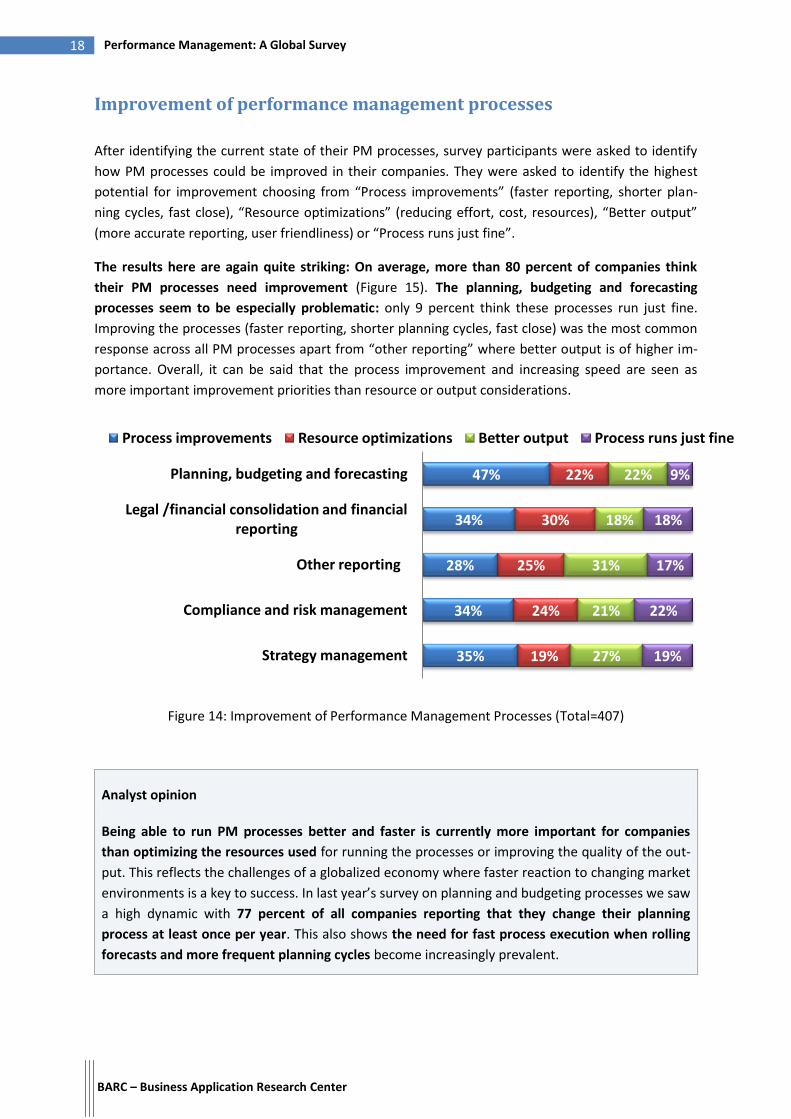
Improvement of performance management processes
After identifying the current state of their PM processes, survey participants were asked to identify
how PM processes could be improved in their companies. They were asked to identify the highest
potential for improvement choosing from “Process improvements” (faster reporting, shorter plan-
ning cycles, fast close), “Resource optimizations” (reducing effort, cost, resources), “Better output”
(more accurate reporting, user friendliness) or “Process runs just fine”.
The results here are again quite striking: On average, more than 80 percent of companies think
their PM processes need improvement (Figure 15). The planning, budgeting and forecasting
processes seem to be especially problematic: only 9 percent think these processes run just fine.
Improving the processes (faster reporting, shorter planning cycles, fast close) was the most common
response across all PM processes apart from “other reporting” where better output is of higher im-
portance. Overall, it can be said that the process improvement and increasing speed are seen as
more important improvement priorities than resource or output considerations.
Figure 14: Improvement of Performance Management Processes (Total=407)
Analyst opinion
Being able to run PM processes better and faster is currently more important for companies
than optimizing the resources used for running the processes or improving the quality of the out-
put. This reflects the challenges of a globalized economy where faster reaction to changing market
environments is a key to success. In last year’s survey on planning and budgeting processes we saw
a high dynamic with 77 percent of all companies reporting that they change their planning
process at least once per year. This also shows the need for fast process execution when rolling
forecasts and more frequent planning cycles become increasingly prevalent.
35%
34%
28%
34%
47%
19%
24%
25%
30%
22%
27%
21%
31%
18%
22%
19%
22%
17%
18%
9%
Strategy management
Compliance and risk management
Other reporting
Legal /financial consolidation and financial reporting
Planning, budgeting and forecasting
Process improvements Resource optimizations Better output Process runs just fine
BARC – Business Application Research Center
19 Performance Management: A Global Survey
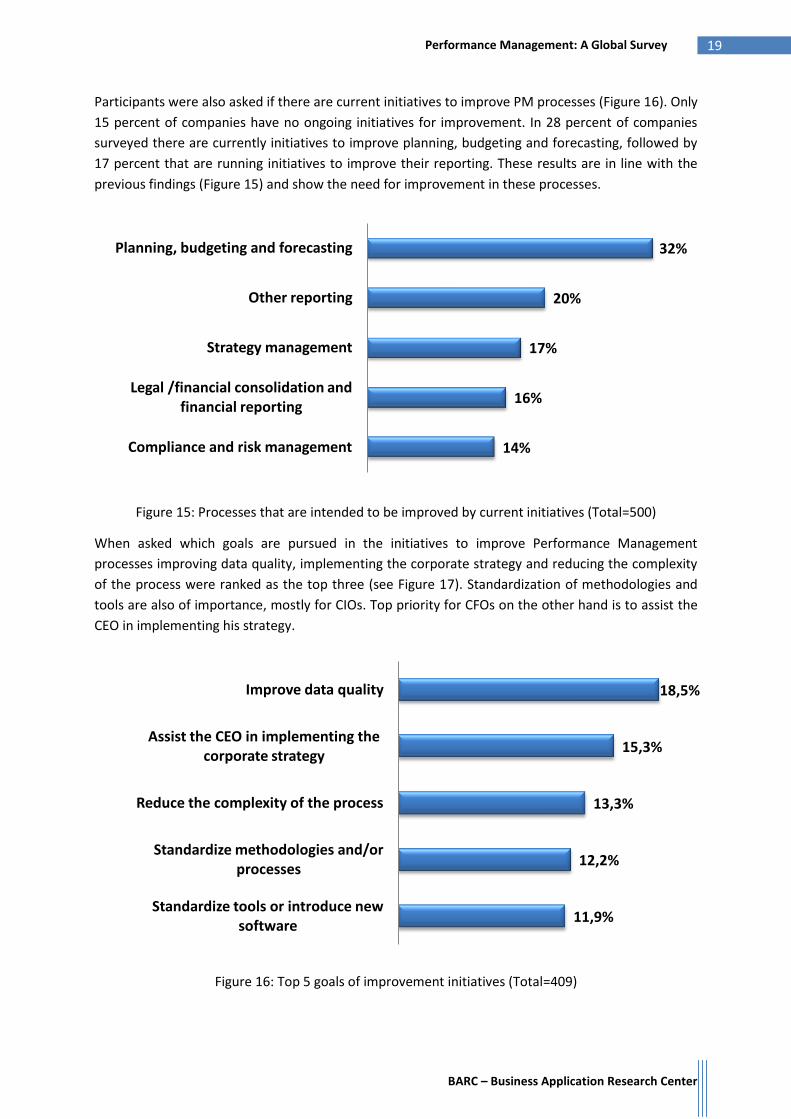
Participants were also asked if there are current initiatives to improve PM processes (Figure 16). Only
15 percent of companies have no ongoing initiatives for improvement. In 28 percent of companies
surveyed there are currently initiatives to improve planning, budgeting and forecasting, followed by
17 percent that are running initiatives to improve their reporting. These results are in line with the
previous findings (Figure 15) and show the need for improvement in these processes.
Figure 15: Processes that are intended to be improved by current initiatives (Total=500)
When asked which goals are pursued in the initiatives to improve Performance Management
processes improving data quality, implementing the corporate strategy and reducing the complexity
of the process were ranked as the top three (see Figure 17). Standardization of methodologies and
tools are also of importance, mostly for CIOs. Top priority for CFOs on the other hand is to assist the
CEO in implementing his strategy.
Figure 16: Top 5 goals of improvement initiatives (Total=409)
32%
20%
17%
16%
14%
Planning, budgeting and forecasting
Other reporting
Strategy management
Legal /financial consolidation and financial reporting
Compliance and risk management
18,5%
15,3%
13,3%
12,2%
11,9%
Improve data quality
Assist the CEO in implementing the corporate strategy
Reduce the complexity of the process
Standardize methodologies and/or processes
Standardize tools or introduce new software
BARC – Business Application Research Center
20 Performance Management: A Global Survey
Integration of performance management processes
With 93 percent of respondents complaining about higher complexity and over 80 percent seeing a
need to improve their performance management processes, the question of how improvements can
be achieved comes into focus. With increasing information requests, more people involved and a
growing number of tools implemented on the one hand and the need for higher speed and better
quality in processes on the other, one hypothesis is that an integration of processes can help to
tackle these challenges and deficiencies. The study looked at the perceived value of integrating PM
processes to identify whether integration in general is valued (Figure 18) and to see which of the
particular PM process integration is seen as most valuable ( see Figure 19).
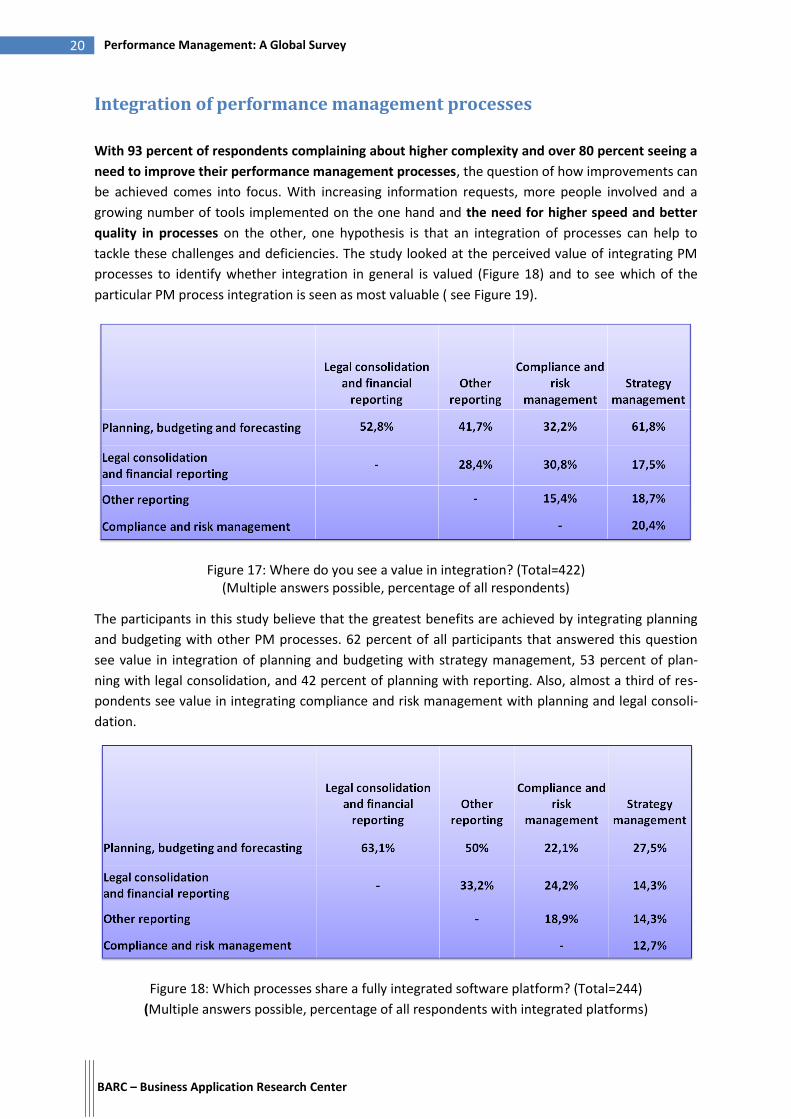
Figure 17: Where do you see a value in integration? (Total=422) (Multiple answers possible, percentage of all respondents)
The participants in this study believe that the greatest benefits are achieved by integrating planning
and budgeting with other PM processes. 62 percent of all participants that answered this question
see value in integration of planning and budgeting with strategy management, 53 percent of plan-
ning with legal consolidation, and 42 percent of planning with reporting. Also, almost a third of res-
pondents see value in integrating compliance and risk management with planning and legal consoli-
dation.
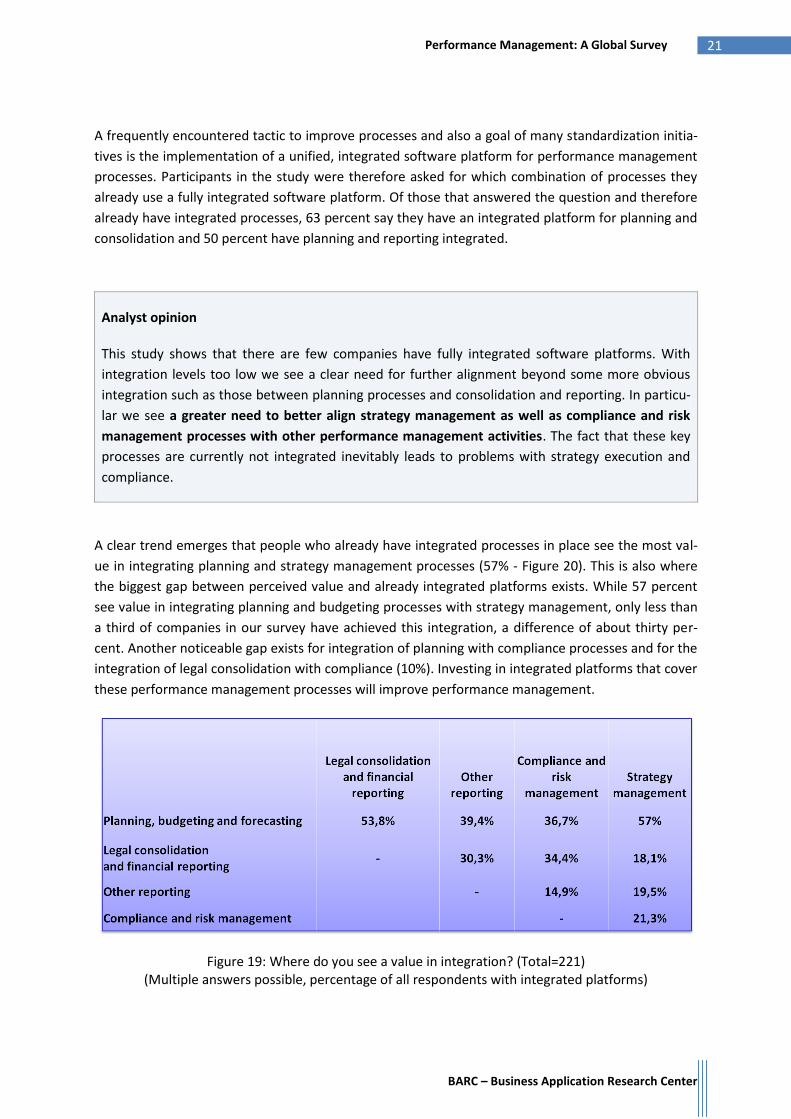
Figure 18: Which processes share a fully integrated software platform? (Total=244)
(Multiple answers possible, percentage of all respondents with integrated platforms)
BARC – Business Application Research Center
21 Performance Management: A Global Survey
A frequently encountered tactic to improve processes and also a goal of many standardization initia-
tives is the implementation of a unified, integrated software platform for performance management
processes. Participants in the study were therefore asked for which combination of processes they
already use a fully integrated software platform. Of those that answered the question and therefore
already have integrated processes, 63 percent say they have an integrated platform for planning and
consolidation and 50 percent have planning and reporting integrated.
Analyst opinion
This study shows that there are few companies have fully integrated software platforms. With
integration levels too low we see a clear need for further alignment beyond some more obvious
integration such as those between planning processes and consolidation and reporting. In particu-
lar we see a greater need to better align strategy management as well as compliance and risk
management processes with other performance management activities. The fact that these key
processes are currently not integrated inevitably leads to problems with strategy execution and
compliance.
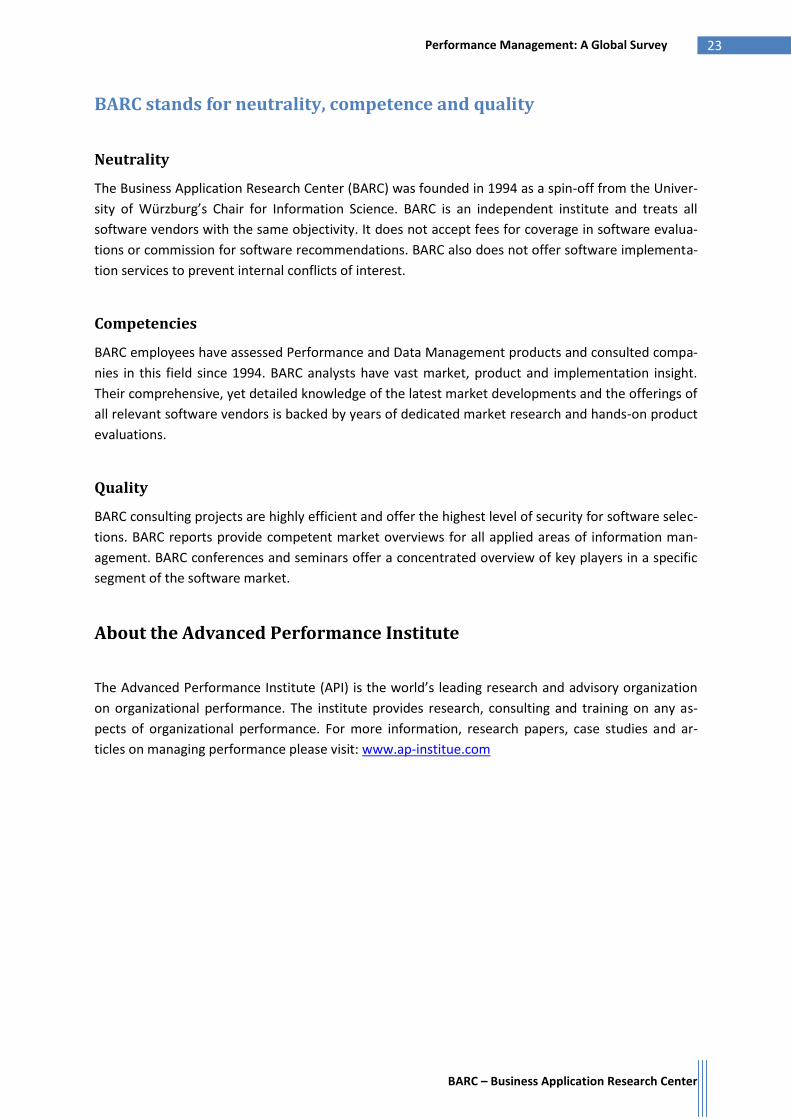
A clear trend emerges that people who already have integrated processes in place see the most val-
ue in integrating planning and strategy management processes (57% - Figure 20). This is also where
the biggest gap between perceived value and already integrated platforms exists. While 57 percent
see value in integrating planning and budgeting processes with strategy management, only less than
a third of companies in our survey have achieved this integration, a difference of about thirty per-
cent. Another noticeable gap exists for integration of planning with compliance processes and for the
integration of legal consolidation with compliance (10%). Investing in integrated platforms that cover
these performance management processes will improve performance management.
Figure 19: Where do you see a value in integration? (Total=221) (Multiple answers possible, percentage of all respondents with integrated platforms)
BARC – Business Application Research Center
22 Performance Management: A Global Survey
Conclusion
The daily complexity in business is increasing. A stunning 93 percent of respondents state that
complexity of their role has increased due to current challenges that arise from inside and outside
the firm. Performance management has become a key enabler for two aspects: (1) helping organiza-
tions to provide managers with more decision-relevant information and (2) helping companies to
become more transparent and compliant with regulations. Consequently the number of people in-
volved in performance management processes has increased over the last years with an average of
30% across all PM processes. But still more than 80 percent of companies think their PM processes
need improvement and started initiatives to tackle the most urgent deficiencies such as data quality,
implementation of corporate strategy, and reduction of complexity. Also, the speed and quality of
performance management processes is seen as a priority over resource or output quality considera-
tions, showing the enormous pressure companies are facing in the current economic climate.
In terms of technology we see an increase in the usage of specialized performance management
software which is starting to replace Excel as the dominant tool. Even though respondents indicated
that they see major benefits in closer integration, integrated technical platforms that are able to
cover multiple PM processes are rare. The biggest gap between perceived benefits and actual inte-
gration is between planning and strategy management, compliance and legal consolidation and com-
pliance and planning.
This study shows that that improving and integrating performance management processes is seen
as a business priority with a high level of expected benefits. Addressing the key challenges outlined
in this study will help companies to comply with the increasing complexities and challenging global
competition.
BARC – Business Application Research Center
23 Performance Management: A Global Survey
BARC stands for neutrality, competence and quality
Neutrality
The Business Application Research Center (BARC) was founded in 1994 as a spin-off from the Univer-
sity of Würzburg’s Chair for Information Science. BARC is an independent institute and treats all
software vendors with the same objectivity. It does not accept fees for coverage in software evalua-
tions or commission for software recommendations. BARC also does not offer software implementa-
tion services to prevent internal conflicts of interest.
Competencies
BARC employees have assessed Performance and Data Management products and consulted compa-
nies in this field since 1994. BARC analysts have vast market, product and implementation insight.
Their comprehensive, yet detailed knowledge of the latest market developments and the offerings of
all relevant software vendors is backed by years of dedicated market research and hands-on product
evaluations.
Quality
BARC consulting projects are highly efficient and offer the highest level of security for software selec-
tions. BARC reports provide competent market overviews for all applied areas of information man-
agement. BARC conferences and seminars offer a concentrated overview of key players in a specific
segment of the software market.
About the Advanced Performance Institute
The Advanced Performance Institute (API) is the world’s leading research and advisory organization
on organizational performance. The institute provides research, consulting and training on any as-
pects of organizational performance. For more information, research papers, case studies and ar-
ticles on managing performance please visit: www.ap-institue.com
Copyright © BARC GmbH 2009
All rights reserved.
Cover: www.demoded.com
Business Application Research Center - BARC GmbH
Steinbachtal 2b
97082 Wurzburg
Germany
+49 (0)931 880651-0