Embed Size (px)
Citation preview
Wei Jin, George Stewart, B 7 s-
We model inte se sitivity in terms of minimum det is expressed as a function of birefringence, spectral transmis- sion characteristi olarization dependent loss of er
the light source. itivity is calculated for various system compared with existing experimental data. The at the interference effects may be minimized rized broadband source (say, 30-50
shape, together with a bir
system, and the tion and coherence characte of
balanced sensor configuration
I. INTRODUCTION E HAVE reported escent wave methane sensor, W where a D-shaped fiber was used as the sensing
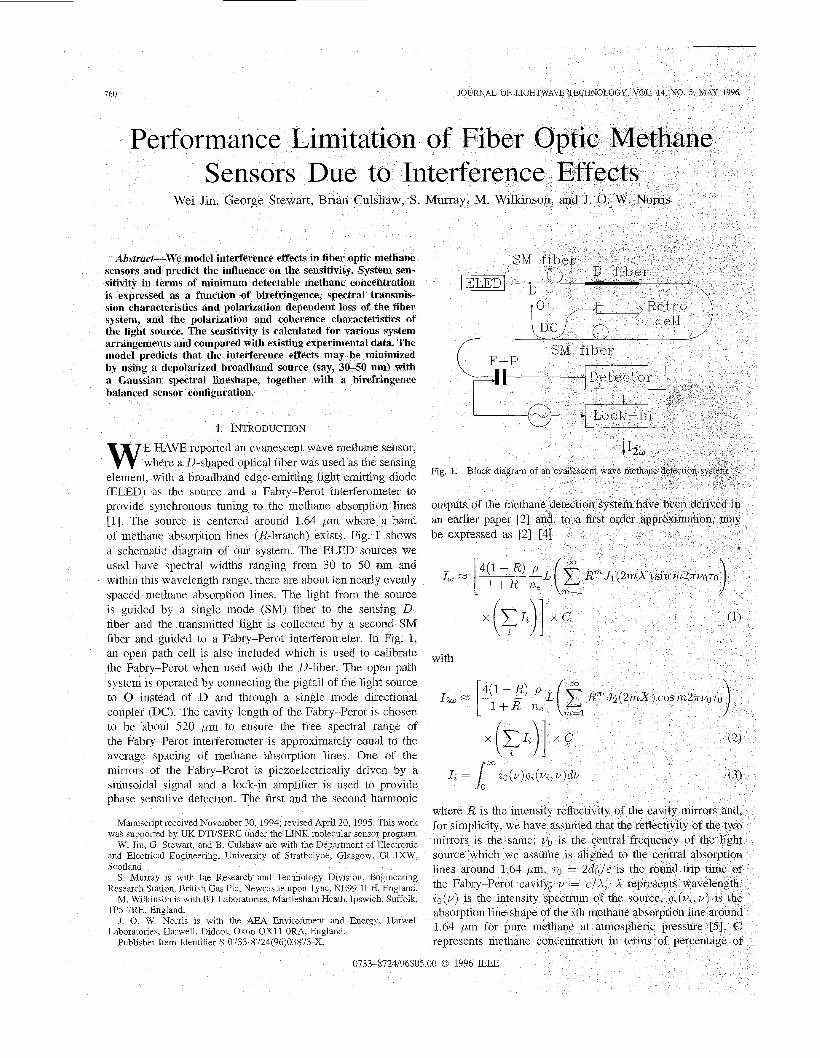
element, with a broadban mitting light emitting diode (ELED) as the source and a Fabry-Perot interferometer to provide synchronous tuning to the methane absorpti [l]. The source is centered around 1.64 pm where of methane absorption lines (R-branch) exists. Fig.
matic diagram of our system. The ELED sources we used have spectral widths ranging from 30 to 50 nm and within this wavelength range, there are about ten nearly evenly spaced methane absorption lines. The light from the source is guided by a single mode (SM) fiber to the sensing D- fiber and the transmitted light is collected by a second SM fiber and guided to a Fabry-Perot interferometer. In Fig. 1, an open path cell is also included which is used to calibrate the Fabry-Perot when used with the D-fiber. The open path system is operated by connecting the pigtail of the light source to 0 instead of D and through a single mode directional coupler (DC). The cavity length of the Fabry-Perot is chosen to be about 520 pm to ensure the free spectral range of the Fabry-Perot interferometer is approximately equal to the average spacing of methane absorption lines. One of the mirrors of the Fabry-Perot is piezoelectrically driven by a sinusoidal signal and a lock-in amplifier is used to provide phase sensitive detection. The first and the second harmonic
Manuscript received November 30, 1994, revised April 20, 1995 Ths work was supported by UK DTVSERC under the LINK molecular sensor program
W Jin, G Stewart, and B Culshaw are with the Department of Electromc and Electrical Engineering, University of Strathclyde, Glasgow, Gl lXW, Scotland
S Murray is with the Research and Technology Division, Engineenng Research Station, British Gas Plc, Newcastle upon Tyne, NE99 lLH, England.
M Wilkinson is with BT Laboratones, Martlesham Heath, Ipswich, Suffolk, 1P5 7RE, England.
J 0 W Norris is with the AEA Environment and Energy, Harwell Laboratories, Harwell, Didcot, Oxon OX1 1 ORA, England
Publisher Item Identifier S 0733-8724(96)03873-X.

JIN et al.: PERFORMANCE LIMITATION OF FIBER OPTIC METHANE SENSORS 761
pure methane, p represents percentage of energy carried by the D-fiber which interacts with methane and ne is the effective refractive index of the guided mode in the D-fiber.
Under ideal conditions, the cavity length of the Fabry-Perot may be stabilised to a fixed value do ( ~ 5 2 0 pm) by minimizing the first harmonic signal, corresponding to an optimal work- ing condition 2~747-0 = (2k + Z)x is satisfied. The second harmonic is then used as a measure of methane concentration. The above relations [see (1) and (2)] have been confirmed by an experiment using an open-path system ( p / n , = 1) with single mode fiber as the input/output fibers and an ELED with 50 nm linewidth and an approximately Gaussian spectral shape [2], [3]. The effect of unexpected intensity variation may be minimized by using a ratiometric measurement [2] 1 2 w / I ~ ~ .
However, unlike the open path experiment, a large modu- lation signal was observed when the open path was replaced by a D-fiber sample (a few meters of D-fiber pigtailed with single mode fibers at both ends), even in the absence of methane. This implies that the use of D-fiber introduces an extra (unwanted) modulation signal which can not be described by (1) and (2). We found that this unwanted modulation signal is due to residual interference occuring in the sys- tem including multibeam interference at the Fabry-Perot and interference mixing between the two polarization states in D- fiber. The polarization mixing phenomenon was confirmed in the following manner. By placing the SM-D-SM fiber sample in between a wavelength scanning monochromator+polarizer unit and an analyzer+photodetector unit, we actually observed periodic intensity variation in the wavelength domain. The period varies with the D-fiber length used and was found to be determined by the optical path difference (OPD) between the two polarization states in the D-fiber. When the analyzer was removed, the amplitude of the periodic signal was largely reduced but still existed and the period of the signal was the same as that with the analyzer. This implies that there is polarization dependent loss at andor after the D-fiber- SM fiber joint, acting as a weak polarizer and mixing the two polarizations to form a polarimetric interferometer. The ELED's used for methane tests were also tested and found to have a certain degree of polarization (0.3-3 dB). The whole system may therefore be seen as two interferometers (Polarimetric + Fabry-Perot) connected in cascade, and the interference effect will be especially serious when the OPD's of the two interferometers are closely matched. Additionally, tests on the transmission characteristics of the D-fiber system showed that the system tends to have a larger attenuation at longer wavelengths which modifies the intensity spectrum and therefore increases the effective coherence length of the output light. This implies that the interference effects may not be negligible even when the OPD's are not so closely matched. The spectral dependent loss will also increase the residual interference effect occuring at the Fabry-Perot. In this paper, we report a model for analyzing the interference effects, and explain how the interference induced modulation depends on the birefringence and the spectral transmission characteristics of the system, differential loss occurring after the sensing D- fiber and the polarization and coherence characteristics of the light source. The minimum detectable methane concentration
I
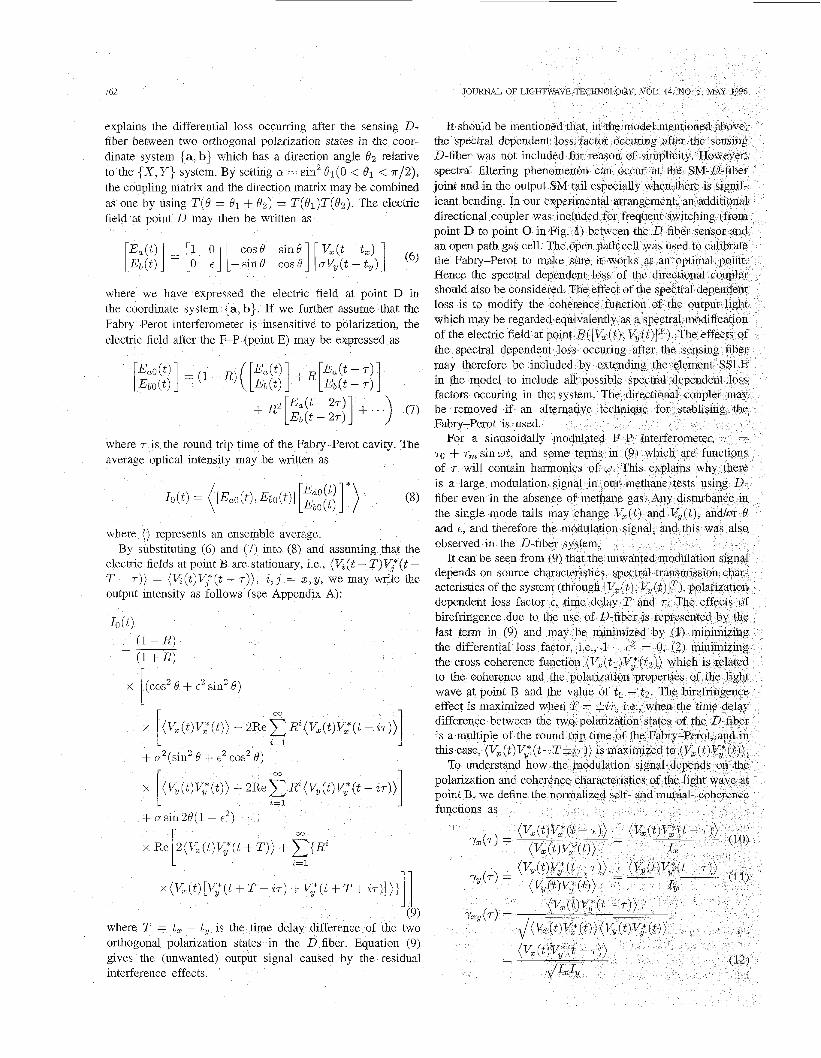
Fig. 2. Modeling of interference effects.
limited by these factors was calculated for several different system arrangements and compared with the results obtained experimentally. The results should be helpful in the design of evanescent wave methane sensors. Some parts of the analysis in this paper (e.g., the effect of the degree of polarilation on the system output, the analysis of broadband light subject to a small phase modulation) may be also applicable to general (polarimetric) interferometers and, to the authors knowledge, has not been done before.
11. MODELING OF INTERFERENCE EFFECTS
To investigate the effect of the interference on the system performance, the system may be modeled by the block diagram shown in Fig. 2. We assume that the electric field at I he input end of the D-fiber (point A) can be represented by a Jones Vector [V,l(t), V,l(t)lT(T = transpose), which is deiermined by the source characteristics coupled with the effecis of the input single mode fiber. The X and Y axes are chosen to be along the two eigen axes of the D-fiber.
While passing through the D-fiber, the electric field will be delayed and spectrally filtered. The spectral filtering character- istic is expected because, to maximize the methane seiisitivity, the D-fiber is specially designed to work close to cutoff at 1.64 pm, and therefore has an increasing attenuation at longer wavelengths especially when fiber bending exists. We may therefore model the sensing D-fiber as a spectrum sensitive loss element (SSLE) followed by a birefringence element (BE). The electric field after the SSLE (point B) is represcnted by another Jones vector [ V, (t ) , V, ( t )] with a different spectral distribution from that at point A. The electric field at point C is simply a delayed version of that at point B and may bc written as [Vz(t - tz),aVy(t - ty)lT where t , and t , are .he time delays of the two orthogonal polarization states in the sensing D-fiber and a is a loss factor, dependent on polarizz tion but not on spectral distribution.
Polarization coupling may occur at and after the D-fiber to SM fiber joint, but here for simplicity, we model this phe- nomenon by using one coupling centre with transfer function [61
(4)
where 0 < Q < 1 represents the fraction of power transfer between the two polarizations.
A weak polarizer with extinction ratio E and direction matrix
(5 )
162 JOURNAL OF LIGH
explains the differential loss occurring after the sensing D- fiber between two orthogonal polarization states in the coor- dinate system {a, b} which has a lrection angle 82 relative to the {x, Y } system. BY setting Q = sin2 B ~ ( O < s1 < ../a), the coupling matrix and the direction matrix may be combined as one by using T(O = 6'1 + 02) = T(01)T(&). The electric field at point D may then be written as
where we have expressed the electric field at point D in the coordinate system {a, b}. If we further assume that the Fabry-Perot interferometer is insensitive to polarization, the electric field after the F-P (point E) may be expressed as
where r is the round trip time of the Fabry-Perot cavity. The average optical intensity may be written as
where () represents an ensemble average. By substituting (6) and (7) into (8) and assuming that the
electric fields at point B are stationary, i.e., (K(t - T ) y ( t - T - 7)) = (x(t)T(t - T ) ) , i , j = z , ~ , we may write the output intensity as follows (see Appendix A):
- (1 - R) (1 + R)
x
-
(cos' o + t2 sin2 e )
x (V,(t)Vz(t)) + 2 R e x R z ( V z ( t ) V z ( t - i r ) )
+ u2 (sin2 6' + e2 cos2 0) I 00
[ I z = 1
L 2=1
I1 x (vz( t ) [V,*(t + T - i ~ ) + V,*(t + T + ZT)])} (9)
where T = t , - t , is the time delay difference of the two orthogonal polarization states in the D-fiber. Equation (9) gives the (unwanted) output signal caused by the residual interference effects.
icant bending. In our directional coupler was point D to point 0 i an open path gas cell
should also be con
the spectral depend
factors occuring in the be removed if an alte
ro + r, sinwt, and of r will contain h
fiber even in the ab the single mode tail and e, and therefore
It can be seen fr depends on source acteristics of th
the cross coherence to the coherence and th
effect is maximized difference between

JIN et al.: PERFORMANCE LIMITATION OF FIBER OPTIC METHANE SENSORS 163
Equation (9) may be rewritten as
00
(cos2 0 + e2 sin2 B)Jz
+ a2(sin2 6' + e2 cos' 1 I1
00
+ a s i n 2 ~ ( 1 - E 2 ) m
00
R2[yz,(T - i7) + yzy(T + i.)] .
(13)
For simplicity, we assume that yz(.) = yv(7) = yzv(~)/yzy(0) (cross-spectral purity) [7] , [SI, and (13) may then be rewritten as
x [[(cos2 B + t2 sin2 B ) I ~ + u2(sin2 6' + t2 cos2 B)I,] r 00 1
+ asin28(1- e 2 ) a l y z Y ( o ) I 00
x 21y(T)I cos(argy(T) + WTYzy(0) ) + C{R2 [ 2=1
x [ly(T - i ~ ) 1 cos(argy(T - i ~ ) + argyzy(0))
+lyzy(T + i7)I cos(arg(T + 2 ~ ) + argyzv(0)))ll 1 (14)
where X and "arg X" represent, respectively, the amplitude and phase angle of the complex number X; yzy(0) represents the value of yzY(7) when T = 0 and is related to the polarization property of the light wave at point B. In the following, we analyze how the degree of polarization of the light wave at point B affects the unwanted modulation signal
Consider a quasimonochromatic light source which is nor- mally a partially polarized source. The degree of polarization P is defined as the ratio of the intensity of the polarized portion to the total intensity and is given by
IO (t> .
Ipol Itot
P=-.
This partially polarized light wave may be regarded as the sum of a completely polarized and a completely unpolarized wave which are independent of each other [7]. Incorporating the degree of polarization P into (14), we obtain the following (see Appendix B):
1 2
+ - a ~ sin 20 sin 2 4 1 - e 2 )
L z = 1
x [ly(T - i7)1 cos(argy(T - i ~ ) + 4)
+Jy(T + i7)1 cos(argy(T + ZT) + 4)I) (16)
where a determines the relative intensity distribution of the polarized light component along the 2- and y-axis ard 4 is a phase factor related to the polarization state of the polarized light component at point B.
In the following, we assume for simplicity, an approxi- mately symmetric spectra around vo for both polarized and unpolarized light, and we may write [7] argy(7) = 27rrv07. In the worst situation where the birefringence effect is maxi- mized, i.e., I sin 26' sin 2al = 1, (16) may be rewritten as
I1
Io(t) = ~ (l - R, Itot 4(1+ R)
x ( 1 + e2)(1 + a2) [ + 2 a P ( 1 - €2)
00
x 2ly(T)I COS(~TVOT + 4) + C { R 2 [ 2 = 1
x [ly(T - iT)1 cos(27rvo(T - 27) + 4)
+ly(T + i7)l cos(2Tvo(T + iT) + a # ) ] } . I1 (17)
It can be seen from (17) that the unwanted modulation signal is maximized when T = &ir, i.e., when the time delay difference between the two polarization states in the D-fiber is a multiple of the round trip time of the Fabry-Perot cavity. If we limit the D-fiber length so that 0 < T < T which agrees with most of our experimental conditions, the highlx order terms $7' + i ~ ) (for i = 1 ,2 , . . .), and y ( i ~ ) , y ( T - i ~ ) (for i = 2,3, . . .), may be neglected, and the modulation signal may be approximated as
I()(t) M M I t o t 4(1+ R)
L L \ I

164
At this stage, if we consider a small amplitude, low frequency modulation of the Fabry-Perot cavity r = 70 + -rm sin wt , and expand the right-hand side in terms of a series of Bessel functions, the first and the second harmonic may be written as
JOURNAL OF LIGH
I, M 3 x 10PI to t
where z(v) is the power spectrum of light wave at point B. 2X = 27rvorm is the modulation index in radians and 4 depends on the polarization state at point B and may vary with environmental disturbance.
We would like to point out that (19) and (20) were derived under the assumption that the light spectra are symmetric. However, if the modulation index 2X = ~ T V O T , is small, the analysis conducted in the following parts of this paper, which is based on (19) and (20), is still approximately true for narrowband light with slight asymmetry. A brief proof of this fact can be found in Appendix C.
Equations (19) and (20) show, respectively, the first and the second harmonics of the interference induced modulation signal which are independent of, but indistinguishable from that due to methane absorption [see (1) and (2)]. The first term in the brace of (19) and (20) represent, to the first order, the residual interference occurring in the Fabry-Perot which is independent of D-fiber birefringence. The second term contains the combined effects of D-fiber birefringence (through T ) and the Fabrj-Perot (through 70) and may become significantly large when T is close to 70.
By equating the second harmonic signal of (20) to an equivalent methane induced signal [see (2)], we may write the signal in terms of minimum detectable methane concentration C,,, as
%Ito, 5 2 (2x1 n, ( E,"=, R"J2(2mX) cos m27rvo70) ( c, 1 2 )
x [(l + t"(l+ a2)]y(70) cos27rv070~ + a(1 - 2 ) P
Crnm M pL
x ly(T - 7 0 ) cos(2nvo(T - 70) + $111. (22)
For our experimental arrangement, the parameters may be taken as [2] R = 0.45,X = 1.7 rads, 0 4 1 and 1 + t2 i 2. The exact value of C,I, is not known but for an approximately Gaussian source with about 30-50 nm FWHM, EzIz/It,,t is estimated to be within the range 10-2-10-3. In the following, we use Z,I,/Itot = lo-'. In the worse case, 1 cos(27rvo(T -
x [(1+ 2)(1+ a2)lr(70)1 cos(27rvo70) + "P( 1 - 2) X ly(T - 70)1 cos (2~vo(T - 70) + 4)]&(2x) (20) minimizing the first h
cell? (2) is the methan with the signal shown in
C,,, and I, for v tions, so that we can in terms of minimum the presently used D- component I, can be Fabry-Perot to the o
where y ( r ) may be calculated from
is very small and it
neglected. The firs
experimental minimum found to be lower than
value of Cmin = 0

JIN et al.: PERFORMANCE LIMITATION OF FIBER OPTIC METHANE SENSORS 165
' 'Ol
0.0
Optical Path Length L=cr (run)
(b)
Fig. 3. a SM fiber.
(a) Spectrum and (b) Coherence function of an ELED source through
experimental result for Cmin using this pigtailed ELED was 5% LEL which agrees with the theoretical prediction.
We now look at the D-fiber sensor. The difference between the open path and a D-fiber sensor is 1) the sensitivity of the D-fiber sensor is reduced by a factor of lo3 due to evanescent wave detection. This implies that the value of Cmin will increase by a factor of lo3 for the same level of interference noise. Taking the ELED as shown in Fig. 3 as an example, the value of Cmin is 400% methane (i.e., the noise signal is four times greater than the signal from 100% pure methane) for a meter length of sensing D-fiber instead of 0.4% for the open path sensor. However, it is likely that the D-fiber sensor will be much longer than an open path cell so this comparison may not be entirely fair. The value of Cmin may be increased because the light spectrum and hence y may be significantly modified if bending occurs in the D-fiber; 2) the value of E is modified due to possible polarization dependent loss occurring in the D-SM fiber joint; 3) the value of T will not be zero except in a balanced D-fiber sensor which may be realized by splicing the D-sensing fiber to an appropriate length of PM fiber with the fast axis of one fiber aligned to the slow axis of the other. Taking estimated parameters as 1 - E' M 0.1, P = 1/2, Cmin may be written for the D-fiber sensor as
Cmin M 1O4[41y(70) ~ 0 ~ 2 7 ~ 0 ~ 0 1 + 0.051y(T - TO)\]. (26)
first term is large and the second term may be neglected. The expression of Cmin is the same as for the open path case, but increased by a factor of p/n , = lo3. If the soirce has a short coherence length (e.g., a Gaussian source with 30 nm linewidth), Iy(q)l could be very small, which gives a small value of C,,, when T = 0. However, as T increases, ly(T - TO)^ will increase rapidly, and the birefringeme effect may begin to dominate. The value of Cmin can increase from a minimum value of 4 x lO41y(70)1 to 50000% meth,me (i.e., 500 times bigger than the signal from 100% pure methane) when T varies from 0 toward 70.
We now discuss whether the first harmonic may be used as an error signal to stablise the Fabry-Perot. If tht: second term added in (19) is much smaller than the first terni, which may be achieved by mininising 1 - c2, P and T then the first term, at first sight, seems to have the same null points as the first harmonic signal induced by methane absorption [see (l)] and the first hamonic could be used as an error signal to tunne the Fabry-Perot to 2 ~ ~ 0 7 0 = ( 2 k + 1 ) ~ . However, we must be careful with this conclusion because (1) was derived under the assumption that the central fiequency (VO) of the source is aligned with one of the (central) R- branch methane absorption lines around 1.64 pm. If they are not aligned, the vo shown in (1) should be replaced by V& corresponding to the position of the above absorption lines and the first term in (19) will not have the same nulling point. As T increases, the second term may become domiiiant due to increase in ly(T - TO)^. This term varies randornly with environmental factors (through sin(27rvo(T - TO) + 4;) , which makes the first harmonic unsuitable for tuning the FabIy-Perot. For an open path sensor, the second term in (19) can be neglected. For an approximately Gaussian spectrum of 30-50 nm linewidth, the first term is also extremely small and the first harmonic can therefore be used to tune the Fabry-Perot to the optimal point. For the spectrum shown in Fig. 3, the first term is about (equivalent to a first harmonic produced by less than 1% methane). This means that, for relatively larger methane concentrations (>1%), the first harmonic may be used to tune the Fabry-Perot. This is not true for smaller methane concentrations (< 1%). However, for D-fiber sensors, absorption induced signals are lo3 times smaller than that for the open-path case, and the unwanted modulation signals are even larger due to the combined effects of birefringmce and spectral dependent loss effects of the D-fiber system. This means that the first harmonic caused by methane absclrption is generally smaller than that due to interference effects, mplying that the first harmonic can not be used to tune the Fabry-Perot anymore. Other means must be found to tune the Fabiy-Perot. What we did in most of our D-fiber experiments, is to calibrate the Fabry-Perot using an open path gas cell.
A technique to minimize the birefringence related interfer- ence effects [second term in (17)] may be to set T - 00, i.e., the OPD between the two orthogonal polarizations is set much longer than the coherence length of the source to destroy the coherence between the two polarizations. This may be realized by using a long length of sensing D-fiber or splicing a long
The Cmin now is determined by the two terms in (26). For a light field with a long coherence length (e.g., Fig. 3), the
length of PM fiber to the D-fiber with the D-fiber axes aligned to the PM fiber axes. For this case, the minimum detectable

166
I 1
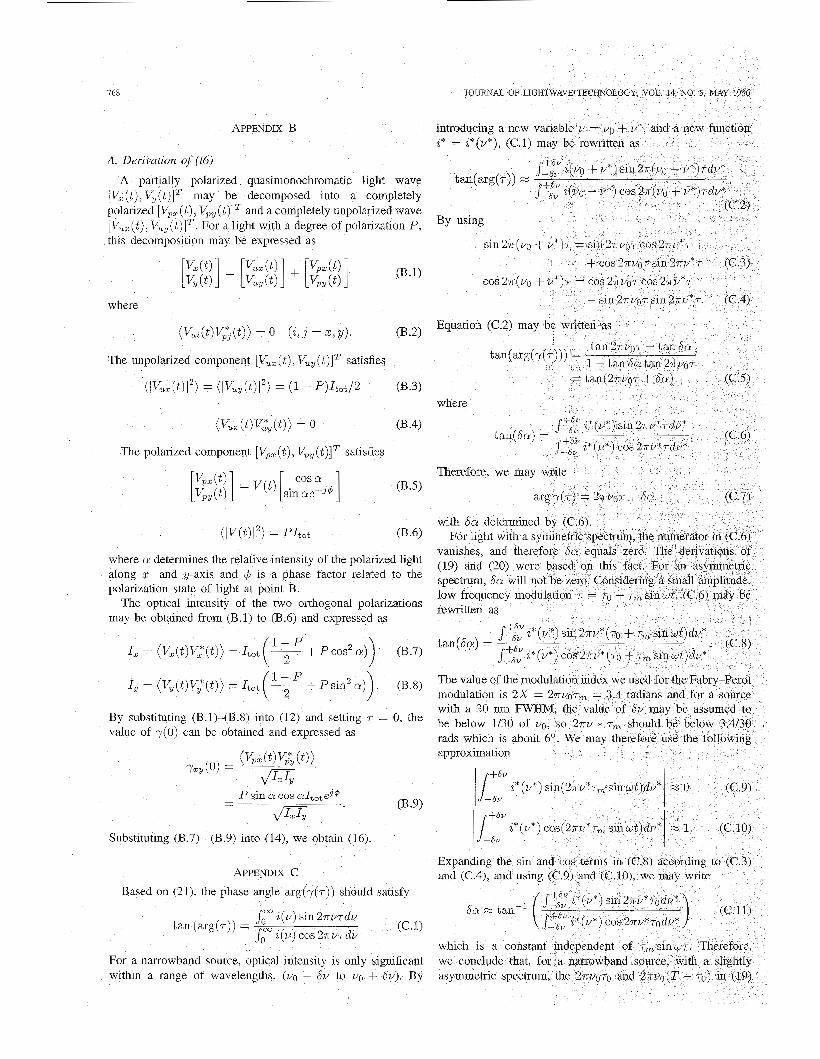
Fig 4 spliced to single mode pigtals at Upper trace' Fabry-Perot driving output, 10 0 mVidiv
Osc~lloscope trace of photodetector output with 90 cm D-fiber nds. Horizontal scale: 200 psldiv; 5.0 V/div; Lower trace: Detector
methane concentration can not be calculated directly from (24), but may be directly derived from (17). For T -+ 00,
lR~(2' * Z T ) ~ -+ 0, and the modulation signal is mainly due to the first term in (17). Hence, the birefringence related term is removed and the value of C,,, which is determined by the first term in (17) is related only to the residual interference effects occurring in the Fabry-Perot, and, to an first order approximation, is the same as the first term in (26).
To demonstrate how the proper use of a long length of PM fiber can reduce the interference related noise, Fig. 4 shows the typical output of the D-fiber system (90 cm D- fiber with single mode pigtails at both ends) when no methane gas is present. The second harmonic signal is large and varies with environmental disturbances. No significant change was observed when 100% methane was introduced, implying that the interference related noise is dominant. Fig. 5 shows the lock-in output for an 80 cm long D-fiber sample with the input end spliced to the single mode tail as before but with the output end now connected to 200 meters of York Hi-Bi fiber. Fig. 5(a) and (b) correspond, respectively, to the cases where the birefringent axes of the two fibers are not aligned and aligned. The two curves in each of the figures represent, respectively, the results when the gas chamber was filled with air ( 0 ) or pure methane (A). In Fig. 5(b) the noise is very much reduced compared with Fig. 5(a) and the minimum detectable methane concentration C,,, can be estimated to be better than 40% methane. We believe that it is limited by the interference occurring at the Fabry-Perot and should not increase with the D-fiber length used. However, the methane sensitivity does increase with D-fiber length, so we expect a minimum detectable methane concentration of about 6% methane for 5 meters length of sensing fiber. During all experiments, the Fabry-Perot was first s frequently calibrated using the open path system with methane. To check if this experimental result agrees with the theoretical prediction, we measured the light spectrum from the PM+D-fiber sample and
The performance o timately limited by i Fabry-Perot which is of the light source U
of the system. For

JIN et al.: PERFORMANCE LIMITATION OF FIBER OPTIC METHANE SENSORS 161
spectrum of, say 30 nm linewidth, the minimum detectable methane concentration C,,,, for both an open path sensor and a balanced D-fiber sensor, is extremely small and may be neglected. However, for a practical light source with a non-Gaussian spectrum, interference effects will limit the performance, especially for the D-fiber sensor. To reduce the interference noise to below other noise levels such as source noise, a wide spectrum with as close to a Gaussian shape as possible is desired and spectral dependent loss caused by, for example, bending to fibers must be avoided. However, even for an ideal Gaussian source, as the OPD between the two polarizations in the D-fiber increases from 0 toward the cavity length of the Fabry-Perot, the birefringence related term ly(T - TO)^ may increase dramatically, and Cmin may reach an equivalent value of 50000% when T = TO. To reduce ly(T - TO)^, a simple way is to destroy the coherence between the two polarizations of the D-fiber. This may be realized by using a long length of PM fiber spliced and aligned with the D-fiber axes. However, PM fibers are expensive and more importantly, the interference between the two polarization states may be useful as a technique to compensate for surface contamination [lo], although other techniques may also be possible. An alternative solution is to take the following two measures: 1) minimize T , i.e., form a balanced D-fiber sensor, and 2) minimize P, i.e., depolarize the source. T may be minimized by splicing with cross axes the sensing D-fiber to a length of PM fiber which has a similar value of path length difference between the two polarization states. However, even if the initial value of T is set to zero, it may increase due to surface contamination in a practical working environment [ 111. Contamination on the flat surface of the D-fiber tends to change the birefringence of the D-fiber and therefore changes the OPD (T value) between the two polarization states. A practical choice may be to minimize T for the uncontaminated D-fiber and limit the value of T/TO below a certain value, say T/TO < 0.3, for the D-fiber under maximum allowable contamination, along with the use of the depolarized source.
APPENDIX A
A. Derivation of (9) Substituting (7) into (8), we obtain
00
n=O
Assuming V, ( t ) , V, ( t ) are stationary processes, according to (61, &(t), Eb(t) should also be stationary, i.e., (E;(t +
Using the formula
we obtain 1 - R l + R Io(t) = -
a1
x (Ea(t)E:(t)) + (Eb( t )E:( t ) ) f 2Re 2) {Rm mi.1
(A.4)
[ x [(Ea(t)EXt - m7)) + (Eb(t)Eb*(t - m 4 ) ] 11.
By using (6), we obtain
(&(t)E,*(t - ,TI)
= cos2 O(V,(t - t,)V,(t - t , - ? I T ) )
+ asinOcosd[(V,(t - t,)V,(t - t , - 1 2 7 ) )
+sin2 a2(V,(t - ty)V,(t - t , - n ~ ) ) + (V,(t - ty)V,(t - t , - TIT))
(AS)
where n = 0 , 1 , 2 , 3 . . .
processes, we may write Based on the assumption that Vz(t), V,(t) are stationary
(Eu(t)E,*(t - ,TI)
= cos2 O(V,(t)V,(t - 7x7))
+ 2 sin2 B(v,(~)v,(~ - n ~ ) )
+ -asin2O[(Vx(t)V,(t + T - n ~ ) ) 1 2
+ (V,(t)V,*(t - T - ..))I (A.6)
where T = t , - t,. By following the same process, we can derive
(Eb(t)Eb*(t - ,TI)
= 2 sin2O(vX(t)v,(t - n ~ ) )
+ 2a2 cos2 d(V,(t)V,(t - w)) 1 2
- -e2gsin20[(V,(t)V,(t+T - n ~ )
+ (V,(t)V,*(t - T - n ~ ) ) ] . (A.7)
Substituting (A.6) and (A.7) into (A.4), and using
Re( V, ( t ) V; ( t+T+n~)) = Re( V, ( t ) Vx* (t - T - ~ T ) ) . (A.8)
we obtain (9).
768
APPENDIX B
A. Derivation of (16)
A partially polarized quasimonochromatic light wave [V, ( t ) , V, (t)lT may be decomposed into a completely polarized [V,, ( t ) , V,, (t)lT and a completely unpolarized wave [Vu, ( C ) , Vu, (t)]*. For a light with a degree of polarization P, this decomposition may be expressed as
where
where Q determines the relative intensity of the polarized light along 5- and y-axis and q5 is a phase factor related to the polarization state of light at point B.
The optical intensity of the two orthogonal polarizations may be obtained from (B.l) to (B.6) and expressed as
1, = (VZ(t)V,*(t)) = I to t + P cos2 a ) ) (B.7)
1, = (&(t)V,*(t)) = I t o t + P sin2 a ) ) . (B.8)
By substituting (B.l)-(B.8) into (12) and setting T = 0, the value of y(0) can be obtained and expressed as
Substituting (B.7)- (B.9) into (14), we obtain (16).
APPENDIX C
Based on (21), the phase angle arg(y(r)) s
som z(v) sin 27rurdv tan (arg(r)) = (C. 1) Jo" z(v) cos 27rv-rdv
For a narrowband source, optical intensity is only significant within a range of wavelengths, (vg - Sv to vg + Sv). By

JIN et al.: PERFORMANCE LIMITATION OF FIBER OPTIC METHANE SENSORS 769
and (20) should be replaced by 27rvo70+6a(70) and 2nvo(T- To) + ( j a ( ~ - constant - To)3 which have no effect on the general conclusion drawn from (19) and (20).
Wei Jin received the Ph.D. degree in advanced signal processing echniques for fiber optic gyroscopes at the University of Strathclyde, Glasgow Scotland, in 1991.
Thereafter, he was employed as a postdoctoral research fellow working in evanescent wave gas sensors. He is now in Hong Kong where he h,is recently taken up an associate professorshp at the Hong Kong Polytechnic 1Jniversity. He has published over 40 papers in the area of fiber optics and sensors.
respectively. The differences are only 6a(70) and
ACKNOWLEDGMENT The authors would like to thank Colin of British gas for
experimental assistance and the two Iains in the Strathclyde OPT0 group for help in recovering lost information caused by a disc failure. Glasgow.
George Stewart received the Ph.D. degree in 1979 from the University of
Thereafter. he worked as a Dostdoctoral research fellow in intezrated and
REFERENCES
B. Culshaw, F. A. Muhammad, G. Stewart, S. Murray, D. Pinchbeck, J. Norris, S. Cassidy, D. Williams, L. Crisp, M. Wilkinson, R. V. Ewyk, and A. McGhee, “Evanescent wave methane detection using optical fiber,” Electron. Lett., vol. 28, no. 24, pp. 2232-2233, 1992. W. Jin, G. Stewart, B. Culshaw, S. Murray, and D. Pinchbeck, “Ab- sorption measurement of methane gas with a broadband light source and interferometric signal processing,” Opt. Lett., vol. 18, no. 16, pp. 1364- 1366, 1993. W. Jin, G. Stewart, B. Culshaw, S. Murray, and D. Pinchbeck, “Pa- rameter optimization in a methane detection system using broadband source and interferometric signal processing,” in int. Symp.: Optic. Tools Manufact. Advanced Automat., Chem., Bzochem. and Environmental Fiber Sensors, Proc SPiE, Boston, MA, Sept. 1993, vol. 2068. G. Stewart, J. Norris, D. F. Clark, and B. Culshaw, “Evanescent-wave Chemical sensors a theoretical evaluation,” Znt. J. Optoelectron., vol. 6, no. 3, pp. 227-238, 1991. K. Chan, H. Ito, and H. Inaba, “All-optical-fiber based remote sensing system for near infrad absorption of low level CH4 gas,” J. Lightwave Technol., vol. LT-5, pp. 1706-1771, Dec. 1987. W. K. Bums, R. P. Moeller, and C. L. Chen, “Depolarization in a single- mode optical fibers,” J. Lightwave Technol., vol. LT-1, pp. 44-50, Jan. 1983. M. Born and E. Wolf, Principles of Optics. New York Pergamon, 1987, 6th ed. L. Mandel, “Concept of cross-spectral purity in coherence theory,” J. Optic. Soc. Amer., vol. 51, no. 12, pp. 1343-1350, 1961. W. Jin, G. Stewart, B. Culshaw, and S. Murray, “Source noise limitation of fiber optic methane sensor,” Appl. Op t , to be published. F. A. Muhammad and G. Stewart, “D-shaped optical fiber design for methane gas sensing,’’ Electron. Lett., vol. 28, no. 13, pp. 1025-1026, 1993. W. Jin, G. Stewart, B. Culshaw, M. Wilkinson, S. Murray, and J. Noms, “Compensation for surface contamination in an evanescent gas detection system,” presented at Second European Conf. Optic. Chemical Sensors, Florence, Italy, Apr. 19-21, 1994.
fiber optics for optical communications. He is currently Senior Lecturer in the Department of Electronic and Electrical Engineering, University of Strathclyde, Glasgow, Scotland. He joined the Optoelectronics group at Strathclyde University in 1985 working on fibre optic components imd optical fiber chemical sensors. He is author or co-author of over 50 papers in the field of fiber and integrated optics.
Brian Culshaw has been Professor of Electronics at Strathclyde Univer- sity since 1983 and Vice-Dean of the Faculty of Engineering s nce 1990. Previously, he has held appointments at University College London, Bell Northern Research in Ottawa, Ont. Canada, Cornell University, Iihaca, NY, and Stanford University, Stanford, CA. He is author or co-author of three books, over 200 papers, and several patents in the areas of optical fitre sensors, components technology and system analysis. He has also acted as a consultant at strategic and technical levels to industrial and government orgar isations in the U.K. and abroad.
S. Murray, photograph and biography not available at the time of publication.
M. Wilkinson, photograph and biography not available at the time of publication.
J. 0. W. Norris, photograph and biography not available at tlie time of publication.