Embed Size (px)
Citation preview

AustriaTech – Federal Agency for Technological Measures Ltd.
Performance Indicators for Inland Waterways PIANC INCOM WG 32
Univesity of Natural Resourcesand Applied Life Sciences, Vienna
Dr. Reinhard Pfliegl (Austria Tech)
Martin Posset (BOKU, Vienna)
Dr. Reinhard Pfliegl | 28/09/2007
Reinhard Pfliegl
• AustriaTech – Federal Agency for Technological Measures Ltd.-Managing Director – 2005-today
• Via Donau – Deputy Managing Director responsible for RIS Development- 2000-2005
• Member TRB AW030- Inland Waterway Transport• Member PIANC INCOM / PIANC ProCOM – 2003-2009• Member of Committee 220 for Engineering Standards Austria 1995-• Member of Board of Governors IEEE ITS Society 2007-2009• Secretary of INA/PIANC (International Navigation Association)
Section Austria
Dr. Reinhard Pfliegl | 28/09/2007
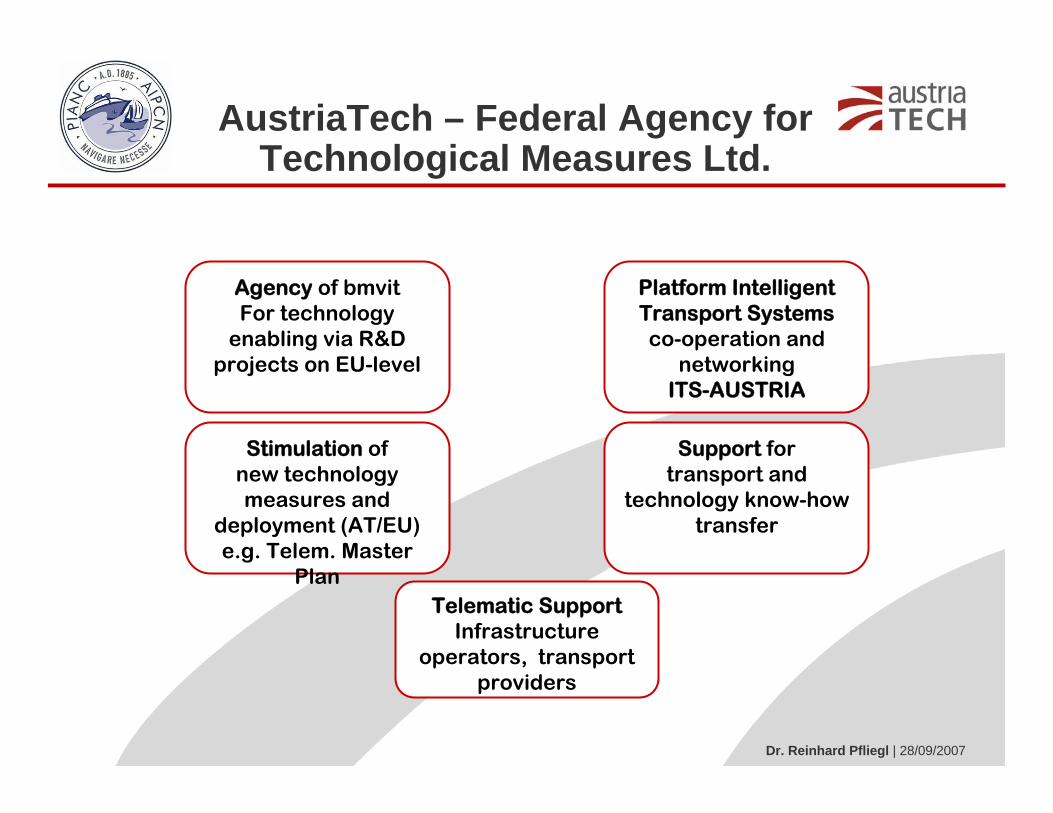
AustriaTech – Federal Agency for Technological Measures Ltd.
Telematic SupportInfrastructure
operators, transportproviders
Platform Intelligent Transport Systemsco-operation and
networkingITS-AUSTRIA
Stimulation ofnew technology measures and
deployment (AT/EU)e.g. Telem. Master
Plan
Agency of bmvitFor technology
enabling via R&D projects on EU-level
Support fortransport and
technology know-howtransfer
Dr. Reinhard Pfliegl | 28/09/2007
Why Performance Indicators?
Dr. Reinhard Pfliegl | 28/09/2007
Why Performance Indicators?
• The need to improve acceptance of IWT in modern supply chains
• The need to show capacity, reliability and applicablilityfor intermodal transports
• The need for comparability with other modes of transport
• Acceleration of advanced transport via IWT
Dr. Reinhard Pfliegl | 28/09/2007
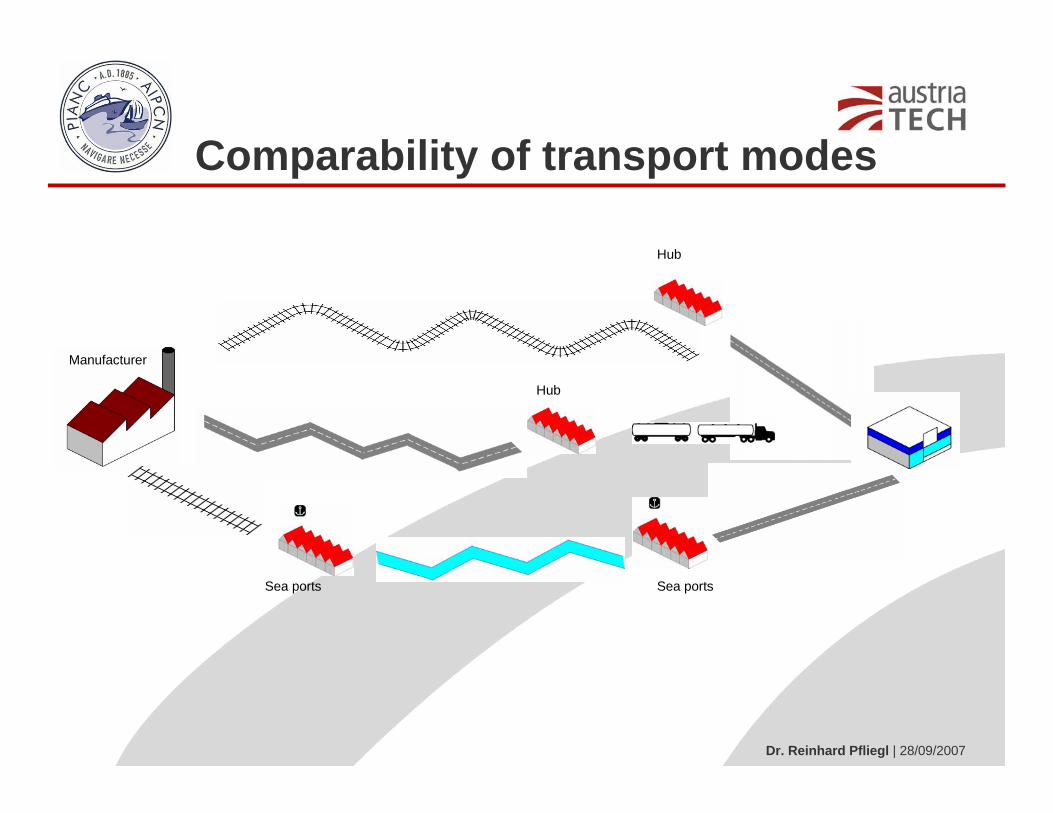
Comparability of transport modes
Manufacturer
Sea ports Sea ports
Hub
Hub

Dr. Reinhard Pfliegl | 28/09/2007
How to achieve a neutral comparability?
Dr. Reinhard Pfliegl | 28/09/2007
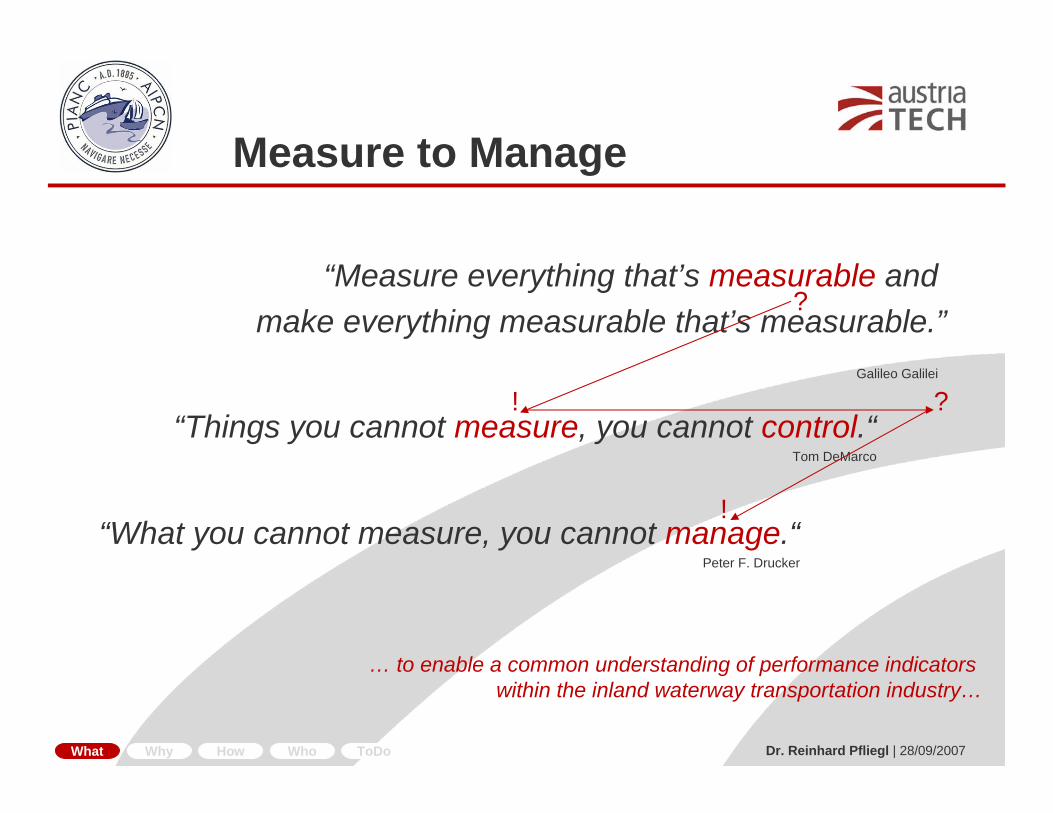
“Things you cannot measure, you cannot control.“Tom DeMarco
“What you cannot measure, you cannot manage.“Peter F. Drucker
“Measure everything that’s measurable and make everything measurable that’s measurable.”
Galileo Galilei
!
?
?
!
Measure to Manage
What Why How Who ToDo
… to enable a common understanding of performance indicatorswithin the inland waterway transportation industry…

Dr. Reinhard Pfliegl | 28/09/2007
Safetyand
Security
Environ-ment
Long-termTransportation
CostEfficiency
Facilitiesand
Infrastructure
EconomicDevelopment ICT
Cargoand
Passengers
Mobilityand
Reliability• AVG travel time (AVG = average)
• Coefficient of variation of travel time•…•…
• accidents per TMT/PMT(TMT ton-miles traveled/PMT passenger-miles traveled)
• number of accidents caused bysecurity problems
•…•…
• Tons of mobile source emissions• Number of people affected by
noise produced byvehicles per TMT(TMT ton-miles traveled)
•…•…
• Tons of cargo transported per year• Number of passengers transported
per year related to total habitants
•…•…
• Availability of river informationsystems
• Usage of satelite navigation•…•…
• Years of usable transportationsystem
• Vehicle costs•…•…
• Number of job opportunitiescreated by transportation
• Economic growth approximationresulted from transportation
•…•…
• Number of barriers and weirsper 100 miles
• Percent of vessels in good conditions
•…•…
PERFORMANCE
What Why How Who ToDo
PIFIW
(see: Jin, M. / Wang, H. / Walden, C., T.: System Performance Measures for Intermodal Transportation with a Case Study and Industrial Application)
Ports• Capacity• Years of usage•…•…
INDICATORS
FOR INLAND WATERWAYS
PIFIW

Dr. Reinhard Pfliegl | 28/09/2007
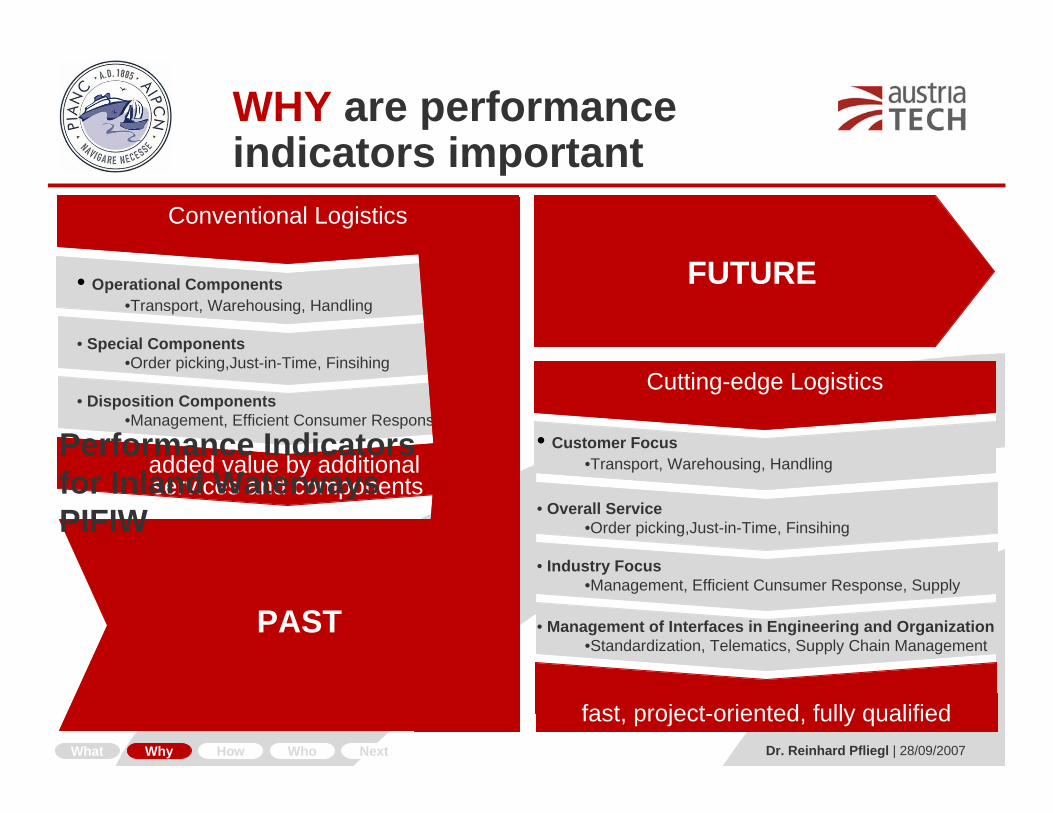
Conventional Logistics
added value by additional services and components
• Operational Components•Transport, Warehousing, Handling
• Special Components•Order picking,Just-in-Time, Finsihing
• Disposition Components•Management, Efficient Consumer Response, Supply
fast, project-oriented, fully qualified
Cutting-edge Logistics
• Customer Focus•Transport, Warehousing, Handling
• Overall Service•Order picking,Just-in-Time, Finsihing
• Industry Focus•Management, Efficient Cunsumer Response, Supply
• Management of Interfaces in Engineering and Organization•Standardization, Telematics, Supply Chain Management
PAST
FUTURE
WHY are performance indicators important
What Why How Who Next
Dr. Reinhard Pfliegl | 28/09/2007
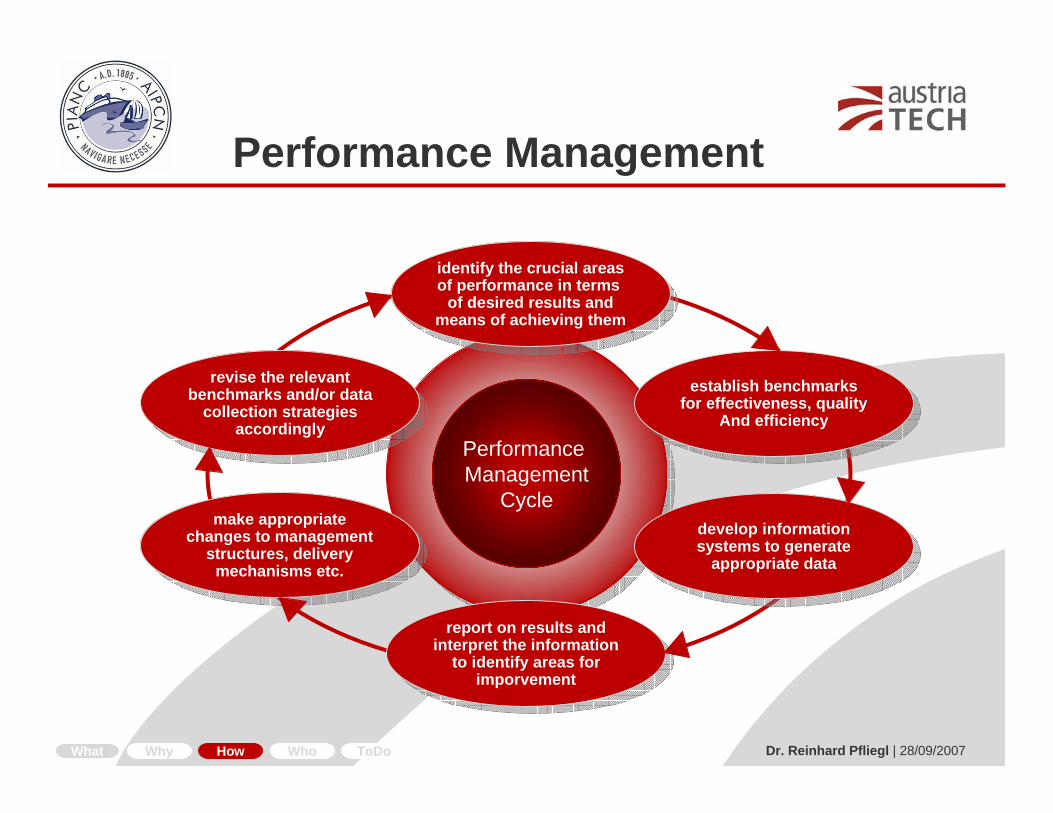
revise the relevantbenchmarks and/or data
collection strategiesaccordingly
revise the relevantbenchmarks and/or data
collection strategiesaccordingly
identify the crucial areasof performance in terms
of desired results andmeans of achieving them
identify the crucial areasof performance in terms
of desired results andmeans of achieving them
establish benchmarksfor effectiveness, quality
And efficiency
establish benchmarksfor effectiveness, quality
And efficiency
develop informationsystems to generate
appropriate data
develop informationsystems to generate
appropriate data
report on results andinterpret the information
to identify areas forimporvement
report on results andinterpret the information
to identify areas forimporvement
make appropriatechanges to management
structures, deliverymechanisms etc.
make appropriatechanges to management
structures, deliverymechanisms etc.
Performance Management
Cycle
Performance Management
What Why How Who ToDo

Dr. Reinhard Pfliegl | 28/09/2007
Some examples from other modes?

Dr. Reinhard Pfliegl | 28/09/2007
Generic KPI for Air FreightIndustry
Dr. Reinhard Pfliegl | 28/09/2007
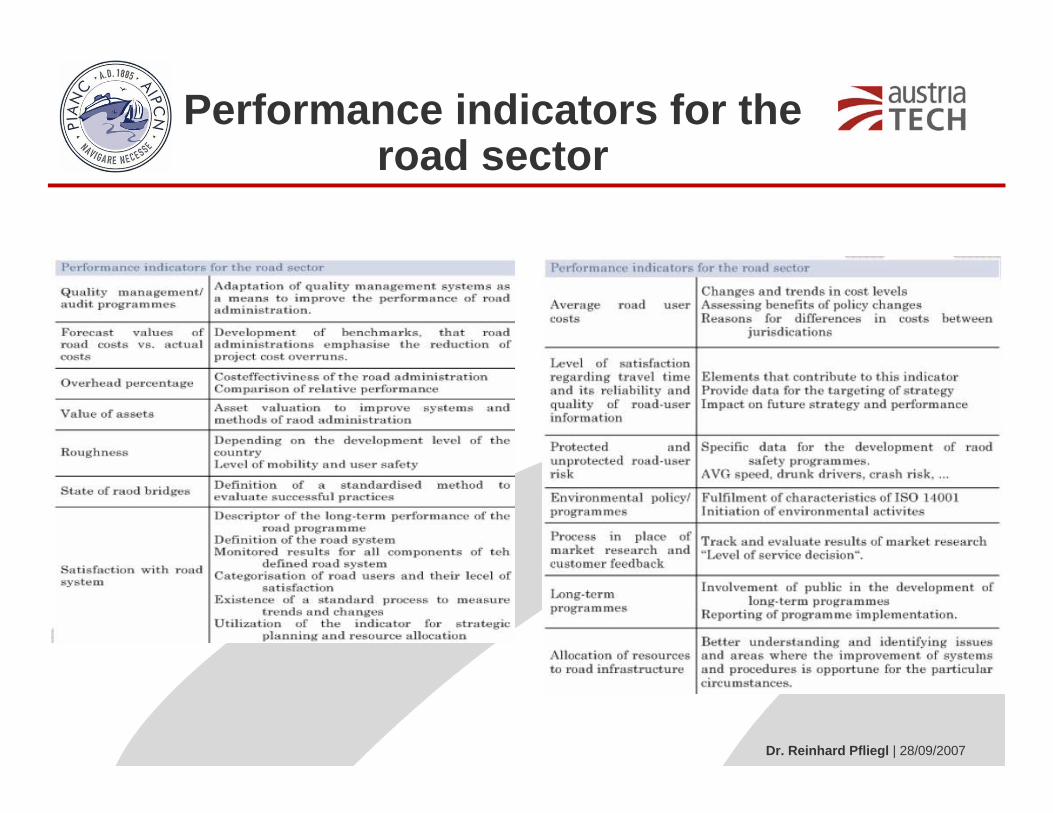
Performance indicators for theroad sector
Dr. Reinhard Pfliegl | 28/09/2007
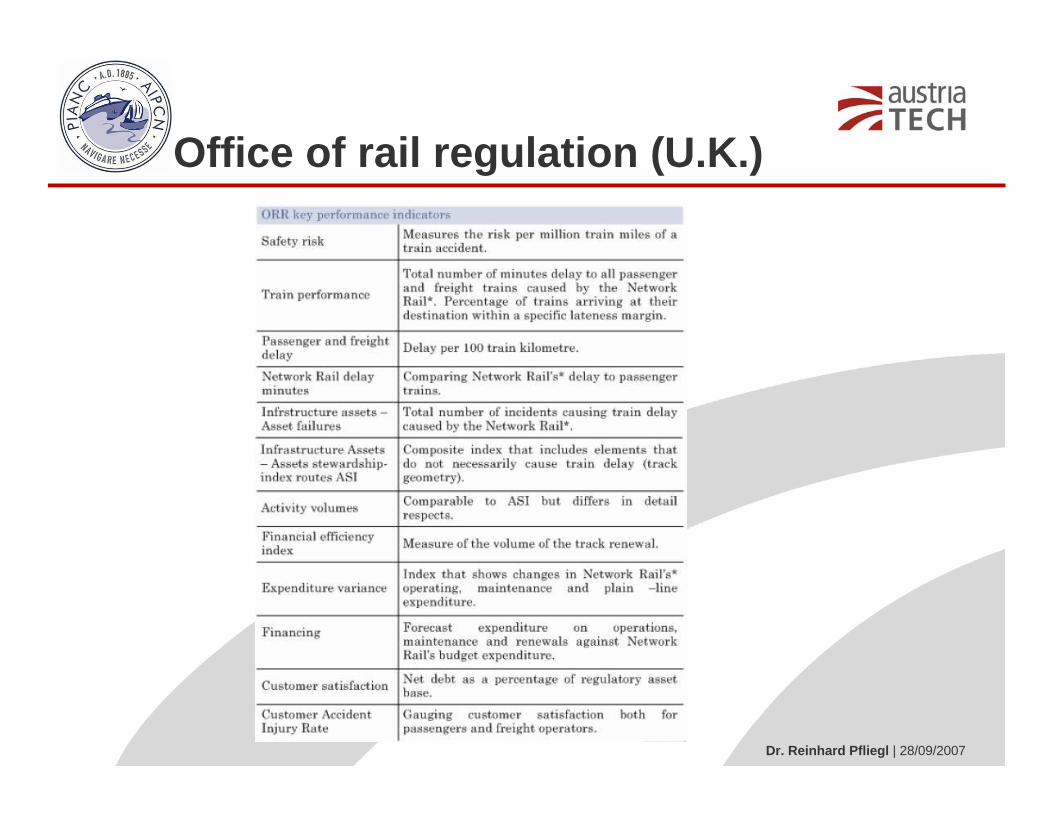
Office of rail regulation (U.K.)

Dr. Reinhard Pfliegl | 28/09/2007
UPS environmental and socialindicators

Dr. Reinhard Pfliegl | 28/09/2007
PIANC INCOM WG 32
Performance Indicators for Inland Waterway Transport
Dr. Reinhard Pfliegl | 28/09/2007
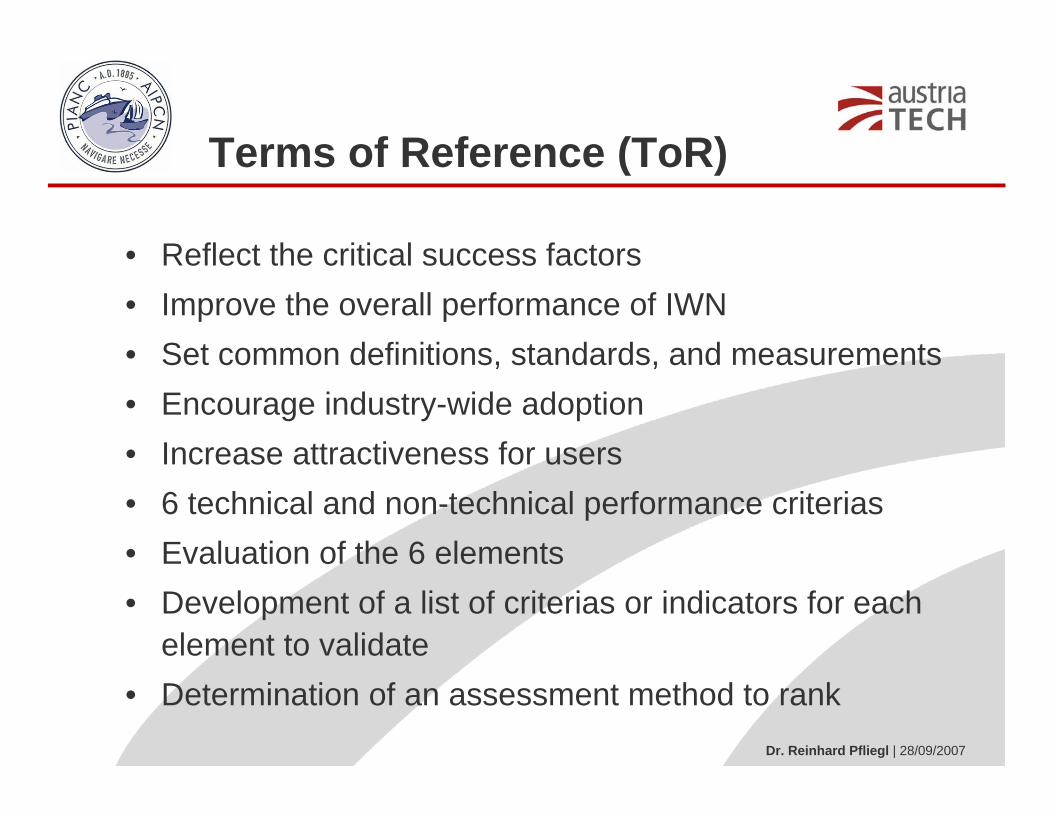
Terms of Reference (ToR)
• Reflect the critical success factors• Improve the overall performance of IWN• Set common definitions, standards, and measurements • Encourage industry-wide adoption• Increase attractiveness for users• 6 technical and non-technical performance criterias• Evaluation of the 6 elements• Development of a list of criterias or indicators for each
element to validate• Determination of an assessment method to rank

Dr. Reinhard Pfliegl | 28/09/2007
WG 32 Members
• U.S.:William T. HARDER
• Austria:Gerhard GUSSMAGG
• Germany:Matthias KUSSNER
• Belgium:Jacques HACOURT
• Netherlands:Robert HEKKENBERGWouter BIJMAN
• France:Benoit DELEU
• Spain:Francisco CAFFARENA

Dr. Reinhard Pfliegl | 28/09/2007
Timeline
WG Meeting Beijing
Q3/08
Start ofpre-paratorywork
1/07
Intermed. Report
6/08
DraftReport forComment
12/08
Final review byWG
3/09
Sub-mission ofTOR
1/06
Kick-off Louisville
9/07
Accep-tance byPIANC EXCOM
Call forparticipation
9/06
List of WG members
Q3/07
WG-Meeting
Q1/08
Final Report
6/09
Dr. Reinhard Pfliegl | 28/09/2007
S P E C I IF C
M E A S U ER A B L E
A T T A I N A B L ER E A L I S T I C
T I M E - S E N S I T I V E
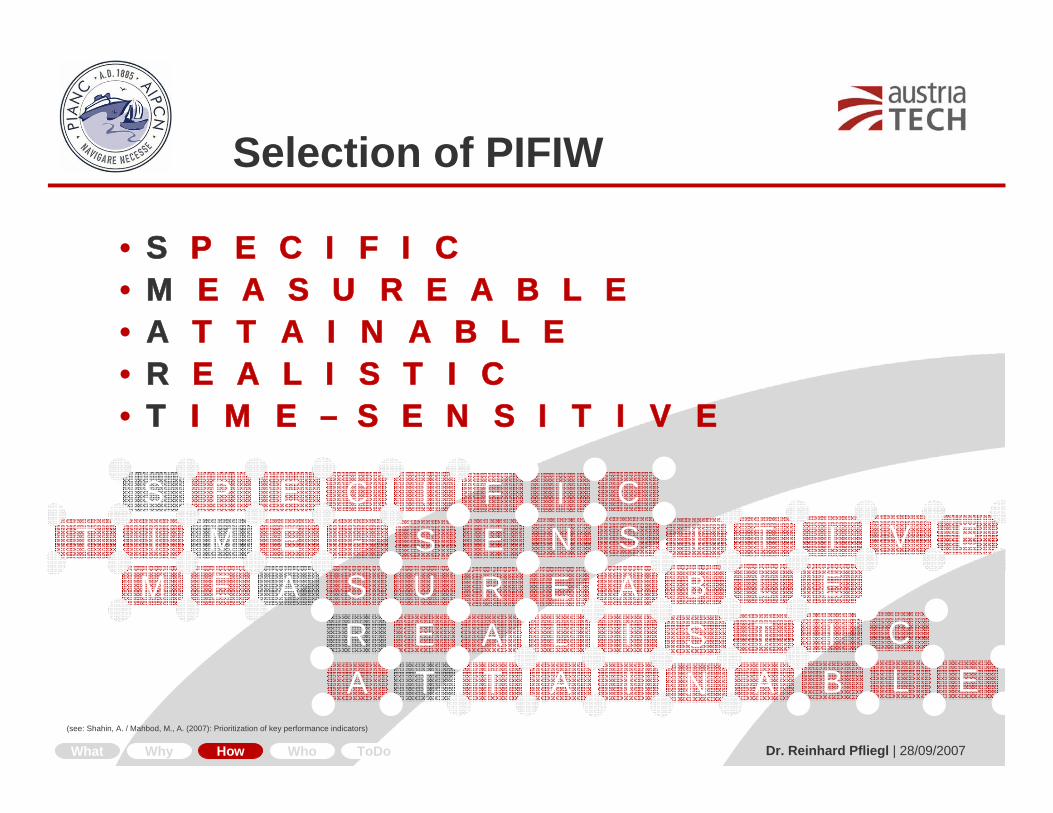
• S P E C I F I C• M E A S U R E A B L E• A T T A I N A B L E• R E A L I S T I C• T I M E – S E N S I T I V E
Selection of PIFIW
What Why How Who ToDo
(see: Shahin, A. / Mahbod, M., A. (2007): Prioritization of key performance indicators)

AustriaTech – Federal Agency for Technological Measures Ltd.
Donau-City-Str. 1 1220 Vienna, Austriaphone +43 1 26 33 444fax +43 1 26 33 444 [email protected]
University of Natural Resources and Applied Life Sciences, Vienna
Feistmantelstr. 4 1180 Vienna, Austriaphone +43 1 47654 44 11fax +43 1 47654 44 [email protected]
…cause change happens
Thank You for Your AttentionPerformance Indicators for Inland Waterways
What Why How Who ToDo…cause change happens
aDMINISTRATION
WATERWAY
vERIFY
eFFICIENT
PERFORMANCE
lOGISTICS
sTANDARD
uNIVERSAL
Dr. Reinhard Pfliegl | 28/09/2007
Introduction of all participants
Areas of interest?
Expectations?
Experiences?
Dr. Reinhard Pfliegl | 28/09/2007
Performance Indicators
Overview of application USACE point of view
presented by
Bill T. Harder

Dr. Reinhard Pfliegl | 28/09/2007
Lunch Break
Have a nice meal!

Dr. Reinhard Pfliegl | 28/09/2007
Performance Indicators for Inland WaterwaysPIFIW (Performance Indicators for Inland Waterways)
Univesity of Natural Resourcesand Applied Life Sciences, Vienna
Dr. Reinhard Pfliegl (Austria Tech)
Martin Posset (BOKU, Vienna)

Dr. Reinhard Pfliegl | 28/09/2007
• What is Performance Management
• Why is there a need for Performance Indicators
• How to select Performance IndicatorsManagement of Performance
• Who reports on Performance
• ToDo Conclusion & Outlook
About Performance Indicators
What Why How Who ToDo

Dr. Reinhard Pfliegl | 28/09/2007
“Things you cannot measure, you cannot control.“Tom DeMarco
“What you cannot measure, you cannot manage.“Peter F. Drucker
“Measure everything that’s measurable and make everything measurable that’s measurable.”
Galileo Galilei
!
?
?
!
Measure to Manage
What Why How Who ToDo
… to enable a common understanding of performance indicatorswithin the inland waterway transportation industry…
Dr. Reinhard Pfliegl | 28/09/2007
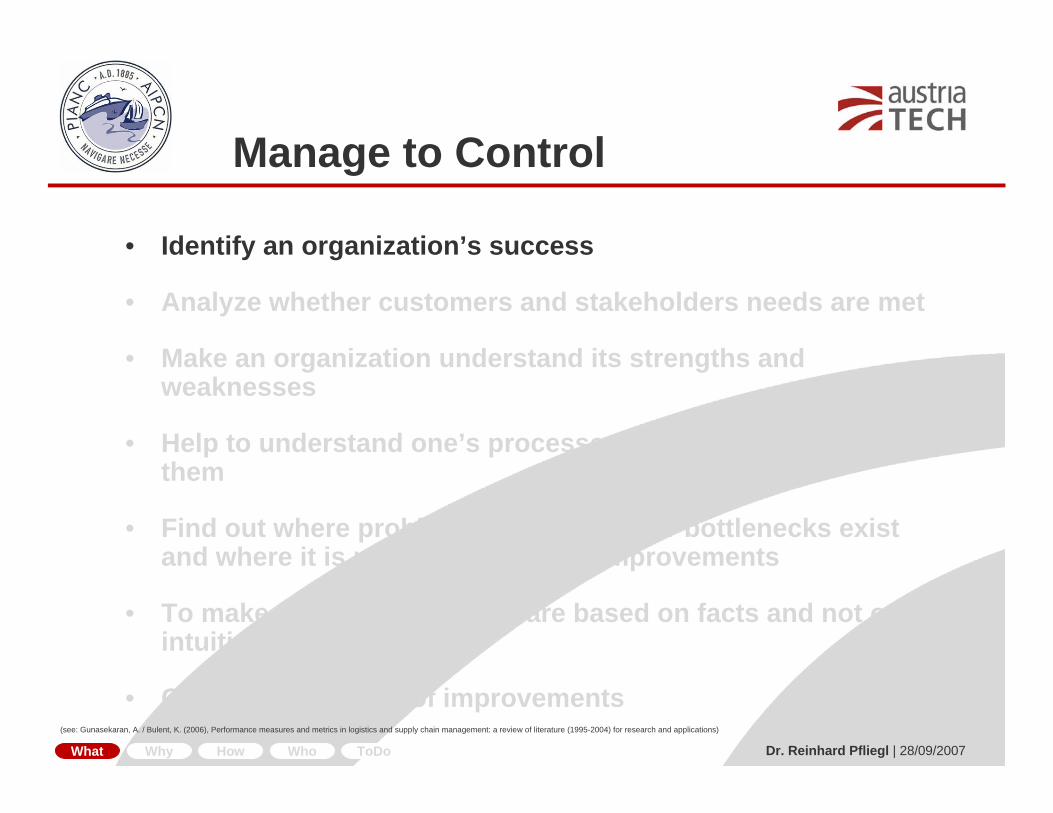
• Identify an organization’s success
• Analyze whether customers and stakeholders needs are met
• Make an organization understand its strengths and weaknesses
• Help to understand one’s processes and how to improve them
• Find out where problems, redundancy or bottlenecks exist and where it is necessary to make improvements
• To make sure that decisions are based on facts and not on intuition or emotions.
• Confirm the impact of improvements
What Why How Who ToDo
Manage to Control
(see: Gunasekaran, A. / Bulent, K. (2006), Performance measures and metrics in logistics and supply chain management: a review of literature (1995-2004) for research and applications)
Dr. Reinhard Pfliegl | 28/09/2007
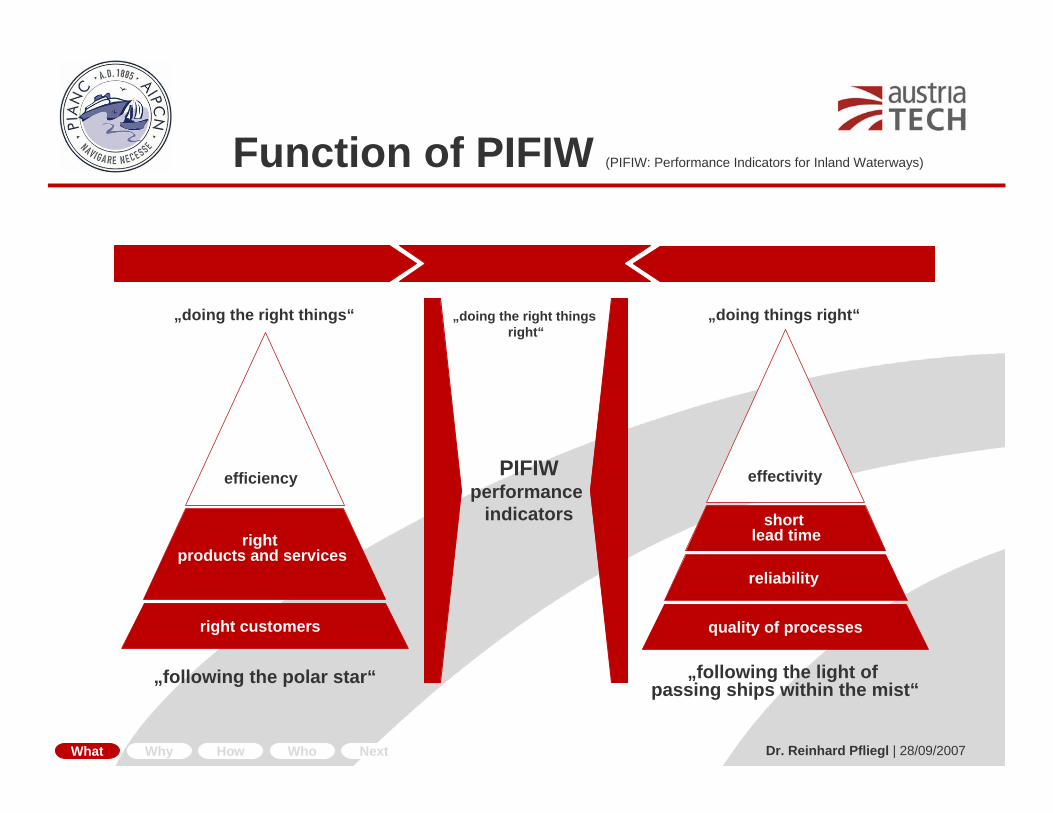
Function of PIFIW (PIFIW: Performance Indicators for Inland Waterways)
„doing things right“
„following the light of passing ships within the mist“
quality of processes
reliability
shortlead time
effectivity
„doing the right things“
„following the polar star“
efficiency
right products and services
right customers
„doing the right thingsright“
PIFIWperformance
indicators
What Why How Who Next
Dr. Reinhard Pfliegl | 28/09/2007
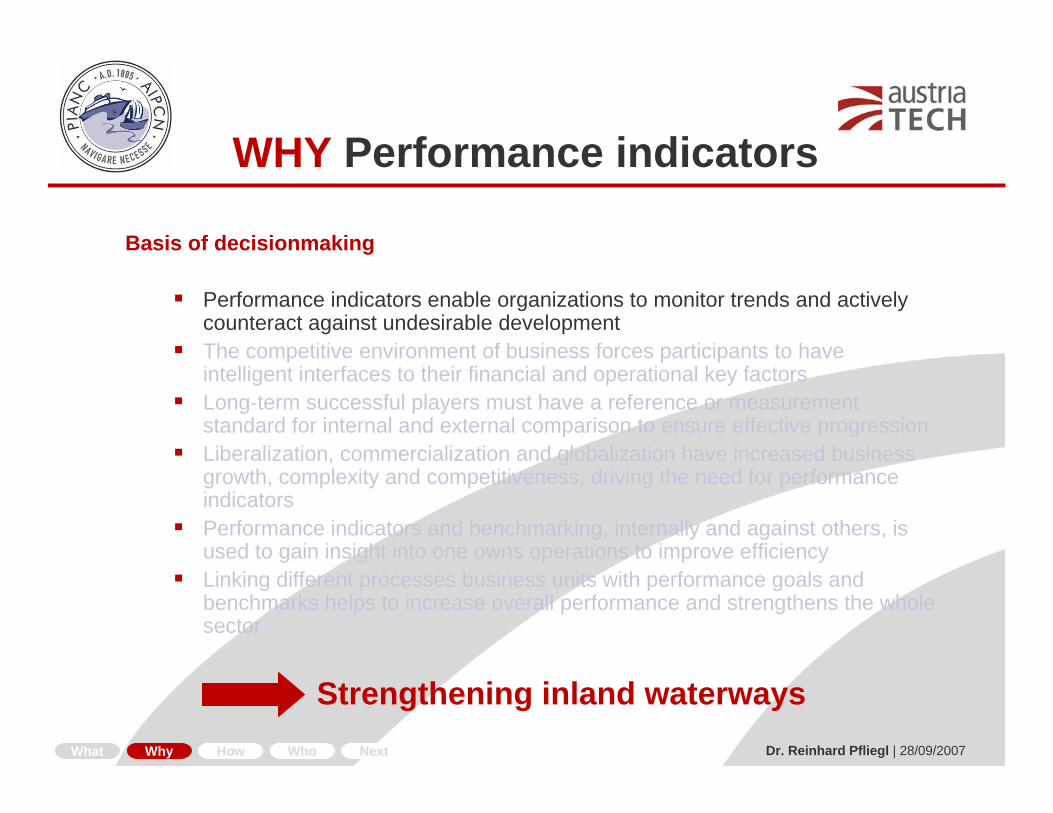
Basis of decisionmaking
Performance indicators enable organizations to monitor trends and actively counteract against undesirable developmentThe competitive environment of business forces participants to have intelligent interfaces to their financial and operational key factorsLong-term successful players must have a reference or measurement standard for internal and external comparison to ensure effective progressionLiberalization, commercialization and globalization have increased business growth, complexity and competitiveness, driving the need for performance indicatorsPerformance indicators and benchmarking, internally and against others, is used to gain insight into one owns operations to improve efficiencyLinking different processes business units with performance goals and benchmarks helps to increase overall performance and strengthens the whole sector
Strengthening inland waterways
WHY Performance indicators
What Why How Who Next
Dr. Reinhard Pfliegl | 28/09/2007
Conventional Logistics
added value by additional services and components
• Operational Components•Transport, Warehousing, Handling
• Special Components•Order picking,Just-in-Time, Finsihing
• Disposition Components•Management, Efficient Consumer Response, Supply
fast, project-oriented, fully qualified
Cutting-edge Logistics
• Customer Focus•Transport, Warehousing, Handling
• Overall Service•Order picking,Just-in-Time, Finsihing
• Industry Focus•Management, Efficient Cunsumer Response, Supply
• Management of Interfaces in Engineering and Organization•Standardization, Telematics, Supply Chain Management
PAST
FUTURE
WHY are performance indicators important
Performance Indicatorsfor Inland WaterwaysPIFIW
What Why How Who Next

Dr. Reinhard Pfliegl | 28/09/2007
• The importance of mobility to ease the movement of people and goods.
• Enabling the accessibility of transportation facilities. Accessibility is strongly related to the use of transportation facilities.
• Transportation has to be safe and reliable and so there is a need to figure out critical processes.
• The transportation sector has a sustainable liability towards the preservation of the existing state of the environment.
• Decision-making in the transportation sector is interwoven with participating populations. Public involvement is very important especially in the sector of waterborne transportation.
What Why How Who ToDo
Reasoning
(see: Jin, M. / Wang, H. / Walden, C., T. (2004): System Performance measures for intermodal transportation with a case study and industrial application)

Dr. Reinhard Pfliegl | 28/09/2007
Contribution to protectionof ability tocoordinate
Contribution to protectionof ability tocoordinate
Contribution to protectionof reactivity
Contribution to protectionof reactivity
Contribution to protectionof anticipation
Contribution to protectionof anticipation
Contribution to protectionof adaptiveness
Contribution to protectionof adaptiveness
Protection ofcoordination
Protection ofcoordination
Protection ofinformation supply
Protection ofinformation supply
Support of goal achievement of theorganisations‘ targets
Support of goal achievement of theorganisations‘ targets
Protection of rationaldecision-making
Protection of rationaldecision-making
direct targets indirect targets
gene
ralf
ram
ewor
k
busi
ness
goal
s
What Why How Who ToDo
Targets
Rapko, P. (2001): Kunden-Controlling, Konzeption und Angrenzung, Tectum Verlag, Marburg)
P E R F O R M A N C E I N D I C A T O R S
Contribution to protectionof adaptiveness
Contribution to protectionof anticipation
Contribution to protectionof reactivity
Contribution to protectionof ability to coordinate
Support of goal achievement of theorganisations‘ targets
Protection ofcoordination

Dr. Reinhard Pfliegl | 28/09/2007
S P E C I IF C
M E A S U ER A B L E
A T T A I N A B L ER E A L I S T I C
T I M E - S E N S I T I V E
• S P E C I F I C• M E A S U R E A B L E• A T T A I N A B L E• R E A L I S T I C• T I M E – S E N S I T I V E
Selection of PIFIW
What Why How Who ToDo
(see: Shahin, A. / Mahbod, M., A. (2007): Prioritization of key performance indicators)

Dr. Reinhard Pfliegl | 28/09/2007
revise the relevantbenchmarks and/or data
collection strategiesaccordingly
revise the relevantbenchmarks and/or data
collection strategiesaccordingly
identify the crucial areasof performance in terms
of desired results andmeans of achieving them
identify the crucial areasof performance in terms
of desired results andmeans of achieving them
establish benchmarksfor effectiveness, quality
And efficiency
establish benchmarksfor effectiveness, quality
And efficiency
develop informationsystems to generate
appropriate data
develop informationsystems to generate
appropriate data
report on results andinterpret the information
to identify areas forimporvement
report on results andinterpret the information
to identify areas forimporvement
make appropriatechanges to management
structures, deliverymechanisms etc.
make appropriatechanges to management
structures, deliverymechanisms etc.
Performance Management
Cycle
Performance Management
What Why How Who ToDo

Dr. Reinhard Pfliegl | 28/09/2007
Do you havecontrolover theentity?
Does it havesignificantimpacts?
Do you havesignificantinfluence?
Do you haveinfluence?
Does it havesignificantimpacts?
Does it haveSignificantimpacts?
Yes
Yes
Yes
Yes Yes
YesNo
No
No
No
No
No
Exclude
Not necessaryto report
Not necessaryto report
Not necessaryto report
Performance data
Disclosures on Management Approach
Narrative reporting on Issues and Dilemmas
Reporting
What Why How Who ToDo
(see: Sustainability Reporting Guidelines (2006), p. 18, http:www.globalreporting.org)

Dr. Reinhard Pfliegl | 28/09/2007
Actors, Areas and Functions
Ministry
of tran
sportatio
n
Min
istry
of la
bour
Euro
pean
Uni
on
Cities
Investment banks
Carriers
Ports
Shipping companies
Land ownersCitizens
Communities
Associa
tions
Indu
stryInterest
groups
Mem
bersof
parliament
Regional governments
Police, Customs
Foreign authorities
Media
Ministryof environment
Parliament
tbd…
tbd…
tbd…
function? function?function?
func
tion?
function?
function?
function?
function?
PARTNERS
PARTNERS
ANDANDCOCO--OPERATORS
OPERATORSW
ATERWAY
WATERW
AY
SERVICE USERS
SERVICE USERS
SUPPLIERSSUPPLIERS
OWNERS
OWNERSTBDTBD……
TBDTBD……
TBD
TBD……
TBD
TBD……
What Why How Who ToDo

Dr. Reinhard Pfliegl | 28/09/2007
Safetyand
Security
Environ-ment
Long-termTransportation
CostEfficiency
Facilitiesand
Infrastructure
EconomicDevelopment ICT
Cargoand
Passengers
Mobilityand
Reliability• AVG travel time (AVG = average)
• Coefficient of variation of travel time•…•…
• accidents per TMT/PMT(TMT ton-miles traveled/PMT passenger-miles traveled)
• number of accidents caused bysecurity problems
•…•…
• Tons of mobile source emissions• Number of people affected by
noise produced byvehicles per TMT(TMT ton-miles traveled)
•…•…
• Tons of cargo transported per year• Number of passengers transported
per year related to total habitants
•…•…
• Availability of river informationsystems
• Usage of satelite navigation•…•…
• Years of usable transportationsystem
• Vehicle costs•…•…
• Number of job opportunitiescreated by transportation
• Economic growth approximationresulted from transportation
•…•…
• Number of barriers and weirsper 100 miles
• Percent of vessels in good conditions
•…•…
PERFORMANCE
What Why How Who ToDo
PIFIW
(see: Jin, M. / Wang, H. / Walden, C., T.: System Performance Measures for Intermodal Transportation with a Case Study and Industrial Application)
Ports• Capacity• Years of usage•…•…
INDICATORS
FOR INLAND WATERWAYS
PIFIW

Dr. Reinhard Pfliegl | 28/09/2007
Airport Council International

Dr. Reinhard Pfliegl | 28/09/2007
Generic KPI for Air FreightIndustry

Dr. Reinhard Pfliegl | 28/09/2007
Performance indicators for theroad sector

Dr. Reinhard Pfliegl | 28/09/2007
Office of rail regulation (U.K.)

Dr. Reinhard Pfliegl | 28/09/2007
UPS environmental and socialindicators

Dr. Reinhard Pfliegl | 28/09/2007
designing measures
identifyingkey objectives2
0 0
7 c
omm
onun
ders
tand
ing
M I
S S
I O
N
ToDo
What Why How Who ToDo
initial collectioncollation
sorting/analyzedistribution
measure
review
act
reflect
system design implementationof measures
use of measuresto assess the
implementation of strategy
use of measuresto challenge strategic
assumptions
(1) reviewing targets
(2) developing measures
(3) reviewing measures
(4) challenging strategy(see: Bourne, M / Mills, J. / Wilcox, M. / Neely, a. / Platts, K. (2000): Designing, implementing and updating performance measurement systems)
V I S I O NV I S I O N

Dr. Reinhard Pfliegl | 28/09/2007
• Measuring performance of processes to make them rateable becausemanagement of processes affects current and future performance
• Monitoring adverse impacts and guarding against negative effects
• Setting up performance indicators to structure information and clarify the correlation of input, output, outcome and impact of operation
• There is a need for standardized and accepted instruments to analyse processes and performance against objectives and to evaluate achievements
• Enabling a common understanding on how organizations can proactively improve their performance and how they can appropriately measure how well their performance measures up to their customer’s expectations
• Comparing the development of different organisations to enablebenchmarking and comparison with other modes of transportation
What Why How Who ToDo
Conclusion

Dr. Reinhard Pfliegl | 28/09/2007

Dr. Reinhard Pfliegl | 28/09/2007
Performance Indicators
3322
performanceperformance indicatorsindicators = = workingworking groupgroup 3232
PIANC PIANC workingworking groupgroup 3232…………thethe right right organizationorganization to to initiateinitiate

Dr. Reinhard Pfliegl | 28/09/2007
Discussion
Terms of Reference
Adaptation?
Extension?
Limitations?
Applications?

Dr. Reinhard Pfliegl | 28/09/2007
Further approach
Election of chair person, secretary, other functionsContent of workSchedule of workContribution of partnersSubgroupsNext stepsBest way to workNext meetingLocation

Dr. Reinhard Pfliegl | 28/09/2007
Closing remarks

Dr. Reinhard Pfliegl | 28/09/2007
Have a nice evening!