Embed Size (px)
Citation preview
METRO SYSTEM PERFORMANCE REPORT
PERFORMANCE INDICATORS AND CUSTOMER SATISFACTIONCustomer Service, Operations and Safety CommitteeOctober 20, 2005
2
• Review Metro System Performance Indicators.• Present for the first time the results of the Customer Satisfaction
Measurement Survey and describe how we use this information.• Describe new communications initiative for sharing this quarterly
“report card” with customers, stakeholders, and the general public.
PURPOSE
3
BACKGROUND
• In November of 2004 Metro committed to a “back to basics” program, with a clear focus on:• Service reliability• Customer service.
• This report lays out the results that have been achieved.
4
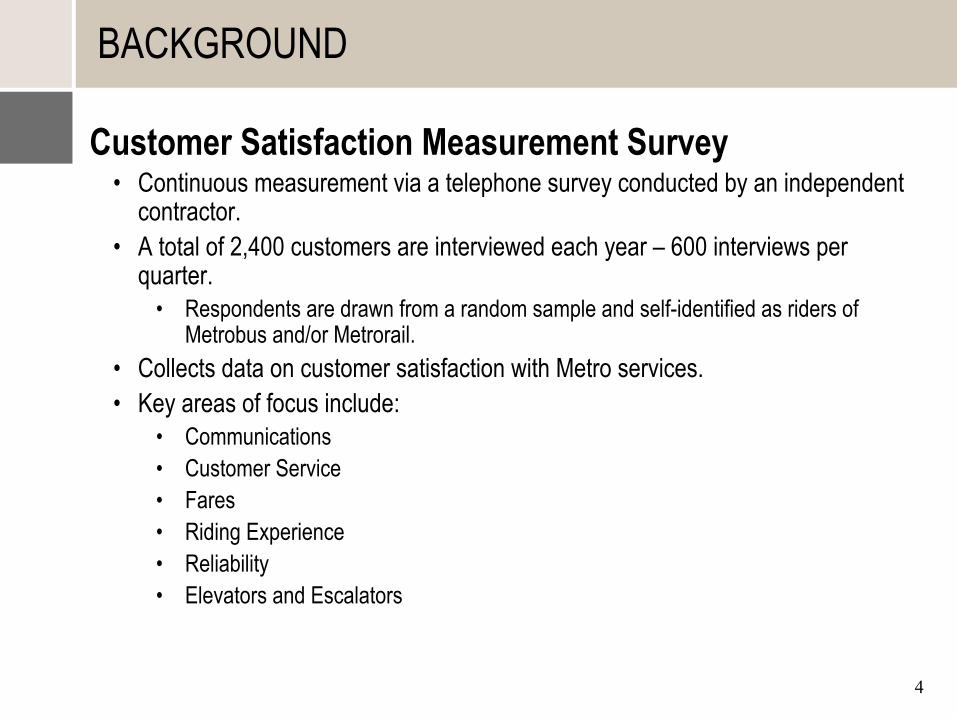
Customer Satisfaction Measurement Survey• Continuous measurement via a telephone survey conducted by an independent
contractor. • A total of 2,400 customers are interviewed each year – 600 interviews per
quarter. • Respondents are drawn from a random sample and self-identified as riders of
Metrobus and/or Metrorail.• Collects data on customer satisfaction with Metro services.• Key areas of focus include:
• Communications• Customer Service• Fares • Riding Experience• Reliability• Elevators and Escalators
BACKGROUND
5
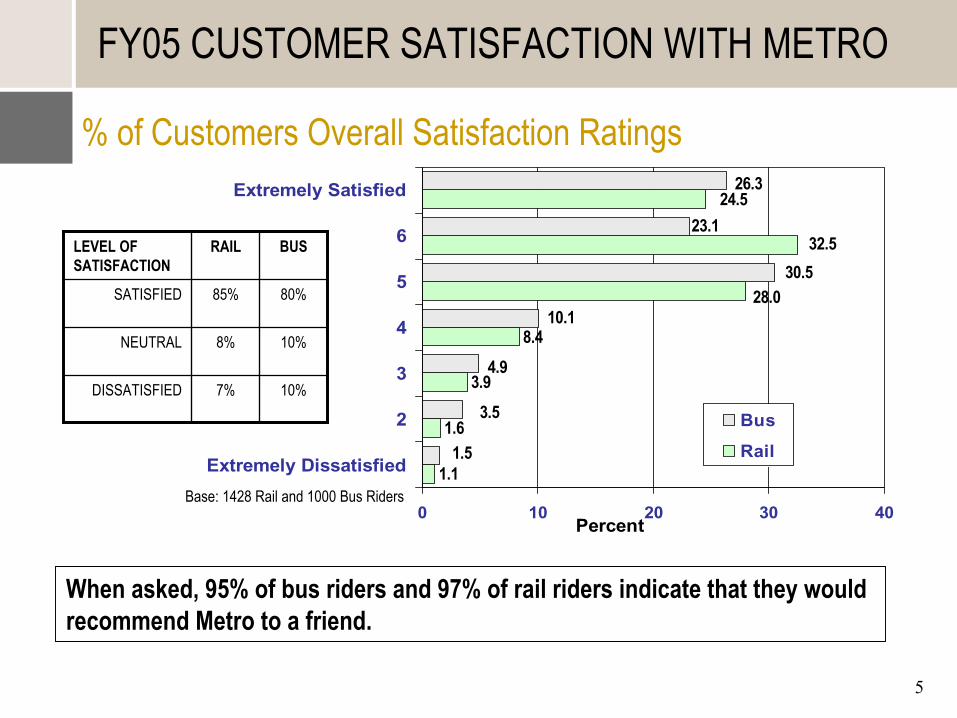
1.1
1.6
3.9
8.4
28.0
24.5
32.5
1.5
3.5
4.9
10.1
30.5
23.1
26.3
0 10 20 30 40
Extremely Dissatisfied
2
3
4
5
6
Extremely Satisfied
Percent
Bus
Rail
Base: 1428 Rail and 1000 Bus Riders
FY05 CUSTOMER SATISFACTION WITH METRO
% of Customers Overall Satisfaction Ratings
10%7%DISSATISFIED
10%8%NEUTRAL
80%85%SATISFIED
BUSRAILLEVEL OF SATISFACTION
When asked, 95% of bus riders and 97% of rail riders indicate that they would recommend Metro to a friend.
6
PERFORMANCE INDICATORS - METRORAIL
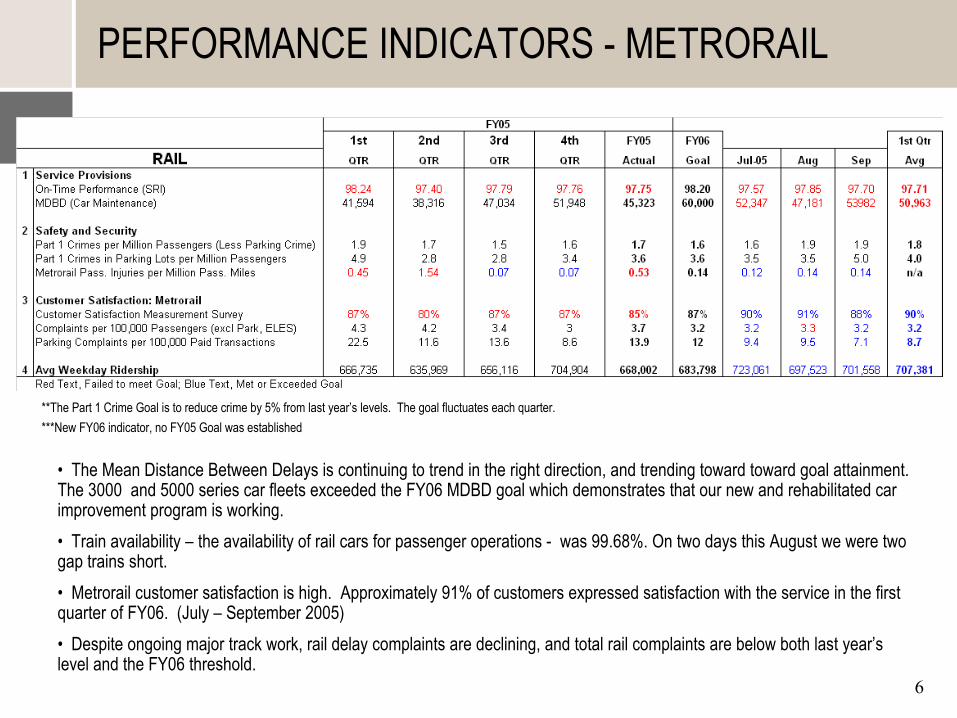
**The Part 1 Crime Goal is to reduce crime by 5% from last year’s levels. The goal fluctuates each quarter.***New FY06 indicator, no FY05 Goal was established
• The Mean Distance Between Delays is continuing to trend in the right direction, and trending toward toward goal attainment. The 3000 and 5000 series car fleets exceeded the FY06 MDBD goal which demonstrates that our new and rehabilitated car improvement program is working. • Train availability – the availability of rail cars for passenger operations - was 99.68%. On two days this August we were two gap trains short.• Metrorail customer satisfaction is high. Approximately 91% of customers expressed satisfaction with the service in the first quarter of FY06. (July – September 2005) • Despite ongoing major track work, rail delay complaints are declining, and total rail complaints are below both last year’s level and the FY06 threshold.
7
CUSTOMER SATISFACTION WITH METRORAIL
Index Ratings of Key Elements
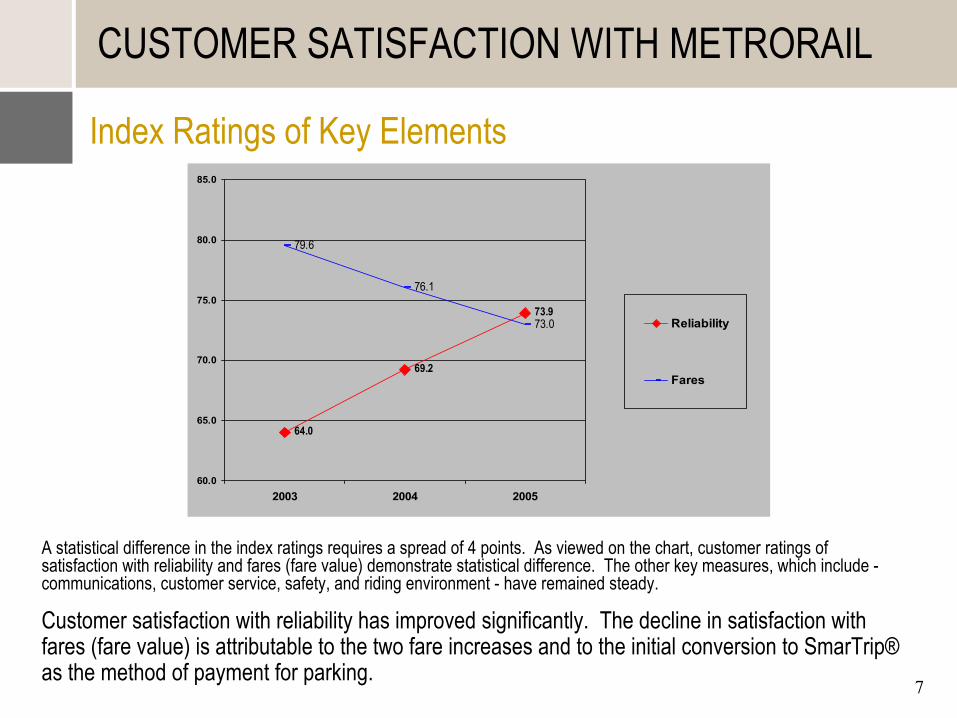
64.0
73.9
79.6
76.1
69.2
73.0
60.0
65.0
70.0
75.0
80.0
85.0
2003 2004 2005
Reliability
Fares
A statistical difference in the index ratings requires a spread of 4 points. As viewed on the chart, customer ratings of satisfaction with reliability and fares (fare value) demonstrate statistical difference. The other key measures, which include -communications, customer service, safety, and riding environment - have remained steady.
Customer satisfaction with reliability has improved significantly. The decline in satisfaction with fares (fare value) is attributable to the two fare increases and to the initial conversion to SmarTrip® as the method of payment for parking.
8
PERFORMANCE INDICATORS - METROBUS
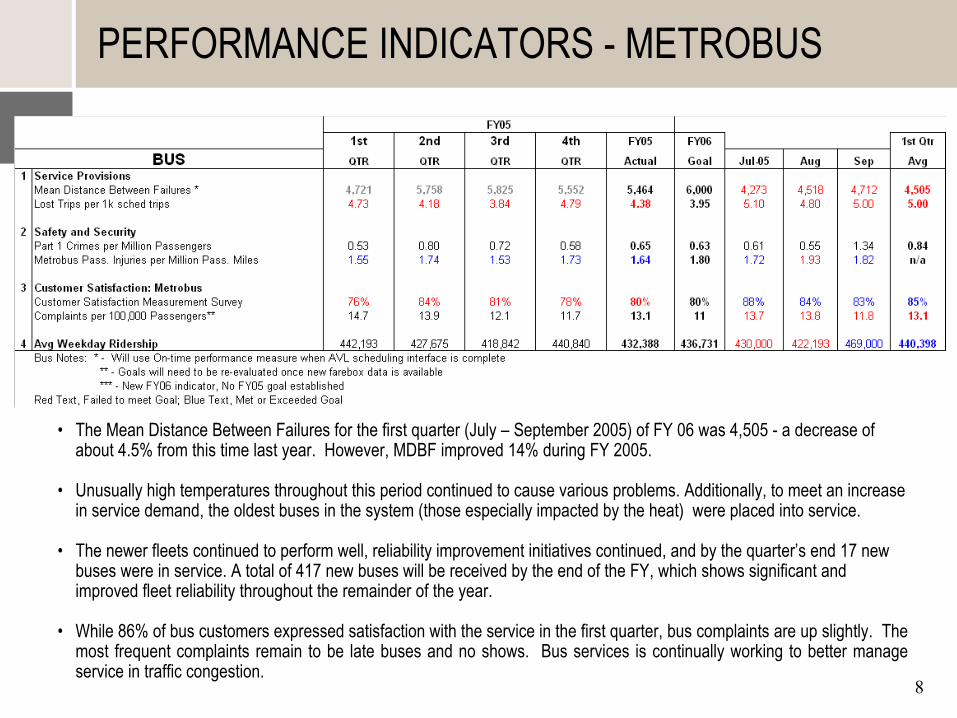
• The Mean Distance Between Failures for the first quarter (July – September 2005) of FY 06 was 4,505 - a decrease of about 4.5% from this time last year. However, MDBF improved 14% during FY 2005.
• Unusually high temperatures throughout this period continued to cause various problems. Additionally, to meet an increase in service demand, the oldest buses in the system (those especially impacted by the heat) were placed into service.
• The newer fleets continued to perform well, reliability improvement initiatives continued, and by the quarter’s end 17 new buses were in service. A total of 417 new buses will be received by the end of the FY, which shows significant and improved fleet reliability throughout the remainder of the year.
• While 86% of bus customers expressed satisfaction with the service in the first quarter, bus complaints are up slightly. The most frequent complaints remain to be late buses and no shows. Bus services is continually working to better manage service in traffic congestion.
9
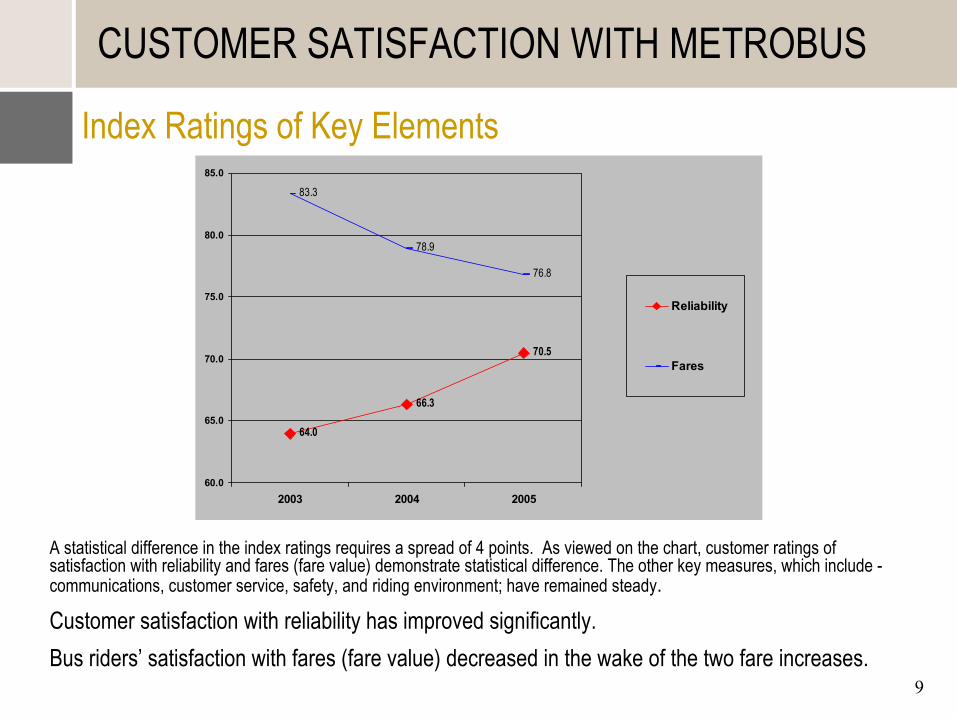
CUSTOMER SATISFACTION WITH METROBUS
Index Ratings of Key Elements
64.0
66.3
70.5
83.3
78.9
76.8
60.0
65.0
70.0
75.0
80.0
85.0
2003 2004 2005
Reliability
Fares
A statistical difference in the index ratings requires a spread of 4 points. As viewed on the chart, customer ratings of satisfaction with reliability and fares (fare value) demonstrate statistical difference. The other key measures, which include -communications, customer service, safety, and riding environment; have remained steady.Customer satisfaction with reliability has improved significantly.Bus riders’ satisfaction with fares (fare value) decreased in the wake of the two fare increases.
10
PERFORMANCE INDICATORS – ELEVATORS AND ESCALATORS
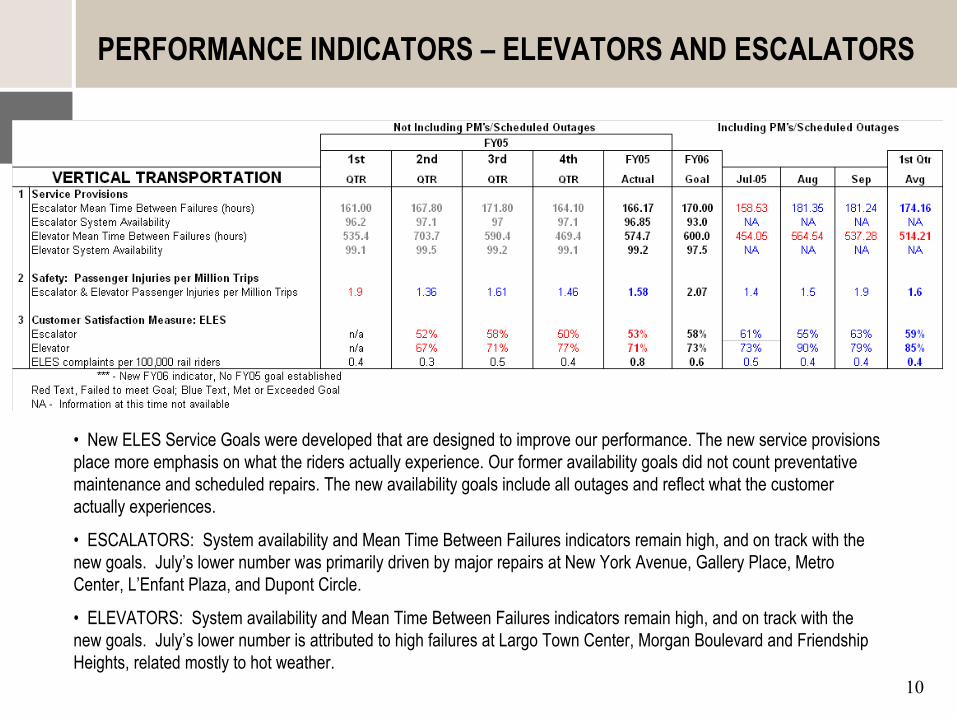
• New ELES Service Goals were developed that are designed to improve our performance. The new service provisions place more emphasis on what the riders actually experience. Our former availability goals did not count preventative maintenance and scheduled repairs. The new availability goals include all outages and reflect what the customer actually experiences.
• ESCALATORS: System availability and Mean Time Between Failures indicators remain high, and on track with the new goals. July’s lower number was primarily driven by major repairs at New York Avenue, Gallery Place, Metro Center, L’Enfant Plaza, and Dupont Circle.
• ELEVATORS: System availability and Mean Time Between Failures indicators remain high, and on track with the new goals. July’s lower number is attributed to high failures at Largo Town Center, Morgan Boulevard and Friendship Heights, related mostly to hot weather.
11
6.4
8.0
12.5
18.2
31.1
7.0
14.6
0.9
4
11.6
10.1
27.4
20.5
23.3
0 20 40
Extremely dissatisfied
2
3
4
5
6
Extremely Satisfied
Percent
ElevatorEscalator
Base: Escalators, 1428 Rail Riders ; Elevators, 243 elevator users
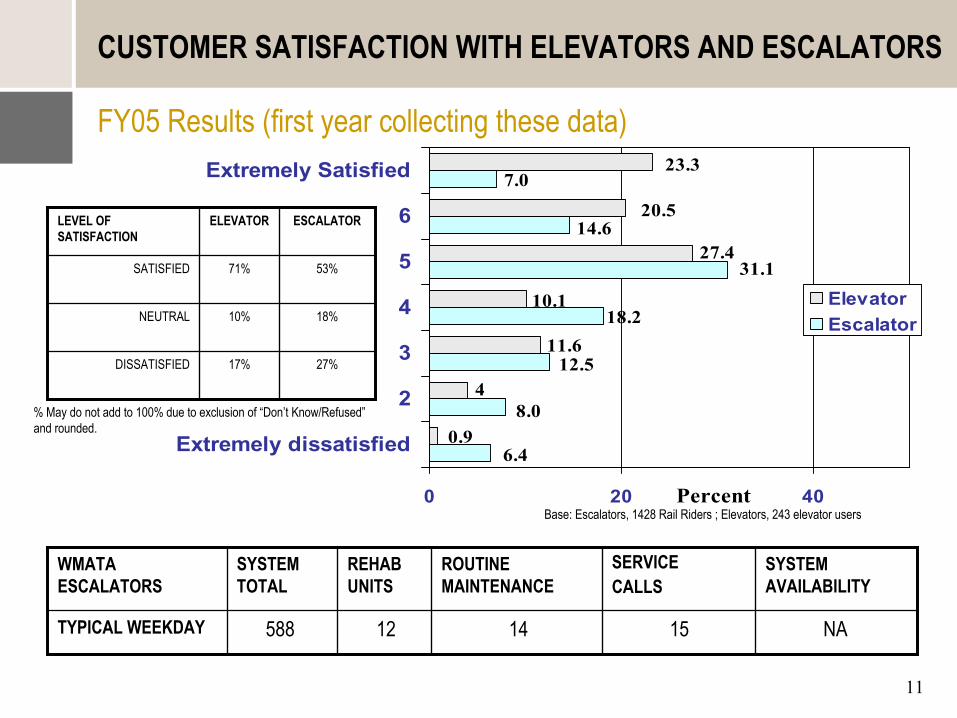
CUSTOMER SATISFACTION WITH ELEVATORS AND ESCALATORS
FY05 Results (first year collecting these data)
27%17%DISSATISFIED
18%10%NEUTRAL
53%71%SATISFIED
ESCALATORELEVATORLEVEL OF SATISFACTION
% May do not add to 100% due to exclusion of “Don’t Know/Refused” and rounded.
NA
SYSTEM AVAILABILITY
151412588TYPICAL WEEKDAY
SERVICECALLS
ROUTINE MAINTENANCE
REHAB UNITS
SYSTEM TOTAL
WMATA ESCALATORS
12
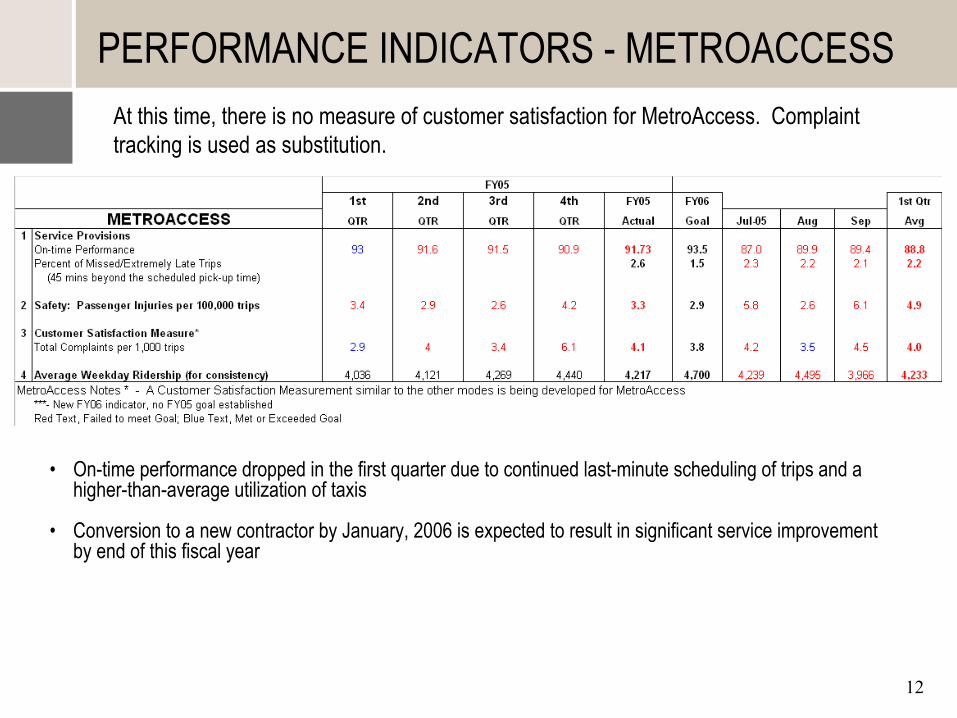
PERFORMANCE INDICATORS - METROACCESS
• On-time performance dropped in the first quarter due to continued last-minute scheduling of trips and a higher-than-average utilization of taxis
• Conversion to a new contractor by January, 2006 is expected to result in significant service improvement by end of this fiscal year
At this time, there is no measure of customer satisfaction for MetroAccess. Complaint tracking is used as substitution.
13
METRORAIL• Key performance indicators are moving in a positive direction, and our engineering intervention
initiatives are working. We are on track to meet our reliability improvement goals by the end of this fiscal year.
• Customer satisfaction is high, with 90% of customers expressing satisfaction in the first quarter of FY06.
METROBUS• The hot summer weather placed extra demands on many bus components, and the key indicators
reflect the negative impact of the weather.• A major influx of new buses are expected to further improve service reliability by the end of this
fiscal year.• While 86% of bus customers expressed satisfaction with the service in the first quarter, bus
complaints were up slightly.VERTICAL TRANSPORTATION
• System availability and MTBF indicators, for both escalators and elevators, are trending in the right direction, and on track with the new goals.
• Customer satisfaction remains low at 59% a slight increase over FY05. There appears to be a lag factor between equipment performance improvements and customer perception.
METROACCESS• While on-time performance was down slightly in the first quarter, we are working with the current
contractor to improve service reliability and customer service. • A new contractor has been selected and will start January 15, 2006. This is expected to
significantly improve service performance by the end of the fiscal year.
SUMMARY
14
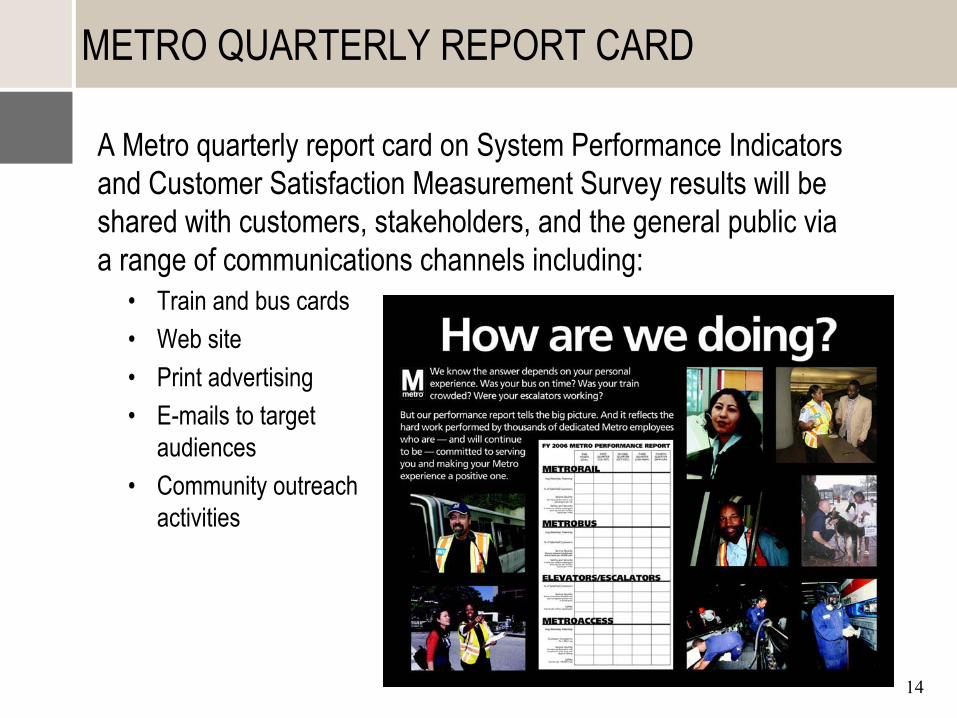
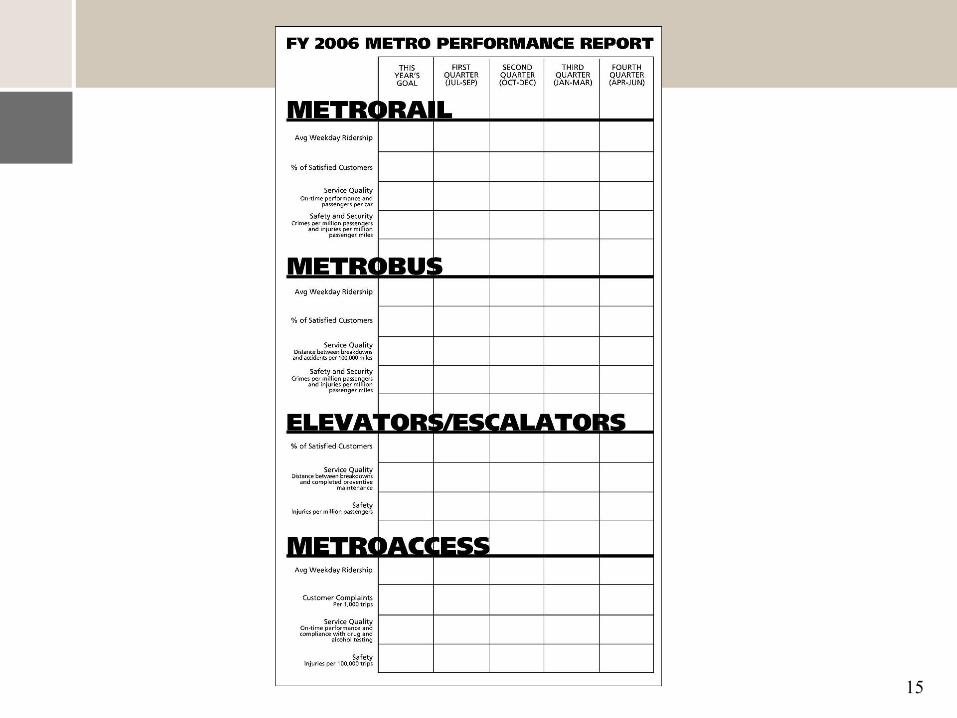
A Metro quarterly report card on System Performance Indicators and Customer Satisfaction Measurement Survey results will be shared with customers, stakeholders, and the general public via a range of communications channels including:
• Train and bus cards• Web site• Print advertising• E-mails to target
audiences• Community outreach
activities
METRO QUARTERLY REPORT CARD
15