Embed Size (px)
Citation preview
Performance Incentives in the Southern California Permanente Medical Group (SCPMG): 1994-2007
Joel D. Hyatt, MDAssistant Medical DirectorSouthern California Permanente Medical [email protected]
The 2nd National Pay for Performance Summit
2/15/2007
2
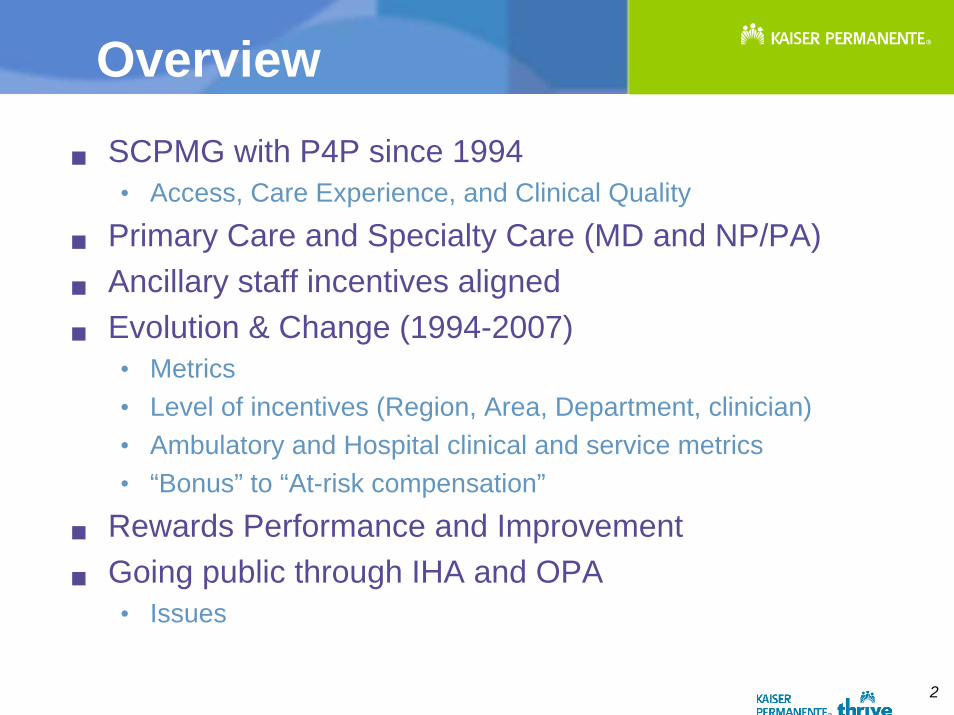
OverviewSCPMG with P4P since 1994• Access, Care Experience, and Clinical Quality
Primary Care and Specialty Care (MD and NP/PA)Ancillary staff incentives alignedEvolution & Change (1994-2007)• Metrics• Level of incentives (Region, Area, Department, clinician)• Ambulatory and Hospital clinical and service metrics• “Bonus” to “At-risk compensation”
Rewards Performance and ImprovementGoing public through IHA and OPA• Issues
3
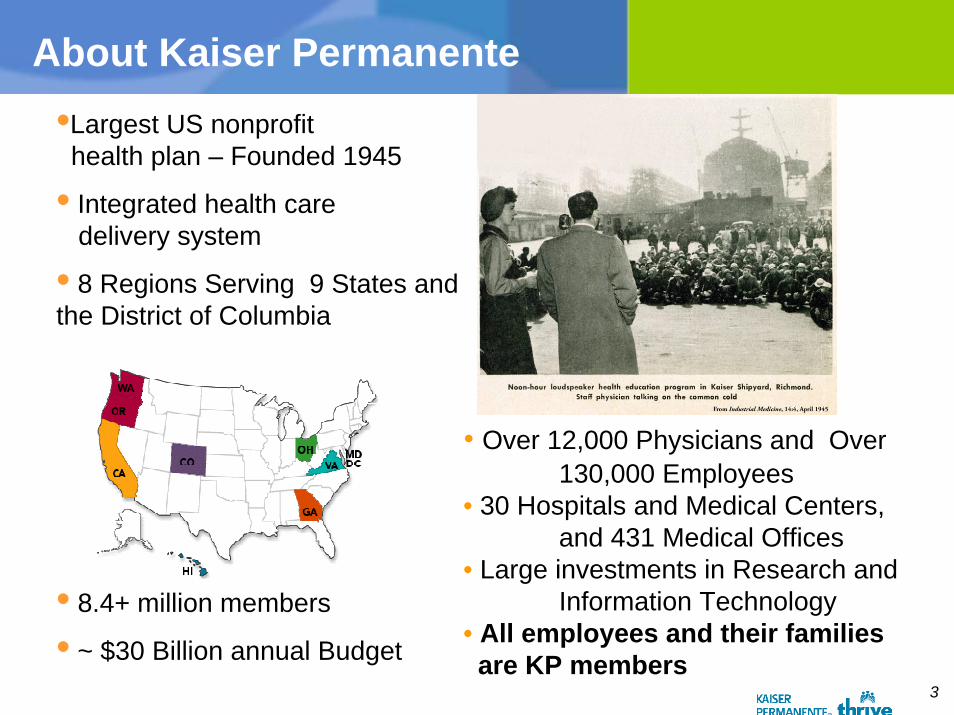
About Kaiser Permanente
• Integrated health caredelivery system
• 8 Regions Serving 9 States and the District of Columbia
• 8.4+ million members
• ~ $30 Billion annual Budget
•Largest US nonprofithealth plan – Founded 1945
• Over 12,000 Physicians and Over 130,000 Employees
• 30 Hospitals and Medical Centers, and 431 Medical Offices
• Large investments in Research and Information Technology
• All employees and their families are KP members
4
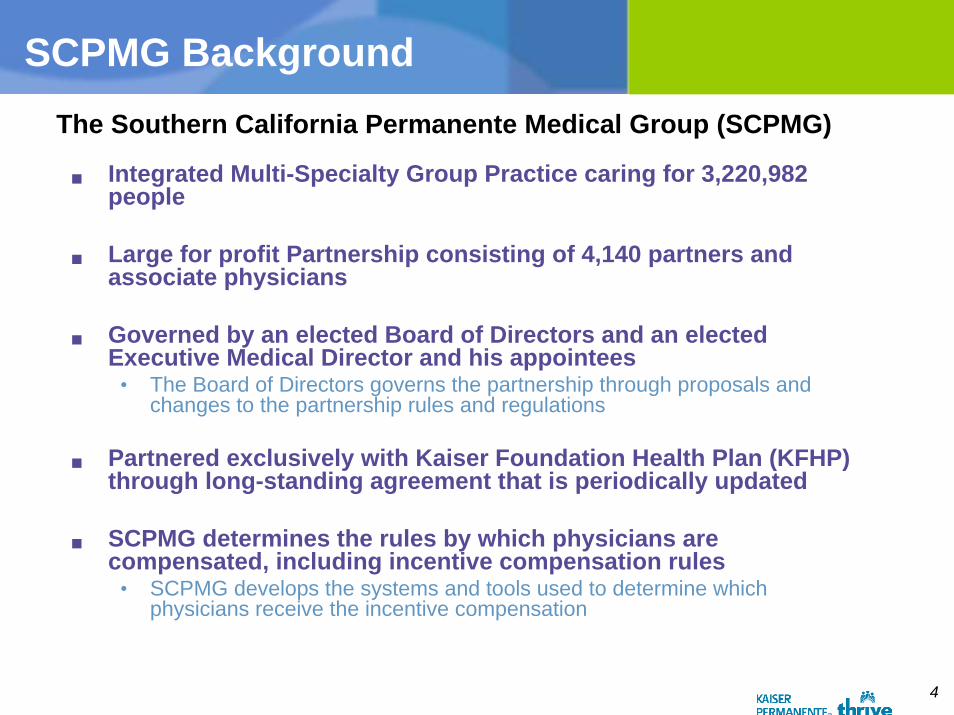
SCPMG BackgroundThe Southern California Permanente Medical Group (SCPMG)
Integrated Multi-Specialty Group Practice caring for 3,220,982 people
Large for profit Partnership consisting of 4,140 partners and associate physicians
Governed by an elected Board of Directors and an elected Executive Medical Director and his appointees
• The Board of Directors governs the partnership through proposals and changes to the partnership rules and regulations
Partnered exclusively with Kaiser Foundation Health Plan (KFHP) through long-standing agreement that is periodically updated
SCPMG determines the rules by which physicians are compensated, including incentive compensation rules
• SCPMG develops the systems and tools used to determine which physicians receive the incentive compensation
5
Principles behind SCPMG’s Pay for Performance Programs
Determined by SCPMG Board not KFHP
Rewards are attached to improving members’ care experience, quality, and access
Measurement tracked and reported prior to compensation being attached
Targeted to reward most of our physicians
From “Bonus” to “At Risk Compensation”
6
SCPMG Incentives
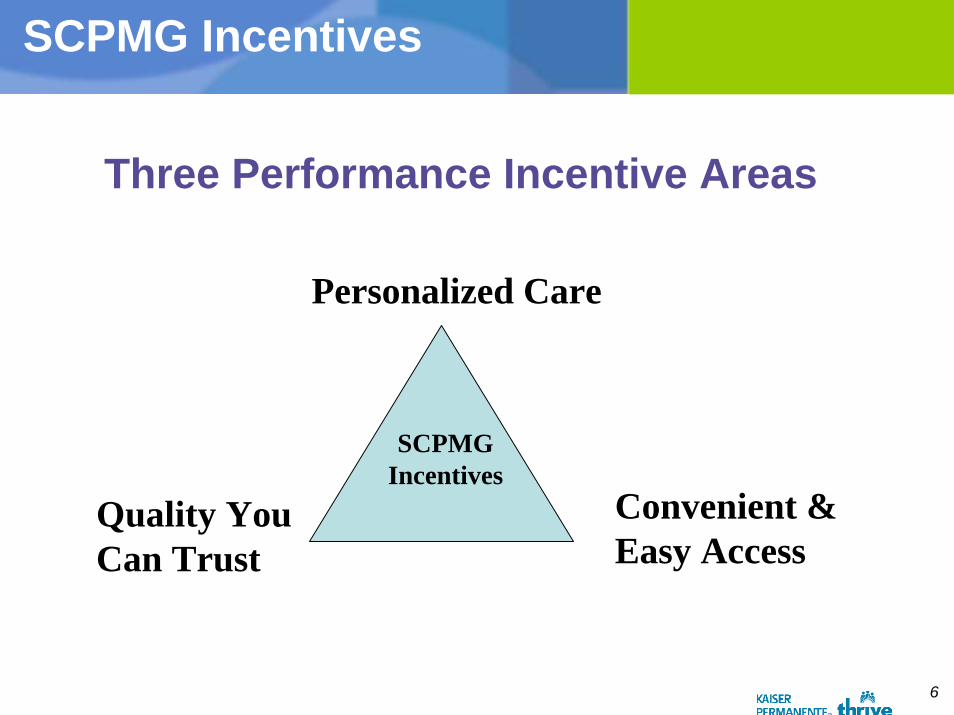
Three Performance Incentive Areas
Personalized Care
Convenient & Easy Access
Quality You Can Trust
SCPMG Incentives
7
SCPMG Incentives
– Caring with a personal touch– Satisfaction surveys
» MAPPS» ASQ
– Quality you can trust
– Convenient and easy access
8
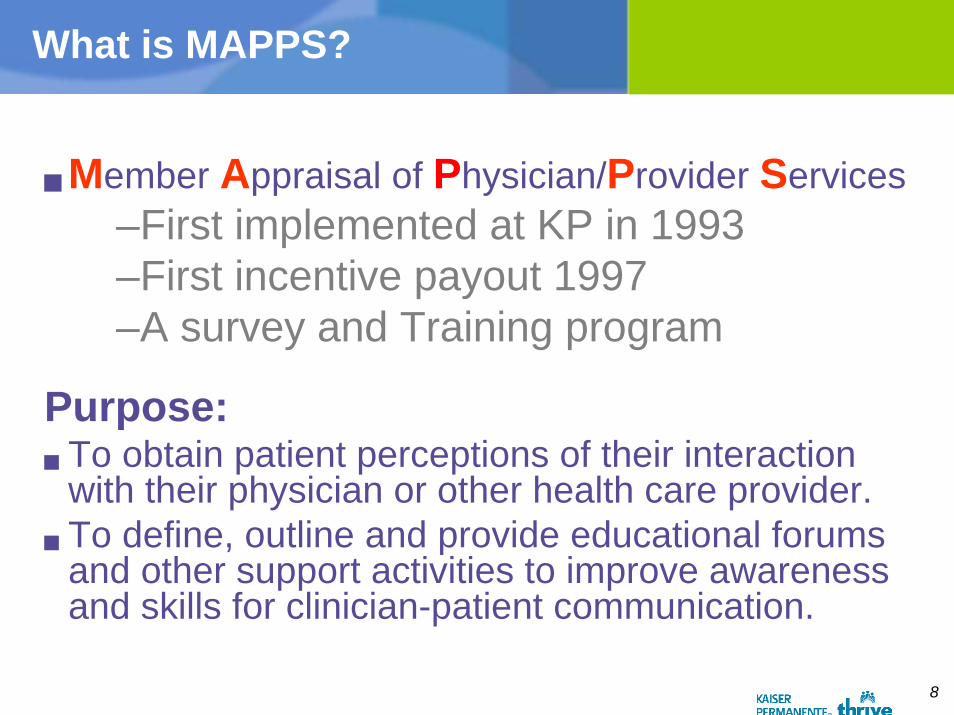
What is MAPPS?
Member Appraisal of Physician/Provider Services–First implemented at KP in 1993–First incentive payout 1997–A survey and Training program
Purpose:To obtain patient perceptions of their interaction with their physician or other health care provider.To define, outline and provide educational forums and other support activities to improve awareness and skills for clinician-patient communication.
9
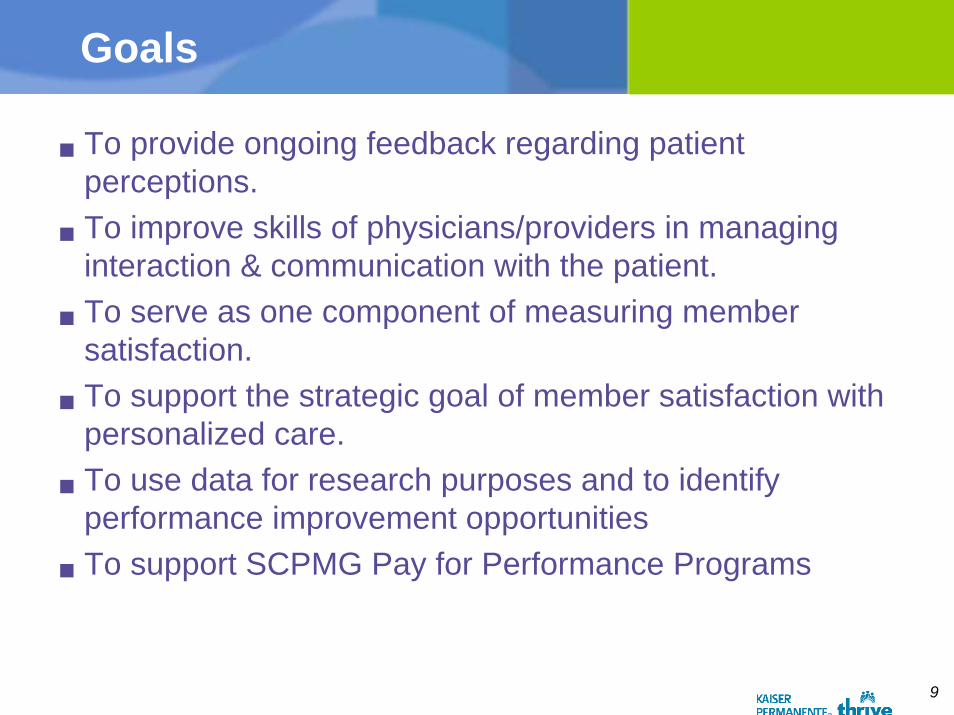
Goals
To provide ongoing feedback regarding patient perceptions.To improve skills of physicians/providers in managing interaction & communication with the patient.To serve as one component of measuring member satisfaction.To support the strategic goal of member satisfaction with personalized care.To use data for research purposes and to identify performance improvement opportunitiesTo support SCPMG Pay for Performance Programs
10
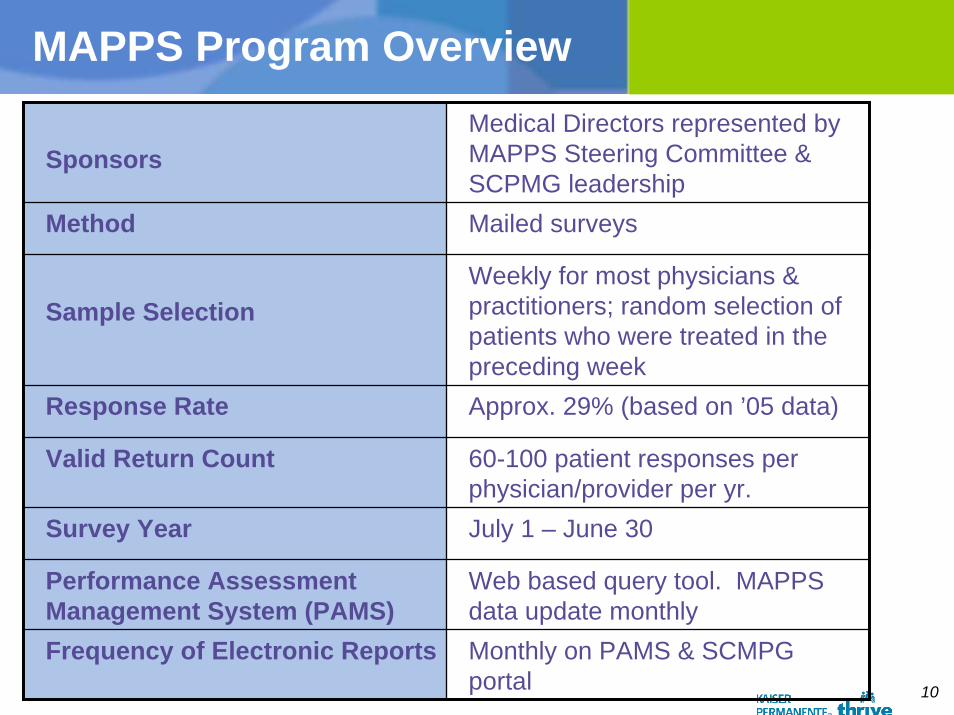
MAPPS Program Overview
SponsorsMedical Directors represented by MAPPS Steering Committee & SCPMG leadership
Method Mailed surveys
Sample SelectionWeekly for most physicians & practitioners; random selection of patients who were treated in the preceding week
Response Rate Approx. 29% (based on ’05 data)
Valid Return Count 60-100 patient responses per physician/provider per yr.
Survey Year July 1 – June 30
Performance Assessment Management System (PAMS)
Web based query tool. MAPPS data update monthly
Frequency of Electronic Reports Monthly on PAMS & SCMPG portal
11
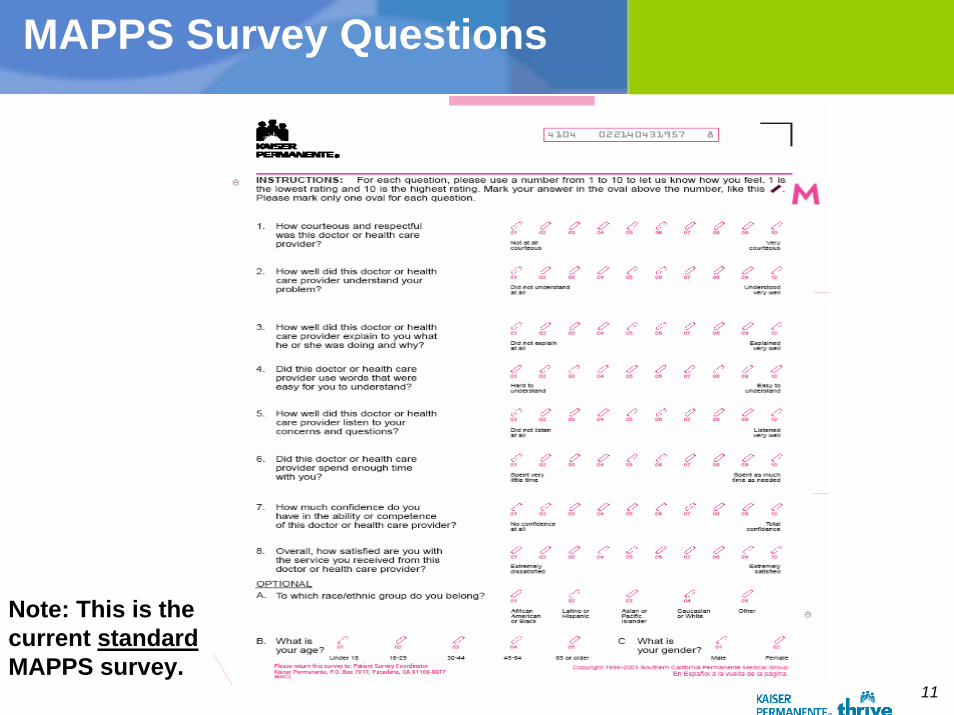
MAPPS Survey Questions
Note: This is thecurrent standardMAPPS survey.
12
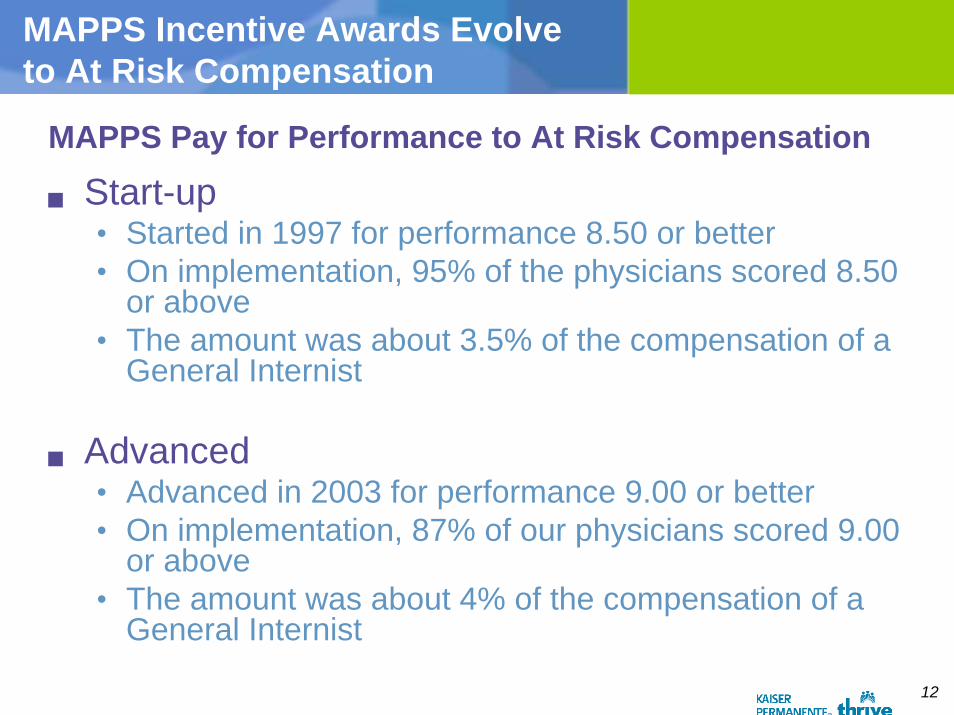
MAPPS Incentive Awards Evolve to At Risk Compensation
MAPPS Pay for Performance to At Risk Compensation
Start-up• Started in 1997 for performance 8.50 or better• On implementation, 95% of the physicians scored 8.50
or above• The amount was about 3.5% of the compensation of a
General Internist
Advanced• Advanced in 2003 for performance 9.00 or better• On implementation, 87% of our physicians scored 9.00
or above• The amount was about 4% of the compensation of a
General Internist
13
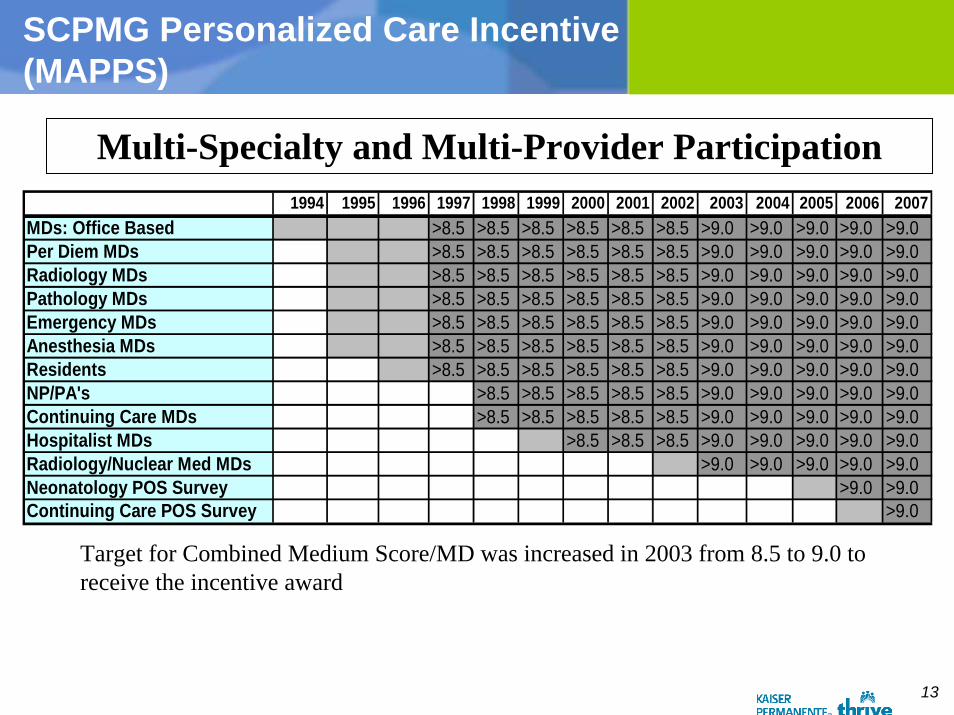
SCPMG Personalized Care Incentive(MAPPS)
Multi-Specialty and Multi-Provider Participation1994 1995 1996 1997 1998 1999 2000 2001 2002 2003 2004 2005 2006 2007
MDs: Office Based >8.5 >8.5 >8.5 >8.5 >8.5 >8.5 >9.0 >9.0 >9.0 >9.0 >9.0Per Diem MDs >8.5 >8.5 >8.5 >8.5 >8.5 >8.5 >9.0 >9.0 >9.0 >9.0 >9.0Radiology MDs >8.5 >8.5 >8.5 >8.5 >8.5 >8.5 >9.0 >9.0 >9.0 >9.0 >9.0Pathology MDs >8.5 >8.5 >8.5 >8.5 >8.5 >8.5 >9.0 >9.0 >9.0 >9.0 >9.0Emergency MDs >8.5 >8.5 >8.5 >8.5 >8.5 >8.5 >9.0 >9.0 >9.0 >9.0 >9.0Anesthesia MDs >8.5 >8.5 >8.5 >8.5 >8.5 >8.5 >9.0 >9.0 >9.0 >9.0 >9.0Residents >8.5 >8.5 >8.5 >8.5 >8.5 >8.5 >9.0 >9.0 >9.0 >9.0 >9.0NP/PA's >8.5 >8.5 >8.5 >8.5 >8.5 >9.0 >9.0 >9.0 >9.0 >9.0Continuing Care MDs >8.5 >8.5 >8.5 >8.5 >8.5 >9.0 >9.0 >9.0 >9.0 >9.0Hospitalist MDs >8.5 >8.5 >8.5 >9.0 >9.0 >9.0 >9.0 >9.0Radiology/Nuclear Med MDs >9.0 >9.0 >9.0 >9.0 >9.0Neonatology POS Survey >9.0 >9.0Continuing Care POS Survey >9.0
Target for Combined Medium Score/MD was increased in 2003 from 8.5 to 9.0 to receive the incentive award
14
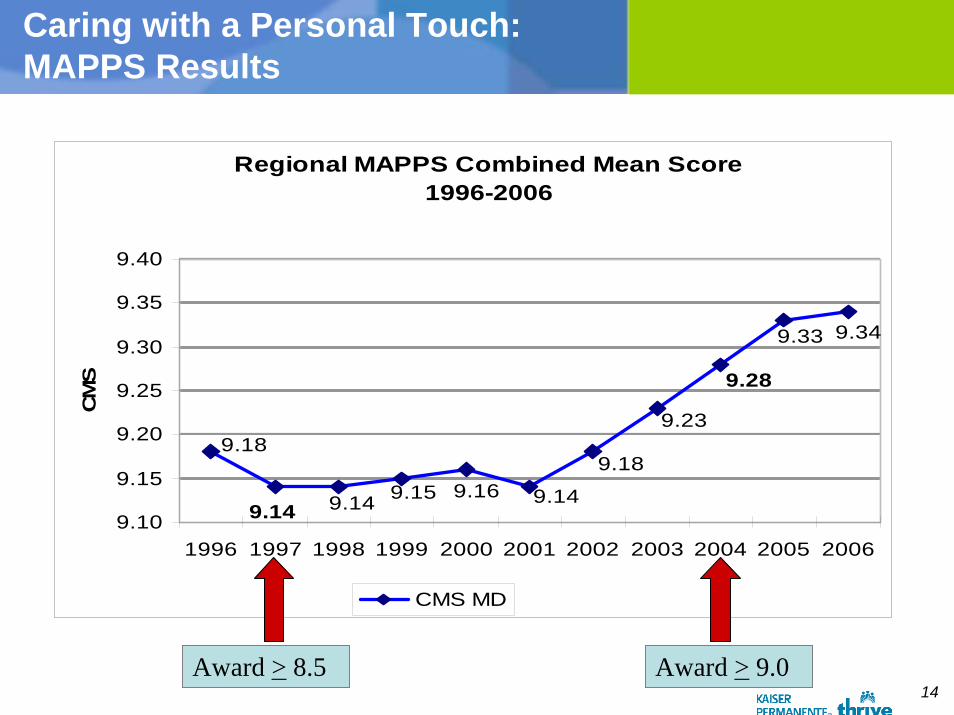
Caring with a Personal Touch:MAPPS Results
Regional MAPPS Combined Mean Score1996-2006
9.349.33
9.28
9.23
9.18
9.149.169.159.149.14
9.18
9.10
9.15
9.20
9.25
9.30
9.35
9.40
1996 1997 1998 1999 2000 2001 2002 2003 2004 2005 2006
CM
S
CMS MD
Award > 8.5 Award > 9.0
15
MAPPS Educational Support for Physicians
Appointment With Success • Required for all Associate Physicians
Conversations at the end of life
Care for the Caregiver
Beyond Appointment with Success
Video Coaching for Clinician Patient Communication
16
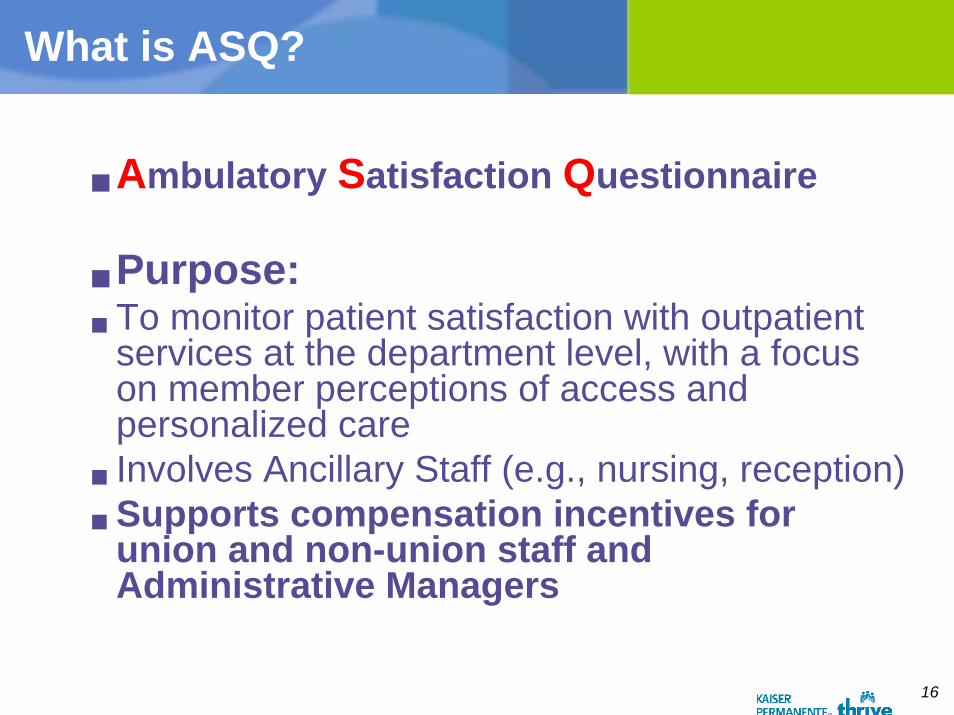
What is ASQ?
Ambulatory Satisfaction Questionnaire
Purpose:To monitor patient satisfaction with outpatient services at the department level, with a focus on member perceptions of access and personalized careInvolves Ancillary Staff (e.g., nursing, reception)Supports compensation incentives for union and non-union staff and Administrative Managers
17
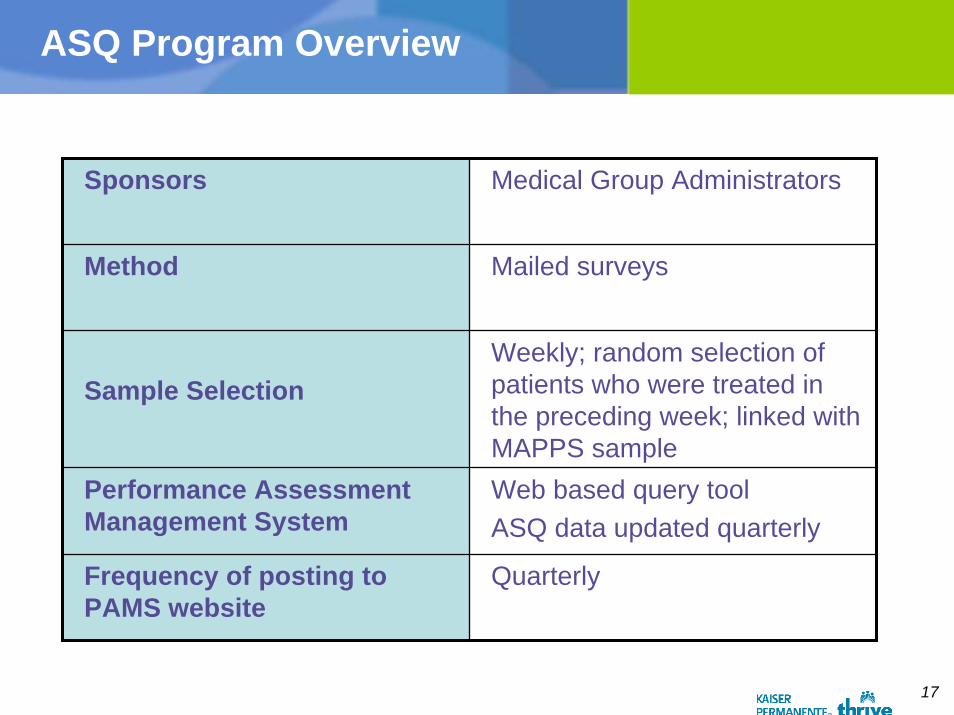
ASQ Program Overview
Sponsors Medical Group Administrators
Method Mailed surveys
Sample SelectionWeekly; random selection of patients who were treated in the preceding week; linked with MAPPS sample
Performance Assessment Management System
Web based query toolASQ data updated quarterly
Frequency of posting to PAMS website
Quarterly

18
Note: This is thecurrent standardASQ survey.
Q2: MD Access Metric
ASQ Survey Questions

19
SCPMG Incentives
– Caring with a personal touch
– Quality you can trust
– Convenient and easy access
20
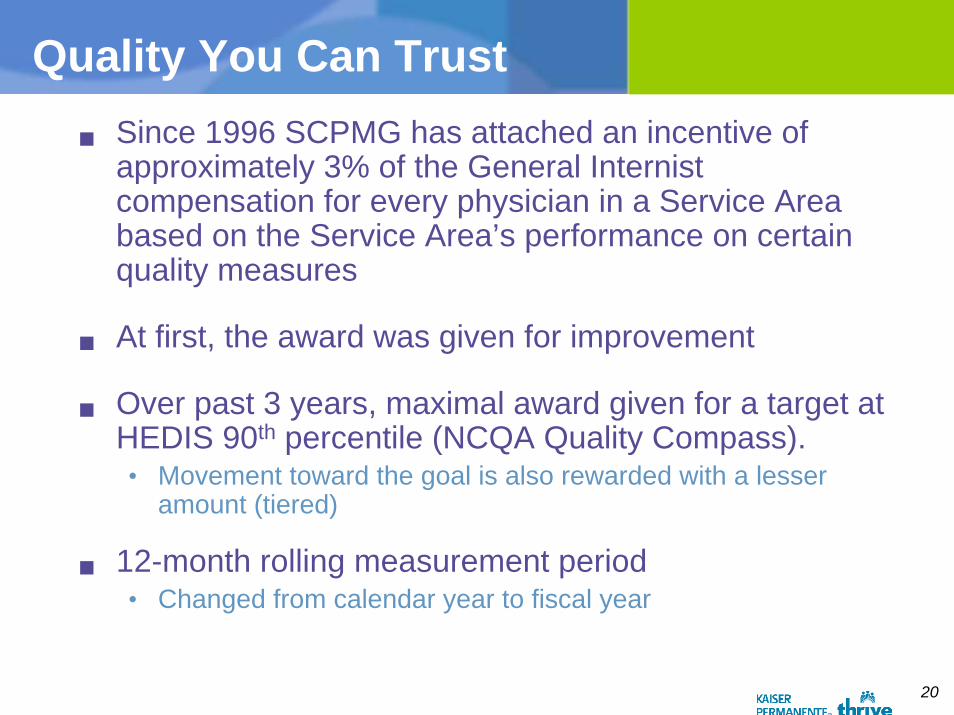
Quality You Can TrustSince 1996 SCPMG has attached an incentive of approximately 3% of the General Internist compensation for every physician in a Service Area based on the Service Area’s performance on certain quality measures
At first, the award was given for improvement
Over past 3 years, maximal award given for a target at HEDIS 90th percentile (NCQA Quality Compass).• Movement toward the goal is also rewarded with a lesser
amount (tiered)
12-month rolling measurement period• Changed from calendar year to fiscal year
21
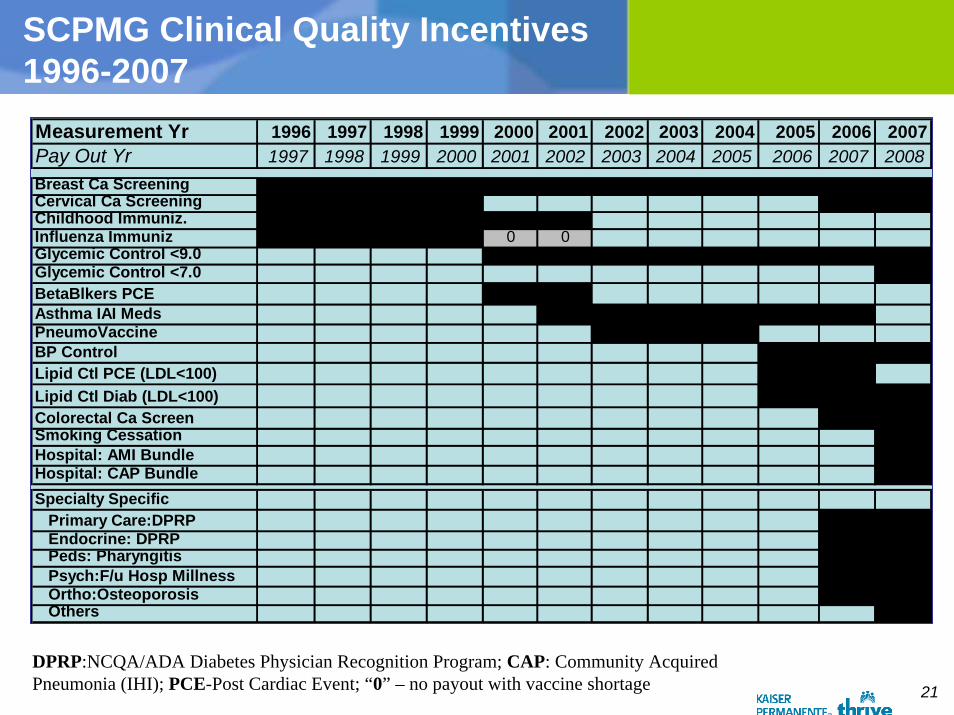
SCPMG Clinical Quality Incentives1996-2007
Measurement Yr 1996 1997 1998 1999 2000 2001 2002 2003 2004 2005 2006 2007Pay Out Yr 1997 1998 1999 2000 2001 2002 2003 2004 2005 2006 2007 2008Breast Ca ScreeningCervical Ca ScreeningChildhood Immuniz.Influenza Immuniz 0 0Glycemic Control <9.0Glycemic Control <7.0BetaBlkers PCEAsthma IAI MedsPneumoVaccineBP ControlLipid Ctl PCE (LDL<100)Lipid Ctl Diab (LDL<100)Colorectal Ca ScreenSmoking CessationHospital: AMI BundleHospital: CAP BundleSpecialty Specific Primary Care:DPRP Endocrine: DPRP Peds: Pharyngitis Psych:F/u Hosp Millness Ortho:Osteoporosis Others
DPRP:NCQA/ADA Diabetes Physician Recognition Program; CAP: Community Acquired Pneumonia (IHI); PCE-Post Cardiac Event; “0” – no payout with vaccine shortage
22
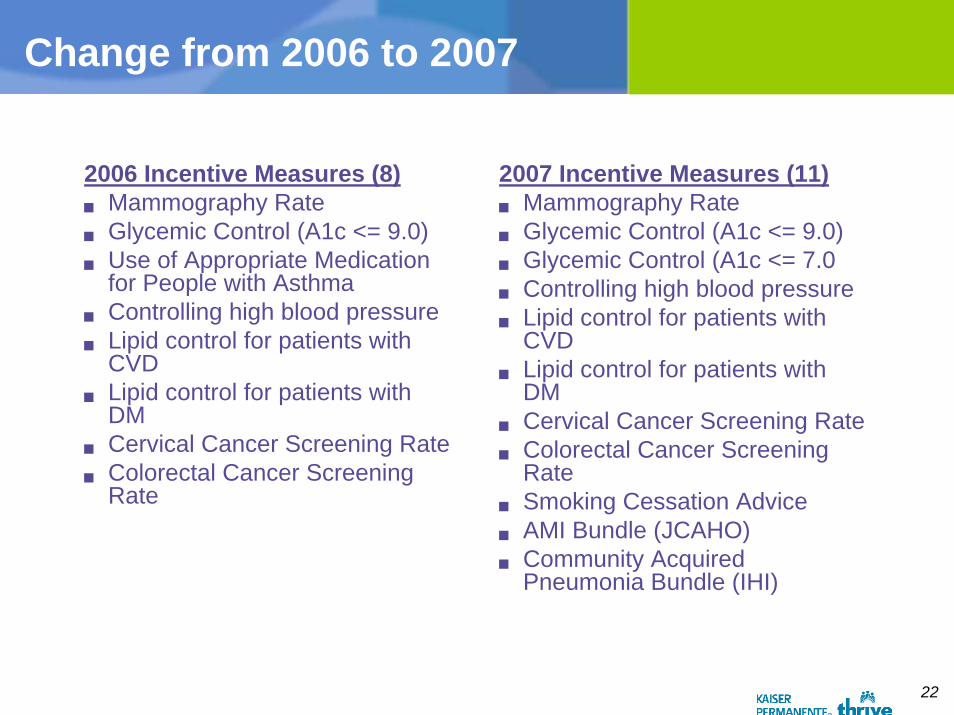
Change from 2006 to 2007
2006 Incentive Measures (8)Mammography RateGlycemic Control (A1c <= 9.0)Use of Appropriate Medication for People with AsthmaControlling high blood pressureLipid control for patients with CVDLipid control for patients with DMCervical Cancer Screening RateColorectal Cancer Screening Rate
2007 Incentive Measures (11)Mammography RateGlycemic Control (A1c <= 9.0)Glycemic Control (A1c <= 7.0Controlling high blood pressureLipid control for patients with CVDLipid control for patients with DMCervical Cancer Screening RateColorectal Cancer Screening Rate Smoking Cessation AdviceAMI Bundle (JCAHO)Community Acquired Pneumonia Bundle (IHI)
23
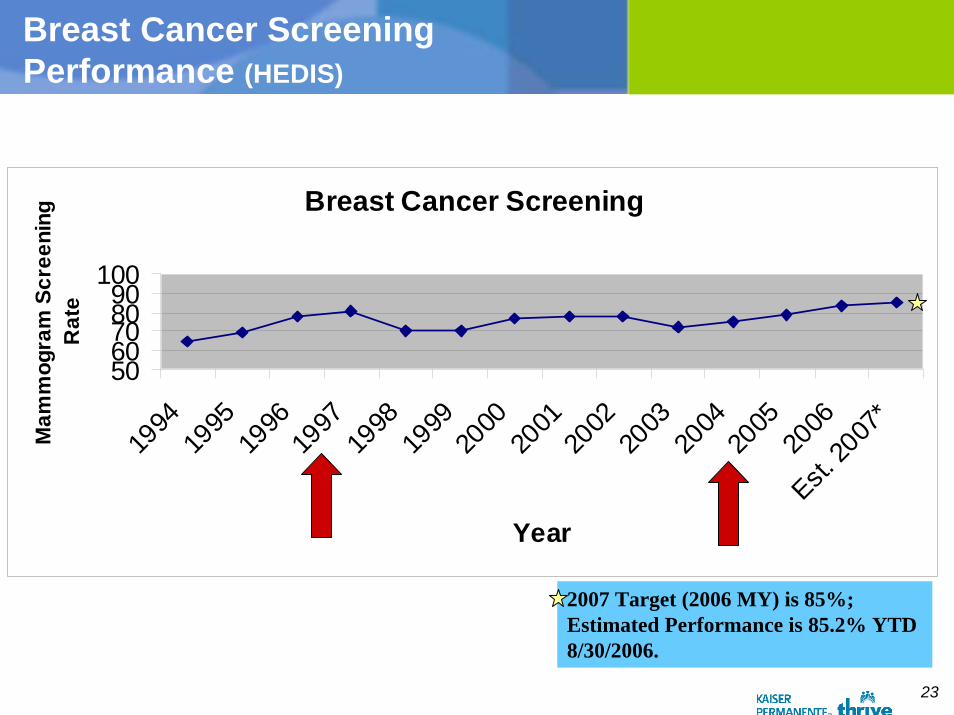
Breast Cancer Screening Performance (HEDIS)
Breast Cancer Screening
5060708090
100
1994
1995
1996
1997
1998
1999
2000
2001
2002
2003
2004
2005
2006
Est. 20
07*
Year
Mam
mog
ram
Scr
eeni
ng
Rat
e
2007 Target (2006 MY) is 85%; Estimated Performance is 85.2% YTD 8/30/2006.
24
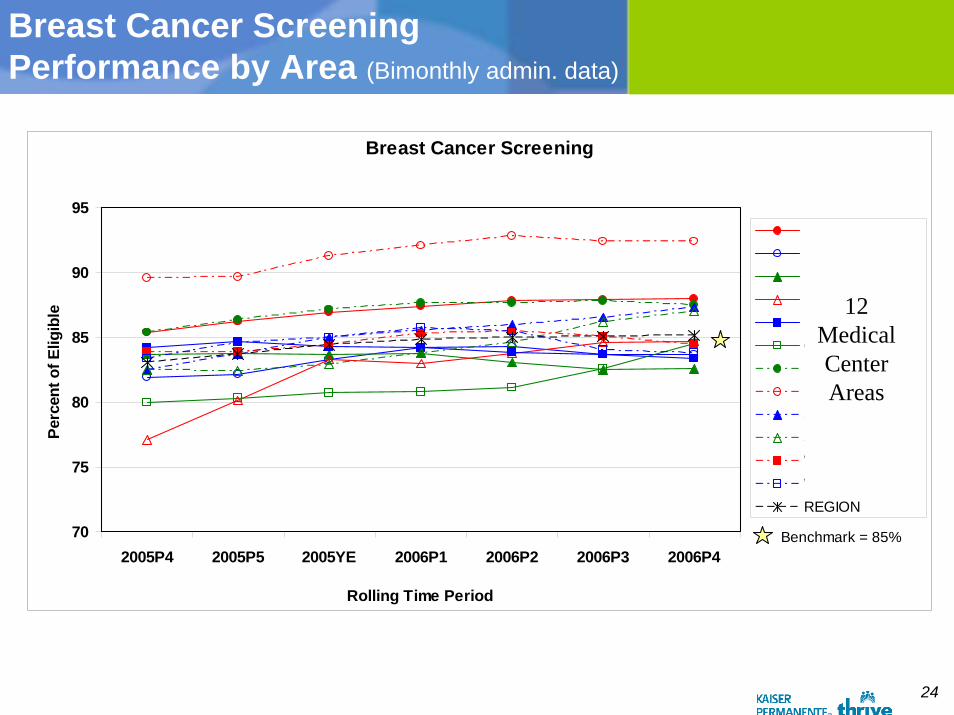
Breast Cancer Screening Performance by Area (Bimonthly admin. data)
Breast Cancer Screening
70
75
80
85
90
95
2005P4 2005P5 2005YE 2006P1 2006P2 2006P3 2006P4
Rolling Time Period
Perc
ent o
f Elig
ible
Baldwin ParkBellflowerFontanaKern CountyLos AngelesOrange CountyPanorama CityRiversideSan DiegoSouth BayWest Los AngelesWoodland HillsREGION
Benchmark = 85%
12 Medical Center Areas
25
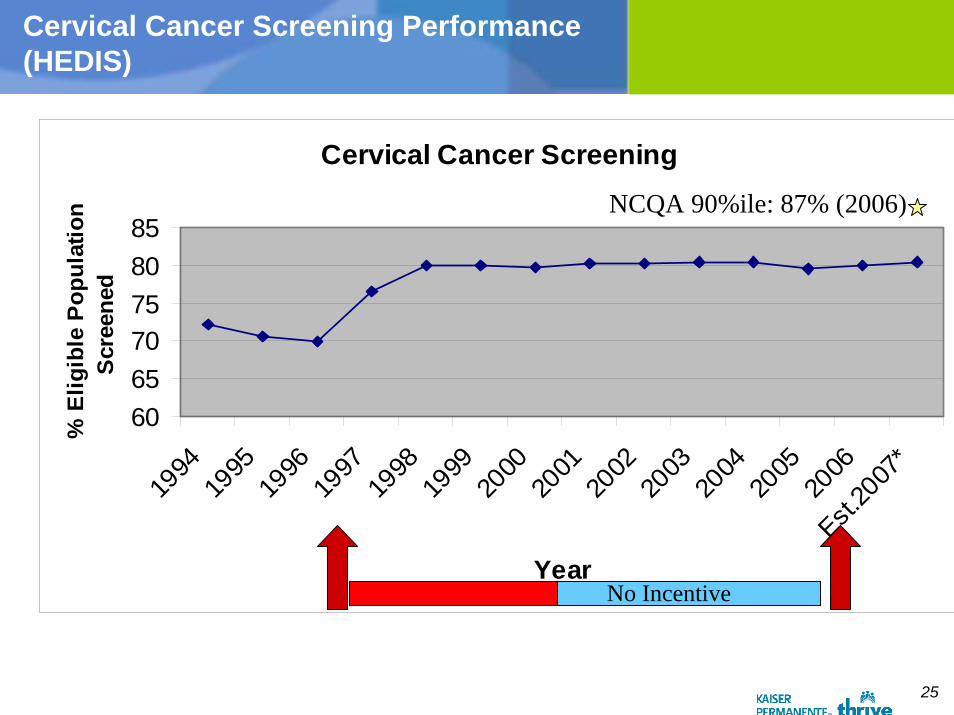
Cervical Cancer Screening Performance (HEDIS)
Cervical Cancer Screening
606570758085
1994
1995
1996
1997
1998
1999
2000
2001
2002
2003
2004
2005
2006
Est.20
07*
Year
% E
ligib
le P
opul
atio
n Sc
reen
ed
No Incentive
NCQA 90%ile: 87% (2006)

26
Hypertension Control Performance (Bimonthly admin data)
Controlling High Blood Pressure
53.5 54.356.4
58.760.8 61.1
64 65.567.2
69.771.8
4045505560657075
2004YE
2005P1
2005P2
2005P3
2005P4
2005P5
2005YE
2006P1
2006P2
2006P3
2006P4
Rolling 12 mos Time Periods
% E
ligib
le H
TN P
ts w
ith B
P <
140/
90
2006 Target is 75%
27
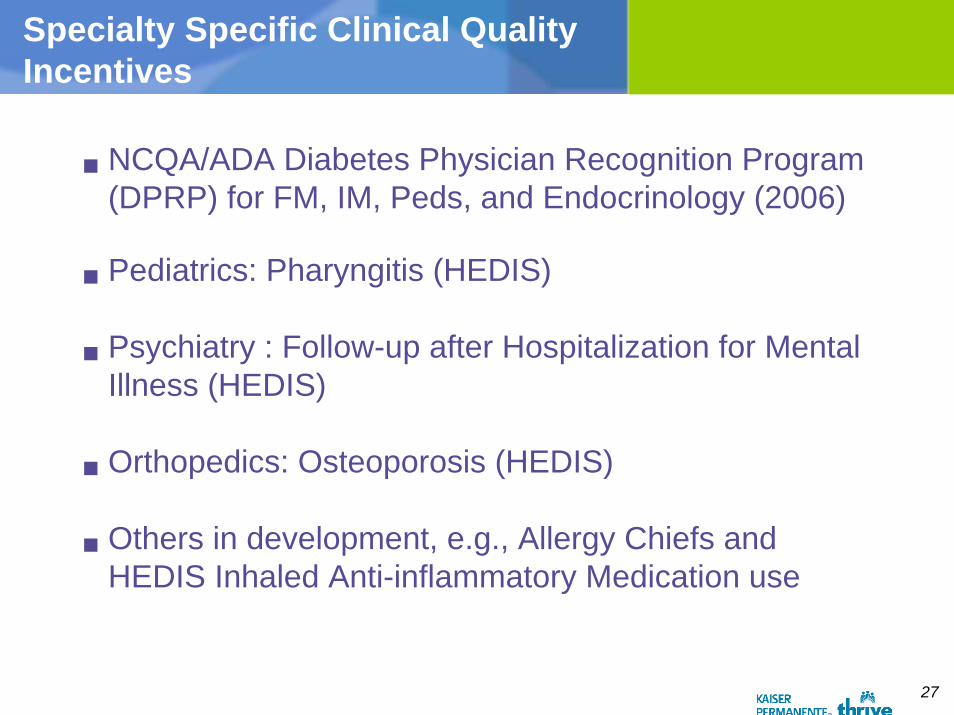
Specialty Specific Clinical Quality Incentives
NCQA/ADA Diabetes Physician Recognition Program (DPRP) for FM, IM, Peds, and Endocrinology (2006)
Pediatrics: Pharyngitis (HEDIS)
Psychiatry : Follow-up after Hospitalization for Mental Illness (HEDIS)
Orthopedics: Osteoporosis (HEDIS)
Others in development, e.g., Allergy Chiefs and HEDIS Inhaled Anti-inflammatory Medication use
28
SCPMG Incentives
– Caring with a personal touch
– Quality you can trust
– Convenient and easy access
29
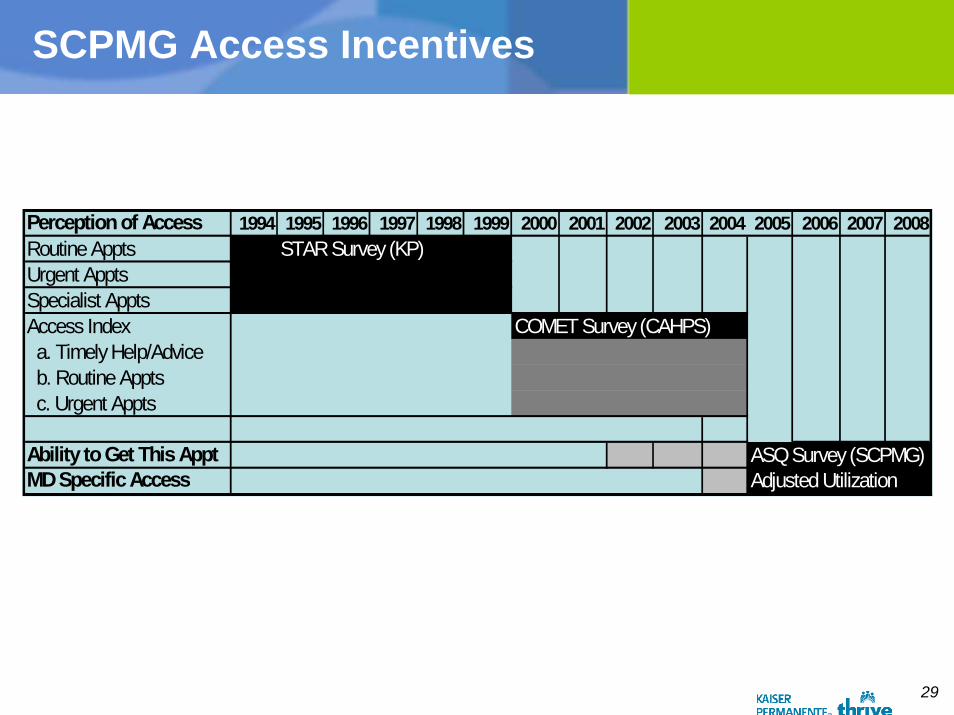
SCPMG Access Incentives
Perception of Access 1994 1995 1996 1997 1998 1999 2000 2001 2002 2003 2004 2005 2006 2007 2008Routine Appts STAR Survey (KP)Urgent ApptsSpecialist ApptsAccess Index COMET Survey (CAHPS) a. Timely Help/Advice b. Routine Appts c. Urgent Appts
Ability to Get This Appt ASQ Survey (SCPMG)MD Specific Access Adjusted Utilization
30
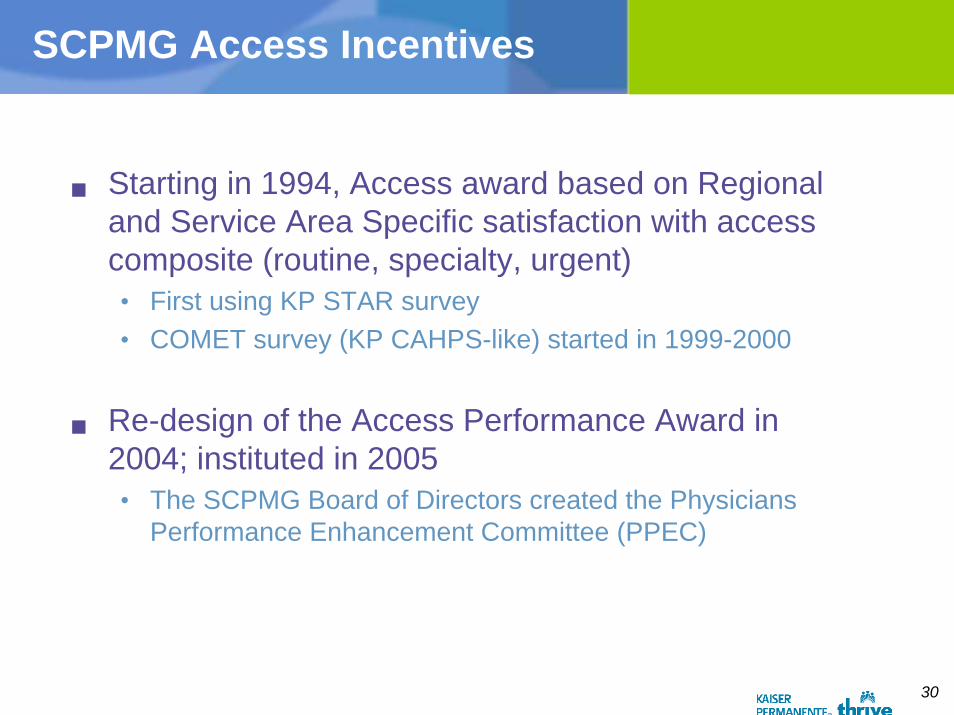
SCPMG Access Incentives
Starting in 1994, Access award based on Regional and Service Area Specific satisfaction with access composite (routine, specialty, urgent)• First using KP STAR survey• COMET survey (KP CAHPS-like) started in 1999-2000
Re-design of the Access Performance Award in 2004; instituted in 2005• The SCPMG Board of Directors created the Physicians
Performance Enhancement Committee (PPEC)
31
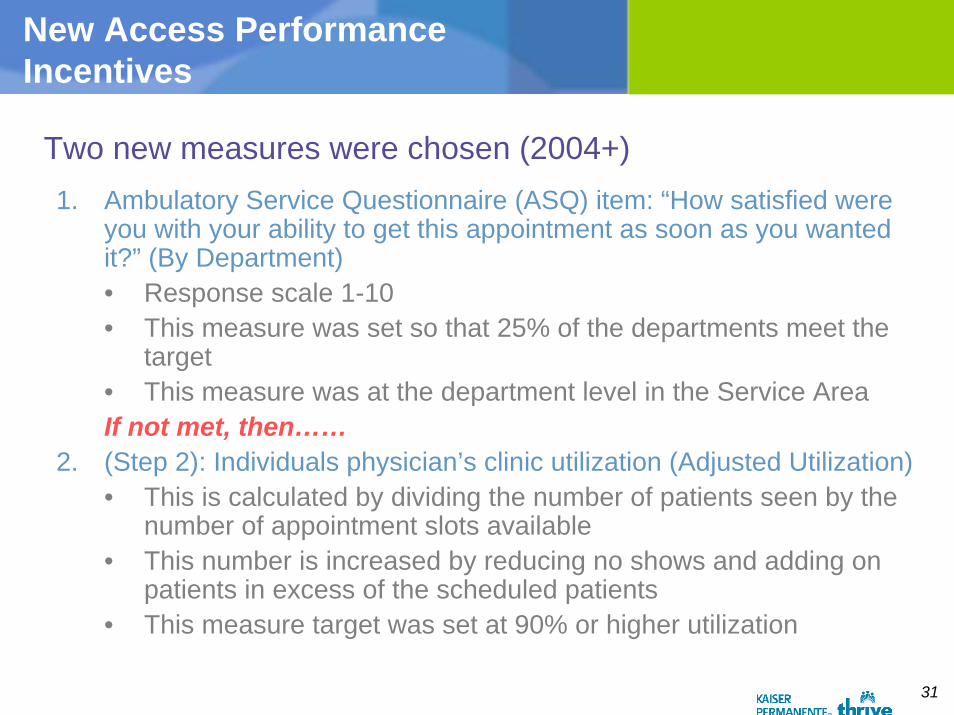
New Access Performance Incentives
Two new measures were chosen (2004+)1. Ambulatory Service Questionnaire (ASQ) item: “How satisfied were
you with your ability to get this appointment as soon as you wanted it?” (By Department)• Response scale 1-10• This measure was set so that 25% of the departments meet the
target• This measure was at the department level in the Service AreaIf not met, then……
2. (Step 2): Individuals physician’s clinic utilization (Adjusted Utilization)• This is calculated by dividing the number of patients seen by the
number of appointment slots available• This number is increased by reducing no shows and adding on
patients in excess of the scheduled patients• This measure target was set at 90% or higher utilization
32
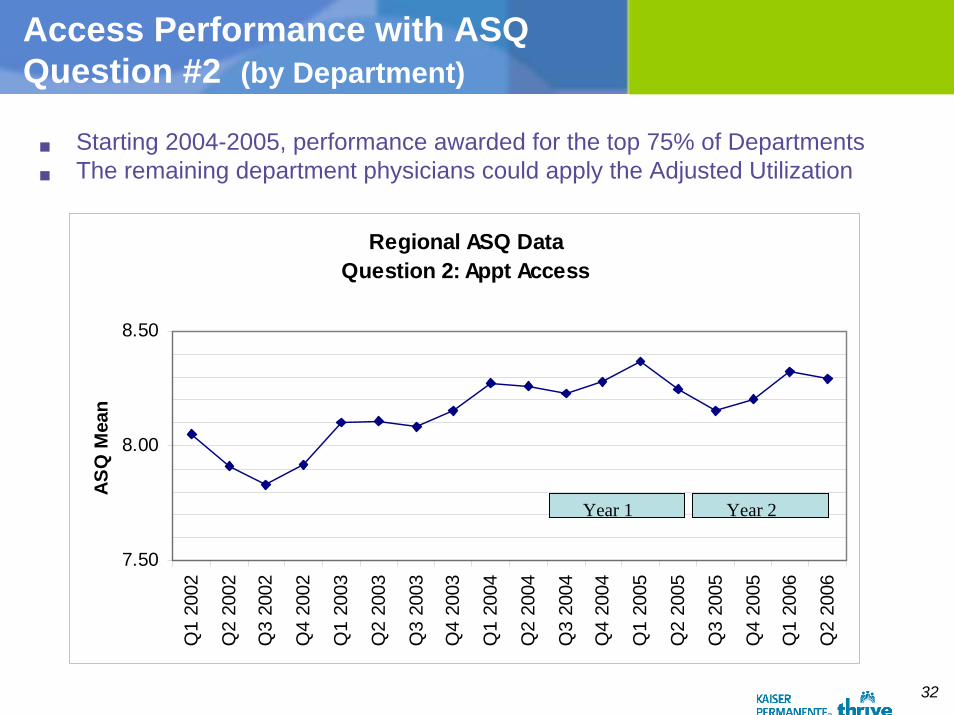
Access Performance with ASQ Question #2 (by Department)
Starting 2004-2005, performance awarded for the top 75% of DepartmentsThe remaining department physicians could apply the Adjusted Utilization
Regional ASQ DataQuestion 2: Appt Access
7.50
8.00
8.50
Q1
2002
Q2
2002
Q3
2002
Q4
2002
Q1
2003
Q2
2003
Q3
2003
Q4
2003
Q1
2004
Q2
2004
Q3
2004
Q4
2004
Q1
2005
Q2
2005
Q3
2005
Q4
2005
Q1
2006
Q2
2006
ASQ
Mea
n
Year 1 Year 2
33
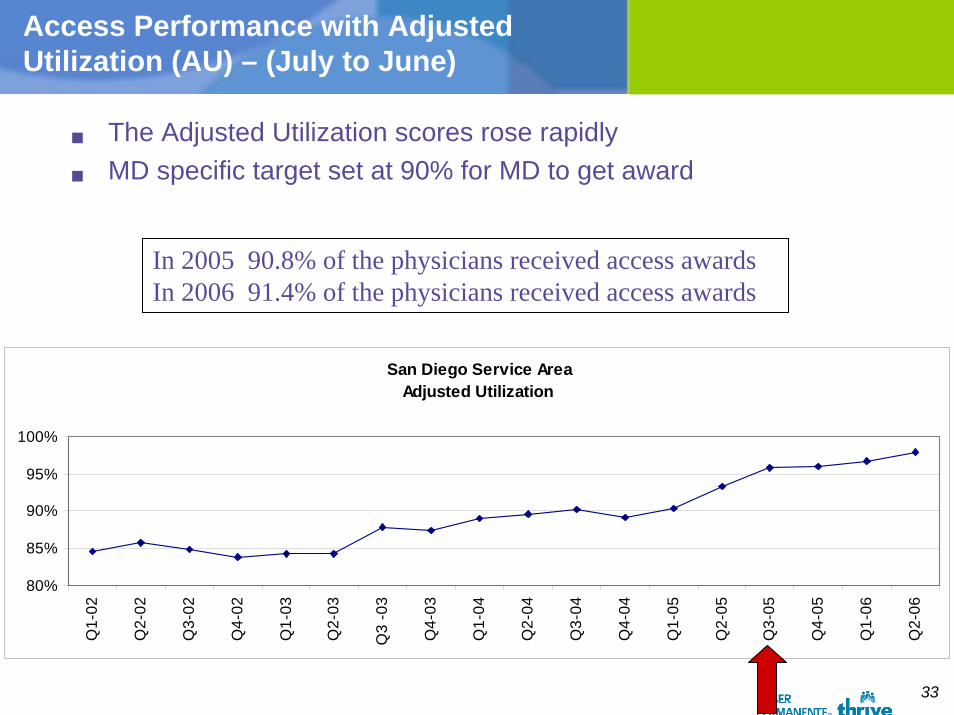
Access Performance with Adjusted Utilization (AU) – (July to June)
The Adjusted Utilization scores rose rapidlyMD specific target set at 90% for MD to get award
In 2005 90.8% of the physicians received access awardsIn 2006 91.4% of the physicians received access awards
San Diego Service AreaAdjusted Utilization
80%
85%
90%
95%
100%
Q1-
02
Q2-
02
Q3-
02
Q4-
02
Q1-
03
Q2-
03
Q3
-03
Q4-
03
Q1-
04
Q2-
04
Q3-
04
Q4-
04
Q1-
05
Q2-
05
Q3-
05
Q4-
05
Q1-
06
Q2-
06
34
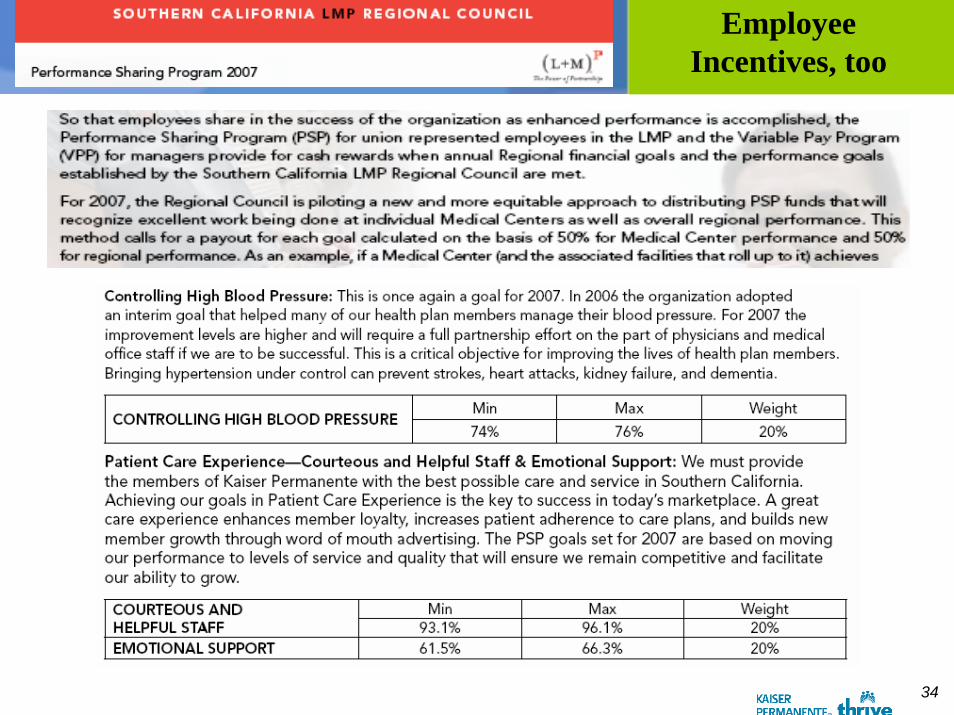
Employee Incentives, too
35
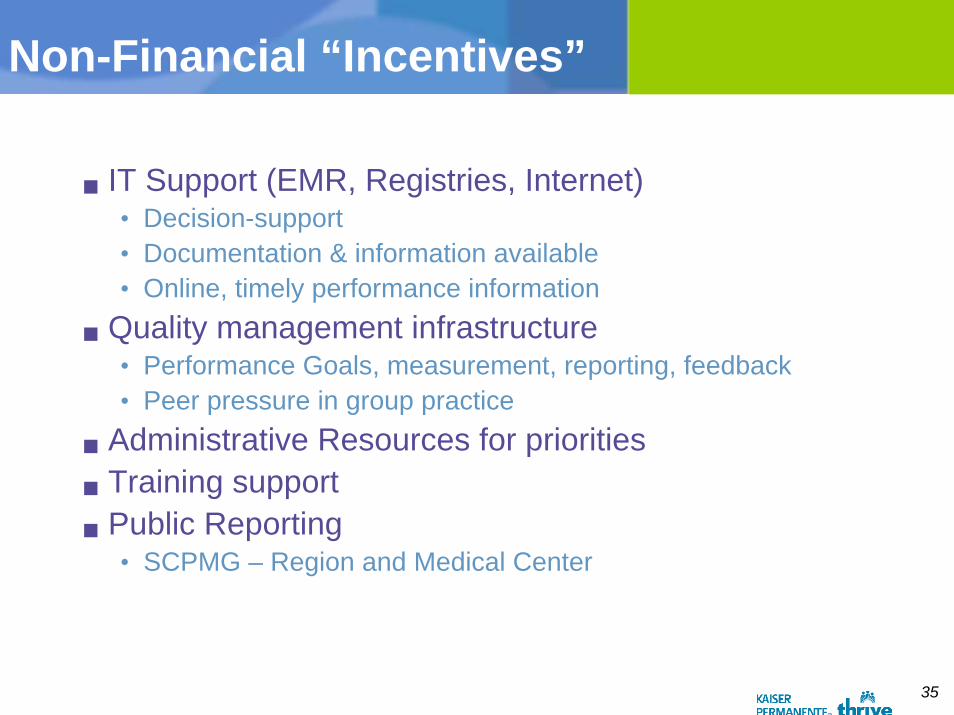
Non-Financial “Incentives”
IT Support (EMR, Registries, Internet)• Decision-support• Documentation & information available• Online, timely performance information
Quality management infrastructure• Performance Goals, measurement, reporting, feedback• Peer pressure in group practice
Administrative Resources for prioritiesTraining supportPublic Reporting• SCPMG – Region and Medical Center
36
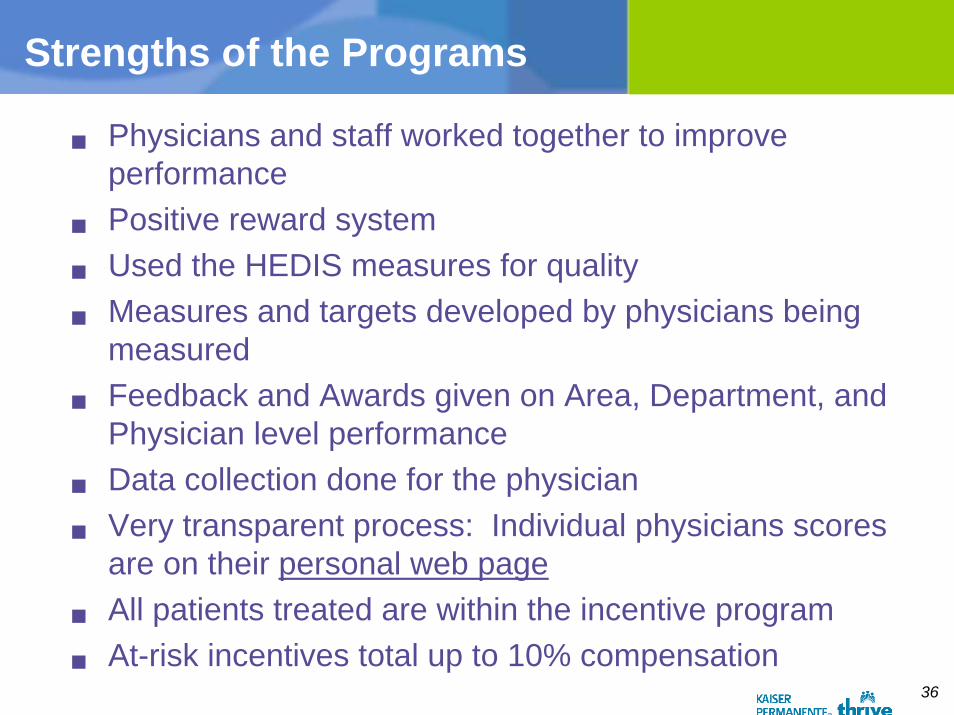
Strengths of the Programs
Physicians and staff worked together to improve performancePositive reward systemUsed the HEDIS measures for quality Measures and targets developed by physicians being measuredFeedback and Awards given on Area, Department, and Physician level performanceData collection done for the physicianVery transparent process: Individual physicians scores are on their personal web pageAll patients treated are within the incentive programAt-risk incentives total up to 10% compensation
37
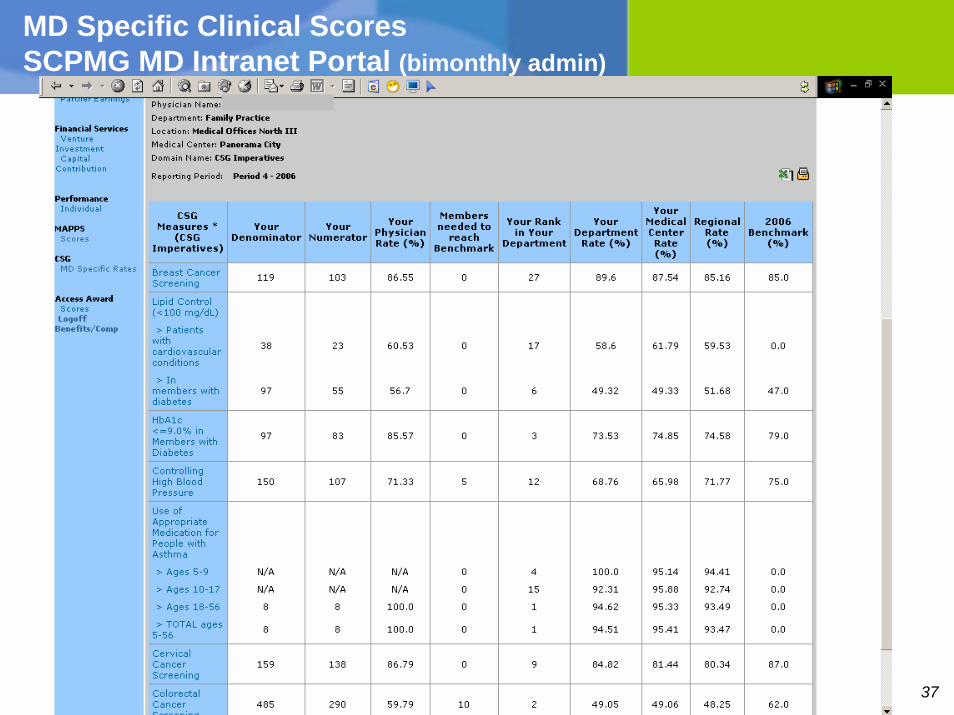
MD Specific Clinical Scores SCPMG MD Intranet Portal (bimonthly admin)
38
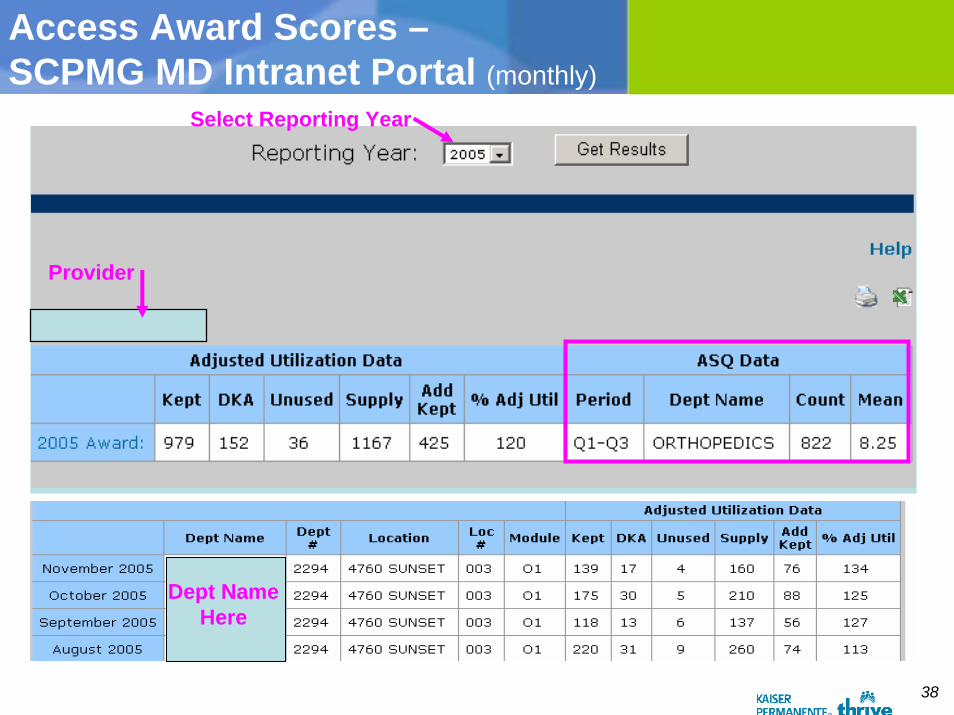
Access Award Scores –SCPMG MD Intranet Portal (monthly)
Select Reporting Year
Provider
Dept NameHere
39
Issues with P4P
Measurement burdenDoes it work?Competing measures and specifications
40
Summary/Conclusions
SCPMG with P4P since 1994• Access, Care Experience, and Clinical Quality
Primary Care and Specialty Care (MD and NP/PA)Ancillary staff incentives alignedEvolution & Change (1994-2007)• Metrics• Level of incentives (Region, Area, Dept., clinician)• Ambulatory and Hospital clinical and service metrics• “Bonus” to At-risk compensation
Rewards Performance and ImprovementGoing public through IHA and OPA• Issues involved