Embed Size (px)
Citation preview
The Park Place Economist The Park Place Economist
Volume 25 Issue 1 Article 8
2017
Performance in Strategic Sectors: A Comparison of Profitability Performance in Strategic Sectors: A Comparison of Profitability
and Efficiency of State-Owned Enterprises and Private and Efficiency of State-Owned Enterprises and Private
Corporations Corporations
Brigitta Jakob Illinois Wesleyan University, [email protected]
Follow this and additional works at: https://digitalcommons.iwu.edu/parkplace
Recommended Citation Jakob, Brigitta (2017) "Performance in Strategic Sectors: A Comparison of Profitability and Efficiency of State-Owned Enterprises and Private Corporations," The Park Place Economist: Vol. 25 Available at: https://digitalcommons.iwu.edu/parkplace/vol25/iss1/8
This Article is protected by copyright and/or related rights. It has been brought to you by Digital Commons @ IWU with permission from the rights-holder(s). You are free to use this material in any way that is permitted by the copyright and related rights legislation that applies to your use. For other uses you need to obtain permission from the rights-holder(s) directly, unless additional rights are indicated by a Creative Commons license in the record and/ or on the work itself. This material has been accepted for inclusion by editorial board of the Park Place Economist at Illinois Wesleyan University. For more information, please contact [email protected]. ©Copyright is owned by the author of this document.
Performance in Strategic Sectors: A Comparison of Profitability and Efficiency of Performance in Strategic Sectors: A Comparison of Profitability and Efficiency of State-Owned Enterprises and Private Corporations State-Owned Enterprises and Private Corporations
Abstract Abstract State-owned enterprises (SOEs) are often claimed to be less profitable and less efficient compared to private corporations. According to Grout and Stevens (2003), SOEs were associated with different types of market failure and were mostly used to attain non-economic goals such as unemployment level reduction, control over natural resources, and political stability. Shirley and Walsh (2000), who surveyed 52 studies on the difference in performance between SOEs and private corporations, discovered that there were only five studies indicating that SOEs outperformed private corporations. However, these studies only monitored the firms in the monopolistic utility sectors. Similar situations occurred in most of the previous studies that researched correlation between performance and firm ownership. Many of them either focused heavily on industries with monopoly/oligopoly characteristics or industries with output that could not be priced by competitive forces. As a result, it was difficult to distinguish the effects of market regulations and conditions on the types of firm ownership. Since there is a correlation between competition and performance, controlling for the market structure is crucial to the proper investigation of performance across different types of ownership (Goldeng, Grunfeld, & Benito, 2008). Since my research is focusing on the difference in performance between SOEs and private corporations within a competitive environment, it contributes to the very few studies that controlled for the market structure. My main research question is whether private corporations perform better compared to SOEs in terms of profitability and efficiency in the strategic sectors in a competitive environment. My hypothesis is that due to the soft-budget constraint behavior and policy burdens imposed by the state, SOEs are less efficient and have lower profitability compared to private corporations.
This article is available in The Park Place Economist: https://digitalcommons.iwu.edu/parkplace/vol25/iss1/8
The Park Place Economist, Volume XXV 9
Performance in Strategic Sectors: A Comparison of Profitability
and Efficiency of State-Owned Enterprises and Private
Corporations
Brigitta Jakob
I. Introduction
State-owned enterprises (SOEs) are often claimed to be less profitable and less efficient
compared to private corporations. According to Grout and Stevens (2003), SOEs were associated
with different types of market failure and were mostly used to attain non-economic goals such as
unemployment level reduction, control over natural resources, and political stability. Shirley and
Walsh (2000), who surveyed 52 studies on the difference in performance between SOEs and
private corporations, discovered that there were only five studies indicating that SOEs
outperformed private corporations. However, these studies only monitored the firms in the
monopolistic utility sectors. Similar situations occurred in most of the previous studies that
researched correlation between performance and firm ownership. Many of them either focused
heavily on industries with monopoly/oligopoly characteristics or industries with output that could
not be priced by competitive forces. As a result, it was difficult to distinguish the effects of market
regulations and conditions on the types of firm ownership. Since there is a correlation between
competition and performance, controlling for the market structure is crucial to the proper
investigation of performance across different types of ownership (Goldeng, Grunfeld, & Benito,
2008).
Since my research is focusing on the difference in performance between SOEs and private
corporations within a competitive environment, it contributes to the very few studies that
controlled for the market structure. My main research question is whether private corporations
perform better compared to SOEs in terms of profitability and efficiency in the strategic sectors in
a competitive environment. My hypothesis is that due to the soft-budget constraint behavior and
policy burdens imposed by the state, SOEs are less efficient and have lower profitability compared
to private corporations.
II. Theoretical Framework and Empirical Studies
II.A Theoretical Framework
II.A.1 Difference between SOEs and Private Corporations SOEs are typically sizeable firms in a dominant sector in an economy. In most of the
developing countries, state ownership is geared towards strategic sectors — either sectors that are
crucial for economic development or that control natural resources of a country (Shleifer, 1998).
There are a number of key differences between state and private ownerships in terms of objectives,
financing, liquidation, management, and compensation. The main objective of private ownership
is to maximize profits for the capitalists who own the corporation. Meanwhile, the ultimate goal
for SOEs is to balance the interests of the stakeholders, including protecting jobs and preventing
social unrests. Lastly, government can act as a backup that provides subsidies to the SOEs when
their sources of revenue fall short of covering costs (Grout and Stevens, 2003).
When it comes to the liquidation of the firm, private ownership will have to declare
bankruptcy or to be acquired when it becomes insolvent. The exit of SOEs will have to be
Jakob
10 The Park Place Economist, Volume XXV
determined by the government — firms that are perceived as ‘too big to fail’ will be bailed out by
taxpayers’ money (Peng, Bruton, Stan, and Huang, 2016). Unlike management of private
corporations who usually have complete autonomy in any key decisions, management of SOEs
only has autonomy in aligning operational strategies, types of output, and internal policies.
Government plays a major part in other significant activities such as choosing the domain of
activities, technology investments, and establishing subsidiaries (Aharoni, 1981). Lastly,
managers’ compensation under private ownership is closely tied to the enterprise performance.
That is not the case for managers in state ownership as their compensation is determined politically
(Peng, Bruton, Stan, and Huang, 2016). Compared to private corporations, SOEs have a number
of advantages including state subsidies, exclusive government contracts, low-interest loans, tax-
breaks, and low-priced raw materials (Li, Lin, and Selover, 2014). However, there are also a
number of disadvantages associated with state ownership.
Soft-Budget Constraint According to soft-budget constraint hypothesis, the state extends various forms of support
to SOEs. As a result, this situation distorts the incentive structure because an SOE does not have
to desperately rely upon generating profit to guarantee its long-term existence or have to worry
about competition. Because a competitive environment incentivizes a management to constantly
improve their performance and to innovate, an SOE is expected to deliver inferior performance
compared to a private corporation (Goldeng, Grunfeld, and Benito, 2008). The soft cushion also
allows the SOEs to be more risk taking in terms of investing their capital and to have less incentive
to spend effectively. Because the returns from an SOE are allocated into a public budget that no
one is specifically assigned to benefit from it as a principal, incentives to closely monitor the
actions and performance of managers are significantly reduced (Stiglitz, 1988).
If managers of private corporations do not allocate their resources efficiently, the market
will conduct a course of actions including replacing the managers, retracting the capital, taking
over the company, or shutting down the company. However, the decision on what to do with SOEs
in similar situation does not fall on the market, but it is decided by the government (Stiglitz, 1988).
That is why the soft-budget constraint situation also causes the difference in skill-sets between the
managers of SOEs and private corporations. While the latter needs to be highly capable of
generating profit for the company, the former needs to be able to deal with the
government/politicians (Barberis, Boycko, Shleifer, and Tsukanova, 1996). Eventually, the soft-
budget constraint results in a number of moral hazard problems. In many cases, it impacts both the
psychology and behavior of the SOE employees to be less aggressive in controlling for costs, to
be less innovative, and to be less efficient as they don’t have to try as hard as the employees of
private corporations to ensure the survival of the firm (Li, Lin, and Selover, 2014).
Lack of Autonomy due to Policy Burdens Another reason for less-than-optimal performance by the SOEs is because they are entitled
to less autonomy as they have to help government achieve its special goals. According to Groves,
Hong, McMillan, and Naughton (1994), when a firm had more autonomy in labor decisions, profit
attainment, and output decisions, it would experience higher efficiency compared to firms that had
less autonomy in making these crucial decisions. As SOEs are owned by the government, they
might have to compromise their profit-maximizing goal in order to prioritize on other government
goals. This is because through SOEs, government plays a conflicting role as a regulator and
shareholder. As a regulator, government has a social contract with the public, hence has to serve
Jakob
The Park Place Economist, Volume XXV 11
their best interests in terms of maintaining the social order. As a shareholder however, government
has to increase the value of its investment (Chen, 2016). Hence, they are faced with multiple and
conflicting objectives. Moreover, given that these other non-financial objectives make it difficult
to measure the performance of an SOE, the incentives of SOE management is not as closely knit
to the performance of the company as to those of private corporations (Putnins, 2015).
For instance, the Chinese government is notorious for often requiring the SOEs to maintain
a surplus of employees in order to keep a low unemployment level, to provide satisfying level of
benefits to the employees, and to sell the products at a lower price to the government (Lin and Li,
2008). Even though these policies are favorable to the Chinese government, they perpetuate
inefficiency problems within the SOEs. According to research conducted by Lin and Li (2008) on
Chinese SOEs between 1995-2001, the policy burden placed on SOEs triggered soft-budget
constraint problems. As long as the SOEs helped the government carry out its goals (policy
burdens), there would be a growing perception that the government would help the SOEs when
things did not go well (soft-budget constraint).
Moreover, when different appointed public officials take office, they often have divergent
views on which public interests they should prioritize. When these differences are not reconciled,
it will be extremely hard for the employees to figure out the ultimate goals they are supposed to
achieve. When the SOE itself is struggling with internally conflicting interests and instructions,
the managers often turn to cooperative strategies in order to secure government support (Aharoni,
1981).
II.A.2 Correlation between Ownership and Efficiency According to neoclassical economic theory, efficiency is mostly affected by market and
incentive structure rather than the type of ownership. Regardless whether a firm is state-owned or
privately owned, efficiency can be achieved as long as the firm operates in a competitive market,
gives full autonomy to the management to make crucial decisions based on market signals, and
provides performance-based compensation (Nellis, 1994). In reality, the above conditions are
rarely met within SOEs, and when the criteria are fulfilled, they are not sustainable in the long run.
SOEs’ responsibility to achieve both commercial and social objectives creates inefficient use of
resources. Even though during times of crisis government often shifts its focus to a more profitable
goal and grants full-autonomy to management, the change in behavior does not last when the crisis
ends (Heracleous, 2001). The neoclassical theory is supported by a study conducted by Wortzel
and Wortzel (1989) on privatization of SOEs. They concluded that SOEs were more inefficient
compared to private corporations not because of the type of ownership, but mostly due to the lack
of clear objectives and goals focusing on efficiency, and additionally lack of organization-level
control systems to attain these goals.
Moreover, due to the perception that government is available to back them up, the
employees of SOEs may have the tendency to develop rent-seeking behavior in order to seek for
themselves more resources from the government. In addition, as they feel that their job security is
guaranteed, the employees will not have the pressure to work very hard. As a result, the
combination of rent-seeking behavior and reduced productivity will create higher burden of cost
for the SOEs, which increases potential for inefficiency (Li, Lin, and Selover, 2014). According
to Putnins (2015), the inefficiency SOEs usually encounter will either result in less output
produced given an amount of resources or more resources used to produce the same amount of
output. Individuals will be impacted through a number of channels including higher prices of the
goods relative to the case of higher efficiency, higher taxes to compensate for lower dividends,
Jakob
12 The Park Place Economist, Volume XXV
higher SOE subsidies compared to if SOEs were more efficient, and combinations of all of the
channels. Hence, the above theory suggests the hypothesis that due to the soft-budget constraint
behavior and policy burdens imposed by the state, SOEs have lower profitability and are more
inefficient compared to private corporations.
II.B Empirical Studies on SOE Performance A number of studies have shown mixed results regarding the difference in performance
between SOEs and private corporations. Boardman and Vining (1989) conducted a study on the
correlation between ownership and performance in competitive environment across the 500 largest
companies outside of the United States, as listed by the Fortune magazine in 1983. They
discovered that SOEs and mixed enterprises (MEs) had inferior performance to that of private
corporations in terms of both profitability and efficiency. For profitability, SOEs had the return on
equity (ROE) that was 12 percent less than what PCs had, and generated US$66 million less in net
income compared to private corporations. For efficiency measurement, SOEs produced 4.4 percent
less sales per employee compared to private corporations. Li, Lin, and Selover (2014) studied a
panel dataset of more than 200,000 Chinese manufacturing firms during 2000-2005 to determine
whether SOEs and private corporations performed differently in terms of their return on assets
(ROA), ROE, return on sales (ROS), labor productivity, and sales growth. They discovered that
the industrial SOEs performed worse than private corporations in terms of all of the categories
investigated. This was mainly triggered by the fact that SOEs were subject to policy burdens.
Moreover, the behavior of SOEs also demonstrated signs of soft-budget constraint, including
higher investment rates compared to private corporations, higher operating costs, and higher debt
levels.
A similar result was achieved by Goldeng, Grunfeld, and Benito (2008), who studied
differences in performance between state and private ownership with the emphasis on the impacts
of the market structure. Using ROA and cost/sales revenue to measure the performance of all
registered companies in Norway in the 1990s, they found that private corporations performed
significantly better than SOEs. Putnins (2015) developed a five-step framework that can help
government improve and create SOEs. His framework implied that the creation of SOEs should
only be limited to instances where there were market failures and that state intervention (in the
forms of taxes, regulation, or subsidies) was not feasible to mitigate these failures. He further
suggested that SOEs should be created if the cost of market failures exceeded the inefficiencies of
SOEs and that there was low risk in government failure.
However, in an exploratory study, Heracleous (2001) discovered that superior performance
was attainable under state ownership. Within the case of Singapore Telecom (Singtel), the state
did not burden the SOE with demands that could compromise its profitability and efficiency. In
most cases, this was not true for SOEs which were constantly imposed with objectives that
jeopardized the two aspects, such as keeping incompetent employees for the sake of better
employment figures. The state demanded the management of Singtel to prioritize on profitability,
efficiency, and best quality of service. Singtel‘s main objective was commercially oriented without
having to worry about the policy burdens. Moreover, Ang and Ding (2006) compared the
performance of 15 government-linked companies and 144 private corporations in Singapore from
1990-2000 and discovered that government-linked companies not only performed better in terms
of ROE and ROA, but also in terms of governance practices and plan implementation.
A number of other studies found that there was no correlation between ownership type and
performance. In his study within the time period of 1994-1998 in Egypt, Omran (2004) discovered
Jakob
The Park Place Economist, Volume XXV 13
that there was no significant difference in performance between state and private ownership. Peng,
Bruton, Stan, and Huang (2016) investigated four theories — property rights theory, agency
theory, transaction cost theory, and resource-based theory — and concluded that under any
circumstances both private and state ownerships should deliver the same level of performance, as
no one form of ownership is more superior compared to the other. Demsetz and Villalonga (2001)
studied 223 firms in the U.S. and discovered that there was no significant correlation between firm
performance and ownership structure.
III. Empirical Model
Despite the mixed findings presented by the literature concerning the performance of
SOEs, I hypothesize that when SOEs compete in the strategic industries that I study, the soft-
budget constraint behavior and state-imposed policy burdens will cause SOEs to have lower
profitability and to be less efficient compared to private corporations. In order to test the
hypothesis, I compiled the list of 510 firms which consists of 111 SOEs and 399 private
corporations from the 2016 Forbes’ List of 2000 largest public companies. These companies are
spread out within seven strategic sectors in 52 countries. Within the scope of this research, strategic
sectors are defined as the sectors that play crucial roles on economic development of a nation, so
government is more likely to partake in the sector through establishing an SOE. The strategic
sectors that I gathered from the list include utilities, oil & gas, mining, transportation, ICT
(information, communication, and technology), pharmaceuticals, and biotechnology. I utilized
Yahoo Finance, Morningstar Direct, and annual reports to collect data on companies’ financials
that are used as the control variables within this research.
I conduct cross-sectional study using the OLS regression to test my hypothesis that private
corporations perform better compared to SOEs in terms of profitability and efficiency. To test the
profitability, I use return on asset (ROA), return on sales (ROS), and net income as dependent
variables, and dummy variable for SOEs (hence, private corporations dummy is the benchmark)
as the main independent variable. To measure the efficiency, sales per employee and sales per
asset are used as the dependent variables. The difference in performance between SOEs and PCs
can be affected by several confounding factors, such as types of industries, market share, sizes,
market capitalization per employee, debt ratio, and home nations. Therefore, I control for these
variables within each of the regression. Dummy variables for different types of industries and
countries will be used to control for both factors. Hence, the models I use within this research:
Profitability model:
𝑅𝑂𝐴, 𝑅𝑂𝑆, 𝑁𝑒𝑡 𝐼𝑛𝑐𝑜𝑚𝑒 = 𝑐 + 𝑎1 (𝑆𝑂𝐸) + 𝑎2 (𝑖𝑛𝑑𝑢𝑠𝑡𝑟𝑦) + 𝑎3 (𝑚𝑎𝑟𝑘𝑒𝑡 𝑠ℎ𝑎𝑟𝑒) + 𝑎4 (𝑙𝑜𝑔 𝑜𝑓 𝑎𝑠𝑠𝑒𝑡) + 𝑎5 (𝑚𝑎𝑟𝑘𝑒𝑡 𝑐𝑎𝑝/𝑒𝑚𝑝𝑙𝑜𝑦𝑒𝑒) + 𝑎6 (𝑑𝑒𝑏𝑡 𝑟𝑎𝑡𝑖𝑜) + 𝑎7 (𝑐𝑜𝑢𝑛𝑡𝑟𝑦) + 𝑒𝑟𝑟𝑜𝑟 𝑡𝑒𝑟𝑚
Efficiency model:
𝑆𝑎𝑙𝑒𝑠/𝑒𝑚𝑝𝑙𝑜𝑦𝑒𝑒, 𝑠𝑎𝑙𝑒𝑠/𝑎𝑠𝑠𝑒𝑡 = 𝑐 + 𝑎1 (𝑆𝑂𝐸) + 𝑎2 (𝑖𝑛𝑑𝑢𝑠𝑡𝑟𝑦) + 𝑎3 (𝑚𝑎𝑟𝑘𝑒𝑡 𝑠ℎ𝑎𝑟𝑒) + 𝑎4 (𝑙𝑜𝑔 𝑜𝑓 𝑎𝑠𝑠𝑒𝑡) + 𝑎5 (𝑚𝑎𝑟𝑘𝑒𝑡 𝑐𝑎𝑝/𝑒𝑚𝑝𝑙𝑜𝑦𝑒𝑒) + 𝑎6 (𝑑𝑒𝑏𝑡 𝑟𝑎𝑡𝑖𝑜) + 𝑎7 (𝑐𝑜𝑢𝑛𝑡𝑟𝑦) + 𝑒𝑟𝑟𝑜𝑟 𝑡𝑒𝑟𝑚

Jakob
14 The Park Place Economist, Volume XXV
As listed in Table 1, SOE is expected to generate negative sign when it comes to both
profitability and efficiency, because of the soft budget constraint and policy burdens imposed by
the state. Market share is expected to be positively correlated with the dependent variables because
when a company has a larger market share compared to its competitors, it will be able to take
advantage of economies of scale, resulting in higher profitability and efficiency. Size should also
generate a positive sign because the more assets a company has, the more profit-generating
opportunities it can create.
Moreover, when the market capitalization/employee is higher, it shows that a company is
valued more by the public. Hence, more investments are flowing in and more profits can be earned.
Lastly, debt ratio is expected to be negatively correlated with the dependent variables. When a
company is burdened by higher level of debt, the sales the company earns will more likely be
allocated for paying off the debt instead of for research and development. Therefore, lower
profitability and efficiency can be attained.
Table 1: Variable Definitions and Expected Signs
Variable Expected
Sign Definition
Dependent Variables
ROA Ratio of net income and total assets
ROS Ratio of net income and total sales
Net Income Final profit or loss after all expenses have been deducted from
sales Sales/Employee Amount of sales that is generated by each employee
Sales/Assets Amount of sales generated per $1 of a company's asset
Explanatory Variables
SOE - Dummy variable that indicates that a company is an SOE
Market Share + Ratio of a company's sales and total sector's sales from the
companies within the Forbes' list
Size + Log of assets
Market cap/employee +
Total market value of a company's outstanding shares
calculated per employee
Debt Ratio - Ratio of liabilities and assets
Industry Strategic sectors that consist of utilities, oil & gas, mining,
transportation, ICT, pharmaceuticals, and biotechnology Country 52 countries in total who have both SOE and private
corporations that are from strategic sectors
Jakob
The Park Place Economist, Volume XXV 15
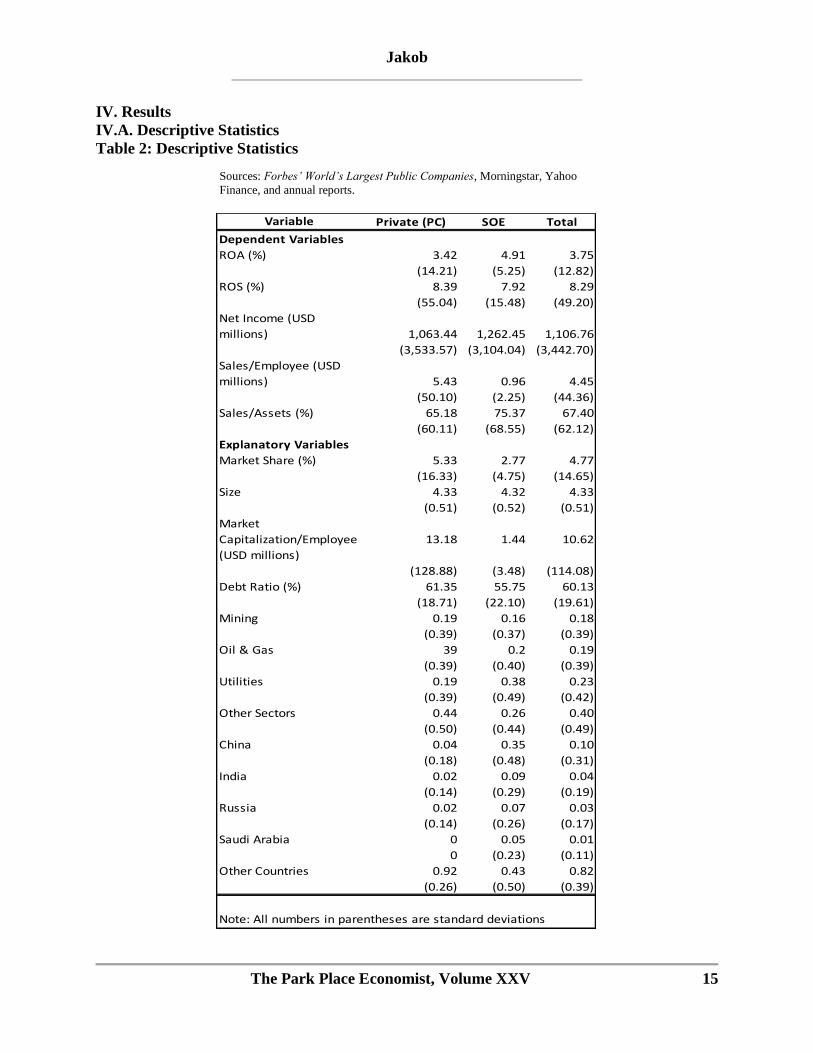
IV. Results
IV.A. Descriptive Statistics
Table 2: Descriptive Statistics
Sources: Forbes’ World’s Largest Public Companies, Morningstar, Yahoo
Finance, and annual reports.
Variable Private (PC) SOE Total
ROA (%) 3.42 4.91 3.75
(14.21) (5.25) (12.82)
ROS (%) 8.39 7.92 8.29
(55.04) (15.48) (49.20)
Net Income (USD
millions) 1,063.44 1,262.45 1,106.76
(3,533.57) (3,104.04) (3,442.70)
Sales/Employee (USD
millions) 5.43 0.96 4.45
(50.10) (2.25) (44.36)
Sales/Assets (%) 65.18 75.37 67.40
(60.11) (68.55) (62.12)
Market Share (%) 5.33 2.77 4.77
(16.33) (4.75) (14.65)
Size 4.33 4.32 4.33
(0.51) (0.52) (0.51)
Market
Capitalization/Employee
(USD millions)
13.18 1.44 10.62
(128.88) (3.48) (114.08)
Debt Ratio (%) 61.35 55.75 60.13
(18.71) (22.10) (19.61)
Mining 0.19 0.16 0.18
(0.39) (0.37) (0.39)
Oil & Gas 39 0.2 0.19
(0.39) (0.40) (0.39)
Utilities 0.19 0.38 0.23
(0.39) (0.49) (0.42)
Other Sectors 0.44 0.26 0.40
(0.50) (0.44) (0.49)
China 0.04 0.35 0.10
(0.18) (0.48) (0.31)
India 0.02 0.09 0.04
(0.14) (0.29) (0.19)
Russia 0.02 0.07 0.03
(0.14) (0.26) (0.17)
Saudi Arabia 0 0.05 0.01
0 (0.23) (0.11)
Other Countries 0.92 0.43 0.82
(0.26) (0.50) (0.39)
Dependent Variables
Explanatory Variables
Note: All numbers in parentheses are standard deviations
Jakob
16 The Park Place Economist, Volume XXV
The variable means and standard deviations are listed in Table 2. The average return on
asset (ROA) for SOEs is 4.91 percent, which is higher compared to private corporations that only
generate 3.42 percent. SOEs also earn higher average net income at USD 1.26 billion, while the
average net income of private corporations only stands at USD 1.06 billion. However, they
generate 8.39 percent in return on sales (ROS) on average, which is 0.47 percentage point higher
compared to SOEs. Each employee in a private corporation generates USD 5.43 million in sales
on average, which is 5.7 times higher than what an employee from an SOE can produce. On the
other hand, SOEs have higher average sales/assets ratio (75.37 percent) compared to private
corporations (65.18 percent).
While the average size between the two types of ownership is quite similar, market share
and market capitalization/employee are significantly different. Private corporations have 5.33%
market share on average within each of their respective sector, while SOEs only maintain 2.77%
of market share. Moreover, each employee within a private corporation generates an average of
USD 13.18 million in market capitalization, where SOEs need about nine employees to generate
the same amount. Both private corporations and SOEs carry relatively high burden of debt with
their debt ratios are 61.35% and 55.75% respectively. The strategic sectors that have the most
number of SOEs are utilities (42), oil & gas (22), and mining (18), while the countries with the
highest total of SOEs are China (38), India (10), Russia (8), and Saudi Arabia (6).
IV.B. OLS Regression
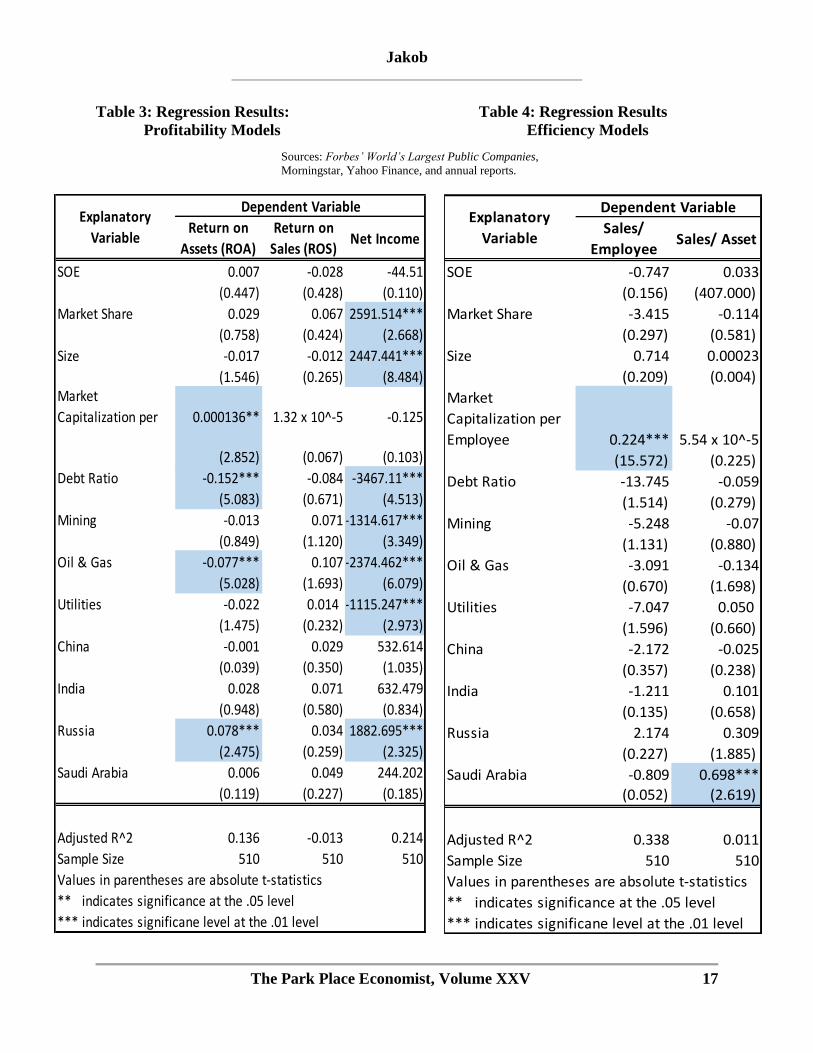
The results for profitability and efficiency regressions are exhibited in Tables 3 and 4. The
coefficient for SOEs turns out to be statistically insignificant at 0.05 level for both the profitability
and efficiency models. This disproves my hypothesis and shows that type of ownership does not
affect the profitability and efficiency of a company. This is consistent with three different studies
I presented earlier in the paper that concluded that there was no correlation between ownership
and performance. Omran (2004) conducted a time series study on the firms in Egypt within the
period of 1994-1998 and discovered that there was no significant difference in performance
between state and private ownership. Peng, Bruton, Stan, and Huang (2016) investigated four
different theories and claimed that no one form of ownership should be superior compared to the
others. Hence, both private and state ownerships should deliver the same level of performance
under any circumstances. My result also aligns with research conducted by Demsetz and
Villalonga (2001) on 223 firms in the U.S., which highlighted the insignificant correlation between
ownership structure and firm performance.
As it is discovered that SOEs should have similar performance as private corporations, this
shows that government subsidies, low-interest loans, and tax-breaks do not necessarily give SOEs
a significant advantage compared to private corporations. This is because the advantage of the
subsidies can potentially be compromised by the soft-budget constraint behavior and the
conflicting roles of government. Firstly, the government subsidies can lead to soft-budget
constraint behavior where SOEs have less incentive to spend effectively. Secondly, through SOE,
government plays conflicting roles as both a shareholder – to increase the value of the investment
– and a regulator – to maintain social order such as through creating more jobs. This type of policy
burden reduces an SOE’s autonomy to solely focus on maximizing profit. Therefore, SOEs deliver
similar performance to private corporations’ despite the government subsidies because they might
be compromised by the soft-budget constraint behavior and the conflicting roles of the
government.
Jakob
The Park Place Economist, Volume XXV 17
Table 3: Regression Results: Table 4: Regression Results
Profitability Models Efficiency Models
Sources: Forbes’ World’s Largest Public Companies,
Morningstar, Yahoo Finance, and annual reports.
Return on
Assets (ROA)
Return on
Sales (ROS)Net Income
SOE 0.007 -0.028 -44.51
(0.447) (0.428) (0.110)
Market Share 0.029 0.067 2591.514***
(0.758) (0.424) (2.668)
Size -0.017 -0.012 2447.441***
(1.546) (0.265) (8.484) Market
Capitalization per 0.000136** 1.32 x 10^-5 -0.125
(2.852) (0.067) (0.103)
Debt Ratio -0.152*** -0.084 -3467.11***
(5.083) (0.671) (4.513)
Mining -0.013 0.071 -1314.617***
(0.849) (1.120) (3.349)
Oil & Gas -0.077*** 0.107 -2374.462***
(5.028) (1.693) (6.079)
Utilities -0.022 0.014 -1115.247***
(1.475) (0.232) (2.973)
China -0.001 0.029 532.614
(0.039) (0.350) (1.035)
India 0.028 0.071 632.479
(0.948) (0.580) (0.834)
Russia 0.078*** 0.034 1882.695***
(2.475) (0.259) (2.325)
Saudi Arabia 0.006 0.049 244.202
(0.119) (0.227) (0.185)
Adjusted R^2 0.136 -0.013 0.214
Sample Size 510 510 510
Explanatory
Variable
Dependent Variable
Values in parentheses are absolute t-statistics
** indicates significance at the .05 level
*** indicates significane level at the .01 level
Sales/
EmployeeSales/ Asset
SOE -0.747 0.033
(0.156) (407.000)
Market Share -3.415 -0.114
(0.297) (0.581)
Size 0.714 0.00023
(0.209) (0.004)
Market
Capitalization per
Employee 0.224*** 5.54 x 10^-5
(15.572) (0.225)
Debt Ratio -13.745 -0.059
(1.514) (0.279)
Mining -5.248 -0.07
(1.131) (0.880)
Oil & Gas -3.091 -0.134
(0.670) (1.698)
Utilities -7.047 0.050
(1.596) (0.660)
China -2.172 -0.025
(0.357) (0.238)
India -1.211 0.101
(0.135) (0.658)
Russia 2.174 0.309
(0.227) (1.885)
Saudi Arabia -0.809 0.698*** (0.052) (2.619)
Adjusted R^2 0.338 0.011
Sample Size 510 510
Explanatory
Variable
Dependent Variable
Values in parentheses are absolute t-statistics
** indicates significance at the .05 level
*** indicates significane level at the .01 level

Jakob
18 The Park Place Economist, Volume XXV
As exhibited in the three profitability models and two efficiency models within Table 3 and 4,
market cap/employee has a positive and significant correlation with return on assets (ROA) and
sales/employee. For every USD 1,000 increase in market cap/employee, the ROA increases by
0.14% and sales/employee grows by USD 224,000. In addition, market share has a significant
correlation with net income at 0.01 level. For every 1% growth in market share, net income will
increase by USD 2.6 billion. On the other hand, ROA will decline by 0.15% and net income will
decrease by USD 3.5 billion for every 1% increase in debt ratio. Companies that operate in mining,
utilities, and oil & gas experience on average USD 1.6 billion lower net income compared to any
other sectors. Especially for oil & gas, it also has 0.08% lower ROA compared to others. This
sector performs worst because the oil prices have been declining within the past several years,
hence driving down the profitability of the companies within the sector.
Companies in Russia tend to experience higher profitability – 0.08% higher ROA and USD
1.9 billion more net income – compared to companies from other countries regardless of their
ownership. Moreover, companies in Saudi Arabia perform better in terms of efficiency as they
have 0.7% higher sales/assets ratio compared to others. These different profitability and efficiency
levels in different countries can potentially be driven by the leniency of the regulations, pricing
policy, and the consumer market within each country. Companies in a heavily regulated
environment will have a stronger incentive to underreport their profitability to avoid higher tax or
stricter regulation (Sirtaine, Pinglo, Guasch, and Foster, 2004).
V. Conclusion and Policy Implications
This study measures the difference in performance in terms of profitability and efficiency
between SOEs and private corporations in strategic sectors. The main hypothesis of this study is
that due to soft-budget constraint and lack of autonomy caused by the policy burdens, SOEs have
lower profitability and are less inefficient compared to private corporations. The performance
measures that are used to assess the profitability are ROA, ROS, and net income, while the
measures to assess the efficiency are sales/employee and sales/assets. Through investigating 399
private corporations and 111 SOEs from 52 countries and seven strategic sectors, this study
discovers that there is no significant correlation between ownership type and performance. Hence,
SOEs and private corporations are expected to deliver the same performance under any
circumstances. This further shows that the government subsidies received by the SOEs do not
necessarily provide them with an edge compared to private corporations. The subsidies can
potentially be compromised by the soft-budget constraint behavior and the conflicting roles of the
government through SOEs.
The policy implication of the result is that government should look into limiting subsidies
allocated for SOEs to a level that does not trigger soft-budget constraint behavior. Moreover,
government should consider giving more autonomy to the SOEs so that it can minimize its
conflicting roles both as a shareholder and a regulator. These policy implications are consistent
with the result, which implies that potential advantage of the government subsidies can be
compromised by the soft-budget constraint aspects and lack of autonomy. However, the result of
this study necessitates a more comprehensive assessment computed with a larger set of measures,
because the measures used within this research only provide a partial view. Moreover, different
countries have different regulations and public policies that might impact how companies report
their sales and profitability.
Jakob
The Park Place Economist, Volume XXV 19
References
Aharoni, Yair. (1981). Performance Evaluation of State-Owned Enterprises: A Process
Perspective. Management Science, 27 (11), 1340-1347.
Amoako, George Kofi, & Goh, Mawusi Kofi. (2015). Corporate Governance Practices of State-
Owned Enterprises in Ghana: An Analysis. The IUP Journal of Corporate
Governance, 14 (2), 44-63.
Ang, J.S., & Ding, D.K. (2006). Government Ownership and the Performance of Government-
Linked Companies: The Case of Singapore. Journal of Multinational Financial
Management, 16 (1), 64-88.
Barberis, N., Boycko, M., Shleifer, A., & Tsukanova, N. (1996). How does Privatization Work?
Evidence from the Russian shops. Journal of Political Economy, 104. 764-790.
Boardman, Anthony E., & Vining, Aidan R. (1989). Ownership and Performance in Competitive
Environments: A Comparison of the Performance of Private, Mixed, and State-
Owned Enterprises. The Journal of Law & Economics, 32 (1), 1-33.
Chen, Christopher. (2016). Solving the Puzzle of Corporate Governance of State-Owned
Enterprises: The Path of the Temasek Model in Singapore and Lessons for China.
Northwestern Journal of International Law & Business, 36, 1-47.
Demsetz, H, & Villalonga, B. (2001). Ownership Structure and Corporate Performance. Journal
of Corporate Finance, 7 (3), 209-233.
Forbes. (2016). The World’s Biggest Public Companies. Retrieved from
http://www.forbes.com/global2000/list/#
Goldeng, Eskil, Grunfeld, Leo A., & Benito, Gabriel R.G. (2008). The Performance Differential
between Private and State Owned Enterprises: The Role of Ownership,
Management and Market Structure. Journal of Management Studies, 45 (7), 1245-
1273.
Grout, P.A., & Stevens, M. (2003). The Assessment: Financing and Managing Public Services.
Oxford Review of Economic Policy, 19. 215-234.
Groves, T., Hong, Y., McMillan, J., & Naughton, B. (1994). Autonomy and Incentives in
Chinese State Enterprises. The Quarterly Journal of Economics 109 (1), 183-209.
Heracleous, Loizos. (2001). State Ownership, Privatization and Performance in Singapore: An
Exploratory Study from a Strategic Management Perspective. Asia Pacific
Journal of Management, 18, 69-81.
Li, Shaomin, Lin, Ying Chou, & Selover, David D. (2014). Chinese State-Owned Enterprises:
Are They Inefficient? The Chinese Economy, 47 (5-6), 81-115.
Jakob
20 The Park Place Economist, Volume XXV
Lin, J.Y., & Z. Li. (2008). Policy Burden, Privatization and Soft Budget Constraint. Journal of
Comparative Economics, 36 (1), 90-102.
Morningstar. (2016). Stocks. Retrieved from https://www.morningstar.com/stocks/
Nellis, J. (1994). Is Privatization Necessary? Public Policy for the Private Sector. Washington,
DC: World Bank.
Omran, M. (2004). The Performance of State-Owned Enterprises and Newly Privatised Firms:
Does Privatization Really Matter? World Development, 32 (6), 1019-1041.
Peng, Mike W., Bruton, Garry D., Stan, Ciprian V., & Huang, Yuanyuan. (2016). Theories of the
(state-owned) firm. Asia Pacific Journal of Management, 33, 293-317.
Putnins, Talis J. (2015). Economics of State-Owned Enterprises. International Journal of Public
Administration, 38 (11), 815-832.
Shirley, M. M. & Walsh, P. (2000). Public versus Private Ownership: The Current State of the
Debate, Policy Research Working Papers. Washington, DC: World Bank.
Shleifer, Andrei. (1998). State versus Private Ownership. Journal of Economic Perspectives, 12
(4), 133-150.
Sirtaine, S., Pinglo, M., Guasch, J., & Foster, V. (2004). How profitable are private
infrastructure concessions in Latin America? Empirical evidence and regulatory
implications. Mimeograph. Washington, DC: World Bank.
Stiglitz, J.E. (1988). Economics of the Public Sector, 2nd edition. London: Norton & Company.
Wortzel, H.V., & Wortzel, L.H. (1989). Privatization: Not the Only Answer. World
Development, 17(5), 633-641.
Yahoo Finance. (2016). Market Data. Retrieved from https://finance.yahoo.com/