Embed Size (px)
Citation preview

Department of Architecture and Civil Engineering Water Environment Technology CHALMERS UNIVERSITY OF TECHNOLOGY Master’s Thesis ACEX30-18-95 Gothenburg, Sweden 2018
Performance Examination of Sustainable Urban Drainage Systems A Multi-Criteria Analysis for the city of Gothenburg Master’s thesis in Infrastructure and Environmental Engineering
Herman López

MASTER’S THESIS ACEX30-18-95
Performance examination of Sustainable Urban Drainage
Systems
A Multi-Criteria Analysis for the city of Gothenburg
Master’s Thesis in the Master’s Programme Infrastructure and Environmental Engineering
HERMAN LOPEZ
Department of Architecture and Civil Engineering
CHALMERS UNIVERSITY OF TECHNOLOGY
Gothenburg, Sweden 2018
Performance Examination of Sustainable Urban Drainage Systems
A Multi-Criteria Analysis for the city of Gothenburg
Master’s Thesis in the Master’s Programme Infrastructure and Environmental Engineering
HERMAN LOPEZ
© AUTHOR HERMAN LOPEZ, 2018
Examensarbete ACEX30-18-95
Institutionen för arkitektur och samhällsbyggnadsteknik
Chalmers tekniska högskola, 2018
Department of Architecture and Civil Engineering
Water Environment Technology
Chalmers University of Technology
SE-412 96 Göteborg
Sweden
Telephone: + 46 (0)31-772 1000
Department of Architecture and Civil Engineering
Göteborg, Sweden, 2018

CHALMERS Architecture and Civil Engineering, Master’s Thesis ACEX30-18-95 i
Performance Examination of Sustainable Urban Drainage Systems. A Multi-Criteria Analysis
for the City of Gothenburg
Master’s thesis in the master’s Programme Master’s Infrastructure and Environmental
Engineering
HERMAN LOPEZ
Department of Architecture and Civil Engineering
Water Environment Technology
Chalmers University of Technology
Abstract Increasing urbanization processes, together with the expected increase in the precipitation as a
result of climate change, have led to the necessity of improving existing stormwater
management systems to mitigate the pollution of water bodies, the emergence of health risks,
and urban flooding events.
The thesis aims to study a stormwater treatment system installed in Gothenburg, Sweden, and
to evaluate the expected performance of nine different Best Management Practices (BMPs) for
stormwater by taking into account social, economic, and environmental aspects. The method
consisted of site investigations, analysis of previous sampling campaigns, literature reviews on
state-of-art urban drainage systems, and the development and implementation of a Multi-
criteria analysis (MCA) to support future decision-making processes. Although the results from
the sampling campaigns are inconclusive, there is substantial evidence to support the
hypothesis that the treatment system currently installed does not operate appropriately. The
literature review showed wide ranges of the expected performance of the BMPs, fluctuating
mainly as a function of local aspects and operation and maintenance actions. Sustainable urban
drainage systems must be considered as an integrated strategy, where various water treatment
alternatives in a treatment train lead to proper management of runoff quality and quantity while
achieving social amenity in the areas.
The MCA allowed the ranking of the different BMPs according to the preference of involved
key-players: wet retention ponds, dry detention basins, swales, and green roofs are always the
preferred options. The implementation of exclusion criteria, representing mainly physical or
interest constraints, is an essential aspect for performing site-specific studies. Despite high
uncertainties linked to the subjectivity of the method, MCA is considered an excellent
pedagogical tool that allows the identification, understanding, analysis, and discussion of the
different urban aspects that influence the selection of drainage system. Additionally,
identification and inclusion of different actors with expertise in environmental, ecological,
social, urbanistic, economic, and technical fields, leads to a lower uncertainty in the MCA
results, achieving the implementation of integrated stormwater systems with environmental,
economic, and social benefits.
Keywords: Best Management Practices (BMP); Decision aiding tools; Multi-criteria analysis
(MCA); Performance Evaluation; Stormwater Management; Sustainable Development;
Sustainable Urban Drainage Systems (SUDS)

CHALMERS Architecture and Civil Engineering, Master’s Thesis ACEX30-18-95 iii
Table of Contents
ABSTRACT ......................................................................................................................................................... I
1. INTRODUCTION ...................................................................................................................................... 1
2. AIMS, HYPOTHESIS, AND IMPLEMENTATION .......................................................................................... 3
3. BACKGROUND INFORMATION ................................................................................................................ 4
3.1 URBAN STORMWATER GENERATION ............................................................................................................. 4 3.1.1 Precipitation .................................................................................................................................... 4 3.1.2 Global Climate Change ................................................................................................................... 5 3.1.3 Climate change effects in Sweden and Gothenburg ....................................................................... 6 3.1.4 Runoff generation ........................................................................................................................... 8
3.2 STORMWATER POLLUTANTS ...................................................................................................................... 10 3.2.1 Pollutant sources and transport.................................................................................................... 13 3.2.2 Impacts of stormwater ................................................................................................................. 14 3.2.3 Frequently occurring pollutants in stormwater ............................................................................ 14
3.3 STORMWATER MANAGEMENT ................................................................................................................... 16 3.3.1 Traditional Approach .................................................................................................................... 16 3.3.2 Sustainability in Urban Drainage Systems .................................................................................... 17 3.3.3 Sustainable drainage and treatment options ............................................................................... 18 3.3.4 Integrated urban planning ............................................................................................................ 26 3.3.5 Example of stormwater management approach – relevance of public participation .................. 26
3.4 STORMWATER REGULATION IN SWEDEN ...................................................................................................... 27 3.5 DECISION AIDING TOOLS ........................................................................................................................... 28
3.5.1 Monetary-based techniques ......................................................................................................... 28 3.5.2 Multi-criteria analysis (MCA) ........................................................................................................ 29
4. STUDY AREA ......................................................................................................................................... 37
4.1 THE CITY OF GOTHENBURG ....................................................................................................................... 37 4.2 BROTTKÄRR ........................................................................................................................................... 38
4.1.1 Catchment area ............................................................................................................................ 39 4.1.2 Current water conditions .............................................................................................................. 40 4.1.3 Stormwater treatment systems .................................................................................................... 41
5. METHOD ............................................................................................................................................... 44
5.1 SAMPLING CAMPAIGNS ............................................................................................................................ 44 5.2 BMPS PERFORMANCE EVALUATION ........................................................................................................... 45 5.3 MULTI-CRITERIA ANALYSIS ........................................................................................................................ 45 5.4 LIMITATIONS .......................................................................................................................................... 45
6. RESULTS ................................................................................................................................................ 47
6.1 SAMPLING CAMPAIGNS ............................................................................................................................ 47 6.1.1 Water quality ................................................................................................................................ 47
6.2 COMPARATIVE ANALYSIS OF STORMWATER TREATMENT OPTIONS ..................................................................... 50 6.3 MULTI-CRITERIA ANALYSIS ....................................................................................................................... 51
6.3.1 Identification of the goal and establishment of the decision context ........................................... 51 6.3.2 Identification and selection of alternatives ................................................................................... 52 6.3.3 Establishment of criteria ............................................................................................................... 52 6.3.4 Performance evaluation of the alternatives against the criteria .................................................. 56 6.3.5 Weighting of the criteria ............................................................................................................... 58 6.3.6 Final evaluation based on the overall weighted score of the alternatives .................................... 60
7. DISCUSSION & RECOMMENDATIONS.................................................................................................... 63
7.1 THE STORMWATER TREATMENT SYSTEM IN BROTTKÄRR ................................................................................. 63 7.2 COMPARATIVE ANALYSIS OF STORMWATER TREATMENT OPTIONS ..................................................................... 64 7.3 MCA DISCUSSIONS ................................................................................................................................. 65

CHALMERS Architecture and Civil Engineering, Master’s Thesis ACEX30-18-95
8. CONCLUSION ........................................................................................................................................ 68
REFERENCES ................................................................................................................................................... 70
APPENDIX 1 TIME AND SPATIAL EFFECTS OF CONTAMINANTS ON RECEIVING WATER BODIES ...................... 80
APPENDIX 2 ADVANTAGES AND DISADVANTAGES OF SEPARATE AND COMBINED SEWER SYSTEMS ............. 81
APPENDIX 3 HYDROGRAPHS .......................................................................................................................... 82
APPENDIX 4 REMEDIAL ACTIONS ON THE FILTER ........................................................................................... 83
APPENDIX 5 TRACER TEST INFORMATION ...................................................................................................... 84
APPENDIX 5.1 TIME DELAY MEASURING POINTS .......................................................................................................... 84 APPENDIX 5.2 POINT B MEASUREMENTS ................................................................................................................... 85
APPENDIX 6 STORMWATER MANAGEMENT SYSTEMS’ PERFORMANCE EVALUATION ................................... 86
APPENDIX 6.1 TECHNICAL PERFORMANCE.................................................................................................................. 86 Appendix 6.1.1 Hydraulic response- Water flow control performance ....................................................... 86 Appendix 6.1.2 Technical Quality performance .......................................................................................... 87
APPENDIX 6.2 ENVIRONMENTAL PERFORMANCE ......................................................................................................... 89 Appendix 6.2.1 Pollution control ................................................................................................................. 89 Appendix 6.2.2 Impact on soil and water .................................................................................................... 94 Appendix 6.2.2 Ecological enhancement potential ..................................................................................... 96
APPENDIX 6.3 SOCIAL PERFORMANCE ....................................................................................................................... 97 Appendix 6.3.1 Public interaction ................................................................................................................ 97 Appendix 6.3.2 Location Amenity ................................................................................................................ 99
APPENDIX 6.4 ECONOMIC PERFORMANCE ............................................................................................................... 101 Appendix 6.4.1 Capital costs ..................................................................................................................... 101 Appendix 6.4.2 Operation and Maintenance ............................................................................................ 102
APPENDIX 7 SCORING OF ALTERNATIVES ..................................................................................................... 104
APPENDIX 7.1 TECHNICAL-ENVIRONMENT (CHALMERS UNIVERSITY OF TECHNOLOGY) ..................................................... 104 APPENDIX 7.2 TECHNICAL-ENVIRONMENT-ECONOMIC (KRETSLOPP OCH VATTEN – GÖTEBORG STAD) ................................ 104 APPENDIX 7.3 SOCIAL (KULTUR OCH FRITID-GÖTEBORG STAD) .................................................................................... 104
APPENDIX 8 WEB-HIPRE............................................................................................................................... 105
APPENDIX 9 PERCENTAGE DISTRIBUTION OF THE CRITERIA IN THE RESULT OF THE MCA ............................ 106

CHALMERS Architecture and Civil Engineering, Master’s Thesis ACEX30-18-95 v
List of Tables Table 1: Rain event classification. Adapted from: (Steinmetz & Krampe, 2009) .................................................... 5 Table 2: Requirements for rainfall data in different applications of urban drainage. Source: (Butler & Davies, 2004) ....................................................................................................................................................................... 5 Table 3: Parameters commonly analyzed in urban runoff, their sources in urban areas and potential effects on receiving waters. Source: (Göteborg Stad, 2017; Björklund, 2011; United States Environmental Protection Agency, 1999) ....................................................................................................................................................... 11 Table 4: Value ranges of pollutant concentrations from rainwater, roofs runoff, low/high-density traffic areas. Source: (Gobel, et al., 2007).................................................................................................................................. 12 Table 5: Example of a matrix of evaluation of alternatives .................................................................................. 34 Table 6: Weighting method example. Adapted from (Martin, et al., 2007) ......................................................... 35 Table 7: Filtration capacity Hydro system. Source: (Dahl Sverige AB, n.d.) .......................................................... 43 Table 8: Systems used in the sampling campaigns ............................................................................................... 44 Table 9: Concentration of pollutants measured at the inlet and the outlet for each of the three days of sampling: Adapted from: (DHI, 2018). .................................................................................................................. 48 Table 10: Water delay time and flow velocity measured in three different points along the detention basin (Point A.1, B, and C. .............................................................................................................................................. 49 Table 11: Key-players involved in the MCA ........................................................................................................... 52 Table 12: Stormwater treatment alternatives for evaluation .............................................................................. 52 Table 13: Categories, parameters, criteria, and benchmarks used for the stormwater performance evaluation 54 Table 14: Exclusion criteria examples. Adapted from: (Ellis, et al., 2004) ............................................................ 55 Table 15: Matrix and evaluation of alternatives. ................................................................................................. 57 Table 16: Evaluation´s standard deviation ........................................................................................................... 57 Table 17: Criteria Weighting results ..................................................................................................................... 59 Table 18: Compiled MCA results based on the alternatives’ scoring values and criteria weights ........................ 62 Table 19: Suggested entities to be included in future in-site analysis. ................................................................. 66 Table 20: Advantages and disadvantages of combined and separate sewer systems. Source: (Butler & Davies, 2004) ..................................................................................................................................................................... 81
List of Figures Figure 1: The world's urban and rural populations, 1950-2050. Source: (United Nations, Department of Economic and Social Affairs, Population division, 2015) ........................................................................................ 1 Figure 2: Example of an intensity-duration-frequency curve. Source: (Arnell, 1978) ............................................. 4 Figure 3: Trends in annual precipitation for 1901-2010 (left) and 1951-2010 (right) Based on the data sets from the Climate Research Unit (CRU), Global Historical Climatology Network (GHCN), and Global Precipitation Climatology Center (GPCC). White areas represent incomplete or missing data. Source: (Hartmann, et al., 2013) ................................................................................................................................................................................ 6 Figure 4: Estimated increase of the annual precipitation in Västra Götaland region. Black lines represent mean values. Shaded areas represent maximum and minimum value, as well as 75, and 25 percentiles of the climate estimations. Observed values are expressed as green (higher values) or yellow (lower values) columns when comparing to the average values of the reference period. Source: (SMHI, 2011) .................................................. 7 Figure 5: Spatial distribution of the precipitation in the Västra Götaland region. The graphs show the differences between the observed precipitation during the period 1961-1990 and the model results for the periods 2021-2050 (left) and 2069-2098 (right). Source: (SMHI, 2011) ................................................................. 7 Figure 6: Effects on stormwater behavior due to urbanization. Adapted from: (Dittmer, 2017) ........................... 8 Figure 7: Runoff generation. Source: (Dittmer, 2017) ............................................................................................ 9 Figure 8: Stormwater runoff generation processes. Source: (Butler & Davies, 2004) ............................................ 9 Figure 9: Timescale effects of intermittent pollutant discharges. Source: (Hvltved-Jacobsen, et al., 1994)......... 14 Figure 10: Urban water systems: Combined (left), Separate (right). Source: (Butler & Davies, 2004) ................. 17 Figure 11: Urban drainage transition concept. Adapted from: (Stahre, 2006) ..................................................... 18 Figure 12: Surface water management train. Source: (Butler & Davies, 2004) .................................................... 18 Figure 13: Typical section of a green roof. Source: (Woods-Ballard, et al., 2015) ................................................ 19 Figure 14: Section view of three types of pervious pavements. Source: (Woods-Ballard, et al., 2015) ................ 20 Figure 15: Soakaways. Source: (Woods-Ballard, et al., 2015) .............................................................................. 21 Figure 16 Section view of a Swale. Source: (Woods-Ballard, et al., 2015) ............................................................ 22 Figure 17: Plant and section view of a dry detention basin. Source: (Woods-Ballard, et al., 2015) ..................... 23
CHALMERS Architecture and Civil Engineering, Master’s Thesis ACEX30-18-95
Figure 18: Typical treatment processes which occur in a manhole filter. Source: (Woods-Ballard, et al., 2015) . 25 Figure 19: Scharnhauser Park, Stuttgart, Germany. Sources: Left Picture (Knox, 2012); Right picture: (Dittmer, 2017) ..................................................................................................................................................................... 26 Figure 20: Steps of an MCA. Adapted from (Department for Communities and Local Government, 2009) ......... 31 Figure 21: Sustainable Urban Drainage System triangle and the relation to sustainable criteria and stakeholder preferences. Source: (Ellis, et al., 2004) ................................................................................................................ 33 Figure 22: City of Gothenburg. Source: (Göteborgs Stad, 2009) ........................................................................... 37 Figure 23: Brottkärr area. Source: Google maps .................................................................................................. 39 Figure 24: Drainage area (blue line). The red points mark the inlet and the outlet of the treatment systems of interest. The blue point marks the location of a rain gauge. Source: (DHI, 2018) ................................................ 39 Figure 25: Division of the area in three different basins. Source: (Norconsult AB, 2011) ..................................... 40 Figure 26: Residential construction area from where the water is drained and treated in the stormwater system of interest.............................................................................................................................................................. 41 Figure 27: Secondary catchment area. The runoff is conducted through a piped system (dark green lines) to the underground sedimentation basis (light green lines). Source: (Göteborg Stad; Kretslopp och vatten, 2017) ...... 42 Figure 28: Filter used as part of the stormwater treatment system. Source: (Dahl Sverige AB, n.d.) .................. 42 Figure 29: Scheme of the treatment system in Brottkärr. Modified and used with permission from: (Göteborg Stad; Kretslopp och vatten, 2017) ........................................................................................................................ 44 Figure 30 Preferred ranking of BMPs by Chalmers University of Technology ....................................................... 60 Figure 31 Preferred ranking of alternatives by Kretslopp och Vatten .................................................................. 61 Figure 32 Preferred ranking of alternatives by Gothenburg City (social actors) ................................................... 61 Figure 33: Time and Spatial effects of contaminants in the receiving water bodies. Source: (Butler & Davies, 2004) ..................................................................................................................................................................... 80 Figure 34: Inlet hydrograph. Used with permission from: (DHI, 2018) ................................................................. 82 Figure 35 Outlet hydrograph. Used with permission from: (DHI, 2018) ............................................................... 82 Figure 36: Filter Before the reparations ................................................................................................................ 83 Figure 37: Filter after the reparations .................................................................................................................. 83 Figure 38: Tracer test measuring points ............................................................................................................... 84 Figure 39: Manholes in Measuring Point B ........................................................................................................... 85 Figure 40 Web-Hipre Model................................................................................................................................ 105 Figure 41: Chalmers University of Technology detailed MCA results ................................................................. 106 Figure 42: Kretslopp och Vatten´s detailed MCA results..................................................................................... 106 Figure 43: Gothenburg City (social actors) detailed MCA results. ...................................................................... 107

„ When I have thus got them all together in one View, I endeavour to estimate their
respective Weights; (...). And tho’ the Weight of Reasons cannot be taken with the Precision
of Algebraic Quantities, yet when each is thus considered separately and comparatively, and
the whole lies before me, I think I can judge better, and am less likely to make a rash Step;
and in fact I have found great Advantage from this kind of Equation, in what may be
called Moral or Prudential Algebra. “
Benjamin Franklin in a letter to Joseph Priestley
outlining a technique for decision-making.
London, September 19, 1772


1 CHALMERS Architecture and Civil Engineering, Master’s Thesis ACEX30-18-95
1. Introduction As a result of the globalization and the cultural and economic interconnection around the globe,
the increase of the urban population has been a trend for more than 50 years (United Nations,
2015). Accompanied by the global population growth, the movement of people from rural to
urban areas led to a historical milestone in 2007; the urban population exceeded for the first
time the rural population on the planet. The tendency of increasing urban and suburban areas
is projected to continue and, as a result, by the year 2050, 64% of the population is expected to
live in urbanized regions (Figure 1). The global urbanization processes have led to significant
environmental impacts around the globe, in such a way that the changes to the natural
conditions and processes within urban and suburban areas are considered to be one of the most
radical of any human activity (National Academy of Sciences, 2008).
The water resulting from precipitation in an urbanized area contains pollutants which originate
from the interaction between rain, air, and activities involved in the catchment area. The
maximum amount of water depends exclusively on the characteristics of the storm events, but
its impacts depend on different surrounding factors such as the percentage of impermeable
surfaces in the catchment area and the intensity of pollutant emissions. The interaction between
human activity and the natural water cycle creates the need for developing drainage systems in
urban areas (Butler & Davies, 2004). Pollution of water bodies, emergence of health risks, and
flooding are some of the problems associated with improperly managed wastewater. The
consequences vary significantly according to the quality and quantity of the water discharged.
Factors such as wealth, climate characteristics, intensity of urbanization, history, and politics
are factors that determine the extent and nature of water drainage systems (Butler & Davies,
2004). Countries like Germany and the United Kingdom have more than 90% of their
population connected to sewers systems, while countries such as Indonesia, due to its
demographics distribution and history, usually lack proper and unified drainage systems.
The anthropogenic impact on the global climate is an increasing concern, as well as the impacts
on human settlements associated with the climate change. Projections and models show a
significant increase in flood risks in Central and Western Europe as a result of global warming
Figure 1: The world's urban and rural populations, 1950-2050.
Source: (United Nations, Department of Economic and Social
Affairs, Population division, 2015)
2 CHALMERS Architecture and Civil Engineering, Master’s Thesis ACEX30-18-95
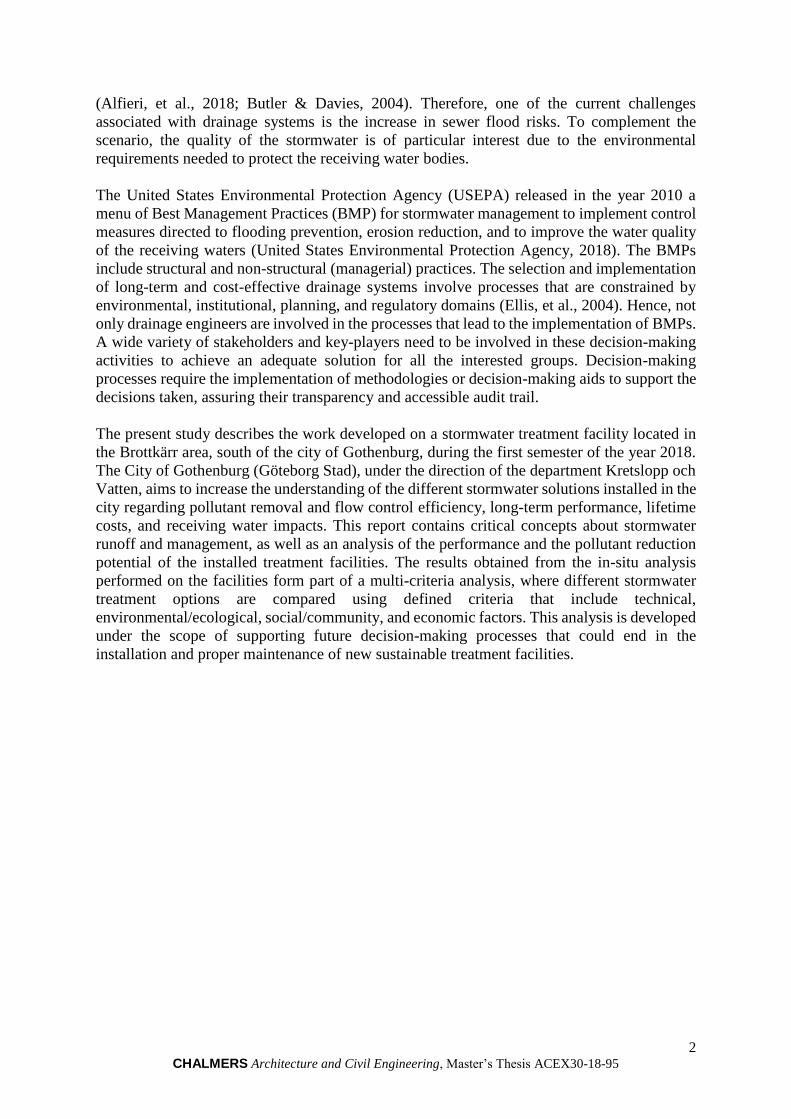
(Alfieri, et al., 2018; Butler & Davies, 2004). Therefore, one of the current challenges
associated with drainage systems is the increase in sewer flood risks. To complement the
scenario, the quality of the stormwater is of particular interest due to the environmental
requirements needed to protect the receiving water bodies.
The United States Environmental Protection Agency (USEPA) released in the year 2010 a
menu of Best Management Practices (BMP) for stormwater management to implement control
measures directed to flooding prevention, erosion reduction, and to improve the water quality
of the receiving waters (United States Environmental Protection Agency, 2018). The BMPs
include structural and non-structural (managerial) practices. The selection and implementation
of long-term and cost-effective drainage systems involve processes that are constrained by
environmental, institutional, planning, and regulatory domains (Ellis, et al., 2004). Hence, not
only drainage engineers are involved in the processes that lead to the implementation of BMPs.
A wide variety of stakeholders and key-players need to be involved in these decision-making
activities to achieve an adequate solution for all the interested groups. Decision-making
processes require the implementation of methodologies or decision-making aids to support the
decisions taken, assuring their transparency and accessible audit trail.
The present study describes the work developed on a stormwater treatment facility located in
the Brottkärr area, south of the city of Gothenburg, during the first semester of the year 2018.
The City of Gothenburg (Göteborg Stad), under the direction of the department Kretslopp och
Vatten, aims to increase the understanding of the different stormwater solutions installed in the
city regarding pollutant removal and flow control efficiency, long-term performance, lifetime
costs, and receiving water impacts. This report contains critical concepts about stormwater
runoff and management, as well as an analysis of the performance and the pollutant reduction
potential of the installed treatment facilities. The results obtained from the in-situ analysis
performed on the facilities form part of a multi-criteria analysis, where different stormwater
treatment options are compared using defined criteria that include technical,
environmental/ecological, social/community, and economic factors. This analysis is developed
under the scope of supporting future decision-making processes that could end in the
installation and proper maintenance of new sustainable treatment facilities.

3 CHALMERS Architecture and Civil Engineering, Master’s Thesis ACEX30-18-95
2. Aims, hypothesis, and implementation This study aims to increase the understanding of a treatment facility installed in the Brottkärr
area in Gothenburg, which consists of a detention basin and a manhole filter to treat stormwater.
Furthermore, with the information gathered from sampling campaigns and literature review, a
multi-criteria analysis is developed to compare different treatment options and support future
decision-making processes that could lead to the implementation of long-term and cost-
efficient stormwater treatment options in the city. The specific objectives are to:
1. Review the local environmental policies and regulations regarding stormwater.
2. Conduct a literature study on the current state of the art of stormwater generation and
stormwater management.
3. Study the hydraulic behavior of the installed detention basin and filter. Monitor the
influent and effluent water quality and analyze the performance of the installations
4. Give recommendations to achieve a proper reduction of priority pollutants in the area,
as well as maintenance requirements and possibilities for improvement of the
stormwater system.
5. Identify the BMPs of interest that would be included in the multi-criteria analysis,
considering local preferences.
6. Establish categories for BMPs evaluation that include social, environmental, economic,
and technical criteria.
7. Evaluate the expected performance, based on a literature review, of the different BMPs
against the defined criteria.
8. Develop a multi-criteria analysis (MCA) process that could support future decision-
making processes for stormwater BMPs.
The installation of stormwater treatment options in the city of Gothenburg has been directed to
comply with the environmental requirements stipulated by the Swedish Environmental
Protection Agency. The efforts have been focused on mitigating the pollution in sensitive water
bodies in the city, where the installation of end-of-pipe solutions is the most common practice.
In some cases, the selection of treatment facilities is based on previous experience and market
availability. It is hypothesized that this scenario has led to the implementation of treatment
alternatives that do not always produce the desired results and entail high needs and
maintenance costs (which usually are not carried out throughout the entire lifespan of the
systems). Treatment options which provide social benefits, such as improving the visual
environment or the possibility of public recreational activities, are generally not considered.
Alternatives other than those commonly used can generate better results regarding the
reduction of pollutant concentrations and water volumes, without leaving aside benefits or
positive impacts on communities.
Multi-criteria analysis methods are useful tools that can be used to include social aspects,
without neglecting those considered conventionally, e.g., economic and technical. The method
allows evaluating the different alternatives according to the preferences of the interested parties
and their individual performance, resulting in the ranking of the various treatment alternatives.
The influence on the result of each aspect can be analyzed to make a decision that generates
the maximum benefit to the environment and the communities.

4 CHALMERS Architecture and Civil Engineering, Master’s Thesis ACEX30-18-95
3. Background information The following section describes the fundamental concepts of the study, focusing on stormwater
runoff, drainage systems, and decision aiding methods.
3.1 Urban stormwater generation
The hydrologic cycle is defined as the driving force that leads to the transfer of pollutants
between all the environmental compartments (van der Perk, 2012). The hydrologic cycle can
be summarized in four principal components, which work together as a continuum all along
the environmental compartments:
1. Precipitation
2. Surface runoff and ground infiltration
3. Water bodies recharge
4. Evaporation and transpiration
The water takes different types of solutes along the cycle. Therefore, these solutes are either
retained or transported from one environmental compartment to another. The input of
pollutants to each of the environmental compartments highly depend on the site-specific
activities and characteristics of the area of influence.
3.1.1 Precipitation
Weather is the driving force for watershed runoff and is a determinant factor in the design of
stormwater treatment options (Tetra Tech, Inc., 2008). Methods that represent and predict
precipitation events are crucial tools used in the design, analysis, and operation of drainage
systems (Butler & Davies, 2004). Measured rain data are usually expressed as depth (mm) and
event duration (minutes). The information gathered allows the derivation of different properties
such as rain intensity (rain depth over the duration) and frequency (N); information which is
conveniently expressed as intensity-duration-frequency (IDF) graphs (Figure 2). IDF relations
are derived from rainfall frequency analysis for particular locations. The frequency of events
is also usually expressed as return period (T). Rain events are classified with return periods of
T years when the magnitude is exceeded on average once every T year.
Figure 2: Example of an intensity-duration-frequency curve.
Source: (Arnell, 1978)

5 CHALMERS Architecture and Civil Engineering, Master’s Thesis ACEX30-18-95
Rainfall intensity varies throughout the storm duration. Storm profiles, or hydrographs, are
used to express the rain depth variation as a function of time. Convective storms usually present
the highest intensities near the beginning of the storm, while highest intensities are usually
recorded near the middle of the duration in frontal storms (Butler & Davies, 2004). This
information plays an essential role in design procedures. A simplification in the classification
of rain events can be achieved by expressing the intensity as a function of the area in liters per
second. According to the intensity, rain events can be classified into three categories (Table 1).
The rain event information required for engineering tasks depends on the objectives. As an
example, the information used for calculating maximum flows rates in storm sewers is of
interest for design and planning procedures. Table 2 exemplifies data requirements for different
engineering tasks.
3.1.2 Global Climate Change
The Intergovernmental Panel on Climate Change (IPCC) has reported the global impacts on
precipitation associated with climate change. Data-sets presented in the Fifth Assessment
Reports, developed by IPCC, show an increase in the global average precipitation (Hartmann,
et al., 2013). In addition to these findings, the observed trends show a spatial variability around
the globe. Significant increases were reported for eastern and northwestern North America,
Europe (except Spain and the Mediterranean coast), Russia, South America, and Australia;
while declines in precipitation were reported for Africa and different (relatively small)
scattered regions around the globe (Figure 3).
Table 1: Rain event classification. Adapted
from: (Steinmetz & Krampe, 2009)
Rain event Clasification Intensity
Weak < 7 l/(s*ha)
Moderate 7-21 l/(s*ha)
Strong > 21 l/(s*ha)
Table 2: Requirements for rainfall data in different applications of urban drainage.
Source: (Butler & Davies, 2004)

6 CHALMERS Architecture and Civil Engineering, Master’s Thesis ACEX30-18-95
3.1.3 Climate change effects in Sweden and Gothenburg
Research results and climate models show that a rain event with a return period of 10 years
could happen twice as often in the future in Sweden (SMHI, 2012). The results of climate
models for the years 2021-2050 and 2069-2098 in the Västra Götaland region show a 10-30%
increase (Figure 4) of annual precipitation at the end of the century with regards to the reference
period (1961-1990) (SMHI, 2011). The spatial distribution of the precipitation along the region
shows a higher increase along the coastal areas of the region, where the city of Gothenburg is
located (Figure 5). Heavy rain frequency, expressed as rain events with a precipitation above
10 mm per day, is also expected to increase in the region in the studied periods.
Figure 3: Trends in annual precipitation for 1901-2010 (left) and 1951-2010
(right) Based on the data sets from the Climate Research Unit (CRU), Global
Historical Climatology Network (GHCN), and Global Precipitation Climatology
Center (GPCC). White areas represent incomplete or missing data. Source:
(Hartmann, et al., 2013)

7 CHALMERS Architecture and Civil Engineering, Master’s Thesis ACEX30-18-95
Furthermore, the models and research on climate change effects in the region show results such
as (Bergqvist, 2014; SMHI, 2011):
A total increase in 4º C at the end of the century with respect to the mean temperature
recorded during the period of reference. High seasonal temperature variations will lead
to shorter winters.
Figure 4: Estimated increase of the annual precipitation
in Västra Götaland region. Black lines represent mean
values. Shaded areas represent maximum and minimum
value, as well as 75, and 25 percentiles of the climate
estimations. Observed values are expressed as green
(higher values) or yellow (lower values) columns when
comparing to the average values of the reference period.
Source: (SMHI, 2011)
Figure 5: Spatial distribution of the precipitation in the Västra Götaland region. The graphs show the
differences between the observed precipitation during the period 1961-1990 and the model results for
the periods 2021-2050 (left) and 2069-2098 (right). Source: (SMHI, 2011)

8 CHALMERS Architecture and Civil Engineering, Master’s Thesis ACEX30-18-95
A total increase of around 5-10% in groundwater levels (present in coarse grain soils)
at the end of the century with respects to the reference period.
A decrease in the snow periods that could result in a maximum of 15 days per year of
snow at the end of the century.
An increase in precipitation during the winters and higher evapotranspiration during
summer will lead to high seasonal variations on the flow along the water bodies in the
region. Overall, a 10% increase in the water flow is predicted to occur at the end of the
century in all the water bodies of the region.
The increase in precipitation and rain intensity predicted for Europe will lead to an increased
risk of flooding, which is the most frequent natural disaster in the region (IPCC, 2012). The
economic losses linked to flood hazards have increased in the previous decades. These
predictions are of particular interest within urban drainage. The implications of such
predictions are also associated to (Butler & Davies, 2004):
Surface flooding and deterioration of the drainage systems due to the increase of the
flows (which can exceed the design capacity).
Greater mobilization of pollutants that leads to impaired receiving water quality.
Increased flows of diluted wastewater arriving at the wastewater treatment plants,
which leads to a lower efficiency in biological treatments.
The high cost of renovating and implementing significant upgrades to the existent sewer
networks makes it an improbable line of action. Therefore, different alternatives such as the
Sustainable Urban Drainage Systems (SUDS) have been developed to complement already
existing sewer networks, leading to new perspectives in the stormwater management field.
3.1.4 Runoff generation
Urbanization and agricultural processes lead to alterations of the natural environment. The
changes in the characteristics of the terrain impacts, in a significant way, the behavior of the
water in the altered areas. Besides, impervious surfaces have been recognized as an intensity
indicator of the urban environment, becoming an important issue that determines the habitat
health (Brabec, et al., 2002). The increase of artificial surfaces, constituting mostly of low
permeability materials in urbanized areas, is the primary factor by which the runoff generation
is increased (Figure 6).
Figure 6: Effects on stormwater behavior due to urbanization. Adapted from: (Dittmer, 2017)
72%
26%
2% 51%
37%
12%
32%
14%
54%
9 CHALMERS Architecture and Civil Engineering, Master’s Thesis ACEX30-18-95
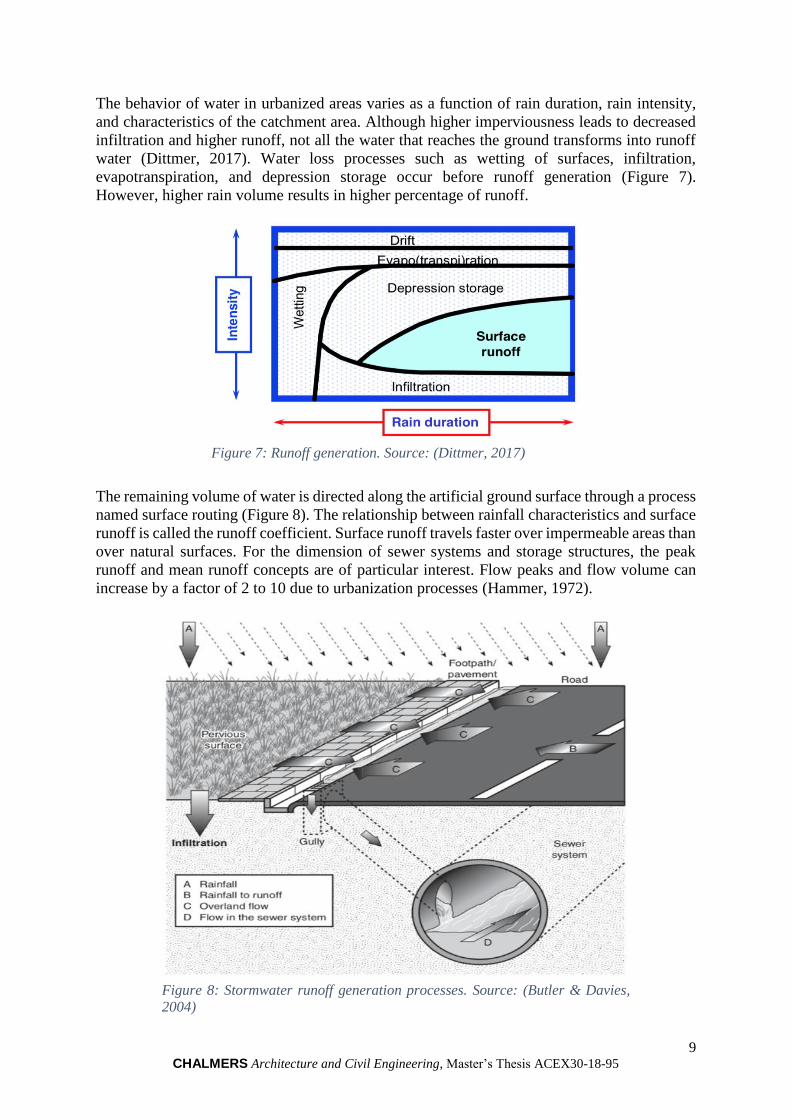
The behavior of water in urbanized areas varies as a function of rain duration, rain intensity,
and characteristics of the catchment area. Although higher imperviousness leads to decreased
infiltration and higher runoff, not all the water that reaches the ground transforms into runoff
water (Dittmer, 2017). Water loss processes such as wetting of surfaces, infiltration,
evapotranspiration, and depression storage occur before runoff generation (Figure 7).
However, higher rain volume results in higher percentage of runoff.
The remaining volume of water is directed along the artificial ground surface through a process
named surface routing (Figure 8). The relationship between rainfall characteristics and surface
runoff is called the runoff coefficient. Surface runoff travels faster over impermeable areas than
over natural surfaces. For the dimension of sewer systems and storage structures, the peak
runoff and mean runoff concepts are of particular interest. Flow peaks and flow volume can
increase by a factor of 2 to 10 due to urbanization processes (Hammer, 1972).
Figure 7: Runoff generation. Source: (Dittmer, 2017)
Figure 8: Stormwater runoff generation processes. Source: (Butler & Davies,
2004)

10 CHALMERS Architecture and Civil Engineering, Master’s Thesis ACEX30-18-95
3.2 Stormwater pollutants
Stormwater contains a mixture of contaminants that range from natural organic and inorganic
pollutants to anthropogenic substances derived from transport, commercial, and industrial
activities (Butler & Davies, 2004). Diffuse spills of contaminants, air-borne pollution, and
substances produced by traffic and construction, are the main sources of pollutants in urban
runoff (Hvitved-Jacobsen, et al., 2010).
The diffuse characteristics of stormwater pollution imply a high complexity regarding water
management and control. Identification of the numerous dispersed stationary and mobile
sources is the main reason for this complexity. Due to the high intensity of emissions in
urbanized areas, the occurrence of pollution is assumed as a continuous at the urban surfaces
(Hvitved-Jacobsen, et al., 2010). Dry periods lead to the accumulation of pollutants, which is
a function of the intensity of activities performed in the catchment area and their extension.
The identification of illegal water discharges and activities (such as spills, leaks from industrial
activities, and accidents) is essential to assess stormwater pollution in an area. Hvitved-
Jacobsen et al. (2010) suggest a systematic framework to assess and predict stormwater
pollution problems. The procedure is based on pollutant pathways, and it is described as
follows:
Assessment of the catchment area characteristics and identification of the nonpoint
diffuse pollutant sources.
Identification of relevant pollutants regarding impacts, quantity, and occurrence.
Identification of the pollutant’s pathways, which include transportation and
transformation.
Determination of the pollutant loads.
Determination of the potential effects.
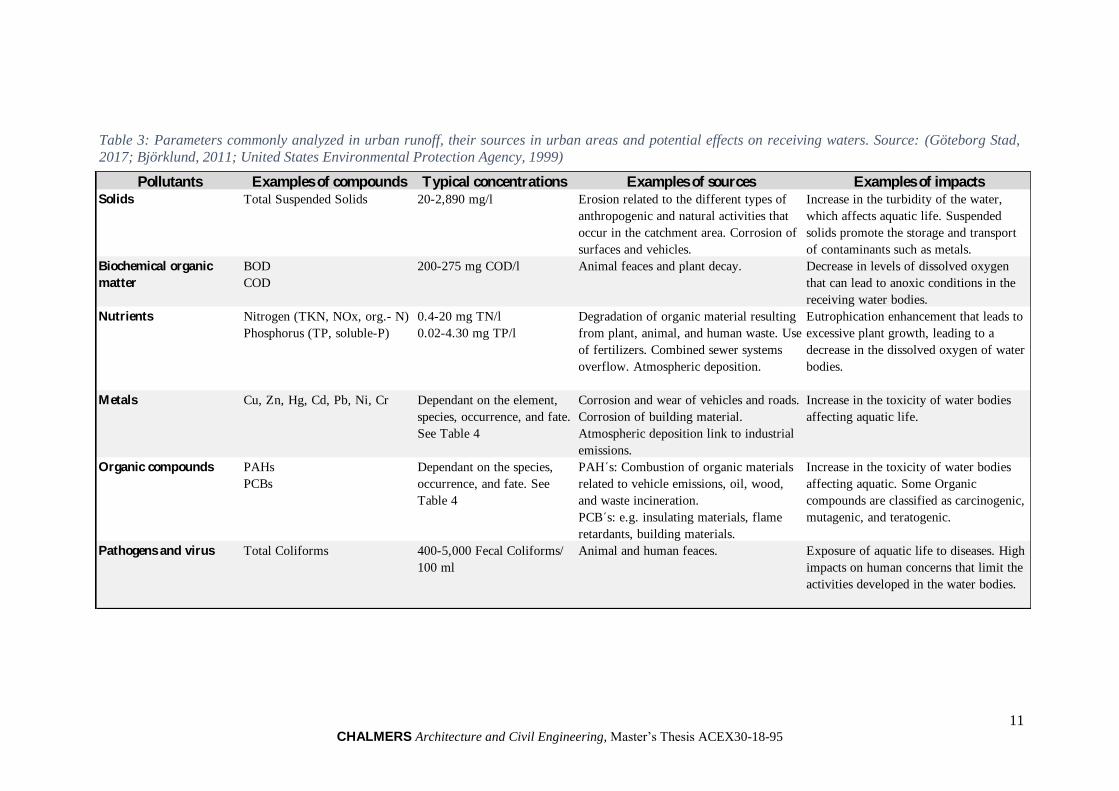
It is essential to recall the role that plays the characteristics of the catchment area in terms of
generation, transport, transformation, and retention of pollutants. Table 3 summarizes the
parameters of interest in urban runoff and describes examples of their sources in urbanized
areas, typical concentrations in stormwater runoff, and the potential impacts on the aquatic
environment. The pollutants concentrations in water runoff varies with regards to the contact
surface. Table 4 shows ranges of pollutants reported on rainwater, roof, and low/high-density
traffic areas runoff. Detailed information on the specific pollutants is explained in the following
subsections.
11 CHALMERS Architecture and Civil Engineering, Master’s Thesis ACEX30-18-95
Table 3: Parameters commonly analyzed in urban runoff, their sources in urban areas and potential effects on receiving waters. Source: (Göteborg Stad,
2017; Björklund, 2011; United States Environmental Protection Agency, 1999)
Pollutants Examples of compounds Typical concentrations Examples of sources Examples of impactsSolids Total Suspended Solids 20-2,890 mg/l Erosion related to the different types of
anthropogenic and natural activities that
occur in the catchment area. Corrosion of
surfaces and vehicles.
Increase in the turbidity of the water,
which affects aquatic life. Suspended
solids promote the storage and transport
of contaminants such as metals.
Biochemical organic
matter
BOD
COD
200-275 mg COD/l Animal feaces and plant decay. Decrease in levels of dissolved oxygen
that can lead to anoxic conditions in the
receiving water bodies.
Nutrients Nitrogen (TKN, NOx, org.- N)
Phosphorus (TP, soluble-P)
0.4-20 mg TN/l
0.02-4.30 mg TP/l
Degradation of organic material resulting
from plant, animal, and human waste. Use
of fertilizers. Combined sewer systems
overflow. Atmospheric deposition.
Eutrophication enhancement that leads to
excessive plant growth, leading to a
decrease in the dissolved oxygen of water
bodies.
Metals Cu, Zn, Hg, Cd, Pb, Ni, Cr Dependant on the element,
species, occurrence, and fate.
See Table 4
Corrosion and wear of vehicles and roads.
Corrosion of building material.
Atmospheric deposition link to industrial
emissions.
Increase in the toxicity of water bodies
affecting aquatic life.
Organic compounds PAHs
PCBs
Dependant on the species,
occurrence, and fate. See
Table 4
PAH´s: Combustion of organic materials
related to vehicle emissions, oil, wood,
and waste incineration.
PCB´s: e.g. insulating materials, flame
retardants, building materials.
Increase in the toxicity of water bodies
affecting aquatic. Some Organic
compounds are classified as carcinogenic,
mutagenic, and teratogenic.
Pathogens and virus Total Coliforms 400-5,000 Fecal Coliforms/
100 ml
Animal and human feaces. Exposure of aquatic life to diseases. High
impacts on human concerns that limit the
activities developed in the water bodies.

12 CHALMERS Architecture and Civil Engineering, Master’s Thesis ACEX30-18-95
Table 4: Value ranges of pollutant concentrations from rainwater, roofs runoff, low/high-density traffic areas. Source: (Gobel, et al., 2007)
Pollutants Example of compounds Rain water Roofs Low density traffic
areas
High density traffic
areasSolids Total Suspended Solids 0.2-52 mg/l 13-120 mg/l 74 mg/l 66-937 mg/l
Biochemical organic
matter
BOD
COD
1-2 mg BOD5/l
5-55 mg COD/l
4-16.1 mg BOD5/l - 2-36 mg BOD5/l
63-146 mg COD/l
Nutrients Nitrogen(TKN, NOx, org.- N)
Phosphorus (TP, soluble-P)
0.01-0.19mg Ptotal/l
0.1-2 mg NH4/l
0-7.4 mg NO3/l
0.06-0.5 mg Ptotal/l
0.1-6.2 mg NH4/l
0-4.7 mg NO3/l
- 0.23-0.34 mg Ptotal/l
0.5-2.3 mg NH4/l
0-16.0 mg NO3/l
Metals Cd
Zn
Cu
Pb
Ni
Cr
0.01-3.9 µg Cd/l
0.5-235 µg Zn/l
1-355 µg Cu/l
2-76 µg Pb/l
1-14 µg Ni/l
2-8 µg Cr/l
0.02-1.0 µg Cd/l
24-4880 µg Zn/l
6-3416 µg Cu/l
2-493 µg Pb/l
2-7 µg Ni/l
2-6 µg Cr/l
0.02-0.5 µg Cd/l
15-1420 µg Zn/l
21-140 µg Cu/l
98-170 µg Pb/l
0.3-13.0 µg Cd/l
120-2000 µg Zn/l
97-104 µg Cu/l
11-525 µg Pb/l
4-70 µg Ni/l
6-50 µg Cr/l
Organic compounds PAH 0.04 - 0.76 µg PAH /l 0.35 - 0.6 µg PAH /l - 0.24-17.1 µg PAH /l
Main ions Na, Mg, Ca, K, SO4, Cl 0.22-20.0 mg Na /l
0.03-0.33 mg Mg /l
1.1-67.13 mg Ca /l
0.46-0.65 mg Mg /l
0.56-14.4 mg SO4 /l
0.2-5.2 mg Cl /l
1-1900 mg Ca /l - 5.0-474.0 mg Na /l
1-1.4 mg Mg /l
13.7-57.0 mg Ca /l
1.7-3.8 mg Mg /l
5.1-139 mg SO4 /l
3.9-669.0 mg Cl /l
13 CHALMERS Architecture and Civil Engineering, Master’s Thesis ACEX30-18-95
3.2.1 Pollutant sources and transport
The primary pollutant sources in a catchment area include vehicle emissions, corrosion and
abrasion; building and road corrosion and erosion; animal feces; street litter deposition;
biodegradable matter such as fallen leaves and grass residues; and spills (Butler & Davies,
2004; Brown & Peake, 2006). Additionally, atmospheric pollution resulting from activities
such as heating, industry and waste incineration, and vehicular traffic contribute to atmospheric
fallout. Pollutants from these sources can be transported by wind, settle, or be absorbed and
dissolved by precipitation. In Gothenburg, the dilution of atmospheric pollutants by
precipitation is the dominant source of N, P, Pb, Zn, and Cd (Butler & Davies, 2004). Vehicles
emit volatile solids and polycyclic aromatic hydrocarbons (PAHs) resulting from the
combustion of fuels and lubricants. Also, wear of vehicle components leads to emissions of
hydrocarbons and heavy metals. Erosion from the urban environment, which includes but is
not limited to roads and buildings, produce particles of brick, concrete, and glass, which
constitute, together with urban debris, the suspended solids’ fraction in the water. Corrosion of
metallic surfaces releases toxic elements such as Cr, Zn, and Cu; de-icing procedures lead to
the increase in the annual chloride loads in stormwater. Also, sodium chloride enhances
pollutant emissions due to the acceleration of corrosion of vehicles and metal structures.
The flow of pollutants highly depends on the urban area and rain event characteristics
(Hartmann, et al., 2013). Different methods are used to express the pollutant concentration in
stormwater, where the event mean concentration, a simplified method that assumes a constant
level of pollutants in the stormwater for each rain event, is defined as the most straightforward
method. A drawback is the lack of information regarding water quality variations throughout
the length of the rain event. Therefore, this method is only used when the total pollutant load
is required.
Study of pollutants build-up and wash off is a common method to predict the stormwater
quality. Factors such as land use, population, traffic flow, street cleaning, seasonal variations,
meteorological conditions, dry periods, and surface types are used to estimate the build-up
processes of pollutants (Butler & Davies, 2004). Further, wash off processes are influenced by
rainfall characteristics, topography, solid particle characteristics, and street surface type.
Mathematical approaches are used to assess the accumulation and wash off of pollutants. The
reported concentrations of pollutants present a high variability as a result of the factors
previously exposed. The stormwater quality can vary by a factor of 10 between “clean” and
“dirty” catchment areas, while quality variations by a factor of 3 have been reported between
single events in a single defined catchment area (Ellis, 1986).
The initial portion of a rain-event runoff, called the first flush, is assumed to be more polluted
than the later portions (Hathaway, et al., 2012). Different methods are used to assess the first
flush of pollutants. For example, threshold methodologies are used to define the first flush
effect by comparing the fraction of total pollution transported in a segment of the total runoff
volume. However, the accuracy of the first flush term and its influencing factors are not entirely
understood. Some authors have defined the first flush as a function of the intensity of a rain
event and the percentage of impervious zones in the catchment area (Lee & Bang, 2000). Other
authors have not found any relation between the pollutant load distribution and rainfall and
catchment area characteristics (Saget, et al., 1996).

14 CHALMERS Architecture and Civil Engineering, Master’s Thesis ACEX30-18-95
3.2.2 Impacts of stormwater
The stormwater impacts on an area can be defined by hydrologic, chemical, biological, or
physical processes (Erickson, et al., 2013). The impacts of stormwater pollutants on water
bodies can be divided into acute and accumulative effects (Hvitved-Jacobsen, et al., 2010).
Bacterial contamination, high concentrations of soluble substances, and solids that cause
turbidity conditions are examples of acute toxic effects which result from pollutant discharges
after storm events (Pettersson, 1999). The variability of the pollutant loads between events
plays a vital role in the chemical and physical processes that occur in water bodies, particularly
in extreme events where higher runoff is achieved. On the other hand, cumulative effects, such
as eutrophication due to the over-discharge of nutrients, occur in relative long-terms (Figure
9). The spatial and temporal effects on receiving water bodies are shown in Appendix 1.
3.2.3 Frequently occurring pollutants in stormwater
The pollutants relevant in urban stormwater include dissolved and suspended solids,
biodegradable organic matter (oxygen-consuming materials), nutrients, heavy metals, organic
compounds, and pathogenic microorganisms (Butler & Davies, 2004; Hvitved-Jacobsen, et al.,
2010).
3.2.3.1 Suspended solids
Suspended solids follow complex processes that characterize its movement throughout the
system (Butler & Davies, 2004). Physical processes include particle degradation,
agglomeration, and flocculation; while chemical and biochemical processes include
dissolution, hydrolysis, precipitation, and biological oxidation. Every particulate-generating
activity in the catchment area is identified as a source of pollution.
Figure 9: Timescale effects of intermittent pollutant discharges. Source:
(Hvltved-Jacobsen, et al., 1994)

15 CHALMERS Architecture and Civil Engineering, Master’s Thesis ACEX30-18-95
Sediments settle on surfaces and are transported by overland flow to the urban drainage system,
where they are intended to be captured in gully pots before their entrance to the piped system.
Transport of solids in the drainage systems depends on the physical and chemical
characteristics of the solids, characteristics of the flow, and characteristics of the drainage
systems (Butler & Davies, 2004). Small particles with low density can remain in suspension
along the entire system under normal flow conditions. On the other hand, larger or denser
particles settle forming sediments, which can be re-suspended due to high flows. Different
settling points can be identified along the entire system. Therefore, sediment removal can be
achieved by different actions such as street sweeping, gully pot implementation, sewer
cleaning, and grit removal in the water treatment plant.
3.2.3.2 Biodegradable organic matter
The biodegradable organic matter is of particular interest due to the rapid consumption of
dissolved oxygen that can affect the survival of aquatic species and performance of the drainage
system. Biological oxygen demand (BOD) and chemical oxygen demand (COD) are the most
common parameters used to express the organic matter. As mentioned previously, BOD
concentrations in domestic sewage effluents are higher than in urban stormwater runoff. The
BOD concentrations in stormwater runoff are linked primarily to plant decaying material and
animal waste generated in the catchment area (Hvitved-Jacobsen, et al., 2010; Erickson, et al.,
2013).
3.2.3.3 Nutrients
Nutrients are assimilated by living organisms to promote their growth and development (van
der Perk, 2012). The type and amounts required for the adequate development of the biota
depend on each organism, but in general, nutrients include proteins, carbohydrates, fats,
minerals, among other components. The term nutrient is used to refer specifically to N and P.
These elements make up the group of primary macronutrients required by plants.
Nutrients undergo relative rapid cycling (van der Perk, 2012). Physical and chemical processes
determine the transfer of nutrients from organism to organism, which is achieved under natural
conditions along trophic levels by predation. Organic matter is then taken up by decomposing
bacteria, leading to the mineralization of nutrients. Pollutant emissions in the atmosphere, the
use of fertilizers, and human wastes enhance the loads of nutrients in the different
environmental compartments. The hydrologic cycle helps in the transport of nutrients, leading
to an enhancement in certain areas. This process is also referred as eutrophication.
Oligotrophic, mesotrophic, and eutrophic ecosystems are defined based on their degree of
eutrophication. Eutrophic ecosystems have high productivity of biomass which, in water
environments, lead to significant variations of dissolved oxygen due to an increase in
phytoplankton, weed, and aquatic macrophytes that lead to oxygen depletion and public health
drawbacks (van der Perk, 2012).
3.2.3.4 Metals
Metals are naturally present in the earth´s crust. As a result, they can cause natural
contamination of water bodies. Despite the existence of some specific and unique cases around
the globe, high concentrations of heavy metals are linked mostly to anthropogenic activity. Due
to their high availability and potential toxicity, the main groups of heavy metals linked to urban
drainage are Cu, Pb, Zn, Cd, Ni, and Cr (Butler & Davies, 2004; van der Perk, 2012; Björklund,
2011). The main problem associated with metals is the bioaccumulation of these non-
degradable inorganic substances in the environment and organisms, and the transfer of them
16 CHALMERS Architecture and Civil Engineering, Master’s Thesis ACEX30-18-95
through the trophic levels in the food chains. The toxicity of metals occurs in the organisms
due to their interaction with organic compounds. This interaction causes the death of the cells.
Considering criteria like frequency of occurrence in the environment, linked to toxicity and
therefore exposure to human lives, heavy metals are ranked as the most hazardous substance
in the environment (Xue, et al., 2017). Different geochemical processes affect the retention of
heavy metals in the environment or organisms (bioavailability), and therefore, their toxicity.
Metals can occur in soluble state, attached to particles, or in different oxidation numbers. Their
toxicity, fate, and transport highly depend on the speciation (Wuana & Okieimen, 2011). The
procedures established for their removal highly depended on the same factor. The attachment
of metals to suspended solids is of interest. Adsorption causes the heavy metals to attach to
different compounds (e.g., organic compounds, suspended solids, clay minerals), which
depending on various factors precipitate and form fixed sediment. The adsorption, as well as
the complexation and precipitation of heavy metals, highly depends on the pH of the water.
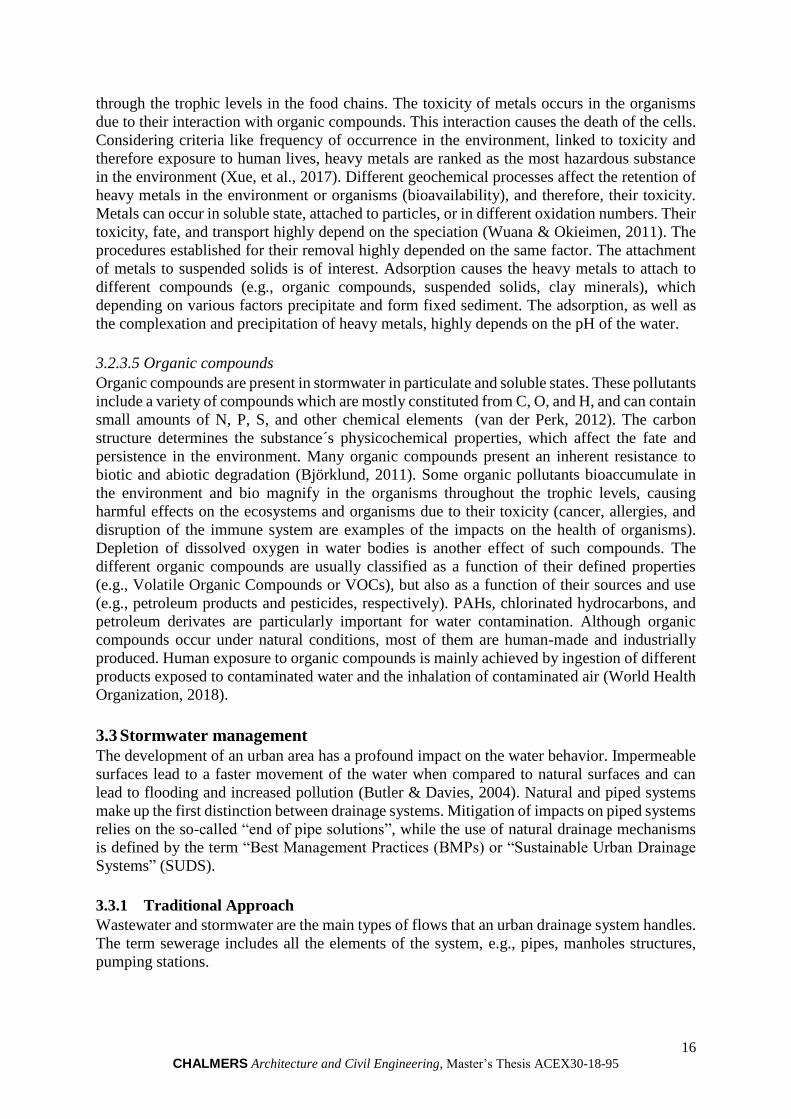
3.2.3.5 Organic compounds
Organic compounds are present in stormwater in particulate and soluble states. These pollutants
include a variety of compounds which are mostly constituted from C, O, and H, and can contain
small amounts of N, P, S, and other chemical elements (van der Perk, 2012). The carbon
structure determines the substance´s physicochemical properties, which affect the fate and
persistence in the environment. Many organic compounds present an inherent resistance to
biotic and abiotic degradation (Björklund, 2011). Some organic pollutants bioaccumulate in
the environment and bio magnify in the organisms throughout the trophic levels, causing
harmful effects on the ecosystems and organisms due to their toxicity (cancer, allergies, and
disruption of the immune system are examples of the impacts on the health of organisms).
Depletion of dissolved oxygen in water bodies is another effect of such compounds. The
different organic compounds are usually classified as a function of their defined properties
(e.g., Volatile Organic Compounds or VOCs), but also as a function of their sources and use
(e.g., petroleum products and pesticides, respectively). PAHs, chlorinated hydrocarbons, and
petroleum derivates are particularly important for water contamination. Although organic
compounds occur under natural conditions, most of them are human-made and industrially
produced. Human exposure to organic compounds is mainly achieved by ingestion of different
products exposed to contaminated water and the inhalation of contaminated air (World Health
Organization, 2018).
3.3 Stormwater management
The development of an urban area has a profound impact on the water behavior. Impermeable
surfaces lead to a faster movement of the water when compared to natural surfaces and can
lead to flooding and increased pollution (Butler & Davies, 2004). Natural and piped systems
make up the first distinction between drainage systems. Mitigation of impacts on piped systems
relies on the so-called “end of pipe solutions”, while the use of natural drainage mechanisms
is defined by the term “Best Management Practices (BMPs) or “Sustainable Urban Drainage
Systems” (SUDS).
3.3.1 Traditional Approach
Wastewater and stormwater are the main types of flows that an urban drainage system handles.
The term sewerage includes all the elements of the system, e.g., pipes, manholes structures,
pumping stations.

17 CHALMERS Architecture and Civil Engineering, Master’s Thesis ACEX30-18-95
Combined sewer systems transport wastewater together with stormwater in the same piped
systems, leading it to end of pipe solutions such as wastewater treatment plants. Under dry
weather conditions, the system carries mainly domestic and industrial wastewater. During
rainfall events, the flow increases, up to fifty to hundred times, due stormwater drainage
(Butler & Davies, 2004). Usually, due to economic aspects, the drainage systems and treatment
plants are not designed to handle the massive flows resulting from rain events throughout the
entire network. Therefore, the flows exceeding a certain level are diverted from the sewer
system and discharged directly into water bodies. The structures that handle and divert these
exceeding flows are called Combined Sewer Overflows (CSO). These structures are intended
to retain the first flush of pollutants during a rain event and direct it to the wastewater treatment
plant. The exceeding flow, containing a considerable amount of pollutants but assumed to be a
highly diluted mixture of storm- and wastewater, is then discharged to a receiving water body.
Separate systems consist of a parallel piped system which transport storm- and wastewater
separately. The main advantage of this system is the avoidance of CSOs. On the contrary, the
main disadvantages consist of higher costs of installation and the discharge of stormwater
without treatment. Figure 10 outlines the combined and separate sewer systems separately,
emphasizing in the water sources and the interaction with urban elements in the catchment area.
The advantages and disadvantages of both systems are described in Appendix 2.
Problems such as discharge of untreated wastewater through CSOs lead to the need of improved
runoff management. An increase in the transport capacity of the sewers cannot always be
achieved, due to the high costs related to the modifications of the existing infrastructure.
3.3.2 Sustainability in Urban Drainage Systems
Reducing the hydraulic load on the drainage system is an alternative to increase the transport
capacity of the system (Stahre, 2006). Various methods of local water detention have been
studied and proposed to handle the water before it is incorporated into the conventional
drainage system. These methods are named Best Management Practices (BMPs) and
correspond to less cost-intensive measures when compared to modifications in the entire
Figure 10: Urban water systems: Combined (left), Separate (right). Source: (Butler & Davies, 2004)

18 CHALMERS Architecture and Civil Engineering, Master’s Thesis ACEX30-18-95
drainage system. The BMPs aim to achieve a transition from the traditional approach by
handling the quantity and the quality of water while including social aspects involved in the
urban water drainage (Figure 11). Other labels, such as SUDS, “Low Impact Development”
(LID), “integrated catchment planning,” “Green infrastructure”, and “ecological stormwater
management” are used around the world to express the same line of action.
The official definition of BMPs consists of four elements listed below (Rossmiller, 2014):
1. Structural, physical, or managerial practices (e.g., activity schedules, prohibition of
practices, maintenance schemes) directed to the prevention and reduction of water
pollution.
2. Structural systems, activities, procedures, practices, and methods, which aim to
control site runoff and the emission of contaminants and spillage (or leaks) of
substances, sludge, or waste.
3. Programs, technologies, processes, measures, or devices that assist with the control,
prevention, removal, or reduction of pollution.
4. BMPs are classified into two major categories: source or treatment controls. Source
controls practices consist mostly of operational practices that aim to prevent
contamination at the point of emission, by decreasing pollutants avoiding their
interaction with stormwater. On the other hand, Treatment controls refer to
methods for water treatment that aim to remove pollutants already present in
stormwater.
To achieve sustainable urban drainage systems, the involvement of different stakeholders is of
vital importance. The principal stakeholders include decision-making, technical, and social
parties. New planning dimensions have been achieved with regards to urban drainage, resulting
in the integration of drainage facilities into the urban landscape by considering values such as:
Economic
Aesthetic
Recreational
Cultural
Historic
Educational
Environmental
Ecological
Biological
3.3.3 Sustainable drainage and treatment options
Sustainable urban drainage infrastructure should have the ability to handle stormwater safely
and to guarantee the proper operation of the systems without stressing resources, environment,
Sustainable Approach
Capacity
Capacity Quality
Amenity
Traditional Approach
Figure 11: Urban drainage transition concept. Adapted from:
(Stahre, 2006)

18 CHALMERS Architecture and Civil Engineering, Master’s Thesis ACEX30-18-95
and public health (Upadhyaya, 2013). The processes by which BMPs work are sedimentation,
filtration, sorption, plant uptake, infiltration, percolation, surface runoff, slow water drainage
and detention, volatilization, and microbial degradation (Horner, 1995). The BMPs can be
categorized with regards to their location throughout the urban water path: inlet and source
control, site control, and regional control (Stahre, 2006). The installation of the different
devices and treatment facilities is recommended based on the stage of the surface water
management train (Figure 12). Despite the fact that the use of different BMPs throughout the
entire water paths leads to better results, it is not always achievable. Therefore, the drainage
solutions must aim to the upper part of the management train, and when the drainage needs
cannot be achieved in that particular stage, the designers must move forward down in the line
of action (Butler & Davies, 2004).
It is important to recall that the distribution of precipitation events plays an essential role in the
long-term hydraulic and pollution removal performance of BMPs (Tetra Tech, Inc., 2008).
BMPs usually perform more efficiently for small rain events because they operate below their
hydraulic design capacity. Even though two locations have the similar annual average
precipitations, BMPs placed in a location with smaller but more frequent storm events will
have a best long-term cumulative performance than the one located in an area with mostly large
events. Frequency analysis of rain events is crucial to understand the reduction potential of
BMPs.
Specific alternatives for stormwater management and reduction of pollutants chosen for the
study are described below, and additional information including expected performance with
regards to technical, social, economic and environmental aspects is discussed in Section 6.2
and summarized in Appendix 6:
3.3.3.1 Green roofs
Green roofs may reduce the amount of water while retaining pollutants. Green roofs consist of
layered structures which include vegetation, soil and substrate, and various type of materials
that allow the proper and desired water drainage (Figure 13). The components vary according
to the different roofs types, and specific location constraints (Woods-Ballard, et al., 2015).
Figure 12: Surface water management train.
Source: (Butler & Davies, 2004)

19 CHALMERS Architecture and Civil Engineering, Master’s Thesis ACEX30-18-95
By increasing the permeable zones in a catchment area, light rainfall can be entirely absorbed
by the vegetation cover, leading to no generation of runoff. The hydraulic performance of a
green roof highly depends on factors such as the antecedent soil moisture in the system
(Woods-Ballard, et al., 2015). Studies in Sweden have shown that the yearly runoff volume
can be reduced by half with the use of green roofs (Stahre, 2006). Studies have also reported
reductions on the peak sewer flows ranging between 30-40% (Maskell & Sherriff, 1992). The
soil type and grass species are the two main factors on which the performance of green roofs
rely on (Rossmiller, 2014).
Through physical, biological, and chemical processes, pollutants in the rainwater are retained
in green roof structures. The pollutant retention potential highly depends on the vegetation and
materials used, as well as on the maintenance of the system. Problems might occur when
owners over-fertilize the green roofs, introducing nutrients into the system. Another benefit of
green roofs is reduced energy consumption linked to the improvement of the thermal
performance of buildings. Green roofs provide a highly valuable amenity. In addition to the
aesthetic value of this system, they also bring significant ecological value due to the
enhancement of urban biodiversity.
Despite the fact that green roofs are designed for minimal maintenance, the monitoring and
maintenance requirements are usually high. These systems required maintenance related to
mowing, litter removal, plant replacement and removal (invasive vegetation), and leakage
maintenance. Additionally, fire hazards are also present in this type of SUDs. Therefore, fire
retardant materials need to be considered in the design processes and the proper maintenance
of monitoring (Jotte, et al., 2017; American Society of Civil Engineers, 2014).
Figure 13: Typical section of a green roof. Source: (Woods-Ballard, et al., 2015)
Vegetation Substrate Filter fabric Drainage
Layer Root
Barrier Waterproof
membrane Roof

20 CHALMERS Architecture and Civil Engineering, Master’s Thesis ACEX30-18-95
3.3.3.2 Pervious pavements
Pervious pavements are commonly used to achieve surface runoff percolation while allowing
the presence of pedestrian and vehicular traffic (Figure 14). Materials such as coarse gravel,
natural stones, concrete blocks with open cells, and porous asphalts are used to achieve water
infiltration (Stahre, 2006). Reservoirs can be placed below the permeable surface to store runoff
before infiltration into the subsoil (Rossmiller, 2014). Pervious pavements are divided into
three main categories: permeable pavements, porous pavements, and reinforced grass/gravel
(Woods-Ballard, et al., 2015). Permeable pavements consist of the proper placement of
impermeable materials, allowing a space between them where water infiltrates. On the other
hand, porous pavements are surfaces of porous asphalt which enables the water to infiltrate in
the soil. Because these systems intend to handle the total runoff volume, the soil infiltration
capacity is a crucial aspect. Different design recommendations are presented by Woods-
Ballard, et al. (2015) as a function of the coefficient permeability of the soils.
Previous pavements have an important reduction potential of pollutants such as heavy metals,
oil and grease, sediments and to some extent, nutrients (Pagotto, et al., 2000; Woods-Ballard,
et al., 2015; Tota-Maharaj & Scholz, 2013; Legret, et al., 1999; Novotny, et al., 2010). The
principal processes by which pollutants are removed are filtration, adsorption, sedimentation,
as well as biodegradation of organic pollutants. The use of different materials such as
adsorption geomembranes can enhance the retention of pollutants.
Pervious pavements present risks of clogging linked to dust and sediments trapped in the
structure. The clogging of the structure reduces the performance of the system (United States
Environmental Protection Agency, 1999). As a consequence, regular monitoring and
maintenance are required to guarantee proper operation of the system. Removal of weed,
sweeping actions, water jet wash, brushing, and suction sweeping are commonly used remedial
actions. The potential use of the space for a wide range of activities is considered as a central
aspect in the implementation of pervious pavements. However, they do not provide any
biodiversity benefits.
Figure 14: Section view of three types of pervious pavements. Source: (Woods-Ballard, et al., 2015)
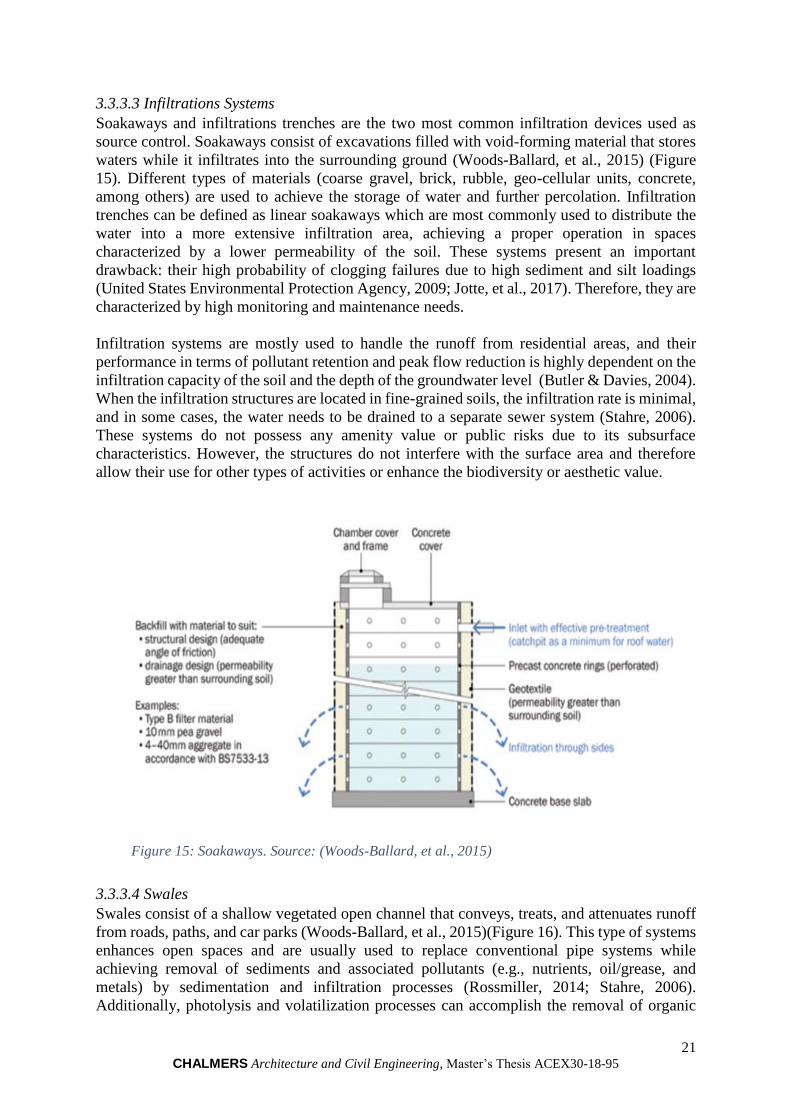
21 CHALMERS Architecture and Civil Engineering, Master’s Thesis ACEX30-18-95
3.3.3.3 Infiltrations Systems
Soakaways and infiltrations trenches are the two most common infiltration devices used as
source control. Soakaways consist of excavations filled with void-forming material that stores
waters while it infiltrates into the surrounding ground (Woods-Ballard, et al., 2015) (Figure
15). Different types of materials (coarse gravel, brick, rubble, geo-cellular units, concrete,
among others) are used to achieve the storage of water and further percolation. Infiltration
trenches can be defined as linear soakaways which are most commonly used to distribute the
water into a more extensive infiltration area, achieving a proper operation in spaces
characterized by a lower permeability of the soil. These systems present an important
drawback: their high probability of clogging failures due to high sediment and silt loadings
(United States Environmental Protection Agency, 2009; Jotte, et al., 2017). Therefore, they are
characterized by high monitoring and maintenance needs.
Infiltration systems are mostly used to handle the runoff from residential areas, and their
performance in terms of pollutant retention and peak flow reduction is highly dependent on the
infiltration capacity of the soil and the depth of the groundwater level (Butler & Davies, 2004).
When the infiltration structures are located in fine-grained soils, the infiltration rate is minimal,
and in some cases, the water needs to be drained to a separate sewer system (Stahre, 2006).
These systems do not possess any amenity value or public risks due to its subsurface
characteristics. However, the structures do not interfere with the surface area and therefore
allow their use for other types of activities or enhance the biodiversity or aesthetic value.
3.3.3.4 Swales
Swales consist of a shallow vegetated open channel that conveys, treats, and attenuates runoff
from roads, paths, and car parks (Woods-Ballard, et al., 2015)(Figure 16). This type of systems
enhances open spaces and are usually used to replace conventional pipe systems while
achieving removal of sediments and associated pollutants (e.g., nutrients, oil/grease, and
metals) by sedimentation and infiltration processes (Rossmiller, 2014; Stahre, 2006).
Additionally, photolysis and volatilization processes can accomplish the removal of organic
Figure 15: Soakaways. Source: (Woods-Ballard, et al., 2015)

22 CHALMERS Architecture and Civil Engineering, Master’s Thesis ACEX30-18-95
pollutants. Biodegradation and plant uptake assist in the removal of nutrients and dissolved
metals. The inclusion of filter bed can form part of the design processes, providing additional
treatment while preventing waterlogging in the system.
The linear characteristics of a swale allow its installation and easy incorporation in areas nearby
roads (Woods-Ballard, et al., 2015). On the other hand, the features of a swale present a
problem in highly dense urban areas where space is a limitation. These systems have an optimal
operation and pollutants reduction potential for small rain events. But instead, they require peak
flow conveyance structures to handle the amounts of water associated with large rain events.
The enhancement of the visual environment is achieved through vegetation, which needs to
follow planting strategies for optimal operation. They are usually shallow surface structures
that do not present high risks. Nevertheless, depending on the on the location and the public
exposure, barriers may be required to mitigate risks associated with vehicles.
3.3.3.5 Dry detention basins
Dry detention basins are designated flooding areas used for temporary water storage and
retention of pollutants, which can be designed to handle rain events with a return period of 2
to 100 years (Erickson, et al., 2013; Stahre, 2006; Rossmiller, 2014)(Figure 17). These systems
consist of a depression ground surface fitted with water inlets and outlets that allow collection
of stormwater while achieving a flow attenuation (Woods-Ballard, et al., 2015).
The water detention time is a crucial aspect in the retention of pollutants. Longer water
detention times achieve a higher removal of contaminants such as sediments, nutrients, heavy
metals, oxygen-demanding pollutants, and organic pollutants. The settling of solid particles
produces most contaminant removal. Retention of 30-65% of total suspended solids and 15-
45% of total phosphorus has been reported across the United States (Erickson, et al., 2013;
Rossmiller, 2014). The use of vegetation enhances the potential of pollutant removal (Woods-
Ballard, et al., 2015). Although, hard surface detention ponds are commonly used in highly
densified urban areas as public spaces where playgrounds or sports facilities are often located.
The exposure of these systems to the public involves the need to develop information
campaigns to reduce health risks and system failures risks associated with clogging of the inlet
and outlet structures due to litter. The features of a dry detention pond need regular maintenance
to achieve a proper performance of the system. These maintenance needs are highly dependent
on the specific design of the system, but usually, they do not encompass high costs. The
Figure 16 Section view of a Swale. Source: (Woods-Ballard, et al., 2015)

23 CHALMERS Architecture and Civil Engineering, Master’s Thesis ACEX30-18-95
activities that make up the operation and maintenance of dry detention basins include removing
of litter and cleaning, grass mowing, structures inspection, and occasional remedial actions.
3.3.3.6 Wet retention basins
Wet retention basins, also referred as ponds, are systems that consist of a permanent pool of
water that aim to attenuate the peak flows and treat the pollutants of stormwater runoff.
Although, volumetric control is not a feature of ponds due to the lack of water interception.
These systems usually contain vegetation that enhances the removal of contaminants by
adhesion and aerobic decomposition (Woods-Ballard, et al., 2015). The volume of the pond
and the water detention time affects directly the performance of the systems in term of
sedimentation of particles and attenuation of peak flows. Large volumes usually provide more
extended detention periods that allow higher efficiencies in particle removal.
The performance of ponds is highly linked to the design, proper maintenance, and proper
operation of the system (Woods-Ballard, et al., 2015). Management plans need to be
established to ensure the adequate implementation of maintenance and remedial actions. The
different design characteristics for ponds define the management features. Nevertheless,
primary operations include the removal of litter and debris, maintenance works on vegetation,
monitoring to the different structures (inlet, outlet, and pretreatment structures), and occasional
removal of sediments.
The public acceptance is strongly related to the aesthetic value, where highly contaminated
ponds usually have negative aesthetic value and are associated with high public risks.
Additionally, the enhancement (or negative impacts o-) the biodiversity is also related to the
concentration of pollutants in the system. On the other hand, ponds with low pollution levels
have a great aesthetic, educational, and recreational value, as well as a habitat value for
different animal species.
Figure 17: Plant and section view of a dry detention basin. Source: (Woods-Ballard, et
al., 2015)

24 CHALMERS Architecture and Civil Engineering, Master’s Thesis ACEX30-18-95
3.3.3.7 Manhole filters
Manhole filters are structures which use physical and chemical processes to achieve pollutant
removal (Woods-Ballard, et al., 2015). These systems differ depending on the type or
manufacturer of the filter, but the principal processes that occur inside the filter´s structure are
sedimentation, filtration, sorption, and precipitation. Filtration devices are useful for the
removal of suspended particles which, due to its small size, are not directly affected by
gravitational processes. Filters can also remove dissolved solids, but their performance is
highly dependent on the technology used in the system. The filtering media is the essential
element in terms of pollutant retention. A wide range of materials can be used as filtering
media, from which the most common are leaf compost, pleated fabric, cellulose, activated
charcoal, perlite, and sand (Woods-Ballard, et al., 2015). Peak flows are one of the main
problems associated with these systems because they do not hold a proper capacity of flows
reduction. Therefore, peak flow conveyance structures need to be installed upstream to control
the flows. Additionally, overflow structures are usually placed in the system to prevent
structural damage.
The reliability of these systems also depends on the sediment loading rates. Filters present a
high probability of clogging under high sediment loadings, which leads to continuous
monitoring, maintenance, and replacement needs. The underground (hidden) characteristics
imply a difficulty in the identification of malfunctioning or failure events. The frequency of
filter replacement varies as a function of different aspects such as the site- and system-specific
characteristics.
Filtering systems are usually sold under prefabricated standards, and their capital cost is often
lower when compared to other structures. The wide variety of filter designs available on the
market provide a wide range of treatment processes that lead to different results. The nature
and load of pollutants, as well as the characteristics of the filter, determine the performance of
a specific device to treat the stormwater runoff appropriately. The manufacturers provide clear
guidance with regards to the systems which they produce. Filters do not provide amenity nor
biodiversity benefits, but their underground characteristics allow the utilization of surface areas
to different types of activities.
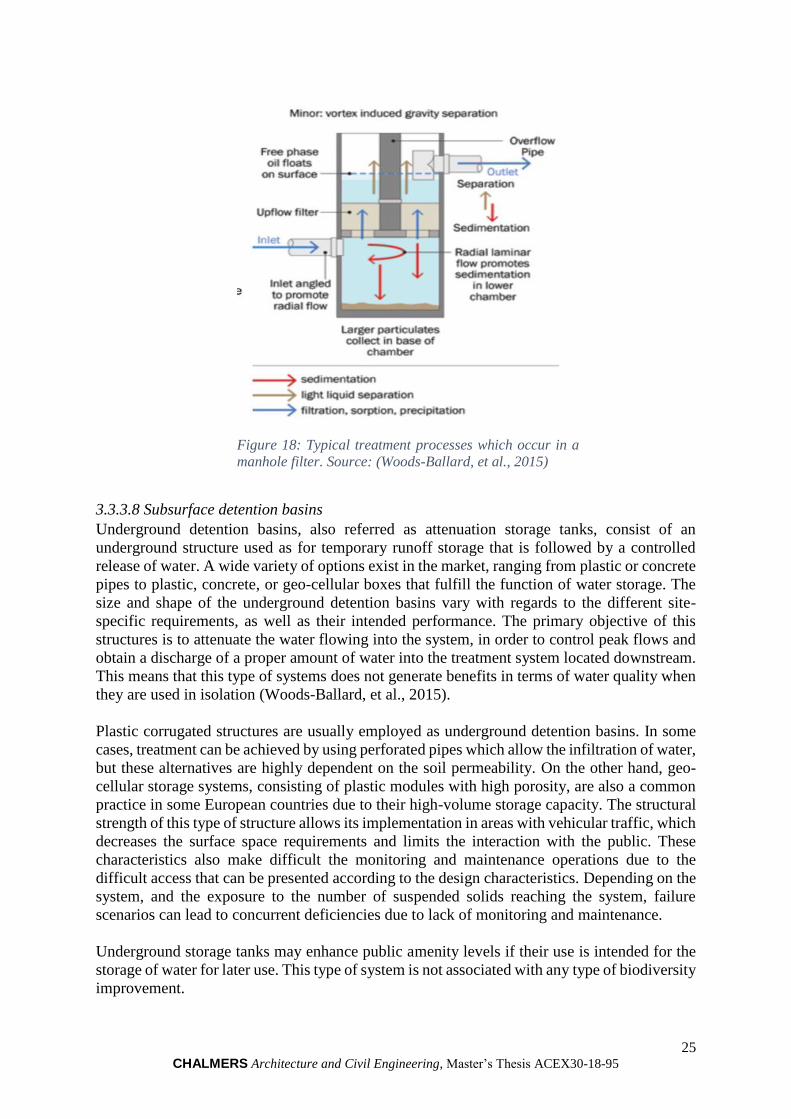
25 CHALMERS Architecture and Civil Engineering, Master’s Thesis ACEX30-18-95
3.3.3.8 Subsurface detention basins
Underground detention basins, also referred as attenuation storage tanks, consist of an
underground structure used as for temporary runoff storage that is followed by a controlled
release of water. A wide variety of options exist in the market, ranging from plastic or concrete
pipes to plastic, concrete, or geo-cellular boxes that fulfill the function of water storage. The
size and shape of the underground detention basins vary with regards to the different site-
specific requirements, as well as their intended performance. The primary objective of this
structures is to attenuate the water flowing into the system, in order to control peak flows and
obtain a discharge of a proper amount of water into the treatment system located downstream.
This means that this type of systems does not generate benefits in terms of water quality when
they are used in isolation (Woods-Ballard, et al., 2015).
Plastic corrugated structures are usually employed as underground detention basins. In some
cases, treatment can be achieved by using perforated pipes which allow the infiltration of water,
but these alternatives are highly dependent on the soil permeability. On the other hand, geo-
cellular storage systems, consisting of plastic modules with high porosity, are also a common
practice in some European countries due to their high-volume storage capacity. The structural
strength of this type of structure allows its implementation in areas with vehicular traffic, which
decreases the surface space requirements and limits the interaction with the public. These
characteristics also make difficult the monitoring and maintenance operations due to the
difficult access that can be presented according to the design characteristics. Depending on the
system, and the exposure to the number of suspended solids reaching the system, failure
scenarios can lead to concurrent deficiencies due to lack of monitoring and maintenance.
Underground storage tanks may enhance public amenity levels if their use is intended for the
storage of water for later use. This type of system is not associated with any type of biodiversity
improvement.
Figure 18: Typical treatment processes which occur in a
manhole filter. Source: (Woods-Ballard, et al., 2015)

26 CHALMERS Architecture and Civil Engineering, Master’s Thesis ACEX30-18-95
3.3.4 Integrated urban planning
The obstacles encountered by integrated planning are more pronounced in large cities, where
it has been evidenced that the staff in the city’s administrations are reluctant to new ideas linked
to sustainable urban drainage systems (Stahre, 2006). However, the results of implementing
this new approach have led to very innovative, successful, and interesting results regarding
drainage solutions. The Scharnhauser Park in Ostfildern, Germany, is an excellent example of
the implementation of successful BMPs. The urban planning process, developed under a
sustainable approach, led to the installation of drainage swales, open channels, green rooftops,
and water detention spaces (Knox, 2012). The BMPs installed can handle, without a problem,
water runoff from a rain event with a return period of 100 years in an area characterized by low
soil permeability (Figure 19). The integrated approach, which compromises the installation of
different BMPs along the water path, considers the entire process as a treatment train and has
led to significant results in terms of water volume attenuation, pollutant reduction, and social
enhancement.
3.3.5 Example of stormwater management approach – relevance of public participation
The United States Environmental Protection Agency developed stormwater monitoring
programs where the different characteristics concerning water quantity and quality where
identified (United States Environmental Protection Agency, 2000). The Stormwater Phase I
plan was developed in 1990 to follow the Clean Water Act (CWA), which aimed to create the
instruments to address stormwater runoff in medium and large municipalities, as well as other
defined areas such as industrialized zones. Following the programs developed in Phase I,
Stormwater Phase II expanded the practices to achieve a reduction on the pollution associated
with stormwater runoff, including components such as (Upadhyaya, 2013) :
Public education and outreach
Public involvement
Illicit discharge detection and elimination
Construction site runoff control
Post-construction runoff control
Pollution and prevention for municipal operations
Figure 19: Scharnhauser Park, Stuttgart, Germany. Sources: Left Picture (Knox, 2012); Right
picture: (Dittmer, 2017)
27 CHALMERS Architecture and Civil Engineering, Master’s Thesis ACEX30-18-95
Different approaches to stormwater management have been developed. The California
Stormwater Quality Association (CASQA) sets a management approach where six different
types of outcome levels are introduced and defined as the back structure of strategic planning.
These different outcomes establish the measurability and the requirements needed to achieve
successfully the planning and assessment tasks, which present a relation between them. In other
words, the outcomes are seen as a progression of conditions that need to be evaluated,
addressed, and further developed to achieve the objectives. The outcomes are grouped into
three principal managerial components (California Stormwater Quality Association, 2015):
Stormwater Management Programs: Defined as the various activities that are
defined under a specific program.
Target Audiences: Directed exclusively to the behavior of the audiences which are
exposed to the programs. Additionally, includes all the factors that can influence
these behaviors such as public knowledge, awareness, and general understanding of
the problems. A wide range of different behaviors can be evaluated, and they are
usually classified as a function of the water sources. For example, municipal sources
include audiences such as road workers, municipal employees, staff; residential
sources contain audiences such as homeowners, gardeners, school children;
industrial and commercial sources include owners, operators, employees;
construction and development sources include developers, engineers, contractors,
among others.
Sources and impacts: Correspond to all the physical components of the management
approach, where the generation, transport, and fate of pollutants inside the urban
environment are assessed.
From the previous program, it is essential to recall the importance of integrated urban
participation, highlighting the necessity to include social, industrial, and commercial key-
players in the processes of development, assessment, and improvement of the stormwater
systems. In conjunction with the technical, environmental, and economic aspects, the
community interaction component must be appraised in the evaluation of stormwater
management systems in an urban area. Besides being economically and environmentally
acceptable, any stormwater management technology must also be accepted by residents in
residential areas (Apostolaki, Jefferies, & Wild, 2006). This aspect strongly relates, while
giving more weight and importance, to the sustainability approach in urban drainage.
3.4 Stormwater regulation in Sweden
The Water Framework Directive (WFD) regulates and sets out the rules to mitigate the
detriment of the European water bodies (European Parliament, 2000). By implementing
management plans, environmental quality standards (EQS), and program measures, European
countries were required to achieve by the year 2015 a good ecological and chemical status for
their inland surface waters, transitional waters, coastal water, and groundwater (Michanek,
2011). Among the objectives stated by the WFD, the discharges of priority hazardous
substances should be gradually ceased. Despite the fact that stormwater does not form an
explicit part of the directive, the focus directed to pollution and maintenance of good water
quality is strongly involved in stormwater management (Soderberg, 2011).
Requirements on stormwater management are imposed through the elaboration of action plans
that lead to a mitigation of the impacts on water recipients. The Swedish Environmental Code
contains no explicit regulations regarding stormwater (Lindh, 2013). However, the term is
regulated as wastewater and drainage water. Wastewater is defined under the legal term

28 CHALMERS Architecture and Civil Engineering, Master’s Thesis ACEX30-18-95
“environmental hazardous activities”, requiring water treatment before discharge. Söderberg
(2011) considers this aspect as a contradictory fact due to the actual lack of treatment of CSOs.
On the other hand, stormwater resulting from areas outside of zoning districts and cemeteries
is regulated as road runoff, directed to the land drainage actions, and defined under the legal
term “water operation”.
The water authorities define the EQS as regulations that aim to protect human health and
environment by maintaining good water quality for all water bodies (Lindh, 2013). Threshold
standards are defined as the maximum concentrations of contaminants allowed and are
determined based on the recipients and their expected water quality. Under the stormwater
framework, Söderberg (2011) considers EQS as a good instrument to attack diffuse sources of
pollutants due to the focus on recipient’s minimum quality levels instead of individual
standards of discharges.
The Planning and Building Act (PBL) plays an essential role in establishing the provisions
directed to the planning of land, water, and construction areas (Boverket, 2016). In this respect
and based on the Public Water Services Act (SFS 2006:412), the municipalities have a legal
influence on installation and management of water supply and sewerage facilities (considering
certain conditions established by the act). Therefore, municipalities are the responsible entities,
dealing with water and land use in the area, to achieve the objectives and EQS compliancy.
The Swedish Transport Administration (Trafikverket) is the responsible authority at the
moment of dealing with stormwater from non-municipal roads.
3.5 Decision aiding tools
Decision-making processes consist of three major components: decision makers, decision
alternatives, and consequences of the decision (Zarghami & Szidarovszky, 2011). Different
actors play different and specific roles in each of the three components of the decision-making
process.
Decision aiding activities help to obtain answers to questions which different stakeholders
possess in a decision process (Figueira, et al., 2005). To identify and study different alternatives
from which the best solution can be achieved, different factors and considerations from the
decision-makers come into play. The elements aim to clarify the decision to take place and to
promote a line of action that complies with the stakeholder objectives. The elements play a role
in the judgment of the available alternatives, and its multiplicity plays an essential role in the
complexity of the processes. Under the scope of this report, two main decision-aiding
techniques are described: monetary-based techniques and Multi-criteria analysis.
3.5.1 Monetary-based techniques
Monetary based techniques can be categorized as financial analysis, cost-effectiveness
analysis, and cost-benefit analysis. Financial analysis is an assessment of how a specific option
may impact the costs and revenues of a decision-making organization (Department for
Communities and Local Government, 2009). As part of the financial analysis, Regulatory
Impact Assessments (RIAs) are included to assess the effects on the budgets and public
expenditure of the considered proposal. For a better and precise understanding of the financial
effects, budget impacts expressed over an extended period are discounted over each year to
present net value.
Cost-effectiveness analysis is a method to evaluate, by comparing different established options,
the least-costly way of achieving a specific objective. The objective usually has characteristics
29 CHALMERS Architecture and Civil Engineering, Master’s Thesis ACEX30-18-95
that prevent it from being evaluated in monetary terms. Cost-benefit analysis aims to evaluate
the expected effects (positive and negative) of a project in monetary terms. The evaluation is
based on well-developed economic theories of valuation that rely on two principal aspects: the
willingness-to-pay and willingness-to-accept (Department for Communities and Local
Government, 2009). Willingness-to-pay is linked to the potential beneficiaries of the options
to be implemented, while willingness-to-accept is linked to the negatively-affected parties. As
a consequence of evaluating the different options in monetary terms, the attractiveness of each
one of them is strongly related to the relationship between benefits and losses. Therefore, the
most attractive solution is the one where the benefits exceed the losses.
Monetary techniques have been used for many decades in water resources planning and
environmental management, where the alternative with the highest difference between benefits
and cost is selected. Problems of this traditional method include evaluating criteria or
alternatives in monetary terms. Intangible costs and benefits are presented in different projects,
and high inaccuracies can occur at the moment of quantifying the values. Benefits and costs
linked to social aspects, as for example social satisfaction and the related increase (or decrease)
of social cohesion, can present difficulties when designated as a monetary value (Department
for Communities and Local Government, 2009). Additionally, (Loucks & van Beek, 2005)
state that a complete use of monetary units to describe the objectives does not address precisely
the distributional issue between which stakeholder pays the costs, which stakeholder benefits,
and to what extend they benefit or loose. Therefore, the application of multi-criteria analysis,
which, by including social aspects, is considered to achieve more realistic solutions for water
and environmental management.
3.5.2 Multi-criteria analysis (MCA)
Multi-criteria decision-making methods are suitable tools for approaching complex problems.
Usually, these problems feature high uncertainties linked to the establishment of objectives or
the inclusion of different perspectives in biophysical and socio-economic systems (San
Cristóbal Mateo, 2012). The central role of the MCA is to handle the difficulties encountered
by the stakeholders regarding the vast amount of information that can be present in decision
processes. Based on monetary and non-monetary objective evaluation, MCA can result in the
establishment of a best single alternative, on a ranking process of alternatives, or the
determination of acceptable and unacceptable alternatives under specific contexts (Department
for Communities and Local Government, 2009).
The high number of variables related to water resources and environmental management
problems can be assessed by characterizing different criteria established to achieve defined
goals. Under a sustainability framework, social, economic, and environmental objectives are
established to achieve the defined goal (Zarghami & Szidarovszky, 2011). The implementation
of sustainable urban drainage systems may intend to accomplish environmental, social,
economic, and technical objectives, to achieve the goal of handling and managing runoff
appropriately in urban areas. In this sense, the main idea of an MCA is to evaluate how different
alternatives or projects can fulfill different established criteria (Rosen, et al., 2013).
Balasubramaniam & Voulvoulis (2015) reviewed the application and the appropriateness of
MCA for different environmental problems such as Environmental Impact Assessments (EIA),
waste management, and water quality and resources. The authors conclude that the nature of
the problems addressed by environmental aspects leads to the rise of decision-aid requirements
that, in most of the cases, MCA meets.

30 CHALMERS Architecture and Civil Engineering, Master’s Thesis ACEX30-18-95
The construction of an MCA is based on different factors that lead to the evaluation of the
alternatives against established criteria, and further evaluation of results. Each step is based on
the goals and objectives established for the project. Therefore, all the different components of
an MCA must be built from the initial step of establishing the goals. Seven essential steps,
illustrated in Figure 20, make-up the process of building and MCA (Department for
Communities and Local Government, 2009).

31 CHALMERS Architecture and Civil Engineering, Master’s Thesis ACEX30-18-95
Step 1:• Identification of the goal
Objectives desired to be achieved.
• Establishment of the decision context
Includes but is not limited to: Resources, Limitation, physical
boundaries, actors involved andaffected
Step 2:• Identification of alternatives:
Selection of the options that are considered adequate to meet the
established objectives.Step 3:
• Establishment of the criteria
The elements by which the alternatives will be judged to
determine the level of compliance with the objectives.
Step 4:• Performance evaluation of alternatives
Scoring of alternatives against the criteria (performance matrix)
Reevaluation of alternatives
Step 5:• Weighting of the criteria
i.e. Assign weights to that criteria, so their relative importance in the
process is expressed.Step 6:
• Calculate the overall score of the
alternatives
i.e., the product of the score of each
alternative with the weight of the criteria results in the ranking of alternatives.
Step 7:• Results analysis
Are the objectives achieved?
Ob
ject
ives
eval
uat
ion
Reevaluation of
criteria
Ree
val
uat
ion o
f al
tern
ativ
es
Figure 20: Steps of an MCA. Adapted from (Department for Communities and Local Government, 2009)
32 CHALMERS Architecture and Civil Engineering, Master’s Thesis ACEX30-18-95
3.5.2.1 Identification of the goal and establishment of the decision context
The decision context of an MCA is made up by three components: the stakeholders, the
involved parties or key-players, and the aims and objectives (Department for Communities
and Local Government, 2009). Stakeholders are defined as the final decision makers in the
process. They establish the goals and preferences, expecting positive outcomes of the MCA
based on their investments. The main role in the method is to structure the alternatives and
criteria of the evaluation. Despite the fact that conflicting priorities and opinions can arise, the
MCA method is based on the coherence and consistency of preferences between the parties.
MCA is not just limited to the stakeholders’ opinions. Key-players need to be identified and
involved in the process. Even though the final decision does not rely on them, they have an
indirect influence on the project. Any party or individual with a potential contribution to the
MCA plays an important role by providing their advice and opinion.
Munier (2011) proposes four entities that should be included in all MCA which intend to solve
environmental issues:
Decision making entity
Technicians who supply quantitative and qualitative information
An analyst who process the data
Citizens
The social and technical aspects of an MCA need to be considered together, based on the impact
of the alternatives and their evaluation (Department for Communities and Local Government,
2009). Depending on the magnitude of the impacts, different stakeholder and key-players
represent interest groups that will cover the different objectives and criteria.
The context that surrounds the decision-making process (which involves aspects such as the
goals, resources, potential problems, strengths, weakness, among others) needs to be
characterized, detailed, and apprehended to achieve a line of joint action between the MCA
players. As mentioned previously, one of the key aspects of MCA is to achieve a common
consensus with regards to the goals to be achieved, and not contradictory goals and opinions
that would occur and affect the process. The clarification of the goals helps to define the tasks
and further stages of the analysis, keeping the whole process on its course (Department for
Communities and Local Government, 2009).
3.5.2.2 Identification and selection of alternatives
The primary source of alternatives is the stakeholders´ experiences and interests. Alternatives
can range from policies, to specific projects determined (Department for Communities and
Local Government, 2009). When MCAs are used to explore the opportunities for
implementation of innovative processes, the number of alternatives can be relatively high. The
identification of alternatives is based on acceptable and not-acceptable analysis, usually based
on funding opportunities.
Previous research and past implementation are another good source of alternatives. Depending
on the specificities of the alternatives, a vast amount of information can be found as part of
literature review, depending on the global development and their application. Further steps in
an MCA may lead to a reevaluation of the alternatives established previously, creating an
iterative process (dotted lines in Figure 20) that lead to more integrate and accurate results
(Department for Communities and Local Government, 2009).

33 CHALMERS Architecture and Civil Engineering, Master’s Thesis ACEX30-18-95
3.5.2.3 Establishment of criteria
The criteria are the major established components on which the alternatives are judged, and the
final decision is built (Department for Communities and Local Government, 2009). This means
that they represent the conditions or restrictions that the project is subject to (Munier, 2011).
The criteria are defined based on the categories which are intended to evaluate the performance
of the different alternatives. Under a sustainable development framework, the principal
categories consist of environmental, economic and social aspects. Ellis et al. (2004) established
technical, environmental, social and economic factors as the prime potential sustainability
criteria to evaluate and compare urban drainage options. Here, capital and operation-
maintenance (O&M) costs, resources use, public acceptability, performance of the alternatives,
and maintenance needs are contemplated under the proposed framework (Figure 21).
The criteria need to be flexible and dynamic to be adapted and redefined to meet modifications,
or further implementation, of the different aspects that each of the alternatives can include.
Criteria come as a result of the specific objectives established in previous stages and are
evaluated or quantified by indicators. Indicators contain baseline information and values that
quantify or qualify each of the criteria. In this sense, these values diagnose the conditions that
describe the properties of each of the criteria and are defined as numeric values or subjective
descriptors (Ellis, et al., 2004).
As part of the process, exclusion criteria define specific alternatives as invalid or unsuitable for
particular cases. Usually, these exclusion criteria hold a technical or scientific nature, and
clarify inherent imperfections, or impairments of the alternatives related to physical constraints
(Ellis, et al., 2004). This step in considered in the MCA and evaluated in the initial steps.
The criteria need to follow specific characteristics that are determined by the principal
objectives. In this sense, primary requirements and needs for the establishment of criteria can
be defined as (Moura, et al., 2011):
Relevance – Do the criteria correspond to relevant aspects of the process concerning
the achievement of the objectives?
Figure 21: Sustainable Urban Drainage System triangle and the
relation to sustainable criteria and stakeholder preferences.
Source: (Ellis, et al., 2004)
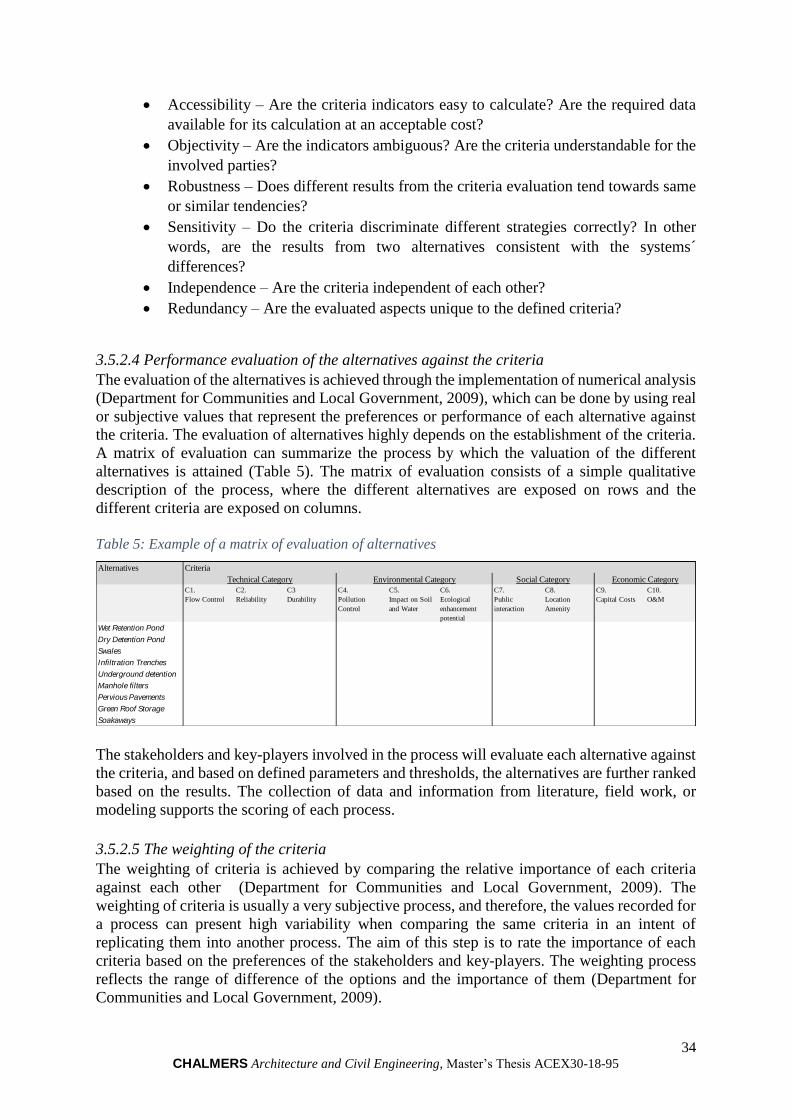
34 CHALMERS Architecture and Civil Engineering, Master’s Thesis ACEX30-18-95
Accessibility – Are the criteria indicators easy to calculate? Are the required data
available for its calculation at an acceptable cost?
Objectivity – Are the indicators ambiguous? Are the criteria understandable for the
involved parties?
Robustness – Does different results from the criteria evaluation tend towards same
or similar tendencies?
Sensitivity – Do the criteria discriminate different strategies correctly? In other
words, are the results from two alternatives consistent with the systems´
differences?
Independence – Are the criteria independent of each other?
Redundancy – Are the evaluated aspects unique to the defined criteria?
3.5.2.4 Performance evaluation of the alternatives against the criteria
The evaluation of the alternatives is achieved through the implementation of numerical analysis
(Department for Communities and Local Government, 2009), which can be done by using real
or subjective values that represent the preferences or performance of each alternative against
the criteria. The evaluation of alternatives highly depends on the establishment of the criteria.
A matrix of evaluation can summarize the process by which the valuation of the different
alternatives is attained (Table 5). The matrix of evaluation consists of a simple qualitative
description of the process, where the different alternatives are exposed on rows and the
different criteria are exposed on columns.
The stakeholders and key-players involved in the process will evaluate each alternative against
the criteria, and based on defined parameters and thresholds, the alternatives are further ranked
based on the results. The collection of data and information from literature, field work, or
modeling supports the scoring of each process.
3.5.2.5 The weighting of the criteria
The weighting of criteria is achieved by comparing the relative importance of each criteria
against each other (Department for Communities and Local Government, 2009). The
weighting of criteria is usually a very subjective process, and therefore, the values recorded for
a process can present high variability when comparing the same criteria in an intent of
replicating them into another process. The aim of this step is to rate the importance of each
criteria based on the preferences of the stakeholders and key-players. The weighting process
reflects the range of difference of the options and the importance of them (Department for
Communities and Local Government, 2009).
Alternatives
C1.
Flow Control
C2.
Reliability
C3
Durability
C4.
Pollution
Control
C5.
Impact on Soil
and Water
C6.
Ecological
enhancement
potential
C7.
Public
interaction
C8.
Location
Amenity
C9.
Capital Costs
C10.
O&M
Wet Retention Pond 2.0 4.0 5.0 4.6 4.8 5.0 3.0 2.6 5.0 4.0
Dry Detention Pond 4.0 2.0 5.0 4.1 4.0 3.5 3.0 3.4 5.0 4.0
Swales 3.0 2.0 3.0 3.4 3.0 4.0 3.3 2.9 5.0 4.0
Infiltration Trenches 5.0 1.0 2.5 3.6 1.8 1.0 2.3 1.5 3.5 2.0
Underground detention 2.0 4.5 3.5 1.8 5.0 0.0 2.5 2.0 3.5 3.0
Manhole filters 0.0 2.0 1.0 2.7 5.0 0.0 2.5 2.0 4.0 1.5
Pervious Pavements 5.0 2.0 2.5 3.0 2.5 0.0 2.8 3.0 3.0 2.3
Green Roof Storage 1.0 3.0 2.5 1.9 5.0 4.0 3.5 4.9 4.0 2.8
Soakaways 5.0 2.0 3.0 2.1 1.0 0.5 2.5 2.0 2.5 3.5
Economic CategoryTechnical Category Environmental Category Social Category
Criteria
Table 5: Example of a matrix of evaluation of alternatives
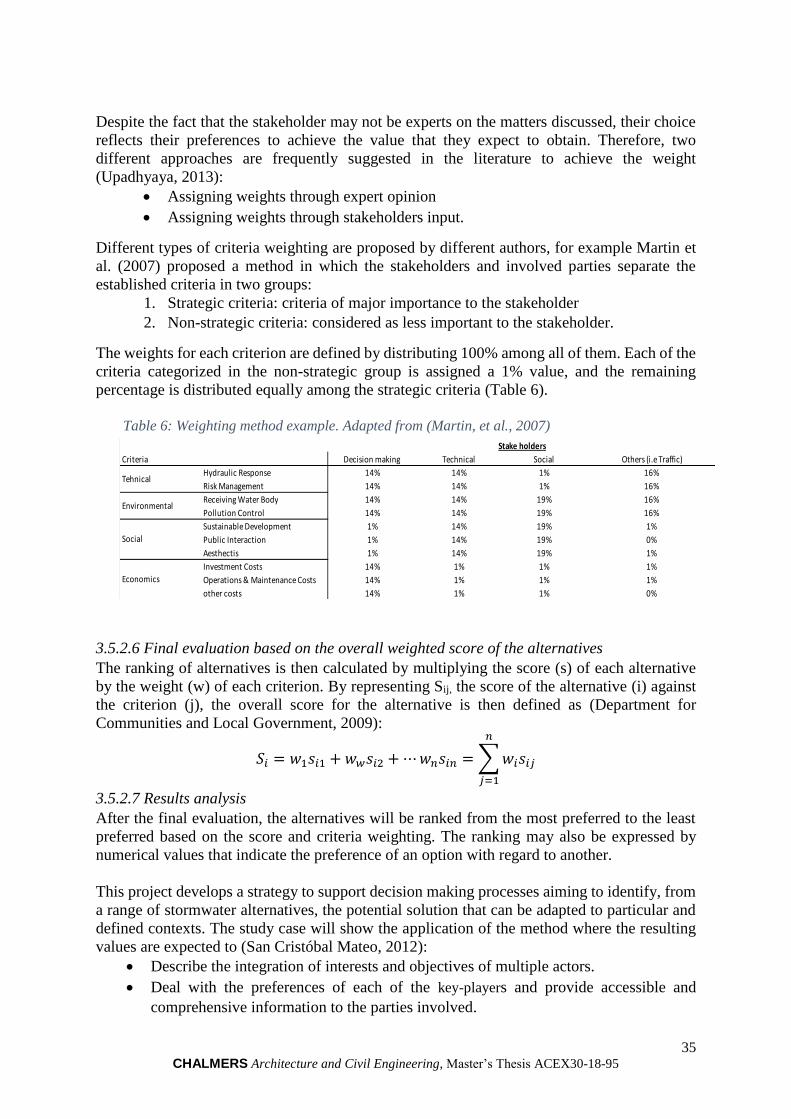
35 CHALMERS Architecture and Civil Engineering, Master’s Thesis ACEX30-18-95
Despite the fact that the stakeholder may not be experts on the matters discussed, their choice
reflects their preferences to achieve the value that they expect to obtain. Therefore, two
different approaches are frequently suggested in the literature to achieve the weight
(Upadhyaya, 2013):
Assigning weights through expert opinion
Assigning weights through stakeholders input.
Different types of criteria weighting are proposed by different authors, for example Martin et
al. (2007) proposed a method in which the stakeholders and involved parties separate the
established criteria in two groups:
1. Strategic criteria: criteria of major importance to the stakeholder
2. Non-strategic criteria: considered as less important to the stakeholder.
The weights for each criterion are defined by distributing 100% among all of them. Each of the
criteria categorized in the non-strategic group is assigned a 1% value, and the remaining
percentage is distributed equally among the strategic criteria (Table 6).
3.5.2.6 Final evaluation based on the overall weighted score of the alternatives
The ranking of alternatives is then calculated by multiplying the score (s) of each alternative
by the weight (w) of each criterion. By representing Sij, the score of the alternative (i) against
the criterion (j), the overall score for the alternative is then defined as (Department for
Communities and Local Government, 2009):
𝑆𝑖 = 𝑤1𝑠𝑖1 + 𝑤𝑤𝑠𝑖2 +⋯𝑤𝑛𝑠𝑖𝑛 =∑𝑤𝑖𝑠𝑖𝑗
𝑛
𝑗=1
3.5.2.7 Results analysis
After the final evaluation, the alternatives will be ranked from the most preferred to the least
preferred based on the score and criteria weighting. The ranking may also be expressed by
numerical values that indicate the preference of an option with regard to another.
This project develops a strategy to support decision making processes aiming to identify, from
a range of stormwater alternatives, the potential solution that can be adapted to particular and
defined contexts. The study case will show the application of the method where the resulting
values are expected to (San Cristóbal Mateo, 2012):
Describe the integration of interests and objectives of multiple actors.
Deal with the preferences of each of the key-players and provide accessible and
comprehensive information to the parties involved.
Decision making Technical Social Others (i.e Traffic)
Hydraulic Response 14% 14% 1% 16%
Risk Management 14% 14% 1% 16%
Receiving Water Body 14% 14% 19% 16%
Pollution Control 14% 14% 19% 16%
Sustainable Development 1% 14% 19% 1%
Public Interaction 1% 14% 19% 0%
Aesthectis 1% 14% 19% 1%
Investment Costs 14% 1% 1% 1%
Operations & Maintenance Costs 14% 1% 1% 1%
other costs 14% 1% 1% 0%
Economics
Stake holders
Table 4. Weightning of Criteria
Criteria
Tehnical
Social
Environmental
Table 6: Weighting method example. Adapted from (Martin, et al., 2007)

36 CHALMERS Architecture and Civil Engineering, Master’s Thesis ACEX30-18-95
Allow an objective interpretation of results with regards to the defined objectives.
The MCA process includes various criteria that may vary between the actors of the decision-
making process. It is possible to identify a list of preferences with regards to specific aspects
considered by contemplating separately different and pertinent points of view that are not
correlated between each other.

37 CHALMERS Architecture and Civil Engineering, Master’s Thesis ACEX30-18-95
4. Study Area
4.1 The city of Gothenburg
The city of Gothenburg is the second largest city in Sweden, capital of Västra Götaland region,
with an urban population of 556,600 inhabitants (City of Gothenburg, 2016). By the year 2035,
the city expects to be home to 700,000 inhabitants. During 2016, 2,680 new homes were built,
achieving the highest recorded construction rate since mid-1970’s. Located on the west coast
of the country, the city is characterized by trade and high industrial activities linked to
Scandinavia’s largest port. Gothenburg’s administration has focused its efforts on creating a
sustainable society. As a result, the EU directive on Sustainability Reporting was expected to
be achieved in the year 2017(Göteborg Stad, 2009).
The city of Gothenburg is characterized by 5000 hectares of impervious surfaces, from which
1460 hectares are drained to combined sewer systems (Lindh, 2013). Like most Swedish cities,
Gothenburg’s central area is dominated by a combined sewer system network which conveys
stormwater and wastewater (Göteborg Stad, 2013). This combined system corresponds to 40%
of the entire sewage grid, which consists of more than 2000 kilometers of pipes (Göteborg
Stad, 2014). The addition of duplicated sewer system has been implemented along the city in
order to create separate sewer systems, leading to a reduction in the discharge of untreated
wastewater via CSOs. The separate drainage system implemented has been designed for rain
events with a return period of two to five years (Sorensen & Rana, 2013).
Generally, polluted stormwater is discharged untreated to the receiving waters (Lindh, 2013).
During overflow conditions, the first flush is captured by the combined systems and directed
to the Rya waste water treatment plant (WWTP). The pollutants linked to stormwater runoff
have a negative effect on Rya’s sludge quality, interfering with their aim and current efforts
directed to the reuse of sludge on farmland (l'Ons, 2017). Forty overflow points distributed
around the city discharge the exceeding water to the receiving water bodies that mostly
converge in the river Göta Älv (Nyström, 2012). The river is also used as the drinking water
Figure 22: City of Gothenburg. Source: (Göteborgs
Stad, 2009)
38 CHALMERS Architecture and Civil Engineering, Master’s Thesis ACEX30-18-95
source of the city. Local projects, such as the one named River City Gothenburg (Centrala
Älvstaden), have focused the efforts on promoting an increase in the water quality in order to
foment additional benefits such as the interaction between citizens and the water bodies.
Improved wastewater treatment, increased installation of separate sewer systems, and high
percentage of connected households have led to a decrease in pollutant loads to receiving
waters. After the construction of the wastewater treatment plant Ryaverket, the fraction of
stormwater related pollutants in the receiving waters has increased when compared to the
sewage effluent (VA-Verket, 2001) Consequently, stormwater treatment has been an
increasing interest throughout the last decade. When treatment of stormwater is achieved, an
important decrease in the total pollutant load to the receiving water bodies is expected.
The city of Gothenburg is designated as one of the 18 areas in Sweden with significant flood
risk (Lansstyrelsen i Vastra Gotalands lan, Enheten for skydd och sakerhet, 2015). Protective
measures, involving physical interventions related to surface water, were stablished as part of
the Risk Management Plan for Floods in Gothenburg. In order to improve the capacity of the
drainage water systems, the city´s stormwater policy has directed its efforts to boost the
inclusion of local stormwater treatment options and SUDS.
Regarding stormwater quality, the strategy of the city has focused on reducing the pollution
related to traffic and building materials, and the efforts have been directed specially to the most
sensitive receiving water bodies (Lindh, 2013). The largest project implemented in the city is
a sedimentation pond in Järnbrott, which aims to treat stormwater from a catchment area with
a major road and industrial and residential land uses. Other measures installed in the city
include underground detention basins, manhole filters, seepage areas, and wetlands.
Additionally, to maintain groundwater level and a proper environmental state of the
surroundings, local treatment is preferred. Nevertheless, the implementation of local treatment
in the city is not always possible due to different factors such as site characteristics.
4.2 Brottkärr
A stormwater treatment system, which consists of an underground retention system and
manhole filter, was placed in operation in 2017 in order to treat stormwater in Brottkärr, located
south of Gothenburg (Figure 23). The system was built in 2016 by the local traffic office
(Trafikkontoret) and operated by Kretslopp och Vatten since then.

39 CHALMERS Architecture and Civil Engineering, Master’s Thesis ACEX30-18-95
4.1.1 Catchment area
The total catchment area is 25 ha, where two different systems treat the stormwater runoff
before it is discharged into Krogabäcken, the receiving water body. A roundabout is located in
the middle of the catchment area, where the roads Brottkärrsvägen and Billdalsvägen intercept
(Figure 24). The annual average daily traffic (AADT) on Brottkärrsvägen and Billdalsvägen
reported for the year 2013 is 5,200 and 10,300 cars, respectively (Trafikkontoret Göteborg
Stad, 2013). Additionally, commercial, residential, and construction activities are predominant
in the area. A gas station is located in the western corner of the catchment area.
Figure 23: Brottkärr area. Source: Google maps
Figure 24: Drainage area (blue line). The red
points mark the inlet and the outlet of the
treatment systems of interest. The blue point
marks the location of a rain gauge. Source:
(DHI, 2018)
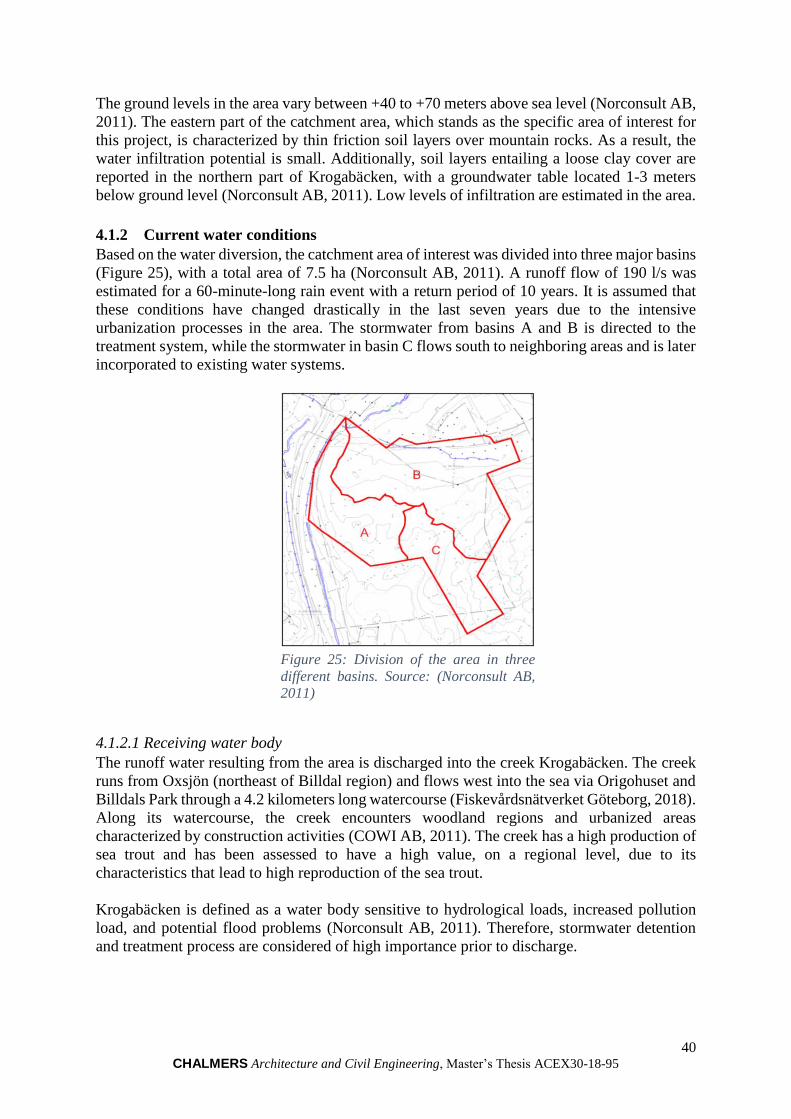
40 CHALMERS Architecture and Civil Engineering, Master’s Thesis ACEX30-18-95
The ground levels in the area vary between +40 to +70 meters above sea level (Norconsult AB,
2011). The eastern part of the catchment area, which stands as the specific area of interest for
this project, is characterized by thin friction soil layers over mountain rocks. As a result, the
water infiltration potential is small. Additionally, soil layers entailing a loose clay cover are
reported in the northern part of Krogabäcken, with a groundwater table located 1-3 meters
below ground level (Norconsult AB, 2011). Low levels of infiltration are estimated in the area.
4.1.2 Current water conditions
Based on the water diversion, the catchment area of interest was divided into three major basins
(Figure 25), with a total area of 7.5 ha (Norconsult AB, 2011). A runoff flow of 190 l/s was
estimated for a 60-minute-long rain event with a return period of 10 years. It is assumed that
these conditions have changed drastically in the last seven years due to the intensive
urbanization processes in the area. The stormwater from basins A and B is directed to the
treatment system, while the stormwater in basin C flows south to neighboring areas and is later
incorporated to existing water systems.
4.1.2.1 Receiving water body
The runoff water resulting from the area is discharged into the creek Krogabäcken. The creek
runs from Oxsjön (northeast of Billdal region) and flows west into the sea via Origohuset and
Billdals Park through a 4.2 kilometers long watercourse (Fiskevårdsnätverket Göteborg, 2018).
Along its watercourse, the creek encounters woodland regions and urbanized areas
characterized by construction activities (COWI AB, 2011). The creek has a high production of
sea trout and has been assessed to have a high value, on a regional level, due to its
characteristics that lead to high reproduction of the sea trout.
Krogabäcken is defined as a water body sensitive to hydrological loads, increased pollution
load, and potential flood problems (Norconsult AB, 2011). Therefore, stormwater detention
and treatment process are considered of high importance prior to discharge.
Figure 25: Division of the area in three
different basins. Source: (Norconsult AB,
2011)

41 CHALMERS Architecture and Civil Engineering, Master’s Thesis ACEX30-18-95
4.1.3 Stormwater treatment systems
4.1.3.1 Primary treatment system
The primary treatment system of Brottkärr area consists of a detention basin, a sand trap, a flow
regulator, and a lamella separator located under the roundabout, treating the northernmost part
of the catchment area (Figure 24). This system is expected to be under normal operation and is
not part of the scope of this project.
4.1.3.2 Secondary treatment system
The treatment system of interest consists of an underground piped detention basin (in Swedish:
Rörmagasin) and a manhole filter, located along the eastern side of Billdalsvägen. The
stormwater is drained from the southernmost part of the catchment area (basin A, B, and C in
Figure 25), which holds a construction site of residential apartments (Figure 26). Heavy traffic,
related to the construction activities, is present in the area.
The pipes transport the runoff to a manhole, which in turn works as an overflow structure
located at the inlet of the detention system (Point A in Figure 27). Under overflow conditions,
the water is discharged by a pipe into a small infiltration area situated on the ground surface.
The overflow is later collected in another underground structure and discharged directly into
the receiving water body. Under normal conditions, the water is directed to the detention basin.
The underground detention system involves a three-piped structure, where two pipes of 1,000
mm diameter and one pipe of 800 mm detain the water before it is directed into the filter.
Sedimentation processes are expected to occur along the 157-meter-long pipe-structure (Figure
27). In spite of that, the outlet of the structure is positioned in the lower part of the system,
which prevents the retention of sediments that are transported, almost entirely, to the filter.
Figure 26: Residential construction area from where
the water is drained and treated in the stormwater
system of interest

42 CHALMERS Architecture and Civil Engineering, Master’s Thesis ACEX30-18-95
The manhole filter, referred as Hydro-system by the manufacture Dahl Sverige AB, consists of
a structure intended to reduce pollutants by the means of sedimentation, filtration, adsorption
and precipitation process. The filter has a maximum flow capacity of 12 l/s.
Manhole
filter
Underground
detention basin
Figure 27: Secondary catchment area. The runoff is conducted through a piped system (dark green
lines) to the underground sedimentation basis (light green lines). Source: (Göteborg Stad; Kretslopp
och vatten, 2017)
Point A
Point B
Point C
Observation well
A.1
Figure 28: Filter used as part of the
stormwater treatment system. Source: (Dahl
Sverige AB, n.d.)

43 CHALMERS Architecture and Civil Engineering, Master’s Thesis ACEX30-18-95
The functional principles of the filter are explained based on Figure 28 as follows (Dahl Sverige
AB, n.d.):
1. Filter inlet (in this case, the outlet of the underground detention system corresponds
to the inlet of the filter)
2. The positioning of the inlet generates a radial flow that promotes sedimentation of
the heavier particles.
3. Sediments are collected in a chamber located in the lower part of the structure.
Sludge, sand, and heavy sediments are expected to be found in this chamber. The
filter maintenance consists in the removal of accumulated sediments.
4. The solids are absorbed by the filter media located in the middle of the structure.
5. The clarified water then is discharged into the receiving water body.
The filter is intended to reduce heavy metals, nutrients, and organic compounds. Details
regarding the working ranges of the filter are shown in Table 7.
Table 7: Filtration capacity Hydro system. Source: (Dahl
Sverige AB, n.d.)
Parameters Units Working range
Conductivity uS/cm < 1,500
pH - 7.0-9.5
Phosphorus (mg/l) 0.2
Ammonium (mg/l) 0.3
Cadmium (mg/l) <1.0
Zinc (mg/l) < 500
Copper (mg/l) <50
Lead (mg/l) <25
Nickel (mg/l) <20
Chromium (mg/l) <50
PAHs (mg/l) <0.2
Mineral Oils (mg/l) <0.2
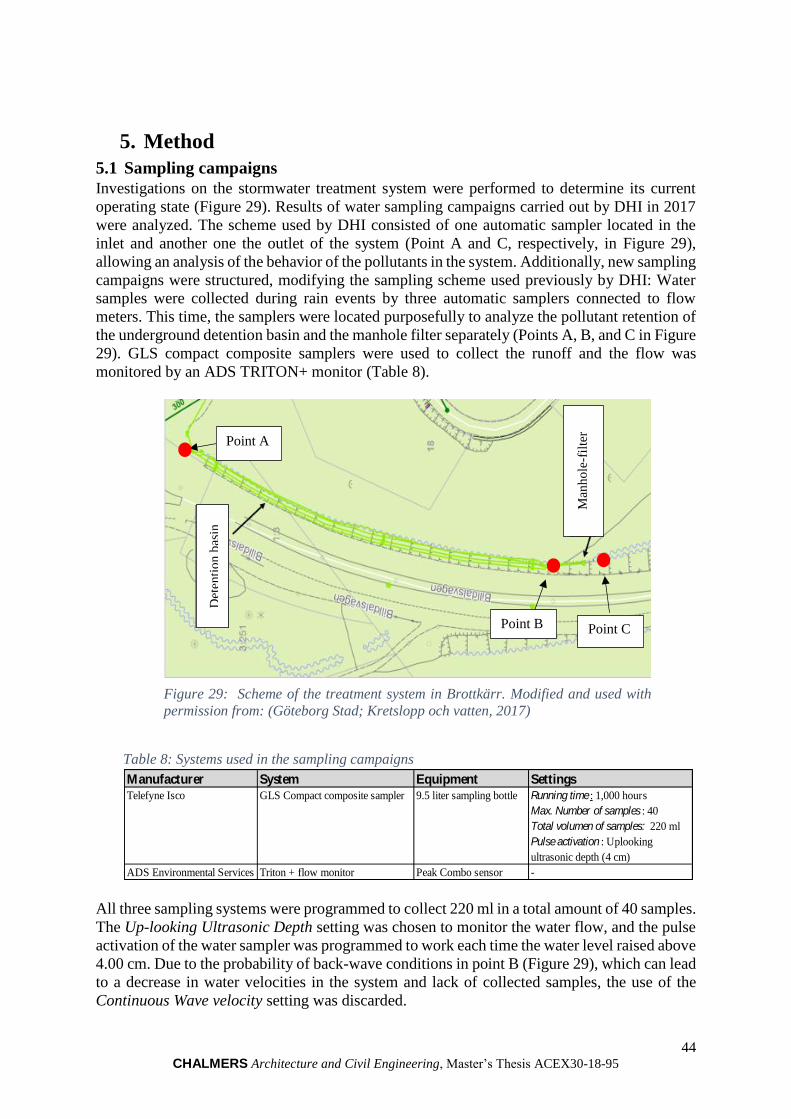
44 CHALMERS Architecture and Civil Engineering, Master’s Thesis ACEX30-18-95
5. Method
5.1 Sampling campaigns
Investigations on the stormwater treatment system were performed to determine its current
operating state (Figure 29). Results of water sampling campaigns carried out by DHI in 2017
were analyzed. The scheme used by DHI consisted of one automatic sampler located in the
inlet and another one the outlet of the system (Point A and C, respectively, in Figure 29),
allowing an analysis of the behavior of the pollutants in the system. Additionally, new sampling
campaigns were structured, modifying the sampling scheme used previously by DHI: Water
samples were collected during rain events by three automatic samplers connected to flow
meters. This time, the samplers were located purposefully to analyze the pollutant retention of
the underground detention basin and the manhole filter separately (Points A, B, and C in Figure
29). GLS compact composite samplers were used to collect the runoff and the flow was
monitored by an ADS TRITON+ monitor (Table 8).
All three sampling systems were programmed to collect 220 ml in a total amount of 40 samples.
The Up-looking Ultrasonic Depth setting was chosen to monitor the water flow, and the pulse
activation of the water sampler was programmed to work each time the water level raised above
4.00 cm. Due to the probability of back-wave conditions in point B (Figure 29), which can lead
to a decrease in water velocities in the system and lack of collected samples, the use of the
Continuous Wave velocity setting was discarded.
Man
ho
le-f
ilte
r
Det
enti
on
bas
in
Point A
Point C
Figure 29: Scheme of the treatment system in Brottkärr. Modified and used with
permission from: (Göteborg Stad; Kretslopp och vatten, 2017)
Manufacturer System Equipment SettingsTelefyne Isco GLS Compact composite sampler 9.5 liter sampling bottle Running time: 1,000 hours
Max. Number of samples : 40
Total volumen of samples: 220 ml
Pulse activation : Uplooking
ultrasonic depth (4 cm)
ADS Environmental Services Triton + flow monitor Peak Combo sensor -
Table 8: Systems used in the sampling campaigns
Point B

45 CHALMERS Architecture and Civil Engineering, Master’s Thesis ACEX30-18-95
A tracer test was done to determine the hydraulic behavior of the detention basin. Pyranine was
used as the fluorescent tracer and was injected in point A (Figure 29), where approximately 4
m3 water were discharged. The flow of the tracer was monitored along the three-piped-system,
and the time of arrival on Point A.1, Point B, and Point C (Figure 29) was recorded. Pont A.1,
the observation well, corresponds to a manhole 7 m form the point of discharge. Using a black
light, the arrival time of the water was recorded in three different points of the system
(Appendix 5.1). In Point B (Figure 29), observations were done in three different manholes to
determine the relative importance in terms of water flow of each one of the pipes. For this
reason, the measures in point 3 are established as Point B (east), Point B (middle), and Point B
(west) (Appendix 5.2).
5.2 BMPs Performance Evaluation
A detailed literature review was developed to obtain information on the performance of the
different alternatives for stormwater treatment. The literature review included theoretical
studies, manuals, and real installations implemented in different regions around the world. The
information was summarized to obtain ranges of expected performance and allow a comparison
of the alternatives.
5.3 Multi-criteria analysis
A multi-criteria analysis was developed to compare different stormwater management
alternatives under defined criteria. The purpose of the multi-criteria analysis was not to propose
the best solution. The objective was to identify and rank possible solutions that can be adapted
in Gothenburg, based on the information gathered from the literature review on the
performance of BMPs, local preferences (e.g. specific interests form Kretslopp och Vatten),
global and regional trends (e.g. increase in the adaptation of sustainable options in urban
environments such as green roofs in Sweden), and environmental requirements.
Through interviews with the stakeholder, Kretslopp och Vatten, the stormwater management
alternatives of interest for the city were established. Additionally, information of interest for
the MCA was produced through discussions with different key-players, which encompass the
sustainability framework (Figure 21). Chalmers University of Technology participated in the
process as the party expert in the technical and environmental aspect. The departments Culture
and Leisure (in Swedish: Kultur och Fritid) and Society and Environment (in Swedish:
Samhälle och miljö) from the city-districts Västra Hisingen and Örgryte-Härlanda,
respectively, participated in the process as the expert parties in the social aspects.
The information gathered along the MCA process was used as an input in a model using the
software Web-hipre (available at: http://hipre.aalto.fi): a software used for the structuring of
decision problems and multicriteria evaluations.
5.4 Limitations
The hydraulic analysis and water sampling were performed exclusively in the installations
selected. The resulting information is expected to support the criteria that constitute the MCA.
Data required for the other BMPs and established criteria were obtained from the literature;
performance data highly rely on the local conditions on which the studies were developed.
Therefore, significant uncertainties can be created when the information is applied to other
regions. Sweden is of particular interest due to its cold climate characteristics, where the
implementation of grassed systems (which make up a significant fraction of the BMPS) can be
46 CHALMERS Architecture and Civil Engineering, Master’s Thesis ACEX30-18-95
restricted due to a decrease in the performance during cold periods. The city of Gothenburg is
characterized by a limited number of structural BMPs, which include few sedimentation
lagoons, rain gardens, manhole filters, grassed swales, and filter strips. As a consequence,
information on a local level was preferred, but not always ascertained due to a limited existence
of performance data.
It was not possible to determine with certainty a place of interest for future implementation of
stormwater management projects in Gothenburg. Therefore, it was decided to carry out the
MCA at the city level. The analysis at the city level generates a lack of certainty in the results,
due to the high importance in determining a place to implement urban drainage systems. The
selection of a site determines precisely the local conditions in which the study is established,
which include: hydrologic conditions, anthropogenic activities developed in the area,
environmental conditions and impacts of the pollutants in the water, social restrictions due to
the behavior and preferences of the affected communities, and spatial and local constraints. As
a result, the results of the MCA do not include but do consider exclusion criteria. The exclusion
criteria acquaint different elements that must be stipulated based on the local and site-specific
conditions of the study, based on the considerations of the different key-players.
The assessment and description of domestic wastewater, which interacts with stormwater in
combined sewer systems, was not included.

47 CHALMERS Architecture and Civil Engineering, Master’s Thesis ACEX30-18-95
6. Results
6.1 Sampling campaigns
6.1.1 Water quality
Water samples were not collected in 2018 due to problems presented during the installation of
samplers, which delayed the beginning of the sampling campaigns. Besides, the following
months corresponded to one of the warmest spring months in the last decades in Sweden,
accompanied with low precipitations in Göteborg (SMHI, 2018), which prevented the sampling
campaigns to be carried out. As a consequence, the water quality analysis relied on previous
sampling campaigns.
Water sampling was commissioned to DHI Sverige AB by Kretslopp och Vatten in the year
2017. Two sampling systems were used to collect flow-proportional composite samples to
measure the incoming and discharged pollutant concentrations. The first sampling system,
composed by an ADS3600 flow meter and a SIGMA water sampler, was located in the inlet of
the system (Point A, Figure 29). Additionally, the second sampling system, constituted by a
Triton+ flow meter and an ISCO water sampler, was located at the outlet (Point C, Figure 29).
The water samples were triggered to operate based on the water level.
Results in Table 9 form part of the document prepared by DHI Sverige AB and presented to
Kretslopp och Vatten in January 2018 (DHI, 2018). Table 9 shows the pollutants selected and
involved in the analysis, which are divided into four main groups: Nutrients, metals, oil index,
and organic compounds. DHI reports the PAHs divided into different categories: PAH-L
corresponding to low molecular weight compounds (152-178 g/mol) such as acenaphthene and
acenaphthylene; PAH-M corresponding to medium molecular weight compounds (around 200
g/mol) such as fluoranthene and pyrene; and PAH-H as high molecular weight compounds
(202-278 g/mol) such as benz[a]anthracene, benzo[b]fluoranthene, benzo[j]fluoranthene
(Agency for Toxic Substances and Disease Registry, 1995). Additionally, due to its high
importance in water contamination, Benzo(a)pyrene, a PAH-H, is reported separately.
Appendix 3 show the hydrographs reported during the sampling period.

48 CHALMERS Architecture and Civil Engineering, Master’s Thesis ACEX30-18-95
Table 9 show higher concentrations of pollutants at the outlet of the system, compared to the
incoming water. Similar results were found in reports from studies developed in the city of
Stockholm on stormwater treatment filters (Alm, et al., 2015; Dromberg, 2009). The use of
filters showed detrimental stormwater quality due to high concentrations of pollutants in the
media: contaminants may leach from the filter material induced by high water flows and by
improper and malfunctioning structures. Additionally, this phenomenon can occur due to
resuspension of retained sediments in the basin when high water flows. The third rain event
sampled (2017-08-04) shows the highest number of detected pollutants and higher
concentrations at the outlet of the system than the inlet. Thirteen of the seventeen pollutants
exhibited insignificant retention or an increase in concentration between the inlet and outlet.
Measurements from event 3 show lower water flows in the inlet in comparison with the
previous sampling events (2017-06-12 and 2017-07-31). The reasons for the increased
concentrations at the outlet are not clear.
All three events show retention of metals (mostly Pb, Cd, Cu, Cr, Ni, and Zn) yet higher
concentrations of organic compounds in the outlet. Event 2 shows substantial retention of
PAHs although no retention of suspended solids was registered. These results are considered
inconclusive due to the correlation of hydrophobic organic compounds, some metals, and
suspended solids concentrations in contaminated water (Butler & Davies, 2004; van der Perk,
2012).
Table 9 shows the guidelines values of pollutants at the point of discharge established for the
city of Gothenburg (Goteborg Stad, 2013). The high concentrations of organic pollutants
measured may be related to the construction activities that are present in the area at the time of
sampling. It is assumed that a spills of petroleum derivates could occur in the days leading up
to the first sampled event measured. The pollutants could have been retained in the system and
washed away at the start of the runoff event, leading to high concentrations in the outlet. Also,
it is possible a mismatch in time between the inlet and outlet samplers due to difficulties in the
programming of automatic samplers. This situation may cause a delay in the activation of the
Table 9: Concentration of pollutants measured at the inlet and the outlet for each of the three days of
sampling: Adapted from: (DHI, 2018).
* The right-most column shows the maximum concentrations of pollutants allowed at the discharge
points in receiving water bodies for the city of Gothenburg. Source: (Goteborg Stad, 2013)
I nlet [µg/l] Outlet [µg/l] Inlet [µg/l] Outlet [µg/l] Inlet [µg/l] Outlet [µg/l]
Total P 17 17 5.3 510 210 1300
Total N 5500 5400 270 510 866 1300
Arsenic 0.89 0.86 0.58 0.48 0.47 0.77
Lead 0.65 0.54 0.2 0.2 0.2 0.2
Cadmium 0.79 0.26 3.2 0.22 0.03 0.03
Copper 14 12 7.5 4.2 8.2 6
Chromium 2.1 1.8 3.8 2.8 15 6.1
Nickel 3.2 2.3 3.4 2 0.52 1.9
Zinc 53 23 60 7.8 3 3
Mercury 0.006 0.005 0.006 0.005 0.005 0.005
Oil 100 700 100 200 900 500
PAHL 40 9700 40 40 40 41
Benso(a)pyrene 0 0.013 0 0 0 0.026
PAHM 48 440 60 19 130 200
PAHH 25 240 92 94 240 460
Suspended Solids 45000 5400 15000 110000 650000 0
PAH 75 10000 150 79 370 700
-
25000
-
Target values at emission
point [µg/l] *
50
1250
15
14
0.4
10
15
40
30
0.05
1000
-
0.05
-
Day 3Parameter
Nutr
ien
tsM
eta
lsO
rgan
ic C
om
po
un
ds
Day 1 Day 2

49 CHALMERS Architecture and Civil Engineering, Master’s Thesis ACEX30-18-95
inlet samplers that happen to miss the first flush, which is then captured by the outlet samplers.
The oil index concentrations were also elevated in samples from Event 1.
The results show that low concentrations of heavy metals enter the system (Table 9). All the
measured values in the inlet, except for Cd, Cu, and Zn, meet the target values of the city of
Gothenburg. After treatment, the concentrations of Cu are the only ones which are not
compliant. It is important to recall that heavy metals and organic pollutants are of particular
importance due to the impacts linked to bioaccumulation and biomagnification in organisms,
such as the trout that are found downstream of Krogabäcken. On the other hand, the nutrient
concentrations do not comply with the guideline values, and the concentrations in the outlet
exceed the levels in the inlet. The reasons for these occurrences are not entirely clear.
The time between the activation of the two automatic samplers was stated as 30 s, but no further
analysis of the detention time in the three-piped system was performed. The delay time is an
essential aspect of the reduction potential of detention basins. Resuspension of sediments can
easily occur because the outlet is located in the bottom part of the basin, leading to clogging
on the filter or direct discharge via the overflow structure during high flows. However, it is
assumed that the three-piped-system aims at peak flow reduction, and not to achieve a high
reduction of pollutants.
In order to determine the behavior of the water within the system, and to determine which of
the three pipes receives the largest volume of water, a tracer test was performed using Pyranine.
The discharge of water at point A (Figure 29) was not measured accurately, but it is estimated
that the water flow corresponds to 3-4 m3 in 15-18 min (3.3 – 3.7 l/s). The water has higher
flow and present shorter arrival times in the central pipeline (Table 10). As a consequence, the
automatic water sampler was installed in the middle pipeline in Point B (Figure 29).
The results of the tracer test are also considered inconclusive since the volume of water
discharged, and its related flow, is minimal and does not give a good indication of how the
system works during rainfall events. It is interesting to study how the system behaves during
heavy rain events where it handles large amounts of water. This would reveal the reduction of
peak flows achieved by the detention system, which promotes proper functioning of the filter
and adequate water discharges to the erosion sensitive water body. The pyranine concentrations
at the measurement points should be considered to study the transport of contaminants within
the system, and clearly understand the distribution of water and the levels of pollutants in each
of the pipelines.
Time Location Velocity (m/s)
0:04:15 A.1 -
0:04:46 B (middle) 4.7
0:09:40 B(west) 0.43
0:11:45 B(east) 0.31
0:12:45 Filter 0.27
0:15:50 Outlet 0.2
Table 10: Water delay time and flow
velocity measured in three different
points along the detention basin (Point
A.1, B, and C.

50 CHALMERS Architecture and Civil Engineering, Master’s Thesis ACEX30-18-95
Further visits to the treatment system led to the following observations:
1. The manhole filter was lacking the overflow structure (Appendix 4). Under normal
operating conditions, this overflow structure creates a relative high-pressure system that
drives the water through the filter media. The lack of this structure allows the water to
pass directly through this void space. As a consequence, the water does not pass through
the media and is led directly into the outlet of the filter, and further discharged into the
receiving water body. The remedial actions required were taken by installing the
missing piece appropriately. Needs for media maintenance and cleaning were also
identified.
2. The corrective cleaning actions performed on the filter showed a low and insufficient
amount of filter media. As a consequence, it is assumed that the media does not hold
the structural requirements for proper contact between the water and the media.
Therefore, low retention of pollutants is foreseen.
6.2 Comparative analysis of stormwater treatment options
Appendix 6 presents the results of the literature review conducted on the performance of the
stormwater treatment alternatives described in Section 3.3.3. The performance factors included
in the comparison are divided into technical, environmental, social, and economic categories.
These factors correspond to the benchmarks used in the MCA analysis to evaluate the criteria.
Their inclusion in the MCA is further exposed in Table 13.
The pollutant removal efficiency and hydraulic performance of BMPs present high
variabilities. It is clear that the highly dynamic hydrological phenomena in natural and urban
environments lead to high variability in the reported results. The dynamic nature of stormwater
and high diversity of site-specific aspects need to be taken into account when evaluating the
performance of individual BMPs. The different activities in the catchment area, the
characteristics of the society, the characteristics of the local precipitation events and the
urbanistic characteristics of the catchment area, design of the structures, and the recurrence of
monitoring and maintenance operations are some of the factors that influence the pollutant
reduction potential of each of the stormwater treatment structures. Moreover, the global
variability of the characteristics of the receiving water bodies leads to a problematic
determination of satisfactory performance of the systems to achieve environmental objectives
(e.g., receiving water quality standards and flood protection). There is a need for new
knowledge about BMPs´ performance to address the lack of data. Nevertheless, with the
information gathered, an expected reduction of pollutants and hydraulic performance for each
of the BMPs can be asserted. It should be noted that higher uncertainties where found in the
analysis of the reduction potential of organic pollutants.
Through literature research, it was evidenced that most BMPs are efficient systems that
generate satisfactory results concerning the reduction of pollutants, control of water flow,
social benefits and, in some cases, biological benefits. In turn, the costs of implementation,
operation, and maintenance are much lower compared to conventional treatment systems.
However, a lack of information was identified concerning detailed design criteria that can
satisfy the information needs that lead to more reliable and effective systems. The information
found throughout the literature review is usually general information, where specific
information that can lead to better performance of each BMP is usually missing. It is important
to emphasize that the data found regarding SUDS include, in most cases, the social components
and benefits of each system; something that is not directly taken into account in conventional
51 CHALMERS Architecture and Civil Engineering, Master’s Thesis ACEX30-18-95
treatments design processes. Throughout the literature, it is evident the emphasis that is given
to the possibilities of better use of the land encompassing and achieving social and
environmental benefits. The global trend in the West hemisphere towards sustainable
development has led to the generation of valuable information regarding SUDS, as well as the
implementation of successful water drainage options.
The International BMP database (http://www.bmpdatabase.org) is an important tool that
contains global information on the implementation and development of more than 600 different
urban drainage systems. The last summary report, published in 2016, identifies the lack of
information available for specific BMPs with regards aspects such as (Clary, et al., 2017):
Retention of fecal indicator bacteria such as enterococcus and E. coli
Pervious pavements general information
Construction and maintenance costs are an essential aspect in the selection of stormwater
treatment alternatives. High variability of associated costs was encountered throughout the
literature review. Similar to the performance of the system, the costs are associated with site-
specific characteristics and local and regional economic aspects. The importance of monitoring
and maintenance needs (and their related costs) was evidenced by the literature study and is
considered an essential aspect that needs to be emphasized, due to its correlation with the
reliability, durability, and performance of the different systems. Monitoring and maintenance
needs are commonly not contemplated by regional and local authorities throughout the entire
lifecycle of the system. Failures associated with the lack of monitoring and maintenance were
reported in all the stormwater treatment systems. Likewise, public risks (e.g., fire hazards in
green gardens and deterioration of obligatory public awareness signs in dry detention basins
and wet ponds that create public hazards) are associated with lack of monitoring and
maintenance activities.
6.3 Multi-Criteria Analysis
The information from the MCA, which aims to evaluate the different BMPs presented in
section 3.3.3 and compared in section 6.2, led to the results presented in the next section based
on the procedure stated by Department for Communities and Local Government (2009) and
presented in Section 3.5.2.
6.3.1 Identification of the goal and establishment of the decision context
The objective of the multicriteria analysis is to evaluate different alternatives for the adequate
management of stormwater in the city of Gothenburg, within the sustainability context. The
evaluation criteria must consider environmental, economic, social, and technical aspects to
cover the main problems to which a decision-making method is exposed. The process must
include different key-players (including the stakeholders) to incorporate the established
evaluation categories and to evaluate in a precise and concise way the performance of the
alternatives according to the criteria.
The party with the highest interests and potential outcome investments, Kretslopp och Vatten
was defined as the principal stakeholder for this process. Kretslopp och Vatten is the
responsible department for handling and managing the water resources for the municipality of
Gothenburg. Chalmers University of Technology, defined as a key-player, participated in the
generation, analysis, and discussion of the data that was used in the process. Between the
previously mentioned parties, the alternatives and criteria were established and evaluated. The
departments Culture and Leisure and Society and Environment from the city-districts Västra
Hisingen and Örgryte-Härlanda participated as social key-players in the evaluation and
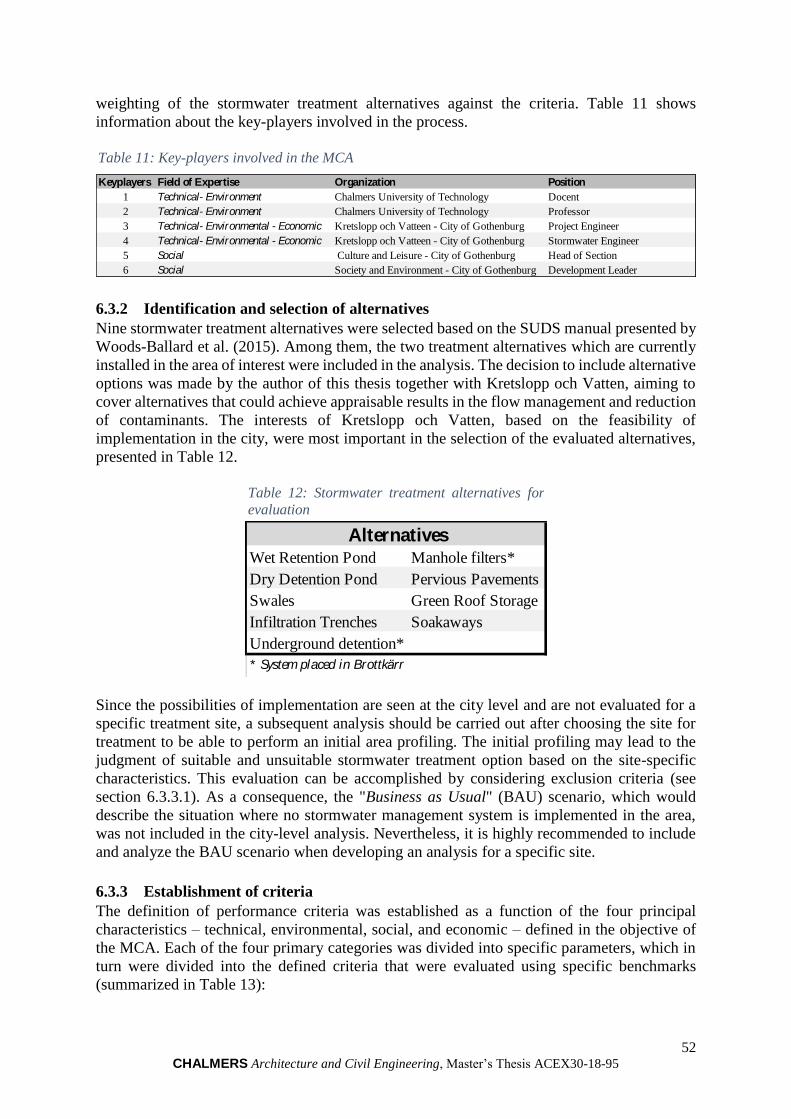
52 CHALMERS Architecture and Civil Engineering, Master’s Thesis ACEX30-18-95
weighting of the stormwater treatment alternatives against the criteria. Table 11 shows
information about the key-players involved in the process.
6.3.2 Identification and selection of alternatives
Nine stormwater treatment alternatives were selected based on the SUDS manual presented by
Woods-Ballard et al. (2015). Among them, the two treatment alternatives which are currently
installed in the area of interest were included in the analysis. The decision to include alternative
options was made by the author of this thesis together with Kretslopp och Vatten, aiming to
cover alternatives that could achieve appraisable results in the flow management and reduction
of contaminants. The interests of Kretslopp och Vatten, based on the feasibility of
implementation in the city, were most important in the selection of the evaluated alternatives,
presented in Table 12.
Since the possibilities of implementation are seen at the city level and are not evaluated for a
specific treatment site, a subsequent analysis should be carried out after choosing the site for
treatment to be able to perform an initial area profiling. The initial profiling may lead to the
judgment of suitable and unsuitable stormwater treatment option based on the site-specific
characteristics. This evaluation can be accomplished by considering exclusion criteria (see
section 6.3.3.1). As a consequence, the "Business as Usual" (BAU) scenario, which would
describe the situation where no stormwater management system is implemented in the area,
was not included in the city-level analysis. Nevertheless, it is highly recommended to include
and analyze the BAU scenario when developing an analysis for a specific site.
6.3.3 Establishment of criteria
The definition of performance criteria was established as a function of the four principal
characteristics – technical, environmental, social, and economic – defined in the objective of
the MCA. Each of the four primary categories was divided into specific parameters, which in
turn were divided into the defined criteria that were evaluated using specific benchmarks
(summarized in Table 13):
Table 11: Key-players involved in the MCA
Keyplayers Field of Expertise Organization Position
1 Technical- Environment Chalmers University of Technology Docent
2 Technical- Environment Chalmers University of Technology Professor
3 Technical- Environmental - Economic Kretslopp och Vatteen - City of Gothenburg Project Engineer
4 Technical- Environmental - Economic Kretslopp och Vatteen - City of Gothenburg Stormwater Engineer
5 Social Culture and Leisure - City of Gothenburg Head of Section
6 Social Society and Environment - City of Gothenburg Development Leader
Table 12: Stormwater treatment alternatives for
evaluation
Wet Retention Pond Manhole filters*
Dry Detention Pond Pervious Pavements
Swales Green Roof Storage
Infiltration Trenches Soakaways
Underground detention*
* System placed in Brottkärr
Alternatives

53 CHALMERS Architecture and Civil Engineering, Master’s Thesis ACEX30-18-95
The technical and hydraulic performance of the treatment options were evaluated as
regards to two parameters: hydraulic response and technical quality. The hydraulic
response effectiveness relates to the flow control criteria, which is evaluated in terms
of peak flow and volume reductions. The technical quality parameter relates to two
different criteria: system reliability and system durability. These criteria were evaluated
in terms of probability of failure and lifespan, respectively.
The environmental performance of the treatment options was assessed as regards to two
parameters: water pollution control and impact on the biophysical surrounding
environment. The impact on the biophysical surrounding environment comprises the
impacts on soil and groundwater criteria (evaluated as the negative impacts that could
result in contamination of the surrounding soil and the groundwater) and the impact on
the ecological habitat and diversity (evaluated as a positive impact that could lead to
improving the biological diversity in the area).
The social performance of the treatment option was assessed as regards to other two
parameters: public exposure and aesthetics. The public exposure parameters associate
directly with the public interaction criteria, which is evaluated in terms of public safety
hazards and information requirements; and the potential for implementation of
recreational activities. The aesthetics parameters associate directly to the location
amenity criteria, which is evaluated in terms of the aesthetic value of the systems and
potential loss of public land (land requirements).
The economic performance of the treatment options was assessed as regards to two
parameters, which in turn define two criteria: capital costs and operation and
maintenance costs (O&M). The capital cost criteria are evaluated in terms of materials
and construction costs, while the operation and maintenance criteria are evaluated in
terms of monitoring and maintenance needs, and the associated costs.
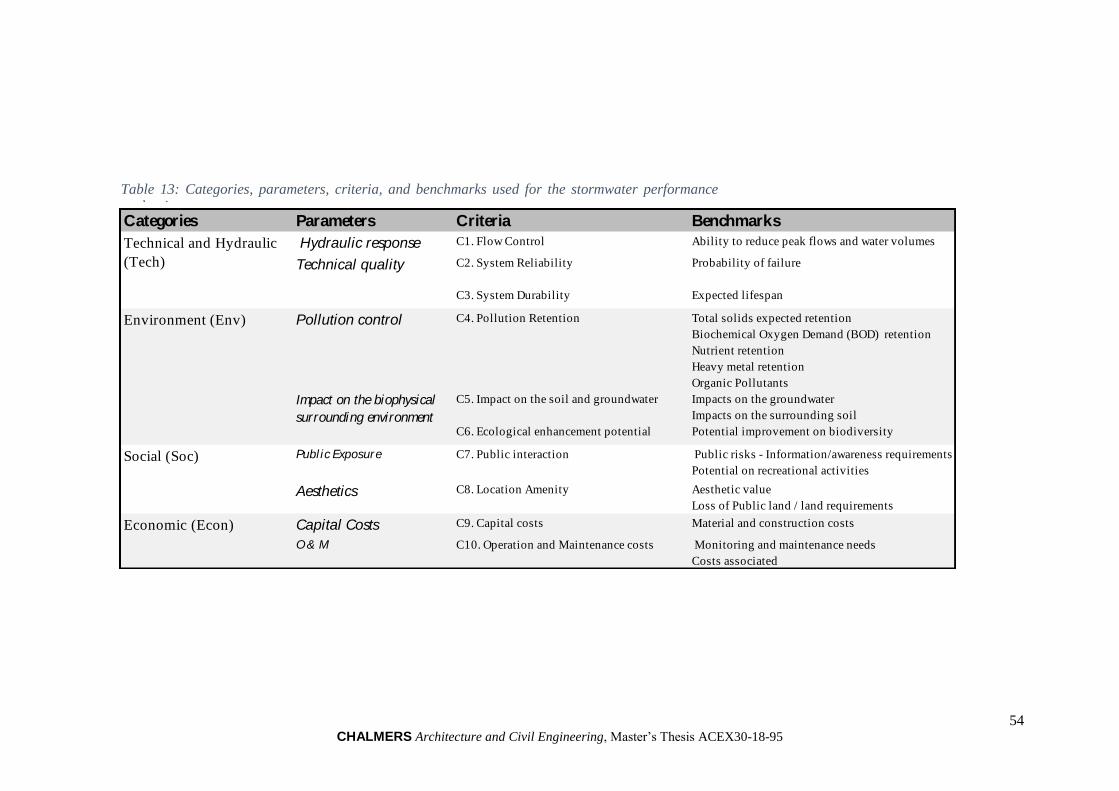
54 CHALMERS Architecture and Civil Engineering, Master’s Thesis ACEX30-18-95
Table 13: Categories, parameters, criteria, and benchmarks used for the stormwater performance
evaluation Categories Parameters Criteria Benchmarks
Hydraulic response C1. Flow Control Ability to reduce peak flows and water volumes
C2. System Reliability Probability of failure
C3. System Durability Expected lifespan
Pollution control C4. Pollution Retention Total solids expected retention
Biochemical Oxygen Demand (BOD) retention
Nutrient retention
Heavy metal retention
Organic Pollutants
C5. Impact on the soil and groundwater Impacts on the groundwater
Impacts on the surrounding soil
C6. Ecological enhancement potential Potential improvement on biodiversity
Publ ic Exposure C7. Public interaction Public risks - Information/awareness requirements
Potential on recreational activities
Aesthetics C8. Location Amenity Aesthetic value
Loss of Public land / land requirements
Capital Costs C9. Capital costs Material and construction costs
O & M C10. Operation and Maintenance costs Monitoring and maintenance needs
Costs associated
Economic (Econ)
Technical and Hydraulic
(Tech) Technical quality
Environment (Env)
Social (Soc)
Impact on the biophysical
surrounding environment

55 CHALMERS Architecture and Civil Engineering, Master’s Thesis ACEX30-18-95
Each one of the established criteria presented in Table 13 holds flexibility that allows them to
be applied to all stormwater management systems, regardless of the place where they are
intended to be implemented. Nevertheless, in contrast to what is stipulated in section 3.5.2.3,
the lack of independence of some established criteria can be identified. For example, there is a
negative correlation between the monitoring and maintenance needs of the alternatives and
their hydraulic performance, the technical quality, and the percentage of pollutant retention.
Lack of monitoring and maintenance risks relate to lower reliability, performance, and
pollutant retention. As a consequence, the implementation of monitoring and maintenance
needs in BMPs is emphasized. Another example of the interdependence of criteria is the
reduction of public risks associated with increased contaminant retention. Therefore, it can be
stated that the criteria comply with most of the relevant requirements in the Sustainable Urban
Drainage Systems context (such as objectivity, robustness, sensitivity), but are not independent
of each other, which results in a degree of redundancy.
6.3.3.1 Exclusion criteria
Despite the fact that SUDS are low-cost alternatives compared to conventional treatment
systems, economic constraints play an essential role in the validation or invalidation of
different stormwater systems during decision-making processes. Additionally, specific features
of the individual stormwater treatment systems can restrain their use and invalidate their
implementation in particular sites (e.g., it is unreal to pretend to install only wet or dry ponds
around an entire city due to their high land requirements). Although it is regarded as a
subjective aspect, the particular preferences of local authorities or private companies, generally
based on previous experiences, also restrict the use of different alternatives.
An initial application and suitability analysis, directed to achieve an objective evaluation of
alternatives, can be obtained using exclusion criteria. Table 14 displays different physical
constraints which would commonly need to be addressed at the moment of considering the
suitability of stormwater treatment systems in a specific site. It is necessary to emphasize that
economic (e.g., budget) or social (e.g., community opposition) are also restrictive factors that
can exclude different alternatives from the analysis.
The establishment and use of exclusion criteria depend to a large extent on the site-specific
characteristics and the alternatives considered by the decision-making agents.
Exclusion criteria Assessment Effects
Space Availability Yes/No Limi ts the use of high area demanding systems
High concentrations of
contaminants
Yes/No Excludes the use of BAU scenar io
Groundwater vulnerability
and water table depth
Yes/No Limi ts the use of infi l tration techniques, whi le
increases the r isk of groundwater pol lution.
Water Pollution risk Yes/No Pre-treatment systems can be requi red,
demanding more area and resources.
Soil permeability Low/Medium/High Control the use of infi l tration techniques and
other systems
Risks of high concentrations
of sediments
Yes/No Limi ts the use of infi l tration systems
Vehicle/Pedestrian traffic Low/Medium/High Sui tabi l i ty/unsui tabi l i ty for the use os pervious
pavements
Permanent Water Flow Yes/No Limi ts the use of wet retention basis
Table 14: Exclusion criteria examples. Adapted from: (Ellis, et al., 2004)

56 CHALMERS Architecture and Civil Engineering, Master’s Thesis ACEX30-18-95
6.3.4 Performance evaluation of the alternatives against the criteria
The analysis of the performance of the alternatives with respect to the established criteria was
carried out within each key-player group, described in section 6.3.1. The different groups
decided, according to their knowledge and expertise, which criteria categories they were
willing to evaluate, and which they preferred not to analyze to prevent a higher uncertainty in
the results. It is essential to recognize that a determining factor which affects the results in an
MCA is the subjectivity related to the experience, knowledge, expertise, and preferences of
each key-player.
Quantitative indicators where established to indicate the performance of each alternative
against the criteria: a scale from 0 to 5 was employed. The definition of each of the quantitative
values depends on each criterion. Therefore, low or high potential of adequate performance
was given a specific score. Appendix 7 details the scores which each of the key-players
assigned to the alternatives in the analysis. It can be evidenced that some decided not to perform
the scoring of some criteria, based on their lack of knowledge in those specific topics. Table
15 discloses the matrix of evaluated alternatives, with the average of the scores given by all the
key-player.
Table 16 presents the standard deviation of the scores, which helps to identify the degree of
variability in scoring by the key-players. The economic category presents no standard deviation
because only Kretslopp och Vatten scored this category. On the other hand, the social key-
players only scored the social category, causing this category to be the only one scrutinized by
all the actors.

57 CHALMERS Architecture and Civil Engineering, Master’s Thesis ACEX30-18-95
Alternatives
C1.
Flow Control
C2.
Reliability
C3
Durability
C4.
Pollution
Control
C5.
Impact on Soil
and Water
C6.
Ecological
enhancement
potential
C7.
Public
interaction
C8.
Location
Amenity
C9.
Capital Costs
C10.
O&M
Wet Retention Pond 3.3 4.5 5.0 4.2 4.0 3.8 2.5 2.7 5.0 4.0
Dry Detention Pond 4.3 2.5 5.0 3.3 3.3 2.8 3.3 3.5 5.0 4.0
Swales 3.3 3.5 3.5 3.4 2.8 3.3 3.0 2.7 5.0 4.0
Infiltration Trenches 4.3 1.5 2.3 3.6 1.8 1.5 2.9 2.9 3.5 2.0
Underground detention 2.8 3.8 3.3 1.8 4.8 1.0 2.6 2.3 3.5 3.0
Manhole filters 0.3 1.5 0.5 3.0 4.9 1.0 3.3 2.3 4.0 1.5
Pervious Pavements 4.3 1.5 2.3 3.0 2.3 0.5 3.0 3.0 3.0 2.3
Green Roof Storage 2.5 2.5 2.8 2.4 4.4 3.8 3.7 4.3 4.0 2.8
Soakaways 4.3 2.5 2.5 2.0 1.5 1.0 3.4 2.6 2.5 3.5
5 - Adequate 5 - High 5 - Long 5 - High 5 - Low 5 - High 5 - Low 5 - High potential 5 - Low 5 - Low
0 - Inadequate 0 - Low 0 - Short 0 - Low 0 - High 0 - Low 0 - High 0 - Low Potential 0 - High 5 - High
Technical Category Environmental Category Social Category Economic Category
Criteria
Table 15: Matrix and evaluation of alternatives.
Alternatives
C1.
Flow Control
C2.
Reliability
C3
Durability
C4.
Pollution
Control
C5.
Impact on Soil
and Water
C6.
Ecological
enhancement
potential
C7.
Public
interaction
C8.
Location
Amenity
C9.
Capital Costs
C10.
O&M
Wet Retention Pond 1.8 0.7 0.0 0.6 1.1 1.8 0.5 0.3 - -
Dry Detention Pond 0.4 0.7 0.0 1.1 1.1 1.1 1.1 0.9 - -
Swales 0.4 2.1 0.7 0.1 0.4 1.1 0.4 0.2 - -
Infiltration Trenches 1.1 0.7 0.4 0.0 0.0 0.7 0.6 1.5 - -
Underground detention 1.1 1.1 0.4 0.1 0.4 1.4 0.1 0.3 - -
Manhole filters 0.4 0.7 0.7 0.5 0.2 1.4 1.1 0.3 - -
Pervious Pavements 1.1 0.7 0.4 0.0 0.4 0.7 0.4 0.5 - -
Green Roof Storage 2.1 0.7 0.4 0.6 0.9 0.4 0.3 0.7 - -
Soakaways 1.1 0.7 0.7 0.1 0.7 0.7 1.4 0.5 - -
Technical Category Environmental Category Social Category Economic Category
Criteria
Table 16: Evaluation´s standard deviation

58 CHALMERS Architecture and Civil Engineering, Master’s Thesis ACEX30-18-95
Despite their bias and subjectivity, the results only present a considerable variation in the
scoring of the following criteria:
Flow control: the criterion with the highest variability between the scores.
o Wet retention ponds: The scores assigned to flow control were 4 (Chalmers
University of Technology) and 2 (Kretslopp och Vatten). As evidenced in
the performance evaluation of alternatives, wet retention ponds have a high
ability to reduce peak flows but have low-to-none ability in reducing the
water volume. Therefore, based on the results, further analysis will be
recommended to determine whether it is appropriate to consider these two
reductions (peak flow & volume) in separate criteria to allow more in-depth
analysis and discussion.
o Green roofs: The scores assigned were 4 (Chalmers University of
Technology) and 1 (Kretslopp och Vatten). Green roofs present a low
reduction potential of peak flows. However, studies report volume reduction
in the sewer systems of up to 50% of the precipitation associated with the
implementation of green roofs in Sweden.
Reliability:
o Swales: The scores assigned were 5 (Chalmers University of Technology)
and 2 (Kretslopp och Vatten). It is not clear which factors were taken into
account by the scoring actors. However, in the literature, problems
associated to the clogging of inner pipes in the swales´ structures are
currently reported. Further research is required to achieve a more profound
and conclusive analysis.
Ecological enhancement potential: The criterion presents the second highest
variability between the scores. The wet retention pond is the alternative which
deserves special attention:
o Wet retention ponds: The scores assigned were 2.5 (Chalmers University of
Technology) and 5 (Kretslopp och Vatten). This aspect is of particular
interest due to the great variety of factors that can be considered and affect
the results of the evaluation. It is worth to highlight the fact that, in wet
retention systems where the concentrations of pollutants are very high, the
enhancement of biodiversity implies a negative impact. On the other hand,
wet retention basins with low levels of pollution represent an area with a
positive impact on biodiversity. These aspects need to be considered in a
further in-site analysis of the expected system.
6.3.5 Weighting of the criteria
Each key-player assigned a percentage to each of the criteria to identify their preferences, and
thus, present the importance considered by each of their expertise fields in the process of
evaluation. The categories of criteria were assessed as presented in Table 17.
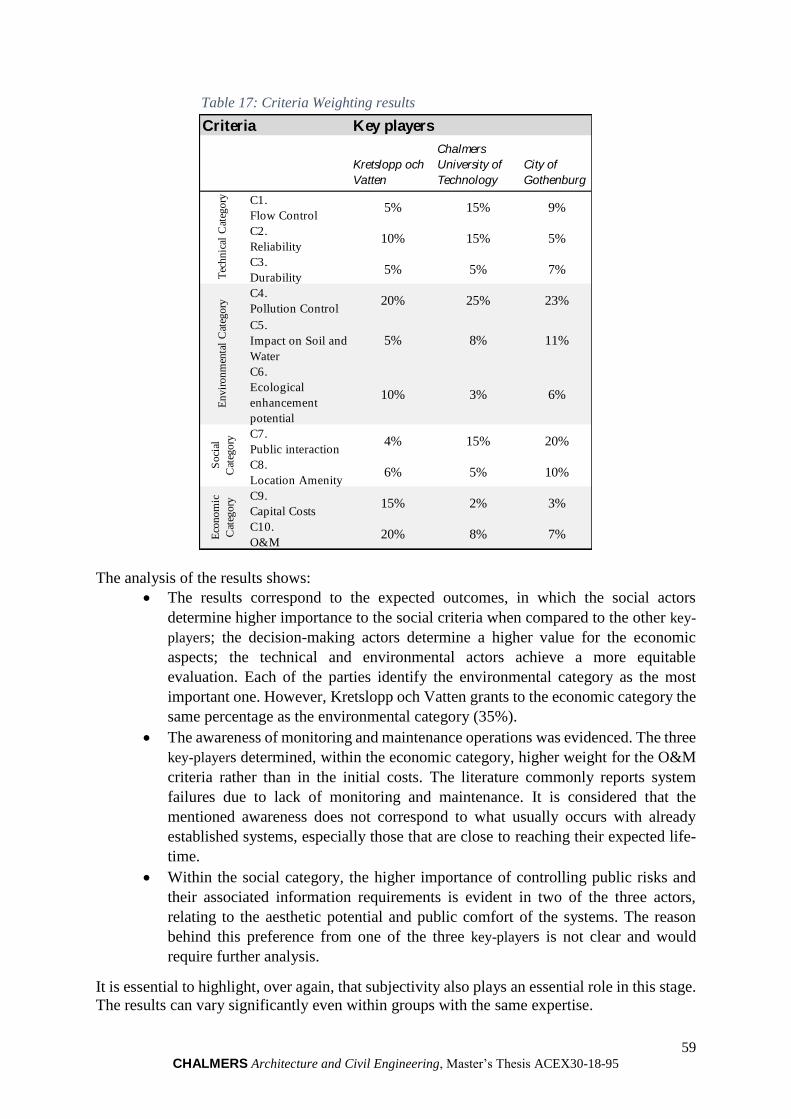
59 CHALMERS Architecture and Civil Engineering, Master’s Thesis ACEX30-18-95
The analysis of the results shows:
The results correspond to the expected outcomes, in which the social actors
determine higher importance to the social criteria when compared to the other key-
players; the decision-making actors determine a higher value for the economic
aspects; the technical and environmental actors achieve a more equitable
evaluation. Each of the parties identify the environmental category as the most
important one. However, Kretslopp och Vatten grants to the economic category the
same percentage as the environmental category (35%).
The awareness of monitoring and maintenance operations was evidenced. The three
key-players determined, within the economic category, higher weight for the O&M
criteria rather than in the initial costs. The literature commonly reports system
failures due to lack of monitoring and maintenance. It is considered that the
mentioned awareness does not correspond to what usually occurs with already
established systems, especially those that are close to reaching their expected life-
time.
Within the social category, the higher importance of controlling public risks and
their associated information requirements is evident in two of the three actors,
relating to the aesthetic potential and public comfort of the systems. The reason
behind this preference from one of the three key-players is not clear and would
require further analysis.
It is essential to highlight, over again, that subjectivity also plays an essential role in this stage.
The results can vary significantly even within groups with the same expertise.
Table 17: Criteria Weighting results
Kretslopp och
Vatten
Chalmers
University of
Technology
City of
Gothenburg
C1.
Flow Control5% 15% 9%
C2.
Reliability10% 15% 5%
C3.
Durability5% 5% 7%
C4.
Pollution Control20% 25% 23%
C5.
Impact on Soil and
Water
5% 8% 11%
C6.
Ecological
enhancement
potential
10% 3% 6%
C7.
Public interaction4% 15% 20%
C8.
Location Amenity6% 5% 10%
C9.
Capital Costs15% 2% 3%
C10.
O&M20% 8% 7%
Key playersCriteria
Tec
hn
ical
Cat
ego
ryE
nvir
on
men
tal
Cat
ego
ryS
oci
al
Cat
ego
ry
Eco
no
mic
Cat
egory

60 CHALMERS Architecture and Civil Engineering, Master’s Thesis ACEX30-18-95
6.3.6 Final evaluation based on the overall weighted score of the alternatives
The results of the MCA for the three scenarios are shown in Table 18. The ranking of
alternatives, resulting from the analysis for each of the three actors involved, is presented
individually in Figures 30-32. The Y-axis corresponds to the values contributed by each of the
criteria to the final results of the alternatives.
Figure 30 shows the results based on the weights granted by Chalmers University
of Technology to the criteria. The preference ranking is:
(1) Wet retention basins
(2) Dry detention basins
(3) Swales
(4) Green roofs
(5) Infiltration basins
(6) Soakaways
(7) Pervious pavements
(8) Underground detention
(9) Manhole filter
Figure 31 shows the results based on the weights granted by Kretslopp och Vatten
to the criteria. The preference ranking is:
(1) Wet retention basins
(2) Dry detention basin
(3) Swales
(4) Green roofs
(5) Underground detention
(6) Infiltration basins
(7) Soakaways
(8) Pervious pavements
(9) Manhole filter
Figure 30 Preferred ranking of BMPs by Chalmers University of Technology
0%
10%
20%
30%
40%
50%
60%
70%
80%
% C
ON
TRIB
UTI
ON
Technical Environmental Social Economics Overall score

61 CHALMERS Architecture and Civil Engineering, Master’s Thesis ACEX30-18-95
Figure 32 shows the results based on the weights granted to the criteria by the
departments Culture & Leisure and Development & Environment from The City of
Gothenburg. The preference ranking is:
(1) Wet retention basins
(2) Dry detention basin
(3) Swales
(4) Green roofs
(5) Infiltration basins
(6) Pervious pavements
(7) Soakaways
(8) Underground detention
(9) Manhole filter
0%
10%
20%
30%
40%
50%
60%
70%
80%
% C
ON
TRIB
UTI
ON
Technical Environmental Social Economics Overall score
Figure 31 Preferred ranking of alternatives by Kretslopp och Vatten
0%
10%
20%
30%
40%
50%
60%
70%
% C
ON
TRIB
UTI
ON
Technical Environmental Social Economics Overall score
Figure 32 Preferred ranking of alternatives by Gothenburg City (social actors)

62 CHALMERS Architecture and Civil Engineering, Master’s Thesis ACEX30-18-95
Alternatives Wet R. B. Dry D.B Swales Green Roofs Infiltration B. Soakaways Pervious P Underground D.B Manhole Filter
Technical 0.28 0.25 0.24 0.18 0.20 0.23 0.20 0.23 0.06
Environmental 0.28 0.22 0.23 0.20 0.21 0.12 0.17 0.13 0.19
Social 0.10 0.13 0.12 0.15 0.12 0.13 0.12 0.10 0.12
Economics 0.08 0.08 0.08 0.06 0.05 0.07 0.05 0.06 0.04
Overall score 0.75 0.69 0.67 0.59 0.57 0.54 0.53 0.52 0.41
Technical 0.17 0.14 0.14 0.10 0.10 0.12 0.10 0.14 0.04
Environmental 0.28 0.22 0.22 0.22 0.19 0.12 0.17 0.18 0.23
Social 0.05 0.07 0.06 0.08 0.06 0.06 0.06 0.05 0.05
Economics 0.31 0.31 0.31 0.23 0.19 0.22 0.18 0.23 0.18
Overall score 0.82 0.75 0.73 0.63 0.53 0.51 0.51 0.58 0.50
Technical 0.17 0.17 0.14 0.10 0.12 0.13 0.12 0.13 0.03
Environmental 0.32 0.25 0.26 0.25 0.22 0.13 0.17 0.16 0.22
Social 0.15 0.20 0.17 0.23 0.18 0.19 0.18 0.15 0.18
Economics 0.09 0.09 0.09 0.06 0.05 0.06 0.05 0.06 0.05
Overall score 0.73 0.70 0.65 0.64 0.56 0.51 0.52 0.50 0.46
Cha
lme
rs
Uni
vers
ity
of
Te
chno
log
y
Kre
tslo
pp o
ch
Va
tten
So
cial
act
ors
Table 18: Compiled MCA results based on the alternatives’ scoring values and criteria weights

63 CHALMERS Architecture and Civil Engineering, Master’s Thesis ACEX30-18-95
7. Discussion & Recommendations
7.1 The Stormwater treatment system in Brottkärr
Although the results from the sampling campaigns indicate retention of metals and nutrients,
and compliance with several values stipulated in Gothenburg’s Water Discharge Guidelines
(Table 9), there are still problems associated with the high concentrations of organic
contaminants and Cu, proper installation and functioning of the system, and its high monitoring
and maintenance demands. The presence of pollutants in the water is likely due primarily to
the construction activities in the area and determines its treatment needs to reach the guideline
values. The discharge of contaminated water into Krogabäcken remains the fundamental
concern due to the presence of trout and the sensitive state of the river concerning pollution
and flooding.
The construction activities that currently occur in the area considerably affect the water quality
and further, the high concentrations of solids associated with these activities also affect the
operation of the filter. Activities performed in construction sites such as earth moving works,
paving, house construction and temporary wastewater discharges, relate to high concentrations
of suspended solids and nutrients in stormwater (Sillanpaa & Koivusalo, 2015). It can be
assumed that after the termination of the construction activities in the area, resulting in a lower
discharge of sediments and pollutants in general, the performance of the system can improve,
leading to a lower release of contaminants into Krogabäcken. It is essential to install, as soon
as possible, a new filter media according to the treatment needs and manufacturer's
recommendations. Additionally, it is recommended to perform continuous monitoring and
maintenance operations in the system while the construction activities are present. After the
termination of these activities, such monitoring actions need to continue for a period of time to
achieve proper knowledge of the systems, which can lead to more conclusive results
concerning its operation and the potential of contaminants reduction. Filter capacity,
performance, and efficiency can be optimized by implementing proper monitoring schemes
that lead to adequate maintenance practices (Erickson, et al., 2010). The durability and long-
term operation of stormwater alternatives is dependent on the monitoring and maintenance
actions (Jefferies, et al., 2009).
Previous reports on the pollutant reduction potential in stormwater filters do not show adequate
results (Alm, et al., 2015; Dromberg, 2009). Regular evaluation of the system is recommended
due to the development of the urban area, which leads to a continuous increase of impervious
areas and an increment in the intensity of pollutant generating activities. It is essential for the
city of Gothenburg to determine which systems achieve a significant reduction of pollutants,
under which scenarios these can be installed, and which are the surrounding factors that can
profoundly impact the operating conditions of the system. Particular attention must be placed
when considering systems such as manhole filters. Media clogging is the main limiting factor
in the use of stormwater treatment filters (Kandra, et al., 2014).
The implementation of manhole filters is not viable when it is intended to handle stormwater
from large catchment areas due to its low capacity of peak flow and water volume control
(Woods-Ballard, et al., 2015). That is why water detention systems are usually installed before
the water quality treatment systems. The implementation of manhole filters in small catchment
areas can be a viable alternative, but its effectiveness depends on many factors linked to the
catchment area. That is why the determination of the characteristics and activities occurring in
the area is fundamental at the moment of selecting an adequate treatment alternative.

64 CHALMERS Architecture and Civil Engineering, Master’s Thesis ACEX30-18-95
The pollutant removal efficiency of stormwater filters is highly dependent on the characteristics
of the filter media. Waste products such as sawdust and pine barks have been reported to exhibit
important retention of hydrophobic organic compounds (Bjorklund & Li, 2015). Generic mulch
and processed jute also achieve retention of metals and benzo(a)pyrene under controlled
conditions (Wojtenko, et al., 2001). The removal of pollutants highly depends on factors such
as the surface area of the filtering media in contact with the water. The practicality of the
implementation of these methods in the field needs further study due to problems associated
with the reduction in the hydraulic capacity of the filters linked to clogging incidents, which is
a major problem in stormwater filters and biofilters (Hatt, et al., 2006). It is also important to
keep in mind that after its useful life is over, the filter media becomes waste which entails
treatment requirements and remediation.
It is considered essential to align ideas and actions among the different actors that carry out the
construction and operation of the stormwater treatment systems throughout the city of
Gothenburg. Entities such as Trafikverket (the Swedish Transport Administration) and
Trafikkontoret (the municipal traffic department) need to be included in the analysis and
discussions of the operating state of the treatment systems installed in the roads throughout the
city and municipalities. These analyses must include factors such as:
The current activities in the catchment area and their pollution intensity.
The activities planned to be carried out in the area, their lifetime, and pollution intensity.
The current state of the area concerning water and air pollution.
The operation and maintenance needs of the different stormwater alternatives
considered.
The expected pollution reduction of the system.
The sensitivity of the receiving water bodies.
The public exposure and interaction with the system.
All the stormwater systems which are installed along the water path before it is
discharged into the receiving water body.
The alignment between the different responsible entities will lead to better results in terms of
pollution mitigation, lower costs in the operation and maintenance of the systems, and the
constant improvement in the implemented technologies around the city.
7.2 Comparative analysis of stormwater treatment options
In general terms, the comparison of the performance of different BMPs for the various analyzed
aspects presents high uncertainties (see Appendix 6). The information resulting from the
literature review corresponds to a statistical summary of the expected performance of
stormwater systems. This information is intended to give a general idea about the performance
of each of the alternatives but cannot be taken as a definitive and forceful message. An analysis
of catchment area characteristics is considered a crucial aspect that determines the system´s
performance. Particular BMPs have been reported to work appropriately in areas while failing
in others due to regional and local characteristics (e.g., grassed BMPs work less efficiently in
cold climate regions) (Wang, et al., 2017). Design manuals should be focused on local aspects,
considering the different features of a region, and not on general guidelines.
The implementation of the SUDS should not be seen as a single stormwater management
system located in one specific site. Instead, the management of stormwater should be seen at a
local and regional level considering the entire water path from sources to receiving water
bodies (Bastien, et al., 2010; Jefferies, et al., 2009). Separate analyses along the entire water

65 CHALMERS Architecture and Civil Engineering, Master’s Thesis ACEX30-18-95
path should be done to identify the water management necessities in the different sub-
catchments. Multiple sites, where local management of water is achieved, results in a whole
water management scheme that works by stages as a water treatment train, resulting in a more
robust system (Jefferies, et al., 2009). Figure 12 shows the different zones that can be defined
along the water path (inlet and source control, site control, and regional control) in which
specific alternatives can be placed.
The sole participation of the municipalities as the entities responsible for stormwater quality is
not enough. Different statutes must be implemented to demand the inclusion of constructors
and inhabitants in the integrated management of stormwater, attacking the generation of
pollutants and the production of runoff at the source (upper parts of the water path). An
excellent example of this, is the use of green roofs and infiltrations lawns in private property,
which involves land owners to decrease water quantities reaching the sewer systems. The
inclusion of different actors promotes the generation of knowledge and nurtures the awareness
of the problem, thus creating better conditions for the networks to function. When the
implementation of inlet-source and site control alternatives is not possible, end-of-pipe
solutions are necessary to mitigate the water quality and quantity problems.
7.3 MCA Discussions
It is essential to evoke that a highly influential factor on the outcomes of an MCA is the
subjectivity related to the experience, knowledge, and expertise of each key-player.
Subjectivity also plays a prominent role in the alternative scoring stage, but is more evident in
the criteria weighting stage, where the key-players define their preferences explicitly. Despite
the high subjectivity of the MCA analysis, the inclusion of different and diverse actors is of
vital importance if it is to generate more accurate, inclusive, and efficient results. The definition
of the objectives can be more complex among a higher number of actors, but it is considered
that the discussions created, to allow the determination of a more realistic context, generates
better results.
The actors included in the present study can be counted as the first approach for future MCA
implementations, but they are not sufficient in the achievement of a more detailed analysis.
The influence and participation of other types of actors throughout the city of Gothenburg plays
an essential role in the scope of in-depth analysis. For example, Trafikkontoret is the
department responsible for the construction of the different stormwater management systems
related to road construction activities. Additionally, as evidenced in Section 3.2.3, traffic is an
important source of pollutants. Hence, it is critical for Kretslopp och Vatten to participate in
the design and construction stages of the alternatives planned by Trafikkontoret, and to include
these actors when analyzing the potential implementation of urban drainage systems for road
runoff. Adequate communication and joint work can lead to the implementation of better
alternatives with lower operation and maintenance costs without affecting the performance. In
turn, the inclusion of the environmental department of the city of Gothenburg should be
considered in the MCA to align the stormwater management objectives with local plans that
include monitoring, reporting, and proposal of actions aimed to the protection of the city's water
bodies.
Table 19 proposes different actors in Gothenburg which are thought of vital importance in the
implementation and achievement of adequate and sustainable stormwater management. For
example, the Green strategy for a dense and Greener city (in Swedish: Grönstrategi för en tät
och grön stad) of Parks and Nature Management (in Swedish: Park- och naturförvaltningen),
which aims to increase the green areas in the city for social and ecological benefits, can be

66 CHALMERS Architecture and Civil Engineering, Master’s Thesis ACEX30-18-95
aligned with stormwater management practices by the use of BMPs. Table 19 does not intend
to establish these actors as the only participants on which responsibilities rely. The site-specific
analysis, which should include a whole study of the catchment area and the anthropogenic and
biological activities present, should result in the accurate determination of the key-players of
interest for an MCA. Private parties, district administrators, and the Construction, Surveying
and Planning department could also contribute in a high extend to the effective management
of the stormwater.
The selection of alternatives, as well as the evaluation criteria, must be chosen and determined
among the actors involved and their preferences. The determination and analysis of a specific
site of alternative implementation are essential in the process of obtaining adequate results. The
method of exclusion criteria needs to be used during the determination of alternatives, thus
avoiding unnecessary costs related to the consideration of non-viable options. In turn, the BAU
scenario needs to be considered to evaluate the need for stormwater management accurately.
Additionally, it is recommended to perform the criteria selection by including at least one more
key-player, and not only the stakeholder. Consequently, the criteria contained in this study
consists of a starting point for further analysis. The criteria selected presents interdependency
problems among them, creating redundancy in the evaluation. Öztürk (2006) exposes different
methods to handle the redundancy and inter-dependency of criteria. It is assumed that the
redundancy and dependency of criteria can be reduced by performing the MCA analysis in a
specific place and by including different actors who allow the identification of a broader
spectrum of evaluation criteria.
The method used in the scoring of alternatives entails a high uncertainty due to the lack of
dialogue and discussion among the participants. As exposed in Section 6.3.4 and Appendix 7,
each participant scored the alternatives based on their willingness, knowledge, and expertise.
The method required then a further analyzes and calculations in which the final result was
achieved by calculating average values of the individual scoring. As a consequence, the
uncertainty in the results increased. A substantial reduction in the standard deviation in the
alternatives´ scoring can be achieved by conducting group discussions and collective
determination of the performance results. To improve the method, it is recommended to carry
out this exercise through workshops, in which people with expertise and related knowledge
meet to discuss each of the alternatives against the criteria categories, expecting to achieve a
single agreed value.
Although the results vary between key-players, wet retention basins, dry detention basins,
swales, and green roofs are ranked the top four BMPs in all the analyses. The uncertainty
associated with the subjectivity and preferences of the key-players plays an essential role in the
results. Martin et al. (2007) report the results of an MCA for stormwater management, where
Entity English Name
Miljöförvaltningen Department of Environment
Förvaltningen kretslopp och vatten Department for Sustainable Waste and Water
Trafikkontoret Department of Traffic
Park- och naturförvaltningen Department of Parks and Nature Management
Stadsbyggnadskontoret Department of City Planning
Byggande, lantmäteri och planarbete Department of Construction, surveying and Planning
Kulturförvaltningen Department of Culture Administration
Stadsdelsförvaltningar District Administrators
Table 19: Suggested entities to be included in future in-site analysis.

67 CHALMERS Architecture and Civil Engineering, Master’s Thesis ACEX30-18-95
the BMPs preferred by three different key-players resulted in infiltration system (such as
infiltration trenches and soakaways) ranked on top for every case. It is considered that the
extrapolation and comparison of results are not feasible due to the mentioned subjectivity of
the involved key-players and its related uncertainty. In a local aspect, due to the difficulties on
the implementation of infiltration systems in Gothenburg linked to the low permeability of the
soils, it is assumed that these systems did not obtain a considerable value in the results of this
study.
The results of the MCA show the preferences of the different actors concerning the criteria
categories under the sustainable development framework used. Although the three key-players
point to the environmental category as the principal aspect, sharp differences were evidenced
in the criteria weighting stage regarding the social category. Gothenburg, as a city focused on
the achievement of Sustainable Development, needs a greater integration of the social aspects
into the urban and environmental objectives associated with urban drainage. The study shows
an opportunity to improve the integration and inclusion of the mentioned social aspects into
local engineering and urban planning systems, achieving results that align better with the
objectives of the city. As shown, BMPs are an excellent alternative to embrace environmental,
social, and economic aspects into the achievement of local urban drainage goals. This
integrated approach can lead to the future implementation of better urban drainage alternatives,
whose overall and long-term performance can exceed the one evidenced in Brottkärr area.
68 CHALMERS Architecture and Civil Engineering, Master’s Thesis ACEX30-18-95
8. Conclusion Pollution from diffuse sources, which is commonly transported by stormwater in urban and
suburban areas, currently restricts the compliance of environmental objectives and standards
in Gothenburg. Even though the term stormwater is not contemplated explicitly in the Swedish
Environmental Code, diverse instruments and programs, including stormwater management
plans, have been established to accomplish the different environmental objectives. Several
entities in the city work together to mitigate and reduce stormwater pollutants discharged to
receiving water bodies, such as the river Göta Älv, or to Rya wastewater treatment plant.
Although the results are inconclusive, there is substantial evidence to support the hypothesis
that the stormwater management system installed in Brottkärr does not operate appropriately
in terms of water quality improvement: outlet concentrations of several pollutants exceed inlet
concentrations as well as water quality guidelines established for the city. Additional studies
conducted in Sweden support the findings and demonstrate the high requirements of operation,
monitoring, and maintenance of manhole filters. Different methods with lower operation and
maintenance needs may yield better results in the treatment and handling of stormwater.
The literature analysis showed that BMPs include a large variety of alternatives destined to
handle appropriately runoff volume and pollutant concentrations in stormwater; in this study,
nine specific BMPs of interest for the city were evaluated further. Many of these alternatives
not only include economic and environmental benefits such as lower construction costs (when
compared to traditional water treatment systems) and significant retention of pollutants, but
also have a high potential for ecological and social gains such as the enhancement of
biodiversity and inclusion of recreational activities. The multiplicity of variables associated
with these systems leads to analyses that may exhibit great complexity.
A multi-criteria analysis is a simple tool that could effectively support decision-making
processes intended to solve complex environmental issues, for example, stormwater
management. Its robustness highly depends on the inclusion of the different actors that make
up the urban environments, achieving an adequate and integrated analysis of the environmental
problems present in the area. The main factors that lead to the establishment of a valuable MCA
for stormwater management are: an adequate analysis of the catchment area; inclusion of the
affected actors; stipulation of the evaluation criteria; and establishment and reevaluation of the
alternatives of interest. The information required to determine the evaluation criteria depends
on the knowledge and preferences of the stakeholder and key-players involved. This condition
entails a high subjectivity of the method, as was evidenced in this study. However, the inclusion
of different experts in each of the variables considered in the project analysis can generate
satisfactory results in the environmental, economic, and social field. The results of the MCA
show the ranking of alternatives, where wet retention basins, dry detention basins, swales, and
green roofs are the four alternatives preferred by the key-players involved in the study. The
other five options occupy different position in the ranking, varying according to the stakeholder
or key-player considered. Due to the general characteristics of the study, which was based on
a city level, and the lack of exclusion criteria that could describe a specific site of
implementation, the results are considered inconclusive. Nevertheless, the results are
considered a starting point, where the misalignment between the social and the technical
aspects was evidenced. This misalignment reveals improvement opportunities that should be
considered in the specific evaluation of future projects aimed at the installation of urban
drainage systems under the sustainability framework. Besides, the process shows, and details,
several elements considered essential for the implementation of MCA in future stormwater

69 CHALMERS Architecture and Civil Engineering, Master’s Thesis ACEX30-18-95
projects, including the mentioned exclusion criteria, the inclusion of the different key-players
involved in the development of urban areas, and the subjectivity of the method with the
proposed ways in which it can be diminished. The information contained, and the method used,
are considered an excellent pedagogical tool that increases the knowledge on the performance
of the different available technologies and allows the exhaustive evaluation and identification
of the relevant criteria that must be considered within stormwater management, to achieve
Gothenburg’s sustainability goals.

70 CHALMERS Architecture and Civil Engineering, Master’s Thesis ACEX30-18-95
References Agency for Toxic Substances and Disease Registry, 1995. Toxicological Profile for Polycyclic
Aromatic Hydrocarbons. Atlanta: U.S. Department of Health and Human Services.
Alfieri, L. et al., 2018. Multi-Model Projections of River Flood Risk in Europe under Global Warming.
Climate, 6(1).
Alm, H., Banach, A. & Rennerfelt, J., 2015. Utvardering av filter i dagvattenbrunnar – en faltstudie i
Nacka kommun. Rapport 2015-12, s.l.: Svenskt Vatten Utveckling.
Al-Rubaei, Ph.D., A. M. et al., 2017. Survey of the Operational Status of 25 Swedish Municipal
Stormwater Management Ponds. Jorunal of Environmental Engineering, 143(6).
Al-Rubaei, A. M., Stenglein, A. L., Viklander, M. & Blecken, G.-T., 2013. Long-Term Hydraulic
Performance of Porous Asphalt Pavements in Northern Sweden. Journal of Irrigation and Drainage
Engineering, 139(6).
American Society of Civil Engineers (ASCE), 2000. National Stormwater Best Management Practices
(BMP) Database. Prepared by the Urban Water Resources Research Council of ASCE for the US EPA.,
Washington D.C.: Office of Science and Technology.
American Society of Civil Engineers, 2014. Public Safety Guidance for Stormwater facilities. Reston:
American Society of civil Engineers.
Andersen, C. T., Foster, I. D. & Pratt, C. J., 1999. The role of urban surfaces (permeable pavements) in
regulating drainage and evaporation: development of a laboratory simulation experiment. Hydrological
Processes, Volume 13, pp. 597-609.
Arnell, V., 1978. Analysis of rainfall data for use in design of storm sewer systems, Göteborg: Chalmers
University of Technology.
Assmuth, E., 2017. Performance of roadside filtration systems in the treatment of stormwater, Aalto:
Aalto University. School of Engineering.
Baish, A. S. & Caliri, M. J., 2009. Average Nutrient and Sediment Effluent Removal Efficiencies for
Stormwater Best Management Practices Implemented in Maryland 1984-2002, Baltimore: Geology and
Environmental Engineering Johns Hopkins University.
Balasubramaniam, A. & Voulvoulis, N., 2005. The Appropriateness of Multicriteria Analysis in
Environmental Decision-Making Problems. Environmental Technology, Volume 26, pp. 951-962.
Barr Engineering Company, 2011. Best Management Practices Construction Costs, Maintenance
Costs, and Land Requirements, Minneapolis: Barr Engineering Company.
Bastien, N., Arthur, S., Wallis, S. & Scholz, M., 2010. The best management of SuDS treatment trains:
a holistic approach. Water Science & Technology, Volume 61.1, pp. 263-272.
Battiata, J., Collins, K., Hirschman, D. & Hoffman, G., 2010. The Runoff Reduction Method. Journal
of Contemporary Water Research & Education, Volume 146, pp. 11-21.
Bergqvist, N., 2014. Environmental assessment and sustainable stormwater planning with regard to
climate change through multi-criteria analysis (MCA), Gothenburg: Chalmers University of
Technology.
Birch, G. F., Matthai, C. & Fazeli, M. S., 2007. Efficiency of a retention/detention basin to
removecontaminants from urban stormwater. Urban Water Journal, 3(2), pp. 69-77.

71 CHALMERS Architecture and Civil Engineering, Master’s Thesis ACEX30-18-95
Björklund, K., 2011. Sources and Fluxes of Organic Contaminants in Urban Runoff, Gothenburg:
Chalmers University of Technology.
Bjorklund, K., Almqvist, H., Malmqvist, P.-A. & Stromvall, A.-M., 2008. Best Management Practices
to Reduce Phthalate and Nonylphenol Loads in Urban Runoff, Goteborg, Lulea: Chalmers University
of Technology, Lulea Municipality.
Bjorklund, K. & Li, L., 2015. Evaluation of low-cost materials for sorption of hydrophobic organic
pollutants in stormwater. Journal of Environmental Management, Volume 159, pp. 106-114.
Boverket, 2016. Legislation. Planning and Building Act (2010:900). Planning and Building Ordinance
(2011:338), Gothenburg: Swedish National Board of Housing, Building and Planning.
Boverket, 2017. Plan- och bygglagen som ett effektivt verktyg for minskad klimatpaverkan. [Online]
Available at: https://www.boverket.se/globalassets/publikationer/dokument/2017/plan--och-
bygglagen-som-ett-effektivt-verktyg-for-minskad-klimatpaverkan.pdf
[Använd 1 03 2018].
Brabec, E., Schulte, S. & Richards, P. L., 2002. Impervious Surfaces and Water Quality: A Review of
Current Literature and Its Implications for Watershed Planning. Journal of Planning Literature, 16(4),
pp. 499-514.
Brown, J. N. & Peake, B. M., 2006. Sources of heavy metals and polycyclic aromatic hydrocarbons in
urban stormwater runoff. Science of the Total Environment, Volume 359, pp. 145-155.
Butler, D. & Davies, J. W., 2004. Urban Drainage. 2nd ed. ed. London: Spon Press.
Bäckström, M., 1999. Porous Pavement in a Cold Climate, Luleå: Luleå University of Technology.
California Stormwater Quality Association, 2015. A Strategic Approach to Planning for and Assessing
the Effectiveness of Stormwater Programs, s.l.: California Stormwater Quality Association (CASQA).
CEC, 2000. Directive establishing a framework for Community action in the field of water policy,
2000/60/EC, s.l.: s.n.
City of Gothenburg, 2016. Annual Report. [Online]
Available at: http://goteborg.se/wps/wcm/connect/3bca7447-c3f0-497a-864e-
a834894dad1c/City_of_Gothenburg_annual_report_2016.pdf?MOD=AJPERES
[Accessed 15 03 2018].
Corson, L. A., 2006. Assessment and Selection of Stormwater Best Management Practices for Highway
Construction, Retrofitting, and Maintenance, West Lafayette: Joint Transportation Research Program,
Purdue University.
COWI AB, 2011. Next Step Group AB. Naturutredning Krogabacken, Göteborg: COWI AB.
Dahl Sverige AB, n.d. Dagvattenboken. Utgåva 2 ed. Sweden: Dahl Sverige AB.
Dakin, K., Benjamin, L. L. & Pantiel, M., 2013. The Professional Design Guide to Green Roofs.
London: Timber Press.
Davis, A. P., Stagge, J. H., Jamil, E. & Kim, H., 2012. Hydraulic performance of grass swales for
managing highway runoff. Water Research, Volume 46, pp. 6775-6786.
Department for Communities and Local Government, 2009. Multi-criteria analysis: A manual, London:
Communities and Local Government Publications.
DHI, 2018. Brottkarr vattenprovtagning. Sammanstallning 2017, Gothenburg, Sweden: DHI.

72 CHALMERS Architecture and Civil Engineering, Master’s Thesis ACEX30-18-95
Dittmer, D.-I. U., 2017. Design of Sewer Systems and Stormwater Treatment. Stuttgart: Institute for
Sanitary Engineering, Water Quality and Solid Waste Management.
Drake, J., Young, D. & McIntosh, N., 2016. Performance of an underground stormwater detention
chamber with comparison with stormwater management ponds. Water, 8(5)(2011).
Dromberg, P., 2009. Brunnsfilter for rening av vagdagvatten, Stockholm: Stockholm Vatten VA AB,
Sweco.
E2STORMED Project, 2015. Report on Stormwater Management, Valencia: Universitat Politecnica de
Valencia.
Ellis, J. B., 1986. Pollution Aspects of Urban Runoff. In: Urban Runoff Pollution. Berlin Heidelberg
New York Tokyo: Springer-Verlag, pp. 1-38.
Ellis, J. B. et al., 2004. Multicriteria decision approaches to support sustainable drainage options for the
treatment of highway and urban runoff. Science of the Total Environment, pp. 251-260.
Environmental Protection Agency - Region I, 2016. [Online]
Available at: https://www3.epa.gov/region1/npdes/stormwater/ma/green-infrastructure-stormwater-
bmp-cost-estimation.pdf
[Accessed 18 04 2018].
EPA, 2017. Nutrient Pollution. Sources and Solutions. [Online]
Available at: https://www.epa.gov/nutrientpollution/sources-and-solutions
[Accessed 10 03 2018].
Erickson, A. J. et al., 2010. Maintenance for Stormwater Treatment Practices. Journal of Contemporary
Water Research & Education, Volume 146, pp. 75-82.
Erickson, A. J., Weiss, P. T. & Gulliver, J. S., 2013. Optimizing Stormwater Treatment Practices. A
Handbook of Assessment and Maintenance. New York: Springer.
European Comission, 2015. Natural Water Retention Measures (NWRM). [Online]
Available at: http://nwrm.eu
[Accessed 17 04 2018].
European Commission, 2016. The EU Floods Directive. [Online]
Available at: http://ec.europa.eu/environment/water/flood_risk/
[Accessed 8 March 2018].
European Parliament, 2000. Directive 2000/60, Brussels: European Parliment.
Fassman, E., 2012. Stormwater BMP treatment performance variability for sediment and heavy metals.
Separation and Purification Technology, Volume 84, pp. 95-103.
Figueira, J., Greco, S. & Ehrgott, M., 2005. Multiple Criteria Decision Analysis. Boston: Springer.
Fiskevårdsnätverket Göteborg, 2018. Krogabäcken. [Online]
Available at: http://fiskevardgoteborg.se/fvo/sodra-fvo/kroga/
[Använd 25 03 2018].
Gobel, P., Dierkes, C. & Coldewey, W. G., 2007. Storm water runoff concentration matrix for urban
areas. Journal of Contaminant Hydrology, Volume 91, pp. 26-42.
Göteborg Stad; Kretslopp och vatten, 2017. Billdalsvägen, Gothenburg: Göteborg Stad.
Göteborg Stad, 2009. Comprenhensive Plan for Göteborg, Göteborg: Göteborg Stad.
73 CHALMERS Architecture and Civil Engineering, Master’s Thesis ACEX30-18-95
Goteborg Stad, 2013. Miljoforvaltningens riktlinjer och riktvarden for utslapp av fororenat vatten till
recipient och dagvatten, Goteborg: Goteborg Stad - Miljöförvaltningen.
Göteborg Stad, 2013. Vatten- och avlopps- och avfallshistorik. [Online]
Available at: http://goteborg.se/wps/portal/start/kommun-o-politik/kommunens-
organisation/forvaltningar/forvaltningar/forvaltningen-kretslopp-och-vatten/vara-verksamheter/vatten-
-och-avlopps--och-
avfallshistorik/!ut/p/z1/hY7PC4IwHMX_Gq_7zrnp1m0EBRb9umi7hMaagjqZq0F_fXYM
[Använd 8 March 2018].
Göteborg Stad, 2014. Vattenstatistik. [Online]
Available at: http://goteborg.se/wps/portal/start/kommun-o-politik/kommunens-
organisation/forvaltningar/forvaltningar/forvaltningen-kretslopp-och-vatten/vara-
verksamheter/vattenstatistik/!ut/p/z1/hY7LCsIwFES_ptvc29hH4i6IClV8bVqzkVZiWmibkkYDfr11K
SjObpgzzICEAmRfPhpdusb0Z
[Använd 15 3 2018].
Göteborg Stad, 2017. Reningskrav for dagvatten, Göteborg: u.n.
Göteborgs Stad, 2009. Översiktsplan för Göteborg. [Online]
Available at: http://goteborg.se/wps/portal/start/byggande--lantmateri-och-planarbete/kommunens-
planarbete/oversiktlig-planering/oversiktsplan-for-goteborg/!ut/p/z1/hY7BCoJAGISfxuv-
_66Y1m07WKmkQZDtJTS2VVBX1q2Fnj47BkVzG-
YbZkBACWKoHq2qbKuHqpv9WSwuBU0O0ZpyzDfLGHfHtIj3aZbj
[Accessed 2 March 2018].
Goteborgs Stad, 2010. Dagvatten, sa har gor vi! Handbok for kommunal planering och forvaltning.,
Goteborgs: Billes tryckeri.
Hammer, T. R., 1972. Stream channel enlargement due to urbanization. Water Resources Research,
8(6), p. 1530–1540.
Hancock, G. S., Holley, J. W. & Chambers, R. M., 2010. A Field-Based Evaluation of wet Retentnion
Ponds: How effective are Ponds at Water Quality Control?. Journal of the American Water Resources
Association, 46(6), pp. 1145-1158.
Harper, Ph.D., P.E., H. H., 1995. Pollutant Removal Efficiencies for Typical Stormwatr Management
Systems in Florida, Orlando: Environmental Research & Design, Inc..
Hartmann, D. L. et al., 2013. Observations: Atmosphere and Surface. In: Climate Change 2013: The
Physical Science Basis. Contribution of Working Group I to the Fifth Assessment Report of the
Intergovernmental Panel on Climate Change, United Kingdom and New York: Cambridge University
Press.
Hathaway, J. M., Tucker, R. S. & Spooner, J. M., 2012. A Traditional Analysis of the First Flush Effect
for Nutrients in Stormwater Runoff from Two Small Urban Catchments. Water Air Soil Pollution,
223(9), pp. 5903-5915.
Hatt, B. E., Siriwardene, N., Deletic, A. & Fletcher, T. D., 2006. Filter media for stormwater treatment
and recycling: the influence of hydraulic properties of flow on pollutant removal. Water Science and
Technology, 54(6/7), pp. 263-272.
Horner, R., 1995. Constructed Wetlands for Urban Runoff Water Quality Control, Seattle: Department
of Civil Engineering. University of Washington, Seattle, WA.

74 CHALMERS Architecture and Civil Engineering, Master’s Thesis ACEX30-18-95
Hossain, M. A., Furumai, H., Nakajima, F. & Aryal, R. K., 2007. Heavy metals speciation in soakaways
sediment and evaluation of metal retention properties of surrounding soil. Water Science & Technology,
56(11), pp. 81-89.
Hvitved-Jacobsen, T., Vollersten, J. & Nielsen, A. H., 2010. Urban and Highway Stormwater Pollution:
Concepts and Engineering. s.l.:CRC Press.
Hvltved-Jacobsen, T., Johansen, N. B. & Yousef, Y. A., 1994. Treatment systems for urban and
highway run-off in Denmark. The Science of the Total Environmen, 146(147), pp. 499-506.
International Stormwater BMP Database, 2016. International Stormwater BMP Database. Version
2016 11 17. [Online]
Available at: www.bmpdatabse.org
[Accessed 17 4 2018].
International Stormwater BMP Satabase, 2014. International Stormwater Best Management Practices
(BMP) Database Pollutant Category Statistical Summary Report. [Online]
Available at:
http://www.bmpdatabase.org/Docs/2014%20Water%20Quality%20Analysis%20Addendum/BMP%2
0Database%20Categorical_StatisticalSummaryReport_December2014.pdf
[Accessed 2018].
IPCC, 2012. Managing the Risks of Extreme Events and Disasters to Advance Climate Change
Adaptation. A Special Report of Working Groups I and II of the Intergovernmental Panel on Climate
Change, Cambridge, UK, and New York, USA: Cambridge University Press.
Jefferies, C. et al., 2009. Sustainable Urban Drainage Systems (SUDS) treatment train assessment tool.
Water Science & Technology, Volume 60.5, pp. 1233-1240.
Jotte, L., Raspati, G. & Azrague, K., 2017. Review of Stormwater Management Practices, Trondheim:
SINTEF Building and Infrastructure.
Kandra, H. S., McCarthy, D., Fletcher, T. D. & Deletic, A., 2014. Assessment of clogging phenomena
in granular filter media used for stormwater treatment. Journal of Hydrology, p. 518–527.
Kang, J.-H., Weiss, P. T., Wilson, C. B. & Gulliver, J. S., 2008. Maintenance of Stormwater BMP´s:
Frequency, Effort and Costs. Stormwater, 9(8), pp. 18-28.
Knox, P., 2012. Scharnhauser Park, Stuttgart (New Town). In: Palimpsests - Biographies of 50 City
Districts. International Case Studies of Urban Change. s.l.:Walter de Gruyter GmbH, pp. 202-205.
Koch, B. J. et al., 2014. Nitrogen Removal by Stormwater Management Strcutures: A Data Synthesis.
Journal of the American Water Resources Association, 50(6), pp. 1594-1607.
Lavieille, D., 2005. Järnbrott Stormwater Pond Evolution of the Pollutant Removal Efficiency and
Release from Sediments, Goteborg: Chalmers University of Technology.
Lee, J. H. & Bang, K. W., 2000. Characterization of urban stormwater runoff. Water Research, 34(6),
pp. 1773-1780.
Legret, M., Colandi, V. & Le Marc, C., 1999. Effects of a porous pavement with reservoir structure on
the quality of runoff water and soil. The Science of the Total Environment, 189(190), pp. 355-340.
Lindh, J., 2013. Sustainable Stormwater Management to Address Pollution and Climate Change. Why
is it not used to its full potential in the city of Gothenburg?, Gothenburg, Sweden: Göteborgs
Universitet.
75 CHALMERS Architecture and Civil Engineering, Master’s Thesis ACEX30-18-95
Li, Y. & Babcock, R., 2014. Green roofs against pollution and climate change. A review. Agron- omy
for Sustainable Development, Springer Verlag/EDP Sciences/INRA, 34(4), pp. 695-705.
Locatelli, L. et al., 2015. Modelling the impact of retention-detentnion units on sewer surcharge and
peak and annual runoff reduction. Water Science and Technology, 71(6), pp. 898-903.
Locatelli, L. et al., 2015. Determining the extent of groundwater interference on the performance of
infiltration trenches. Journal of Hydrology, Volume 529, pp. 1360-1372.
l'Ons, D., 2017. Gryaabs slamstrategi. [Online]
Available at: http://www.svensktvatten.se/globalassets/utbildning/konferenser-och-
seminarier/nam17/kretslopp/44-gryaabs_slamstrategi.pdf
[Accessed 12 03 2018].
Loucks, D. P. & van Beek, E., 2005. Water Resources Systems Planning and Management An
Introduction to Methods, Models and Applications. Italy: UNESCO.
Lansstyrelsen i Vastra Gotalands lan, Enheten for skydd och sakerhet, 2015. Riskhanteringsplan for
oversvamningar i Goteborg, Goteborg: Riskhanteringsplan for oversvamningar i Goteborg.
Martin, C., Ruperd, Y. & Legret, M., 2007. Urban stormwater drainage management: The development
of a multicriteria decision aid approach for best management practices.. European Journal of
Operational Research, pp. 338-349.
Maskell, A. D. & Sherriff, J. D., 1992. Scope for Control of Urban Runoff. VOLUME: A Review of
Present Methods and Practice. Report 124, London: Ciria.
Michanek, G., 2011. Introduction to the Fourth Issue. In: Nordic Environmental Law Journal. s.l.:s.n.,
p. 1.
Middlesex University, 2003. Report 5.1. Review of the Use of stormwater BMPs in Europe, s.l.: EU
RTD 5th Framework.
Moura, P., Barraud, S., Baptista, M. B. & Malard, F., 2011. Multicriteria decision-aid method to
evaluate the performance of stormwater infiltration systems over the time. Water Science and
Technology, 64(10), pp. 1993-2000.
Munier, N., 2011. A Strategy for Using Multicriteria Analysis in Decision-Making. A Guide for Simple
and Complex Environmental Projects. Dordrecht, Heidelberg, London, New York: Springer.
National Academies of Sciences, Engineering, and Medicine, 2014. Long-Term Performance and Life-
Cycle Costs of Stormwater Best Management Practices. Washington, DC: The National Academies
Press.
National Academy of Sciences, 2008. Urban Stormwater Management in the United States,
Washington D.C: The National Academies Press.
Naturvårdsverket, 2016. Sweden´s Environmental Objectives, Stockholm: Naturvårdsverket.
Nilsson, E., 2013. Fororeningsreduktion och Flodesutjamning i makadammagasin – en studie av ett
makadammagasin i kungsbacka. Journal of Water Management and Research, Volume 69, pp. 101-
107.
Norconsult AB, 2011. Bostader norr om Uggledal, Gothenburg: Norconsult AB.
Norconsult AB, 2011. Detaljplan for Narcentrum vid Brottkarrsmotet, Göteborg: Norconsult Ab;
Göteborg Stad.

76 CHALMERS Architecture and Civil Engineering, Master’s Thesis ACEX30-18-95
Novotny, V., Ahern, J. & Brown, P., 2010. Water Centric Sustainable Communities. New Jersey: John
Wiley & Sons, INC..
Nyström, U., 2012. http://www.gp.se/nyheter/göteborg/regnet-förorenade-älvens-vatten-1.634254.
[Online]
Available at: http://www.gp.se/nyheter/göteborg/regnet-förorenade-älvens-vatten-1.634254
[Accessed 15 03 2018].
Pagotto, C., Legret, M. & Le Cloirec, P., 2000. Comparison of the hydraulic behaviour and the quality
of highway runoff Water according to the type of pavement.. Water Research, 34(18), pp. 4446-4454.
Peluso, V. & Marshall, A., 2002. Best Management Practices for South Florida Urban Stormwater
Management Systems, West Palm Beach: South Florida Water Management District.
Pettersson, T. J., 1999. Stormwater Ponds for Pollution Reduction, Gothenburg, Sweden: Chalmers
University of Technology.
Rosen, L. et al., 2013. SCORE: Multi-Criteria Analysis (MCA) for Sustainability Appraisal of Remedial
Alternatives, Gothenburg: Chalmers Publication Library.
Rossmiller, R. L., 2014. Stormwater Design for Sustainable Development. s.l.:McGraw-Hill Education.
Rowe, D. B., 2011. Green roofs as a means of pollution abatement. Environmental Pollution, Volume
159, pp. 2100-2110.
Saget, A., Chebbo, G. & Bertrand-Krajewski, J.-L., 1996. The First Flush in Sewer Systems. Water
Science & Technology, 33(9), pp. 101-108.
San Cristóbal Mateo, J. R., 2012. Multi-criteria Analysis in the Renewable Energy Industry. London:
Springer.
Scholes, L., Revitt, D. M. & Ellis, J. B., 2004. Determination of numerical values for the assessment of
BMPs, s.l.: Middlesex University.
Scholes, L., Revitt, D. M. & Ellis, J. B., 2008. A systematic approach for the comparative assessment
of stormwater pollutant removal potentials. Journal of Environmental Management, Volume 88, pp.
467-478.
Sijtsma, F., 2006. Project evaluation, sustainability and accountability: combining cost-benefit analysis
(CBA) and multi-criteria analysis (MCA), s.l.: University of Groningen.
Sillanpaa, N. & Koivusalo, H., 2015. Stormwater quality during residential construction activities:
influential variables. Hydrological Processes, Volume 29, p. 4238–4251.
SMHI, 2011. Klimatanalys for Vastra Gotalands lan. Raport 2011-45. Sweden: SMHI.
SMHI, 2012. Urban Water Vision. [Online]
Available at: https://www.smhi.se/en/research/research-departments/hydrology/urban-water-vision-
eng-1.22093
[Accessed 15 03 2018].
SMHI, 2018. Maj 2018 - Sommarväder med rekordvärme. [Online]
Available at: https://www.smhi.se/klimat/klimatet-da-och-nu/manadens-vader-och-vatten-
sverige/manadens-vader-i-sverige/maj-2018-meteorologi-1.134781
[Accessed 20 June 2018].
Song, J.-Y., Chung, E.-S. & Kim, S. H., 2018. Decision Support System for the Design and Planning
of Low-Impact Development Practices: The Case of Seoul. Water, 10(146).

77 CHALMERS Architecture and Civil Engineering, Master’s Thesis ACEX30-18-95
Stahre, P., 2006. sustainability in Urban Storm Drainage. Planning and examples. Stockholm: Svenskt
Vatten.
Stahre, P. & Geldof, G. D., 2003. New Approach to Sustainable Stormwater Planning, Malmo:
International Green Roof Institute.
Steinmetz, P. H. & Krampe, D.-I. J., 2009. Part 1: Urban Drainage. In: W. Q. a. S. W. M. Institute of
Sanitary Engineering, ed. Wastewater Technology. Stuttgart: Universität Stuttgart.
Swedish Environmental Protection Agency, 2017. The Swedish Environmental Code. [Online]
Available at: http://www.swedishepa.se/Guidance/Laws-and-regulations/The-Swedish-
Environmental-Code/
[Accessed 8 March 2018].
Swedish Environmental Protection Agency, 2018. Environmental Objectives. [Online]
Available at: https://www.miljomal.se/Environmental-Objectives-Portal/
[Accessed January 2018].
Soderberg, J., 2011. EU:s ramdirektiv for vatten och dagvattenfororening. In: Nordisk Miljorattslig
Tidskrift. s.l.:s.n.
Sorensen, J. & Rana, A., 2013. Comparative Analysis of Flooding in Gotenburg, Sweden and Mumbai,
India: A Review, Sweden: Lund Univeristy.
Tetra Tech, Inc., 2008. Stormwater Best Management Practices (BMP) Performance Analysis, Fairfax,
VA: Tetra Tech.
The Center for Watershed Protection, 2013. Cost-Effectiveness Study of Urban Stormwater BMPs in
the James River Basin, Maryland: The Center for Watershed Protection.
Tota-Maharaj, K. & Scholz, M., 2013. Combined permeable pavement and photocatalytic titanium
dioxide oxidation system for urban run-off treatment and disinfection. Water and Environment Journal,
Volume 27, pp. 338-347.
Trafikkontoret Göteborg Stad, 2013. Trafikåret: webbkatalogen. [Online]
Available at: http://www.statistik.tkgbg.se
[Accessed 25 03 2018].
Transport Infrastructure Ireland, 2015. Design of Soakaways, Ireland: TII Publications.
U.S. Department of the Interior, n.d. Green Roof benefits. [Online]
Available at: https://www.nps.gov/tps/sustainability/new-technology/green-roofs/benefits.htm
[Accessed 19 04 2018].
United Nations, Department of Economic and Social Affairs, Population division, 2015. World
Urbanization Prospects: The 2014 Revision, New York: United Nations.
United States Environment Protection Agency, 1999. Storm Water Technology Fact Sheet. Infiltration
Trench, Washington: United States Environment Protection Agency.
United States Environmental Protection Agency, 1999. Preliminary Data Summary of Urban Storm
Water Best Management Practices, Washington: United States Environmental Protection agency.
United States Environmental Protection Agency, 1999. Storm Water Technology Fact Sheet. Porous
Pavement, Washington, D.C.: United States Environmental Protection agency.
United States Environmental Protection Agency, 1999. Storm Water Technology Fact Sheet. Wet
Detentnion Ponds, Washington, D.C: United States Environmental Protection Agency. .

78 CHALMERS Architecture and Civil Engineering, Master’s Thesis ACEX30-18-95
United States Environmental Protection Agency, 2000. Stormwater Phase II Final Rule: An Overview,
s.l.: US EPA.
United States Environmental Protection Agency, 2009. Stormwater Wet Pond and Wetland
Management Guidebook, s.l.: United States Protection agency.
United States Environmental Protection Agency, 2018. National Menu of Best Management Practices
(BMPs) for Stormwater. [Online]
Available at: https://www.epa.gov/npdes/national-menu-best-management-practices-bmps-
stormwater#edu
[Accessed 20 February 2018].
Upadhyaya, J. K., 2013. A sustainability assessment framework for infrastructure: Application in
stormwater systems, Windsor, Canada: University of Windsor.
van der Perk, M., 2012. Soil and Water Contamination. 2. Edition ed. Utretch: CRC Press.
Wang, M., Zhang, D. Q., Dong, J. W. & Tan, S. K., 2017. Constructed wetlands for wastewater
treatment in cold climate — A review. Journal Of Environmental Sciences, Volume 57, pp. 293-311.
Water Environment & Reuse Foundation (WE&RF), 2017. International Stormwater BMP Database.
2016 SUMMARY STATISTICS, s.l.: Water Environment & Reuse Foundation (WE&RF).
VA-Verket, 2001. Dagvatten. Inom planlagda områden. [Online]
Available at: http://goteborg.se/wps/wcm/connect/823376f9-2624-4394-81a1-
2723cb18330e/OPA_Dagvattenplan.pdf?MOD=AJPERES
[Accessed 13 03 2018].
Weiss, P. T., Gulliver, J. S. & Erickson, A. J., 2010. The Performance of Grassed Swales as Infiltration
and Pollution Prevention Practices. A literature review, s.l.: s.n.
Werthman, C., 2007. Green Roof - A Case Study. New York: Princeton Architectural Press.
Vijayaraghavan, K., 2016. Green roofs: A critical review on the role of components, benefits,
limitations and trends. Renewable and Sustainable Energy Systems, Volume 56, pp. 740-752.
Wojtenko, I., Ray, A. B. & Field, R., 2001. Use of Natural Filter Media for Stormwater Treatment.
Orlando: United States Environmental Protection Agency.
Woods-Ballard, B. et al., 2015. The SuDS Manual (C753). London, UK: Construction Industry
Research and Information Association (CIRIA).
World Health Organization, 2018. Persistent organic Pollutants. [Online]
Available at: http://www.who.int/foodsafety/areas_work/chemical-risks/pops/en/
[Accessed 19 03 2018].
Wuana, R. A. & Okieimen, F. E., 2011. Heavy Metals in Contaminated Soils: A Review of Sources,
Chemistry, Risks and Best Available Strategies for Remediation. International Scholarly Research
Network, Volume 2011, p. 20.
Xue, S. et al., 2017. Cadmium, lead, and arsenic contamination in paddy soils of a mining area and their
exposure effects on human HEPG2 and keratinocyte cell-lines. Environmental Research , Volume 156,
pp. 23-30.
Yousef, Y. A., Wanielista, M. P. & Harper, H. H., 1981. Removal of Highway Contaminants by
Roadside Swales. Transportation Research Record, Volume 1017, pp. 62-68.

79 CHALMERS Architecture and Civil Engineering, Master’s Thesis ACEX30-18-95
Zarghami, M. & Szidarovszky, F., 2011. Multicriteria Analysis. Applications to Water and Environment
Management. Heidelberg Dordrecht London New York: Springer.
Ozturk, Z. K., 2006. A Review of Multi Criteria Decision Making with Dependency between Criteria,
Eskisehir: Anadolu University.
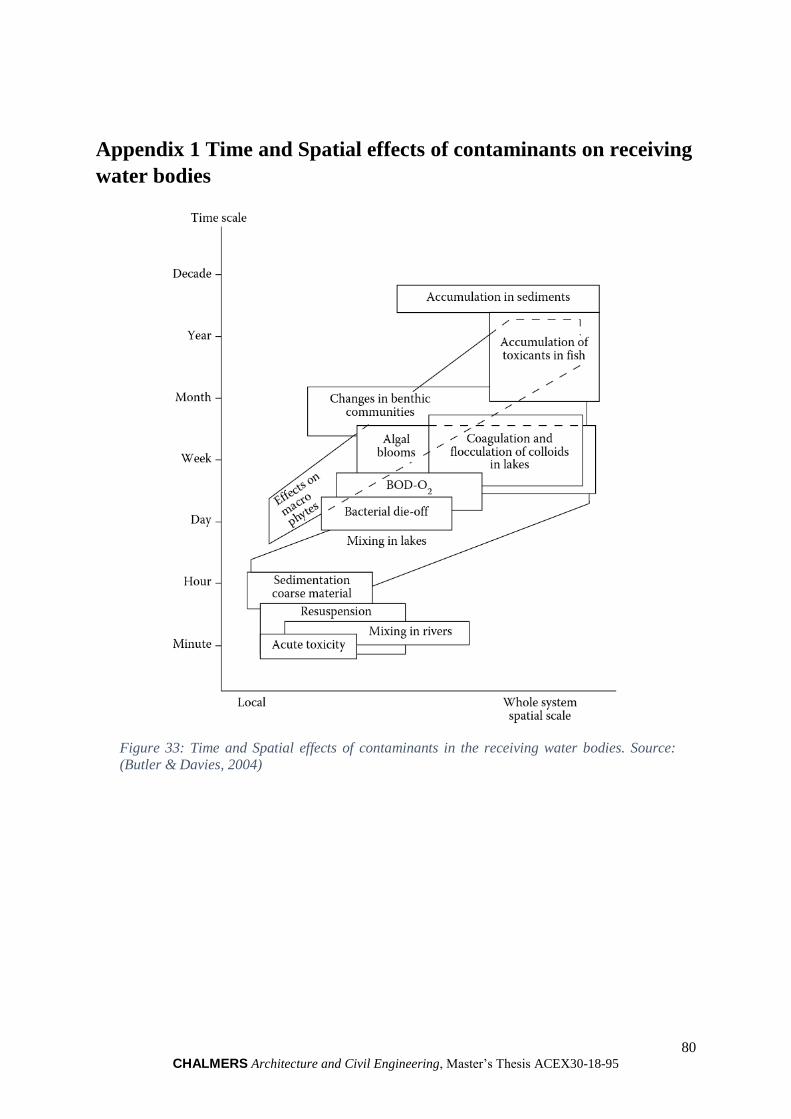
80 CHALMERS Architecture and Civil Engineering, Master’s Thesis ACEX30-18-95
Appendix 1 Time and Spatial effects of contaminants on receiving
water bodies
Figure 33: Time and Spatial effects of contaminants in the receiving water bodies. Source:
(Butler & Davies, 2004)

81 CHALMERS Architecture and Civil Engineering, Master’s Thesis ACEX30-18-95
Appendix 2 Advantages and disadvantages of separate and
combined sewer systems
Table 20: Advantages and disadvantages of combined and separate sewer systems. Source: (Butler &
Davies, 2004)

82 CHALMERS Architecture and Civil Engineering, Master’s Thesis ACEX30-18-95
Appendix 3 Hydrographs
Figure 34 and Figure 35 shows the hydrographs in Point A and Point B, respectively. Three
different results are exposed:
Blue graph: Water level in the system (meters)
Green graph: Water velocity (m/s)
Red graph: Water flow (m3/s)
Figure 34: Inlet hydrograph. Used with permission from: (DHI, 2018)
Figure 35 Outlet hydrograph. Used with permission from: (DHI, 2018)

83 CHALMERS Architecture and Civil Engineering, Master’s Thesis ACEX30-18-95
Appendix 4 Remedial actions on the filter
Figure 36: Filter Before the reparations
Figure 37: Filter after the reparations

84 CHALMERS Architecture and Civil Engineering, Master’s Thesis ACEX30-18-95
Appendix 5 Tracer test information
Appendix 5.1 Time delay measuring points
Manhole filter –
(00:12:45)
Point A.1 –
(00:04:15)
Point A – Water and
tracer discharged.
(00:00:00)
Point B –
(00:04:46) – B(middle)
(00:09:40) – B (west)
(00:11:45) – B(east)
Point C (outlet)
(00:15:50)
Point C (outlet)
Figure 38: Tracer test measuring points

85 CHALMERS Architecture and Civil Engineering, Master’s Thesis ACEX30-18-95
Appendix 5.2 Point B measurements
Point B (West)–
Time of arrival
(00:09:40)
Point B (Middle)–
Time of arrival
(00:014:46)
Point B (east)–
Time of arrival
(00:11:45)
Figure 39: Manholes in Measuring Point B

86 CHALMERS Architecture and Civil Engineering, Master’s Thesis ACEX30-18-95
Appendix 6 Stormwater management systems’ performance evaluation
Appendix 6.1 Technical performance
Appendix 6.1.1 Hydraulic response- Water flow control performance
Peak flow (PF)-Volume
Reduction (V)Comments Sources
Wet Retention Pond Medium (PF) - No
reduction (V)
Wet-retention ponds possess no ability to reduce overall the runoff
volume. Hydraulic efficiencies highly depend on length-to-width ratios.
Battiata, et al., 2010; Hancock, et al., 2010; Al-
Rubaei, Ph.D., et al., 2017
Dry Detention Pond High (PF) - Low (V) Runoff reduction highly depends on the design of the system. Some
systems achieve 100-year peak flow and have problems with 2-year peak
flows. (20-90%)
Jotte, et al., 2017; E2STORMED Project,
2015
Swales Medium(PF)- Low (V) Highly dependent on rain event characteristics. Total volume and flow
magnitudes are significantly reduced in rainfall of low precipitation (40-
60%). Due to their limited storage volumes, swales work primarily as
flow conveyance during significant rain events. Wet swales present 0%
reduction.
Davis, et al., 2012; Jotte, et al., 2017; Battiata,
et al., 2010; Corson, 2006; Weiss, et al., 2010
Infiltration Trenches High (PF)-High(V) Possess an essential reduction in peak flows (50-90%). Nevertheless,
their performance is highly dependant on the rain intensity.
Jotte, et al., 2017; Song, et al., 2018; Battiata,
et al., 2010
Underground detention High(PF)-No Reduction
(V)
Runoff reduction highly depends on the design of the system. E2STORMED Project, 2015
Manhole filters No reduction (PF) - No
reduction (V)
No runoff reduction can be achieved. Filters contain structures that
discharge the water without treatment under overflow conditions.
Pervious Pavements High (PF) -High (V) (45-75%) High reductions. Nevertheless, freezing conditions affect the
performance of the system. Runoff control can be affected by a 50%
when compared to temperatures of 20 Degrees Celsius.
Andersen, et al., 1999; Bäckström, 1999;
Battiata, et al., 2010
Green Roof Storage Low (PF) - Moderate (V) This system achieves considerable water volume reduction capacity. 50%
of annual runoff volume reductions have been reported.
Stahre, 2006; Jotte, et al., 2017; Rowe, 2011;
Battiata, et al., 2010
Soakaways High (PF)- High (V) (30-80%). Highly dependent on the infiltration rates of the adjacent soil
or structures.
Transport Infrastructure Ireland, 2015;
Locatelli, et al., 2015
Alternatives
Water flow control
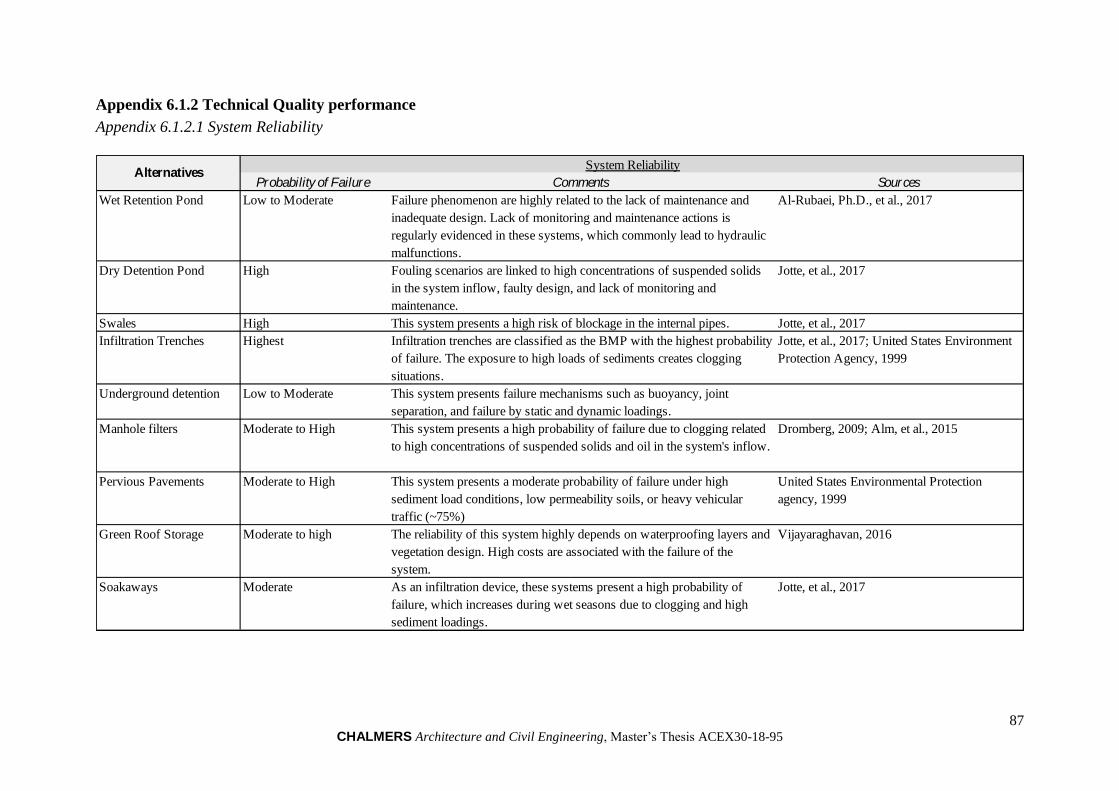
87 CHALMERS Architecture and Civil Engineering, Master’s Thesis ACEX30-18-95
Appendix 6.1.2 Technical Quality performance
Appendix 6.1.2.1 System Reliability
Probability of Failure Comments Sources
Wet Retention Pond Low to Moderate Failure phenomenon are highly related to the lack of maintenance and
inadequate design. Lack of monitoring and maintenance actions is
regularly evidenced in these systems, which commonly lead to hydraulic
malfunctions.
Al-Rubaei, Ph.D., et al., 2017
Dry Detention Pond High Fouling scenarios are linked to high concentrations of suspended solids
in the system inflow, faulty design, and lack of monitoring and
maintenance.
Jotte, et al., 2017
Swales High This system presents a high risk of blockage in the internal pipes. Jotte, et al., 2017
Infiltration Trenches Highest Infiltration trenches are classified as the BMP with the highest probability
of failure. The exposure to high loads of sediments creates clogging
situations.
Jotte, et al., 2017; United States Environment
Protection Agency, 1999
Underground detention Low to Moderate This system presents failure mechanisms such as buoyancy, joint
separation, and failure by static and dynamic loadings.
Manhole filters Moderate to High This system presents a high probability of failure due to clogging related
to high concentrations of suspended solids and oil in the system's inflow.
Dromberg, 2009; Alm, et al., 2015
Pervious Pavements Moderate to High This system presents a moderate probability of failure under high
sediment load conditions, low permeability soils, or heavy vehicular
traffic (~75%)
United States Environmental Protection
agency, 1999
Green Roof Storage Moderate to high The reliability of this system highly depends on waterproofing layers and
vegetation design. High costs are associated with the failure of the
system.
Vijayaraghavan, 2016
Soakaways Moderate As an infiltration device, these systems present a high probability of
failure, which increases during wet seasons due to clogging and high
sediment loadings.
Jotte, et al., 2017
System ReliabilityAlternatives

88 CHALMERS Architecture and Civil Engineering, Master’s Thesis ACEX30-18-95
Appendix 6.1.2.1 System Durability
Expected Lifetime Comments Sources
Wet Retention Pond Long Expected lifetime of 20-50 years Peluso & Marshall, 2002; Corson, 2006
Dry Detention Pond Long Expected lifetime of 20-50 years Corson, 2006
Swales Moderate to Long Expected lifetime of 15-20 years Peluso & Marshall, 2002
Infiltration Trenches Short to Moderate Expected lifetime of 5-15 years Corson, 2006
Underground detention Moderate to Long Expected lifetime of 25-75 years E2STORMED Project, 2015
Manhole filters Short to Moderate High rates of unit replacement.
Pervious Pavements Moderate to Long Expected lifetime of 20 - 40 years Peluso & Marshall, 2002; E2STORMED
Project, 2015
Green Roof Storage Long Expected lifetime of 40 years. U.S. Department of the Interior, n.d.;
E2STORMED Project, 2015
Soakaways Long Expected lifetime of 20-50 years E2STORMED Project, 2015
DurabilityAlternatives

89 CHALMERS Architecture and Civil Engineering, Master’s Thesis ACEX30-18-95
Appendix 6.2 Environmental performance
Appendix 6.2.1 Pollution control
Appendix 6.2.1.1 Total solids reduction
Expected reduction Comments Sources
Wet Retention Pond 78-90% TS removal performance is highly variable depending on the pond,
catchment, and rain event characteristics. Water detention time is a crucial
aspect of the design, as well as the first flush detention time.
Fassman, 2012;Drake, et al., 2016; National
Academies of Sciences, Engineering, and
Medicine, 2014; United States Environmental
Protection agency, 1999
Detention Pond 66-93%% TS removal performance is highly variable depending on the catchment
area and rain event characteristics. Highly dependent on site and particle
characteristics. Vegetated detention ponds present high pollutant retention
potentials.
Jotte, et al., 2017; Fassman, 2012;Drake, et al.,
2016; National Academies of Sciences,
Engineering, and Medicine, 2014; Corson,
2006
Swales 30-90% Highly dependent on site and particle characteristics National Academies of Sciences, Engineering,
and Medicine, 2014; Weiss, et al., 2010;
Corson, 2006
Infiltration Trenches 70-99% High removal potential of suspended solids along the linear structure. Jotte, et al., 2017; United States Environment
Protection Agency, 1999; Corson, 2006
Underground detention 80-90% TSS removal performance is highly variable depending on system's
design, catchment, and rain event characteristics. Underground detention
systems which include sedimentation processes achieve higher retention
of pollutants.
Jotte, et al., 2017; Drake, et al., 2016
Manhole filters 15-95% TSS removal performance is highly dependent on the filtering method,
structural design of the filter, and filter media.
International Stormwater BMP Satabase, 2014
Pervious Pavements 50-95% The retention of Suspended solids highly depends on the type of
pervious pavement.
Legret, et al., 1999; Pagotto, et al., 2000;
Novotny, et al., 2010; United States
Environmental Protection agency, 1999
Green Roof Storage 90% A direct correlation exists between the magnitude of the rain event, the
surrounding atmospheric concentrations of pollutants, and the number of
solids in the effluent.
Novotny, et al., 2010
Soakaways 30% E2STORMED Project, 2015; Woods-Ballard,
et al., 2015
AlternativesTotal Solids

90 CHALMERS Architecture and Civil Engineering, Master’s Thesis ACEX30-18-95
Appendix 6.2.1.2 Biochemical Oxygen Demand reduction
Expected reduction
(literature)Comments Sources
Wet Retention Pond 29-53% Highly dependent on the physical and chemical processes on the pond, as
well as in the climate characteristics of the area. The use of sequenced
anaerobic cells increases the retention.
Middlesex University, 2003;Scholes, et al.,
2008; United States Environmental Protection
agency, 1999
Detention Pond 30-90% Highly dependent on the volume of water detained. Higher retention of
oxygen-consuming substances is achieved when higher water levels are
reached during the detention.
Scholes, et al., 2008; Harper, Ph.D., P.E.,
1995
Swales 13-61% Highly dependent on design aspects such as the length of the swale,
vegetation (when included), and percolation material used.
Weiss, et al., 2010; Scholes, et al., 2008
Infiltration Trenches 70-80% Highly dependent on design aspects such as the depth of the infiltration
trench
United States Environment Protection Agency,
1999; Scholes, et al., 2008
Underground detention <10% Low pollutant retention potential due to purposes of the systems, which
tend to control water flows and/sediments, but where chemical processes
are not intended to occur.
Jotte, et al., 2017
Manhole filters Inconclusive information Highly dependent on the filtering media. Scholes, et al., 2008; Alm, et al., 2015
Pervious Pavements 90% High retention of pollutants resulting from anaerobic decomposition
within the pavement structure
Tota-Maharaj & Scholz, 2013
Green Roof Storage No exposure These contaminants in green roofs areas are usually related to the
decomposition of vegetation cover, but no exposure is associated with
them. Therefore, the concentrations are considered as insignificant.
Li & Babcock, 2014
Soakaways Low Scholes, et al., 2008
Biochemical Oxygen Demand
Alternatives

91 CHALMERS Architecture and Civil Engineering, Master’s Thesis ACEX30-18-95
Appendix 6.2.1.3 Nutrients reduction
Expected reduction
(literature)Comments Sources
Wet Retention Pond 10-50% TN
20-94% TP
The retention is highly dependent on the species and the mechanisms
present in the system (e.g., algae uptake, settling and sedimentation)
which reduce each species of nutrients.
Middlesex University, 2003; National
Academies of Sciences, Engineering, and
Medicine, 2014; Corson, 2006
Detention Pond 0-40% TN
10-94% TP
The retention is highly dependent on the species and the mechanisms
present in the system (e.g., adsorption, biodegradation, filtration achieved
by filtration structures) which reduce each species of nutrients.
Jotte, et al., 2017; Koch, et al., 2014; National
Academies of Sciences, Engineering, and
Medicine, 2014; The Center for Watershed
Protection, 2013; Corson, 2006
Swales 0-50% TN
20-85% TP
The retention potential is highly dependent on the species, as well as the
vegetation (and its health) present in the swale. The removal of grass
clipping after mowing removes nutrients and improves the performance
of the system.
Weiss, et al., 2010; Koch, et al., 2014;
Middlesex University, 2003; National
Academies of Sciences, Engineering, and
Medicine, 2014; Corson, 2006
Infiltration Trenches 40-80%TN
20-75% TP
Phosphorus and Nitrogen are accumulated in the infiltration trenches. The
removal rates highly depend on specific design characteristics.
American Society of Civil Engineers (ASCE),
2000; Middlesex University, 2003; Corson,
2006
Underground detention 0% TN
0-20% TP
Underground detention basins have low efficiency in the retention of
pollutants due to their impermeable characteristics.
Baish & Caliri, 2009
Manhole filters Inconclusive information Nutrients retention potential is highly dependent on the filter structure and
media characteristics.
Dromberg, 2009; Alm, et al., 2015
Pervious Pavements 25-85% TN
20-80% TP
Highly variable based on area and pervious pavement characteristics. Pagotto, et al., 2000; Novotny, et al., 2010;
United States Environmental Protection
agency, 1999; The Center for Watershed
Protection, 2013
Green Roof Storage (-)50% - 32% Green roofs, in some cases, can be a source of nutrients due to excess
use of fertilizers.
Rowe, 2011
Soakaways 30% The surrounding growth of grass is linked to the low removal rates of
nutrients in soakaways.
Woods-Ballard, et al., 2015
Nutrients
Alternatives

92 CHALMERS Architecture and Civil Engineering, Master’s Thesis ACEX30-18-95
Appendix 6.2.1.4 Heavy metals reduction
Expected reduction
(literature)Comments Sources
Wet Retention Pond 20-90% These systems are recognized to achieve a high retention of metals. Middlesex University, 2003; United States
Environmental Protection agency, 1999;
Corson, 2006
Detention Pond 0-60% Dry detention basins are considered to achieve moderate retention. The
retention potential is highly dependent on the species and the
characteristics of the system and rain events.
Birch, et al., 2007; Corson, 2006; United
States Environmental Protection Agency,
1999; Woods-Ballard, et al., 2015
Swales 70-90% The efficiency of swales in metal reduction is highly dependent on the
ionic species. Heavy metals with large particulate fractions are removed
more efficiently.
Middlesex University, 2003; Scholes, et al.,
2008; United States Environmental Protection
Agency, 1999; Yousef, et al., 1981
Infiltration Trenches 70-90% The removal efficiency highly depends on the state (soluble or
particulate), and the infiltration capacity of the surrounding soil.
American Society of Civil Engineers (ASCE),
2000; Middlesex University, 2003
Underground detention 40% Considered to achieve low retention of metals. Highly dependent on the
sedimentation processes that occur in the system.
E2STORMED Project, 2015; Woods-Ballard,
et al., 2015
Manhole filters Inconclusive information Highly dependent on the media and porosity of the filter. Old and used
filters have higher retention of pollutants than newly installed filters,
which in some cases emission pollutants have been reported.
Dromberg, 2009; Alm, et al., 2015
Pervious Pavements 20-60% Highly dependent on the catchment area and site characteristics. Previous
pavements in residential areas show a high metal retention potential.
Pagotto, et al., 2000; United States
Environmental Protection Agency, 1999
Green Roof Storage >70% Highly dependent on the state (particulate or soluble) and season of the
year. Cold season affects the retention of pollutants. Highly dependent on
the atmospheric concentrations.
Rowe, 2011; United States Environmental
Protection Agency, 1999
Soakaways 50% The removal efficiency highly depends on the state (soluble or
particulate), and the infiltration capacity of the surrounding soil.
E2STORMED Project, 2015
Heavy Metals
Alternatives

93 CHALMERS Architecture and Civil Engineering, Master’s Thesis ACEX30-18-95
Appendix 6.2.1.5 Heavy metals reduction
Expected reduction
(literature)Comments Sources
Wet Retention Pond 60-90% These systems are recognized to achieve a high retention of organic
pollutants.
Middlesex University, 2003; Lavieille, 2005
Detention Pond Inconclusive information Highly dependent on the basin configuration and the time and volumen
water retntion.
Swales 0.36 Limited information Middlesex University, 2003
Infiltration Trenches 50-90% Limited information. Highly linked to the removal of suspended solids. Middlesex University, 2003
Underground detention 40% Limited information. Highly linked to the removal of suspended solids.
Manhole filters Not reported/Inconclusive
information
Old and used filters have a higher retention of pollutants than newly
installed filters, which in some cases emit pollutants.
Alm, et al., 2015; Dromberg, 2009
Pervious Pavements 50-90% Limited information. Highly linked to the removal of suspended solids. Pagotto, et al., 2000
Green Roof Storage No expected reduction Low expected exposure to these types of contaminants.
Soakaways 50% Present little to no retention of high soluble compounds. Limited
information. Highly linked to the removal of suspended solids.
Middlesex University, 2003; Woods-Ballard,
et al., 2015
Organic Pollutants
Alternatives
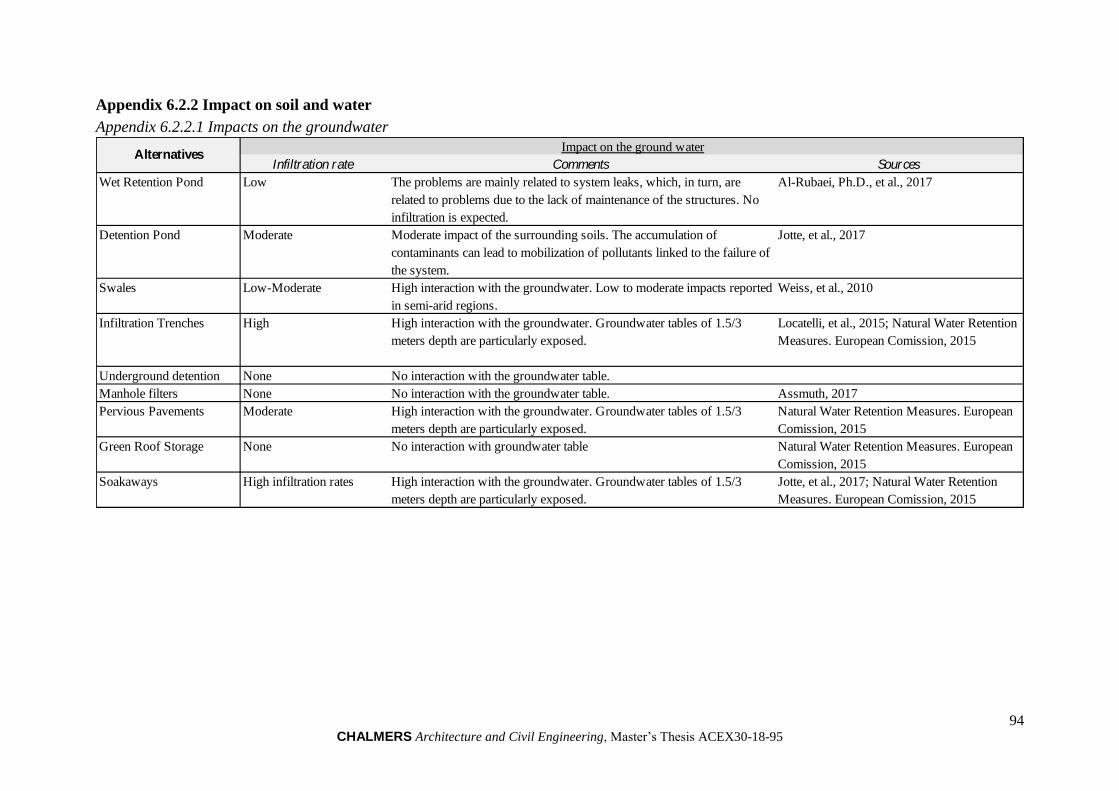
94 CHALMERS Architecture and Civil Engineering, Master’s Thesis ACEX30-18-95
Appendix 6.2.2 Impact on soil and water
Appendix 6.2.2.1 Impacts on the groundwater
Infiltration rate Comments Sources
Wet Retention Pond Low The problems are mainly related to system leaks, which, in turn, are
related to problems due to the lack of maintenance of the structures. No
infiltration is expected.
Al-Rubaei, Ph.D., et al., 2017
Detention Pond Moderate Moderate impact of the surrounding soils. The accumulation of
contaminants can lead to mobilization of pollutants linked to the failure of
the system.
Jotte, et al., 2017
Swales Low-Moderate High interaction with the groundwater. Low to moderate impacts reported
in semi-arid regions.
Weiss, et al., 2010
Infiltration Trenches High High interaction with the groundwater. Groundwater tables of 1.5/3
meters depth are particularly exposed.
Locatelli, et al., 2015; Natural Water Retention
Measures. European Comission, 2015
Underground detention None No interaction with the groundwater table.
Manhole filters None No interaction with the groundwater table. Assmuth, 2017
Pervious Pavements Moderate High interaction with the groundwater. Groundwater tables of 1.5/3
meters depth are particularly exposed.
Natural Water Retention Measures. European
Comission, 2015
Green Roof Storage None No interaction with groundwater table Natural Water Retention Measures. European
Comission, 2015
Soakaways High infiltration rates High interaction with the groundwater. Groundwater tables of 1.5/3
meters depth are particularly exposed.
Jotte, et al., 2017; Natural Water Retention
Measures. European Comission, 2015
AlternativesImpact on the ground water

95 CHALMERS Architecture and Civil Engineering, Master’s Thesis ACEX30-18-95
Appendix 6.2.2.2 Impacts on the exposed soil
Erosion / Sediment control Comments Sources
Wet Retention Pond Moderate These systems intend to collect contaminants in the site of
implementation, leading to a build-up of pollutants which need to be
handled by remediation techniques. Erosion problems can be detected.
Natural Water Retention Measures. European
Comission, 2015; Al-Rubaei, Ph.D., et al.,
2017
Detention Pond Moderate Moderate impact of the surrounding soils. These systems intend to collect
contaminants in the site of implementation, leading to a build-up of
pollutants which need to be handled by remediation techniques.
Natural Water Retention Measures. European
Comission, 2015
Swales Low These systems intend to collect contaminants in the site of
implementation, leading to a build-up of pollutants which need to be
handled by remediation techniques. These systems are considered to have
the lower impact than basins due to the system's dimensions.
Natural Water Retention Measures. European
Comission, 2015
Infiltration Trenches Low Contaminants are intended to be collected in the percolating areas of the
system.
Natural Water Retention Measures. European
Comission, 2015
Underground detention None - Natural Water Retention Measures. European
Comission, 2015
Manhole filters None - Natural Water Retention Measures. European
Comission, 2015
Pervious Pavements Low Contaminants are intended to be collected in the percolating areas of the
system.
Natural Water Retention Measures. European
Comission, 2015
Green Roof Storage Low Low impact of the substrate used. Remediation techniques need to be
considered.
Natural Water Retention Measures. European
Comission, 2015
Soakaways Moderate Significant accumulation of pollutants in the sediments which can
mobilize through weakening of bonds.
Hossain, et al., 2007; Natural Water Retention
Measures. European Comission, 2015
Impact on soil
Alternatives

96 CHALMERS Architecture and Civil Engineering, Master’s Thesis ACEX30-18-95
Appendix 6.2.2 Ecological enhancement potential
Appendix 6.2.2.1 Biodiversity enhancement potential
Potential improvement on
biodiversityComments Sources
Wet Retention Pond Moderate- High Can strongly favor biodiversity and habitat value. Highly dependent on
the water quality
Middlesex University, 2003; Corson, 2006
Detention Pond Low-Moderate Can favor biodiversity and habitat value. Natural Water Retention Measures. European
Comission, 2015; Corson, 2006
Swales Low-Moderate Enhancement potential is strongly related to the artificial vegetation
planting techniques.
Middlesex University, 2003; Corson, 2006
Infiltration Trenches None - Middlesex University, 2003; Corson, 2006
Underground detention None -
Manhole filters None -
Pervious Pavements None -
Green Roof Storage Moderate habitat Value Highly related to the artificial planting and public exposure. Werthman, 2007
Soakaways Low Poor to none ecologic potential Transport Infrastructure Ireland, 2015
Potential Enhancement in biological diversity
Alternatives

97 CHALMERS Architecture and Civil Engineering, Master’s Thesis ACEX30-18-95
Appendix 6.3 Social performance
Appendix 6.3.1 Public interaction
Appendix 6.3.1.1 Perceived risks and information requirements
Risks (R) - Awareness
requirements (AR)Comments Source
Wet Retention Pond High (R) - High (AR) May require approval from safety authorities. American Society of Civil Engineers, 2014
Detention Pond High (R) - High (AR) May require approval from safety authorities. American Society of Civil Engineers, 2014
Swales Low (R)- Low (AR) This system works with shallow water depths. Swale design should
minimize standing water to prevent vectors and pests. Residents with
swales need to be trained on maintenance requirements.
American Society of Civil Engineers, 2014;
Peluso & Marshall, 2002
Infiltration Trenches Low (R)- Low (AR) Ideal for use close to playing fields, recreational areas and public spaces. Natural Water Retention Measures. European
Comission, 2015
Underground detention No public interaction Underground structure with no public interaction. -
Manhole filters No public interaction Underground structure with no public interaction. -
Pervious Pavements Moderate (R)- Moderate
(AR)
Highly dependent on the area of installation. Residents with pervious
pavements need to be trained on maintenance requirements.
The Center for Watershed Protection, 2013
Green Roof Storage Moderate (R)- Moderate
(AR)
It is not usually design for public access. However, fire risks and vector
proliferation can occur.
Jotte, et al., 2017; American Society of Civil
Engineers, 2014
Soakaways No public interaction Underground structure with no public interaction. -
Alternatives
Perceived risks and information requirements

98 CHALMERS Architecture and Civil Engineering, Master’s Thesis ACEX30-18-95
Appendix 6.3.1.2 Potential for recreational activities
Potential Comments Source
Wet Retention Pond Moderate - High Wet basins are often considered a community amenity where different
recreational activities can be established.
Jotte, et al., 2017; American Society of Civil
Engineers, 2014
Detention Pond High Dry detention basins sometimes consist of urban areas destined as public
spaces which are part of the flood management system. Playgrounds or
other recreational activities are intended to occur in the area.
American Society of Civil Engineers, 2014
Swales None - Low Can take part of the urban space, but they do not contain a potential for
recreational activities.
Natural Water Retention Measures. European
Comission, 2015
Infiltration Trenches None Can take part of the urban space, but they do not contain a potential for
recreational activities.
Natural Water Retention Measures. European
Comission, 2015
Underground detention None No public access
Manhole filters None No public access
Pervious Pavements None - Low The potential use of the space for a wide range of activities is considered
as an enhancement aspect of the amenity level of pervious pavements.
Natural Water Retention Measures. European
Comission, 2015; Woods-Ballard, et al., 2015
Green Roof Storage None- Low Highly dependent on the design of the spaces. Not typically design for
public access.
Jotte, et al., 2017; American Society of Civil
Engineers, 2014;Natural Water Retention
Measures. European Comission, 2015
Soakaways Low No direct interaction with the superficial area. Nevertheless, these
systems consist of an underground structure which allows the occurrence
of different activities
Potential for recreational activitiesAlternatives

99 CHALMERS Architecture and Civil Engineering, Master’s Thesis ACEX30-18-95
Appendix 6.3.2 Location Amenity
Appendix 6.3.2.1 Visual environment aesthetic value
Aesthetic Value Comments Source
Wet Retention Pond High Wet basins are often considered a community amenity. It is essential to
hide the presence of drainage structures and maintain low pollution
levels.
Jotte, et al., 2017; American Society of Civil
Engineers, 2014; United States Environmental
Protection Agency, 2009
Detention Pond Moderate- High Dry detention basins sometimes consist of urban areas destined as public
spaces which are part of the flood management system.
Natural Water Retention Measures. European
Comission, 2015
Swales Moderate- High Selective planting on the swales could enhance aesthetic value, especially
in areas characterized by roads.
Middlesex University, 2003
Infiltration Trenches Low Low aesthetics and cultural value. Selective planting on the surrounding
area could enhance aesthetic value
Natural Water Retention Measures. European
Comission, 2015
Underground detention None No aesthetic value.
Manhole filters None No aesthetic value.
Pervious Pavements Low - Moderate Highly dependent on the visual aspects of the surface materials and the
surrounding environment.
Woods-Ballard, et al., 2015; Natural Water
Retention Measures. European Comission,
2015; The Center for Watershed Protection,
2013
Green Roof Storage Moderate- High Considered to be aesthetically pleasing. Jotte, et al., 2017; Werthman, 2007
Soakaways None No aesthetic value. Natural Water Retention Measures. European
Comission, 2015
AlternativesVisual environment
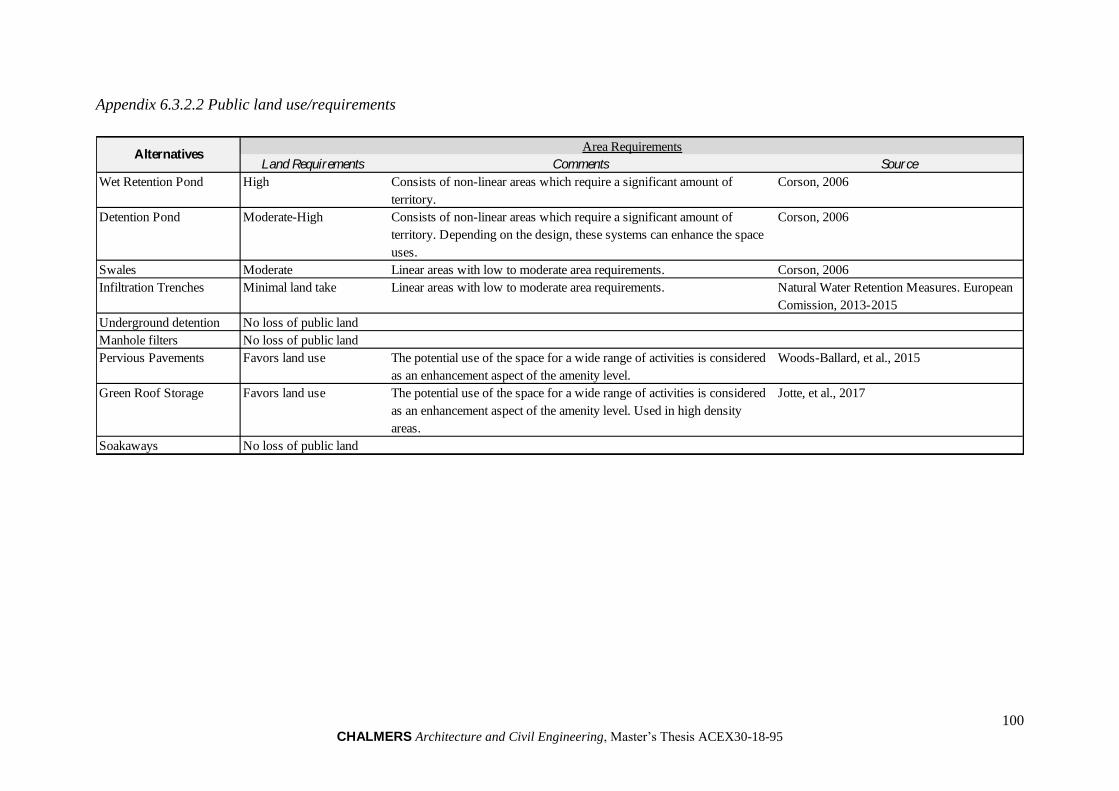
100 CHALMERS Architecture and Civil Engineering, Master’s Thesis ACEX30-18-95
Appendix 6.3.2.2 Public land use/requirements
Land Requirements Comments Source
Wet Retention Pond High Consists of non-linear areas which require a significant amount of
territory.
Corson, 2006
Detention Pond Moderate-High Consists of non-linear areas which require a significant amount of
territory. Depending on the design, these systems can enhance the space
uses.
Corson, 2006
Swales Moderate Linear areas with low to moderate area requirements. Corson, 2006
Infiltration Trenches Minimal land take Linear areas with low to moderate area requirements. Natural Water Retention Measures. European
Comission, 2013-2015
Underground detention No loss of public land
Manhole filters No loss of public land
Pervious Pavements Favors land use The potential use of the space for a wide range of activities is considered
as an enhancement aspect of the amenity level.
Woods-Ballard, et al., 2015
Green Roof Storage Favors land use The potential use of the space for a wide range of activities is considered
as an enhancement aspect of the amenity level. Used in high density
areas.
Jotte, et al., 2017
Soakaways No loss of public land
Area RequirementsAlternatives

101 CHALMERS Architecture and Civil Engineering, Master’s Thesis ACEX30-18-95
Appendix 6.4 Economic performance
Appendix 6.4.1 Capital costs
Appendix 6.4.1.1 Approximate simplified unit costs
Relative Costs Comments (Approximate simplified unit costs) Source
Wet Retention Pond Low 9-100 €/m3. 6-7% of investment is required on civil-engineering works Middlesex University, 2003; Environmental
Protection Agency - Region I, 2016;
E2STORMED Project, 2015
Detention Pond Low 9-91 €/m3. High variability and dependency on the area where it is
established (different costs between rural vs. urban areas)
Middlesex University, 2003; Peluso &
Marshall, 2002; E2STORMED Project, 2015
Swales Low 15 - 30 €/m (linear)
7.6 - 15 €/m3
Middlesex University, 2003; E2STORMED
Project, 2015
Infiltration Trenches Moderate- high 200 €/m3 Environmental Protection Agency - Region I,
2016; E2STORMED Project, 2015
Underground detention High 150- 1500 €/m3 Middlesex University, 2003; Environmental
Protection Agency - Region I, 2016
Manhole filters Low Dependent on media filter. Usually low-cost units. E2STORMED Project, 2015
Pervious Pavements Moderate- high 150-500 €/m3 Middlesex University, 2003; Environmental
Protection Agency - Region I, 2016
Green Roof Storage Moderate- high 100-300 €/m2 Jotte, et al., 2017; Dakin, et al., 2013;
Novotny, et al., 2010; E2STORMED Project,
2015
Soakaways Moderate 3 €/m2 treated area;
150 €/m3 stored volume
Jotte, et al., 2017; Middlesex University, 2003
Material and construction costsAlternatives

102 CHALMERS Architecture and Civil Engineering, Master’s Thesis ACEX30-18-95
Appendix 6.4.2 Operation and Maintenance
Appendix 6.4.2.1 Monitoring and maintenance needs
Relative frequency Comments Source
Wet Retention Pond Low (>1 time/ year) Monitoring on the accumulation of sediments is required.
Requires special supervision after relatively large rainfall events. Control
structures need to be inspected semiannually and repaired as needed.
Removal of sediments must be done every 5 years.
Kang, et al., 2008; Al-Rubaei, Ph.D., et al.,
2017
Detention Pond Low (>1 time /year) These systems require monitoring on the accumulation of
sediments. Additionally, they require special supervision after relatively
large rainfall events. Control structures need to be maintained
semiannually, as well as embankments and side slopes.
Kang, et al., 2008; Peluso & Marshall, 2002
Swales Low (1 time / 10 years). Very low maintenance needs. Sediments build up
monitoring is recommended to prevent damming effect. The avoidance of
vehicle and pedestrian traffic prevents compaction which in turn heads to
a lower maintenance needs. Sediments removal is recommended to be
done at least every 5 years.
Middlesex University, 2003; Peluso &
Marshall, 2002
Infiltration Trenches High (>2 times/year) Very susceptible to clogging. Trenches need to be
inspected regularly and the debris removed.
Middlesex University, 2003; Peluso &
Marshall, 2002
Underground detention Moderate (1-2 times/year). These systems require individual and specialized
monitoring due to their underground characteristics. The identification of
failure mechanisms is not easily observed.
Kang, et al., 2008
Manhole filters Moderate - High (>1 time /year) Highly dependent on the type of filter and catchment area
characteristics. High risks of clogging, especially in areas under
urbanization processes. High rates of replacement of filter media needs,
as well as protective caps (that work as a pre-treatment), have been
reported.
Dromberg, 2009
Pervious Pavements High (1-12 times/ year) Failures are commonly associated with faults in
construction. Clogging caused by the regular deposition and
accumulation of fine sediments has been reported. Requires special
monitoring and supervision in winter and cold season.
Al-Rubaei, et al., 2013; Novotny, et al., 2010;
Kang, et al., 2008
Green Roof Storage High (>2 times /year) Lack of supervision can lead to fire hazards. Constant
maintenance of irrigation systems and plant mowing is required.
Jotte, et al., 2017; Dakin, et al., 2013; Kang, et
al., 2008
Soakaways Low monitoring needs Nevertheless, an initial period of frequent monitoring is recommended to
determine the rate of sediment accumulation.
Jotte, et al., 2017; Transport Infrastructure
Ireland, 2015
AlternativesMonitoring and maintenance needs

103 CHALMERS Architecture and Civil Engineering, Master’s Thesis ACEX30-18-95
Appendix 6.4.2.2 Operation and maintenance associated costs
Relative costs Comments (Approximate simplified unit costs) Source
Wet Retention Pond Low 0.15-5 €/m3/year.
3-5% of initial construction costs
Middlesex University, 2003; E2STORMED
Project, 2015
Detention Pond Low 1-10% of the total construction costs.
(0.3 - 1.52 €/m3/year)
Kang, et al., 2008; Middlesex University,
2003; Barr Engineering Company, 2011;
Peluso & Marshall, 2002
Swales Moderate 0.03-0.16 €/m2/year
5-7% of initial construction costs
Middlesex University, 2003; Erickson, et. al,
2010; Peluso & Marshall, 2002;
E2STORMED Project, 2015
Infiltration Trenches Moderate - High 5-20% of the total construction costs Middlesex University, 2003; Kang, et al.,
2008
Underground detention High 1.5 €/m3 stored volume/year E2STORMED Project, 2015
Manhole filters Inconclusive information Highly dependent on the type of filter and catchment area characteristics
Pervious Pavements Moderate 0.3 - 1.52 €/m3/year; 0.08-3 €/m2/year Middlesex University, 2003; Erickson, et. al,
2010; E2STORMED Project, 2015
Green Roof Storage Moderate - High Irrigation and drainage systems required. 0.2-45 €/m2/year Jotte, et al., 2017; Dakin, et al., 2013;
E2STORMED Project, 2015
Soakaways Low 0.15 €/m2 treated area
0.1-24.2 €/m3/year
Jotte, et al., 2017; Middlesex University,
2003)
Operation and maintenance associated costsAlternatives

104 CHALMERS Architecture and Civil Engineering, Master’s Thesis ACEX30-18-95
Appendix 7 Scoring of alternatives
Appendix 7.1 Technical-Environment (Chalmers University of Technology)
Appendix 7.2 Technical-Environment-Economic (Kretslopp och Vatten –
Göteborg Stad)
Appendix 7.3 Social (Kultur och fritid-Göteborg Stad)
Alternatives
C1.
Flow Control
C2.
Reliability
C3
Durability
C4.
Pollution
Control
C5.
Impact on Soil
and Water
C6.
Ecological
enhancement
potential
C7.
Public
interaction
C8.
Location
Amenity
C9.
Capital Costs
C10.
O&M
Wet Retention Pond 4.5 5.0 5.0 3.7 3.3 2.5 2.5 2.5 - -
Dry Detention Pond 4.5 3.0 5.0 2.5 2.5 2.0 2.3 2.8 - -
Swales 3.5 5.0 4.0 3.3 2.5 2.5 3.3 2.8 - -
Infiltration Trenches 3.5 2.0 2.0 3.6 1.8 2.0 3.0 2.8 - -
Underground detention 3.5 3.0 3.0 1.7 4.5 2.0 2.8 2.3 - -
Manhole filters 0.5 1.0 0.0 3.3 4.8 2.0 2.8 2.5 - -
Pervious Pavements 3.5 1.0 2.0 3.0 2.0 1.0 2.8 2.5 - -
Green Roof Storage 4.0 2.0 3.0 2.8 3.8 3.5 3.5 4.5 - -
Soakaways 3.5 3.0 2.0 1.9 2.0 1.5 2.8 2.8 - -
Criteria
Technical Category Environmental Category Social Category Economic Category
Alternatives
C1.
Flow Control
C2.
Reliability
C3
Durability
C4.
Pollution
Control
C5.
Impact on Soil
and Water
C6.
Ecological
enhancement
potential
C7.
Public
interaction
C8.
Location
Amenity
C9.
Capital Costs
C10.
O&M
Wet Retention Pond 2.0 4.0 5.0 4.6 4.8 5.0 3.0 2.6 5.0 4.0
Dry Detention Pond 4.0 2.0 5.0 4.1 4.0 3.5 3.0 3.4 5.0 4.0
Swales 3.0 2.0 3.0 3.4 3.0 4.0 3.3 2.9 5.0 4.0
Infiltration Trenches 5.0 1.0 2.5 3.6 1.8 1.0 2.3 1.5 3.5 2.0
Underground detention 2.0 4.5 3.5 1.8 5.0 0.0 2.5 2.0 3.5 3.0
Manhole filters 0.0 2.0 1.0 2.7 5.0 0.0 2.5 2.0 4.0 1.5
Pervious Pavements 5.0 2.0 2.5 3.0 2.5 0.0 2.8 3.0 3.0 2.3
Green Roof Storage 1.0 3.0 2.5 1.9 5.0 4.0 3.5 4.9 4.0 2.8
Soakaways 5.0 2.0 3.0 2.1 1.0 0.5 2.5 2.0 2.5 3.5
Economic CategoryTechnical Category Environmental Category Social Category
Criteria
Alternatives
C1.
Flow Control
C2.
Reliability
C3
Durability
C4.
Pollution
Control
C5.
Impact on Soil
and Water
C6.
Ecological
enhancement
potential
C7.
Public
interaction
C8.
Location
Amenity
C9.
Capital Costs
C10.
O&M
Wet Retention Pond - - - - - - 2.0 3.0 - -
Dry Detention Pond - - - - - - 4.5 4.5 - -
Swales - - - - - - 2.5 2.5 - -
Infiltration Trenches - - - - - - 3.5 4.5 - -
Underground detention - - - - - - 2.5 2.5 - -
Manhole filters - - - - - - 4.5 2.5 - -
Pervious Pavements - - - - - - 3.5 3.5 - -
Green Roof Storage - - - - - - 4.0 3.5 - -
Soakaways - - - - - - 5.0 3.0 - -
Technical Category Environmental Category Social Category Economic Category
Criteria

105 CHALMERS Architecture and Civil Engineering, Master’s Thesis ACEX30-18-95
Appendix 8 Web-hipre
Figure 40 Web-Hipre Model
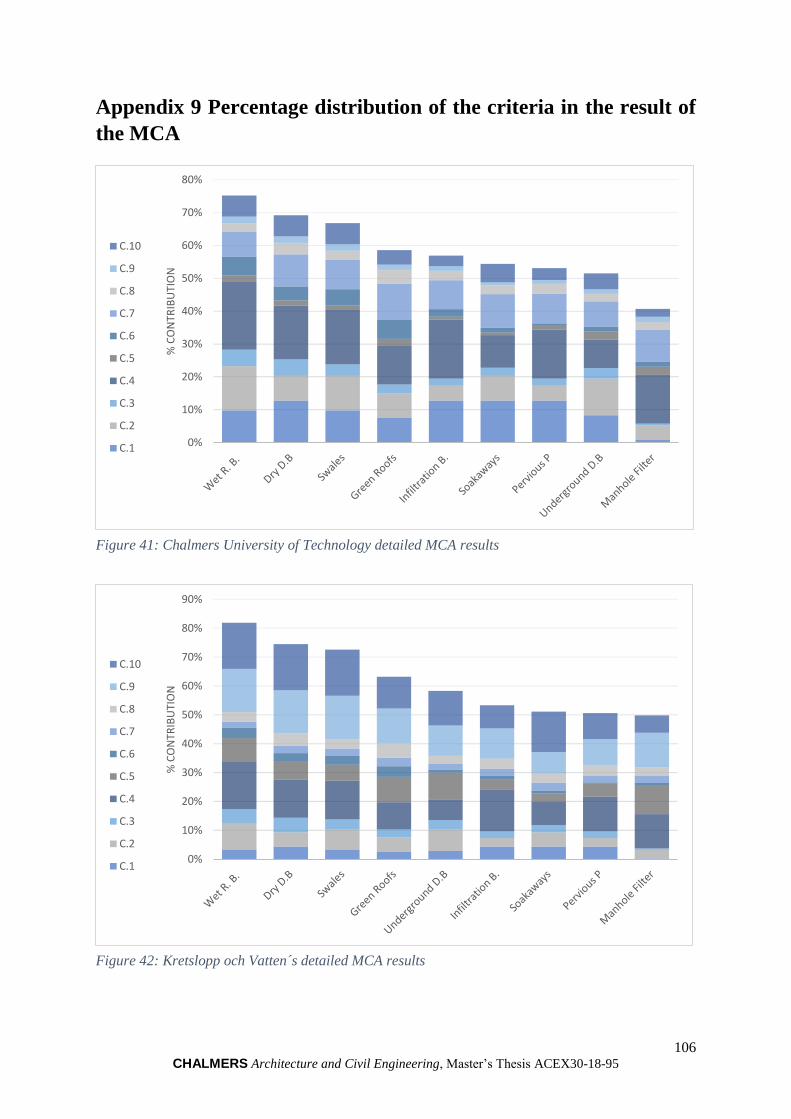
106 CHALMERS Architecture and Civil Engineering, Master’s Thesis ACEX30-18-95
Appendix 9 Percentage distribution of the criteria in the result of
the MCA
0%
10%
20%
30%
40%
50%
60%
70%
80%%
CO
NTR
IBU
TIO
N
C.10
C.9
C.8
C.7
C.6
C.5
C.4
C.3
C.2
C.1
Figure 41: Chalmers University of Technology detailed MCA results
0%
10%
20%
30%
40%
50%
60%
70%
80%
90%
% C
ON
TRIB
UTI
ON
C.10
C.9
C.8
C.7
C.6
C.5
C.4
C.3
C.2
C.1
Figure 42: Kretslopp och Vatten´s detailed MCA results
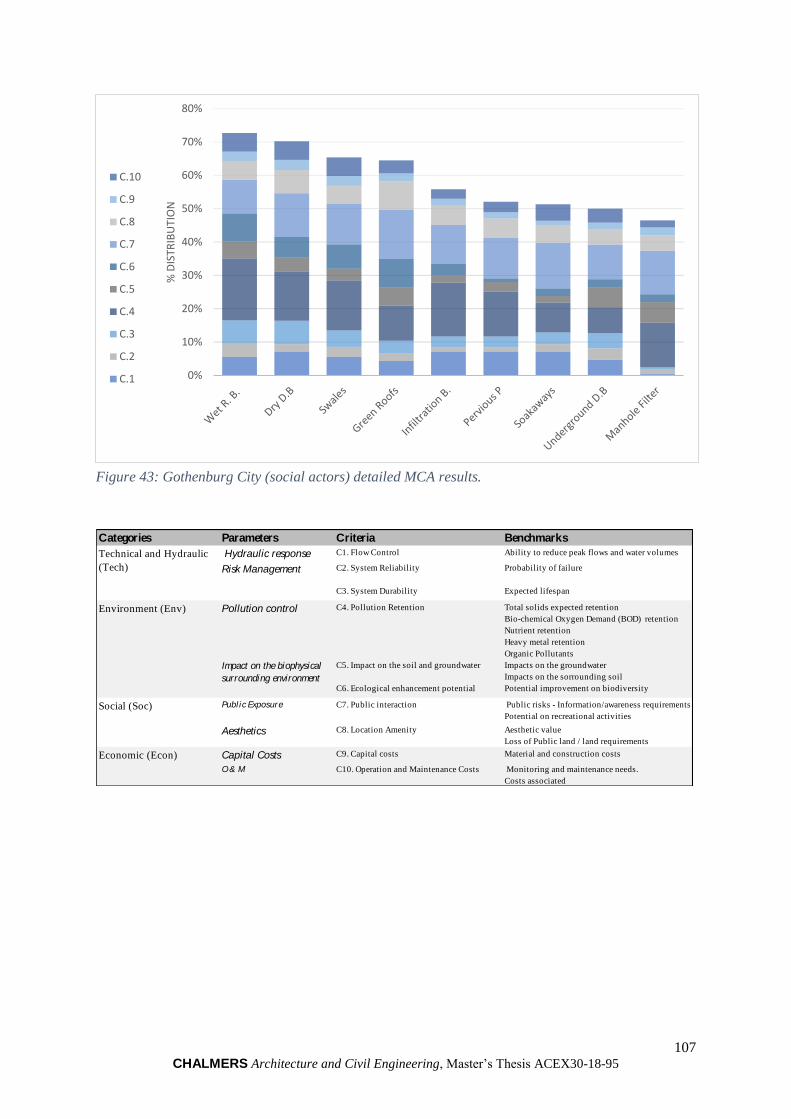
107 CHALMERS Architecture and Civil Engineering, Master’s Thesis ACEX30-18-95
0%
10%
20%
30%
40%
50%
60%
70%
80%
% D
ISTR
IBU
TIO
NC.10
C.9
C.8
C.7
C.6
C.5
C.4
C.3
C.2
C.1
Figure 43: Gothenburg City (social actors) detailed MCA results.
Categories Parameters Criteria Benchmarks
Hydraulic response C1. Flow Control Ability to reduce peak flows and water volumes
C2. System Reliability Probability of failure
C3. System Durability Expected lifespan
Pollution control C4. Pollution Retention Total solids expected retention
Bio-chemical Oxygen Demand (BOD) retention
Nutrient retention
Heavy metal retention
Organic Pollutants
C5. Impact on the soil and groundwater Impacts on the groundwater
Impacts on the sorrounding soil
C6. Ecological enhancement potential Potential improvement on biodiversity
Publ ic Exposure C7. Public interaction Public risks - Information/awareness requirements
Potential on recreational activities
Aesthetics C8. Location Amenity Aesthetic value
Loss of Public land / land requirements
Capital Costs C9. Capital costs Material and construction costs
O & M C10. Operation and Maintenance Costs Monitoring and maintenance needs.
Costs associated
Economic (Econ)
Technical and Hydraulic
(Tech) Risk Management
Environment (Env)
Social (Soc)
Impact on the biophysical
surrounding environment