Embed Size (px)
Citation preview

5-Dec-17 1
PERFORMANCE EVALUTION OF INTERMEDIATE PUBLIC TRANSPORT BY BENCHMARKING
APPROACH :A CASE STUDY
byMr. P. Dinesh KumarM.Tech(Transportation)GMR Institute of Technology.Present:Transportation Engineer IBI Consultancy India Pvt LtdBanglore, India.
Under the Esteemed Guidance ofMr. K. Naga RajeshAssistant Professor
Department of Civil EngineeringGMR Institute of Technology

2
CONTENTS Abstract Introduction Aim & Objectives Literature Review Study methodology Key Performance Indicators (KPI) Data collection for benchmarking Calculations Results Calculated Level of Service(CLOS) Performance Report Card Conclusions Future Scope & Recommendations References

ABSTRACTDue to an emerging trend in urbanization and modern living patterns, the necessity oftransportation and mobility has a drastic impact in the growing countries like India. Theexisting public transport is not able to cater the needs of the demand and mobility patternsfor better connectivity. These scenarios have lead to the development of a newtransportation system i.e Intermediate Public Transport (IPT).The IPT these days turnedinto a vital mode of transportation throughout urban India and acts as a feeder to publictransportation system and it is essential mode in rural and urban fringes. An effectivemanagement by monitoring the performance of IPT helps in sustainable urban transport. Tocarry out the study, Srikakulam district (Urban), has been selected. The execution of IPT inStudy area has been assessed by considering parameters like Performance Areas and KeyPerformance Indicators (KPI). For this performance evaluation of Study area the concept ofBenchmarking Approach is adopted. These approaches incorporates the perception of thecity, system and passenger. This study represents LOS (Level of Service) values for variousKPI which are calculated using various methodologies adopted by MoUD (Ministry ofUrban Development) and other agencies. A comparative study of obtained values with thestandard LOS values is done to obtain the OLOS (Overall Level of Service) of the casestudy area.Key Words: Intermediate Public transport, Key Performance Indicators, Benchmarkingapproach.

4
INTRODUCTION As a lag between growing public transport demand and service capacity results in an
increase of travel cost, congestion, and unreliable service, thereby creating economic lossand environmental degradation.
Public transport is considered to be one of the performance indicators to monitor theurban transport performance . Public transport system of a city constitutes of conventionalform like city buses, LRT(Light Rail Transit) and non-conventional form like sharedautos.
Though Conventional public transport is operating in high capacity but it has fixed routes,stops, schedule and mostly travel in mixed traffic conditions which causes long waitingtime and more travel time and thus causing irregularity in service.
In contrast IPT provides greater access by flexibility, connectivity, availability on demandand comfort and operate easily through the narrow streets where buses can’t operate.
Therefore, the performance of public transport system of a city cannot be judged only byconventional form of public transport, non-conventional form should also be taken intoconsideration if it exists.
In the present study, passenger, city, system perception has been considered to evaluatethe performance of IPT system. In this case study share-autos and maxi cabs areconsidered and their performance is evaluated using the benchmarking approach.
5-Dec-17 5
(Contd..)
The SLB(Service Level Benchmarking) can be defined as “Theprocess of determining how effectively and efficiently thepresent Transportation system is performing in the existingsituation” or simply “The quantification of qualitative aspects inurban transportation.”
Benchmarking, basically helps us to understand how ourtransportation system is performing as a whole and in whichsectors it was lagging along with its severity, so that we canhave a clear plan for the future development.
Bench Marking:

6
AIM & OBJECTIVESAim of the study: The aim of the present study is to evaluate the performance of the IPT
system by Benchmarking process, considering Key PerformanceIndicators(KPI).
Objectives of the study:
To identify different IPT modes operating in Srikakulam. To develop KPI’s based on the performance areas of availability, mobility,
safety, affordability, Intelligent Transportation System(ITS) facility, comfort and convenience.
To assess the vehicular occupancy of IPT modes operating in Srikakulam, assess the passenger attitude and trip maker characteristics.
To compare IPT mode to two-wheeler mode in terms of mobility and safety. To identify areas of excellence and gaps and to derive performance report
card to set targets.

5-Dec-17 7
LITERATURE REVIEW CEPT University (2013); IUT University (2013) has
Conducted the studies on various Indian cities and helps instandardizing the procedure for Benchmarking to arrive at keyperformance indicators.
Service level benchmark’s MoUD (2009) wants to addressinstitutional and operational aspects for ensuring long termsustainability of the benchmarking activity.
TCQSM, 2nd edition (2003); TCRP Report 88 providescurrent research-based guidance on evaluating quality ofservice, reflecting how passengers perceive the quality of thetransit service offered and provided.
The Present Study helps in filling the gaps in the areas ofConvenience and Safety in terms of Vehicle occupancy, Waitingtime and Accident Rate which helps in improving the LOS ofstudy area and its Performance.

8
STUDY METHODOLOGY
Study Area Identification for Performance evaluation of IPT
Bench Marking Approach
Key Performance Indicators
Data Collection Using Primary Surveys and Secondary Sources
Evaluating the Performance of IPT
Identifying the areas that need Improvement
Performance Report Card for Improving LOS

9
KEY PERFORMANCE INDICATORS (KPI)Performance
MeasurePerformance indicators/ service
attributesStandard’s adopted from
Availability Extent of supply of IPT Draft report of urban transport for six Indian cities, CEPT University
Service coverage SLB handbook, MoUDComfort* Driver behavior, Co passenger
behavior, Cleanliness of the vehicle, Sitting beside thedriver
Present Study(* Performance measure based on service attributes)
Convenience Waiting time AuthorVehicle occupancy AuthorTravel Time Ratio (TTR) TCQSM part 3, quality of service
Mobility Travel speed Draft report of urban transport for six Indian cities, CEPT
Safety Accident rate for IPT AuthorAffordability Affordability Draft report of urban transport for
six Indian cities, CEPTITS Facility GPS for IPT Draft report of urban transport for
six Indian cities, CEPT
10
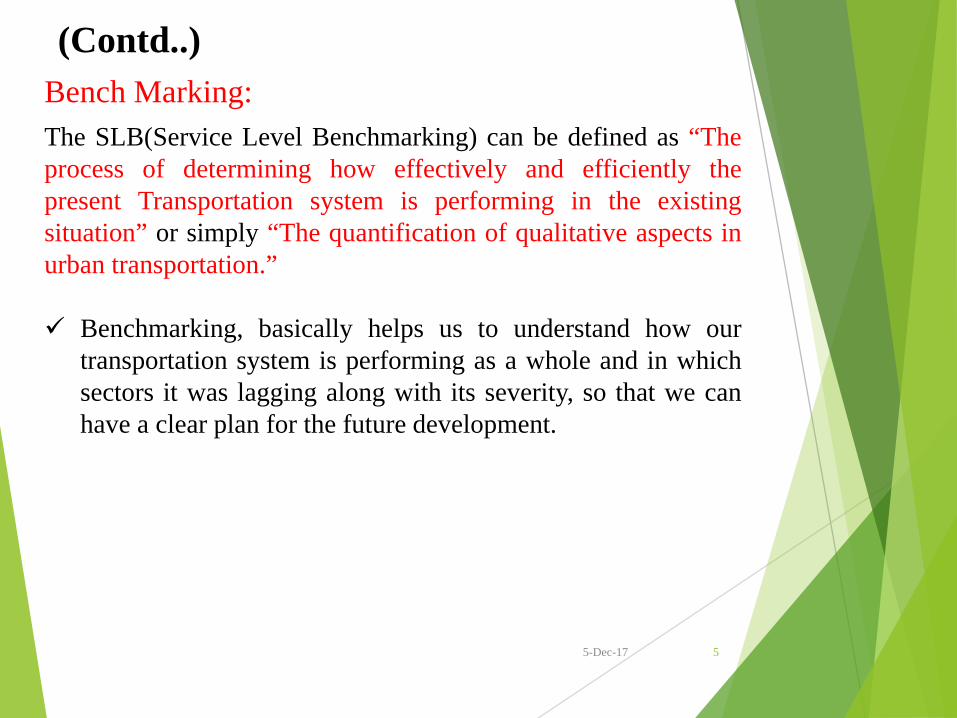
DATA COLLECTION FOR BENCHMARKING
Data Type Source
Vehicle strength and growth Secondary Andhra Pradesh TransportDepartment, Regional TransportAuthority (RTA), Srikakulam
Accident data Secondary Secondary Traffic police
Waiting time, affordability, trip maker characteristics and service rating
Primary Trip maker survey
Acceptable waiting time,relative weightage of indicators
Primary Passenger attitude survey
Travel speed, travel time ratio
Primary Speed and delay study byconducting trail runs
Load factor Primary Vehicular occupancy survey of IPT

11
DATA COLLECTION FOR BENCHMARKING:The Various Surveys Conducted to collect DATA for Bench marking are :• Trip maker survey• Passenger attitude survey• IPT occupancy survey• Speed and delay study
The Various Survey Formats are as follows: UMI Conference\2.Required\Survey Formats.docx
The Image of Study Area:UMI Conference\2.Required\Study Area Image .jpg
(Contd..)
5-Dec-17 12
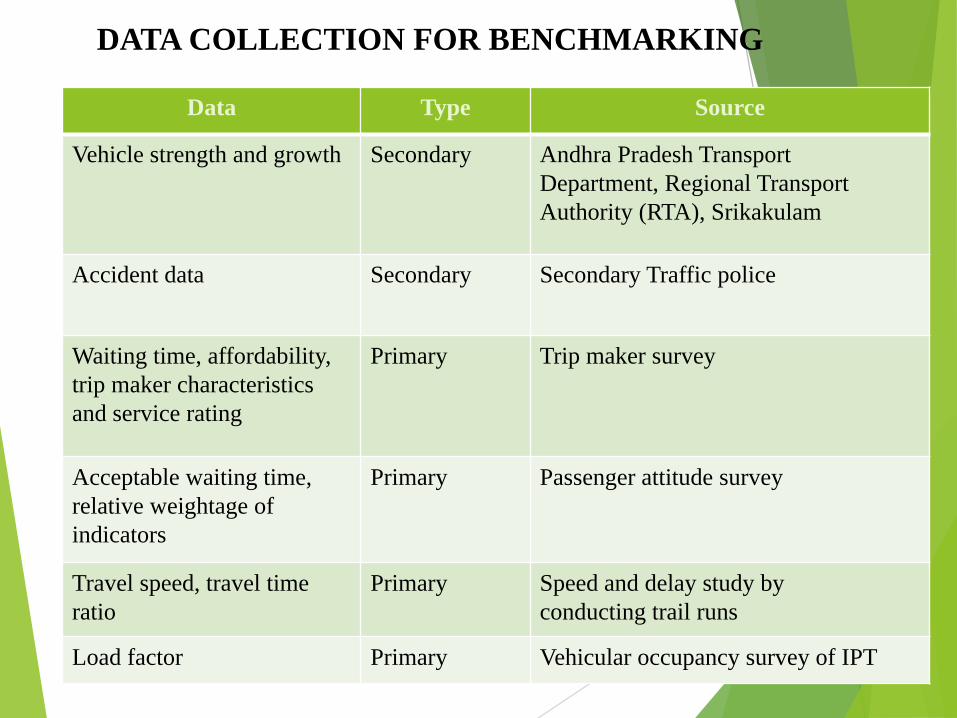
Calculations: link to Calculations1.Affordability:
Affordability= Total expenditure on transportation x 100/ Monthly incomeEg: From Trip maker survey for a person named S. kameswara rao• total expenditure on transportation = 10• Monthly income = 30,000/-
=> Affordability = (10 x 100)/30,000 = 0.0332. Comfort:
Ia = ∑(Si x Fi)/NWhere
Ia = Index of acceptability for the service attribute ‘a’,fi = frequency of respondents giving rating i to service attribute ‘a’,Si= scale value of the rating i,N = summation of frequencies of respondents giving lowest to highest rating
CALCULATIONS
5-Dec-17 13
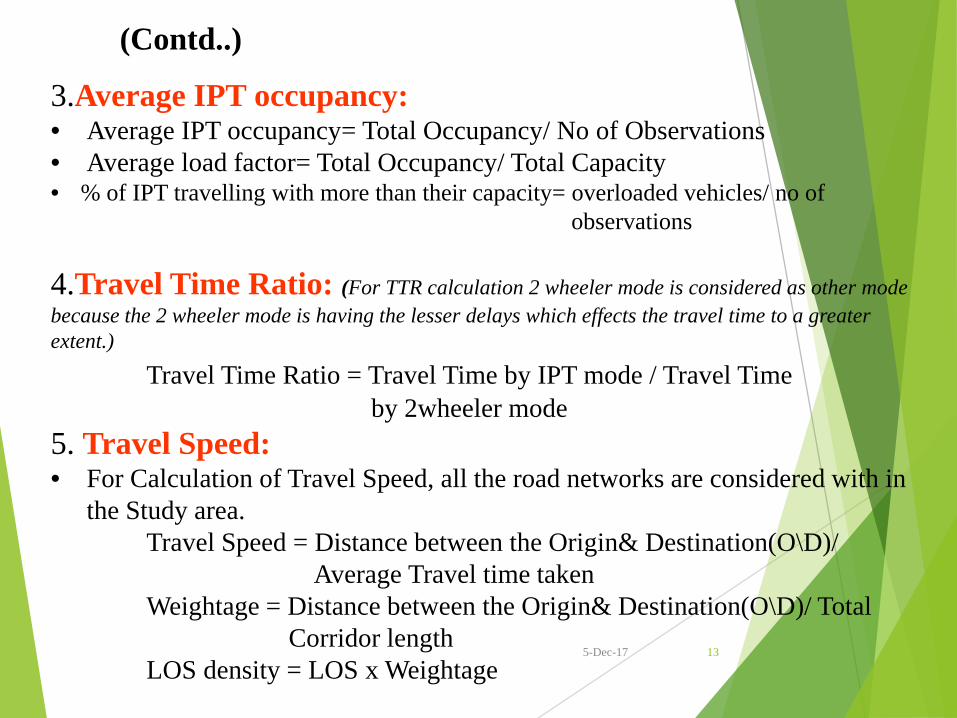
3.Average IPT occupancy:• Average IPT occupancy= Total Occupancy/ No of Observations• Average load factor= Total Occupancy/ Total Capacity• % of IPT travelling with more than their capacity= overloaded vehicles/ no of
observations
4.Travel Time Ratio: (For TTR calculation 2 wheeler mode is considered as other mode because the 2 wheeler mode is having the lesser delays which effects the travel time to a greater extent.)
Travel Time Ratio = Travel Time by IPT mode / Travel Time by 2wheeler mode
5. Travel Speed:• For Calculation of Travel Speed, all the road networks are considered with in
the Study area.Travel Speed = Distance between the Origin& Destination(O\D)/
Average Travel time takenWeightage = Distance between the Origin& Destination(O\D)/ Total
Corridor lengthLOS density = LOS x Weightage
(Contd..)

5-Dec-17 14
6. Accident rate:Accident rate= total no accidents IPT responsible for x 100/ total no of
accidentsFor the year 2016
total no accidents IPT responsible for = 3total no of accidents = 36Accident Rate = (3 x 100)/36 = 8.333
7. Numerical Rating:Safety while travelling:
• Average Weightage = (20x5+31x4+6x3+2x2+0x1)/(20+31+6+2+0)
• Relative Weightage(Wi) = Average Weightage / Total weightage
• Service quality w.r.t unity(Ri) = Average Weightage/5
• QOIPTSi (Quality of Intermediate public transport) = Wi x Ri
• QOIPTS = ∑ QOIPTSi
(Contd..)

5-Dec-17 15
RESULTS
INDICATOR Evaluation RANGE LOS
Presence of IPT vehicles/1000 population
Total number of IPT vehicles = 9118
Total population = 132487
Presence of IPT vehicles/1000 population =
9118/(132487/1000) = 68.822
<4
5-6
7-8
>8
1
2
3
4
Evaluation and LOS criteria for extent of supply of IPT (CEPT)
Evaluation and LOS criteria for service coverage of IPT (SLB)Indicator Evaluation Range LOS
Service coverage of
IPT in the city
Total length in route kms of the corridors on which IPT ply in the city (a) =55.9 Km
Area of the urban limits of the city in sq. Kms(b) = 14.56 km2
Service coverage of IPT = (a/b) = 3.84
>= 1 1
0.7 – 1 2
0.3 – 0.7 3
< 0.3 4
1.Extent of Supply:
2.Service coverage:

5-Dec-17 16
(Contd..)
Affordability of IPT for different classes of income
Monthly Household income Affordability (%) = total expenditure on transportation*100/monthly income
5000 to 10000 2.9910000 to 20000 4.5520000 to 30000 5.00
30000 to 40000 1.89
LOS criteria for Affordability (CEPT)Affordability (%) = total expenditure on transportation by IPT * 100 / monthly income LOS
<10 (Calculated value=3.61) 1
11 – 14 2
15 – 19 3
>20 4
LOS criteria for average waiting time (SLB)
Defined minimum % of passengers Acceptable maximum waiting time in minutes LOS
100 <= 4 175 4 – 6 (Calculated value=4.21) 250 6 – 10 3
<50 >10 4
3.Affordability:
4.Average waiting time:

5-Dec-17 17
(Contd..)LOS criteria for level of comfort (Samir)
Minimum value of the Performance index, (i.e. Geometric mean of the Relative values of 4 elements of comfort) LOS
>0.85 10.85-0.5 (Calculated value=0.73) 2
0.5-0.25 3<0.25 4
LOS criteria for Vehicle Occupancy of IPT(Present Study)Percentage of IPT vehicles travelling with more than their capacity LOS
0 1<20 2
20 – 50 (Calculated value=35) 3>50 4
LOS criteria for TTR of IPT (TCQSM) Travel time of IPT to private LOS category
< =1 11-1.25 2
1.25-1.5 3>1.5 4
5.Comfort:
6.Vehicle occupancy:
7.Travel Time Ratio:
18
(Contd..)
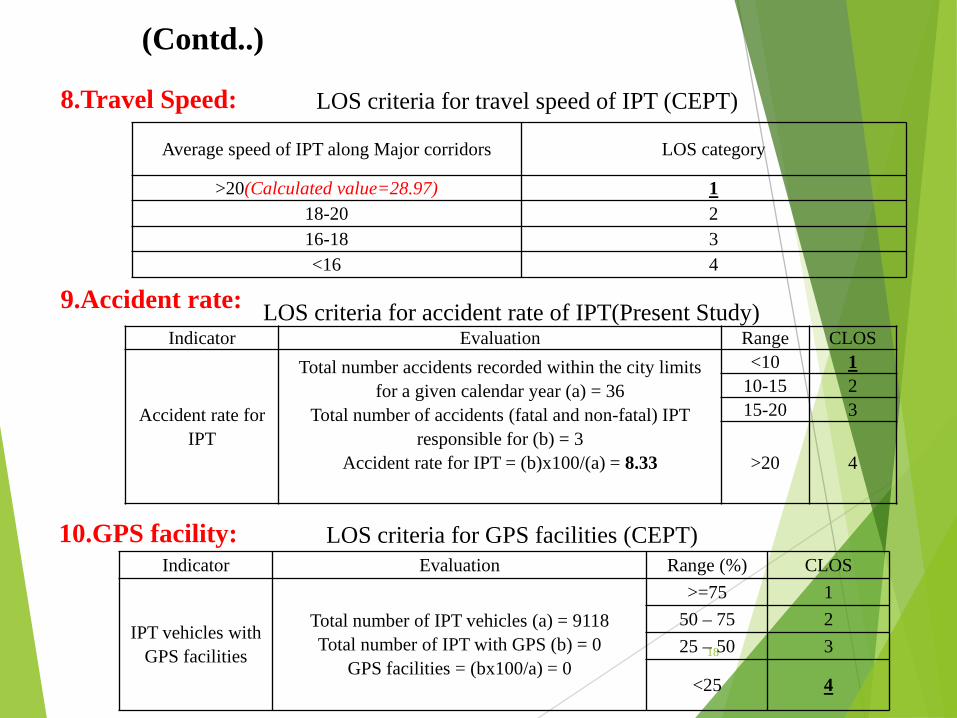
LOS criteria for travel speed of IPT (CEPT)
Average speed of IPT along Major corridors LOS category
>20(Calculated value=28.97) 118-20 216-18 3<16 4
LOS criteria for accident rate of IPT(Present Study)Indicator Evaluation Range CLOS
Accident rate for IPT
Total number accidents recorded within the city limits for a given calendar year (a) = 36
Total number of accidents (fatal and non-fatal) IPT responsible for (b) = 3
Accident rate for IPT = (b)x100/(a) = 8.33
<10 110-15 215-20 3
>20 4
LOS criteria for GPS facilities (CEPT)Indicator Evaluation Range (%) CLOS
IPT vehicles with GPS facilities
Total number of IPT vehicles (a) = 9118Total number of IPT with GPS (b) = 0
GPS facilities = (bx100/a) = 0
>=75 150 – 75 225 – 50 3
<25 4
8.Travel Speed:
9.Accident rate:
10.GPS facility:

5-Dec-17 19
25%
75%
Performance Indicator
Extent of supply
LOS:4
50%50%
Performance Indicator
Vehicle occupancy
LOS:3
75%
25%
Performance Indicator
Average waiting time
LOS:2
100%
Performance Indicator
Service coverage
LOS:1
(Contd..)
100%
Performance Indicator
Affordability
LOS:1
100%
Performance Indicator
Travel Speed
LOS:1

5-Dec-17 20
100%
Performance Indicator
Accident rate
LOS:1
(Contd..)
75%
25%
Performance Indicator
Comfort
LOS:2
25%
75%
Performance Indicator
GPS facility
LOS:4
LOS:2
75%
25%
Performance Indicator
TTR

5-Dec-17 21
(Contd..)
From the above results of the ten KPI, the average of the CLOS(CalculatedLevel of Service) of each KPI will give the Overall Level of Service (OLOS) ofthe IPT system for the Srikakulam city. Therefore, the OLOS of the IPT systemby benchmarking process is the summation of CLOS of all the indicators, theCLOS of extent of supply is 4, CLOS of service coverage is 1, CLOS of comfortis 2, CLOS of average waiting time is 2, CLOS of vehicle occupancy of IPT is3, CLOS of TTR is 2, CLOS of travel speed is 1, CLOS of accident rate is2, CLOS of affordability is 1, CLOS of GPS facilities is 4.
The summation of all the CLOS is, 4+1+2+2+3+2+1+1+1+4= 21 and theaverage of all the CLOS is given by 21/10 = 2.1.
This reflects the poor performance of the IPT system, and to improve theperformance of IPT by benchmarking involves fixing targets for each of the tenindicators and to achieve them in the upcoming years. Suggestions to achievetargets are given in the performance report card of IPT for Srikakulam city in thebelow Table.

PERFORMANCE REPORT CARDIPT Performance report card for the city of Srikakulam by Benchmarking process
Indicator CLOS LOS
Targeted Suggestions to achieve target
Extent of supply 4 3 Registration of new IPT vehicles should be allowed to act as a feeder to Mass Transit System to improve Mobility
Service coverage 1 1 Though it has met the LOS target for ease in transportation, increase IPT Service where PT is not available.
Affordability 1 1Though it has met the LOS target for ease in transportation, government has to Standardize the fares for IPT and shared services and to check regularly.
Comfort 2 1 The Authorities should check & The Commuters should discourage in travelling by seating beside the driver.
Average waiting time 2 1 Based on the corridor demand, the frequency of IPT may be increased in peak hours.
Vehicle occupancy 3 2 No of IPT vehicles can be increased to reduce the Load factor and Vehicle Occupancy to increase the LOS.
Travel Time Ratio 2 1 IPT may be used as public transport in the outsscirts areas and should be integrated with city bus routes to act as feeder.
Travel speed 1 1Though it has met the LOS target for ease in transportation,the speed can be Maintained as Safe Speed to avoid accidents and to maintain a smooth movement of vehicles with in the Urban Corridor.
GPS for IPT 4 3 IPT vehicles should be upgraded with technology for sustainable & safe transport.
Accident rate 1 1Though it has met the LOS target for ease in transportation,checking the over speeding of IPT vehicles on Urban Streets by speed laser gun and instruct IPT vehicles to operate safely to act as a feeder to PT.

5-Dec-17 23
CONCLUSIONS
The Conclusions are Drawn from the work executed for the SrikakulamUrban area:• The various IPT modes operating in Srikakulam town are identified.• The KPI’s for the performance areas of
availability, mobility, safety, affordability, Intelligent TransportationSystem(ITS) facility, comfort and convenience are developed andanalysed.
• The vehicular occupancy of IPT modes operating in Srikakulam isassessed.
• Passenger attitude and trip maker characteristics are assessed.• In terms of mobility IPT and 2 wheeler modes are compared.• The areas of excellence and gaps are derived and performance report
card is prepared to set targets.• OLOS of IPT is obtained to be 2.1, which shows there is a need for
improvement in the performance. Suggestions to improve the IPTsystem have been presented in the report card.

FUTURE SCOPE & RECOMMENDATIONS
Future scope:
• To evaluate the overall performance of IPT, additional performance areas and Keyperformance indicators can be considered such as service accessibility, hours ofservice, ridership, etc.
• Also to evaluate the performance of IPT, other methodologies can be adopted alongwith benchmarking and numerical rating such as fuzzy sets, DEA (Data EnvelopmentAnalysis), etc for better results.
• A comparative study of IPT with the city bus system and private mode can be made.• The LOS criteria considered for the KPI, comfort, average waiting time, TTR, vehicle
occupancy of IPT, the accident rate for IPT can be standardized by evaluating theperformance of IPT using benchmarking for various cities with different populationsize.
• The KPI like Security can also be considered for the performance evaluation of IPTfor various cities to improve the quality of service for the city.
• The upcoming technologies like smart vehicular technology , ITS , traveler informationsystem , vehicular damage assessment can be implemented for the IPT vehicles toimprove the service quality for the city.

5-Dec-17
(Contd..)
Recommendations:
• The IPT system should be regularized and should be confined to operate zone wisefor its better functioning and well-coordinated with the city bus system in terms ofroutes and frequencies.
• There is a need to check the uncontrolled growth of auto rickshaws and thecommuters are needed to be shifted to organized public transport.
• The traffic police should check that no driver allows the commuters to sit next tothem.
• Based on the corridor demand, the frequency should be increased within the core ofthe city to reduce the waiting times and making IPT available in the routes wheretrips by city bus is not feasible.
• The IPT system of Srikakulam town should be improved in technology for cleanmobility, and they are creating congestion in urban streets because of unsystematicparking policy, over speeding on MDR(Major District Roads) roads andovercrowding of passengers.
• There is a need to check that no IPT vehicle should stop or parked at least 100 metersfrom bus stops and major junctions.

26
REFERENCES1. ““Service Level Benchmarking in Urban Transportation for Indian
cities”, (2013), CEPT University, Ahmedabad- February 2013.
2. “Transit Capacity and Quality of Service Manual, 2nd
edition”, (2003), released by Transportation Research Board.
3. “Service level benchmark’s for urban transport at a glance”, (2009), released
by MoUD, Urban mobility India conference.
4. Samir Kumar Das (2001), “LOS evaluation of improved bus services in
Dhaka city”, Journal of the Eastern Asia Society for Transportation
Studies, Vol.4, No.1, October,2001.
5. “Service level Benchmarking in Urban Transportation for Indian
cities”, (2013) – IUT University http://www.iutindia.org
6. Will be available at
https://en.wikipedia.org/wiki/Srikakulam_district;http://aproads.cgg.gov.in/ge
tInfo.do?dt=1&oId=33

5-Dec-17 27
THANK YOU