Embed Size (px)
DESCRIPTION
Performance_Evaluation_of_Virtual_Machines
Citation preview
PERFORMANCE EVALUATION OF VIRTUAL MACHINES
Yasser A. Khan and Mohammed Amro Department of Information & Computer Science, Dhahran, Saudi Arabia
{ yasera, mamro}@kfupm.edu.sa
Keywords: Benchmarking, Virtual Machines, Performance Evaluation
Abstract: Virtualization has many advantages such as interoperability, flexibility and cost efficiency. However, it is
known to cause performance overhead. In this study we investigate the performance of different virtual
machines, VMware and VirtualBox, by performing a benchmarking experiment. Our results show that
VirtualBox is a superior virtualization solution compared to VMware. Moreover, its CPU performance is
better than its host. The results of this paper negate VMware’s claims that their binary translation technique
for handling privileged guest OS instruction is efficient than other virtualization solutions. VirtualBox’s
code analyses, generate, and recompile technique, although being complicated was shown to be far effective
performance wise.
1 INTRODUCTION
Virtualization technology allows multiple operating
systems (OS) to run concurrently, in an isolated
manner, on a single machine (Smith and Nair, 2005).
The underlying platform that supports virtualization
is referred as the host while the multiple systems are
guests. The software that implements virtualization
is known as a virtual machine monitor (VMM). It
creates an illusion that the guest OS is running on a
separate physical machine, by providing it access to
virtual hardware resources. This guest OS along
with these virtual resources is referred as a virtual
machine (VM). Interoperability is one of the
advantages of virtualization. Software written for a
specific instruction set architecture (ISA) can be run
on different ISAs through virtualization. It is also
beneficial for software testing; a newly developed
system can be tested on virtualized forms of
hardware and software platforms it is intended to be
used on. This reduces the cost associated with
acquirement and maintenance of different software
and hardware resources.
Virtualization, despite its several benefits, is
known to incur performance overhead. An
application’s execution behavior is different on a
VM, compared to a physical machine. The guest OS
has access to software mimics of the host resources
rather than direct access to them (Jie et al., 2012).
Virtualization is also not favortable for high
performance computing (HPC) applications (Huang
et al., 2006). The virtualization layer or the guest OS
is involved in every I/O operation, which are critical
in HPC applications. The VMM is the core
component of a VM and has a great impact on its
performance (Jianhua et al., 2006). Hence, it is
important to compare the performance of the
different comercially available virtual machine
monitors.
Repeated research allows the results of
experiments, reported in literature, to be established
as a repeatable fact and identifies aspects not
revealed previously (Clark et al., 2004). The wide
range of hardware and software environments
available prevents reported results obtained for a
specific computer system to be generalized for other
systems. Hence, in this paper we present results that
repeat the experiment performed by Langer and
French (2011) in their paper “Virtual Machine
Performance Benchmarking”. Performance of VMs
running on two different VMMs, VMware and
VitualBox, is compared by benchmarking.
The remainder of this paper is organized as
follows. In Section 2 we discuss related work.
Detailed description of the different experiments
performed is given in Section 3 and experimental
setup in Section 4. An overview of the architecture
of VMMs is given in Section 5. Results of the
performed experiment are given in Section 6.
Limitations of the experimental results are discussed
in Section 7 and, Section 8 concludes the paper.
2 RELATED WORK
Several studies have compared the performance of
VMMs. Jianhua et al. (2008) compared the CPU,
RAM and Disk I/O performance of Xen (Barham et
al., 2003) and KVM (Kivity et al., 2007). The
LINPACK (Dongarra et al., 2003) benchmark was
used to evaluate CPU performance, LMBench
(Staelin et al., 1996) for RAM and, IOZone (Capps
and Norcott, 2004) for disk I/O. The results for all of
them showed that Xen performed better compared to
KVM. Moreover, the CPU performance of the guest
OS running on Xen was almost same as that of the
native OS. The better RAM performance of Xen is
supported by the fact that it supports para-
virtualization, which enables the guest OS to realize
that its resources are being virtualized.
The disk I/O performance of Windows XP
virtual machines was measured by Youhui et al.
(2008). The reported results varied for different
Windows read modes (no buffer, sequential and
normal).
Langer and French (2011) compared several
VMMs and concluded that Virtual Box (Oracle,
2009) gave the best CPU, RAM and disk I/O
performance. CPU performance was computed using
the Dhrystone (Weicker, 1984) and Whetstone
(Weicker, 1990) benchmarks; the former gives
integer performance whereas the latter gives floating
point performance. The Linux command ‘dd’ was
used for measuring RAM and disk I/O performance.
3 EXPERIMENTS
To compare the performance of VMMs we perform a benchmarking experiment that consists of the three stages: single-level comparision, nested comparision and cloud instance comparision.
3.1 Single-level Comparison
In the first stage we reproduce the results obtained by Langer and French (2011). The obtained results are analyzed and compared against against their results. Based on our interpretation of the results we will conclude which VMM performs better in terms of a particular benchmark. Hence our first research question is as follows:
RQ1 – Which VMM is the most effective performance wise?
3.2 Nested Comparison
In this stage we execute the benchmarking script
(Langer and French, 2011) on an Amazon EC2
cloud instance (medium). We install a RedHat 5.5
VM running on VirtualBox on his instance and
execute the benchamrking script. Since Amazon
cloud instances are VMs themselves hence, the VM
we installed is considered as a nested VM. Amazon
EC2 is the parent VM while the VM running on
VirtualBox is the child VM. The obtained results for
the nested VM are compared with those of the parent
VM. This will determine whether a nested VM
perform the same or worse compared to the parent
VM. Hence, our second research questions is as
follows:
RQ2 – Do nested VMs perform the same or worse compared to their parent VM?
4 EXPERIMENT SETUP
4.1 Virtual Machine Monitors
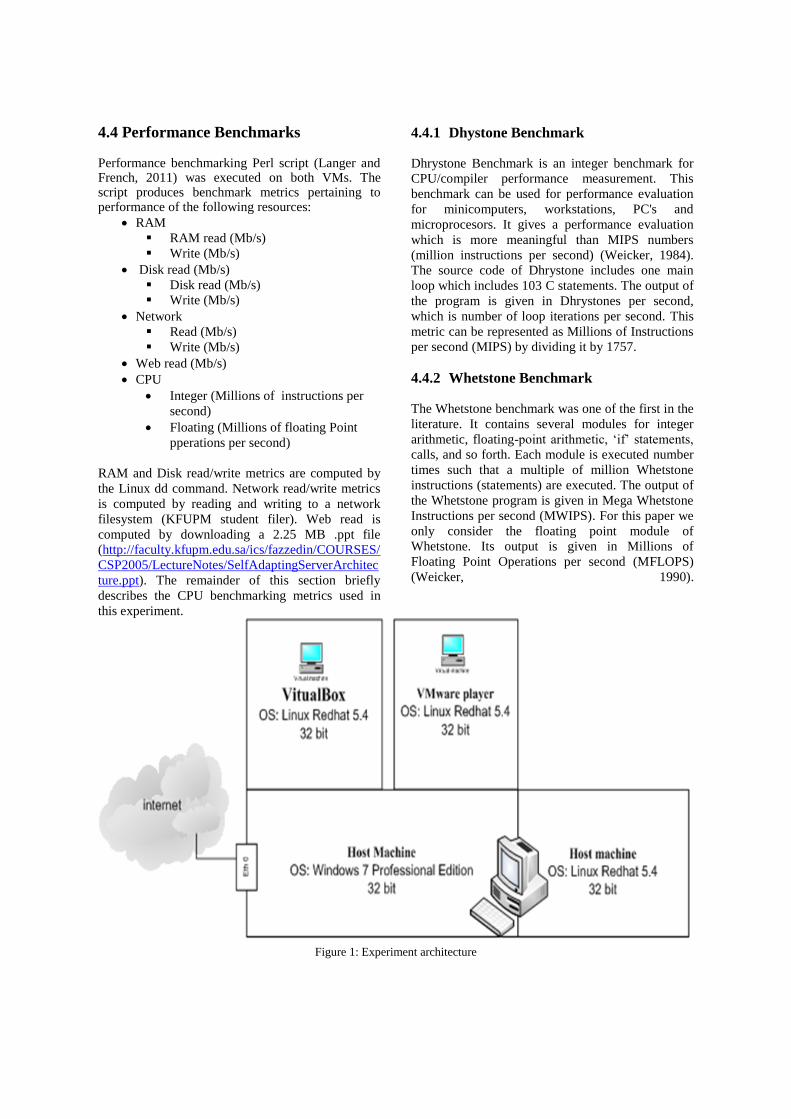
There are many commercial and open source VMMs that are created by different vendors to implement VM architecture. In this paper we compare the performance of two popular VMMs—VMware Player Version 4 and VitualBox Version 3.2.1. The versions are the same as used by Langer and French (2011) in their benchmarking experiment. Figure 1 shows the architecture of the experimental setup.
4.2 Host platform
The experiment was performed on two CCSE lab workstations with the following configuration:
Host A Host B
CPU Intel Core 2 Duo 2.67 Ghz
Intel Core 2 Quad 2.67 Ghz
RAM 2 GB 4 GB
OS Windows 7 32-bit Windows 7 32-bit
4.3 Guest OS
The guest operating system installed on the two VMMs is RedHat v5.5 32-bit, an enterprise Linux distribution.
4.4 Performance Benchmarks
Performance benchmarking Perl script (Langer and French, 2011) was executed on both VMs. The script produces benchmark metrics pertaining to performance of the following resources:
RAM
RAM read (Mb/s)
Write (Mb/s)
Disk read (Mb/s)
Disk read (Mb/s)
Write (Mb/s)
Network
Read (Mb/s)
Write (Mb/s)
Web read (Mb/s)
CPU
Integer (Millions of instructions per
second)
Floating (Millions of floating Point
pperations per second)
RAM and Disk read/write metrics are computed by
the Linux dd command. Network read/write metrics
is computed by reading and writing to a network
filesystem (KFUPM student filer). Web read is
computed by downloading a 2.25 MB .ppt file
(http://faculty.kfupm.edu.sa/ics/fazzedin/COURSES/
CSP2005/LectureNotes/SelfAdaptingServerArchitec
ture.ppt). The remainder of this section briefly
describes the CPU benchmarking metrics used in
this experiment.
4.4.1 Dhystone Benchmark
Dhrystone Benchmark is an integer benchmark for
CPU/compiler performance measurement. This
benchmark can be used for performance evaluation
for minicomputers, workstations, PC's and
microprocesors. It gives a performance evaluation
which is more meaningful than MIPS numbers
(million instructions per second) (Weicker, 1984).
The source code of Dhrystone includes one main
loop which includes 103 C statements. The output of
the program is given in Dhrystones per second,
which is number of loop iterations per second. This
metric can be represented as Millions of Instructions
per second (MIPS) by dividing it by 1757.
4.4.2 Whetstone Benchmark
The Whetstone benchmark was one of the first in the
literature. It contains several modules for integer
arithmetic, floating-point arithmetic, ‘if’ statements,
calls, and so forth. Each module is executed number
times such that a multiple of million Whetstone
instructions (statements) are executed. The output of
the Whetstone program is given in Mega Whetstone
Instructions per second (MWIPS). For this paper we
only consider the floating point module of
Whetstone. Its output is given in Millions of
Floating Point Operations per second (MFLOPS)
(Weicker, 1990).
Figure 1: Experiment architecture
5 VMM ARCHITECTURE
In this section we give an overview of the
architecture of the two VMMs experimented in this
paper—VMware and VirtualBox.
5.1 VMware
Vmware is one of the most famous commercial
applications that are widely used for Windows
virtualization. VMware VMs execute as user level
applications on a host machine. Three processes
execute on the host machine to support a VM
instance. They are VMApp, VMDriver and the
VMware hypervisor (VMM). VMApp is a client
application that uses services provided by
VMDriver, a driver installed on the host OS. The
CPU may execute host OS code or guest OS code.
The VMDriver is responsible for switching the
context between the host and guest. This context
switch is more expensive than a normal process
context switch (Sugerman et al., 2001).
User level code of the guest is run natively on
the host processor by the VMM. Kernel level code is
intercepted by the hypervisor and performed by
VMApp on behalf of the guest. For example,
VMApp will perform I/O operations on behalf of the
guest through system calls. The hypervisor is also
responsible for transferring virtual hardware
interrupts to the host OS for handling (Sugerman et
al., 2001).
VMware uses a combination of two techniques,
binary translation and direct execution, to achieve
full virtualization of the host CPU. User mode code
of guest is directly executed on the host CPU,
whereas, kernel model code is replaced by new
instructions which have the same intended effect.
This replacement (binary translation) of code is
performed by the VMware hypervisor. This is
performed on the fly and the results are cached for
future use. The VMware hypervisor completely
isolates the guest from the host which enables allows
migration and portability of VMs (VMware, 2007).
To virtualize the host’s memory the VMware
hypervisor virtualizes the memory management unit
(MMU). The virtualized MMU enables mapping of
virtual addresses to the guest’s physical address
space. The guest OS does not have direct access to
the host physical address space. The hypervisor
maps guest physical addresses to host physical
addresses. It makes use of the translation lookup
buffer (TLB) on the guest to avoid two translations
on every memory access. A virtualized TLB is
called a shadow page table. Whenever, a virtual
address is mapped to physical address the hypervisor
updates the shadow page table to allow direct
lookup. However, MMU virtualization is known to
cause performance overhead, which can be resolved
by hardware assisted virtualization (VMware, 2007).
5.2 VirtualBox
VirtualBox is a powerful free available open source
software under of the GNU General Public License
(GPL), VirtualBox supports x86 and
AMD64/Intel64 virtualization for home use and for
enterprise customer, currently, VirtualBox runs on
Windows, Linux, Macintosh, and Solaris hosts and
supports a large number of guest operating systems
including but not limited to Windows (NT 4.0, 2000,
XP, Server 2003, Vista, Windows 7),
DOS/Windows 3.x, Linux (2.4 and 2.6), Solaris and
OpenSolaris, OS/2, and OpenBSD.
VirtualBox VMs execute as user level
applications on a host machine. Three processes
execute on the host machine to support a VM
instance. They are VBoxSVC, VirtualBox and the
VirtualBox hypervisor. VBoxSVC is a background
process which manages the execution of all
VirtualBox VM instances. The process ‘VirtualBox’
is the GUI that manages a particular VM and
provides I/O for the guest OS. Its start-up
responsibility is loading the VirtualBox hypervisor
into host memory. The different VirtualBox client
processes include a command line VM management
tools (VBoxManage and VirtualBox Python shell),
remote VM login tool (VBoxHeadless), webservice
for remote management of VMs (vboxwebsrv) and
GUI for debugging (VBoxSDL). These client
processes interact with the VBoxSVC process and
can control the state of the VM (Oracle, 2012).
The VirtualBox hypervisor has a very modular
and flexible design. It consists of the following
components. IPRT, a runtime library, provides host
OS features to the VM. A VM can execute guest OS
code either on the virtual CPU or the host CPU. This
is managed by the Execution Manager component.
To safeguard the state of the host CPU, guest OS
code needs to be recompiled by VirtualBox when
interrupts are disabled in the guest. The
recompilation is done such that the guest OS cannot
modify the state of the host CPU. This recompilation
is handled by the Recompilation Execution Manager
(REM). User mode instructions of the guest are
executed directly on the host CPU by the Execution
Manager (EM), whereas, kernel mode instructions
are trapped by the Trap Manager (TRPM). Guest
kernel mode instruction may interfere with the state
of the host, therefore trapping is performed. The
remaining components of VirtualBox include Page,
Pluggable Device, Time, Configuration and Save
State managers. The services provided by the above
components are all accessed through the VirtualBox
API. Therefore, all VirtualBox client processes
never directly access the hypervisor (Oracle, 2012).
User level code of the guest is run natively on
the host processor by the VirtualBox hypervisor,
whereas, kernel level code causes the guest to trap
and an interrupt occurs. The hypervisor handles this
interrupt depending on the blocking instruction. For
example, page faults will trap the guest and the
hypervisor handles this by forwarding the request to
the virtual I/O register. For other kernel mode guest
code, the hypervisor executes this code on behalf of
the guest in kernel mode. This causes a lot of
instructional faults as the guest cannot execute
privileged instructions. Handling these faults is very
expensive for the hypervisor and this severely
affects the performance of the VM (Oracle, 2012).
The VirtualBox hypervisor reserves some of the
guest’s address space for its own use. This is not
visible to the guest and may cause performance
issues. The x86 architecture contains a hidden cache
for the CPU which is not software accessible. The
VirtualBox hypervisor cannot make use of it but the
guest OS can. Hence, guest code delegated to the
hypervisor cannot reap the benefits of the hidden
cache. Certain registers are accessed frequently by
guest OS, for example the Task Priority Register.
The VirtualBox hypervisor blocks the guest on every
such access causing significant performance
overhead (Oracle, 2012).
The VirtualBox tries to solve the problem of
repeated blocking by patching the guest code. The
guest code is analyzed to find offending instructions
and they are replaced with jumps to the hypervisor,
which suitable code is generated. This is a very
complex task but it works well and significantly
improves VM performance (Oracle, 2012).
5.3 Architectural Comparision
VMware and VirtualBox both suffer from
performance issues with regard to I/O operations. In
both VMMs, the hypervisor traps the I/O
instructions and performs it in behalf of the guest.
Both VMware and VirtualBox VMs run as user
processes on the guest. Therefore, pages allocated to
the VM by the hypervisor may get paged out by the
host OS. The difference between VMware and
VirtualBox lies in how they handle guest kernel
code. VMware performs binary translation of guest
code in kernel mode, whereas, VirtualBox performs
disassembly, modification and recompilation of
code. The former technique is simpler and faster,
whereas, the latter is very complex and requires
special handling for many situations.
6 RESULTS AND DISCUSSION
6.1 Single-level Comparison
This experiment was performed in two steps. First,
the benchmarking Peril script (Langer and French,
2011) was executed natively (without virtualization)
on both hosts (Host A and Host B). Second, the
script was executed on VMware and VirtualBox
VMs running the guest OS (RedHat v5.5) on both
hosts. Both steps were performed three times;
averages were computed for each metric and logged
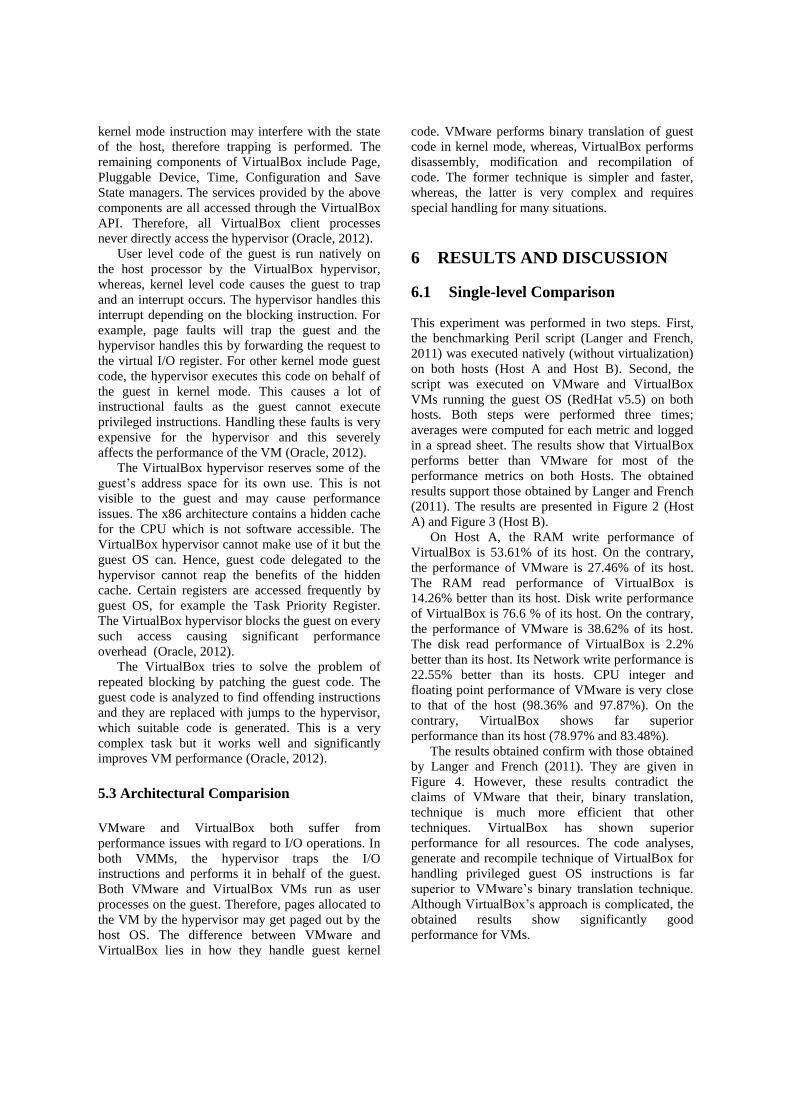
in a spread sheet. The results show that VirtualBox
performs better than VMware for most of the
performance metrics on both Hosts. The obtained
results support those obtained by Langer and French
(2011). The results are presented in Figure 2 (Host
A) and Figure 3 (Host B).
On Host A, the RAM write performance of
VirtualBox is 53.61% of its host. On the contrary,
the performance of VMware is 27.46% of its host.
The RAM read performance of VirtualBox is
14.26% better than its host. Disk write performance
of VirtualBox is 76.6 % of its host. On the contrary,
the performance of VMware is 38.62% of its host.
The disk read performance of VirtualBox is 2.2%
better than its host. Its Network write performance is
22.55% better than its hosts. CPU integer and
floating point performance of VMware is very close
to that of the host (98.36% and 97.87%). On the
contrary, VirtualBox shows far superior
performance than its host (78.97% and 83.48%).
The results obtained confirm with those obtained
by Langer and French (2011). They are given in
Figure 4. However, these results contradict the
claims of VMware that their, binary translation,
technique is much more efficient that other
techniques. VirtualBox has shown superior
performance for all resources. The code analyses,
generate and recompile technique of VirtualBox for
handling privileged guest OS instructions is far
superior to VMware’s binary translation technique.
Although VirtualBox’s approach is complicated, the
obtained results show significantly good
performance for VMs.
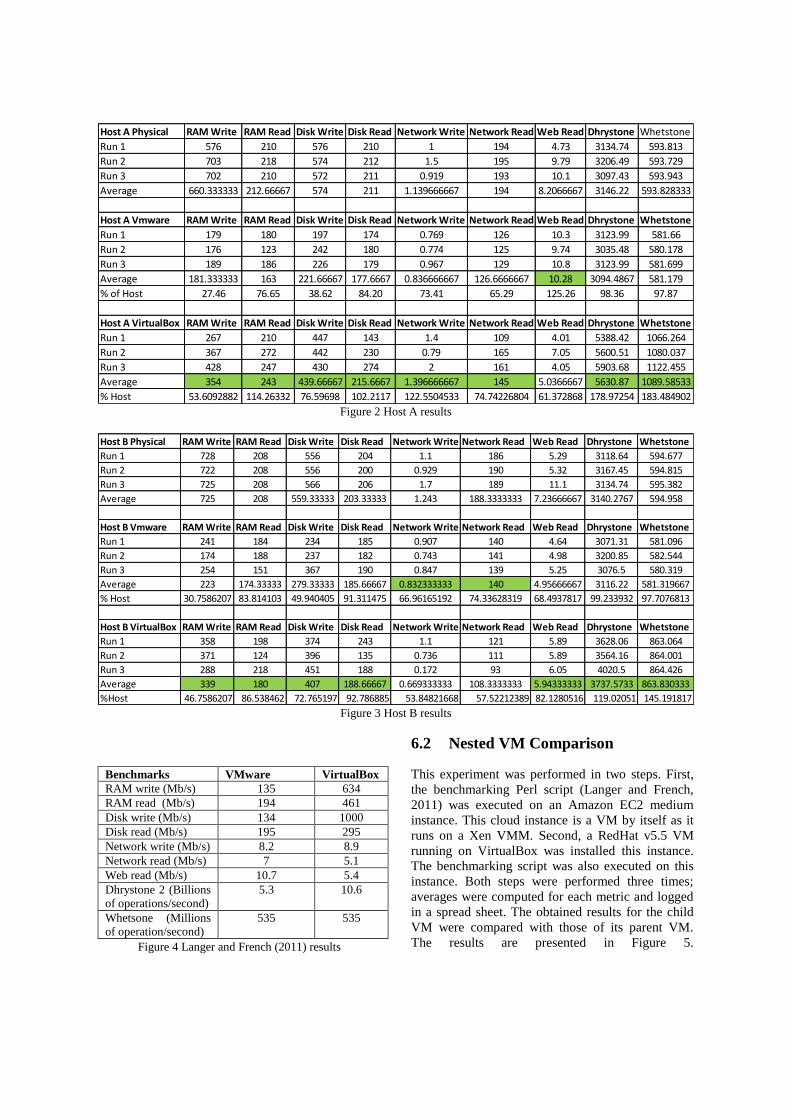
Figure 2 Host A results
Figure 3 Host B results
Benchmarks VMware VirtualBox
RAM write (Mb/s) 135 634
RAM read (Mb/s) 194 461
Disk write (Mb/s) 134 1000
Disk read (Mb/s) 195 295
Network write (Mb/s) 8.2 8.9
Network read (Mb/s) 7 5.1
Web read (Mb/s) 10.7 5.4
Dhrystone 2 (Billions
of operations/second)
5.3 10.6
Whetsone (Millions
of operation/second)
535 535
Figure 4 Langer and French (2011) results
6.2 Nested VM Comparison
This experiment was performed in two steps. First,
the benchmarking Perl script (Langer and French,
2011) was executed on an Amazon EC2 medium
instance. This cloud instance is a VM by itself as it
runs on a Xen VMM. Second, a RedHat v5.5 VM
running on VirtualBox was installed this instance.
The benchmarking script was also executed on this
instance. Both steps were performed three times;
averages were computed for each metric and logged
in a spread sheet. The obtained results for the child
VM were compared with those of its parent VM.
The results are presented in Figure 5.
Host A Physical RAM Write RAM Read Disk Write Disk Read Network Write Network Read Web Read Dhrystone Whetstone
Run 1 576 210 576 210 1 194 4.73 3134.74 593.813
Run 2 703 218 574 212 1.5 195 9.79 3206.49 593.729
Run 3 702 210 572 211 0.919 193 10.1 3097.43 593.943
Average 660.333333 212.66667 574 211 1.139666667 194 8.2066667 3146.22 593.828333
Host A Vmware RAM Write RAM Read Disk Write Disk Read Network Write Network Read Web Read Dhrystone Whetstone
Run 1 179 180 197 174 0.769 126 10.3 3123.99 581.66
Run 2 176 123 242 180 0.774 125 9.74 3035.48 580.178
Run 3 189 186 226 179 0.967 129 10.8 3123.99 581.699
Average 181.333333 163 221.66667 177.6667 0.836666667 126.6666667 10.28 3094.4867 581.179
% of Host 27.46 76.65 38.62 84.20 73.41 65.29 125.26 98.36 97.87
Host A VirtualBox RAM Write RAM Read Disk Write Disk Read Network Write Network Read Web Read Dhrystone Whetstone
Run 1 267 210 447 143 1.4 109 4.01 5388.42 1066.264
Run 2 367 272 442 230 0.79 165 7.05 5600.51 1080.037
Run 3 428 247 430 274 2 161 4.05 5903.68 1122.455
Average 354 243 439.66667 215.6667 1.396666667 145 5.0366667 5630.87 1089.58533
% Host 53.6092882 114.26332 76.59698 102.2117 122.5504533 74.74226804 61.372868 178.97254 183.484902
Host B Physical RAM Write RAM Read Disk Write Disk Read Network Write Network Read Web Read Dhrystone Whetstone
Run 1 728 208 556 204 1.1 186 5.29 3118.64 594.677
Run 2 722 208 556 200 0.929 190 5.32 3167.45 594.815
Run 3 725 208 566 206 1.7 189 11.1 3134.74 595.382
Average 725 208 559.33333 203.33333 1.243 188.3333333 7.23666667 3140.2767 594.958
Host B Vmware RAM Write RAM Read Disk Write Disk Read Network Write Network Read Web Read Dhrystone Whetstone
Run 1 241 184 234 185 0.907 140 4.64 3071.31 581.096
Run 2 174 188 237 182 0.743 141 4.98 3200.85 582.544
Run 3 254 151 367 190 0.847 139 5.25 3076.5 580.319
Average 223 174.33333 279.33333 185.66667 0.832333333 140 4.95666667 3116.22 581.319667
% Host 30.7586207 83.814103 49.940405 91.311475 66.96165192 74.33628319 68.4937817 99.233932 97.7076813
Host B VirtualBox RAM Write RAM Read Disk Write Disk Read Network Write Network Read Web Read Dhrystone Whetstone
Run 1 358 198 374 243 1.1 121 5.89 3628.06 863.064
Run 2 371 124 396 135 0.736 111 5.89 3564.16 864.001
Run 3 288 218 451 188 0.172 93 6.05 4020.5 864.426
Average 339 180 407 188.66667 0.669333333 108.3333333 5.94333333 3737.5733 863.830333
%Host 46.7586207 86.538462 72.765197 92.786885 53.84821668 57.52212389 82.1280516 119.02051 145.191817
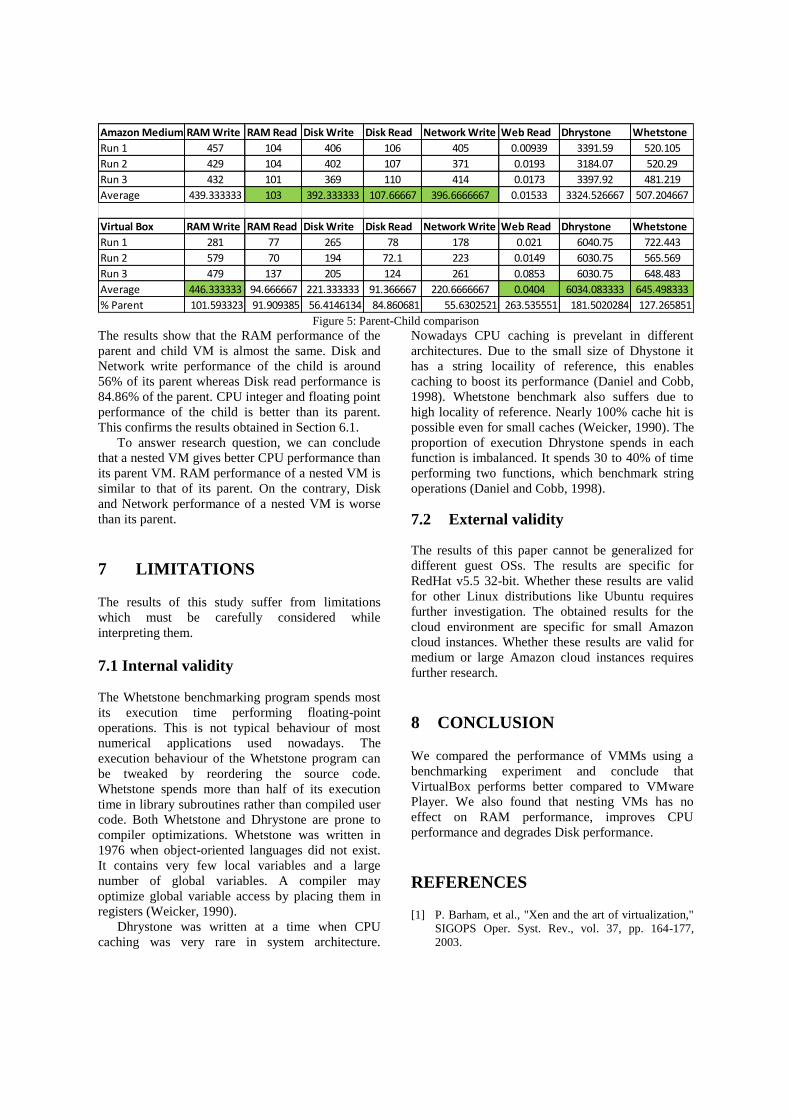
Figure 5: Parent-Child comparison
The results show that the RAM performance of the
parent and child VM is almost the same. Disk and
Network write performance of the child is around
56% of its parent whereas Disk read performance is
84.86% of the parent. CPU integer and floating point
performance of the child is better than its parent.
This confirms the results obtained in Section 6.1.
To answer research question, we can conclude
that a nested VM gives better CPU performance than
its parent VM. RAM performance of a nested VM is
similar to that of its parent. On the contrary, Disk
and Network performance of a nested VM is worse
than its parent.
7 LIMITATIONS
The results of this study suffer from limitations
which must be carefully considered while
interpreting them.
7.1 Internal validity
The Whetstone benchmarking program spends most
its execution time performing floating-point
operations. This is not typical behaviour of most
numerical applications used nowadays. The
execution behaviour of the Whetstone program can
be tweaked by reordering the source code.
Whetstone spends more than half of its execution
time in library subroutines rather than compiled user
code. Both Whetstone and Dhrystone are prone to
compiler optimizations. Whetstone was written in
1976 when object-oriented languages did not exist.
It contains very few local variables and a large
number of global variables. A compiler may
optimize global variable access by placing them in
registers (Weicker, 1990).
Dhrystone was written at a time when CPU
caching was very rare in system architecture.
Nowadays CPU caching is prevelant in different
architectures. Due to the small size of Dhystone it
has a string locaility of reference, this enables
caching to boost its performance (Daniel and Cobb,
1998). Whetstone benchmark also suffers due to
high locality of reference. Nearly 100% cache hit is
possible even for small caches (Weicker, 1990). The
proportion of execution Dhrystone spends in each
function is imbalanced. It spends 30 to 40% of time
performing two functions, which benchmark string
operations (Daniel and Cobb, 1998).
7.2 External validity
The results of this paper cannot be generalized for
different guest OSs. The results are specific for
RedHat v5.5 32-bit. Whether these results are valid
for other Linux distributions like Ubuntu requires
further investigation. The obtained results for the
cloud environment are specific for small Amazon
cloud instances. Whether these results are valid for
medium or large Amazon cloud instances requires
further research.
8 CONCLUSION
We compared the performance of VMMs using a
benchmarking experiment and conclude that
VirtualBox performs better compared to VMware
Player. We also found that nesting VMs has no
effect on RAM performance, improves CPU
performance and degrades Disk performance.
REFERENCES
[1] P. Barham, et al., "Xen and the art of virtualization,"
SIGOPS Oper. Syst. Rev., vol. 37, pp. 164-177,
2003.
Amazon Medium RAM Write RAM Read Disk Write Disk Read Network Write Web Read Dhrystone Whetstone
Run 1 457 104 406 106 405 0.00939 3391.59 520.105
Run 2 429 104 402 107 371 0.0193 3184.07 520.29
Run 3 432 101 369 110 414 0.0173 3397.92 481.219
Average 439.333333 103 392.333333 107.66667 396.6666667 0.01533 3324.526667 507.204667
Virtual Box RAM Write RAM Read Disk Write Disk Read Network Write Web Read Dhrystone Whetstone
Run 1 281 77 265 78 178 0.021 6040.75 722.443
Run 2 579 70 194 72.1 223 0.0149 6030.75 565.569
Run 3 479 137 205 124 261 0.0853 6030.75 648.483
Average 446.333333 94.666667 221.333333 91.366667 220.6666667 0.0404 6034.083333 645.498333
% Parent 101.593323 91.909385 56.4146134 84.860681 55.6302521 263.535551 181.5020284 127.265851
[2] D. Capps, W.D. Norcott, “IOZone Filesystem
Benchmark”, http://www.iozone.org, 2004.
[3] B. Clark, et al., "Xen and the art of repeated
research," presented at the Proceedings of the annual
conference on USENIX Annual Technical
Conference, Boston, MA, 2004.
[4] J. Dongarra, P. Luszczek, and A. Petitet, "The
LINPACK Benchmark: past, present and
future", presented at Concurrency and Computation:
Practice and Experience, 2003, pp.803-820.
[5] W. Huang, et al., "A case for high performance
computing with virtual machines," presented at the
Proceedings of the 20th annual international
conference on Supercomputing, Cairns, Queensland,
Australia, 2006.
[6] C. Jianhua, et al., "Performance Measuring and
Comparing of Virtual Machine Monitors," in
Embedded and Ubiquitous Computing, 2008. EUC
'08. IEEE/IFIP International Conference on, 2008, pp.
381-386.
[7] T. Jie, et al., "A Performance Study of Virtual
Machines on Multicore Architectures," in Parallel,
Distributed and Network-Based Processing (PDP),
2012 20th Euromicro International Conference on,
2012, pp. 89-96.
[8] A. Kivity, et al., "kvm : the Linux Virtual Machine
Monitor," Reading and Writing, vol. 1, pp. 225-230,
2007.
[9] S.G. Langer, T. French, “Virtual Machine
Performance Benchmarking”, J. Digit Imaging, 2011,
pp. 883-88.
[10] Oracle, “Virtual Box 3.1.2”,
http://download.virtualbox.org/virtualbox/3.1.2/
, 2009. [11] J. E. Smith and R. Nair, "The architecture of virtual
machines", Computer, vol. 38, pp. 32-38, 2005.
[12] C. Staelin and H.-p. Laboratories, "lmbench: Portable
Tools for Performance Analysis," in In USENIX
Annual Technical Conference, ed, 1996, pp. 279-294.
[13] R. P. Weicker, “Dhrystone: A Synthetic Systems
Programming Benchmark”, in Communications of
the ACM 27, 10 (Oct. 1984), pp. 1013-1030
[14] R. P. Weicker, "An Overview of Common
Benchmarks," Computer, vol. 23, pp. 65-75, 1990.
[15] Z. Youhui, et al., "On Virtual-Machine-Based
Windows File Reads: A Performance Study," in
Computational Intelligence and Industrial
Application, 2008. PACIIA '08. Pacific-Asia
Workshop on, 2008, pp. 944-948.
[16] M. Daniel and P. Cobb, “When Dhrystone Leaves
You High and Dry”, EDN Magazine, May 1998.
[17] Oracle, “VirtualBox User Manual”,
http://www.virtualbox.org/manual/, 2012
[18] Sugerman, J., Venkitachalam, G. & Lim, B.-H. 2001.
Virtualizing I/O Devices on VMware Workstation's
Hosted Virtual Machine Monitor. Proceedings of the
General Track: 2002 USENIX Annual Technical
Conference. USENIX Association.
[19] VMware, “Understanding Full Virtualization,
Paravirtualization, and Hardware Assist”
http://www.vmware.com/files/pdf/VMware_par
avirtualization.pdf, 2007
.