Embed Size (px)
Citation preview

Sustain. Environ. Res., 25(3), 141-150 (2015) 141
*Corresponding authorEmail: [email protected]
Performance evaluation of sedimentation followed by constructed wetlands for drainage water treatment
Mahmoud Nasr1,* and Sayed Ismail2
1Department of Sanitary EngineeringAlexandria University
Alexandria 21544, Egypt2Department of Public Works
Ain Shams University Cairo 11517, Egypt
Key Words: Constructed wetlands, modeling, nutrient transformation, polluted drain water, removal efficiency
ABSTRACT
Performance of a constructed wetland utilized to improve the water quality in “Bahr El-Baqar” drain was evaluated. The drain is located on the north-eastern edge of the Nile Delta, which receives a mixture of domestic and agricultural discharges. The treatment system consists of two sedimentation units followed by ten constructed wetlands operated as free water surface flow basins. The drain discharges its water into “El-Manzala” Lake, which has fishing activities and connects to the Mediterranean Sea. Results showed that, at an organic loading of 2,800 kg BOD (biological oxygen demand) d-1, treatment facilities achieved overall removals: 75 ± 3% (BOD), 57 ± 5% (chemical oxygen demand, COD), 78 ± 2% (suspended solids), 50 ± 5% (NH4) and 44 ± 8% (total P). Profiles of basins revealed that, due to natural aeration at the water surface (shallowness) and from the roots of the plants, dissolved oxygen (DO) levels gradually increased from 1.0 ± 0.1 to 6.5 ± 0.7 mg L-1. At a hydraulic retention time (HRT) of 60 h, the wetlands were able to reach the allowable limits in the Law 48/1982 for DO (> 4 mg L-1), BOD (< 40 mg L-1) and COD (< 80 mg L-1) after 60% of their longitudinal length. Ordinary differential equations were implemented to model the biological process occurring in the wetlands. It was observed that the simulated results tracked the measured data well, and the stoichiometric parameters were: YH = 0.45 mg VSS mg-1 BOD, YA = 0.26 mg COD mg-1 N, and YN = 0.06 mg N mg-1 COD. The model predicted that operating the basins at HRT of 73 h, removal of NH4 will be enhanced by 24%. At this condition, the effluent NH4 is allowable for adequate discharge according to Law 48/1982 (NH4-N < 3.0 mg L-1).
INTRODUCTION
In Egypt, the high population growth rate along with the limitation of water supplies has caused severe problems in the water quality and quantity. As a result, Egypt has been reported as one of the most water-stressed ten countries in the world [1]. The annual share of fresh water resources per-capita in Egypt is now about 800 m3, and it is expected to drop to about 600 m3 per person-year by 2025 [2]. Additionally, limited amount of rainfall makes the country highly dependent on the Nile River and underground aquifers, which are
also subjected to unpredicted seasonal fluctuations. In this context, there is a crucial need to explore all viable options for conserving current water resources, as well as finding new alternatives to cope with the projected water scarcity problem [3].
Great efforts have been directed towards reutilization of drainage water in the agricultural production process [4]. This is due to agriculture being the primary consumer of water in Egypt, which requires up to 85% of total water resources. Unfortunately, Egyptian drains receive large quantities of partially treated or untreated domestic and industrial wastewater.

Nasr and Ismail, Sustain. Environ. Res., 25(3), 141-150 (2015)
other words, there is a contribution among wetland plants, soils, and associated microorganisms to remove contaminants from wastewater. These natural activities are accomplished without mechanical components or external energy supply. Several types of constructed wetlands are designed for handling different types of wastewater. According to the water flow regime, they are classified into either free water surface flow or subsurface flow [15]. Free water surface flow wetlands allow water to flow above ground (i.e., exposed to the atmosphere and sunlight), and are classified into floating plants, submerged plants or emergent plants [6]. On the other hand, subsurface flow wetlands are designed to keep the water level below the surface of the filter bed. Subsurface-flow wetlands can be further classified based on flow direction as horizontal flow (parallel to the surface) or vertical flow (down through the filter layer towards a drainage system at the bottom) [16]. Each of the mentioned categories employs different layout, media plants, design criteria and flow pattern. For example, free water surface wetlands can be operated as intermittent flow, with a fill and decant phases, or as continuous wastewater discharges. Moreover, each type has its own distinct advantages and disadvantages. For example, subsurface wetlands have the ability to avoid the mosquito problems of free water surface wetlands [17]. In this context and due to flexibility of operation, constructed wetlands can be employed as a sustainable solution for treatment of drainage water.
Therefore, this study aims at evaluating a constructed wetland named Lake “El-Manzala” engineered wetland to improve the water quality in “Bahr El-Baqar” drain. The drain receives a mixture of domestic and agricultural discharges. The system layout consists of three lifting pumps and two sedimentation basins followed by ten constructed wetlands (free surface slow). The gathered data, during the period August-October are used to (1) investigate the plant performance, (2) demonstrate pollutants profile along the wetland longitudinal length, and (3) develop a mathematical modeling. The treated effluent is compared to allowable limits listed in Law 48/1982.
MATERIALS AND METHODS
1. Wastewater Characteristics
“Bahr El-Baqar” drain, located at the north-eastern edge of the Nile Delta, is the source of the polluted water used during the study. Due to the high portion of agricultural drainage water, the concentrations of pollutants in the influent were relatively low. Table 1 lists the measured properties of the raw wastewater
This contamination causes a serious deterioration in the dissolved oxygen (DO) levels of drains that has threatened their reuse [5]. In this regard, several projects have been implemented for remediation, treatment and/or reuse of drainage water. For example, constructed wetland in “El-Manzala” was projected to treat 25,000 m3 d-1 from “Bahr El-Baqar” drain [6]. After treatment, the major portion of water is used for irrigation, while the remaining is diverted into basins designed for fish farming. In “El-Salam” Canal project, 2 billion m3 of drainage water from “Bahr Hadous” and Lower “Serw” drains is mixed with 2 billion m3 of fresh water from the Nile River (at Damietta branch). The project provides the water to irrigate 92,500 ha in the Eastern Nile Delta and 168,000 ha in Sinai. Similarly, “Umoum” project reuses 1 billion m3 of drainage water to irrigate 82,000 ha in “Nubaria” after mixing with fresh water. The source for water reuse for the project is from the discharge from three sub-catchments of “Umoum” drain; i.e., “Abu-Hummus”, “Shereshra” and “Truga”.
Remedia t ion of dra inage water has been classified as being physical, chemical, and biological methods [7]. Researches on using aeration as a main procedure showed enhancement of microbial growth to improve the water quality [8]. On the other hand, the bioremediation has been advanced rapidly since 1990 for degradation of contaminants in the environment [9]. Bioremediation with aquatic plants has been developed, where water pollutants are removed or fixed through adsorption, absorption, accumulation and degradation by the plants [10]. Additionally, aquatic animals were used to remediate the eutrophicated water, and adjust the structure of nutrition through changing the composition and density of fish [11].
In order to reduce the treatment cost and the complexity of operation, a simple treatment method known as “constructed wetland” has been developed particularly in the past 20 years [12]. Constructed wetlands simulate the processes occurring in nature in order to improve the treatment capacity [13]. These systems are suitable for rural communities and villages. In constructed wetlands, treatment performance is achieved through an integrated combination of physical, chemical and biological interactions [6]. These processes can be occurred sequentially or simultaneously. Organic pollutants are broken down as a substrate source for the wide variety of microorganisms that dwell in the soil and plants. Other contaminants such as heavy metals are removed by filtration, adsorption as well as uptake by plant, algae and bacteria. Metals entering wetlands as insoluble suspended solids are separated from the water column via sedimentation and sorption [14]. In
142
Nasr and Ismail, Sustain. Environ. Res., 25(3), 141-150 (2015)
quality in the drain. The C/N/P ratio was approximately 30/2/1 indicating unbalanced nutritional needs of microorganisms for an adequate biological treatment process [18]). The high N and P species were most fertilizers through agricultural activities. High BOD/COD ratio of 0.81 demonstrates the presence of high portion of biodegradable matter due to dumping of domestic wastewater in the drain.
2. Plant Layout Description
Layout of the lake “El-Manzala” wetland project and a schematic diagram of the wastewater flow pattern are displayed in Fig. 1. The full capacity of the facility understudy is 25,000 m3 d-1. The intake consists of three lifting screw pumps (one standby), each has a capacity of 12,500 m3 d-1. Firstly, the flow is discharged from “Bahr El-Baqar” drain, in continuous operation, to two sedimentation basins with a total surface area equals to 54,000 m2. Each clarifier treats 12,500 m3 d-1, with a nominal design hydraulic retention time (HRT) of 78 h. Subsequently, the primary effluent is distributed via a channel and pipes to ten wetland beds. The basins were designed as free water surface flow to provide adequate treatment and enhance water quality. Each bed has a surface area of 12,500 m2 (250 m length
and 50 m width) with an average depth of 0.5 m and 1% slope along the basin. Percentages of coverage are: Phragmites australis (30%), Typha (30%), other species (15%) and an open surface (25%) to allow for sunlight penetration. Each wetland is subjected to daily 2,500 m3 (i.e., 200 L m2 d-1). After that, part of the treated effluent (4,000 m3 d-1) is reused for hatchery ponds followed by fingerling ponds. The remaining portion is dumped into the drain. The drain discharges its water into “El-Manzala” Lake, which has many fishing activities, and connects to the Mediterranean Sea. Main characteristics of the treatment plant including sedimentation basins and constructed wetlands are listed in Table 2.
3. Mathematical Modeling Procedure
Model simulation and parameter estimation were performed using MATLAB® software. A set of ordinary differential equations was integrated in one M-file, and accessed by SIMULINK through the S-function block. The M-file task is to program detail of the biological process, as well as to define the number of input, output, parameters and initial states. The S-function block is like a black box; giving the input and parameters to it, the output will be generated. Model
Table 1. Characteristics of water quality in "Bahr El-Baqar" drain
Parameters (mg L-1) Carbon content Nitrogen species TP DO TSSCOD BOD NH4-N NO3-N TKNAverage 138 112 8.0 0.3 12.3 5.0 1.6 145
Standard deviation 10 7 0.8 0.0 3.9 0.7 0.2 9Allowable limit* 80 40 3 - - 1 4 50
*According to Law 48/1982COD: Chemical oxygen demand; BOD: Biochemical oxygen demand; TKN: Total Kjeldahl Nitrogen; TSS: Total suspended solids
Fig. 1. a) Layout of the lake “El-Manzala” wetland project and b) schematic diagram of wastewater flow.
143

Nasr and Ismail, Sustain. Environ. Res., 25(3), 141-150 (2015)
calibration is accomplished when selecting the optimal values of the stoichiometric and kinetic parameters. In the model, soluble and particulate components are denoted S and X, respectively. The active biomass is divided into two types of organisms: heterotrophic biomass (XH) and autotrophic biomass (XA). Monod kinetics were assumed for bacterial growth.
4. Analysis
Different parameters were measured along the wetland basins to assess the removal efficiency of various contaminants. The analysis covered chemical oxygen demand (COD), biochemical oxygen demand (BOD), total suspended solids (TSS), ammonium, nitrate, and total phosphorus (TP). All the analyses were determined according to Standard Methods [19]. On-line parameters were periodically measured in the field, such as; temperature, pH, and DO. The plant was monitored for 90 d from August to October, 2013. Samples were gathered from the inlet and outlet of the treatment units, in addition to different locations along the wetland length. The effluent was compared with the Egyptian standards of water quality in agricultural drains (Law 48/1982).
RESULTS AND DISCUSSION
1. Dissolved Oxygen Variation
As shown in Fig. 2, the influent DO concentrations were 1.2-1.9 mg L-1 during the study period. Due to residence of the water in sedimentation basins for a long retention time (up to 78 h) with no aeration, the DO levels remained approximately 0.8-1.2 mg L-1. However, the final value of DO discharged from wetlands was 6.5 ± 0.7 mg L-1. A highly significant difference of DO levels between inlet and outlet of the treatment plant was observed. The wetland basins showed good performance in enhancing the DO concentration. The shallowness of the basins, as well as natural aeration at the water surface and from the roots of the plants introduces oxygen into the water [6].
The existence of enough DO in the wetlands assured the aerobic environment for the aerobic biochemical processes. Similar results were reported by Sharma et al. [20], who emphasized the key role of aquatic plants (such as macrophytes) for release of oxygen in the rhizosphere, resulting in improving aerobic condition within the treatment bed.
2. Reduction of Organic Matter
As displayed in Fig. 2, concentrations of raw BOD are fluctuated between 103 and 128 mg L-1, while the variation of COD was 124-151 mg L-1. Sedimentation basins achieved BOD and COD reductions of 19% and 13%, respectively. Subsequently, the influent organic matters to the wetlands were BOD (90 ± 4 mg L-1) and
Table 2. Main characteristics of the treatment plant stagesSediment
basin (1st stage)
Constructed wetland
(2nd stage)Area (m2) 27,000 12,500Depth (m) 1.5 0.5q (m3 d-1) 12,500 2,500Number 2 10HRT (h) 78 60HLR (L m-2 d-1) 463 200OLR (kg BOD ha-1 d-1) - 180
OLR: organic loading rate
0
1
2
3
4
5
6
7
8
9
0 15 30 45 60 75 90
DO
(mg
L-1)
0
20
40
60
80
100
120
140
0 15 30 45 60 75 90
BO
D (m
g L-1
)
0
20
40
60
80
100
120
140
160
180
0 15 30 45 60 75 90
TSS
(mg
L-1)
Time (d)
Raw drain Sedimentation Constructed wetlands
Fig. 2. Variation of DO, BOD and TSS for the treatment plant stages during the study period (August- October, 2013).
144

Nasr and Ismail, Sustain. Environ. Res., 25(3), 141-150 (2015)
COD (121 ± 5 mg L-1). The final treated BOD recorded 27 ± 3 mg L-1, corresponding to an overall removal efficiency of 75 ± 3%. Similar trends were observed for COD, where final effluent contains 60 ± 5 mg L-1 (i.e., total elimination of 56 ± 5%). The wetlands were able to eliminate organics because they support a wide range and diverse population of bacteria that grow on the submerged roots and stems of aquatic plants [14,21]. Additionally, the plant succeeded to obtain the required levels in the Law 48/1982 (i.e., below 40 mg BOD L-1 and 80 mg COD L-1). Those results are compared to a study be Vymazal and Kröpfelová [22] who demonstrated removal of BOD and COD of 95 and 84%, respectively. Their work employed a three-stage constructed wetland system consisting of saturated vertical-flow bed, free-drained vertical-flow bed and horizontal-flow bed in series. Moreover, Gikas and Tsihrintzis [16] observed mean removal efficiencies of 96% for BOD and 94% for COD using a small-size vertical flow constructed wetland for on-site treatment of household wastewater. However, results of different studies may be difficult to interpret because pre-treatment, substrate, vegetation, and climatic conditions vary widely among the sites.
3. Removal of TSS
The raw TSS values ranged 129-161 mg L-1 throughout the entire study (Fig. 2). The effluent from sedimentation basins composed of 68 ± 2 mg L-1; equivalent to an average removal of 50-56%. This demonstrates the function of the primary treatment for TSS removal, crucial for avoiding clogging of the bed media in the following wetlands. The final TSS dropped to 32 ± 2 mg L-1 in the treated effluent which is accepted according to the Law 48/1982 (i.e., lower than 50 mg L-1). Low water velocities in the wetland basins in addition to the presence of vegetation encourage entrapment and filtration of particulate matters [22]. Thus, the elimination of solids in the wetlands was efficient showing a total TSS removal of 78 ± 2%. Solids build up is one of the major operational and maintenance issue associated with the application of wetlands for wastewater treatment. Knowles et al. [17] reviewed clogging problems in the wetlands that can ultimately limit the lifetime of the system.
4. Transformation of Nitrogen Species
The average value of raw NH4-N in the drain was about 6.6-9.1 mg L-1. The effluent NH4-N from sedimentation basins was slightly elevated to 8.1 ± 0.6 mg L-1 (Fig. 3). It was suggested that NH4 increased due to ammonification of organic nitrogen. However,
due to nitrification and ammonia adsorption processes occurred in the wetlands, the final NH4-N significantly dropped to 3.9 ± 0.3 mg L-1 (total removal = 50 ± 5%). Generally, the transformation of nitrogen species can be accomplished by biological (i.e., ammonification, nitrification, denitrification, plant uptake, biomass assimilation, dissimilatory nitrate reduction), and physic-chemical routes (e.g., volatilization, and adsorption) Additionally, the presence of plants is necessary in enhancing nitrification as they provide surfaces and oxygen for the growth of aerobic microorganisms in the rhizosphere. Accordingly, wetlands were effective not only for the removal of organic matters and TSS but also for nitrification. The NH4-N mass removal rate is 836 ± 127 mg m-2 d-1.
Nitrate levels increased from 0.3 ± 0.0 mg L-1 in the influent to 5.0 ± 0.4 mg L-1 in the effluent (Fig. 3). The fact that no nitrate removal occurred in the wetland could be attributed to the lack of enough carbon source
Fig. 3. Variation of NH4-N, NO3-N and TP for the treatment plant stages during the study period (August-October, 2013).
0.01.02.03.04.05.06.07.08.09.0
10.0
0 15 30 45 60 75 90
NH
4-N
(mg
L-1)
0.0
1.0
2.0
3.0
4.0
5.0
6.0
7.0
0 15 30 45 60 75 90
NO
3-N
(mg
L-1)
0.0
1.0
2.0
3.0
4.0
5.0
6.0
7.0
0 15 30 45 60 75 90
TP (m
g L-1
)
Time (d)
Raw drain Sedimentation Constructed wetlands
145

Nasr and Ismail, Sustain. Environ. Res., 25(3), 141-150 (2015)
necessary for heterotrophic bacteria to accomplish the denitrification reaction. The wetlands were efficient only for NH4 removal; and thus no significant TN elimination was observed. Similar observations were found by Ayaz et al. [12] who showed that lack of organic content resulted in reduced denitrification in an integrated constructed wetland system treating medium strength wastewater from a pilot-scale intensive fish farm. However, the presence of nitrates in the final effluent is not of great concern because there is no required range for this parameter in the Law 48/1982. Different trend was found by Chang et al. [13] who recorded mass removal rates of 762 and 820 mg m-2 d-1 with elimination of 56 and 55% for nitrate and TN, respectively. The opposite results might be due to applying different scheme of integrated vertical-flow constructed wetland systems.
5. Trends of TP
As demonstrated in Fig. 3, the overall TP removal efficiency was 44 ± 8% with residual of 2.8 ± 0.3 mg L-1. The presence of vegetations can efficiently remove TP because it is readily available for plant uptake [24]. It has long been recognized that growth metabolism of vegetation in wetlands is a significant reason for TP removal [25]. Additionally, the uptake and metabolism of nutrient by the bacteria present in the system, promotes further TP removal. The microbial activity can be enhanced because plants create appropriate conditions by increasing the surface area in the water, as well as oxygenation of the environment around the roots. Accordingly, the role of vegetation and oxygen in phosphorus removal might be dominant. Unfortunately, the complexity of phosphorus removal mechanisms is not quite clear. Those results corresponded to an average mass removal rate of 484 ± 92 mg TP m-2 d-1. Similarly, Kantawanichkul et al. [14] observed that the average mass removal rate for TP at a HLR (hydraulic loading rate) of 80 mm d-1 was 690 mg m-2 d-1. The study investigated the ability of vertical flow constructed wetland systems to treat high-strength wastewater under tropical climatic conditions.
The presence of wetlands as a polishing stage is a viable solution because the discharge of nutrients to the receiving water bodies is of a great concern. Excessive accumulation of nutrients can lead to ecological imbalances that may cause overgrowth of plants and animals, leading to water eutrophication. Ammonia may consume DO in natural waters by way of microbial nitrification reactions. Additionally, high levels of the unionized ammonia species are toxic to fish and other aquatic life. Nitrites and nitrates are known to be toxic for aquatic animals and hazardous to
human health, primarily related to carcinogenesis [26].
6. Profile of Pollutants along the Wetland Length
The effect of wetland length on pollutants removal was investigated. The DO levels increased along longitudinal length being highest at the effluent side with an average value of 6.5 mg L-1. The wetlands were able to reach the allowable limits in the Law 48/1982 (i.e., 4 mg L-1) after 150 m from the beginning of basins. The plant use light as an energy source, water as electron donor, and CO2 as a carbon source, which results in the release of O2 [6]. As displayed in Fig. 4, the low concentration of DO at the inlet was corresponding to the high organic matter expressed as BOD and COD. By introducing wastewater to the basins, microorganisms consume the carbonaceous matter needed for living, growth and reproduction. As a result, the organics were gradually decreased along the length of the beds to reach the required levels in the
0
1
2
3
4
5
6
7
8
0 50 100 150 200 250
DO
(mg
L-1)
0
20
40
60
80
100
0 50 100 150 200 250
BO
D (m
g L-1
)
01020304050607080
0 50 100 150 200 250
TSS
(mg
L-1)
Distance (m)
Field data Range Allowable limit (Law 48/1982)
Fig. 4. Profiles of DO, BOD and TSS along the wetland longitudinal length.
146
Nasr and Ismail, Sustain. Environ. Res., 25(3), 141-150 (2015)
Law 48/1982 at lengths from the inlet of approximately 150 m. By increasing the contact time, the basins provide the ability for further degradation of organic substances. Those results indicate that, the length of bed could be minimized to about 150 m to achieve the allowable low limits for organic matter removal.
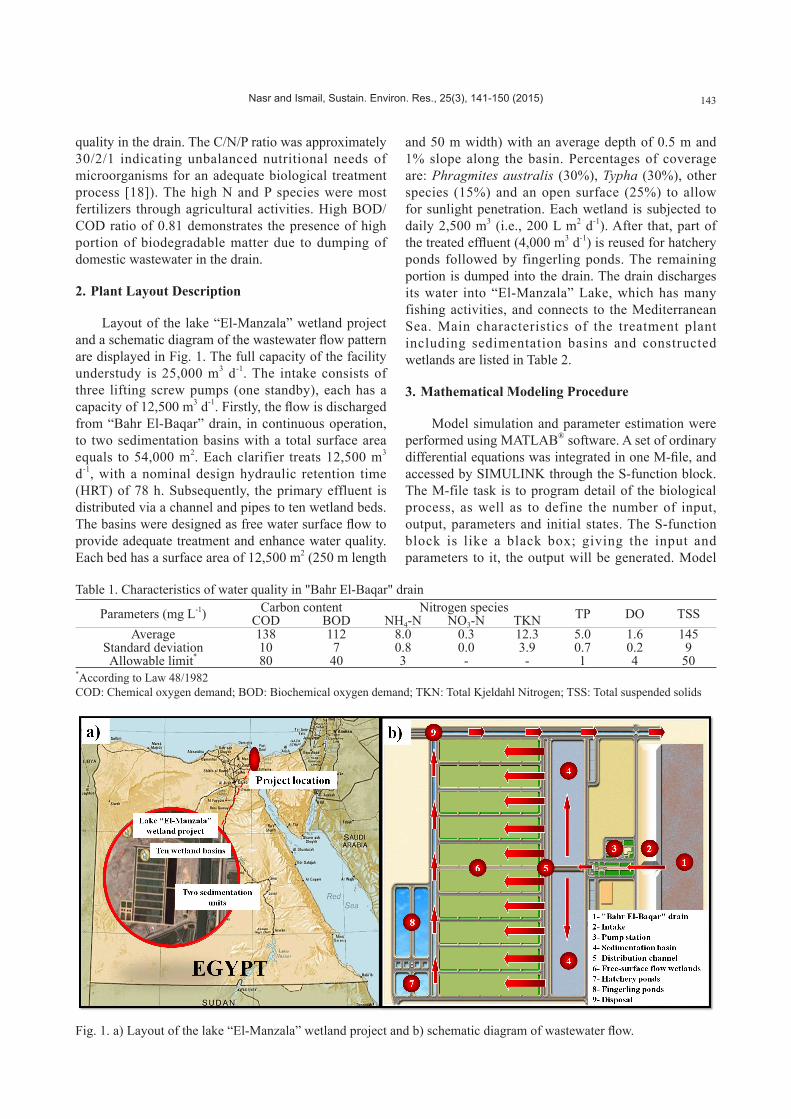
As shown in Fig. 5, similar trends were observed for NH4 removal, because travelling of wastewater through the beds provides chance for more conversion of the nitrogen species. On the contrary, nitrates concentrations detected in the inlet were low at 0.3 mg L-1, and then rose gradually until reaching its highest value to about 4.6-4.7 mg L-1 at the end. That might be because the carbon source especially at the final part of the basins (expressed as BOD) was not sufficient for heterotrophic bacteria to accomplish the denitrification reaction. However, it was mentioned that the growth of algae could lead to consumption of nitrate, according to the reaction. Unfortunately, the total length of 250
m failed to achieve the limits in Law 48/1982 for the NH4-N level (i.e., < 3 mg L-1) and TP concentration (i.e., < 1 mg L-1).
7. Model Development and Parameters Estimation
Modeling reflects the physicochemical and biological processes taking place within the constructed wetlands. Growth of heterotrophic biomass (j1) is formulated in Eq. 1. A fraction of readily biodegradable substrate (SS) is used for the growth of XH. Ammonia nitrogen (SNH) is incorporated into cell mass as the nitrogen source for synthesis. This process is generally the main contributor to the production of new biomass and removal of BOD.
where
Biodegradable soluble organic nitrogen (SNS) is converted to SNH in a first-order process mediated by the active XH. The Ammonification of organic nitrogen (j2) is expressed in Eq. 2.
Aerobic growth of autotrophic bacteria (j3) is
expressed by Eq. 3. SNH is oxidized to nitrate resulting in the production of XA, where a part of SNH is incorporated into the autotrophic cells.
where
Based on the above description, observed conversion rates of BOD can be formulated by Eq. 4.
The model assumed that NH4 removal, as expressed by Eq. 5, was undertaken by (i) heterotrophic growth with aerobic oxidation of the organic matter and consumption of ammonium (j1), and (ii) autotrophic nitrification through oxidation of ammonium to nitrate (j3). This mechanism resulted in formation of nitrate species as expressed by Eq. 6. However, the model neglected the existence of algae in the basins, and their role in consumption of nitrate for growth. Moreover,
0
1
2
3
4
5
6
7
8
9
10
0 50 100 150 200 250
NH
4-N
(mg
L-1)
0
1
2
3
4
5
6
0 50 100 150 200 250
NO
3-N
(mg
L-1)
0
1
2
3
4
5
6
7
0 50 100 150 200 250
TP (m
g L-1
)
Distance (m)
Field data Range Allowable limit (Law 48/1982)
Fig. 5. Profiles of NH4-N, NO3-N and TP along the wetland longitudinal length.
(1)
(2)
(3)
(4)11 j
YS
HS ⋅−=
147

Nasr and Ismail, Sustain. Environ. Res., 25(3), 141-150 (2015)
because of its uncertain biological degradation mechanism and kinetics, phosphorus removal was not incorporated in the model.
Model calibration was progressed by estimating the optimal values of the stoichiometric and kinetic parameters of the mathematical model. Literature data ranges were used to set upper and lower bounds for parameter values. The estimated values are listed in Table 3. As shown in Fig. 6, the model provides a comprehensive description of the organic removal processes that take place within constructed wetlands (p: 0.0812). Moreover, it was observed that the model can simulate the wetland behaviour for nitrogen transformation (p: 0.0945 for NH4, and p: 0.0000 for NO3), where a satisfactory agreement with the field measurements was observed.
In order to get benefits from the estimated parameters, the model was further used to modify the current basin characteristics. In this regard, the mathematical equations were re-calculated at HRT of 73 h (instead of 60 h). In this scenario, the observed wastewater constituents were modified, where removal of BOD and NH4 enhanced by 16 and 24%, respectively. Currently, the treated effluent of NH4 is allowable for adequate discharge according to Law 48/1982 (NH4-N < 3.0 mg L-1). Increasing the HRT inside the beds provides the ability for further degradation of organic and nutrient matters. This condition resulted in elevating the removal efficiency of contaminants, although it requires more land area.
The results of this study can be compared to previous observations. Ávila et al. [24] observed mean overall removal efficiencies of 97% (TSS), 78% (COD), 91% (BOD), 94% (NH4), 46% (TN) and 4% (PO4-P) using vertical flow beds followed by horizontal subsurface and free water surface wetlands in series. Moreover, El-Sheikh et al. [6] demonstrated that percentages of removal for the different contaminants were BOD: 52%, COD: 50%, TSS: 87%, NH4: 66% and PO4: 52%, using free water surface constructed wetlands.
CONCLUSIONS
In sight of the water scarcity scenario and stringent regulations, this study aimed at evaluating the remediation of “Bahr El-Baqar” drain, which receives
a mixture of domestic and agricultural discharges. The treatment units, composed of sedimentation basins followed by constructed wetlands, were able to eliminate organics to be adequately disposed according to Law 48/1982. However, final concentrations of nitrogen species and TP remained unacceptable. Based on the simulated model, increasing the HRT from 60 to 73 h, would enhance the removal of BOD and NH4-N by 16 and 24%, respectively. Currently, the treated effluent of NH4 is allowable for discharge according to Law 48/1982 (NH4-N < 3.0 mg L-1).
The obtained stoichiometric and kinetic values could be applied for the design and simulation of full-scale artificial constructed wetlands subjected to domestic and agricultural drainage. Additionally, the estimated parameters can be used to modify the current basin characteristics designed for substrate and nitrogen species removal. Moreover, it is suggested to
(5)
(6)
Fig. 6. Field data and model predictions for the BOD, NH4-N and NO3-N.
0
10
20
30
40
50
60
70
80
90
0 15 30 45 60 75 90
S S(m
g L-1
)
0
1
2
3
4
5
6
7
8
0 15 30 45 60 75 90
NH
4-N
(mg
L-1)
0
1
2
3
4
5
6
7
8
0 15 30 45 60 75 90
NO
3-N
(mg
L-1)
Time (d)
Actual data Simulated resultsPredicted at HRT = 73 h
148

Nasr and Ismail, Sustain. Environ. Res., 25(3), 141-150 (2015)
study a partial bypass from the sedimentation basin to the final parts of wetlands to provide organic matters for denitrification capacity; and that will be the focus of our future work.
ACKNOWLEDGEMENT
This work was supported by the Sanitary Engineer- ing Department, Faculty of Engineering, Alexandria University, Egypt.
REFERENCES
1. Khalil , B., T.B.M.J. Ouarda, A. St-Hilaire and F. Chebana, A statistical approach for the rationalization of water quality indicators in surface water quality monitoring networks. J. Hydrol., 386(1-4), 173-185 (2010).
2. El-Kady, M. and F. El-Shibini, Desalination in Egypt and the future application in supplementary irrigation. Desalination, 136(1-3), 63-72 (2001).
3. Sorour, M.H., N.M.H. El Defrawy and H.F. Shaalan, Treatment of agricultural drainage water via lagoon reverse osmosis system. Desalination, 152(1-3), 359-366 (2003).
4. Abdel-Azim, R.A., Agricultural Drainage Water in Egypt: Evaluation of Current Practices and a Vision of the Future Development. Ph.D. Dissertation, Cairo University, Egypt (2000).
5. Talaat, H.A., M.H. Sorour, N.A. Rahman and H.F. Shaalan, Pretreatment of agricultural drainage water (ADW) for large-scale desalination. Desalination, 152(1-3), 299-305 (2003).
6. El-Sheikh, M.A., H.I. Saleh, D.E. El-Quosy and A.A. Mahmoud, Improving water quality in polluted drains with free water surface constructed wetlands. Ecol. Eng., 36(10), 1478-1484 (2010).
7. Wu, W.Z., Y. Liu, Q. Zhu, C.J. Wei and J.L. Wang, Remediation of polluted river water by biological contact oxidation process using two types of carriers. Int. J. Environ. Pollut., 38(3), 223-234 (2009).
8. Xu, W., B. Yuan, S.Y. Sun and Y.C. Zhu, Progress of water pollution remediation techniques in city and town river. J. Guangdong Univ. T., 21(4), 85-90 (2004) (in Chinese).
9. Nasr, M., M. Moustafa, H. Seif and G. El-Kobrosy, Application of fuzzy logic control for Benchmark simulation model.1. Sustain. Environ. Res., 24(4), 235-243 (2014).
10. Sato, K., H. Sakui, Y. Sakai and S. Tanaka, Long-term experimental study of the aquatic plant system for polluted river water. Water Sci. Technol., 46(11-12), 217-224 (2002).
11. Wang, J., X.D. Liu and J. Lu, Urban river pollution control and remediation. Procedia Environ. Sci., 13, 1856-1862 (2012).
12. Ayaz, S.C., O. Aktas, N. Findik, L. Akca and C. Kinaci, Effect of recirculation on nitrogen removal in a hybrid constructed wetland system. Ecol. Eng., 40, 1-5 (2012).
13. Chang, J.J., S.Q. Wu, Y.R. Dai, W. Liang and Z.B. Wu, Nitrogen removal from nitrate-laden wastewater by integrated vertical-flow constructed wetland systems. Ecol. Eng., 58, 192-201 (2013).
14. Kantawanichkul, S., S. Kladprasert and H. Brix, Treatment of high-strength wastewater in tropical vertical flow constructed wetlands planted with Typha angustifolia and Cyperus involucratus. Ecol. Eng., 35(2), 238-247 (2009).
15. Bassi, N., M.D. Kumar, A. Sharma and P. Pardha-Saradhi, Status of wetlands in India: A review of extent, ecosystem benefits, threats and management strategies. J. Hydrol. Regional Stud., 2, 1-19
Table 3. Stoichiometric and kinetic parameter estimated values
Parameter* Expression Units Simulated Value Literature Value
KS saturation constant for substrate in heterotrophicgrowth
mg BOD L-1 75 25-100 [18]
KNHN saturation constant for ammonium in heterotrophic growth
mg N L-1 0.01 0.01 [27]
KNH saturation constant for nitrification mg N L-1 2.2 0.2-2 [27]Ka ammonification rate constant L mg-1 COD d-1 0.6 0.00016-0.7 [18]YH BOD yield for heterotrophic biomass mg VSS mg-1 BOD 0.45 0.45 [28]YA yield for autotrophic biomass mg COD mg-1 N 0.26 0.240 [29]YN nitrogen yield for heterotrophic biomass mg N mg-1 COD 0.06 0.071 [29] k20 maximum specific growth rate for heterotrophic
biomass at 20 °Cd-1 1.00 0.213 [29]
k15 maximum specific growth rate for autotrophicbiomass at 15 °C
d-1 0.028 0.01-0.47 [30]
θ dimensionless temperature coefficient for heterotrophic growth
- 1.01 1-1.135 [30]
*The time consumed to complete the simulating progress was 0:00:36; PC memory: 2.00 GB RAM.
149

Nasr and Ismail, Sustain. Environ. Res., 25(3), 141-150 (2015)
(2014).16. Gikas, G.D. and V.A. Tsihrintzis, A small-size
vertical flow constructed wetland for on-site treatment of household wastewater. Ecol. Eng., 44, 337-343 (2012).
17. Knowles, P., G. Dotro, J. Nivala and J. Garcia, Clogging in subsurface-flow treatment wetlands: Occurrence and contributing factors. Ecol. Eng., 37(2), 99-112 (2011).
18. Metcalf and Eddy, Wastewater Engineering: Treatment and Reuse. 4th Ed., McGraw-Hill, New York (2012).
19. APHA, Standard Methods for the Examination of Water and Wastewater. 21st Ed., American Public Health Association, Washington, DC (2005).
20. Sharma, G., Priya and U. Brighu, Performance analysis of vertical up-flow constructed wetlands for secondary treated effluent. APCBEE Procedia, 10, 110-114 (2014).
21. Bu i , X .T. , L .T. Le , P.D . Nguyen and C . Visvanathan, Industrial wastewater reuse by airlift external membrane bioreactor. Sustain. Environ. Res., 24(1), 41-47 (2014).
22. Vymazal, J. and L. Kröpfelová, A three-stage experimental constructed wetland for treatment of domestic sewage: First 2 years of operation. Ecol. Eng., 37(1), 90-98 (2011).
23. Nasr, M., A. Elreedy, A. Abdel-Kader, W. Elbarki and M. Moustafa, Environmental consideration of dairy wastewater treatment using hybrid sequencing batch reactor. Sustain. Environ. Res., 24(6), 449-456 (2014).
24. Ávila, C., M. Garfí and J. García, Three-stage hybrid constructed wetland system for wastewater treatment and reuse in warm climate regions. Ecol.
Eng., 61, 43-49 (2013).25. Abou-Elela, S.I., G. Golinielli, E.M. Abou-Taleb
and M.S. Hellal, Municipal wastewater treatment in horizontal and vertical flows constructed wetlands. Ecol. Eng., 61, 460-468 (2013).
26. Nasr, M.S., M.A.E. Moustafa, H.A.E. Seif and G. El Kobrosy, Modelling and simulation of German BIOGEST/EL-AGAMY wastewater treatment plants - Egypt using GPS-X simulator. Alexandria Eng. J., 50(4), 351-357 (2011).
27. Gujer, W., M. Henze, T. Mino and M. van Loosdrecht, Activated sludge model No. 3. Water Sci. Technol., 39(12), 183-193 (1999).
28. Rittmann, B.E. and P.L. McCarty, Environmental Biotechnology: Principles and Applications. McGraw-Hill, New York, 394-415 (2001).
29. Galanopoulos, C., E. Sazakli, M. Leotsinidis and G. Lyberatos, A pilot-scale study for modeling a free water surface constructed wetlands wastewater treatment system. J. Environ. Chem. Eng., 1(4), 642-651 (2013).
30. Painter, H.A. and J.E. Loveless, Effect of temperature and pH value on the growth-rate constants of nitrifying bacteria in the activated-sludge process. Water Res., 17(3), 237-248 (1983).
Discussions of this paper may appear in the discus-sion section of a future issue. All discussions should be submitted to the Editor-in-Chief within six monthsof publication.
Manuscript Received: December 14, 2014Revision Received: January 16, 2015
and Accepted: March 16, 2015
150
![[1] 1 2 5 6 15 a 15 a Q) ¥33, ¥33, 000. - 000. - 000. - 15 14 29 04 51 16 53 53 00 17 50 56 08 50 00 40 15 46 09 18 00 09 35 141 141 141 141 141 141 141 141 141 141 141 141 54 49](https://img.pdfslide.us/doc/110x75/5f09a6d27e708231d427dc4e/1-1-2-5-6-15-a-15-a-q-33-33-000-000-000-15-14-29-04-51-16-53-53.jpg)
![141 Chapter 3 - Shodhgangashodhganga.inflibnet.ac.in › bitstream › 10603 › 19076 › 10 › 10_chapt… · 141 Chapter 3 [1, 2-a] pyridin-3-yl] methanol Imp-5 Imp-7 3.2 Literature](https://img.pdfslide.us/doc/110x75/5f0306ab7e708231d4072ba4/141-chapter-3-a-bitstream-a-10603-a-19076-a-10-a-10chapt-141-chapter.jpg)


![[XLS] · Web view3 138 0 138 129 9 0 138 0 138 3 103 0 103 0 103 0 103 0 103 3 84 0 84 0 84 0 84 0 84 3 40 0 40 38 2 40 0 40 0 3 141 0 141 0 141 0 141 0 141 3 106 0 106 0 106 0 106](https://img.pdfslide.us/doc/110x75/5ab1efb97f8b9a7e1d8d05a0/xls-view3-138-0-138-129-9-0-138-0-138-3-103-0-103-0-103-0-103-0-103-3-84-0-84.jpg)