Embed Size (px)
Citation preview

IN DEGREE PROJECT INFORMATION AND COMMUNICATION TECHNOLOGY,SECOND CYCLE, 30 CREDITS
, STOCKHOLM SWEDEN 2017
Performance Evaluation of Non-commercial LTE Network For Smart Grid Application
Modification of IEC 61850-90-5 Protocol stack and its Testing over Non-commercial LTE
RAJENDRA BOGATI
KTH ROYAL INSTITUTE OF TECHNOLOGYSCHOOL OF INFORMATION AND COMMUNICATION TECHNOLOGY


Modification of IEC 61850-90-5Protocol stack and its Testing over
Non-commercial LTEModification of IEC 61850-90-5 Protocol stack and its
Testing over Non-commercial LTE
Rajendra BogatiAugust 2017
The thesis work was carried out in cordinationABB Corporate Research Centre
Vasteras, Sweden
Examiner: Professor Dr. Ahmed HemaniSchool of ICTKTH Royal Institute of Technology
Supervisor: Dimitrios StathisSchool of ICTKTH Royal Institute of Technology
Dr. Gargi BagSenior ScientistABB Corporate Research Centre
TRITA-ICT-EX-2017:175KTH Royal Institute of TechnologySchool of Information and Communication Technology


Acknowledgement
The dissertation describes the master thesis project conducted in cooperation with ABB at ABBCorporate Research in Västerås, Sweden.
First and foremost, I express my humble gratitude to the Almighty for the strength he has givenme throughout my life.
I would like to thank Mr. Linus Eriksson who was a part of this project and who has con-tributed to the success of this project. I would also like to thank ABB Corporate Research forgiving me the opportunity to work on this project. Many thanks to my supervisor Dr. GargiBag, Scientist, ABB Corporate Research Centre for all her help, guidance, support and feedbackthroughout the project. Many thanks to Mr. Linus Thrybom and Mr. Morgan E. Johansson forproviding useful documents and giving the right direction to solve the problem. Special thanks tomy colleague Deep, Monika, Camila, Huang, Mattias, Hamze, Sayed and all other thesis workersat ABB Corporate Research Centre for their wonderful company and kind help to solve problemthat came across while working on my thesis and stay at Västerås
Many thanks to my examiner Prof. Dr. Ahmed Hemani, Department of Electronic Systems,KTH Royal Institute of Technology for all the support and feedback whenever I need it. I amparticularly grateful to Dimitrios Stathis for his valuable feedback and suggestion on writing thereport.
I am always thankful to my family for their everlasting love and support. Special thanks toall my friends who supported and inspired me when I need them. I won’t accomplish this withouttheir kind support.
Rajendra BogatiStockholmAugust 2017

Abstract
The introduction of smart grid technology has changed the way traditional power grid networkfunction. It made the grid structure more dynamic by enhancing electrical usage managementcapability. Also, it has increased the scope to enhance communication infrastructure in a smartgrid structure. The current smart grid solution is based on IEC 61850 architecture where theexchange of information between the electrical utilities is over the fast Ethernet LAN connection.This communication mechanism is fast, efficient but lacks scalability, flexibility and less susceptibleto failure. Also, earlier technical paper from IEC 61850 standard was for communication within asubstation.
Wide Area Monitoring Protection and Control implementation which utilizes coherent real timesynchrophasor information would play a vital role in realizing the utility physical status. IEC61850-90-5, a new technical report from International Electrotechnical Commission provides themechanism to transmit and receive the synchrophasor information using the advance IP protocolover a wireless communication infrastructure for WAMPAC application. IEC 61850-90-5 provide away to exchange routable synchrophasor information over public IP network such as LTE, WiMax,WLAN, etc. Out of all the available wireless solution, LTE provides high flexibility, distance cov-erage, data rate with low latency and hence can play an important role in replacing the existingcommunication structure in a smart grid.
The thesis work evaluates the performance and applicability of LTE for smart grid communi-cation. An IEC 61850-90-5 communication model utilizing UDP/IP protocol to transmit andreceive data over the LTE network was developed from the open source project. The modifiedmodel was used to benchmark the performance of LTE. Different communication metrics such asreliability, availability, latency, and throughput was evaluated to benchmark the performance ofLTE for time critical smart grid application. The metrics were measured for different packet sizesand transmission rates combination.
The result shares some interesting findings on the readiness of LTE for smart grid solution. Itis concluded that cellular network can play an important role in realizing communication infras-tructure in a smart grid application.


Contents
Abstract i
List of Figures v
List of Tables vii
Abbreviations ix
1 Introduction 11.1 Motivation . . . . . . . . . . . . . . . . . . . . . . . . . . . . . . . . . . . . . . . . 11.2 Scope of thesis . . . . . . . . . . . . . . . . . . . . . . . . . . . . . . . . . . . . . . 21.3 Related Work . . . . . . . . . . . . . . . . . . . . . . . . . . . . . . . . . . . . . . . 2
1.3.1 Performance of LTE for Smart Grid Application . . . . . . . . . . . . . . . 21.3.2 Performance Evaluation of Smart Grid Communications via Network Simu-
lation Version 3 . . . . . . . . . . . . . . . . . . . . . . . . . . . . . . . . . . 31.3.3 Performance Evaluation of Cellular Communication System for Machine-to-
Machine Smart Grid Application . . . . . . . . . . . . . . . . . . . . . . . . 31.3.4 Work Related to Routable GOOSE and SV Transmission . . . . . . . . . . 4
1.4 Thesis outline . . . . . . . . . . . . . . . . . . . . . . . . . . . . . . . . . . . . . . . 4
2 Background 52.1 Electric Power System . . . . . . . . . . . . . . . . . . . . . . . . . . . . . . . . . . 52.2 Smart Grid Tecnhology . . . . . . . . . . . . . . . . . . . . . . . . . . . . . . . . . 7
2.2.1 Architecture of Smart Grid . . . . . . . . . . . . . . . . . . . . . . . . . . . 72.2.2 Technology requirement for Smart Grids . . . . . . . . . . . . . . . . . . . . 8
2.3 Substation Automation System . . . . . . . . . . . . . . . . . . . . . . . . . . . . . 82.3.1 Communication in SAS . . . . . . . . . . . . . . . . . . . . . . . . . . . . . 10
2.4 IEC 61850 . . . . . . . . . . . . . . . . . . . . . . . . . . . . . . . . . . . . . . . . . 102.4.1 IEC61850 Series Outline . . . . . . . . . . . . . . . . . . . . . . . . . . . . . 112.4.2 IEC 61850 Data Modeling . . . . . . . . . . . . . . . . . . . . . . . . . . . . 132.4.3 IEC 61850 Service and Data Mapping to Communication Protocols . . . . . 142.4.4 Generic Object Oriented Substation Event . . . . . . . . . . . . . . . . . . . 152.4.5 Sample Value . . . . . . . . . . . . . . . . . . . . . . . . . . . . . . . . . . . 16
2.5 Synchrophasor Technology . . . . . . . . . . . . . . . . . . . . . . . . . . . . . . . . 162.6 TR IEC 61850-90-5 . . . . . . . . . . . . . . . . . . . . . . . . . . . . . . . . . . . . 17
2.6.1 Data Modeling in IEC 61850-90-5 . . . . . . . . . . . . . . . . . . . . . . . 18
iii

2.6.2 Communication Scheme . . . . . . . . . . . . . . . . . . . . . . . . . . . . . 192.6.3 IEC 61850-90-5 services . . . . . . . . . . . . . . . . . . . . . . . . . . . . . 212.6.4 Routed-Sample Value Profile Mapping . . . . . . . . . . . . . . . . . . . . . 22
2.6.4.1 Route-SV A-Profile . . . . . . . . . . . . . . . . . . . . . . . . . . 222.6.4.2 Routed-SV T-Profile . . . . . . . . . . . . . . . . . . . . . . . . . . 28
3 Wireless Communication Perfomance Metrics 313.1 Wireless Communication . . . . . . . . . . . . . . . . . . . . . . . . . . . . . . . . . 31
3.1.1 Long Term Evolution . . . . . . . . . . . . . . . . . . . . . . . . . . . . . . 313.1.2 Communication Requirement in IEC 61850-90-5 . . . . . . . . . . . . . . . 32
3.1.2.1 Network Throughput . . . . . . . . . . . . . . . . . . . . . . . . . 323.1.2.2 Latency or Transfer time . . . . . . . . . . . . . . . . . . . . . . . 333.1.2.3 Reliability . . . . . . . . . . . . . . . . . . . . . . . . . . . . . . . 343.1.2.4 Availability . . . . . . . . . . . . . . . . . . . . . . . . . . . . . . . 35
4 Implementation And Testing 374.1 Design and Implementation of IEC 61850-90-5 Protocol Stack . . . . . . . . . . . . 37
4.1.1 IEC 61850-90-5 Standalone Application Control flow . . . . . . . . . . . . . 384.1.2 Synchrophasor Data Encoding in R-SV packet . . . . . . . . . . . . . . . . 404.1.3 IEC 61850 Timestamping . . . . . . . . . . . . . . . . . . . . . . . . . . . . 41
4.2 Test Methodology . . . . . . . . . . . . . . . . . . . . . . . . . . . . . . . . . . . . 424.2.1 Setup Overview . . . . . . . . . . . . . . . . . . . . . . . . . . . . . . . . . . 42
4.2.1.1 Environmental Setup . . . . . . . . . . . . . . . . . . . . . . . . . 424.2.1.2 Time Synchronization Setup . . . . . . . . . . . . . . . . . . . . . 43
4.2.2 Test Model . . . . . . . . . . . . . . . . . . . . . . . . . . . . . . . . . . . . 434.2.2.1 Control Flow . . . . . . . . . . . . . . . . . . . . . . . . . . . . . . 434.2.2.2 Configuration File . . . . . . . . . . . . . . . . . . . . . . . . . . . 45
4.2.3 Test Cases . . . . . . . . . . . . . . . . . . . . . . . . . . . . . . . . . . . . . 464.2.3.1 Test Case To Measure Throughput . . . . . . . . . . . . . . . . . . 464.2.3.2 Test Case To Measure Latency . . . . . . . . . . . . . . . . . . . . 464.2.3.3 Test Case To Measure Reliability . . . . . . . . . . . . . . . . . . . 474.2.3.4 Test Case To Measure Availability . . . . . . . . . . . . . . . . . . 47
4.2.4 Data Analysis and Extraction . . . . . . . . . . . . . . . . . . . . . . . . . . 48
5 Result And Analysis 495.1 Result . . . . . . . . . . . . . . . . . . . . . . . . . . . . . . . . . . . . . . . . . . . 49
5.1.1 Throughput . . . . . . . . . . . . . . . . . . . . . . . . . . . . . . . . . . . . 495.1.2 Latency . . . . . . . . . . . . . . . . . . . . . . . . . . . . . . . . . . . . . . 495.1.3 Reliability . . . . . . . . . . . . . . . . . . . . . . . . . . . . . . . . . . . . . 515.1.4 Availability . . . . . . . . . . . . . . . . . . . . . . . . . . . . . . . . . . . . 52
6 Conclusion and Future Work 55
References 60
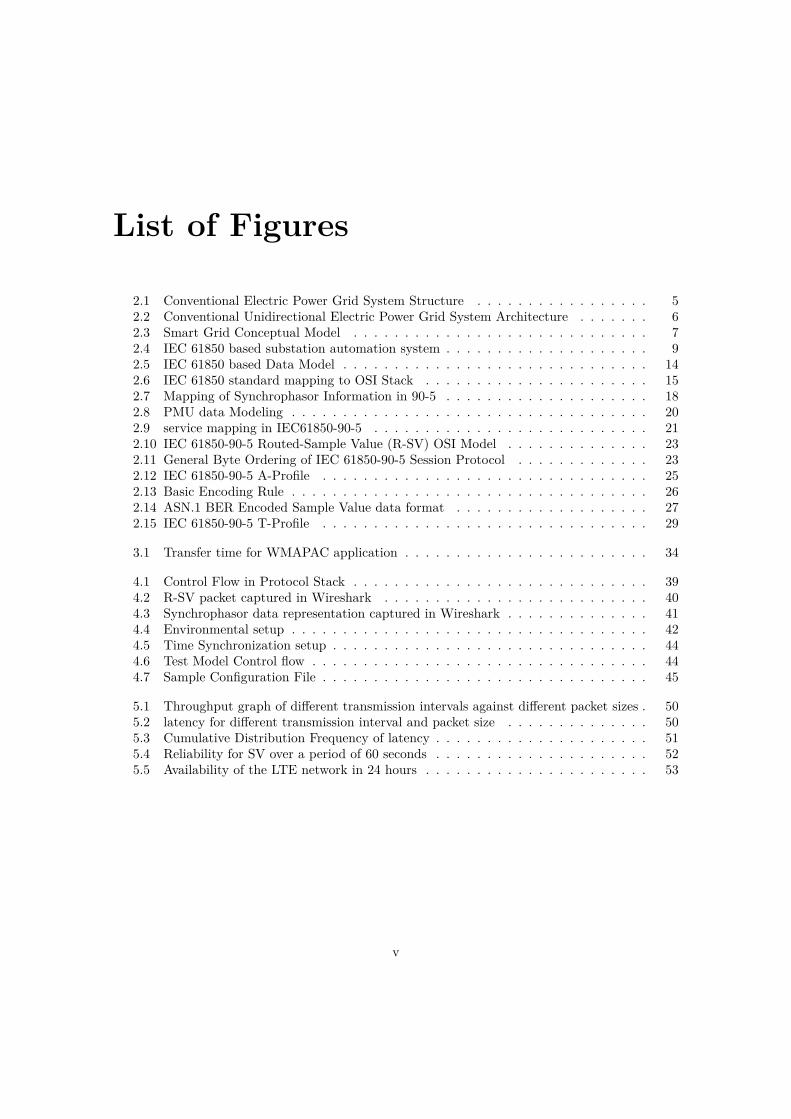
List of Figures
2.1 Conventional Electric Power Grid System Structure . . . . . . . . . . . . . . . . . 52.2 Conventional Unidirectional Electric Power Grid System Architecture . . . . . . . 62.3 Smart Grid Conceptual Model . . . . . . . . . . . . . . . . . . . . . . . . . . . . . 72.4 IEC 61850 based substation automation system . . . . . . . . . . . . . . . . . . . . 92.5 IEC 61850 based Data Model . . . . . . . . . . . . . . . . . . . . . . . . . . . . . . 142.6 IEC 61850 standard mapping to OSI Stack . . . . . . . . . . . . . . . . . . . . . . 152.7 Mapping of Synchrophasor Information in 90-5 . . . . . . . . . . . . . . . . . . . . 182.8 PMU data Modeling . . . . . . . . . . . . . . . . . . . . . . . . . . . . . . . . . . . 202.9 service mapping in IEC61850-90-5 . . . . . . . . . . . . . . . . . . . . . . . . . . . 212.10 IEC 61850-90-5 Routed-Sample Value (R-SV) OSI Model . . . . . . . . . . . . . . 232.11 General Byte Ordering of IEC 61850-90-5 Session Protocol . . . . . . . . . . . . . 232.12 IEC 61850-90-5 A-Profile . . . . . . . . . . . . . . . . . . . . . . . . . . . . . . . . 252.13 Basic Encoding Rule . . . . . . . . . . . . . . . . . . . . . . . . . . . . . . . . . . . 262.14 ASN.1 BER Encoded Sample Value data format . . . . . . . . . . . . . . . . . . . 272.15 IEC 61850-90-5 T-Profile . . . . . . . . . . . . . . . . . . . . . . . . . . . . . . . . 29
3.1 Transfer time for WMAPAC application . . . . . . . . . . . . . . . . . . . . . . . . 34
4.1 Control Flow in Protocol Stack . . . . . . . . . . . . . . . . . . . . . . . . . . . . . 394.2 R-SV packet captured in Wireshark . . . . . . . . . . . . . . . . . . . . . . . . . . 404.3 Synchrophasor data representation captured in Wireshark . . . . . . . . . . . . . . 414.4 Environmental setup . . . . . . . . . . . . . . . . . . . . . . . . . . . . . . . . . . . 424.5 Time Synchronization setup . . . . . . . . . . . . . . . . . . . . . . . . . . . . . . . 444.6 Test Model Control flow . . . . . . . . . . . . . . . . . . . . . . . . . . . . . . . . . 444.7 Sample Configuration File . . . . . . . . . . . . . . . . . . . . . . . . . . . . . . . . 45
5.1 Throughput graph of different transmission intervals against different packet sizes . 505.2 latency for different transmission interval and packet size . . . . . . . . . . . . . . 505.3 Cumulative Distribution Frequency of latency . . . . . . . . . . . . . . . . . . . . . 515.4 Reliability for SV over a period of 60 seconds . . . . . . . . . . . . . . . . . . . . . 525.5 Availability of the LTE network in 24 hours . . . . . . . . . . . . . . . . . . . . . . 53
v


List of Tables
2.1 IEC 61850 series Outline . . . . . . . . . . . . . . . . . . . . . . . . . . . . . . . . . 122.2 New Added Series of IEC 61850 . . . . . . . . . . . . . . . . . . . . . . . . . . . . . 132.3 Different Security Option in 90-5 . . . . . . . . . . . . . . . . . . . . . . . . . . . . 192.4 IEEE C37.118.2 Command Frame Equivalent in IEC 61850-90-5 . . . . . . . . . . 22
4.1 Time Quality Definition . . . . . . . . . . . . . . . . . . . . . . . . . . . . . . . . . 42
vii


Abbreviations
2G Second Generation.
3G Third Generation.
3GPP 3rd Generation Partnership Project (3GPP).
4G Fourth Generation.
5G Fifth Generation.
A-Profile Application Profile.
ABB ASEA Brown Boveri.
AC Alternating Current.
ACSI Abstract Communication Service Interface.
AES Advanced Encryption Standard.
AMI Advanced Metering Infrastructure.
APDU Application Protocol Data Unit.
BER Basic Encoding Rule.
CDC Common Data Class.
CDF Cumulative Distribution Function.
CT Current Transformer.
DC Direct Current.
DCU Data Concentrator Unit.
DER Distributed Energy Resource.
DG Distributed Generation.
EPC Evolved Packer Core.
ix

FACTS Flexible AC Transmission Systems.
GDOI Group Domain of Interpretation.
GOOSE Generic Object Oriented Substation Event.
GSE Generic Substation Event.
GSM Global System for Mobile Communications.
GSSE Generic Substation State Event.
HMAC Hashed Message Authentication Code.
HMI Human Machine Interaction.
IDE Integrated Development Environment.
IEC International Electrotechnical Commission.
IED Intelligent Electronic Device.
IGMPv3 Internet Group Management Protocol version 3.
IP Internet Protocol.
KDC Key Distribution Center.
LAN Local Area Network.
LTE Long Term Evolution.
LTE-SAE Long Term Evolution -System Architecture Evolution.
M2M Machine-to-Machine.
MIMO Multiple-Input Multiple-Output.
MMS Manufacturing Message Specification.
MPLS Multi Protocol Label Switching.
MU Merging Unit.
OFDM Orthogonal Frequency Division Multiplexing.
OSI Open Source Interconnect.
PDC Phasor Data Concentrators.
PLC Power Line Communication.
PMU Phasor Measurement Unit.
pps packet per second.
Page x
PT Power Transformer.
R-GoCB Routed- Goose Control Block.
R-GOOSE Routed- Generic Object Oriented Substation Event.
R-MSVCB Routed Multicast Sample Value Control Block.
R-SV Routed- Sample Value.
RFC request For Comment.
ROCOF Rate Of Change Of Frequency.
RTT Round-Trip-Time.
SAS Substation Automation System.
SC-FDMA Single Carrier Frequency Division Multiple Access.
SCADA Supervisory Control And Data Acquisition.
SCL Substation Configuration Language.
SCMS Specific Communication Service Mapping.
SDH Synchronous Digital Hierarchy.
SISCO System Integration Specialist Com-pany.
SONET Synchronous Optical Networking.
SPDU Session Protocol Data Unit.
SV Sampled Value.
SVCB Sampled Value Control Block.
T-Profile Transport Profile.
TCP Transmission Control Protocol.
TLV Tag Length Value.
TSDU Transport Session Data Unit.
UCA Utility Communication Architecture.
UDP User Datagram Protocol.
UMTS Universal Mobile Telecommunications System.
UTC Coordinated Universal Time.
WAMPAC Wide Area Monitoring Protection and Control.
WLAN Wireless LAN.
Page xi


1 | Introduction
Electrical power network has transformed rapidly over the past few decade. The introduction ofsmart technology has revolutionized the conventional power grid structure from uni-directionalpower flow to bi-directional power flow system and made the grid structure more distributed, dy-namic and even more complex. This has increased the need for robust communication systembetween different smart grid equipment for control, monitoring, and protection application.
Wide Area Monitoring Protection and Control application can be realized through synchropha-sor information exchange. IEEE C37.118 standard provides the way to measure and exchangesynchrophasor information [1], [2]. But it suffers the interoperability and security issues. On theother hand, IEC 61850 provides a standard solution for inter-operability and security issue. IEC61850 is the first series of the standard which basically describes the way of exchanging IEC relatedinformation within a substation. It cannot be used for inter-substation communication. Hence, anew technical report was required that helps in exchanging synchrophasor information based onIEC 61850 standard.
Technical report IEC 61850-90-5 is prepared by International Electrotechnical Commissiontechnical committee 57 and provides the way to exchange the synchrophasor information betweendifferent smart grid equipment and outside a substation in IEC 61850 context [3]. It makes useof Internet Protocol protocol to transmit/receive synchrophasor data between two devices usingpublic IP networks such as 4G and 5G.
1.1 MotivationThere have been several electrical disturbance event over the past few years and from the study,it was realized that synchrophasor information can be useful in preventing such great electricalblackout [4]. The efficient communication system is required to exchange this useful synchrophasorinformation within and outside the substation. The existing communication system lacks the flex-ibility and redundancy in case of electrical failure. Cellular technology like Long Term Evolutionand 5G has evolved and matured a lot over the past few years and can be a suitable solution tostrengthen the communication infrastructure in a smart grid operation.
IEC 61850-90-5 propose to use the advanced Internet Protocol along with multicast and en-hanced security feature mentioned in IEC 62351 to create a routable synchrophasor traffic thatcan be exchanged using any wireless communication. WAMPAC application has to meet the com-munication requirement of availability, For the choice of wireless communication to be used forWAMPAC application, have to meet requirements related to latency, reliability and availability
1

of the different applications in power grids. While the severity of the requirements varies fromapplication to application, there will be additional requirements related to redundancy, time syn-chronization, security and coverage.
LTE is a high speed all IP wireless communication system used for mobile communication. LTEoffers high bandwidth, enhanced security, high reliability, and low latency for time-critical traffic.It can be a potential solution to replace the existing smart grid communication infrastructure.
1.2 Scope of thesisThe scope of the work was to study the applicability of LTE in smart grid communication for timecritical application. Synchrophasor data were created, mapped into Routed- Sample Value profileand transmitted in LTE infrastructure. Overall the thesis was divided into two major task.
The first task includes the development of complete IEC 61850-90-5 protocol stack. This workincludes the creation of synchrophasor data, encapsulating the data into UDP/IP protocol andforming a R-SV profile data. In addition to that, different counters and functions were imple-mented to facilitate the measurement of important communication parameters.
The second part includes identifying the important communication metrics to benchmark thecommunication system applicability. Four different parameter latency, reliability, throughput, andavailability were identified and was measured. A test and measurement framework was createdduring the course of the thesis work to analyze the performance of 90-5 protocol in an LTE envi-ronment.
In order to finish the thesis work in provided time, the work was mainly focused on imple-menting the synchrophasor data as IEC 61850-90-5 services. The security aspect of the data wasnot considered and is being left for future work. The performance result for both Routed- SampleValue and Routed- Generic Object Oriented Substation Event shows almost similar result and sinceR-SV are used for transmitting stream of synchrophasor information, the report only includes theresult from R-SV calculation.
The non-commercial LTE network used for the thesis work is called as LTE-evolution. It wasprovided by an external project partner and hence the architecture of LTE network is not describedin this report.
1.3 Related WorkThe innovation in wireless and cellular communication has gained the interest of researcher tounderstand its applicability in smart grid application. Many researchers has worked in utilizingwireless communication for smart grid automation application that is explained in the followingsubsection.
1.3.1 Performance of LTE for Smart Grid ApplicationThe author in [5] has investigated the performance of LTE in combination with IEC 61850 andMMS for smart grid automation application like Advanced Metering Infrastructure and remotecommunication application. Two set one for each application i.e. remote monitoring and smart
Page 2

metering was studied. The simulation was verified to check the latency and priority requirementsatisfaction in both the application.
The remote communication model was MMS client-server based that uses LTE for communi-cation infrastructure. Additionally, MAC scheduling was used to prioritize the IEC packet. TwoMAC scheduling mechanisms are supported; Round Robin (RR) and Priority-aware Round Robin(PrioRR). The smart metering application smart meter entity and MDMS Host entity. And also,only Also, only the RR MAC scheduler was used for the experiment.
The work was simulated using network simulator-3 (ns-3) tool. Various communication pa-rameter like reliability, throughput, and latency was calculated to evaluate LTE performance forautomation application. The result shows LTE satisfy the performance requirement for both theapplication. The simulation results indicated that LTE can be integrated with IEC 61850 MMSto satisfy the performance requirements on smart metering and remote control communicationservices in smart grid distribution networks.
1.3.2 Performance Evaluation of Smart Grid Communications via Net-work Simulation Version 3
In [6], the author has evaluated the performance Zigbee, Wi-Fi and LTE for smart grid com-munication between Data Concentrator Unit and Advance Metering Infrastructure (AMI). Theinvestigation of smart grid communication between Data Concentrator Units (DCU)s and Ad-vanced Metering Infrastructure (AMI) separates the simulation results into two sections. Firstly,the maximum distance for data transmission between DCU and AMI devices is compared to threewireless technologies. Secondly, the performance of ZigBee in different smart grid situations.
The authors describe smart grid technologies and communication frameworks such as DLMS/-COSEM which is a protocol that can be utilized as an interface to gather power consumption databetween DCUs and AMIs. One of the interesting result presented in the paper was the coveragedistance of all three communication protocol. LTE has 4 times better coverage distance than theother two wireless protocol (Wi-Fi and Zigbee).
1.3.3 Performance Evaluation of Cellular Communication System forMachine-to-Machine Smart Grid Application
The author in [7] has simulated the performance of GSM (2G), UMTS (3G) and LTE (4G) forMachine-to-Machine communication in smart grid application. The M2M communication setupused for the experiment make use of internet and cellular network for smart grid communication.The utilities in home make use of internet while the utilities far ahead uses the public internet totransmit and receive the packets.
The experiment measures different performance metrics like data rates, RTT and jitter tocheck the suitability of cellular communication for M2M smart grid communication. The paperconcludes. that LTE has the least latency of 70 ms which can be used for less demanding smartgrid application.
Page 3

1.3.4 Work Related to Routable GOOSE and SV TransmissionOther studies on LTE performance for smart grid application is mentioned in [8]. In this measure-ment, GOOSE and SV packet were encapsulated in IP packet using specialize router. RTT wasmeasured in the research work. The research work shows the RTT is less than 100 ms which couldbe useful for less time critical smart grid application.
The work in [9] shows the exchange of synchrophasor information between PMU. The workwas implemented in a specialized library Khorjin which is used to receive and parse synchrophasordata from IEEE C37.118.2 based PMU/Phasor Data Concentrators, map it to the IEC 61850 datamodel and further transmit it as Routed- GOOSE (R-GOOSE) or Routed-Sample Value (R-SV)services.
The previous work in LTE as a smart grid communication solution shows LTE could play avital role in smart grid communication extension. Most of the LTE performance related work issuitable for less time demanding application. Mapping of IP routable packet directly over theLTE network helps in reducing the latency and thereby increasing the scalability and reliabilityof the networking infrastructure. The performance evaluation of routable smart grid packet suchas synchrophasor data over non-commercial LTE has never been done before. The main work ofthe thesis work is to benchmark LTE performance for directly mapped synchrophasor informationbased in IEC 61850-90-5 protocol.
1.4 Thesis outlineChapter 2, provides the comprehensive background to understand the key concept explained in thisthesis work. This chapter provides a short explanation about smart grid architecture, substationautomation system, IEC 61850 and IEC 61850-90-5 protocol.
Chapter 3, defines and explains the different performance metrics used to benchmark wirelesscommunication system are introduced and explained in this chapter.
Chapter 4, describes design, implementation and testing method of IEC 61850-90-5 in the tar-geted platform in combination with LTE network is explained.
Chapter 5, presents the result of the thesis work.
Chapter 6, discusses the finding of the work and the future work to enhance the performance.
Page 4

2 | Background
This chapter presents background study on electric power system, smart grid technology andSubstation Automation System. In addition to that it includes a detailed study of IEC 61850standard and IEC 61850-90-5 standard.
2.1 Electric Power System
The electrical power industry has limited or no capacity to store the generated electricity [10].Hence the generated power needs to be transported from the remote generation station to theend consumers. The electrical power industry deploys an electrical power system to transfer thegenerated powers. An electrical power system consists of electrical machines, lines, and way totransfer the power over a longer distance. It is also referred to as electrical grid or a power network[11].
The electric grid is a network of interconnected electrical equipment deployed to supply, transferand use electrical power. An electrical grid is a complex system and is broadly divided into threemajor sub-systems as shown in the Figure 2.1:
• Generation subsystem
• Transmission subsystem
• Distribution subsystem
Figure 2.1: Conventional Electric Power Grid System Structure from [12]
5

The generation subsystem consists of generators and steps up transformers. The generator isa 3-phase Alternating CurrentAC (Alternating Current) generator that generates the power andthe step-up transformer converts power to high voltages. This high voltage power is feed on thetransmission subsystem and transmitted over a long distance till the load center. At the load cen-ter, the voltage is stepped down and fed to the distribution system that distributes the electricalpower to nearby residence and industries [13].
Challenges of Electric Power System
The consumption of electricity is steadily increasing over the past few years. EIA recently re-leased International Energy Outlook 2013 project estimates the consumption of electricity wouldincrease 56% by 2040 [14]. The present electrical structure has not been changed for over 100years and is not suited to meet the need of 21st century [15]. It lacks automated analysis, highresponsive mechanical switches, real-time analysis tools, etc [16].
Also the introduction of Distributed Generation which provides the flexibility to add renewableenergy source at distribution level makes the grid structure more complex. The introduction ofenergy storage equipment at the different level in power grid makes it more and more dynamic.The market-driven requirement has increased the need for control and protection application forgridd automation.
The introduction of SCADA [17] system which is an automated control and enhanced commu-nication system helped to address some of its challenges. It provides the flexibility to monitor thebehavior to track any major electrical disturbances in the grid network. It also ensures properoperation and security of the generation and the transmission system. But the distribution or thefeeder network is still passive with little or limited control as shown in the Figure 2.2. This hasbeen the major threat to the current grid structure and it requires an immediate attention. Thenext generation of power system, so called as Smart Grid helps in helps in solving this problemand has revolutionized the way the electric power system has been realized in the past [16].
Figure 2.2: Conventional Unidirectional Electric Power Grid System Architecture [18]
Page 6

2.2 Smart Grid TecnhologyThe smart grid is a next-generation electric power grid structure that offers higher efficiency, betterreliability and more secured energy transfer. It combines the energy generated from both renewableand alternative energy sources, using an automated control and modern communications technolo-gies [19].
There is no single definition of smart grid technology. The European Technology Platformdefines in [20] the Smart Grid as
”An electricity network that can intelligently integrate the actions of all users connected to it –generators, consumers and those that do both in order to efficiently deliver sustainable, economicand secure electricity supplies.”
2.2.1 Architecture of Smart GridSmart grid does not have a single architecture and most of the literature uses the NIST conceptualmodel architecture as defined in [21]. It divides the smart grids into seven major domains as: Cus-tomers, Markets, Service Providers, Operations, Bulk Generation, Transmission and Distribution.Each domain communicates securely with each other as shown by the solid lines in figure 2.3.
Figure 2.3: Smart Grid Conceptual Model [21]
Each domain has its own actors and applications. An actor is a device, system or a program
Page 7

that takes a decision of what information needs to be exchange to perform a particular application.While, applications are the task performed by one or more actor in a domain. To enable SmartGrid functionality, an actor in one domain particularly interact with an actor from the other do-main.
The conceptual model is a high-level perspective of the smart grid. It is just a way to understandthe operation of smart grid but does not provide any information on smart grid implementation.
2.2.2 Technology requirement for Smart GridsTo fulfill the requirements of smart grid, in [22] following technologies are introduced to be devel-oped and implemented:
1. Information and Communication Technologies that include
• The communication technologies like– 802 series like Ethernet LAN, Wireless LAN, WiMAX, etc.– Mobile Communication like 3G, LTE, etc.– Multi Protocol Label Switching– Power Line Communication
• The information exchange technologies like– Standard for smart metering– Modbus– DNP3– IEC 61850
2. Sensing, measurement, control and automation technologies that include
• Intelligent Electronic Device for advanced protection, measurement and event recording• Phasor Measurement Unit (PMU) and Wide Area Monitoring, Protection and Control
(WAMPAC) for higher security• Integrated sensors, measurements, control and automation systems and information and
communication technologies• Measuring technology like Synchrophasor
3. Power electronics and energy storage technologies that includes
• High Voltage DC (HVDC) transmission and back-to-back schemes and Flexible ACTransmission Systems for long distance transport and integration of energy source
• Different power electronic interfaces and power electronic supporting devices to provideefficient connection of renewable energy sources and energy storage devices
2.3 Substation Automation SystemThe electrical substation is a subsidiary station in an electric grid that is used for controlling, mon-itoring and protection of the power equipment [23]. According to [24] [25], an electrcial substationis divided into 4 different types as:
Page 8

1. Switchyard substation which is at the generating substation and connects the generator sub-system to the utility grid.
2. Customer substation that connects the power to different business application.
3. System substation that transforms the power across the network grid.
4. Distribution substation that transfers power from the transmission system to the distributionsystem of an area.
The substation is an important element of the modern power grid network [23]. It connectsmany systems. To ensure uninterrupted and smooth operation of the power network, different sub-station needs to share basic variable information like Bus voltages and frequencies, line loading,transformer loading, power factor, real and reactive power flow, temperature, etc. between eachother. A Substation Automation System (SAS) process the information collected from differentpower equipments and perform the action accordingly. It controls, monitor and protect all devicesin a substation [26].
The Substation Automation System connects and integrates the number of devices into a func-tional array for monitoring, controlling, and configuring the substation. Modern SAS structurehas 3 basic level as shown in the figure 2.4:
Figure 2.4: IEC 61850 based Substation Automation System Architecture [18]
The station level includes Human Machine Interaction , Station Computer, etc. and are locatedin a shielded control room. The bay level is the middle layer is located close to the switchgear. Baylevel includes different protection and control IEDs (intelligent electrical devices). The equipmentsin between these 2 layers are often referred to as secondary equipment. Process level is the lastlevel that interface the SAS and the switchgear. Switchyard equipment (also primary equipment)such as CTs/Power Transformers, remote I/O, actuators, merging units, etc. are included in thislevel [23] [26] .
Page 9

2.3.1 Communication in SASCommunication plays a critical role in implementing an end-to-end and two-way open commu-nication grid infrastructure in a real-time system such as power network [27]. Over 50 differentcommunication protocols like DNP3, LON, EthernetIP, OPC-DA, etc have been used in the pastand present. The Communication standard is based on communication architecture in an SA sys-tem. It defines the way of encoding, decoding and sharing the electrical parameters between thecontrol centers, IEDs and other communication equipment. The communication standard usuallyconsists of a data link protocol, physical layer protocol with one or more application layer protocolrunning on top of TCP/IP.
The selection of communication protocol is based on the bandwidth, reliability and latencyrequirement of the link. The author in paper [23] categories these communication protocols in 3broad categories:
• Proprietary/vendor specification, e.g. UCA and DNP3, etc.
• National standard, e.g. IEEE 1613, etc.
• International standard, e.g. IEC 60870-5-101/104, IEC 60870-6-TASE.2, IEC 61850, etc
Most of these technologies were vendor specific and have low bandwidth, limited network de-vices applicability, serial interface, etc. Also, the communication model has limited to station andbay level communication as in case of DNP3 and IEC 60870-5-104 protocol. These protocols are notsuited for corporate communication technology and are not able to expand the network reachability.
To address these issue, IEC introduced the IEC 61850 standard which is high-speed ethernetbased standard. It is used for communication between all three level in all modern SA systemas shown in figure 2.4. It defines two communication bus namely station and process bus forexchange of information. Station bus provides the communication link between station and baylevel. Process bus exchanges the time-critical information between the bay and process level [23].
2.4 IEC 61850IEC 61850 is a communication networks and systems standard for power utility automation. It isdeveloped by IEC Technical Committee 57 Working Groups 10 [28]. IEC 61850 is based on thework by Utility Communication Architecture 2.0. It defines vendor independent communicationstandard for uninterrupted operation of different types IEDs that includes the breaker/switch IED,Merging Unit IED, and protection & control (P & C) IED [29]. The main aim of the standardwas to create an international standard for communication within a substation.The main featureof this standards are:
• It defines a common naming conventional called as data model for easy information manage-ment in a substation.
• It provides Abstract Communication Service Interface that makes its application and databaseunchanged when communication and media changes.
• It standardize a Substation Configuration Language to describe the data model and config-uration of IEDs from different vendors.
• It provides TCP/IP based communication model over an Ethernet.
Page 10

• It defines two communication network bus (process and station bus) to minimize the hard-wiring within a substation.
2.4.1 IEC61850 Series OutlineThe standard is divided into 10 parts as shown in the table 2.1.
Series Title Edition PublicationIEC 61850-1 Part 1: Communication networks and sys-
tems in substations - Introduction andoverview
1 28-Apr-03
IEC 61850-2 Communication networks and systems insubstations - Part 2: Glossary
1 07-Aug-08
IEC 61850-3 Communication networks and systems insubstations - Part 3: General requirements
2 12-Dec-13
IEC 61850-4 Communication networks and systems insubstations - Part 4: System and projectmanagement
2 11-Apr-11
IEC 61850-5 Communication networks and systems insubstations - Part 5: Communication re-quirements for functions and device models
2 30-Jan-13
IEC 61850-6 Communication networks and systems insubstations - Part 6: Configuration descrip-tion language for communication in electricalsubstations related to IEDs
2 17-Dec-09
IEC 61850-7 Communication networks and systems insubstations - Basic communication structure
IEC 61850-7-1 Principles and models 2 15-Jul-11
EC 61850-7-2 Abstract Communication Service Interface(ACSI)
2 24-Aug-10
IEC 61850-7-3 Common Data Classes 2 16-Dec-10
IEC 61850-7-4 Compatible Logical Node classes and data2.0 classes
2 31-Mar-10
IEC 61850-7-410 Hydroelectric power plants - Communication2.0 for monitoring and control
2 30-Oct-12
IEC 61850-7-420 Distributed energy logical nodes 1 10-Mar-09
IEC 61850-8 Communication networks and systems insubstations - Specific Communication Ser-vice Mapping (SCSM)
IEC 61850-8-1 Mapping to MMS (ISO 9506-1 and ISO 9506-2) and to ISO/IEC 8802-3
2 17-Jun-11
IEC 61850-9 Communication networks and systems insubstations - Specific Communication Ser-vice Mapping (SCSM)
Continued on next page
Page 11

Series Title Edition PublicationIEC 61850-9-2 Sampled Values over ISO/IEC 8802-3 2 22-Sep-
11IEC 61850-10 Part 10: Communication networks and sys-
tems for power utility automation - Confor-mance testing
2 14-Dec-12
Table 2.1: IEC 61850 series Outline
The first part of the IEC 61850 standard provides an introduction and a general overview of all10 complete standards [28]. Part 3,4 and 5 describes the key communication requirements of IEC61850 to be used within a substation. These requirements include identification of data & servicemodel and underlying application, data link, network, transport and physical layer to meet theoverall communication requirement [27].
Part 6 of the standard gives an overview of System Configuration Language (SCL). SCL is anXML based language used to configure the communication related parameter of different IEDs ina substation [30].
The data modeling aspect of IEC 61850 is defined in part 7 of the standard. IEC 61850 has anabstract object-oriented modeling structure which follows the hierarchy defined in part 7-2 [31] ofthe standard. The method to create the abstract data object and to map it to abstract services isdefined in this standard. The abstraction of data object referred to as logical nodes is defined inpart 7-4 [32]. All the data objects are further constructed using the common block called as Com-mon Data Class. Part 7-3 [33] defines all the CDC . To extend its application to non substationautomation, further standard in parts 7-410, 7-420 and 7-510 are defined.
Part 8-1 [34] defines the way of mapping abstract services and data to a real protocol such asManufacturing Message Specification. Part 9-2 [35] defines Specific Communication Service Map-ping for the transmission of sampled values between sensors and IEDs. The last part 10 definesthe testing method to verify its conformance with various protocol defined in the document.
The first publication of the standard was released in 2003. The initial scope of the publicationwas communication within the substation. However, after the release, the applicability of IEC61850 for nonsubstation related application was realized and was extended to other domains suchas Distributed Energy Resource, Hydroelectric power plant, etc. This results in renaming thenew standards as “Communication networks and systems for power utility automation“ instead of“Communication networks and systems in substations“ used in first editions.
The IEC standard is continuously updated. Few new standard is in the process of reviewingand editing before they are officially published. The new standard added after the first release arelisted as the technical report in table 2.2.
Page 12

Series Title Edition PublicationIEC 61850-1 Communication networks and systems for
2.0 2013-03-14 power utility automation -Part 1: Introduction and overview
2 14-Mar-13
IEC 61850-7 Communication networks and systems forpower utility automation - Basic communi-cation structure
IEC 61850-7-510 Hydroelectric power plants - Modeling con-cepts and guidelines
1 22-Mar-12
IEC 61850-90-1 Communication networks and systems forpower utility automation - Part 90-1: Use ofIEC 61850 for the communication betweensubstations
1 16-Mar-13
IEC 61850-90-4 Communication networks and systems forpower utility automation - Part 90-4: Net-work engineering guidelines
1 6-Aug-13
IEC 61850-90-5 Communication networks and systems forpower utility automation - Part 09 90-5: Useof IEC 61850 to transmit synchrophasor in-formation according IEEE C37.118
1 9-May-12
IEC 61850-90-7 Communication networks and systems forpower utility automation - Part 90-7: Objectmodels for power converters in distributedenergy resources (DER)
1 21-Feb-13
Table 2.2: New Added Series of IEC 61850
Part 90-5, newly added standard in IEC series is used for wide-area transmission of synchropha-sor information according to IEEE C37.118 for Wide-Area Monitoring, Protection and Controlling(WAMPAC) application [3]. The information is transmitted over a public network like cellularcommunication and is explained further in section 4.1.2.
2.4.2 IEC 61850 Data ModelingThe data from the devices are mapped into an abstract object-oriented data model following themodeling method defined in part 7 of the standard. The model follows a hierarchy and is applicationindependent. It is divided into the various logic block called as devices, nodes, data class, and data.
• Physical DevicePhysical layer is the first layer in an IEC 61850 data model which include an intelligent devicesuch as Intelligent Electronic Device (IED). It is connected to a network and is identified by itsnetwork address. Each physical device contains one or more logical node like breaker/control.
• Logical DeviceLogical device (LD) in [31] is defined as “entity that represents a set of typical substationfunctions“. The set of substation function includes performing power network function likemeasurement or protection. Every LD consists of one or more Logical Nodes (LN).
• Logical NodeLN is the basic building block of the IEC data model. It is defined in [31] as “an entity that
Page 13

represents a specific substation function“. Each LN consists of one or more data elements.Part 7-4 categorize the 92 different logical nodes into 13 different main groups which representthe typical substation function. The naming convention of the LN is standardized and shouldalways starts with the group it belongs to. For e.g. The LN “MMXU“ starts with groupindicator ’M’ which represents this LN is used for metering and measuring function.
• Data ClassEach data element belongs to one of the CDC defined in part 7-3 of the standard. Each CDCfollows a standardized naming conventional and defines the data type for that logical node.Additionally, it contains several individual attributes categorized based on their FunctionalConstraints (FC).For e.g. The LN XCBR includes “PoS“ (Switch Position) as one of its data object from thesimple CDC type DPC (Controllable Double Point).
• Data AttributesThe data attributes represent the contains the actual data in binary form to be shared withother logical devices. For e.g. The "PoS" data class of DPC simple CDC has stVal, q and tas the data attributes.
Figure 2.5: IEC 61850 based Data Model
2.4.3 IEC 61850 Service and Data Mapping to Communication Proto-cols
The IEC 61850 built based on the Open Source Interconnect 7 layer model. The data services andapplication related to SA system is mapped to the top layer (application layer) of the OSI protocolstack as shown in the figure 2.6. This ensures the no change in the upper layer protocol with thedevelopment of lower underlying layer with the communication standard.
Page 14

Figure 2.6: IEC 61850 standard mapping to OSI Stack
The Abstract Communication Service Interface (ACSI) defined in part 7-2 of the standard isa physical device that provides abstract communication services such as connection, variable ac-cess, unsolicited data transfer, device control and file transfer services, independent of the actualcommunication stack and profiles used [36]. These communication services must be mapped to areal protocol such as Manufacturing Message Specification (MMS) in an SA system. IEC 61850defines a Specific Communication Service Mapping (SCSM) to map ACSI models onto real proto-cols. SCSM is a set of standardized rule that provides the concrete mapping of ACSI services andobjects onto a particular communication protocol stack [37] as shown in the figure 2.6. Part 8-1and 9-2 defines SCSM mapping of GOOSE and SV respectively.
2.4.4 Generic Object Oriented Substation EventThe IEC 61850 defines two different class of communication model to be used for communicationwithin the Substation Automation System (SAS) namely:
• Client/server communication model used for reporting and remote switching application
• peer-peer communication model for Generic Substation Event and SV services
The GSE provides fast and reliable communication model for the exchange of input and outputdata values. It make use of publisher/subscriber model to distribute the generic substation eventinformation among various physical device using multicast and broadcast services. Part 7-2 of IEC61850 defines two classes of control messages.
1. Generic Object Oriented Substation Eventmessage format that are used for the exchange ofa wide range of possible common data organized by a data-set
2. Generic Substation State Event message format that are used to convey state change infor-mation in bit pairs
Page 15

The IEC 61850 GOOSE/GSSE replaces the hard-wired binary signaling with ethernet basesstation bus. All of the hard-wiring needed for status signals can be replaced by a single Ethernetconnection between IEDs. The transfer to control message like a trip or a break status can usingGOOSE/GSE message is really fast and is typically in the range of 3-10ms.
2.4.5 Sample ValueSample Value (SV) is used for the transmission of the synchronized stream of current and voltagevalue. It is transmitted over Ethernet providing fast and cyclic exchange of measured current andvoltage values replacing the traditional analog wiring. Special attention is required to choose thesample rate for the transmission of SV in a time-controlled way. This is required to minimizethe combined jitter of sampling and transmission. For e.g. the Busbar voltage used to triggerprotection relays is measured at 4000 samples/s and transmitted cyclically at 1 kHz [38].
It is also based on a publisher/subscriber mechanism. There are two model defined in IEC61850-7-2 to exchange SV between the publisher and one or more subscriber:
1. Multicast-application-association
2. Two-party-application-association
2.5 Synchrophasor TechnologySynchronized phasor measurement of voltage and current plays an important role in the smoothfunctioning of the todays smart grid structure. Phasor measurement, when measured simultane-ously and synchronized with a precise timing clock, is called as synchrophasor measurement.
A Sinusoidal wave is used to represent a signal in power system analysis and is representedusing the Equation 2.1
X = Xm sin(ωt+ φ) (2.1)
It is represented in phasor form by Equation 2.2
x(t) = (Xm√2
)ejφ = (Xm√2
)(sinφ+ j cosφ) = Xr + jXi (2.2)
where Xm√2
represents the amplitude of phasor in root mean square (RMS) value and r and jare the real and imaginary part in a rectangular co-ordinate system. The value X in Equation 2.2represents the synchrophasor representation of the signal x(t) in Equation 2.1 and φ is the instan-taneous phase angle relative to a cosine function at the nominal system frequency synchronized toUTC time.
Phasor Measurement Unit is used to measure the synchrophasor values. Modern PMU arecapable of measuring the frequency and Rate Of Change Of Frequency which given by Equation2.3 and Equation 2.4 respectively.
x(t) = Xm cos[Ψ(t)] (2.3)
Page 16

ROCOF (t) = df(t)dt (2.4)
where,
f(t) = (1/2π)dΨ(t)dt
The IEEE first standardize the synchrophasor measurement as IEEE 1344 standard and wasreaffirmed in 2001. Later in 2005, to deal with the PMU measurement issue, IEEE release a com-plete new revised standard in the name IEEE C37.118-2005 – IEEE Standard for SynchrophasorMeasurements for Power Systems. The specification includes the standard to measure, quantify,test and certify the accuracy of the transmitted data used for real-time data communication [39].The standard didn’t have the complete list of factor a PMU can detect in a power system. Hence,it was split into two parts in 2011:
1. C37.118-1This standard deals with phasor estimation and measurement system. It defines the methodto measure Synchrophasors, Frequency, and Rate of change of frequency (ROCOF) in alloperating condition [1].
2. C37.118-2This standard deals with the real-time exchange of synchrophasor measurement betweendifferent entities in a power system. It defines different data types and message type. Inaddition it also introduced two classifications of PMU, M - measurement & P - protection[2].
2.6 TR IEC 61850-90-5Synchrophasor measurement and calculation done by PMU are useful in estimating the conditionof the electrical power network and preventing big electrical disturbances. The measurement andtransmission method of this useful synchrophasor information is defined in IEEE C37.118.1 andIEEE C37.118.2 respectively. IEEE C37.118 has certain limitation which are
• Security concerning the transmission of synchrophasor information is not well defined in thestandard
• The dataset naming in the standard is not standardized and hence the inter-operabilitybetween the devices from different vendors is the biggest drawback of the IEEE C37.118standard
• The dataset configuration tool defined in the standard is vendor specific.
• No mechanism is defined in the standard to transmit the same message to more client in amulticast domain.
Page 17

IEC 61850 helps in filling the gap observed in C37.118 with system independent, better securityand standardized data modeling and configuration approach. Hence a completely new communica-tion mechanism has to be proposed to transmit the synchrophasor measurement in compliance withIEC 61850 standard. IEC in 2012 released a new technical report in the name of "Communicationnetworks and systems for power utility automation - Part 90-5: Use of IEC 61850 to transmitsynchrophasor information according to IEEE C37.118" to solve this problem. TR IEC 61850-90-5specifies the communication mechanism for the exchange of time synchronized power measurementover wide area networks based on the IEC 61850 format [3]. It defines the synchrophasor dataexchange mechanism between:
• Phasor Measurement Units (PMU)s
• Phasor Data Concentrators (PDC)s
• Between control center applications
• Wide Area Monitoring, Protection, and Control (WAMPAC)
The IEC 61850-90-5 standard also provides a way to route the IEC 61850-8-1 GOOSE andIEC 61850-9-2 Sample Value packets. These packets can be used to transport synchrophasorinformation as well as general IEC 61850 data. Internet Protocol along with Transmission ControlProtocol (TCP) or User Datagram Protocol is used to transport the synchrophasor information asshown in the Figure 2.7 . Hence the message format are called as Routed- Generic Object OrientedSubstation Event and Routed- Sample Value.
Figure 2.7: Mapping of Synchrophasor Information in 90-5
IEC 61850-90-5 provides enhanced security for IP packet using the Secured Hash Algorithm-2 (SHA-2) algorithm for message integrity and Advanced Encryption Standard for encryption.Encryption is optional. Both asymmetric and symmetric key pair is used for hashing function. Thekey management system based on RFC 3547 - Group Domain of Interpretation is implemented toexchange the hash key to both publisher and subscriber. The different security option available inIEC 61850-90-5 is shown in the Table 2.3
In the table 2.3 Message Authentication Code (MAC) -None is provided for testing.
2.6.1 Data Modeling in IEC 61850-90-5To model a system in IEC 61850, both client and server shall be modeled as logical nodes on someIEDs. A PMU in IEC 61850-90-5 is a logical device which has one or more logical nodes dependingon its use for the particular application. Classical logical node and its data objects defined in part 7of IEC 61850 as well as some new logical nodes and data objects are used to model IEEE C37.118.2PMU in 90-5 compliance. For e.g. one or more instances of classical logical node MMXU is used
Page 18

HMACalgorithm
Numberof bits
Designation
None None MAC-None
SHA-256 80 HMAC-SHA256-80
SHA-256 128 HMAC-SHA256-128
SHA-256 256 HMAC-SHA256-256
AES-GMAC 64 AES-GMAC-64
AES-GMAC 128 AES-GMAC-128
Table 2.3: Different Security Option in 90-5
for publishing phase currents and voltage value and one or more instances of classical logical nodeMSQI is used for publishing sequence current and voltage value.
IEEE C37.118.2 PMU is capable of measuring synchrophasor, frequency, and ROCOF value.Hence a new data object HzRte is added to MMXU logical node to exchange the ROCOF value. Inaddition to that information regarding the status of PMU is transmitted using the common dataclass named “PhyHealth“ in an instance of LPHD Logical Node as shown in the Figure 2.8
2.6.2 Communication Scheme
IEC61850-90-5 shall be used as the primary protocol for synchrophasor data exchange for WAMPAC(Wide Area Monitoring, Protection, and Control) application. The synchrophasor measurementand calculation can be exchanged within and outside the substation using SV while additionalevent status data can be communicated using the GOOSE or reporting considering the time crit-icality of the situation. The information can be exchanged using any of the two communicationscheme defined in [3]
• Direct connection with TunellingIn this communication scheme, SV and GOOSE message are tunnelled accross the high speedconnection like Synchronous Optical Networking or Synchronous Digital Hierarchy.
• The Gateway ApproachIn this communication scheme SV and GOOSE message are communicated in an IP publicnetwork.
The use of communication scheme for synchrophasor data exchange depends on the applicationsthey serve. The first option is a good option for shorter distance communication and hence thesecond one is preferred over it which serves for both long and short distance communication. Inthis approach, messages are encapsulated in an IP based protocol which can transverse to a longerdistance and multiple stages of networking equipment. The enhance mapping of SV and GOOSEto support the gateway approach is shown in the Figure 2.9
Page 19

Figure 2.8: PMU data Modeling
Page 20

Figure 2.9: service mapping in IEC61850-90-5
As can be seen in Figure 2.9 , the synchrophasor data is encapsulated in IP based protocolusing UDP as transport layer protocol. Since it uses the IP network, the data can be multicastedusing some IP multicast protocol like Internet Group Management Protocol version 3. The SV andGOOSE data are transmitted as a routable data and hence in 90-5, they are called as Routed-SV(R-SV) and Routed-GOOSE (R-GOOSE).
2.6.3 IEC 61850-90-5 servicesSection 6 of IEEE C37.118.2 define four different messaging frame for communicating synchropha-sor information which are:
• Header frame
• Configuration frame
• Command frame
• Data frame
These frame are translated as services in 90-5. The functionality of command frame is imple-mented in 90-5 using the two control block namely Routed Multicast Sample Value Control Blockand Routed- Goose Control Block and is explained in the Table 2.4.
All the configuration in IEC 61850 is configured through the SCL file and there is no need foran extra configuration frame. The data frame in C37.118.2 is used to transfer the synchrophasorinformation and is defined by the following four different services in IEC 61850-90-5:
• Routed Sampled Value service
• Routed GOOSE service
• Tunneled GOOSE or Sampled Value service
• Management service
Page 21
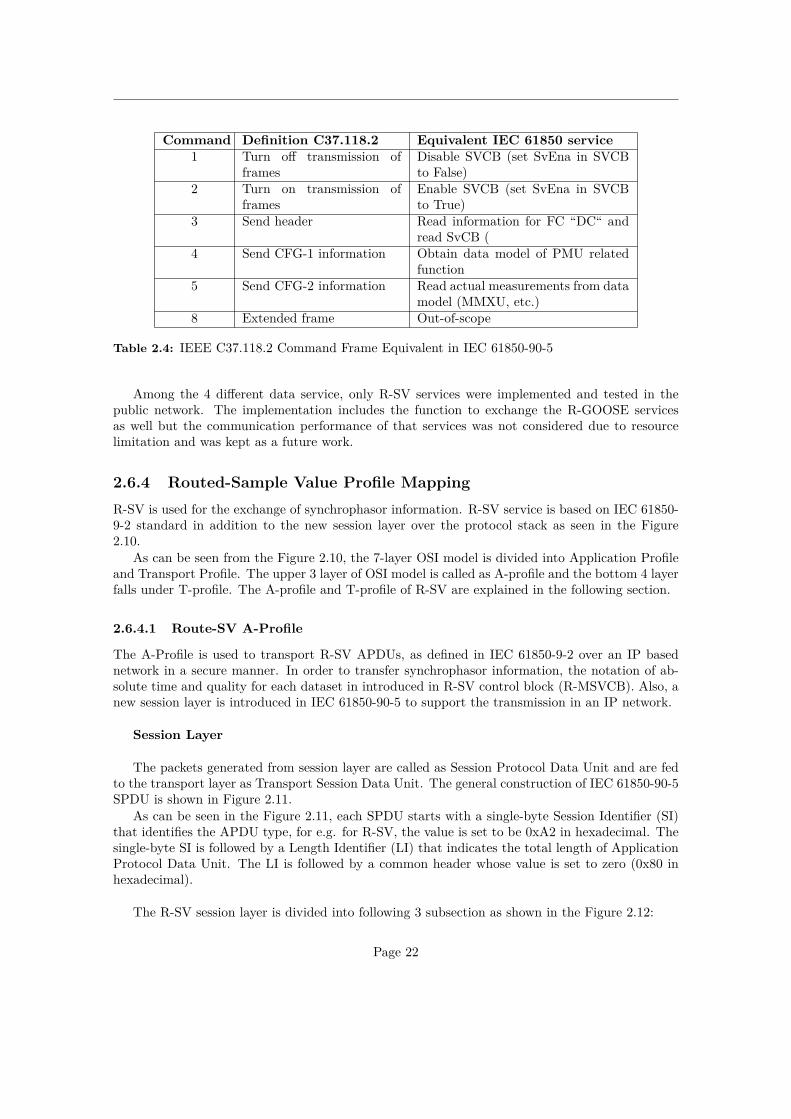
Command Definition C37.118.2 Equivalent IEC 61850 service1 Turn off transmission of
framesDisable SVCB (set SvEna in SVCBto False)
2 Turn on transmission offrames
Enable SVCB (set SvEna in SVCBto True)
3 Send header Read information for FC “DC“ andread SvCB (
4 Send CFG-1 information Obtain data model of PMU relatedfunction
5 Send CFG-2 information Read actual measurements from datamodel (MMXU, etc.)
8 Extended frame Out-of-scope
Table 2.4: IEEE C37.118.2 Command Frame Equivalent in IEC 61850-90-5
Among the 4 different data service, only R-SV services were implemented and tested in thepublic network. The implementation includes the function to exchange the R-GOOSE servicesas well but the communication performance of that services was not considered due to resourcelimitation and was kept as a future work.
2.6.4 Routed-Sample Value Profile MappingR-SV is used for the exchange of synchrophasor information. R-SV service is based on IEC 61850-9-2 standard in addition to the new session layer over the protocol stack as seen in the Figure2.10.
As can be seen from the Figure 2.10, the 7-layer OSI model is divided into Application Profileand Transport Profile. The upper 3 layer of OSI model is called as A-profile and the bottom 4 layerfalls under T-profile. The A-profile and T-profile of R-SV are explained in the following section.
2.6.4.1 Route-SV A-Profile
The A-Profile is used to transport R-SV APDUs, as defined in IEC 61850-9-2 over an IP basednetwork in a secure manner. In order to transfer synchrophasor information, the notation of ab-solute time and quality for each dataset in introduced in R-SV control block (R-MSVCB). Also, anew session layer is introduced in IEC 61850-90-5 to support the transmission in an IP network.
Session Layer
The packets generated from session layer are called as Session Protocol Data Unit and are fedto the transport layer as Transport Session Data Unit. The general construction of IEC 61850-90-5SPDU is shown in Figure 2.11.
As can be seen in the Figure 2.11, each SPDU starts with a single-byte Session Identifier (SI)that identifies the APDU type, for e.g. for R-SV, the value is set to be 0xA2 in hexadecimal. Thesingle-byte SI is followed by a Length Identifier (LI) that indicates the total length of ApplicationProtocol Data Unit. The LI is followed by a common header whose value is set to zero (0x80 inhexadecimal).
The R-SV session layer is divided into following 3 subsection as shown in the Figure 2.12:
Page 22

Figure 2.10: IEC 61850-90-5 Routed-Sample Value (R-SV) OSI Model
Figure 2.11: General Byte Ordering of IEC 61850-90-5 Session Protocol [3]
Page 23

1. Header
2. User data
3. Signature
The header has the following sequence of information:
• SPDU LengthIt is a 4-byte unsigned integer that represents the total length of the SPDU. The maximumvalue of SPDU length is 65,517 octets.
• SPDU NumberIt is a 4-byte unsigned integer to detect duplicate or out-of-order packet delivery. Its valuerange from 0 to 4 294 967 295. It is maintained by a sender on a destination basic and isincremented whenever a packet is sent to the destination address. When the maximum valueis reached, the value is reset to zero.
• VersionIt is a 2-byte unsigned integer that represents the protocol version number as specified bythe standard. The value specified in the standard is 1.
• TimeofCurrentKeyIt is a 4-byte unsigned integer that represent the SecondsSinceEpoch value. SecondSinceEp-och shall be the interval in seconds counted continuously since the epoch 1970-01-01 00:00:00Coordinated Universal Time. The value shall not be adjusted for leap seconds.
• TimetoNextKeyIt is a 2-byte signed integer that represents the number of minutes remaining to use the newkey.
• SecurityAlgorithmsIt is a 2-byte field representing the encryption and HMAC algorithm type used. The mostsignificant byte is used to indicate the type of encryption while the least significant byteindicated the type of the HMAC used in the packet.
• Key IDThe 4-byte number is used as a reference to the key that is in use. This value is assigned byKDC.
The user data consists of two length and payload field:
• LengthThe length is a 4-byte unsigned integer. The maximum size of the length is based on theSPDU length and its value cannot be larger than the
SPDU Length – 14 – Signature Size
• PayloadThe payload payload starts with the common payload attributes:
– Payload typeThis attribute is used to identify the type of PDU. The hexadecimal values for R-SVdata type is 0x82.
Page 24

Figure 2.12: IEC 61850-90-5 A-Profile [9]
Page 25

– SimulationIt is a single byte boolean attribute to indicate if the payload is sent for test or not.
– APPIDIt is a 2-byte value as defined in 61850-90-2.
– APDU LengthIt is a 2-byte unsigned integer used to indicate the total length of Application PDU(APDU).
– R-SV APDUThe payload length is followed with R-SV APDU explained in the next section.
The signature field starts with 1-byte tag and its hexadecimal value is 0x85. The tag is followedby 1-byte length field that indicated the total length of HMAC value. The final octet contains thefinal HMAC value as calculated by the algorithm mentioned in the security algorithm field.
R-SV ASDU
The SV ASDU is explained in detail in IEC 61850-9-2 and is called as savPdu. The savPdu isencoded based on ASN.1 Basic Encoding Rule (BER).
ASN.1 Basic Encoding Rule
Abstract Syntax Notation One (ASN.1) is a notation used to describe the message that can betransmitted and received in a network [40]. It is divided into two part:
• The first part specifies the syntax for describing the content of a message in data type andcontent sequence format. It is defined in ISO 8824/ITU X.208 standard.
• The second part specifies the basic encoding rules for encoding each data item in a message.The encoding standard is defined in ISO 8824/ITU X.209 standard.
There are set of encoding rules defined in ISO 8824/ITU X.209 and sample Value is encodedbased on Basic Encoding Rule (BER). BER encodes abstract information into a concrete datastream. The principle of BER standard is to encode each message in a TLV triplet structure,where T represents Tag, L represents Length and V represents Value as shown in the Figure 2.13.
Figure 2.13: Basic Encoding Rule
• TagThe tag is a 1-byte information that indicate the type of message encoded.
Page 26

• LengthThe length is 1-byte in length which represent the length of data in Value field.
• ValueThe value contains the actual data. The value can contain several other data coded in formof other TLVs as can be seen in the Figure 2.13.
The sample value starts with a tag 0x60 hexadecimal value followed by the length of the totalPDU as can be seen in the Figure 2.14. The length is followed by the sequence of followingattributes:
Figure 2.14: ASN.1 BER Encoded Sample Value data format
• noASDUIt indicates the number of Sample Value ASDU contains in an SV packet. The tag associatedwith this attribute is 0x80.
• SecurityThe security field is optional and is associated with a tag 0x81.
• Sequence of ASDUsAll ASDUs concatenated in a SV packet are associated with a tag 0x60. The tag is followedby the length. The value field of this attribute has the series of ASDU data as can be seenin the Figure 2.14. Each ASDU has the series of the following data:
– svID (Sample Value Identifier)It is a visible string of maximum 129 octets that indicates unique identification of thesampled value. It is associated with a 0x80 tag.
Page 27

– datsetThe DatSet attribute specify the reference of the data-set of the transmitted MSVCBmessage. The Tag associated with datSet is set to 0x81.
– smpCntThe smpCnt attribute is a 2-byte unsigned integer containing the sample count valuewhich will be incremented every time a new sample value is taken. The tag associatedwith this attribute is 0x82.
– ConfRev (Configuration Revision)The ConfRev attribute is a 4-byte unsigned integer containing counts of the numberof times the configuration with regard to the SVCB (Sample Value Control Block) hasbeen changed. The counter shall be incremented when the configuration changes. TheTag associated with ConfRev is set to 0x83.
– refrTmThe refrTm is an 8-byte optional field that indicates the TIMESTAMP of the refreshtime of the SV Buffer. It is associated with 0x84 tag.
– smpSynchIt is a boolean value which indicates if the SV is synchronized by a clock signal or not.It is associated with a tag of 0x85.
– SmpRateIt is a 2-byte unsigned integer containing the sample rate value. The Tag associatedwith SmpRate is set to 0x86.
– SampleThe sample attribute starts with 0x87 tag and its value contains the member of dataset that is to be transmitted.
2.6.4.2 Routed-SV T-Profile
The T-profile used for the transmission of SV packet is specified in IEC 61850-9-2. To transportthe Routed-SV in a public network, UDP/IP protocol is used as shown in the Figure 2.15.
Page 28

Figure 2.15: IEC 61850-90-5 T-Profile [9]
Page 29


3 | Wireless Communication Per-fomance Metrics
This chapter provides an introduction to wireless communication, communication requirementfor IEC 61850-90-5 application and a detailed explanation of parameter used to benchmark LTEsystem for the 90-5 application.
3.1 Wireless CommunicationWireless communication has transformed rapidly over the years. The technological innovationfrom the first generation (1G) to fourth generation (4G) has increased bandwidth, coverage, andcapacity of wireless communication significantly while reducing the latency to few milliseconds [41].The technological advancement has widened its application. At present wireless communicationis used to transfer data in almost all major industries that include medical, transport, university,military, etc. The standardization of WLAN, LTE, and Wi-Max technologies has increased itsdominance in an industrial application during the past 10 years [42].
3.1.1 Long Term EvolutionLTE is a high-speed wireless communication system and is the evolution of GSM/WCDMA corenetwork. LTE is a 4G communication technology standardized by 3rd Generation PartnershipProject (3GPP) in release 8. To support high-speed data connectivity and mobility, it uses Or-thogonal Frequency Division Multiplexing as its radio access technology for downlink traffic andSingle Carrier Frequency Division Multiple Access for uplink traffic. LTE features advanced an-tenna technologies such as Multiple-Input Multiple-Output.
LTE is an all IP packet-switched based network and offers low latency both in user and controlplane. The architecture is based on Long Term Evolution -System Architecture Evolution with newEvolved Packer Core as its core network. The new EPC network is optimized for better networkperformance, cost-efficiency and facilitate the uptake of mass-market multimedia traffic [43].
LTE technology is continuously evolving to improve network performance, flexibility and reducelatency. LTE-Advanced which features fast switching for direct device-device communication incase of emergency, carrier aggregation to increase the data transmission rate are some of the keyinnovation in the current LTE world. The data throughput with LTE-Advanced is theoreticallyaround 1 Gbps in downlink and 500 Mbps in Uplink [44]. This key development has alwaysfascinated researcher to utilize LTE for the different application.
31

3.1.2 Communication Requirement in IEC 61850-90-5Wireless communication provides the high level of flexibility and scalability with low deploymentcost compared to other fast data rate technologies like Optical communication. For wireless com-munication to be acceptable in smart grid automation, it has to fulfill the critical requirementsrelated to latency, reliability, availability and data rates of different power grid application. Theseverity of the requirement varies from application to application and there could be an additionalrequirement related to redundancy, time synchronization, security, and coverage.
There are several long and short-range wireless technologies available but LTE can play akey role in replacing the currently deployed communication technologies in the smart grid. LTEprovides high data rate, low latency, high availability and enhanced security. LTE also featuresdifferent Quality-of-service (QoS) based on application criticality that can be useful in reducingthe transfer time in smart grid application.
The Communication requirement in smart grid application is application dependent and variesfrom one application to another. This requirement includes transmission rate, delay in measure-ment and transmission of data, reliability at which the packets are delivered and the availability ofthe network for transmission. These parameters are critical in benchmarking the performance of aprotocol in a public wireless infrastructure. LTE is an all IP-network which guarantees high relia-bility, high data throughput and low latency, and following parameter are measured to benchmarkits applicability for the transmission of synchrophasor information:
• Network Throughput
• Latency or Transfer time
• Reliability or packet delivery ratio
• Availability
The time-critical application considered in the thesis work requires latency below 30ms, areliability of 99.99%, 100-200 pps transmission rate and less failure rate.
3.1.2.1 Network Throughput
Network throughput in a communication network is the measure of the rate of successfully deliv-ered message over the communication channel. In other words, it is a measure of the number ofpackets successfully transmitted per second in a given networking infrastructure. Throughput isusually measured in bits per second, and sometimes in data packet per second [45].
The throughput in a given network is given by Equation 3.1.
Throughput = Total number of packet successfully delivered
Total time interval(3.1)
Network throughput is the measure of amount of information or message can be processed bya system in the given time interval. Throughput helps in measuring the system efficiency andsometime is useful in calculating the channel utilization. Throughput is affected by many factorlike load in a given system, interface due to other signal, radio resource allocation, etc.
Page 32

In smart grid automation application, huge amount of data has to be processed in a minimaltime and hence the throughput should be significantly higher. Non-commercial LTE offers highbandwidth to transmit data from multiple users or device. This parameter is measured duringthe thesis work to understand channel utilization of the given non-commercial LTE infrastructure.Also, it helps in measuring the rate at which the data is processed.
3.1.2.2 Latency or Transfer time
Latency is the total time a packet takes to get from source to destination. Latency is an impor-tant parameter in understanding the total delay a packet may suffer when traversing through thevarious networking equipment. Latency involves transmission, processing and propagation delay.These delays in a network effects the performance in a communication system [46].
Delay in a network can be measured either as one-way delay (message transmission time fromsource to destination) or as Round-Trip-Time delay (transmission time from source to destinationand back to the source). Smart grid automation application desires low latency which ranged from5 to 100 ms depending on the application its serves while time critical application requires latencymostly below 30ms [47]. LTE provides low latency to high critical message and can serve a keycommunication enabler in smart grid application.
In general, latency is given by the Equation 3.2 provided both the receiving and transmittingnode synchronized to same time source.
Latency = Trx − Ttx (3.2)
where,Trx = Time at which the packet is received at the receiving nodeTtx = Time at which the packet is sent by the transmitting node
IEC 61850-5 defines latency as the transfer time which is defined as the complete transmissiontime of a data packet including the processing time at both sender and receiver end. The timebegins from the moment sender puts the application data content on top of its transmission stack(coding and sending) till the moment receiver extracts the data from its transmission stack (receiv-ing and decoding). Furthermore, IEC 61850-5 defines six message types depending on its usage.These message types are:
• Type 1 - Fast messages
• Type 2 - Medium speed messages
• Type 3 - Low speed messages
• Type 4 - Raw Speed messages
• Type 5 - File Transfer functions
• Type 6 - Command messages and file transfer with access control
Synchrophasor information is the continuous stream of voltage and current measured at a clocksignal. These message type falls under Type 4 - Raw speed message. These message needs to have
Page 33

a constant delay and its transfer time or transmission delay falls in the range of 10-30ms.
IEC 61850-90-5 is used for WAMPAC application where the synchrophasor information has toshared between different substation as shown in the Figure 3.1.
Figure 3.1: Transfer time for WMAPAC application [48]
The transfer time in this case is given by the equation 3.3:
TransferT ime = ta + tb1 + ta1 + tb0 + tc2 + tb2 + tc (3.3)
3.1.2.3 Reliability
Reliability is the probability of success or the probability that the system will perform its intendedfunction under specified design limits [49]. It is measured based on a total number of packet suc-cessfully delivered against the total number of packets transmitted. Theoretically, it is the measureof the rate of success. Reliability is an important communication parameter to understand the de-pendability of a given system. Reliability is mostly affected by the loss of the packet in a network.Packet loss in a network could be because of numerous reason which includes congestion in a net-work, no network availability, network failure, etc.
In general, reliability is measured in percentage and is given by the Equation 3.4
Reliability = Total no. of Received Packet for some T time
Total no. of Transmitted Packet during the same time× 100% (3.4)
Reliability helps in analyzing the networking condition. This is very useful information in an-alyzing the applicability of a given communication infrastructure for a given system.Time-criticalapplication requires highly reliable system. Higher reliability is desirable for proper and efficientoperation of time-critical application. Missing of information can affect the system performance
Page 34

to predict electrical disturbance. In smart grid automation system, an IED requires around 200packets per second to interpolate the system condition and predict if there is any fault in thetransmission system.
In smart grid automation, the devices exchange message or information continuously and arevery sensitive to loss of information. The reliability requirement for smart grid application is99.99% which means the system can tolerate only 1 packet loss in every 10000 packet it sends.Communication network reliability is only measured during the thesis work.
3.1.2.4 Availability
Availability is the probabilistic measurement to check if a system is operational at a certain pointin time [50]. Availability depends on two factors:
• Failure rate of the elements
• Repair rate of the elements
The former can be improved through better elements quality, condition monitoring, and redun-dancy while the latter depends on the maintenance strategy of the operator [48].
During normal operation, the devices exchange message continuously for a longer period oftime and availability calculation of communication network is important to understand the failurerate and up time of the entire networking system. If we define the status function X(t) = 1 forany time t>0, then the availability at a given time ‘t‘ of the communication system is given byEquation 3.5 [50].
Availability(t) = Pr[X(t) = 1] (3.5)
Availability measurement of a system is the measurement of reliability at a given point of time.Reliability is dependent on availability. Hence to have a better reliability in a system, the networkshould availability all time. This, in turn means the network should have a very low failure rateand in case of failure, the network should have an efficient redundant implementation.
During the thesis work, availability parameter was used to measure the robustness of thecommunication network. It is also useful in measuring the device failure rate of a network andalso the level of redundant implementation in case of failure. LTE network is highly susceptibleto devise failure and is always deployed with a redundant path to compensate for the failure.This parameter was used to measure the robustness of LTE network and find its suitability forsynchrophasor information transmission application.
Page 35


4 | Implementation And Testing
As mentioned in Chapter 1, the work is divided into two major task: Design & Implementation ofIEC 61850-90-5 protocol stack, and testing its performance over the non-commercial LTE network.
The first section covers the design and implementation of IEC 61850-90-5 protocol stack onthe targeted machine. It includes the contribution done to develop the complete 90-5 protocolstack. The information contained in encoded synchrophasor message is explained in detail in thissubsection. Also, it gives an introduction to timestamping type used to timestamp the data.
The later section presents the test setup, test control flow, and test cases. Different test casesused to measure availability, reliability, throughput, and latency are explained in detail in thischapter.
4.1 Design and Implementation of IEC 61850-90-5 ProtocolStack
The protocol stack was designed to exchange synchrophasor data between two machines based ona client-server model. The packets were encoded and transmitted in a UDP/IP network at theserver side. The transmitted data was received, decoded and analyzed at the client side. The de-velopment work also includes the addition of a function to keep track of transmission information,to facilitate the measurement of key communication parameter mentioned in section 3.1.2.
The 90-5 protocol stack was started from an open source code from site [51]. The open sourcecode was started by System Integration Specialist Com-pany and is the platform where many de-velopers have collaborated and contributed to the development of 90-5 protocol stack. The opensource code was provided by ABB and is licensed under the Apache License, Version 2.0. It hasthe basic interface and function definition to transmit the data between the machines.
The protocol stack source code was written in C language. C language because it is very pow-erful, rich in the library and most importantly has less processing delay than any other high-levellanguage. The development was performed in Microsoft Visual Studio IDE in windows platform.Microsoft Visual Studio was used because it has some useful inbuilt function to measure the HMACand time that were used for the development of protocol stack. Also, it has an easy method totranslate the source code to a standalone application.
The final output of the development was a standalone application that accepts the configura-tion file (explained in 4.2.2.2) as an input from the directory mentioned in the source code and
37

generates an output which is a statistics file that contains required transmission information liketransmitted, received, missing packets, etc.
The original source code was modified as per the project requirement and the major changesimplemented in the code is illustrated below:
• The origin source code supports the encoding and decoding of R-SV information, but thedata field was empty. The data to be send was analyzed and encoded in the data field ofR-SV. Also, the decoded of encoded data was included on the client side. It is explained indetails with an example in sub-subsection 4.1.2.
• Synchrophasor data needs to be timestamped while encoding. The original source code in-cludes second accuracy time-stamping function. But for the measurement of latency param-eter, time resolution up to few microsecond was required. For microsecond time resolution,windows inbuilt function was implemented in the original source code. The time-stampingwith microsecond resolution was implemented as per IEC 61850 format which is explainedin details in sub-subsection 4.1.3.
• The original source code supports encoding and decoding of R-SV information. Hence toextend the study for R-GOOSE information, R-GOOSE encoding and decoding functionswere defined in the original source code.
• The major aim of the project was to measure the important communication metrics definedin subsection 3.1.2. Periodic update of packet size and transmission interval was required forin-depth analysis and measurement of the communication metrics. To facilitate the dynamicupdate of packet size and transmission interval, changes were done in the configuration file.The original source code was also changed accordingly to accept the changes.
• The output of the program is a statistics file which logs the data transmission informationlike transmitted, received, missing packets, etc. Major changes were done on the source codeto track the transmission logs and extra counter were added in the original source code tofacilitate the measurement of key communication parameters.
• Minor changes were done in the original source code to suit the implementation of the projecton the targeted platform (windows). Some key functions and header were added in the projectfile.
4.1.1 IEC 61850-90-5 Standalone Application Control flowThe control flow of 90-5 application follows the following steps and is shown in Figure 4.1.
• The application starts by initializing internal storage for keys and payloads, KDC and IPinterface stack.
• Encoding of Synchrophasor data and preparation of R-SV packet.
• The prepared R-SV is then transmitted to the receiver/client IP address over the UDP portspecified in the source code. The destination UDP port used during the course of work was102.
• The receiver/client at the other end continuously searches for the packet on the same UDPport and from server IP address. The client on reception of information checks for the securityinformation and then decodes it.
Page 38

Figure 4.1: Control Flow in Protocol Stack
Page 39

Figure 4.2: R-SV packet captured in Wireshark
4.1.2 Synchrophasor Data Encoding in R-SV packetAs explained in sub-subsection 2.6.4, the R-SV ASDUs are encoded in ASN.1 BER encodingformat. Wireshark capture of the R-SV ASDUs is shown in Figure 4.2.
As can be seen in Figure 4.2, each field is encoded as Tag Length Value triplet. The samplesare the field where the synchophasor data is encoded as a data-set member. The samples fieldstarts with ;a tag of 0x87 in hexadecimal followed by its length (0x3C in hexadecimal as shown inFigure 4.3). The value of the samples includes the synchrophasor value and the capture of samplesfield and explanation can be seen in Figure 4.3.
As can be seen in Figure 4.3, all three phasor information is packed into a single R-SV ASDUand each synchrophasor value is represented as:
• A 2-byte integer number to represent the phase number
• The angle and magnitude of phasor information is 5 octets long each and is represented infloating point number representation
• The time-stamping is 8 octets long and is represented in IEC 61850 format
It should be noted that R-SV data set is not encoded in ASN.1 BER format. There is notag and length associated with synchrophasor value.They are directly represented in their normalformat. This is the main difference between the data-set representation in R-GOOSE and R-SV.
Page 40

Figure 4.3: Synchrophasor data representation captured in Wireshark
4.1.3 IEC 61850 Timestamping
The timestamp shall represent the UTC time since the epoch of midnight of 1970-01-01. Section6.1.2.9 of IEC 61850-7-2 defines the timestamp type. This timestamp type is used to timestampthe synchrophasor data. The timestamp type consist of following three attributes:
• SecondSinceEpochIt is a 4-byte unsigned integer and shall represent the count of a number of seconds elapsedsince epoch 1970-01-01 00:00:00 UTC.
• FractionOfSecondIt is a 3-byte unsigned integer and shall represent the fraction of a second when the valueof the TimeStamp has been determined. The resolution of time can be calculated using theEquation 4.1:
Resolution =23∑i=0
bi × 2−(i+1)s (4.1)
where i represent the number of bits used to represent FractionOfSecond attribute. Whenall 3 bytes are used, the resolution is 60 nanosecond.
• TimeQualitythe TimeQuality is a single byte long packed list that provide information about the timesource quality. Its definition is shown in Table 4.1.
Page 41

Attribute name Attribute type ExplanationClockFailure BOOLEANClockNotSynchronized BOOLEANTimeAccuracy CODED ENUM Number of significant bits
in the FractionOfSecond:Minimum time intervalshall be: 2−n
Table 4.1: Time Quality Definition
Figure 4.4: Environmental setup
4.2 Test MethodologyThe modified IEC 61850-90-5 protocol stack was used to test and benchmark its performance overa non-commercial LTE network. R-SV packets were exchanged between the machines and key com-munication parameter explained in sub-subsection 3.1.2 were measured to study the applicabilityof LTE for smart grid application.
4.2.1 Setup Overview
4.2.1.1 Environmental Setup
The standalone IEC 61850-90-5 application was run on two different machines that emulate twodifferent IEDs. Both the machines were connected directly via Ethernet to two separate 4G LTEmodems that had 100 Mbit/s downlink and 50 Mbit/s uplink capacity. The 4G LTE modemconnects to base-station via air-interface. A Virtual Private Network (VPN) tunneling was usedthrough the public network to connect the base station to the core network. The core network islocated around 90 km from the base station (BS).
When a packet is transmitted, it returns back to another machine after traverse through corenetwork shown in Figure 4.4.
Page 42

Machine and LTE Modem Configuration
• Both machines were configured to have static IP in order to avoid change of IP addresses.Dynamic Host Configuration Protocol (DHCP) could be used but would require more con-figuration changes during the test runs.
• The machines were connected to different modems which were on different Local Area Net-works (LAN)s and thus no direct communication could be reachable between the machines.Hence port forwarding functionality was enabled in both the LTE modem.
• To synchronize both the machine to the same time server, one machine was configured asNTP time server and other as NTP client.
4.2.1.2 Time Synchronization Setup
Synchrophasor data is the complex angle and magnitude value timestamped with the same timingsource. Hence the machine used for synchrophasor data exchange has to be synced to the sametiming source. Network Time Protocol (NTP) was used as a time synchronization protocol duringthe experiment. NTP is a time synchronization protocol used to synchronize network time betweenthe machines. It is a client-server based model and utilizes UDP port number 123 for an exchangeof time synchronization information between the machines.
Meinberg NTP packages were used to install NTP services and associated service in both themachines. Meinberg NTP packages because it is an open source binary file available freely on theinternet and is easy to configure [52]. Time synchronization between the machines running IEC61850-90-5 application is shown in Figure 4.5.
As can be seen in Figure 4.5, Machine 1 is synchronized to NTP server from the public Internetand machine 2 is synchronized to machine 1. The NTP package on machine 1 is synchronized to ahighly accurate stratum 1 network time server like 0.se.pool.ntp.org. The NTP package in machine2 is configured to get the time from machine 1 by embedding its IP address as a server address.This makes sure that both machines have the same time.
To increase the accuracy of the test, the offset and drift of both machines were measured usinga command line application before the start of every test. This drift/offset was then used tocompensate the latency calculations.
4.2.2 Test ModelIn order to evaluate and benchmark the performance of non-commercial LTE, machines wereconfigured based on client-server model. A point-to-point communication model was used to finishthe work on time but the design process has the useful function and interfaces definition to supportmulticast communication.
4.2.2.1 Control Flow
The test model control flow is shown in Figure 4.6. Before the start of the application, key param-eter like packet size, transmission interval, logging interval, etc. needs to set in the application.These were set using the configuration file explained in the next section.
Page 43

Figure 4.5: Time synchronization setup
Figure 4.6: Test Model Control flow
Page 44

Figure 4.7: Sample Configuration File
The application running on both the machine loads the configuration and start exchangingR-SV based on the configuration file feed to it. The application produces a statistics file as anoutput. The statistics file is a log file that has important transmission parameters used to measurethe communication metrics. The results from both the statistics files were compared and the finalcompared result was plotted using MATLAB.
Additionally, packet sniffing tool like Wireshark was run on both the machine before the startof the program to capture all the packets received and transmitted from its interface. Wiresharkwith IEC 61850-90-5 extension provided with the open source project was used during the test.Wireshark was used to inspect the proper delivery of packets.
4.2.2.2 Configuration File
For the calculation of key communication metrics, the configuration file was used. It helps indynamic and static updating of the application parameter. The sample configuration file is shownin Figure 4.7.
Some of the key parameter is explained below:
• InterfaceID – It is the Globally Unique IDentifier (GUID) of the interface used to transmit/re-ceive data. During the experiment, the machine emulating an IED was directly connected toLTE modem via Ethernet. Hence, this parameter was fixed for the whole experiment.
• SMVIP4Pub – It was used to set the destination IP address on the application. Both themachines were communicating with port forwarding feature enabled in the LTE modem.Hence this parameter was filled with the IP address of the LTE modem connected to anothermachine.
• StatResetMinute – The value set for this parameter represents the time in minutes to resetthe statistics file.
• LogIntMin – The value set for this parameter represent the time interval in minutes topopulate the transmission information in the statistics file.
Page 45

• TransIntMsec – The value set for this parameter represent the rate of transmission of data.For e.g. if it is set to 5 meaning application will transmit packet every 5 ms counting in totalof 200 packets per second.
• Ulong – This parameter was used to dynamically update the packet size. The packet sizewas calculated using the Equation 4.2
Packet Size(in bytes) = 289 + Ulong × 8 (4.2)
4.2.3 Test CasesA general test plan template was formed to test the transmission performance of R-SV over a non-commercial LTE infrastructure. Different test cases were derived to test different communicationmetrics introduced in 3.1.2. The test plan was based on the different behavior of packet size andthe transmission interval. Each test cases were run for different trials to get the closest expectedmeasurement result.
During the test, parameters such as packet size (Ulong), transmission interval (TransIntMsec),logging interval (LogIntMin) and reset interval (StatResetMinute) were modulated as per the testrequirements or test cases. StatResetMinute and LogIntMin parameter in configuration file wasalso dynamically update to facilitate the capture of correct information in the statistics file. Allthese parameters were updated using bat scripting.
4.2.3.1 Test Case To Measure Throughput
Throughput test was conducted to measure the number of packets transmitted from source to des-tination every second. The test was further extended to study the effect of transmission throughputfor different packet size and transmission interval combination. The throughput test plan is ex-plained below:
• Ten different packet size ranging from 500 to 2400 bytes were considered for this test.
• Five different transmission interval ranging from 40 to 200 pps (packets per sec) was consid-ered during the course of this test
• Each test combination was run for 3 trials and for a minute duration
The throughput Equation 3.1, was used to measure the throughput result.
4.2.3.2 Test Case To Measure Latency
The latency test was conducted to check the transfer time of R-SV in a non-commercial LTEnetwork. The latency test plan is explained below:
• Five different packet size ranging from 500 to 1500 bytes were considered for this test.
• Five different transmission interval ranging from 40 to 200 pps (packets per sec) was consid-ered during the course of this test
• Each test combination was run for 3 trials and for 1-minute duration.
Page 46

The latency Equation 3.2, was modified to measure the latency result and is shown by Equation4.3:
Latency = (Ts −∆s)(Td −∆d) (4.3)
where,Ts and Td are the times where the packets are transmitted and received on the source and desti-nation machines respectively∆s and ∆d are the offset from the NTP server for the source and destination machine respectively
4.2.3.3 Test Case To Measure Reliability
The reliability test was carried to check the delivery rate of R-SV packet over a non-commercialLTE network. The reliability test plan is explained below:
• Only one packet size i.e. 537 bytes was considered for the test.
• The transmission interval was fixed to 2 msec i.e. 500 packet transmission every second.
• The LogIntMin was set to its lowest value i.e. 17 msec.
• Each test combination was run for 5 trials and for a duration of 1 minute
The reliability Equation 3.4, was modified to measure the reliability result and modified relia-bility equation is shown in Equation 4.4:
Reliability =60000∑t=0
RxRx +Mx
(4.4)
where,Rx = Total number of received packet on the given machineMx = Total number of packet not received on the same machinet = time interval in ms
4.2.3.4 Test Case To Measure Availability
Availability test was executed to check the readiness of the non-commercial LTE network. Theavailability test plan is explained below:
• Packet size 1237 bytes was considered for the test.
• The transmission interval was fixed to 1000 ms to limit the transmission of the packet to oneper second.
• The LogIntMin was set to 5 to capture the transmission interval every 5 min.
• The test was run for longer duration of 24 hours and only 1 trail was run in total
Page 47

The availability Equation 3.5, was modified to measure the availability result and the modifiedequation is shown in Equation 4.5:
Availability = RxRx +Mx
(4.5)
where,Rx = Total number of received packet on the given machine for every 15-minute intervalMx = Total number of packet not received on the same machine for every 15-minute interval
4.2.4 Data Analysis and ExtractionThe size of the raw data from the test is approximately 45 Gigabyte. The raw data consists ofWireshark captures, time offset files and statistic files that were generated during the test runs.This result was used for plotting the graph results.
To extract the useful information, different bat script was written and was run. Bat scriptbecause the test was conducted in windows machine. Basically, two different bat scripts werecreated for data collection.
• Script to collect data for the availability measurements
• Script to collect data for latency, throughput and reliability measurements
Page 48

5 | Result And Analysis
The following chapter presents the performance evaluation result of IEC 61850-90-5 protocol stackover a non-commercial LTE network. It includes the plot result for the different communicationmetrics throughput, reliability, latency, and availability measured during the course of thesis work.
5.1 ResultThe measured result for availability, latency, throughput, and reliability was plotted in MATLABprogram using Matlab scripts. MATLAB because it has rich in-built plot function to realize theresult and also it has diverse file format to save the plot result. Based on the extracted informationdifferent MATLAB scripts were created to read the extracted file and plot accordingly.
5.1.1 ThroughputThe throughput metrics was measured to analyze the rate at which the packets are being transmit-ted and received. It was tested for different packet size against the different transmission interval.The test was conducted for several trials and the final result was measured based on all the resultsaverage. The throughput plot for R-SV transmission is shown in Figure 5.1.
An interesting finding of the test was the decrease in overall throughput when the packet size isincreased beyond 950 bytes which can be seen in Figure 5.1. The observed behavior was commonfor all the transmission interval and is more prominent when the number of packets transmit-ted every second is more i.e for transmission interval 5 and 10 ms. The throughput drop observedranges from 15% for lower transmission interval 5ms to 5% for higher transmission interval of 25 ms.
The potential reason for this throughput drop may be due to the resource limitation in thecore network or an issue with the network scheduler. Another potential reason may be due topacket segmentation i.e. splitting of larger packets. Splitting of larger packet into two increasesthe overhead, thereby reducing the throughput.
5.1.2 LatencyThe latency metrics was the measure to understand the delay imposed on the packet by the non-commercial LTE network while traversing from source to destination. Figure 5.2 shows the averagelatency for different packet sizes and transmission intervals. This to examine if packets with lesssize traverse the network faster than bigger packets. The average latency observed was around 22ms.
49

Packet Size (Bytes)400 600 800 1000 1200 1400 1600 1800 2000 2200 2400
Th
rou
gh
pu
t (p
ackets
/sec)
20
40
60
80
100
120
140
160
180
200
Throughput v/s Packet Size For Different Transmission Interval
Transint 5Transint 10Transint 15Transint 20Transint 25
Figure 5.1: Throughput graph of different transmission intervals against different packet sizes
Tranmission Interval5 10 15 20 25
late
ncy (
msec)
10
12
14
16
18
20
22
24
26
28
30Latency v/s Tranmission Interval for different Packet Size Graph
PacketSize 0537PacketSize 0737PacketSize 0937PacketSize 1137PacketSize 1369
Figure 5.2: latency for different transmission interval and packet size
Page 50

Latency (sec)0.015 0.02 0.025 0.03 0.035 0.04 0.045 0.05
CD
F
0
0.1
0.2
0.3
0.4
0.5
0.6
0.7
0.8
0.9
1
CDF v/s Latency For Different Transmission Interval
TransInt 5TransInt 10TransInt 15TransInt 20TransInt 25
Figure 5.3: Cumulative Distribution Frequency of latency
The average latency increases slightly with packet size. For e.g. For transmission interval of10 ms, the average latency for 537 bytes the latency is around 17 ms and for packet size 1369bytes is around 22ms as can be seen in the latency graph. This trend is not uniform which is anunexpected behavior. Hence CDF was calculated for the latency test to analyze the trend. Figure5.3 shows the Cumulative Distribution Function i.e. occurrence of a certain latency for differenttransmission intervals. CDF was measured by grouping the latency value of packet size and all itstrial into a single transmission interval.
The CDF graph shows maximum latency observed was around 45 ms. The CDF characteris-tics of Transmission interval 10ms and 25ms shows a different behavior than other 3 transmissioninterval. On analyzing the results, it was found transmission interval 10ms and 25ms has largerstandard deviation.
A potential reason for larger deviation may be due to software limitation as the protocol stackwas emulated in a personal computer which was running other application as well. Other reasoncould be congestion in the network and public internet access in LTE network.
5.1.3 ReliabilityThe reliability plot is presented in Figure 5.4. Reliability was measured to understand the effi-ciency at which the packets are received and drop in a non-commercial LTE network. Networkwas expected to be highly reliable and the expected average reliability was around 99.99%.
Figure 5.4 shows measured reliability decreases with the time interval. During the start, the
Page 51

Time (1 Unit= 17msec)0 500 1000 1500 2000 2500 3000 3500
Re
lia
bil
ity
(in
%)
98.5
99
99.5
100
100.5
101
101.5Reliability v/s Time Plot
Reliability
Figure 5.4: Reliability for SV over a period of 60 seconds
application takes some time to stabilize which results in the huge dip in the graph. As the timeprogress, the reliability tends to stabilize for some time and once again packet drop is observedin the network. These packet drop results in decreasing the overall reliability to 99.7% even afterstabilizing which is less from the expected result. This drop in reliability would affect the perfor-mance and is highly undesirable.
On analyzing the Wireshark, it was found that the packets that were dropped not were receivedon the receiving interface. So, the packet is dropped while traversing the network. The potentialreason may be the public internet, congestion or network unavailability.
5.1.4 AvailabilityFigure 5.5 shows the availability plot of LTE network for a duration of 24 hours. One R-SV packetper second was continuously exchanged between the machine and the plot was taken for every 5min interval reading.
As can be seen in Figure 5.5, the network availability of the non-commercial 4G LTE dropsbelow 94% between 9:00 AM and 1:00 PM. The drop in network availability was due to an occur-rence of more packet drop during that time interval and is shown in the graph by a huge dip.
the potential reason for this behavior could be due to congestion in the public network or maythe core network infrastructure is used somewhere else. On discussing with the network provider,it was found out that the network was not dedicated for the test.
Page 52

Time (4:35 PM till 4:35 PM next day)4:35PM 8:40PM 12:50AM 5:00AM 9:10AM 1:20PM 5:30PM
Availa
bili
ty (
%)
93
94
95
96
97
98
99
100
101Availability v/s Time Graph
Availability
Figure 5.5: Availability of the LTE network in 24 hours
Page 53

6 | Conclusion and Future Work
Technical Report IEC 61850-90-5 provides a way to exchange routable GOOSE and SV message ina public IP network such as Long Term Evolution and 5G. LTE has evolved significantly over thepast few years and could play an important role to be the suitable solution for wireless communica-tion in a smart grid infrastructure. The thesis work evaluates the performance of non-commercialLTE for smart grid applications such as Wide Area Monitoring Protection and Control.
An IEC 61850-90-5 model with new session layer and data packed in Routed- Sample Valueformat as defined in the technical report was developed during the thesis work. The modified R-SV packets representing the synchrophasor information was exchanged between two machines thatemulate a virtual Intelligent Electronic Device over a non-commercial LTE environment. Com-munication metrics such as throughput, reliability, availability, and latency were considered tobenchmark the performance of non-commercial LTE. Different test cases were formulated to mea-sure and calculate these metrics.
The routable GOOSE and SV packet proposed in the technical report will be key in utilizingwireless communication for smart grid application. LTE provides flexibility and scalability withlow deployment cost. LTE in combination with IEC 61850-90-5 can play a major role in replacingthe existing wired communication model in a smart grid. Also, it would play a major role inMachine-to-Machine communication.
The test presented in the report is to analyze the readiness of IEC 61850-90-5 protocol andits applicability in combination with non-commercial LTE. It can be concluded from the obtainedresult that LTE would be a suitable solution for wireless communication for most of the smartgrid application. But there is still some major optimization to be implemented in LTE networkalong with QoS priority to support its complete usage in applications with stringent requirementson communication network performance.
The network throughput test was conducted to understand the effect of packet size and trans-mission rate combination in data transmission rate. The result shows the gradual decrease intransmission speed when is increased beyond 950 Bytes for lower transmission interval. The trans-mission frequency drop observed was around 15% for lower transmission interval of 2ms (i.e. 200packets transmitted per second).
The highest latency observed was around 45ms which could affect the performance. The avail-ability and reliability result was crucial to analyze the LTE network stability. The overall resultshows poor network performance during the 9:00 AM and 1:00 PM time. The poor availability hasalso resulted in lower reliability. The overall reliability observed was 99.7% which is below thanthe expected reliability of 99.99%. This can be improved by using a dedicated network.
55

The innovation in cellular communication has gained the interest of many researchers to useit for the different application. Utilization of cellular communication for smart grid applicationwould be key in coming days. The existing non-commercial LTE could give better performance andresult for time demanding smart grid application when provided with the dedicated connection andenhance QoS for smart grid packets. Additional with the trend moving from 4G to 5G, cellular com-munication would have a great impact in strengthening the backbone of smart grid communication.
Future Work
The main work of the thesis work was to study the usability of LTE for time-critical smart gridapplication. To define LTE applicability, various communication metrics such as throughput, relia-bility, latency, and availability was considered. Another aspect such as security was not considereddue to time restriction and is kept for future.
A comprehensive analysis of IEC 61850-90-5 standard was done. The complete implementa-tion was beyond the scope of the project and hence only packet structuring, data integrity checkand UDP/IP transmission were covered in the development process. Security and enhancing thereliability of the sent packet was kept for future work.
The test cases run to evaluate the performance of non-commercial LTE were limited due totime restriction. More test trial can be run to get more accurate result. Also, all the test exceptthe availability test was performed during the office hour between 9 AM to 6 PM. Running thesame test cases during the non-office hour would give a different result and is kept for future work.
Page 56

Bibliography
[1] IEEE Standard for Synchrophasor Measurements for Power Systems (C37.118.1-2011).IEEE, 2011.
[2] IEEE Std C37.118.2-2011 (Revision of IEEE Std C37.118-2005). IEEE, 2011.
[3] “IEC communication networks and systems for power utility automation - part 90-5: Use ofiec 61850 to transmit synchrophasor information according ieee c37.118, ed 1.0.” InternationalElectrotechnical Commission, Tech. Rep., May 2012.
[4] H. Falk, M. Adamiak, D. Baigent, and V. Madani, “An overview of the new iec 61850 syn-chrophasor publish-subscribe profile,” in Protective Relay Engineers, 2013 66th Annual Con-ference for. IEEE, 2013, pp. 309–321.
[5] G. Karagiannis, G. T. Pham, A. D. Nguyen, G. J. Heijenk, B. R. Haverkort, and F. Campfens,“Performance of lte for smart grid communications.” in MMB/DFT. Springer, 2014, pp. 225–239.
[6] A. Kheaksong, A. Prayote, and W. Lee, “Performance evaluation of smart grid communi-cations via network simulation version 3,” in Electrical Engineering/Electronics, Computer,Telecommunications and Information Technology (ECTI-CON), 2016 13th International Con-ference on. IEEE, 2016, pp. 1–5.
[7] G. M. Shrestha and J. Jasperneite, “Performance evaluation of cellular communication systemsfor m2m communication in smart grid applications,” Computer Networks, pp. 352–359, 2012.
[8] P. Ferrari, A. Flammini, M. Loda, S. Rinaldi, D. Pagnoncelli, and E. Ragaini, “First exper-imental characterization of lte for automation of smart grid,” in Applied Measurements forPower Systems (AMPS), 2015 IEEE International Workshop on. IEEE, 2015, pp. 108–113.
[9] S. R. Firouzi, L. Vanfretti, A. Ruiz-Alvarez, F. Mahmood, H. Hooshyar, and I. Cairo, “Aniec 61850-90-5 gateway for ieee c37. 118.2 synchrophasor data transfer,” in Power and EnergySociety General Meeting (PESGM), 2016. IEEE, 2016, pp. 1–5.
[10] H. Chen, T. N. Cong, W. Yang, C. Tan, Y. Li, and Y. Ding, “Progress in electrical energystorage system: A critical review,” Progress in Natural Science, vol. 19, no. 3, pp. 291–312,2009.
[11] A. Shawkat, “Smart grids: Opportunities, developments, and trends,” IEEE Transactions2013-978-1-4471-5209-5, 2013.
[12] “Electric power system,” http://www2.econ.iastate.edu/classes/econ458/tesfatsion/images/ElectricPowerSystem.jpg, (Accessed on 06/14/2017).
57

[13] S. M. Kaplan, “Electric power transmission: background and policy issues,” US CongressionalResearch Service, April, vol. 14, pp. 4–5, 2009.
[14] Energy Information Administration, “EIA projects world energy consumption will increase56% by 2040,” https://www.eia.gov/todayinenergy/detail.php?id=12251, 25 July 2013, (Ac-cessed on 06/15/2017).
[15] A. Vallejo, A. Zaballos, J. M. Selga, and J. Dalmau, “Next-generation qos control architec-tures for distribution smart grid communication networks,” IEEE Communications Magazine,vol. 50, no. 5, pp. 128–134, 2012.
[16] V. C. Gungor, D. Sahin, T. Kocak, S. Ergut, C. Buccella, C. Cecati, and G. P. Hancke,“Smart grid technologies: Communication technologies and standards,” IEEE transactionson Industrial informatics, vol. 7, no. 4, pp. 529–539, 2011.
[17] “What is scada? supervisory control and data acquisition,” https://inductiveautomation.com/what-is-scada, (Accessed on 10/08/2017).
[18] R. H. Khan and J. Y. Khan, “A comprehensive review of the application characteristics andtraffic requirements of a smart grid communications network,” Computer Networks, vol. 57,no. 3, pp. 825–845, 2013. [Online]. Available: http://www.sciencedirect.com/science/article/pii/S1389128612003751
[19] V. C. Gungor, B. Lu, and G. P. Hancke, “Opportunities and challenges of wireless sensornetworks in smart grid,” IEEE transactions on industrial electronics, vol. 57, no. 10, pp.3557–3564, 2010.
[20] The SmartGrids European Technology Platform, http://www.smartgrids.eu/ETPSmartGrids, (Accessed on 06/15/2017).
[21] D. Von Dollen, “Report to nist on the smart grid interoperability standards roadmap,” ElectricPower Research Institute (EPRI) and National Institute of Standards and Technology, 2009.
[22] J. B. Ekanayake, N. Jenkins, K. Liyanage, J. Wu, and A. Yokoyama, Smart grid: technologyand applications. John Wiley & Sons, 2012.
[23] “Data communication in a substation automation system,” http://belden.picturepark.com/Website/Download.aspx?DownloadToken=024dba07-aaa4-40d5-ba60-ca30add4384b&Purpose=AssetManager&mime-type=application/pdf, July 2012, (Accessed on 06/19/2017).
[24] J. D. McDonald, Electric power substations engineering. CRC press, 2012.
[25] A. Leonardi, K. Mathioudakis, A. Wiesmaier, and F. Zeiger, “Towards the smart grid: sub-station automation architecture and technologies,” Advances in Electrical Engineering, vol.2014, 2014.
[26] S. Roostaee, R. Hooshmand, and M. Ataei, “Substation automation system using IEC 61850,”in Power Engineering and Optimization Conference (PEOCO), 2011 5th International. IEEE,2011, pp. 393–397.
[27] R. Mackiewicz, “Overview of IEC 61850 and Benefits,” in Power Systems Conference andExposition, 2006. PSCE’06. 2006 IEEE PES. IEEE, 2006, pp. 623–630.
[28] “IEC communication networks and systems for power utility automation part –1: Introductionand overview, ed 2.0.” International Electrotechnical Commission, Tech. Rep., 2013.
Page 58

[29] T. S. Sidhu and Y. Yin, “Modelling and simulation for performance evaluation of iec61850-based substation communication systems,” IEEE transactions on power delivery, vol. 22, no. 3,pp. 1482–1489, 2007.
[30] “IEC communication networks and systems in substations - part 6: Configuration descriptionlanguage for communication in electrical substations related to ieds , ed 2.0.” InternationalElectrotechnical Commission, Tech. Rep., Dec 2009.
[31] “IEC communication networks and systems in substations - part 7-2: Abstract communicationservice interface (acsi) , ed 2.0.” International Electrotechnical Commission, Tech. Rep., Aug2010.
[32] “IEC communication networks and systems in substations - part 7-4: Compatible logical nodeclasses data classes , ed 2.0.” International Electrotechnical Commission, Tech. Rep., Mar 2009.
[33] “IEC communication networks and systems in substations - part 7-3: Common data classes,ed 2.0.” International Electrotechnical Commission, Tech. Rep., Dec 2010.
[34] “IEC communication networks and systems in substations - part 8-1: Mapping to mms (iso9506-1 and iso 9506-2) and to iso/iec 8802-3 , ed 2.0.” International Electrotechnical Commis-sion, Tech. Rep., Jun 2011.
[35] “IEC communication networks and systems in substations - part 9-2: Sampled values overiso/iec 8802-3 , ed 2.0.” International Electrotechnical Commission, Tech. Rep., Sep 2011.
[36] “IEC Glossary - Abstract Communication Service Interface (ACSI),” http://std.iec.ch/terms/terms.nsf/9bc7f244dab1a789c12570590045fac8/6cb7f02cfa2274c9c12574ab0036770a?OpenDocument, (Accessed on 06/20/2017).
[37] “IEC Glossary - Specific Communication Service Mapping, SCSM ,” http://std.iec.ch/terms/terms.nsf/3385f156e728849bc1256e8c00278ad2/5b38de600b30bf1ec1256db10027c3a3?OpenDocument, (Accessed on 06/20/2017).
[38] S. C., Utility Communication networks and services specification, deployment and operation.Springer, 2017.
[39] D. Tholomier, H. Kang, and B. Cvorovic, “Phasor measurement units: Functionality andapplications,” in Power Systems Conference, 2009. PSC’09. IEEE, 2009, pp. 1–12.
[40] M. Rouse, “Asn.1 (abstract syntax notation one),” http://whatis.techtarget.com/definition/ASN1-Abstract-Syntax-Notation-One, Nov 2010, (Accessed on 08/17/2017).
[41] T. Mshvidobadze, “Evolution mobile wireless communication and lte networks,” in Applicationof Information and Communication Technologies (AICT), 2012 6th International Conferenceon. IEEE, 2012, pp. 1–7.
[42] M. Andersson, “Wireless technologies for industrial applications,” https://www.digikey.com/en/articles/techzone/2012/jan/wireless-technologies-for-industrial-applications, Jan 2012,(Accessed on 08/17/2017).
[43] Ericsson, “Lte: an introduction,” https://www.ericsson.com/res/docs/2011/lte_an_introduction.pdf, (Accessed on 08/31/2017).
Page 59

[44] I. Poole, “4g lte advanced tutorial,” http://www.radio-electronics.com/info/cellulartelecomms/lte-long-term-evolution/3gpp-4g-imt-lte-advanced-tutorial.php, (Ac-cessed on 08/31/2017).
[45] “What is throughput? - definition from whatis.com,” http://searchnetworking.techtarget.com/definition/throughput, (Accessed on 10/09/2017).
[46] B. Mitchell, “All about the effects of latency on computer networks,” https://www.lifewire.com/latency-on-computer-networks-818119, 20 Mar 2017, (Accessed on 08/18/2017).
[47] P. Kansal and A. Bose, “Bandwidth and latency requirements for smart transmission gridapplications,” IEEE Transactions on Smart Grid, vol. 3, no. 3, pp. 1344–1352, 2012.
[48] “IEC communication networks and systems in substations - part 5: Communication require-ments for functions and device models,” International Electrotechnical Commission, Tech.Rep., Jan 2013.
[49] C. Derman, G. J. Lieberman, and S. M. Ross, “On optimal assembly of systems,” NavalResearch Logistics (NRL), vol. 19, no. 4, pp. 569–574, 1972.
[50] “Reliability basics: Availability and the different ways to calculate it,” http://www.weibull.com/hotwire/issue79/relbasics79.htm, (Accessed on 10/09/2017).
[51] I. . U. Group, “Home - 90-5 open source site,” http://iec61850.ucaiug.org/90-5/default.aspx,(Accessed on 08/31/2017).
[52] “Meinberg ntp software downloads,” https://www.meinbergglobal.com/english/sw/ntp.htm,(Accessed on 08/21/2017).
Page 60

TRITA TRITA-ICT-EX-2017:175
www.kth.se