Embed Size (px)
Citation preview
Copyright © 2010 Accenture All Rights Reserved. Accenture, its logo, and High Performance Delivered are trademarks of Accenture.
Performance Engineering Sterling MCS-OM
- An Accenture Capability
Copyright © 2010 Accenture All Rights Reserved.
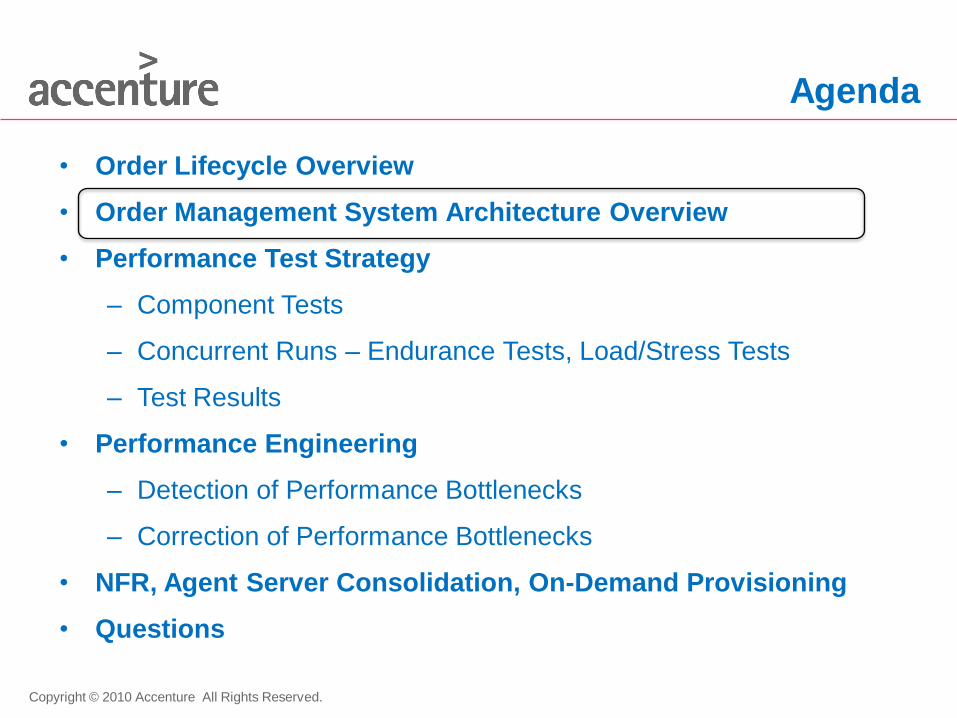
Agenda
• Order Lifecycle Overview
• Order Management System Architecture Overview
• Performance Test Strategy
– Component Tests
– Concurrent Runs – Endurance Tests, Load/Stress Tests
– Test Results
• Performance Engineering
– Detection of Performance Bottlenecks
– Correction of Performance Bottlenecks
• NFR, Agent Server Consolidation, On-Demand Provisioning
• Questions
Copyright © 2010 Accenture All Rights Reserved. 3
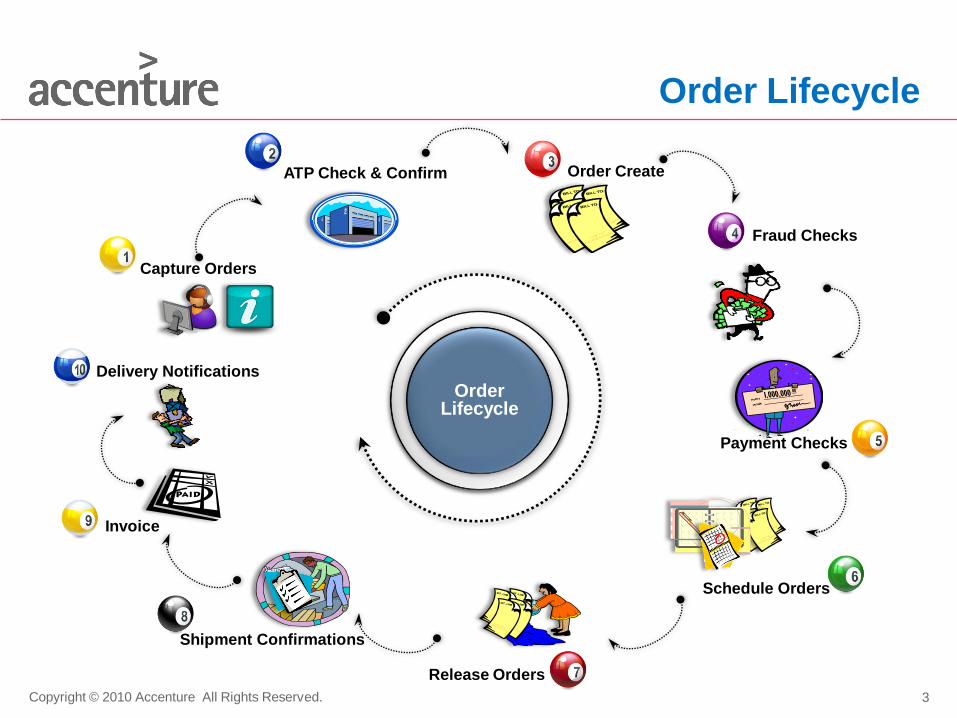
Order Lifecycle
Order Lifecycle
Capture Orders
ATP Check & Confirm Order Create
Fraud Checks
Payment Checks
Schedule Orders
Release Orders
Shipment Confirmations
Invoice
Delivery Notifications
Copyright © 2010 Accenture All Rights Reserved.
• Order Lifecycle Overview
• Order Management System Architecture Overview
• Performance Test Strategy
– Component Tests
– Concurrent Runs – Endurance Tests, Load/Stress Tests
– Test Results
• Performance Engineering
– Detection of Performance Bottlenecks
– Correction of Performance Bottlenecks
• NFR, Agent Server Consolidation, On-Demand Provisioning
• Questions
Agenda
Copyright © 2010 Accenture All Rights Reserved. 5
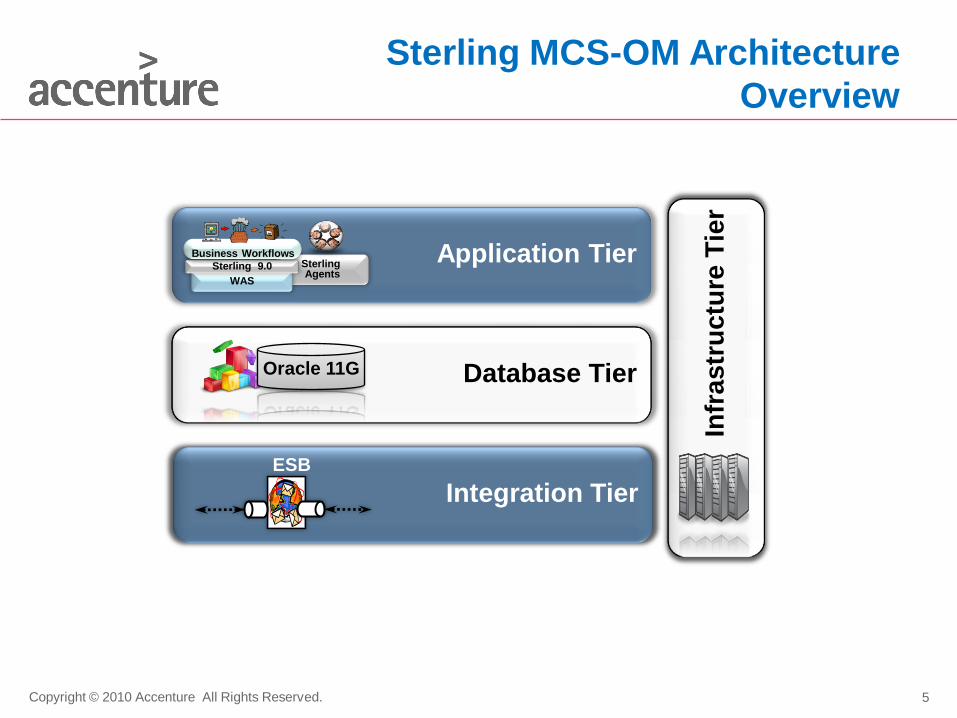
Sterling MCS-OM Architecture
Overview
Integration TierESB
Application TierSterling Agents
WAS
Sterling 9.0
Business Workflows
Infr
astr
uctu
re T
ier
Database TierOracle 11G
Copyright © 2010 Accenture All Rights Reserved.
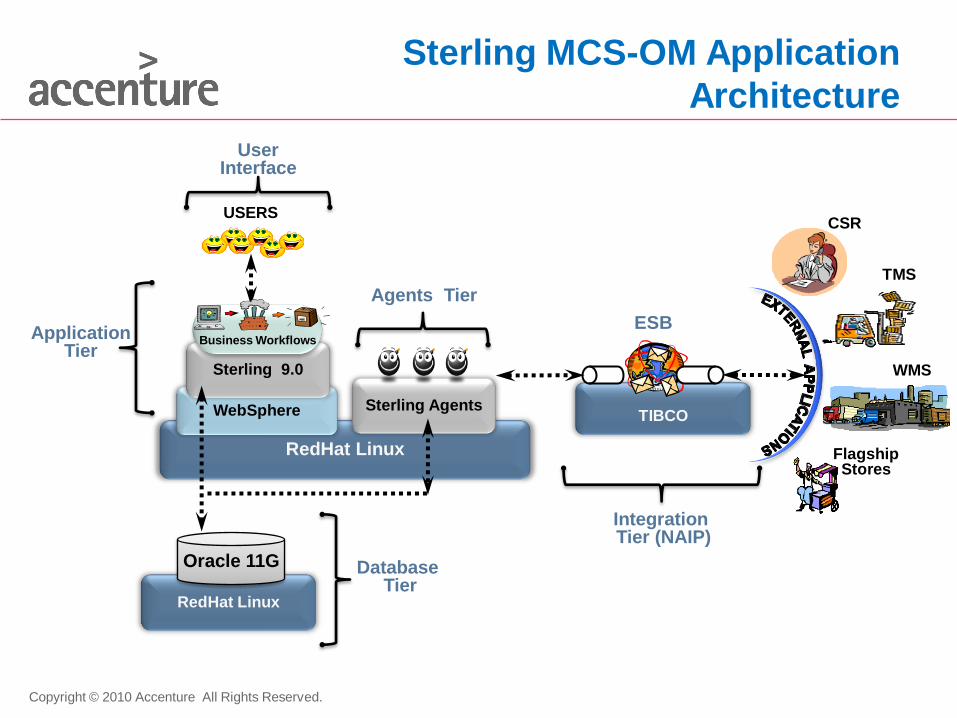
Sterling MCS-OM Application
Architecture
RedHat Linux
WebSphere
ESB
RedHat Linux
Oracle 11G
USERS
TMS
WMS
FlagshipStores
Sterling 9.0
Business Workflows
Database Tier
ApplicationTier
User Interface
Integration Tier (NAIP)
TIBCO
CSR
Sterling Agents
Agents Tier

Copyright © 2010 Accenture All Rights Reserved.
• Order Lifecycle Overview
• Order Management System Architecture Overview
• Performance Test Strategy
– Component Tests
– Concurrent Runs – Endurance Tests, Load/Stress Tests
– Test Results
• Performance Engineering
– Detection of Performance Bottlenecks
– Correction of Performance Bottlenecks
• NFR, Agent Server Consolidation, On-Demand Provisioning
• Questions
Agenda
Copyright © 2010 Accenture All Rights Reserved.
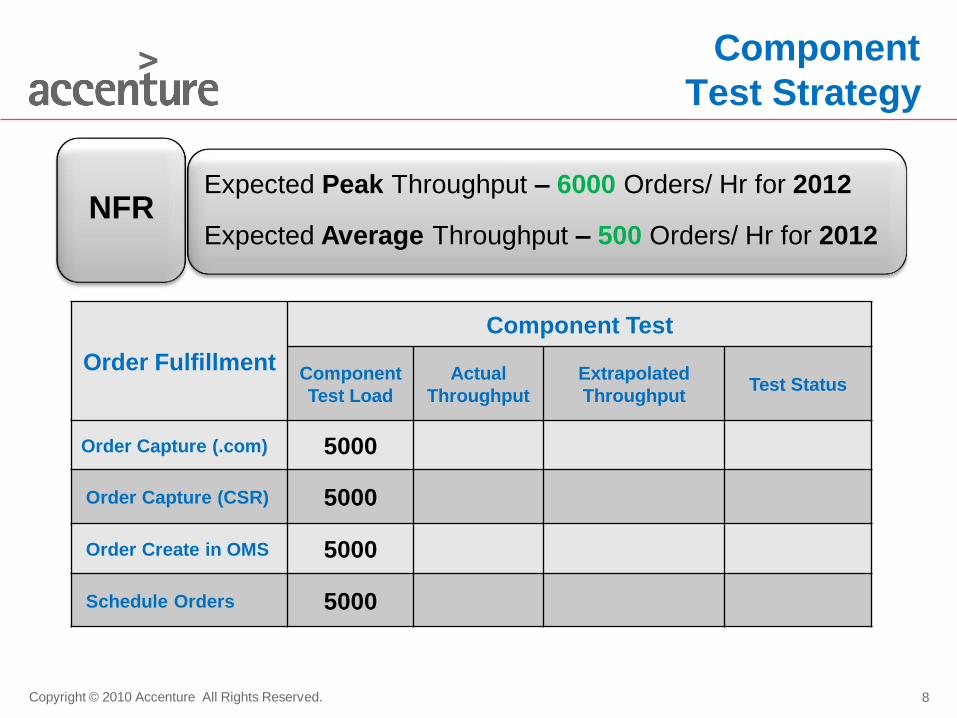
Component
Test Strategy
8
Order Fulfillment
Component Test
Component
Test Load
Actual
Throughput
Extrapolated
ThroughputTest Status
Order Capture (.com) 5000
Order Capture (CSR) 5000
Order Create in OMS 5000
Schedule Orders 5000
NFRExpected Peak Throughput – 6000 Orders/ Hr for 2012
Expected Average Throughput – 500 Orders/ Hr for 2012
Copyright © 2010 Accenture All Rights Reserved. 9
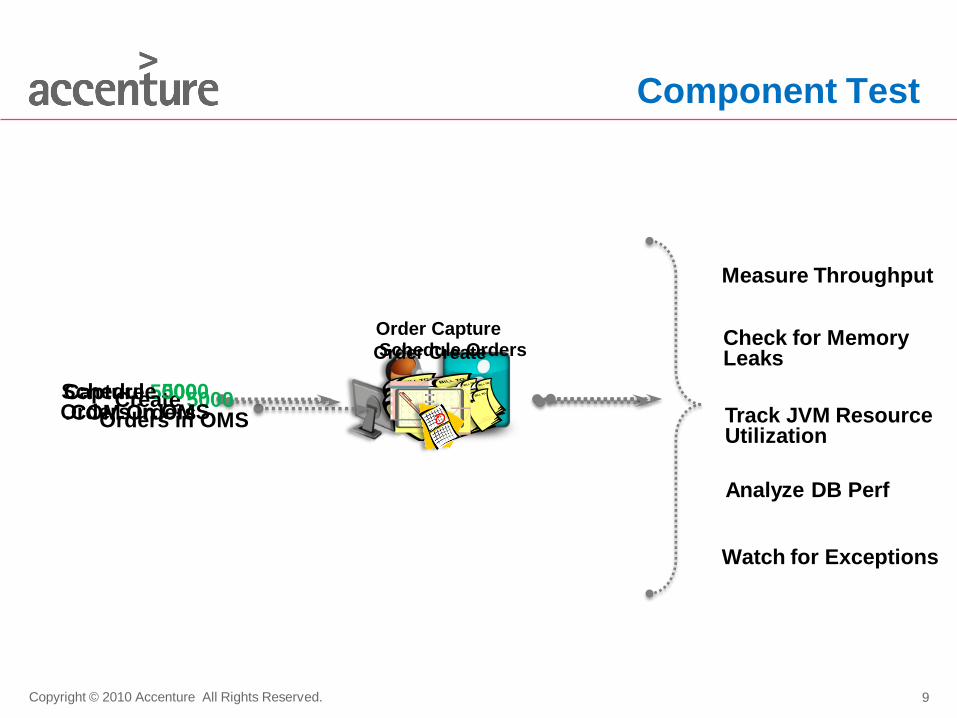
Component Test
Order Capture
Order CreateSchedule Orders
Capture 5000.COM Orders
Create 5000Orders in OMS
Schedule 5000Orders in OMS
Measure Throughput
Check for Memory Leaks
Watch for Exceptions
Track JVM Resource Utilization
Analyze DB Perf

Copyright © 2010 Accenture All Rights Reserved.
Component
Test Results
10
Order
Fulfillment
Component Test
Component
Test Load
Actual
Throughput
Extrapolated
ThroughputTest Status
Order Capture (.com) 5000 5 mins 60000/hr Passed
Order Capture (CSR) 5000 5 mins 60000/hr Passed
Order Create in OMS 5000 12 mins 25000/hr Passed
Schedule Orders 5000 65 mins 4615/hr FAILED
NFRExpected Peak Throughput – 6000 Orders/ Hr for 2012
Expected Average Throughput – 500 Orders/ Hr for 2012
Copyright © 2010 Accenture All Rights Reserved.
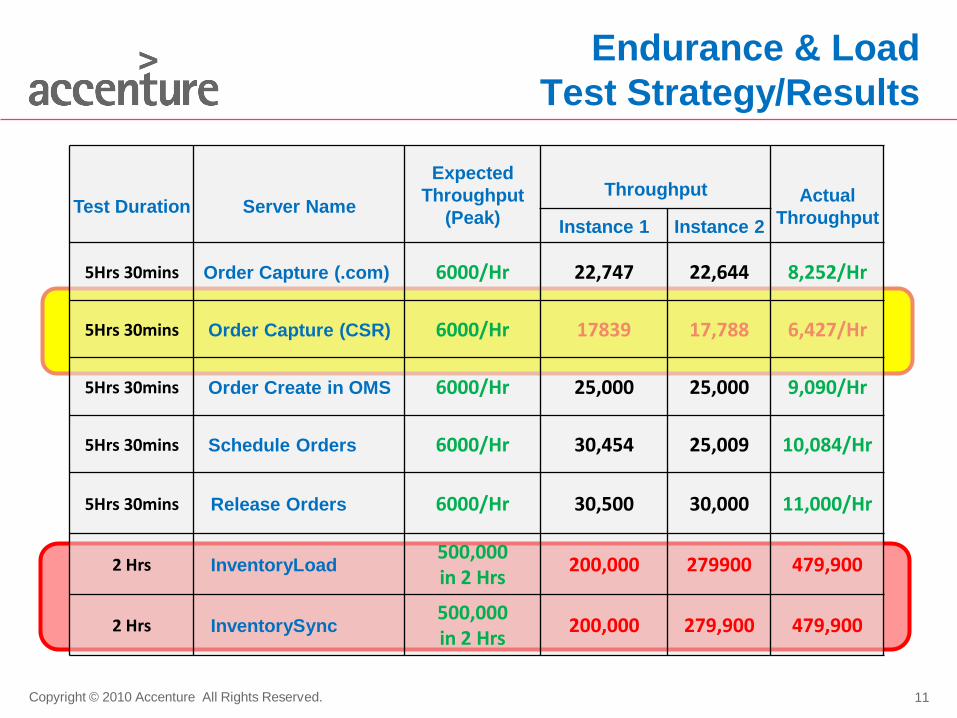
Endurance & Load
Test Strategy/Results
11
Test Duration Server Name
Expected
Throughput
(Peak)
Throughput Actual
ThroughputInstance 1 Instance 2
5Hrs 30mins Order Capture (.com) 6000/Hr 22,747 22,644 8,252/Hr
5Hrs 30mins Order Capture (CSR) 6000/Hr 17839 17,788 6,427/Hr
5Hrs 30mins Order Create in OMS 6000/Hr 25,000 25,000 9,090/Hr
5Hrs 30mins Schedule Orders 6000/Hr 30,454 25,009 10,084/Hr
5Hrs 30mins Release Orders 6000/Hr 30,500 30,000 11,000/Hr
2 Hrs InventoryLoad500,000 in 2 Hrs
200,000 279900 479,900
2 Hrs InventorySync500,000 in 2 Hrs
200,000 279,900 479,900
Copyright © 2010 Accenture All Rights Reserved.
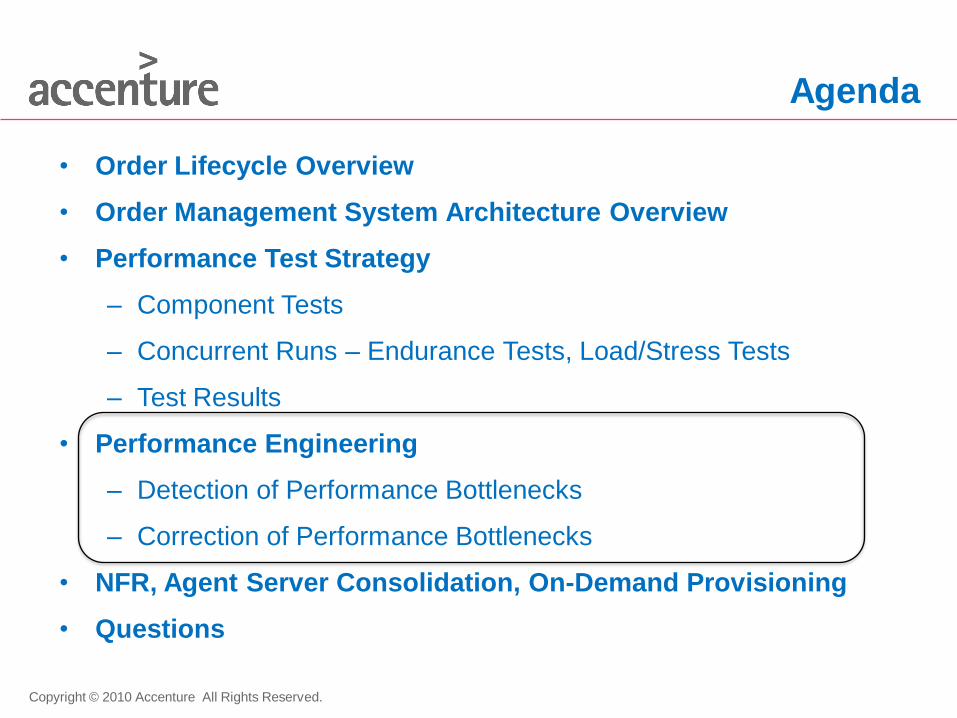
• Order Lifecycle Overview
• Order Management System Architecture Overview
• Performance Test Strategy
– Component Tests
– Concurrent Runs – Endurance Tests, Load/Stress Tests
– Test Results
• Performance Engineering
– Detection of Performance Bottlenecks
– Correction of Performance Bottlenecks
• NFR, Agent Server Consolidation, On-Demand Provisioning
• Questions
Agenda

Copyright © 2010 Accenture All Rights Reserved.
Detection of
Performance Bottlenecks
13
Tier Tools Employed
Application &
Agents Tier
GC Logs, Heap Dumps, Thread Dumps, Core
Dumps, Patrol Perceive
DB Tier OEM, AWR Reports
Integration TierMonitoring Inbound/Outbound rates, Patrol
Perceive
UI TierLoad Runner ( Response Time, Concurrent
Users)
Copyright © 2010 Accenture All Rights Reserved.
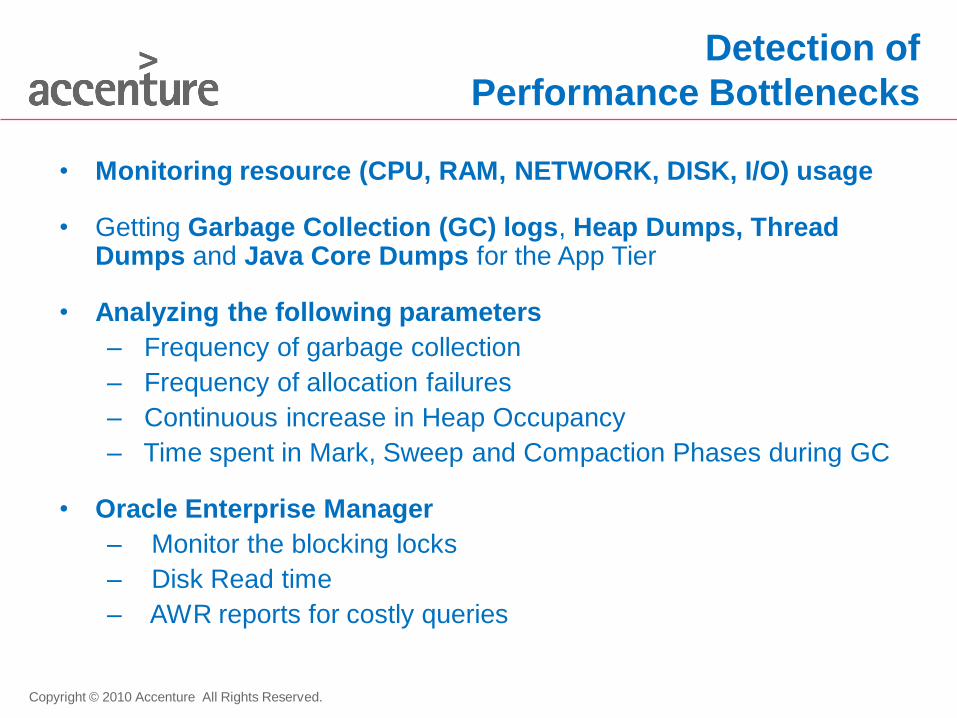
Detection of
Performance Bottlenecks
• Monitoring resource (CPU, RAM, NETWORK, DISK, I/O) usage
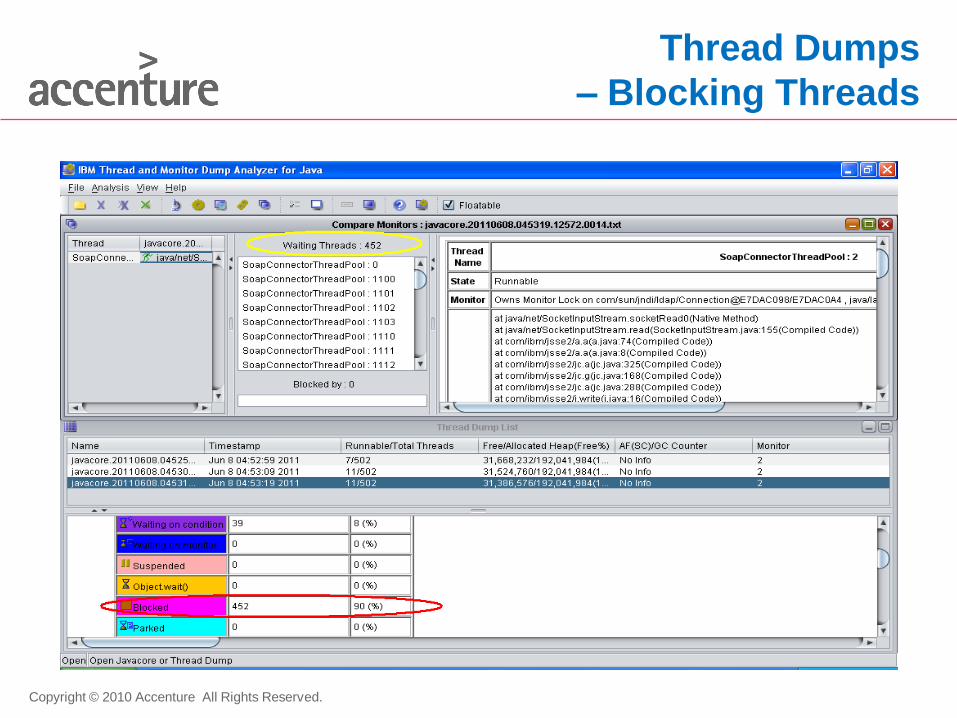
• Getting Garbage Collection (GC) logs, Heap Dumps, Thread Dumps and Java Core Dumps for the App Tier
• Analyzing the following parameters
– Frequency of garbage collection
– Frequency of allocation failures
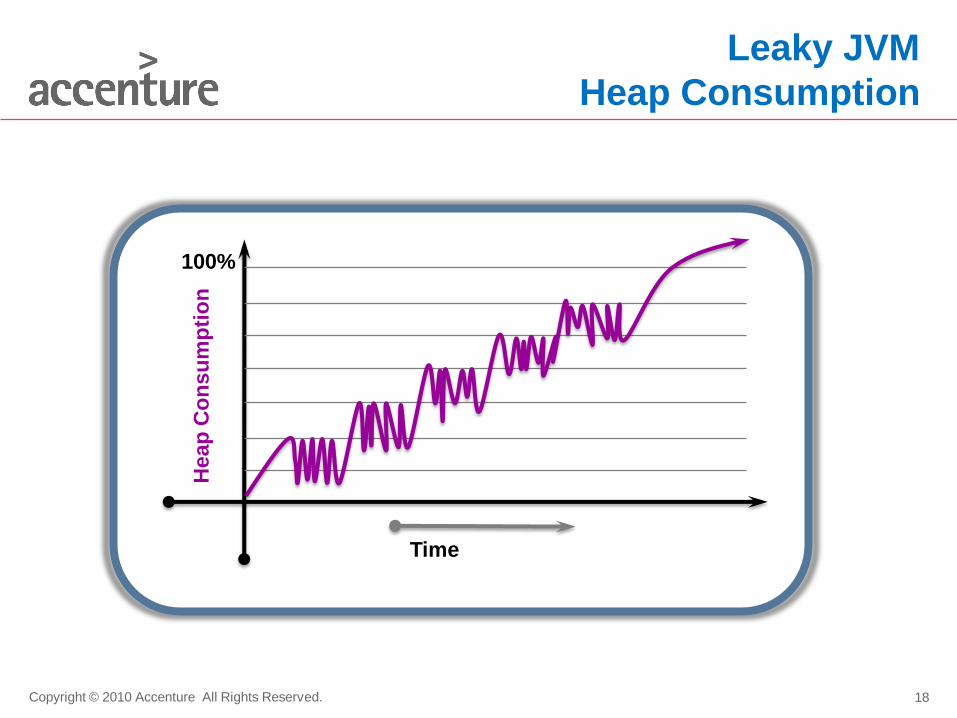
– Continuous increase in Heap Occupancy
– Time spent in Mark, Sweep and Compaction Phases during GC
• Oracle Enterprise Manager
– Monitor the blocking locks
– Disk Read time
– AWR reports for costly queries
Copyright © 2010 Accenture All Rights Reserved. 15
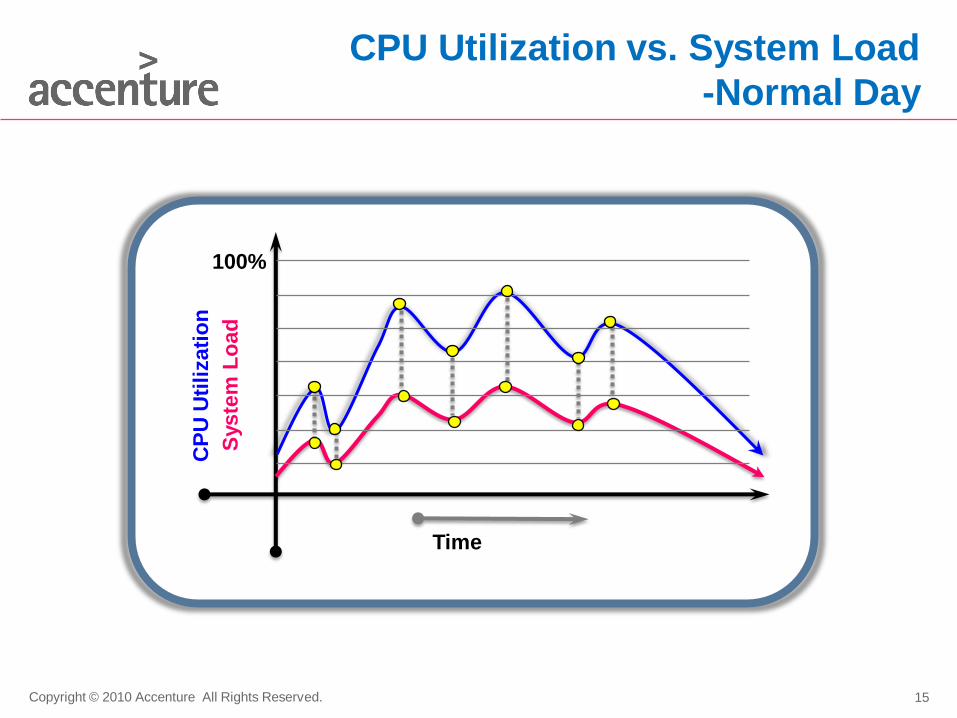
Time
CP
U U
tili
zati
on
Syste
m L
oa
d
100%
CPU Utilization vs. System Load
-Normal Day
Copyright © 2010 Accenture All Rights Reserved. 16
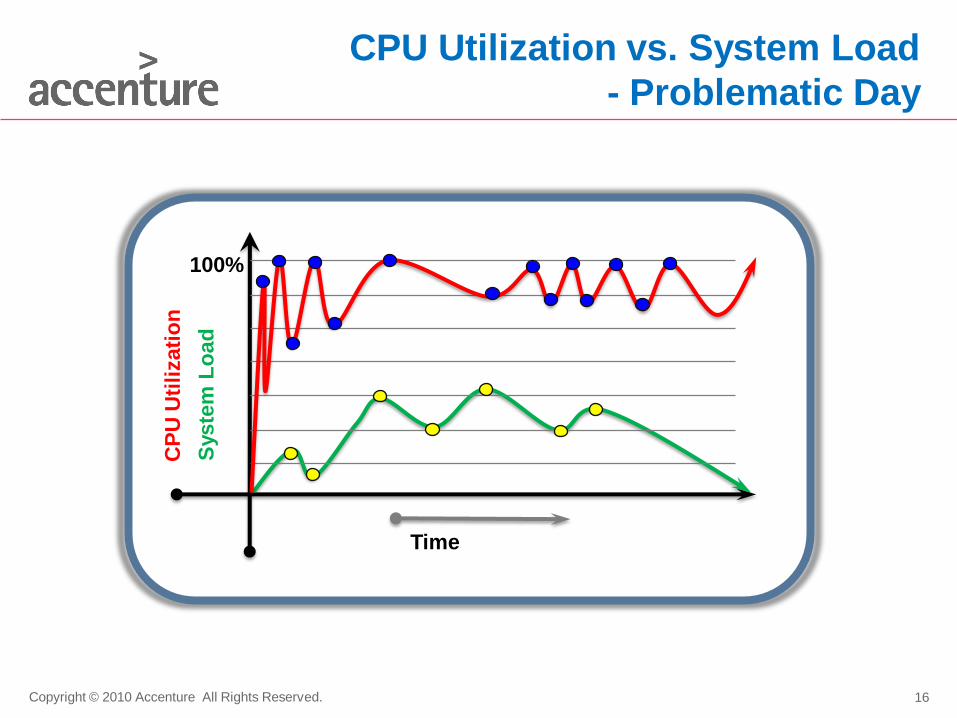
CPU Utilization vs. System Load
- Problematic Day
Time
100%
CP
U U
tili
zati
on
Syste
m L
oa
d
Copyright © 2010 Accenture All Rights Reserved. 17
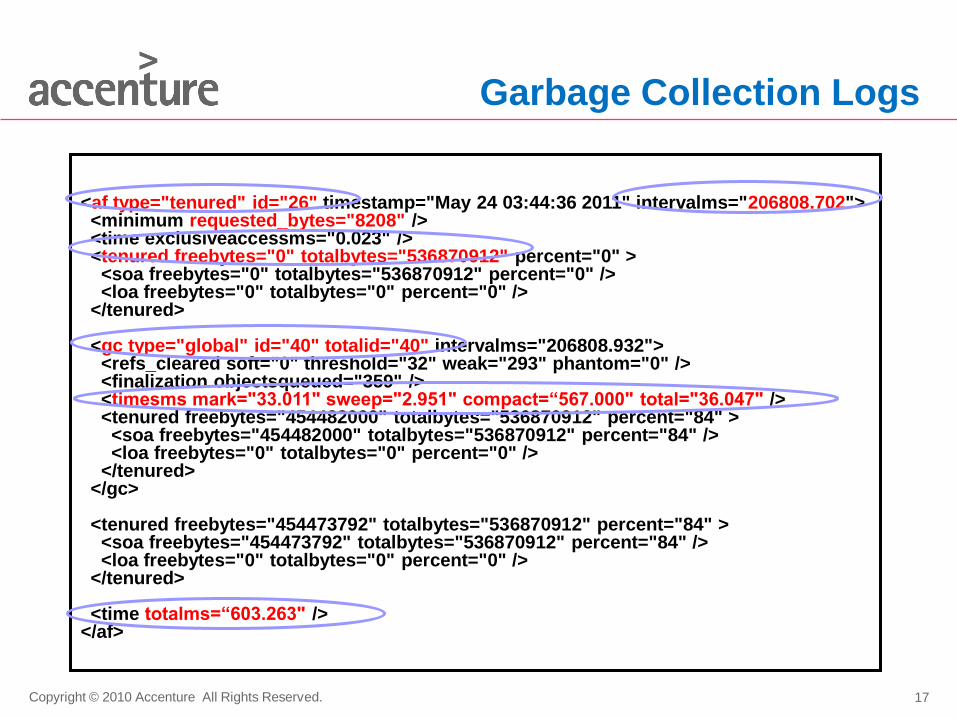
<af type="tenured" id="26" timestamp="May 24 03:44:36 2011" intervalms="206808.702"><minimum requested_bytes="8208" /><time exclusiveaccessms="0.023" /><tenured freebytes="0" totalbytes="536870912" percent="0" >
<soa freebytes="0" totalbytes="536870912" percent="0" /><loa freebytes="0" totalbytes="0" percent="0" />
</tenured>
<gc type="global" id="40" totalid="40" intervalms="206808.932"><refs_cleared soft="0" threshold="32" weak="293" phantom="0" /><finalization objectsqueued="359" /><timesms mark="33.011" sweep="2.951" compact=“567.000" total="36.047" /><tenured freebytes="454482000" totalbytes="536870912" percent="84" ><soa freebytes="454482000" totalbytes="536870912" percent="84" /><loa freebytes="0" totalbytes="0" percent="0" />
</tenured></gc>
<tenured freebytes="454473792" totalbytes="536870912" percent="84" ><soa freebytes="454473792" totalbytes="536870912" percent="84" /><loa freebytes="0" totalbytes="0" percent="0" />
</tenured>
<time totalms=“603.263" /></af>
Garbage Collection Logs
Copyright © 2010 Accenture All Rights Reserved. 18
Leaky JVM
Heap Consumption
Heap
Co
ns
um
pti
on
Time
100%
Copyright © 2010 Accenture All Rights Reserved.
Thread Dumps
– Blocking Threads
Copyright © 2010 Accenture All Rights Reserved.
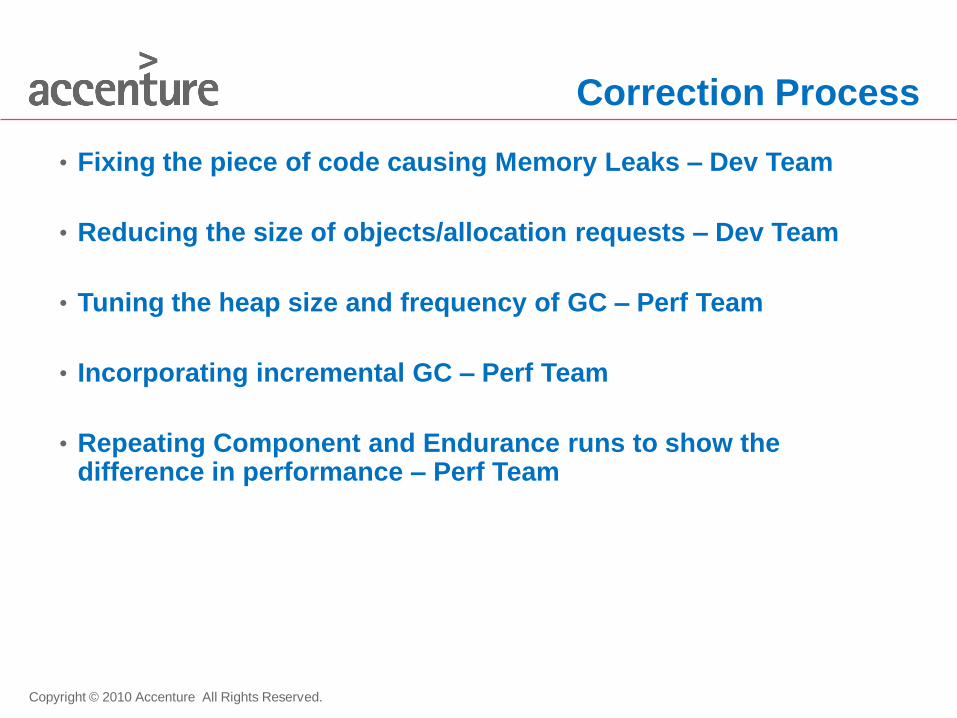
Correction Process
• Fixing the piece of code causing Memory Leaks – Dev Team
• Reducing the size of objects/allocation requests – Dev Team
• Tuning the heap size and frequency of GC – Perf Team
• Incorporating incremental GC – Perf Team
• Repeating Component and Endurance runs to show the difference in performance – Perf Team
Copyright © 2010 Accenture All Rights Reserved.
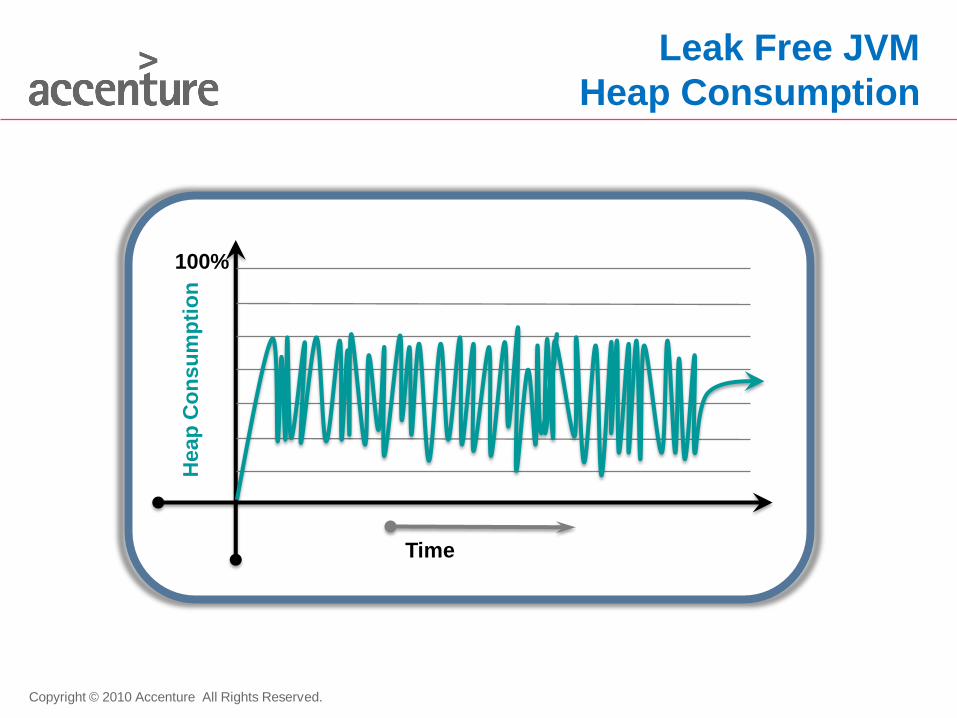
Leak Free JVM
Heap Consumption
Time
Heap
Co
ns
um
pti
on
100%
Copyright © 2010 Accenture All Rights Reserved.
• Order Lifecycle Overview
• Order Management System Architecture Overview
• Performance Test Strategy
– Component Tests
– Concurrent Runs – Endurance Tests, Load/Stress Tests
– Test Results
• Performance Engineering
– Detection of Performance Bottlenecks
– Correction of Performance Bottlenecks
• NFR, Agent Server Consolidation, On-Demand Provisioning
• Questions
Agenda
Copyright © 2010 Accenture All Rights Reserved.
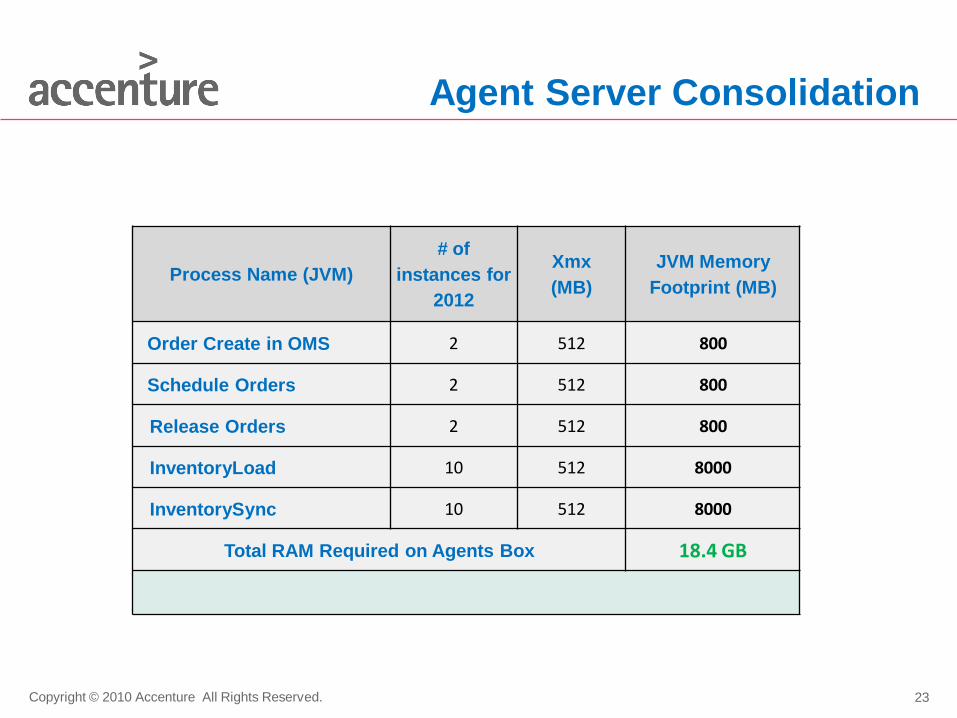
Agent Server Consolidation
23
Process Name (JVM)
# of
instances for
2012
Xmx
(MB)
JVM Memory
Footprint (MB)
Order Create in OMS 2 512 800
Schedule Orders 2 512 800
Release Orders 2 512 800
InventoryLoad 10 512 8000
InventorySync 10 512 8000
Total RAM Required on Agents Box 18.4 GB
Copyright © 2010 Accenture All Rights Reserved.
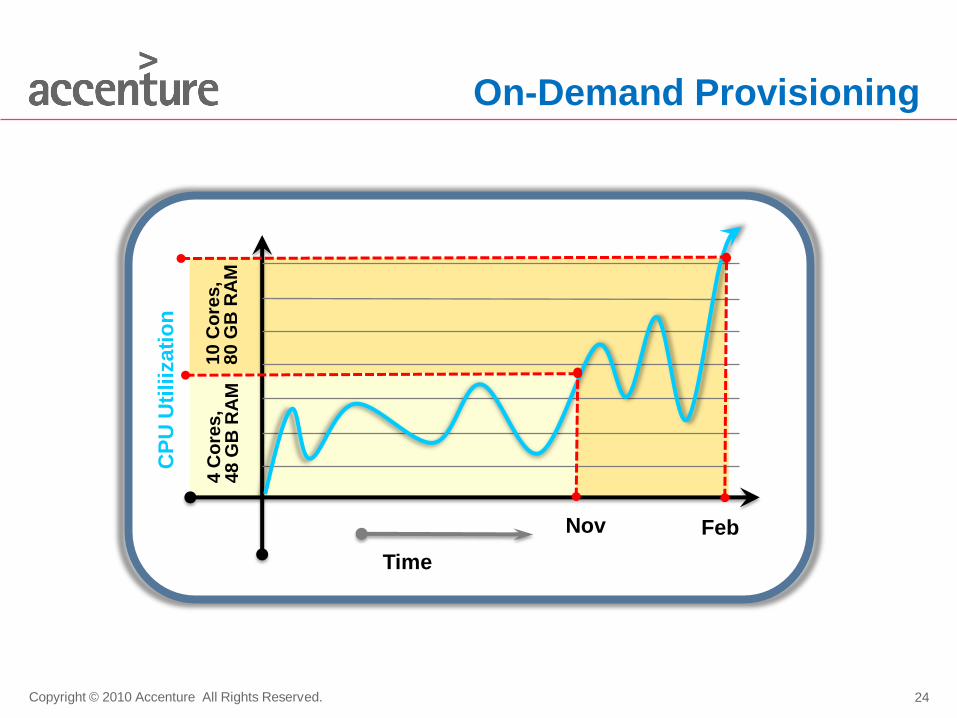
On-Demand Provisioning
24
Time
CP
U U
tili
izati
on
Nov
4 C
ore
s,
48 G
B R
AM
10 C
ore
s,
80 G
B R
AM
Feb
Copyright © 2010 Accenture All Rights Reserved.
THANK YOU!!
25