Embed Size (px)
Citation preview

Updated 07/28/20
The leading self-service intelligence platform for marketers to drive business outcomes across closed ecosystems.
PERFORMANCE DASHBOARDHow could machine learning insights help you capitalize on your highest performing ads?
KEY BENEFITS
Centralize and visualize spend and performance data across closed ecosystems.
Easily understand recommendations to improve performance based on audience, creative, and other valuable insights.
Create a shared view of performance across brand, creative, and media teams to align on how cross-channel campaigns are delivering on desired outcomes.
Save and immediately load specific performance views based on dates, custom labels, KPIs, and more.
Add historical benchmarks to compare period-over-period trends, including custom date periods.
POWERING PERFORMANCE DASHBOARD
Global Custom Metrics: Define and construct unique cross-platform KPIs through calculations that combine common data from outcomes ingested via Social BYOD feeds, direct third-party integrations, or native publisher metrics.
Labels: Use 4C’s unique flexible tagging system to organize your reporting dashboard with the most relevant information for your business segments and marketing campaigns.

Updated 07/28/20
The leading self-service intelligence platform for marketers to drive business outcomes across closed ecosystems.
PERFORMANCE DASHBOARD
INSIGHTSPowered by machine learning, the insights algorithm analyzes and places every line item into one of four actionable categories based on relative performance and spend. Each category is color coded and represents a recommended action to guide budget towards the highest performing line items.
Opportunities : Higher performance and lower spend than average. Action: increase budget.
Drivers: Higher performance and spend compared to average. Action: continue spending.
Draggers: Higher spend but lower performance than average. Action: decrease budget.
Sleepers: Lower spend and performance compared to average. Acton: consider further reducing spend or pausing.
HeatmapCompare multiple metrics for a specific or group of audiences, creatives, or labels. The Heatmap displays the performance category, spend, and default KPI for the cluster of creatives or audiences selected in the Quad Chart. The line item compass color highlights whether performance is above or below the average relative to all creatives or audiences with selected filters.
Quad Chart Understand how to optimize line items based on the quadrant they’re in and see the distribution of your brand across the four performance categories.
Audiences, creatives, and labels are grouped based on similar performance and spend and plotted to provide an overview into your insights. Quadrants are divided by your default KPI and spend averages.
Drill down into a cluster by selecting it to view its details in the heat map.
Updated 07/28/20
The leading self-service intelligence platform for marketers to drive business outcomes across closed ecosystems.
PERFORMANCE DASHBOARD
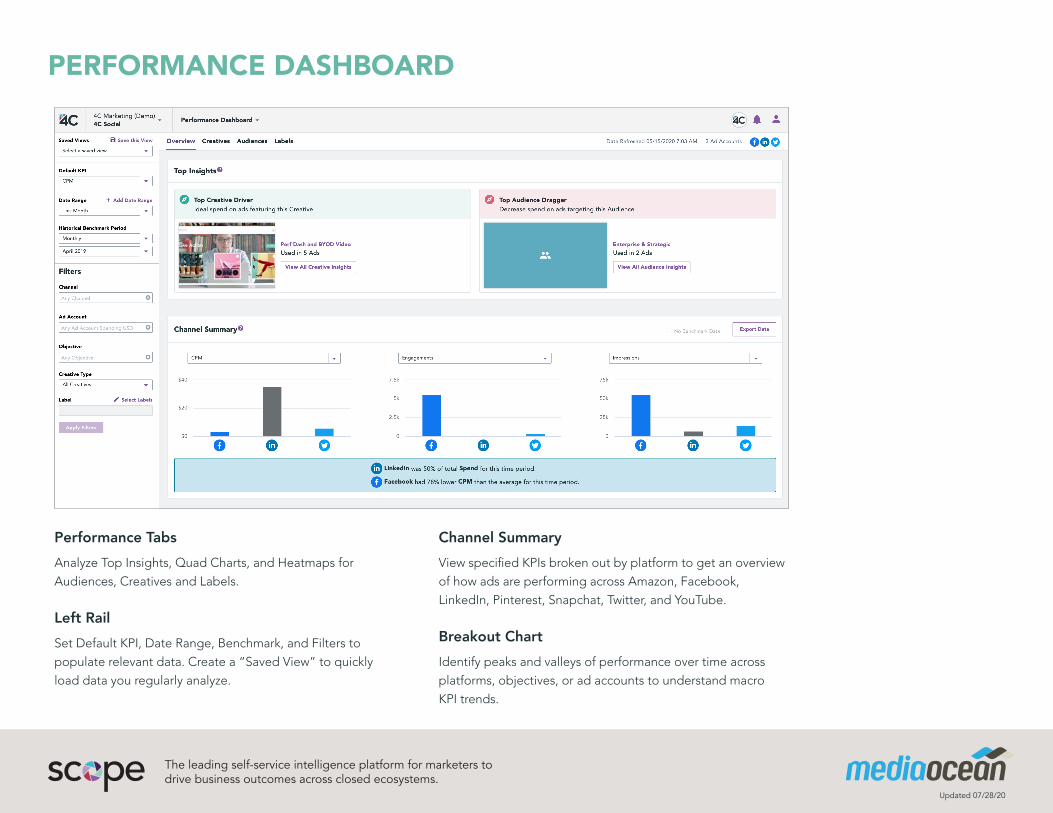
Performance TabsAnalyze Top Insights, Quad Charts, and Heatmaps for Audiences, Creatives and Labels.
Left RailSet Default KPI, Date Range, Benchmark, and Filters to populate relevant data. Create a “Saved View” to quickly load data you regularly analyze.
Channel SummaryView specified KPIs broken out by platform to get an overview of how ads are performing across Amazon, Facebook, LinkedIn, Pinterest, Snapchat, Twitter, and YouTube.
Breakout ChartIdentify peaks and valleys of performance over time across platforms, objectives, or ad accounts to understand macro KPI trends.