Embed Size (px)
Citation preview

International Journal of Mobile Network Communications & Telematics ( IJMNCT) Vol.1, No.1, September 2011
1
PERFORMANCE COMPARISON OF K-MEANS &CANNY EDGE DETECTION ALGORITHM ON MRI
IMAGES
Anu Sharma1 and Gulista2
Department of Computer Science & Engineering, College of EngineeringTeerthanker Mahaveer University, Moradabad, India
[email protected],[email protected]
ABSTRACT
MRI segmentation plays a crucial role in many medical imaging applications .Various approaches areapplied for the Segmentation of the MRI depending on the medical application, Image modality and otherfactors. The objective of this paper is to perform a segmentation process on MR images of the humanBrain using Kmeans Algorithm and Canny Edge Detection Algorthm. K-means Clustering algorithm givesus the segmented image of an MRI having the same intensity regions. K-means Clustering segments all thethree matters of the brain i.e. Grey matter, White matter and Dark matter. Also the edge detectionalgorithm is implemented that gives us the boundaries of the various regions of the MRI depending on scaleand threshold values used for the segmentation. Implementation of each algorithm is then discussed.Finally, the experimental results of each algorithm are presented and discussed. Following algorithm areused in this paper. Clustering is an unsupervised way of data grouping with a given measure of similarity.Clustering algorithms attempts to organize unlabeled feature vectors into clusters, such as samples withina cluster, that are more similar to each other than to samples belonging to different clusters, in which avalidity measure is computed for each set of clusters. The number of clusters, which optimizes this measure,is the optimum number of clusters in the data set. The purpose of multi-resolution image analysis is todecompose the image into multi-frequency representations to visualize contents of interest in variableresolutions. Multi-scale filtering such as the canny operator can detect the edges in the low contrast or lowS/N images. They are good edge detectors because they follow the optimal filter design criteria: goodlocalization and high S/N output.
KEYWORDS
Clustering Analysis, Medical Imaging, Thresholding Techniques, k-Means, Canny edge detector.
1. INTRODUCTION
Segmentation refers to the process of partitioning a digital image into multiple segments (sets ofpixels, also known as superpixels). The goal of segmentation is to simplify and/or change therepresentation of an image into something that is more meaningful and easier to analyze.[11]
Image segmentation is typically used to locate objects and boundaries (lines, curves, etc.) inimages. The result of image segmentation is a set of segments that collectively cover the entireimage, or a set of contours extracted from the image.[15]
Medical imaging refers to the techniques and processes used to create images of the human body(or parts thereof) for clinical purposes (medical procedures seeking to reveal, diagnose or

International Journal of Mobile Network Communications & Telematics ( IJMNCT) Vol.1, No.1, September 2011
2
examine disease) or medical science (including the study of normal anatomy and function). As adiscipline and in its widest sense, it is part of biological imaging and incorporates radiology (inthe wider sense), radiological sciences, endoscopy, (medical) thermography, medical photographyand microscopy (e.g. for human pathological investigations). Measurement and recordingtechniques which are not primarily designed to produce images, such as electroencephalography(EEG) and magneto encephalography (MEG) and others [16], but which produce data susceptibleto be represented as maps (i.e. containing positional information), can be seen as forms ofmedical imaging. In the clinical context, medical imaging is generally equated to radiology or"clinical imaging" and the medical practitioner responsible for interpreting (and sometimesacquiring) the image is a radiologist[1]. Magnetic resonance imaging (MRI) is an imagingtechnique used primarily in medical settings to produce high quality images of the inside of thehuman body. MRI is based on the principles of nuclear magnetic resonance (NMR), aspectroscopic technique used by scientists to obtain microscopic chemical and physicalinformation about molecules. Magnetic resonance imaging (MRI) is a noninvasive medical testthat helps physicians diagnose and treat medical conditions [2]. MR imaging uses a powerfulmagnetic field, radio frequency pulses and a computer to produce detailed pictures of organs, softtissues, bone and virtually all other internal body structures. The images can then be examined ona computer monitor, printed or copied to CD. MRI does not use ionizing radiation (x-rays).Detailed MR images allow physicians to better evaluate various parts of the body andcertain diseases that may not be assessed adequately with other imaging methods such as x-ray,ultrasound or computed tomography MRI, or magnetic resonance imaging, is a means of “seeing”inside of the body in order for doctors to find certain diseases or abnormal conditions. MRI doesnot rely on the type of radiation (i.e.,ionizing radiation) used for an x-ray or computedtomography (CT) scan. The MRI examination requires specialized equipment that uses apowerful, constant magnetic field, rapidly changing local magnetic fields, radiofrequency energy,and dedicated equipment including a powerful computer to create very clear pictures ofinternal body structure.
MR imaging of the head is performed to help diagnose:
• Tumors of the brain.• Developmental anomalies of the brain.• Disorders of the eyes and the inner ear.• Stroke.• Trauma patients (in selected patients).• C+auses of headache.
The main advantages of MR imaging system are:.
• It has an excellent capability for soft tissue imaging• It has very high resolution of the order of 1mm cubic voxels• It has high signal to noise ratio• Multi channel images with variable contrast can be achieved by using different pulse
sequences; this can be further utilized for segmenting and classifying differentstructures.[12]
2. MRI SEGMENTATION ALGORITHM
2.1 MRI Segmentation using Clustering Algorithm
Clustering is an unsupervised way of data grouping with a given measure of similarity. Clusteringalgorithms attempts to organize unlabeled feature vectors into clusters, such as samples within a

International Journal of Mobile Network Communications & Telematics ( IJMNCT) Vol.1, No.1, September 2011
3
cluster, that are more similar to each other than to samples belonging to different clusters, inwhich a validity measure is computed for each set of clusters. The number of clusters, whichoptimizes this measure, is the optimum number of clusters in the data set. The flowchart of theclustering approach is shown in Figure 1. The critical part of the clustering approach is choosingthe additional cluster center.[3,4]One of the most common clustering methods is the K meansalgorithm. In its first step, an initial mean vector iteration is arbitrarily specified for each of the Kclusters. Each pixel of the training set is then assigned to the class of which the mean vector isclosest to the pixel vector, forming the first set of decision boundaries. A new set of cluster meanvectors is then calculated from this classification, and the pixels are reassigned accordingly. Ineach iteration, the K means will tend to gravitate toward concentrations of data in nearby regionsof the feature space. The algorithm iterates until there is no significant change in pixelassignments. The criterion for terminating the iterative process can be defined in terms of the netmean migration from one iteration to the next.
.
Figure 1: Flowchart of the clustering approach.
Kmeans clustering algorithm was developed by J. MacQueen (1967), k-means clustering is analgorithm to classify or to group your objects based on attributes/features into K number of group.K is positive integer number. The grouping is done by minimizing the sum of squares of distancesbetween data and the corresponding cluster centroid. Thus the purpose of K-mean clustering is toclassify the data.[14]
International Journal of Mobile Network Communications & Telematics ( IJMNCT) Vol.1, No.1, September 2011
4
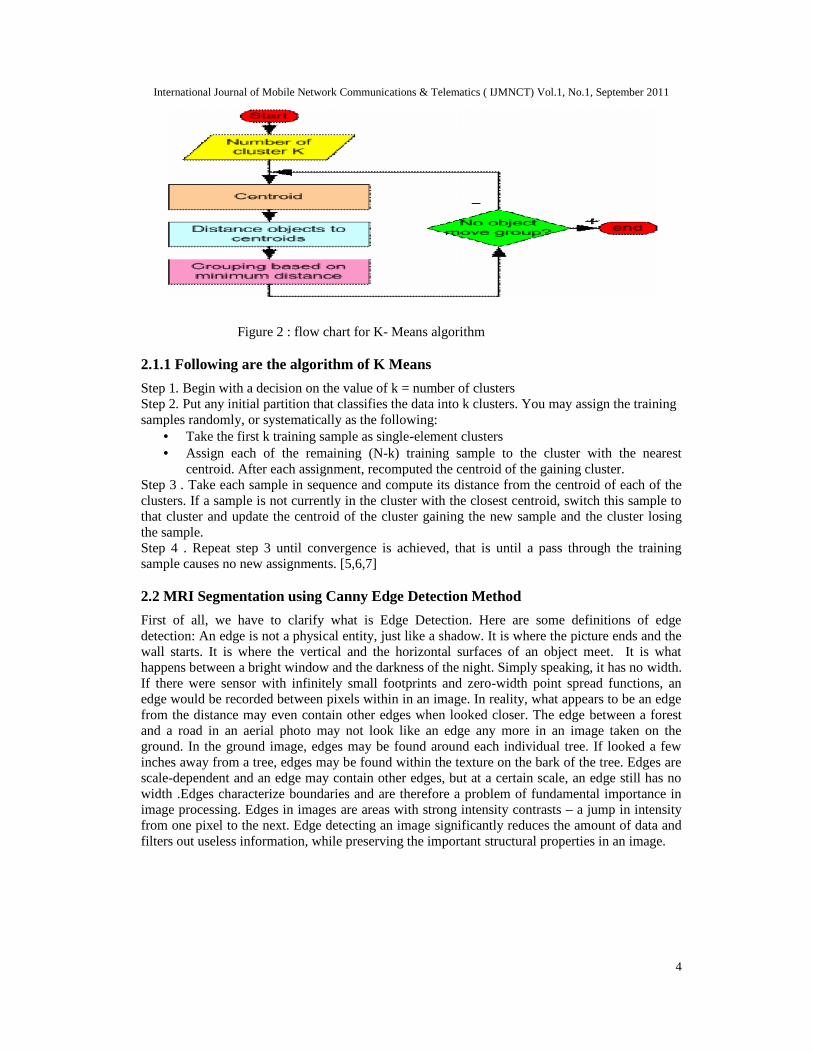
Figure 2 : flow chart for K- Means algorithm
2.1.1 Following are the algorithm of K Means
Step 1. Begin with a decision on the value of k = number of clustersStep 2. Put any initial partition that classifies the data into k clusters. You may assign the trainingsamples randomly, or systematically as the following:
• Take the first k training sample as single-element clusters• Assign each of the remaining (N-k) training sample to the cluster with the nearest
centroid. After each assignment, recomputed the centroid of the gaining cluster.Step 3 . Take each sample in sequence and compute its distance from the centroid of each of theclusters. If a sample is not currently in the cluster with the closest centroid, switch this sample tothat cluster and update the centroid of the cluster gaining the new sample and the cluster losingthe sample.Step 4 . Repeat step 3 until convergence is achieved, that is until a pass through the trainingsample causes no new assignments. [5,6,7]
2.2 MRI Segmentation using Canny Edge Detection Method
First of all, we have to clarify what is Edge Detection. Here are some definitions of edgedetection: An edge is not a physical entity, just like a shadow. It is where the picture ends and thewall starts. It is where the vertical and the horizontal surfaces of an object meet. It is whathappens between a bright window and the darkness of the night. Simply speaking, it has no width.If there were sensor with infinitely small footprints and zero-width point spread functions, anedge would be recorded between pixels within in an image. In reality, what appears to be an edgefrom the distance may even contain other edges when looked closer. The edge between a forestand a road in an aerial photo may not look like an edge any more in an image taken on theground. In the ground image, edges may be found around each individual tree. If looked a fewinches away from a tree, edges may be found within the texture on the bark of the tree. Edges arescale-dependent and an edge may contain other edges, but at a certain scale, an edge still has nowidth .Edges characterize boundaries and are therefore a problem of fundamental importance inimage processing. Edges in images are areas with strong intensity contrasts – a jump in intensityfrom one pixel to the next. Edge detecting an image significantly reduces the amount of data andfilters out useless information, while preserving the important structural properties in an image.

International Journal of Mobile Network Communications & Telematics ( IJMNCT) Vol.1, No.1, September 2011
5
The Canny edge detection algorithm is known to many as the optimal edge detector. Canny'sintentions were to enhance the many edge detectors already out at the time he started his work.He was very successful in achieving his goal and his ideas and methods can be found in his paper,"A Computational Approach to Edge Detection". In his paper, he followed a list of criteria toimprove current methods of edge detection. The first and most obvious is low error rate. It isimportant that edges occuring in images should not be missed and that there be NO responses tonon-edges. The second criterion is that the edge points be well localized. In other words, thedistance between the edge pixels as found by the detector. and the actual edge is to be at aminimum. A third criterion is to have only one response to a single edge. This was implementedbecause the first 2 were not substantial enough to completely eliminate the possibility of multipleresponses to an edge. [8] Canny specified three issues that an edge detector must address. Theyare:-
• Error rate:-The edge detector should respond only to edges, and should find all of them;no edges should be missed.
• Localization:- The distance between the edge pixels as found by the edge detector andthe actual edge should be as small as possible.
• Response:- The edge detector should not identify multiple edge pixels where only asingle edge exists. [9,10]
2.2.1 Steps:
Step 1. Apply derivative of GaussianStep 2. Non-maximum suppression .
• Thin multi-pixel wide “ridges” down to single pixel widthStep 3. Linking and thresholding
• Low, high edge-strength thresholds• Accept all edges over low threshold that are connected to edge over high threshold
To improve current methods of edge detectors we must follow:
• The first and most obvious is low error rate. It is important that edges occurring in imagesshould not be missed and that there be no responses to non-edges.
• The second criterion is that the edge points be well localized i.e., the distance between theedge pixels as found by the detector and the actual edge is to be at a minimum.
• A third criterion is to have only one response to a single edge [13]
3. IMPLEMENTATION
Proposed algorithm is implemented in .Net using C# language. Here we have presented somesnapshots of main page as well as comparisons of our algorithm with k means and canny edgedetector.

International Journal of Mobile Network Communications & Telematics ( IJMNCT) Vol.1, No.1, September 2011
6
3.1Main Page
3.1Implementation of K-Means Clustering Algorithm.

International Journal of Mobile Network Communications & Telematics ( IJMNCT) Vol.1, No.1, September 2011
7
3.2IMPLEMENTATION OF SAVE PATIENT RECORD
3.3Implementation of Search Patient Record

International Journal of Mobile Network Communications & Telematics ( IJMNCT) Vol.1, No.1, September 2011
8
3.4Implementation of canny edge detection algorithm with T1= 20 and T2=10
3.5 Implementation of Canny Edge Detection Algorithm with T1= 20 and
T2=59
4. RESULTS AND DISCUSSION
We have shown that Canny Edge Detection and K-means clustering algorithms are quite usefulfor retrieval of relevant images from image database. Our results indicate that the proposedapproach offers significant performance improvements in retrieval of medical images.Further, byfine tuning of shape feature extraction and using other shape feature extraction methods,performance of the retrieval process can be improved more.
1) The k-mean clustering provides a lower localization error, and qualitatively, a dramaticimprovement in edge detection performance over an existing edge detection method forspeckled imagery.

International Journal of Mobile Network Communications & Telematics ( IJMNCT) Vol.1, No.1, September 2011
9
2) The k-mean clustering meant to allow for balanced and well localized edge strengthmeasurements in bright regions as well as in dark regions.
3) The performance of the k-mean clustering has been demonstrated for edge-detectionspeckle reducing anisotropic diffusion.
4) This segmentation method can be develop by other project to get better view for medicalimage.
We conclude that following are the Disadvantages of Canny Edge Detector1) The Canny algorithm contains a number of adjustable parameters, which can affect the
computation time and effectiveness of the algorithm.2) The size of the Gaussian filter: the smoothing filter used in the first stage directly affects
the results of the Canny algorithm. Smaller filters cause less blurring, and allow detectionof small, sharp lines. A larger filter causes more blurring, smearing out the value of agiven pixel over a larger area of the image.
3) Thresholds: A threshold set too high can miss important information. On the other hand,a threshold set too low will falsely identify irrelevant information (such as noise) asimportant. It is difficult to give a generic threshold that works well on all images. Notried and tested approach to this problem yet exists.
4) Complex Computations,5) Time consuming
4.1 Error Analysis .
Figure 3:Image
TABLE 1: Noise Ratio of K-MEANS & CANNY Edge Detector
% ERROR RATENoise Ratio 0 20 50CANNY 4.1667 13.4766 21.5386K-MEANS 2.8212 5.3277 20.4861

International Journal of Mobile Network Communications & Telematics ( IJMNCT) Vol.1, No.1, September 2011
10
Figure 4: Noise Ratio Graph of K-MEANS & CANNY Edge Detector
TABLE 2: ENTROPY & MUTUAL INFORMATION (MI) OF CANNY EDGEDETECTORS & K-MEANS Algorithm
Figure 5: ENTROPY & MUTUAL INFORMATION (MI) GRAPH OF EDGEDETECTORS & K-MEANS Algorithm
The comparison of the segmented images are done by taking the entropy and mutual informationmeasures.The entropy of an image can be defined as a measure of the uncertainty associated witha random variable and it quantifies, in the sense of an expected value, the information containedin a message. Entropy of an image E returns a scalar value representing the entropy of grayscaleimage I. Entropy is a statistical measure of randomness that can be used to characterize the
Edge detectors MI EntropyCanny 0.0287 2.4095Sobel 0.0302 1.7232Roberts 0.0310 1.5261Prewitt 0.0308 1.6631K-Means 0.1369 5.6174

International Journal of Mobile Network Communications & Telematics ( IJMNCT) Vol.1, No.1, September 2011
11
texture of the input image. Entropy is defined as -sum (p.*log2(p)) where p contains thehistogram counts.
5. CONCLUSION
The Canny Edge Detection Algorithm contains a number of adjustable parameters, which canaffect the computation time and effectiveness of the algorithm. The size of the Gaussian filterused in the first stage directly affects the results of the Canny algorithm. Smaller filters cause lessblurring, and allow detection of small, sharp lines. A larger filter causes more blurring, smearingout the value of a given pixel over a larger area of the image. A threshold set too high can missimportant information.
On the other hand, a threshold set too low will falsely identify irrelevant information (such asnoise) as important. It is difficult to give a generic threshold that works well on all images.On the other hand, In K-Means Algorithm, the effect of noise is less than canny edge detectoralgorithm.Also in K-Means, quality of segmentation increases with increase in the number ofclusters but here the value of K is decided by us according to the nature of the MRI and theaccording to the application used.
6. FUTURE SCOPE OF K-MEANS ALGORITHMS
Kmeans algorithm segments the MRI on the basis of region intensity into K clusters. Hence all thethree matters of the Brain i.e. Grey matter, White matter and dark matter can be detected from theSegmented image. Also we note that quality of segmentation increases with increase in the numberof clusters but here the value of K is decided by us according to the nature of the MRI and theaccording to the application used. For example we can decide by seeing the image that how manyclusters should be there in the particular image. For example by seeing the number of colors in acolored MRI we can easily guess the value of k. In the snapshot a MRI is segmented with differentvalue of k which will give different results each time.
REFERENCES
[1] http://en.wikipedia.org/wiki/Medical_imaging
[2] http://www.cis.rit.edu/htbooks/mri/chap-1/chap-1.htm
[3] http://www.medscape.com/viewarticle/504669_2
[4] A.K. JAIN, M.N. MURTY AND P.J. FLYNN Data Clustering: A Review ACM ComputingSurveys, Vol. 31, No. 3, September 1999
[5] http://www.scribd.com/doc/53325215/k-mean
[6] Ching-Hsue Cheng, You-Shyang Chen * Classifying the segmentation of customer value via RFMmodel and RS theoryC.-H. Cheng, Y.-S. Chen / Expert Systems with Applications 36 (2009) 4176–4184
[7] http://www.scribd.com/doc/36541388/Brain-Tumor-Detection
[8] Canny Edge Detection Tutorial Author: Bill Green (2002)
[9] http://www.scribd.com/doc/29336195/Advanced-Edge-Detection-Techniques-b
[10] Kunal J Pithadiya ,Chintan K Modi ,Jayesh D Chauhan Selecting the Most Favourabl Edge DetectionTechnique for Liquid Level Inspection in Bottles International Journal of Computer InformationSystems and Industrial Management Applications (IJCISIM) http://www.mirlabs.org/ijcisim ISSN:2150-7988 Vol.3 (2011), pp.034
[11] http://en.wikipedia.org/wiki/K-means_clustering

International Journal of Mobile Network Communications & Telematics ( IJMNCT) Vol.1, No.1, September 2011
12
[12] Neeraj Sharma and Lalit M. Aggarwal1 Automated medical image segmentation technique J MedPhys. 2010 Jan–Mar; 35(1): 3–14. doi: 10.4103/0971-6203.58777 PMCID: PMC2825001
[13] H.S.Prasantha1 , Dr.Shashidhara.H.L2 ,Dr.K.N.B.Murthy3 ,Madhavi Lata.G4 Medical ImageSegmentation, H.S.Prasantha et. al. / (IJCSE) International Journal on Computer Science andEngineering , Vol. 02, No. 04, 2010, 1209-1218.
[14] http://www.codeproject.com/KB/recipes/K-Mean_Clustering.aspx.
[15] K.M.Murugesani, Dr. S.Palaniswami2, Efficient Color Image Segmentation using Multi-Elitiest-Exponerntial Practicle swarn Optimization, Journal of Theoretical and Applied InformationTechnology © 2005 - 2010 JATIT. All rights reserved.
[16] http://biomedikal.in/2011/01/an-introduction-to-medical-imaging-modalities-for-biomedical-beginners/
Authors
Anu Sharma born in India on November 18, 1984. She completed her B.Techfrom N.C college, Israna, Panipat(haryana) in 2006. She completed postgraduation from MMEC, Mullana, Ambala (haryana) in 2011.She is havingexperience of more than 4 years as lecturer. Presently working as a AssistantProfessor in Teerthanker Mahaveer University,Moradabad(u.p).
Gulista Khan born in India on September, 30, 1985. She completed his B. Tech.from Shri Krishan Institute of Engineering And Technology, Kurukshetra in 2006.She completed Post Graduation (M. Tech.) from MMEC,Mullana in 2009. She ishaving Experience of more than 4.5 years as lecturer in Haryana Engineeringcollege. Presently she is working as Assistant Professor in the Department ofComputer Science and Engineering at Teerthankar Mahaveer University .


![1 2 Profile: DCE MRI Quantification 5 Reviewed Draft ...qibawiki.rsna.org › images › 1 › 12 › DCE-MRI... · 41 fit-for-purpose quantitative transfer constant (K trans)[1]](https://img.pdfslide.us/doc/110x75/5f042e737e708231d40cb6f4/1-2-profile-dce-mri-quantification-5-reviewed-draft-a-images-a-1-a-12.jpg)