Embed Size (px)
Citation preview
Copyright© 2013 TDK Corporation. All rights reserved. - 1 -Oct 31, 2013Performance Briefings First Half of Fiscal Year March, 2014
TDK Corporation October 31, 2013
Performance BriefingsFirst Half of
Fiscal Year March, 2014
Copyright© 2013 TDK Corporation. All rights reserved. - 2 -Oct 31, 2013Performance Briefings First Half of Fiscal Year March, 2014
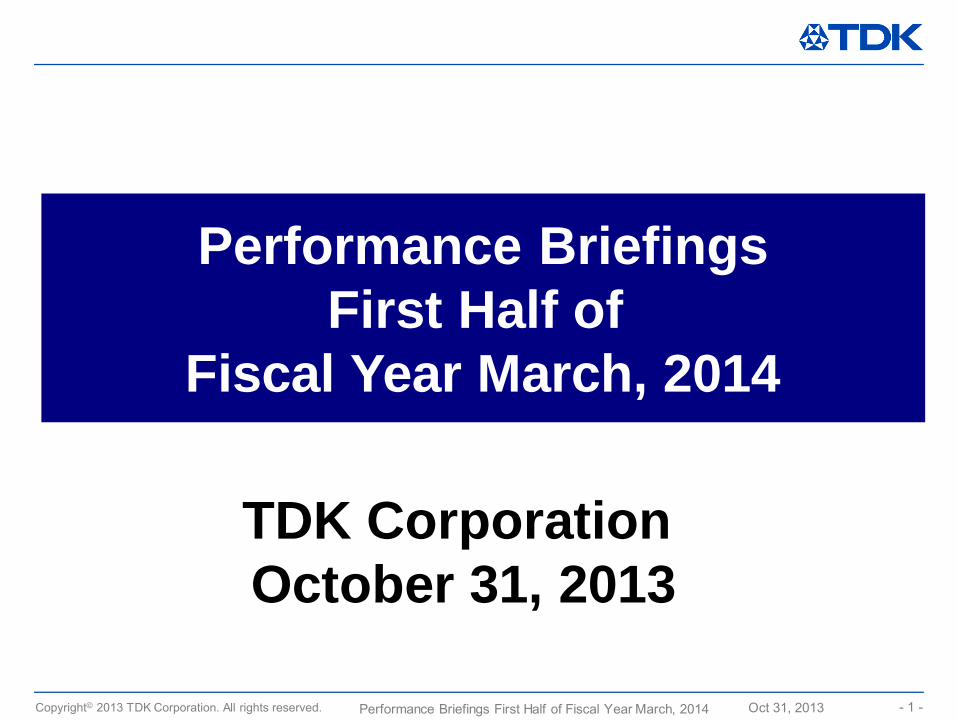
◆Consolidated First Half Results of FY March, 2014Consolidated Full Year Projections of FY March, 2014
Takehiro Kamigama, President and CEO
◆Consolidated 2Q Results of FY March, 2014Takakazu Momozuka, Corporate Officer
◆Magnetic Application Products Business and Film Application Products Business
Atsuo Kobayashi, Executive Vice President
◆Passive Components BusinessHiroyuki Uemura, Executive Vice President
Copyright© 2013 TDK Corporation. All rights reserved. - 3 -Oct 31, 2013Performance Briefings First Half of Fiscal Year March, 2014
Consolidated First Half Results of FY March, 2014
Consolidated Full Year Projections of FY March, 2014
Takehiro KamigamaPresident and CEO
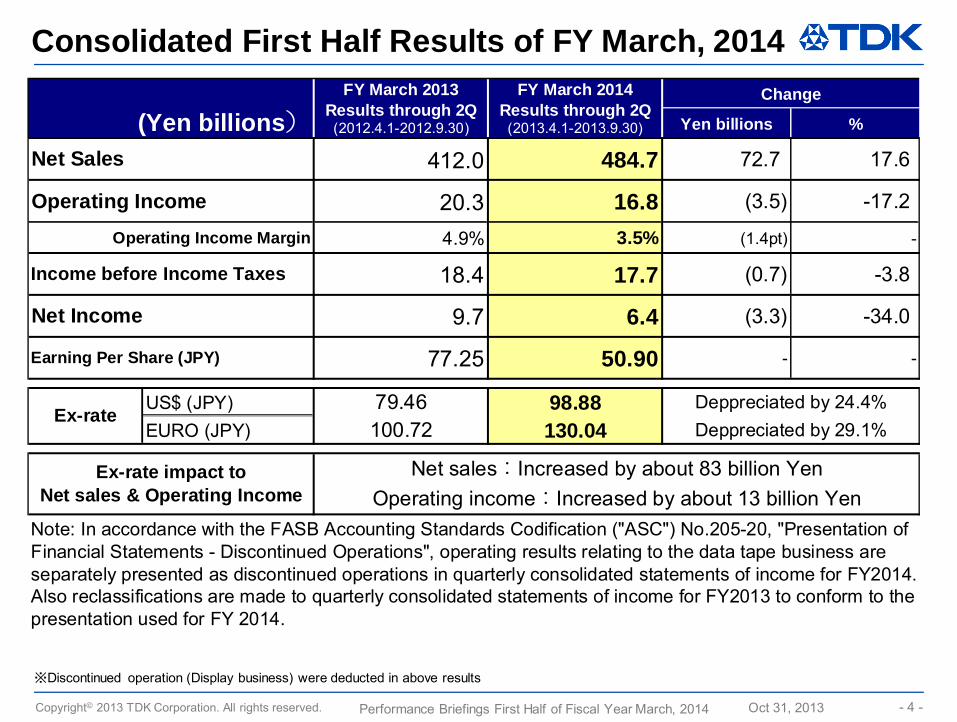
Copyright© 2013 TDK Corporation. All rights reserved. - 4 -Oct 31, 2013Performance Briefings First Half of Fiscal Year March, 2014
※Discontinued operation (Display business) were deducted in above results
Consolidated First Half Results of FY March, 2014
Yen billions %
412.0 484.7 72.7 17.6
20.3 16.8 (3.5) -17.2
4.9% 3.5% (1.4pt) -
18.4 17.7 (0.7) -3.8
9.7 6.4 (3.3) -34.0
77.25 50.90 - -
US$ (JPY) 79.46 98.88EURO (JPY) 100.72 130.04
Note: In accordance with the FASB Accounting Standards Codification ("ASC") No.205-20, "Presentation ofFinancial Statements - Discontinued Operations", operating results relating to the data tape business areseparately presented as discontinued operations in quarterly consolidated statements of income for FY2014.Also reclassifications are made to quarterly consolidated statements of income for FY2013 to conform to thepresentation used for FY 2014.
Earning Per Share (JPY)
FY March 2013Results through 2Q(2012.4.1-2012.9.30)
FY March 2014Results through 2Q(2013.4.1-2013.9.30)
Change
Net Sales
Operating Income
(Yen billions)
Net sales:Increased by about 83 billion YenOperating income:Increased by about 13 billion Yen
Ex-rate impact toNet sales & Operating Income
Operating Income Margin
Ex-rateDeppreciated by 24.4%Deppreciated by 29.1%
Income before Income Taxes
Net Income
Copyright© 2013 TDK Corporation. All rights reserved. - 5 -Oct 31, 2013Performance Briefings First Half of Fiscal Year March, 2014
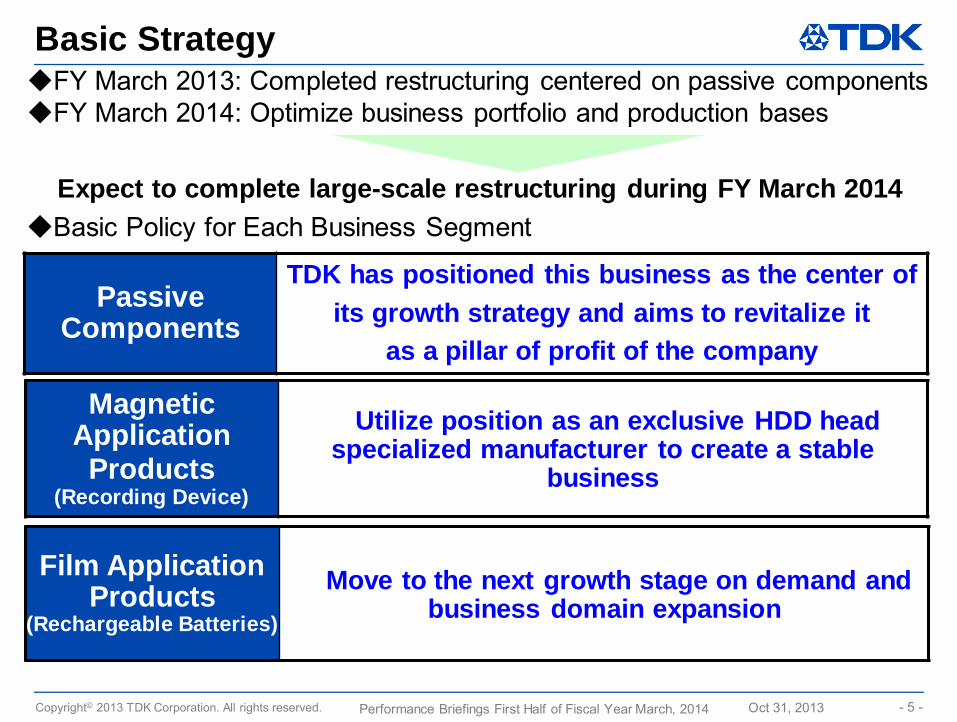
Basic Strategy◆FY March 2013: Completed restructuring centered on passive components◆FY March 2014: Optimize business portfolio and production bases
Expect to complete large-scale restructuring during FY March 2014◆Basic Policy for Each Business Segment
Passive Components
TDK has positioned this business as the center of its growth strategy and aims to revitalize it
as a pillar of profit of the company
Magnetic Application Products
(Recording Device)
Utilize position as an exclusive HDD head specialized manufacturer to create a stable
business
Film Application Products
(Rechargeable Batteries)
Move to the next growth stage on demand and business domain expansion
Copyright© 2013 TDK Corporation. All rights reserved. - 6 -Oct 31, 2013Performance Briefings First Half of Fiscal Year March, 2014
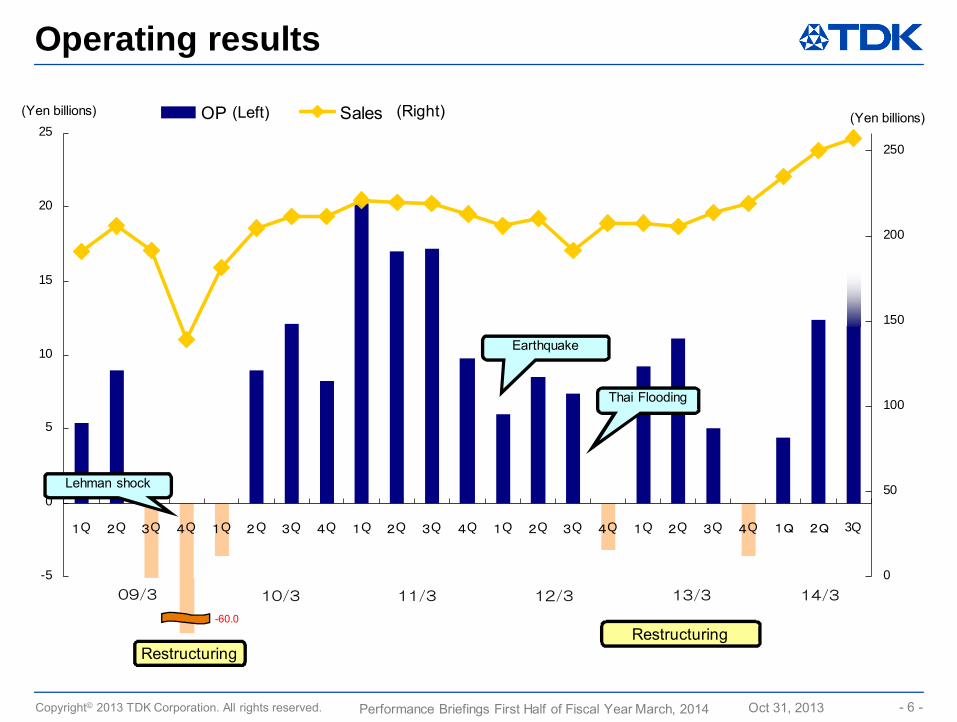
-5
0
5
10
15
20
25
1Q 2Q 3Q 4Q 1Q 2Q 3Q 4Q 1Q 2Q 3Q 4Q 1Q 2Q 3Q 4Q 1Q 2Q 3Q 4Q 1Q 2Q 3Q
0
50
100
150
200
250
OP Sales
Operating results
14/313/312/311/310/309/3
-60.0
Lehman shock
Earthquake
Thai Flooding
(Left) (Right)(Yen billions)
RestructuringRestructuring
(Yen billions)
Copyright© 2013 TDK Corporation. All rights reserved. - 7 -Oct 31, 2013Performance Briefings First Half of Fiscal Year March, 2014
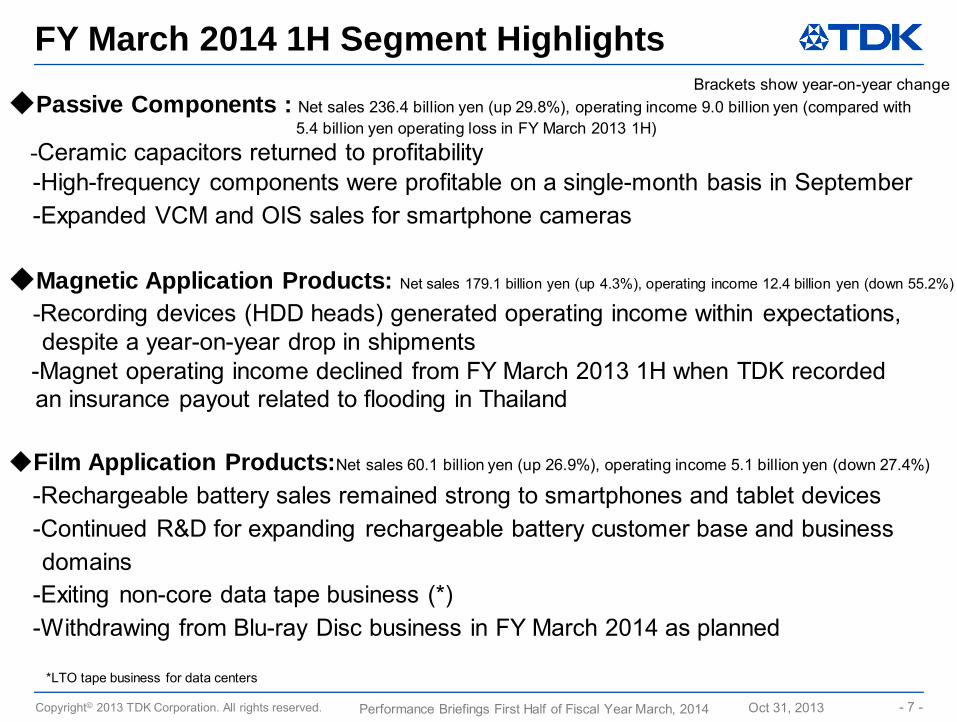
FY March 2014 1H Segment Highlights
◆Passive Components : Net sales 236.4 billion yen (up 29.8%), operating income 9.0 billion yen (compared with 5.4 billion yen operating loss in FY March 2013 1H)
-Ceramic capacitors returned to profitability-High-frequency components were profitable on a single-month basis in September-Expanded VCM and OIS sales for smartphone cameras
◆Magnetic Application Products: Net sales 179.1 billion yen (up 4.3%), operating income 12.4 billion yen (down 55.2%)
-Recording devices (HDD heads) generated operating income within expectations, despite a year-on-year drop in shipments
-Magnet operating income declined from FY March 2013 1H when TDK recorded an insurance payout related to flooding in Thailand
◆Film Application Products:Net sales 60.1 billion yen (up 26.9%), operating income 5.1 billion yen (down 27.4%)
-Rechargeable battery sales remained strong to smartphones and tablet devices-Continued R&D for expanding rechargeable battery customer base and business domains
-Exiting non-core data tape business (*)-Withdrawing from Blu-ray Disc business in FY March 2014 as planned
Brackets show year-on-year change
*LTO tape business for data centers
Copyright© 2013 TDK Corporation. All rights reserved. - 8 -Oct 31, 2013Performance Briefings First Half of Fiscal Year March, 2014
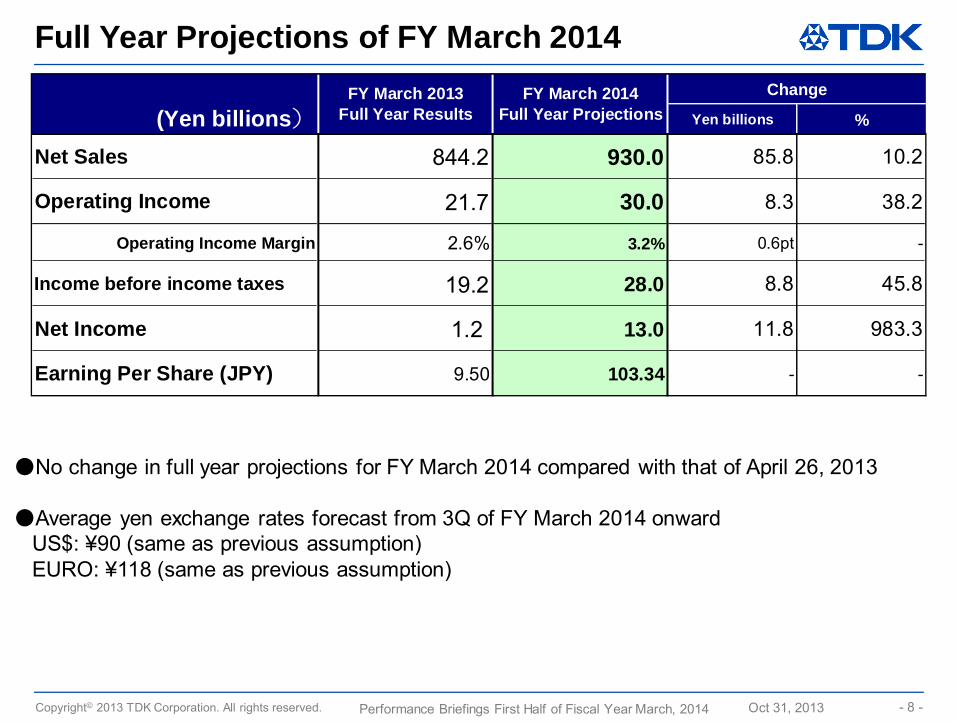
Full Year Projections of FY March 2014
●No change in full year projections for FY March 2014 compared with that of April 26, 2013
●Average yen exchange rates forecast from 3Q of FY March 2014 onwardUS$: ¥90 (same as previous assumption) EURO: ¥118 (same as previous assumption)
Yen billions %
844.2 930.0 85.8 10.2
21.7 30.0 8.3 38.2
2.6% 3.2% 0.6pt -
19.2 28.0 8.8 45.8
1.2 13.0 11.8 983.3
9.50 103.34 - -
FY March 2014Full Year Projections
Change
Net Sales
FY March 2013Full Year Results
Earning Per Share (JPY)
Net Income
Operating Income
(Yen billions)
Operating Income Margin
Income before income taxes
Copyright© 2013 TDK Corporation. All rights reserved. - 9 -Oct 31, 2013Performance Briefings First Half of Fiscal Year March, 2014
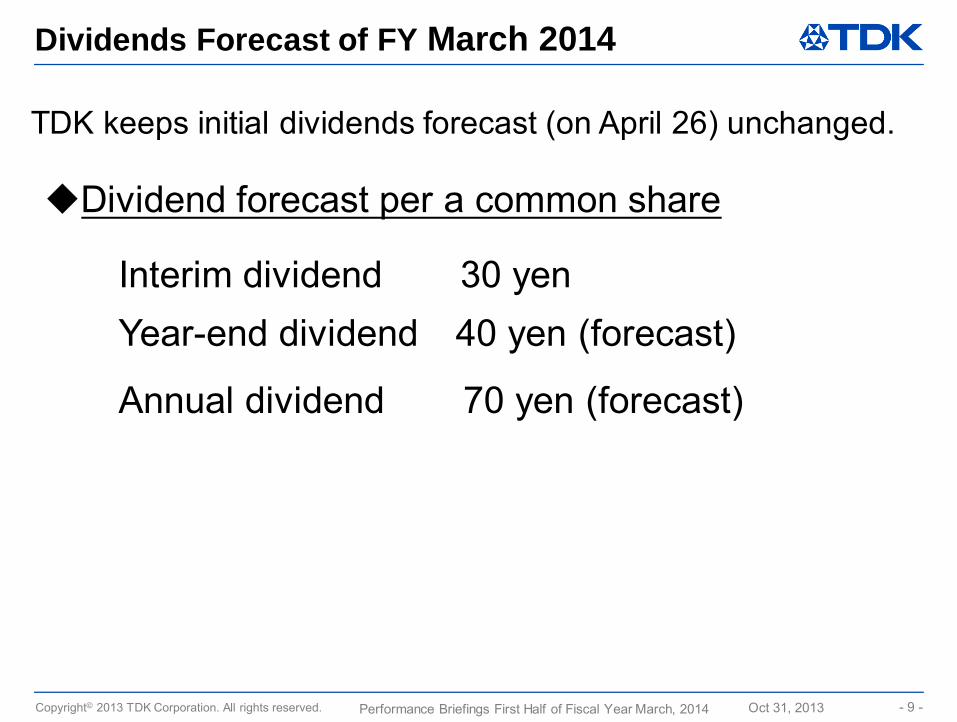
Dividends Forecast of FY March 2014
Dividend forecast per a common share
Interim dividend 30 yenYear-end dividend 40 yen (forecast)
Annual dividend 70 yen (forecast)
TDK keeps initial dividends forecast (on April 26) unchanged.
Copyright© 2013 TDK Corporation. All rights reserved. - 10 -Oct 31, 2013Performance Briefings First Half of Fiscal Year March, 2014
Takakazu MomozukaCorporate Officer
Consolidated 2Q Results of FY March, 2014
Copyright© 2013 TDK Corporation. All rights reserved. - 11 -Oct 31, 2013Performance Briefings First Half of Fiscal Year March, 2014
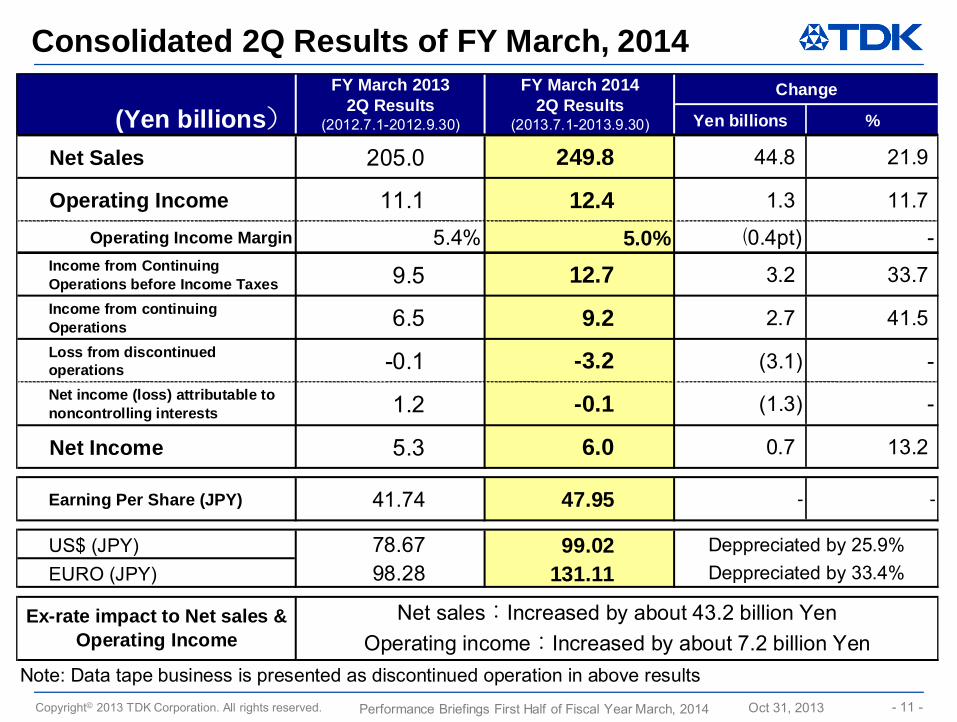
Consolidated 2Q Results of FY March, 2014
Yen billions %
Net Sales 205.0 249.8 44.8 21.9
Operating Income 11.1 12.4 1.3 11.7
Operating Income Margin 5.4% 5.0% (0.4pt) -Income from ContinuingOperations before Income Taxes 9.5 12.7 3.2 33.7Income from continuingOperations 6.5 9.2 2.7 41.5Loss from discontinuedoperations -0.1 -3.2 (3.1) -Net income (loss) attributable tononcontrolling interests 1.2 -0.1 (1.3) -
Net Income 5.3 6.0 0.7 13.2
Earning Per Share (JPY) 41.74 47.95 - -
US$ (JPY) 78.67 99.02EURO (JPY) 98.28 131.11
Note: Data tape business is presented as discontinued operation in above results
Change
Deppreciated by 25.9%Deppreciated by 33.4%
Net sales:Increased by about 43.2 billion Yen
(Yen billions)FY March 2013
2Q Results(2012.7.1-2012.9.30)
FY March 20142Q Results
(2013.7.1-2013.9.30)
Ex-rate impact to Net sales &Operating Income Operating income:Increased by about 7.2 billion Yen
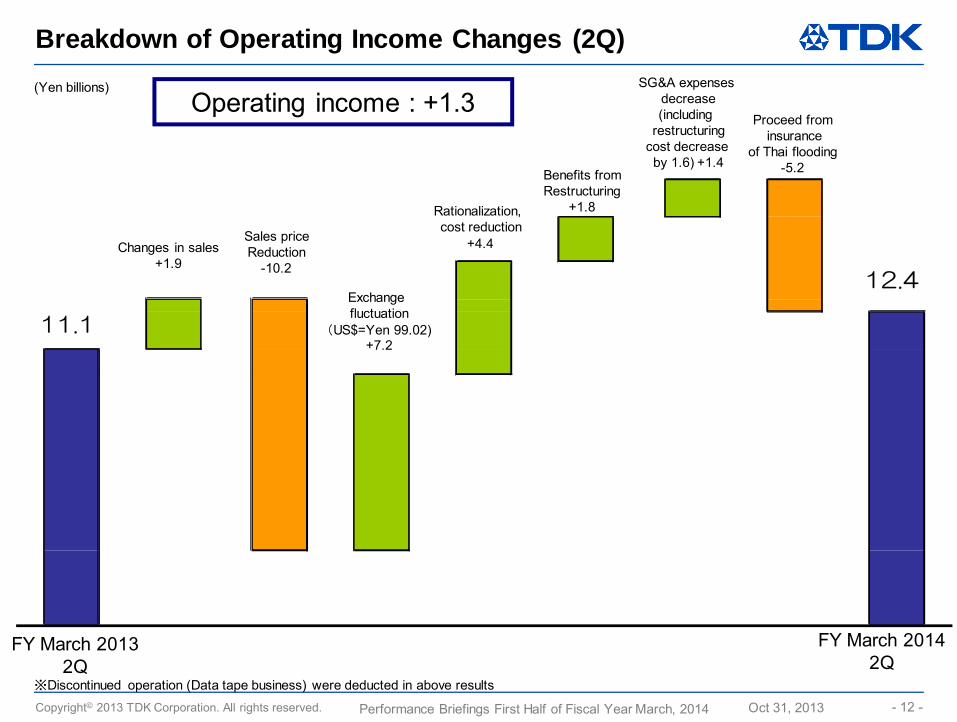
Copyright© 2013 TDK Corporation. All rights reserved. - 12 -Oct 31, 2013Performance Briefings First Half of Fiscal Year March, 2014
12.4
11.1
(Yen billions)
Breakdown of Operating Income Changes (2Q)
Operating income : +1.3
FY March 20132Q
FY March 20142Q
※Discontinued operation (Data tape business) were deducted in above results
Changes in sales+1.9
Sales priceReduction
-10.2
Exchange fluctuation
(US$=Yen 99.02)+7.2
Proceed frominsurance
of Thai flooding-5.2
Rationalization, cost reduction
+4.4
Benefits fromRestructuring
+1.8
SG&A expenses decrease(including
restructuringcost decrease by 1.6) +1.4
Copyright© 2013 TDK Corporation. All rights reserved. - 13 -Oct 31, 2013Performance Briefings First Half of Fiscal Year March, 2014
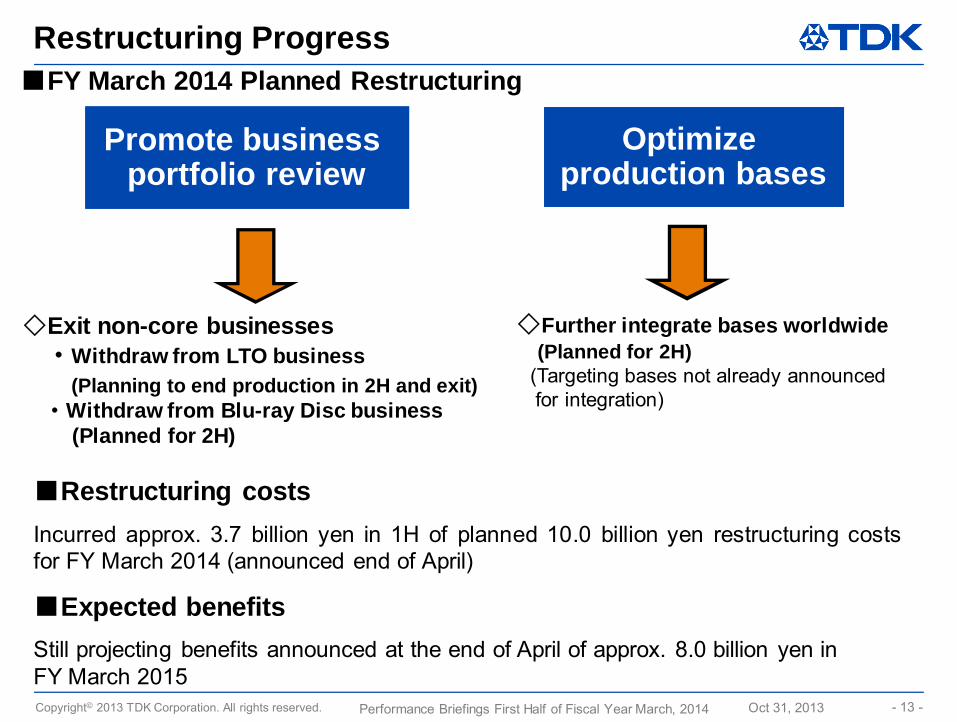
Restructuring Progress
Promote business portfolio review
Promote business portfolio review
Optimize production bases
Optimize production bases
■Restructuring costsIncurred approx. 3.7 billion yen in 1H of planned 10.0 billion yen restructuring costsfor FY March 2014 (announced end of April)
■Expected benefitsStill projecting benefits announced at the end of April of approx. 8.0 billion yen in FY March 2015
◇Exit non-core businesses・Withdraw from LTO business
(Planning to end production in 2H and exit)・Withdraw from Blu-ray Disc business
(Planned for 2H)
■FY March 2014 Planned Restructuring
◇Further integrate bases worldwide(Planned for 2H)
(Targeting bases not already announcedfor integration)
Copyright© 2013 TDK Corporation. All rights reserved. - 14 -Oct 31, 2013Performance Briefings First Half of Fiscal Year March, 2014
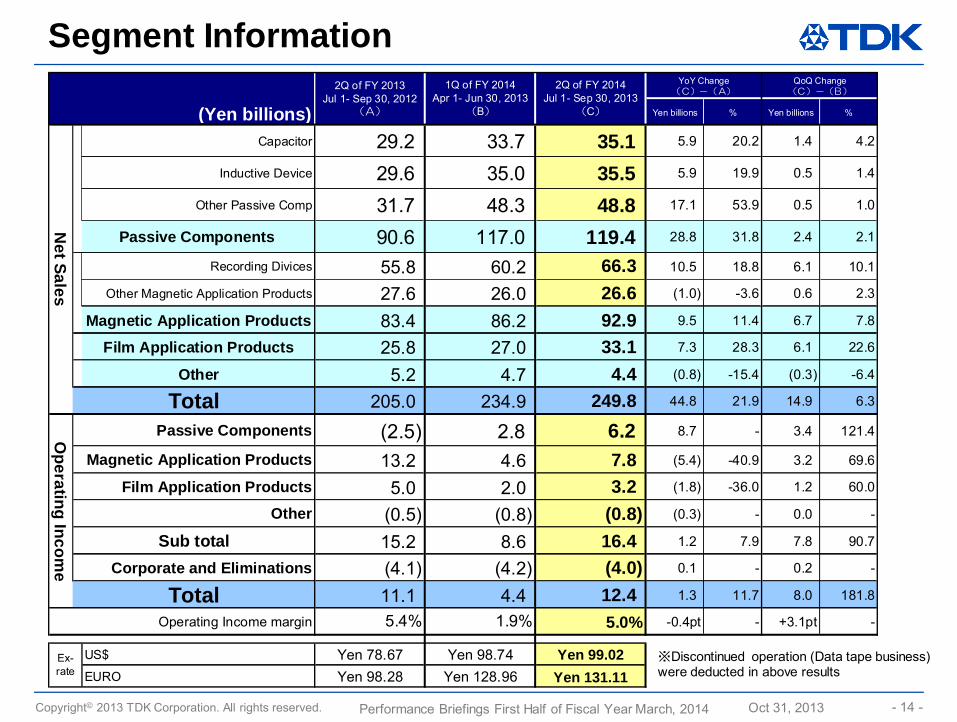
Segment Information
※Discontinued operation (Data tape business) were deducted in above results
Yen billions % Yen billions %
Capacitor 29.2 33.7 35.1 5.9 20.2 1.4 4.2
Inductive Device 29.6 35.0 35.5 5.9 19.9 0.5 1.4
Other Passive Comp 31.7 48.3 48.8 17.1 53.9 0.5 1.0
Passive Components 90.6 117.0 119.4 28.8 31.8 2.4 2.1
Recording Divices 55.8 60.2 66.3 10.5 18.8 6.1 10.1
Other Magnetic Application Products 27.6 26.0 26.6 (1.0) -3.6 0.6 2.3
Magnetic Application Products 83.4 86.2 92.9 9.5 11.4 6.7 7.8
Film Application Products 25.8 27.0 33.1 7.3 28.3 6.1 22.6
Other 5.2 4.7 4.4 (0.8) -15.4 (0.3) -6.4
205.0 234.9 249.8 44.8 21.9 14.9 6.3
(2.5) 2.8 6.2 8.7 - 3.4 121.4
13.2 4.6 7.8 (5.4) -40.9 3.2 69.6
5.0 2.0 3.2 (1.8) -36.0 1.2 60.0
(0.5) (0.8) (0.8) (0.3) - 0.0 -
15.2 8.6 16.4 1.2 7.9 7.8 90.7
(4.1) (4.2) (4.0) 0.1 - 0.2 -
11.1 4.4 12.4 1.3 11.7 8.0 181.8
Operating Income margin 5.4% 1.9% 5.0% -0.4pt - +3.1pt -
US$ Yen 78.67 Yen 98.74 Yen 99.02EURO Yen 98.28 Yen 128.96 Yen 131.11
Ex-rate
Total
Sub totalCorporate and Eliminations
Net Sales
Operating Incom
e
TotalPassive Components
Magnetic Application Products
Film Application ProductsOther
(Yen billions)
QoQ Change(C)-(B)
2Q of FY 2013Jul 1- Sep 30, 2012
(A)
1Q of FY 2014Apr 1- Jun 30, 2013
(B)
2Q of FY 2014Jul 1- Sep 30, 2013
(C)
YoY Change(C)-(A)
Copyright© 2013 TDK Corporation. All rights reserved. - 15 -Oct 31, 2013Performance Briefings First Half of Fiscal Year March, 2014
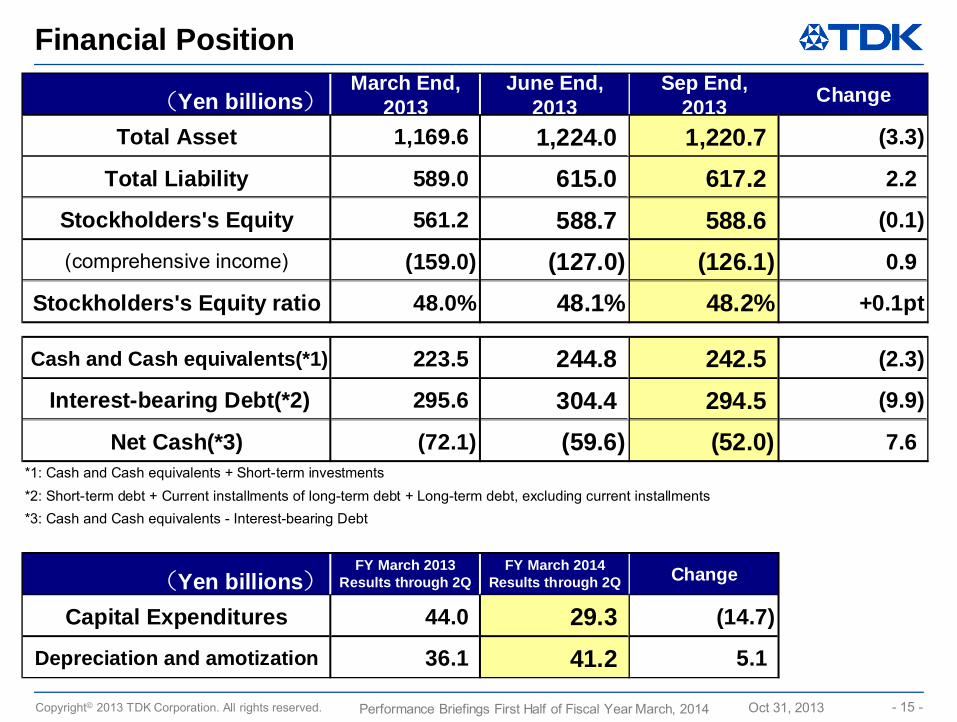
Financial Position
(Yen billions)March End,
2013June End,
2013Sep End,
2013 Change
Total Asset 1,169.6 1,224.0 1,220.7 (3.3)
Total Liability 589.0 615.0 617.2 2.2
Stockholders's Equity 561.2 588.7 588.6 (0.1)
(comprehensive income) (159.0) (127.0) (126.1) 0.9
Stockholders's Equity ratio 48.0% 48.1% 48.2% +0.1pt
Cash and Cash equivalents(*1) 223.5 244.8 242.5 (2.3)
Interest-bearing Debt(*2) 295.6 304.4 294.5 (9.9)
Net Cash(*3) (72.1) (59.6) (52.0) 7.6*1: Cash and Cash equivalents + Short-term investments*2: Short-term debt + Current installments of long-term debt + Long-term debt, excluding current installments*3: Cash and Cash equivalents - Interest-bearing Debt
(Yen billions)FY March 2013
Results through 2QFY March 2014
Results through 2Q Change
Capital Expenditures 44.0 29.3 (14.7)
Depreciation and amotization 36.1 41.2 5.1
Copyright© 2013 TDK Corporation. All rights reserved. - 16 -Oct 31, 2013Performance Briefings First Half of Fiscal Year March, 2014
Magnetic Application Products BusinessFilm Application Products Business
Atsuo KobayashiExecutive Vice President
Copyright© 2013 TDK Corporation. All rights reserved. - 17 -Oct 31, 2013Performance Briefings First Half of Fiscal Year March, 2014
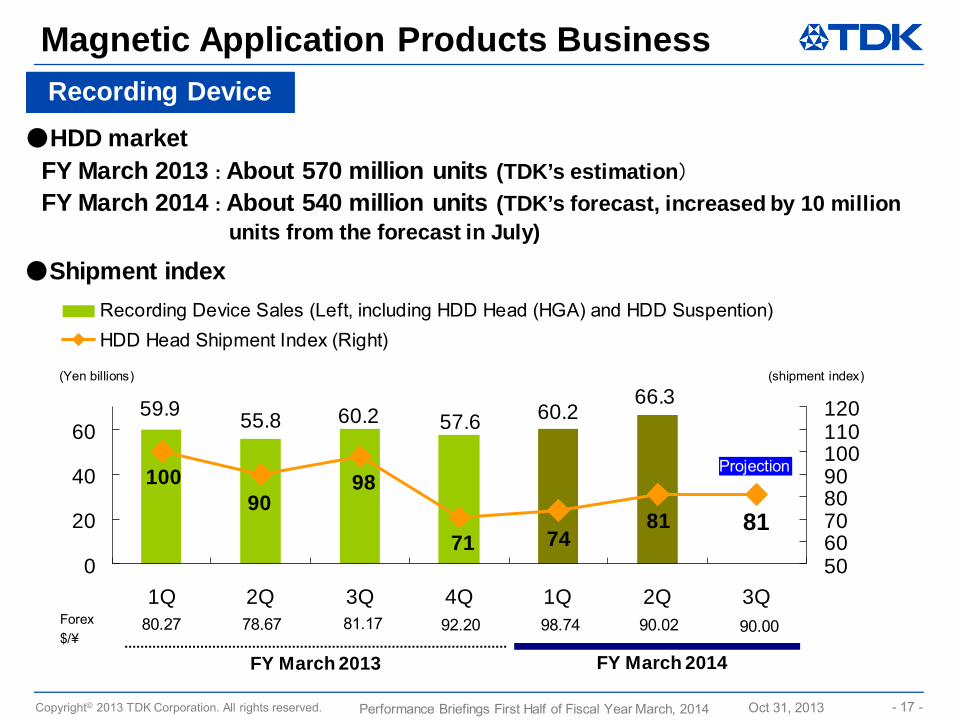
66.360.257.660.255.859.9
8174
81
10090
98
710
20
40
60
1Q 2Q 3Q 4Q 1Q 2Q 3Q5060708090100110120
Recording Device Sales (Left, including HDD Head (HGA) and HDD Suspention)HDD Head Shipment Index (Right)
(Yen billions) (shipment index)
Magnetic Application Products Business
●HDD marketFY March 2013 : About 570 million units (TDK’s estimation)
FY March 2014 : About 540 million units (TDK’s forecast, increased by 10 million units from the forecast in July)
●Shipment index
FY March 2014
92.2081.1778.6780.27
FY March 2013
90.0298.74
Projection
Forex$/¥
Recording DeviceRecording Device
90.00
Copyright© 2013 TDK Corporation. All rights reserved. - 18 -Oct 31, 2013Performance Briefings First Half of Fiscal Year March, 2014
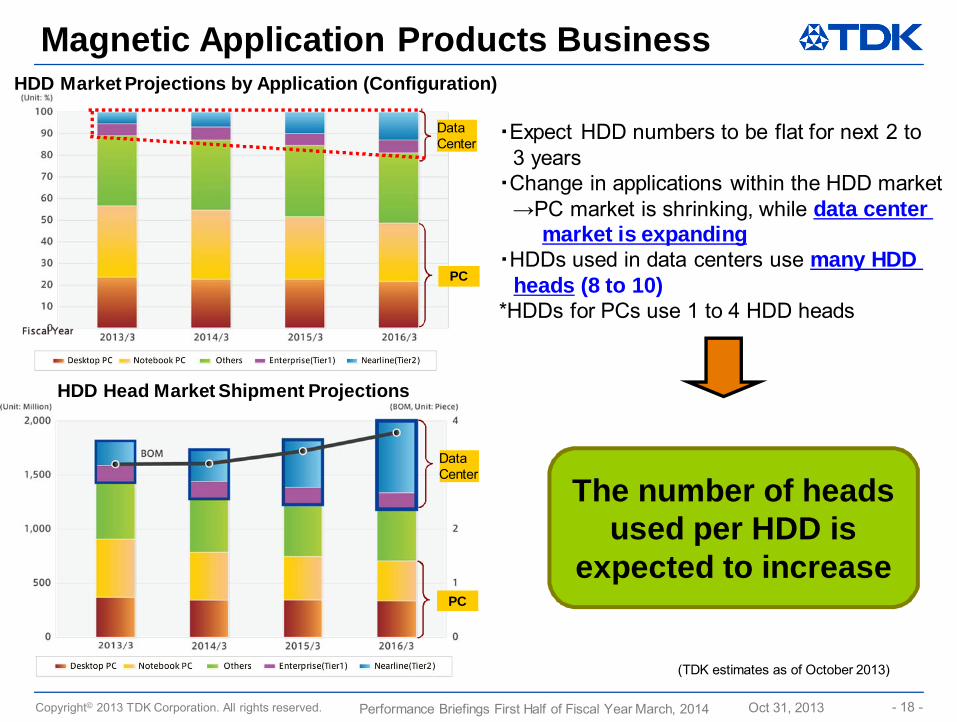
HDD Market Projections by Application (Configuration)
PC
Data Center
・Expect HDD numbers to be flat for next 2 to 3 years
・Change in applications within the HDD market→PC market is shrinking, while data center
market is expanding・HDDs used in data centers use many HDD
heads (8 to 10)*HDDs for PCs use 1 to 4 HDD heads
The number of heads used per HDD is
expected to increase
(TDK estimates as of October 2013)
PC
DataCenter
Magnetic Application Products Business
HDD Head Market Shipment Projections
Copyright© 2013 TDK Corporation. All rights reserved. - 19 -Oct 31, 2013Performance Briefings First Half of Fiscal Year March, 2014
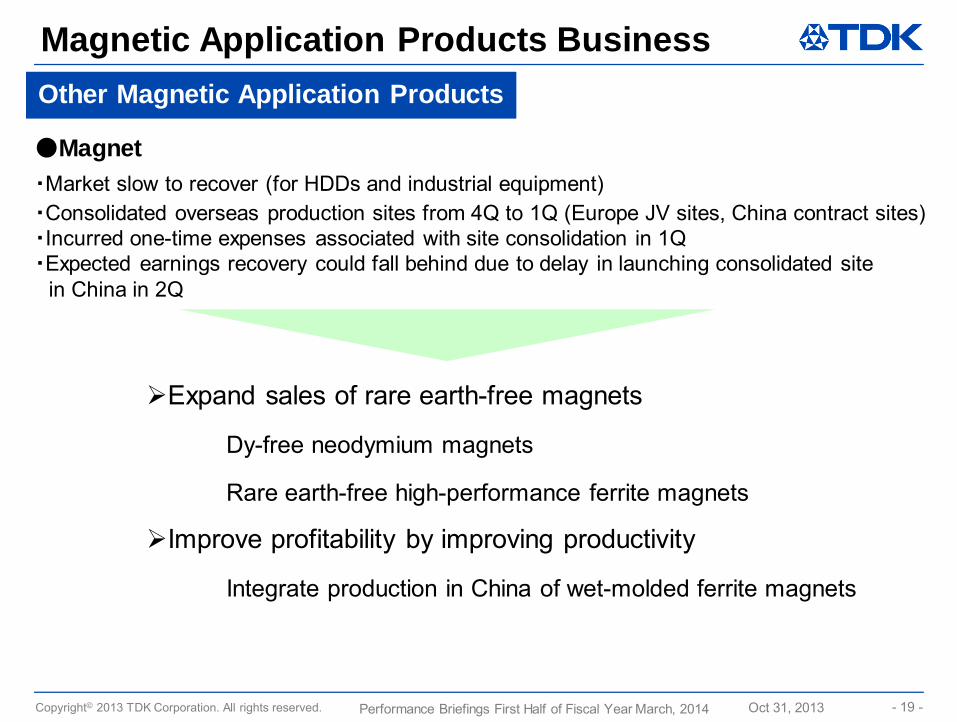
Magnetic Application Products BusinessOther Magnetic Application ProductsOther Magnetic Application Products
●Magnet・Market slow to recover (for HDDs and industrial equipment)・Consolidated overseas production sites from 4Q to 1Q (Europe JV sites, China contract sites)・Incurred one-time expenses associated with site consolidation in 1Q・Expected earnings recovery could fall behind due to delay in launching consolidated site
in China in 2Q
Expand sales of rare earth-free magnets
Dy-free neodymium magnets
Rare earth-free high-performance ferrite magnets
Improve profitability by improving productivity
Integrate production in China of wet-molded ferrite magnets
Copyright© 2013 TDK Corporation. All rights reserved. - 20 -Oct 31, 2013Performance Briefings First Half of Fiscal Year March, 2014
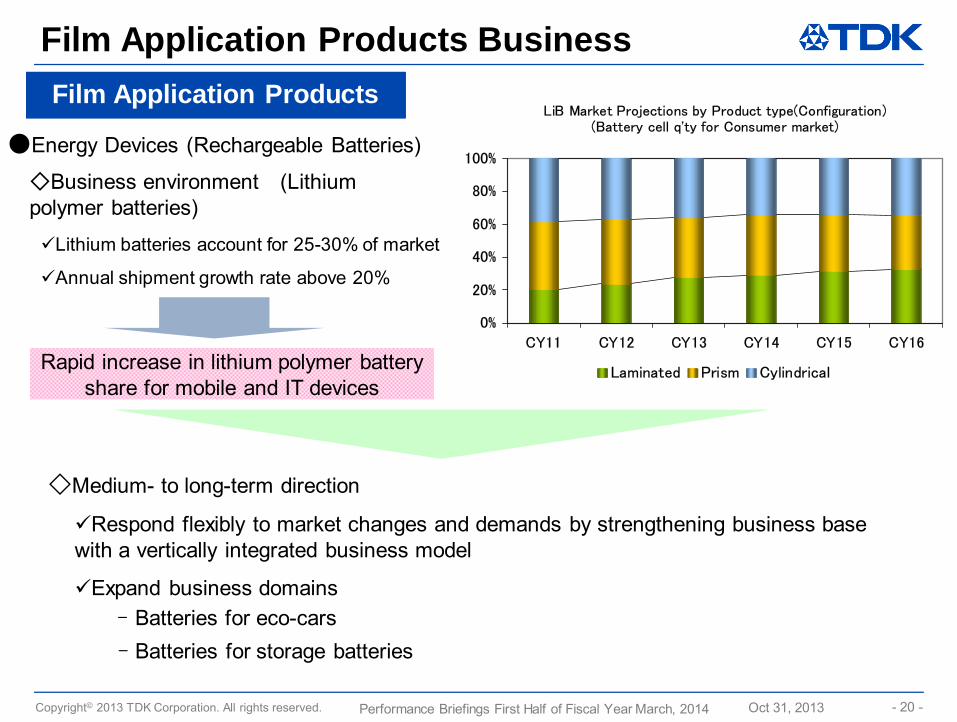
Film Application Products BusinessFilm Application ProductsFilm Application Products
セラミックコンデンサセラミックコンデンサ
●Energy Devices (Rechargeable Batteries)
Lithium batteries account for 25-30% of market
Annual shipment growth rate above 20%
◇Business environment (Lithium polymer batteries)
Rapid increase in lithium polymer batteryshare for mobile and IT devices
Respond flexibly to market changes and demands by strengthening business base with a vertically integrated business model
Expand business domains- Batteries for eco-cars- Batteries for storage batteries
◇Medium- to long-term direction
LiB Market Projections by Product type(Configuration)(Battery cell q'ty for Consumer market)
0%
20%
40%
60%
80%
100%
CY11 CY12 CY13 CY14 CY15 CY16
Laminated Prism Cylindrical
Copyright© 2013 TDK Corporation. All rights reserved. - 21 -Oct 31, 2013Performance Briefings First Half of Fiscal Year March, 2014
Passive Components Business
Hiroyuki UemuraExecutive Vice President
Copyright© 2013 TDK Corporation. All rights reserved. - 22 -Oct 31, 2013Performance Briefings First Half of Fiscal Year March, 2014
-15
-12.5
-10
-7.5
-5
-2.5
0
2.5
5
7.5
10
1Q 2Q 3Q 4Q 1Q 2Q 3Q 4Q 1Q 2Q
0
25
50
75
100
125OP Sales
2012/3
79.2777.3577.9681.74 80.27為替レート
$/¥
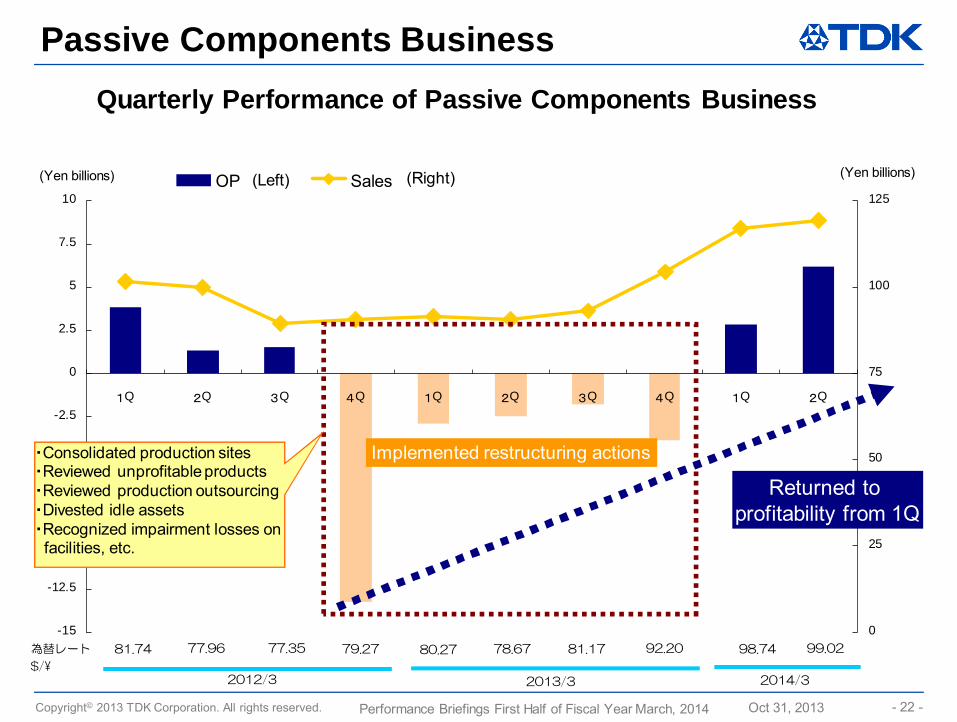
Quarterly Performance of Passive Components Business
78.67 81.17 92.20 98.74 99.02
2013/3 2014/3
Returned to profitability from 1Q
Implemented restructuring actions・Consolidated production sites・Reviewed unprofitable products・Reviewed production outsourcing・Divested idle assets・Recognized impairment losses on
facilities, etc.
Passive Components Business
(Left) (Right)(Yen billions) (Yen billions)
Copyright© 2013 TDK Corporation. All rights reserved. - 23 -Oct 31, 2013Performance Briefings First Half of Fiscal Year March, 2014
Passive Components●Measures to Further Improve Profitability
◆Ceramic capacitors-Continue to bolster products for auto market
◆Inductive devices-Flexibly respond to customer requests with a full lineup of thin film, wire-wound coil and
multi-layered products◆High-frequency components
-Aim to expand healthy SAW (discrete products) sales further by increasing production-Continue design-in activities for modular products-Step up reference activities to IC manufacturers
◆Piezoelectric material products (VCM, OIS)-Orders strong for use in smartphones in China; secure steady orders for optical image
stabilizers (OIS), which are expected to be adopted going forward.
◆Productivity improvements-Optimize ceramic capacitor production lines
(Improve productivity further following site consolidation, launch integrated production line from materials to products)
-Continue to improve production processes for high-frequency components(Dispatch head business process engineers)
Copyright© 2013 TDK Corporation. All rights reserved. - 24 -Oct 31, 2013Performance Briefings First Half of Fiscal Year March, 2014
Supplementary Data
Copyright© 2013 TDK Corporation. All rights reserved. - 25 -Oct 31, 2013Performance Briefings First Half of Fiscal Year March, 2014
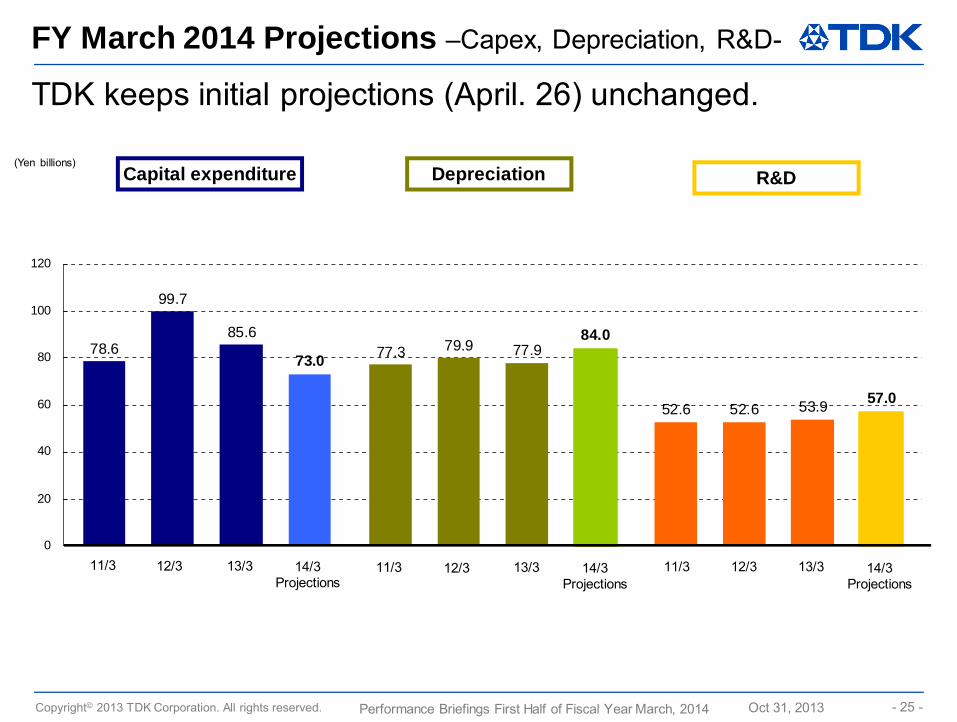
78.6 77.3
52.6
99.7
79.9
52.6
85.677.9
53.9
73.084.0
57.0
0
20
40
60
80
100
120
FY March 2014 Projections –Capex, Depreciation, R&D-
12/3 12/3 12/311/3 11/3 11/313/3 13/3 13/314/3Projections
14/3Projections
14/3Projections
(Yen billions)Capital expenditure Depreciation R&D
TDK keeps initial projections (April. 26) unchanged.
Copyright© 2013 TDK Corporation. All rights reserved. - 26 -Oct 31, 2013Performance Briefings First Half of Fiscal Year March, 2014
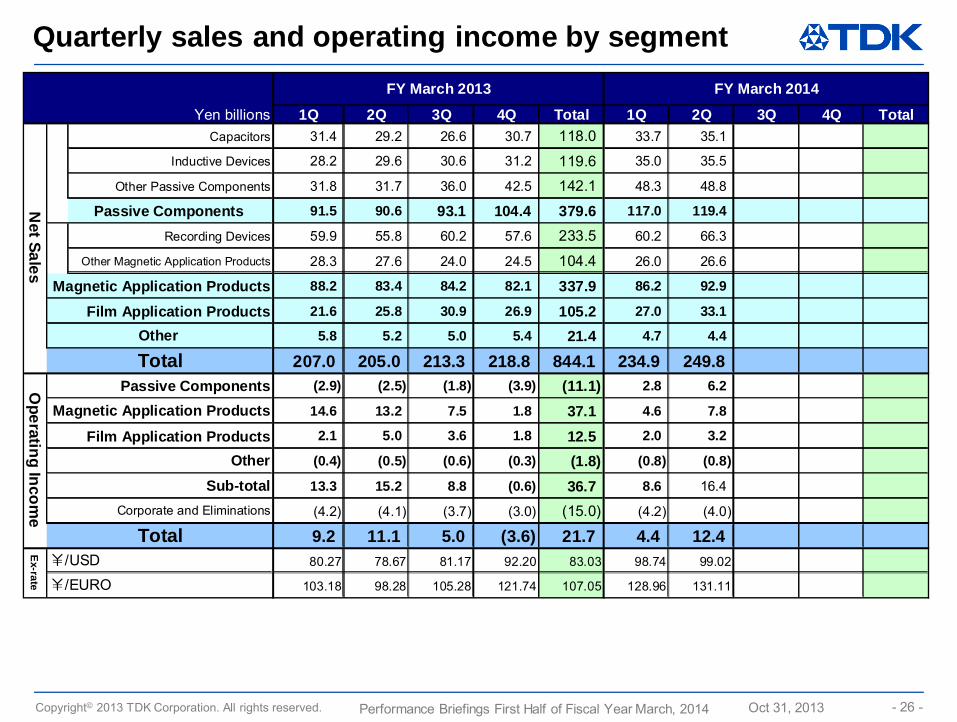
Quarterly sales and operating income by segment
1Q 2Q 3Q 4Q Total 1Q 2Q 3Q 4Q TotalCapacitors 31.4 29.2 26.6 30.7 118.0 33.7 35.1
Inductive Devices 28.2 29.6 30.6 31.2 119.6 35.0 35.5
Other Passive Components 31.8 31.7 36.0 42.5 142.1 48.3 48.8
Passive Components 91.5 90.6 93.1 104.4 379.6 117.0 119.4
Recording Devices 59.9 55.8 60.2 57.6 233.5 60.2 66.3
Other Magnetic Application Products 28.3 27.6 24.0 24.5 104.4 26.0 26.6
Magnetic Application Products 88.2 83.4 84.2 82.1 337.9 86.2 92.9
Film Application Products 21.6 25.8 30.9 26.9 105.2 27.0 33.1
5.8 5.2 5.0 5.4 21.4 4.7 4.4
207.0 205.0 213.3 218.8 844.1 234.9 249.8(2.9) (2.5) (1.8) (3.9) (11.1) 2.8 6.2
14.6 13.2 7.5 1.8 37.1 4.6 7.8
Film Application Products 2.1 5.0 3.6 1.8 12.5 2.0 3.2
(0.4) (0.5) (0.6) (0.3) (1.8) (0.8) (0.8)
13.3 15.2 8.8 (0.6) 36.7 8.6 16.4
(4.2) (4.1) (3.7) (3.0) (15.0) (4.2) (4.0)
9.2 11.1 5.0 (3.6) 21.7 4.4 12.480.27 78.67 81.17 92.20 83.03 98.74 99.02
103.18 98.28 105.28 121.74 107.05 128.96 131.11
FY March 2013
Net Sales
Other
Total
Yen billions
Total
OtherSub-total
Operating Incom
e
Passive ComponentsMagnetic Application Products
FY March 2014
Ex-rate
¥/USD¥/EURO
Corporate and Eliminations
Copyright© 2013 TDK Corporation. All rights reserved. - 27 -Oct 31, 2013Performance Briefings First Half of Fiscal Year March, 2014
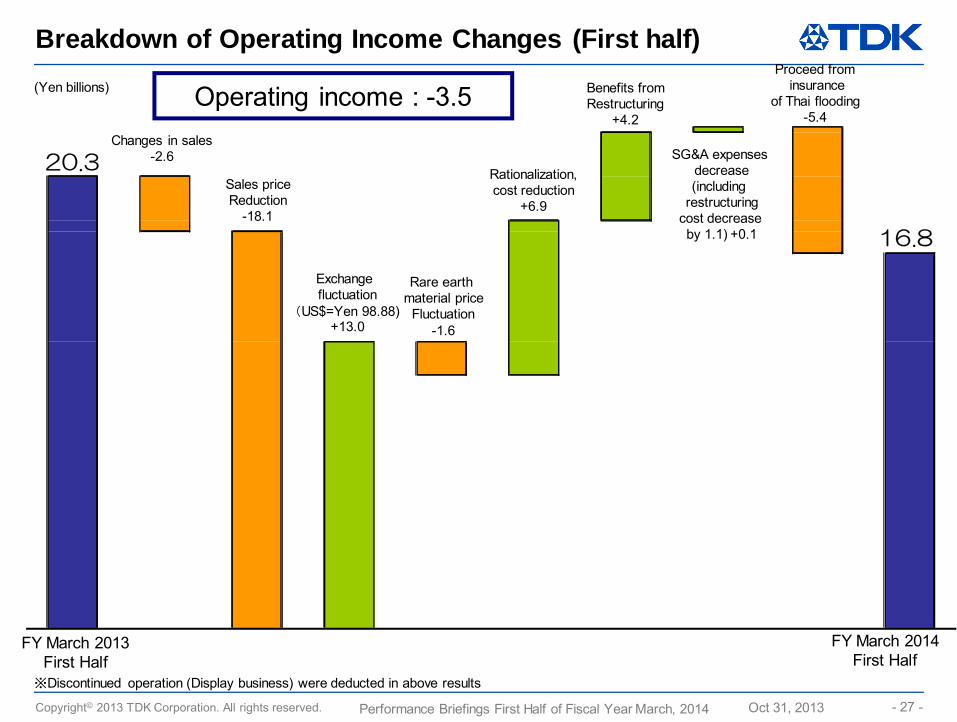
FY March 2013First Half
FY March 2014First Half
Breakdown of Operating Income Changes (First half)
16.8
20.3
(Yen billions) Operating income : -3.5Changes in sales
-2.6
Sales priceReduction
-18.1
Exchange fluctuation
(US$=Yen 98.88)+13.0
Proceed frominsurance
of Thai flooding-5.4
Benefits fromRestructuring
+4.2
SG&A expenses decrease(including
restructuringcost decrease by 1.1) +0.1
Rationalization, cost reduction
+6.9
Rare earth material price
Fluctuation-1.6
※Discontinued operation (Display business) were deducted in above results
Copyright© 2013 TDK Corporation. All rights reserved. - 28 -Oct 31, 2013Performance Briefings First Half of Fiscal Year March, 2014
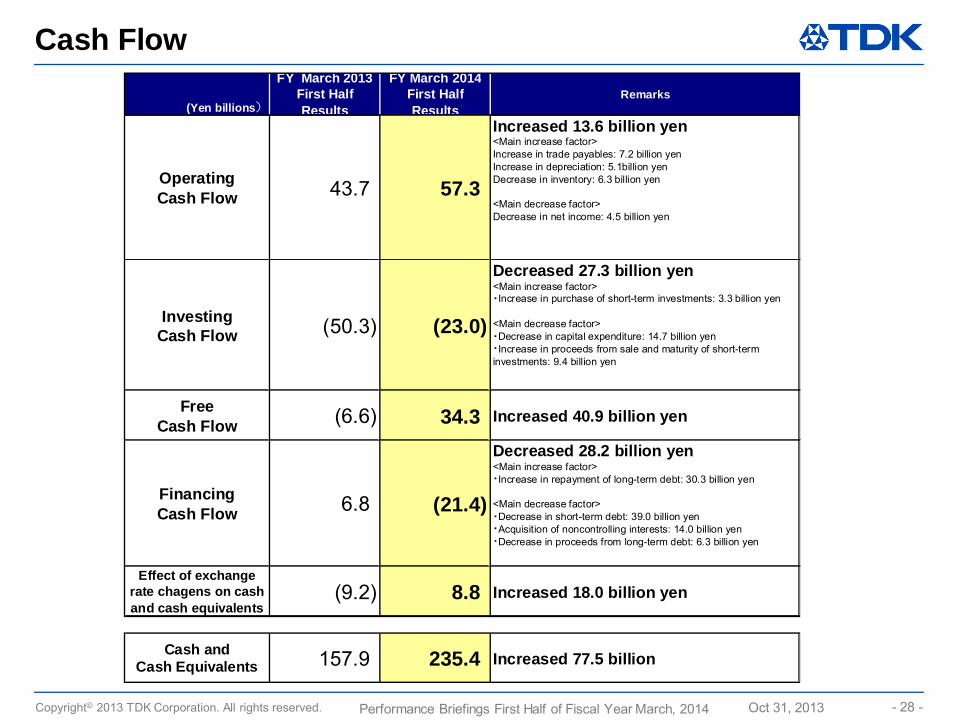
Cash Flow
43.7 57.3
Increased 13.6 billion yen<Main increase factor>Increase in trade payables: 7.2 billion yenIncrease in depreciation: 5.1billion yenDecrease in inventory: 6.3 billion yen
<Main decrease factor>Decrease in net income: 4.5 billion yen
(50.3) (23.0)
Decreased 27.3 billion yen<Main increase factor>・Increase in purchase of short-term investments: 3.3 billion yen
<Main decrease factor>・Decrease in capital expenditure: 14.7 billion yen・Increase in proceeds from sale and maturity of short-terminvestments: 9.4 billion yen
(6.6) 34.3 Increased 40.9 billion yen
6.8 (21.4)
Decreased 28.2 billion yen<Main increase factor>・Increase in repayment of long-term debt: 30.3 billion yen
<Main decrease factor>・Decrease in short-term debt: 39.0 billion yen・Acquisition of noncontrolling interests: 14.0 billion yen・Decrease in proceeds from long-term debt: 6.3 billion yen
(9.2) 8.8 Increased 18.0 billion yen
157.9 235.4 Increased 77.5 billion
RemarksFY March 2014
First HalfResults(Yen billions)
FY March 2013First HalfResults
Cash andCash Equivalents
FreeCash Flow
FinancingCash Flow
Effect of exchangerate chagens on cashand cash equivalents
OperatingCash Flow
InvestingCash Flow
Copyright© 2013 TDK Corporation. All rights reserved. - 29 -Oct 31, 2013Performance Briefings First Half of Fiscal Year March, 2014
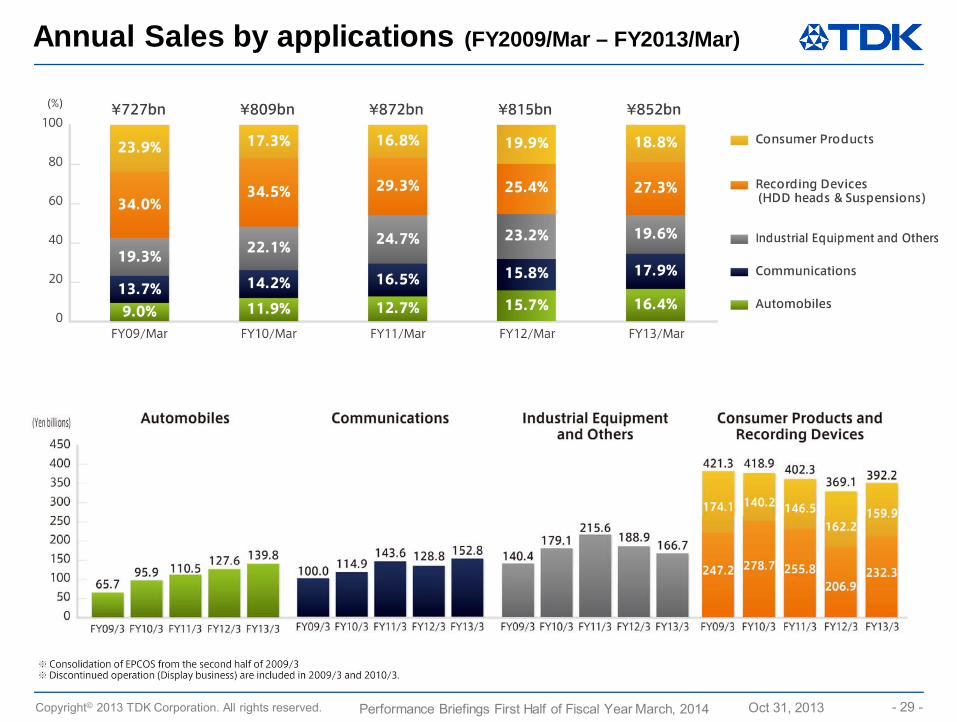
Annual Sales by applications (FY2009/Mar – FY2013/Mar)
Copyright© 2013 TDK Corporation. All rights reserved. - 30 -Oct 31, 2013Performance Briefings First Half of Fiscal Year March, 2014
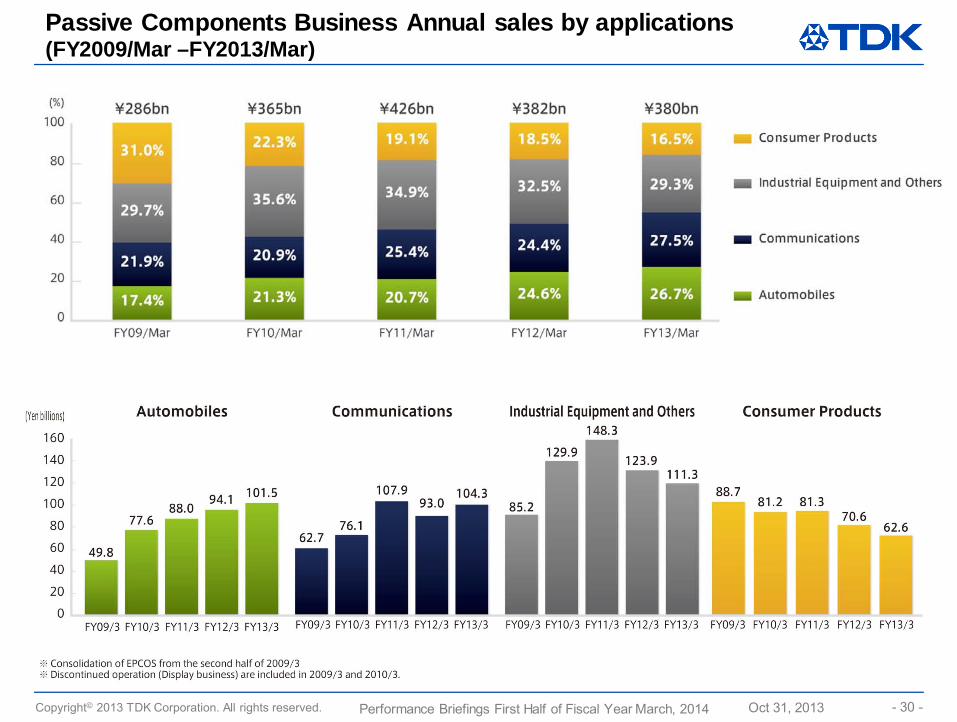
Passive Components Business Annual sales by applications (FY2009/Mar –FY2013/Mar)
Copyright© 2013 TDK Corporation. All rights reserved. - 31 -Oct 31, 2013Performance Briefings First Half of Fiscal Year March, 2014
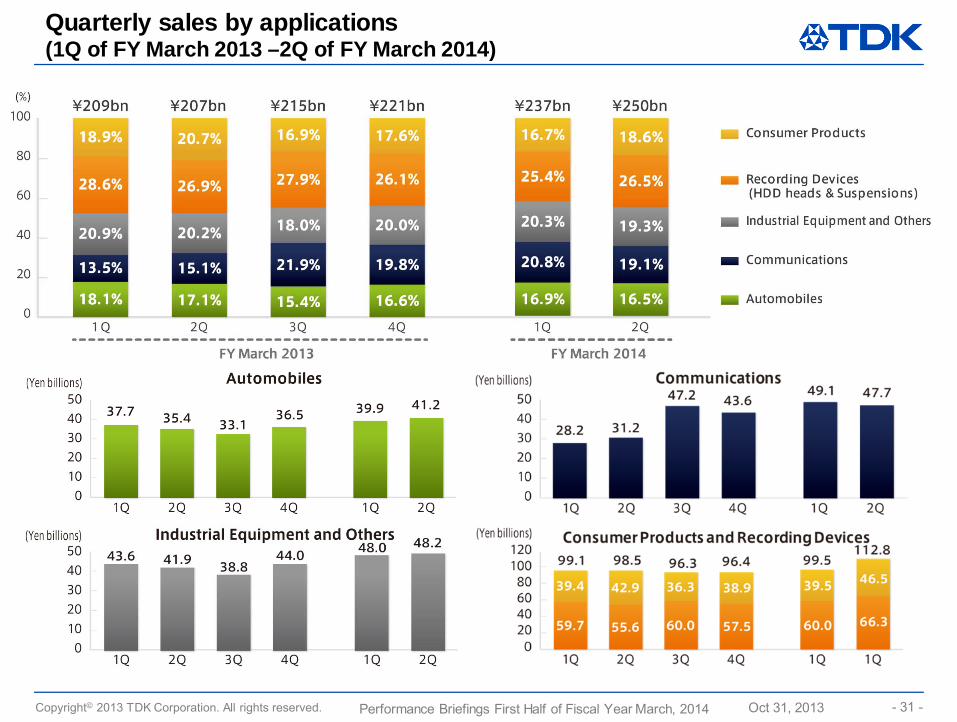
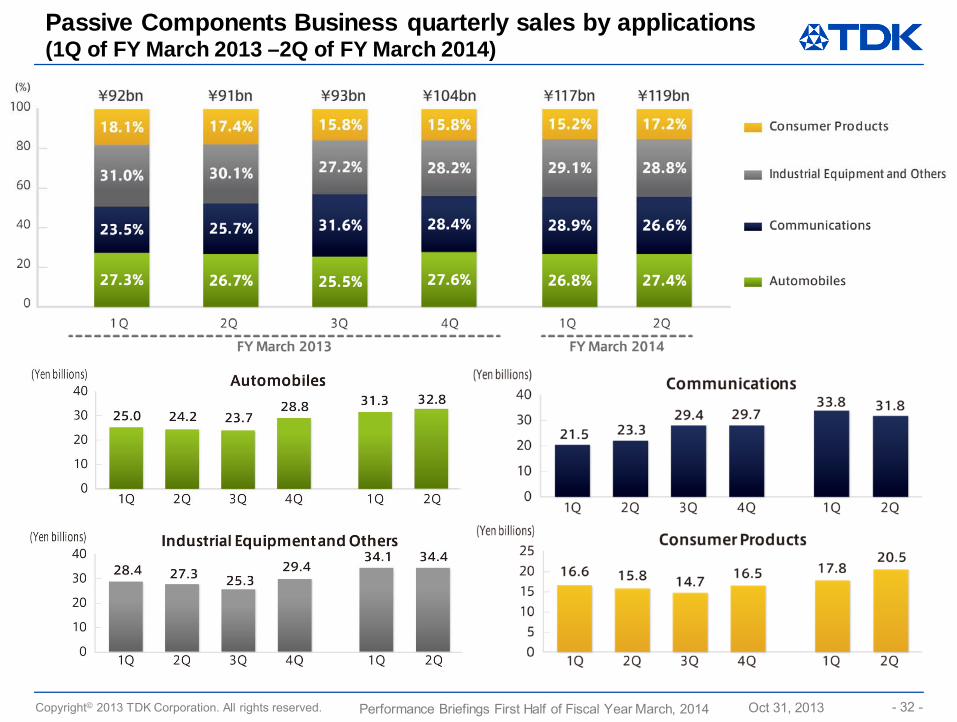
Quarterly sales by applications (1Q of FY March 2013 –2Q of FY March 2014)
Copyright© 2013 TDK Corporation. All rights reserved. - 32 -Oct 31, 2013Performance Briefings First Half of Fiscal Year March, 2014
Passive Components Business quarterly sales by applications (1Q of FY March 2013 –2Q of FY March 2014)
Copyright© 2013 TDK Corporation. All rights reserved. - 33 -Oct 31, 2013Performance Briefings First Half of Fiscal Year March, 2014
Copyright© 2013 TDK Corporation. All rights reserved. - 34 -Oct 31, 2013Performance Briefings First Half of Fiscal Year March, 2014
Copyright© 2013 TDK Corporation. All rights reserved. - 35 -Oct 31, 2013Performance Briefings First Half of Fiscal Year March, 2014
Cautionary Statements with Respect to Forward-Looking Statements
This material contains forward-looking statements, including projections, plans, policies, management strategies, targets, schedules, understandings and evaluations, about TDK or its group companies (TDK Group). These forward-looking statements are based on the current forecasts, estimates, assumptions, plans, beliefs and evaluations of TDK Group in light of information currently available to it, and contain known and unknown risks, uncertainties and other factors. TDK Group therefore wishes to caution readers that, being subject to risks, uncertainties and other factors, TDK Group’s actual results, performance, achievements or financial position could be materially different from any future results, performance, achievements or financial position expressed or implied by these forward-looking statements, and TDK Group undertakes no obligation to publicly update or revise any forward-looking statements after the issue of this material except as provided for in laws and ordinances.The electronics markets in which TDK Group operates are highly susceptible to rapid changes. Risks, uncertainties and other factors that can have significant effects on TDK Group include, but are not limited to, shifts in technology, fluctuations in demand, prices, interest and foreign exchange rates, and changes in economic environments, conditions of competition, laws and regulations. Also, since the purpose of these materials is only to give readers a general outline of business performance, many numerical values are shown in units of a billion yen. Because original values, which are managed in units of a million yen, are rounded off, the totals, differences, etc. shown in these materials may appear inaccurate. If detailed figures are necessary, please refer to our financial statements and supplementary materials.
This material contains forward-looking statements, including projections, plans, policies, management strategies, targets, schedules, understandings and evaluations, about TDK or its group companies (TDK Group). These forward-looking statements are based on the current forecasts, estimates, assumptions, plans, beliefs and evaluations of TDK Group in light of information currently available to it, and contain known and unknown risks, uncertainties and other factors. TDK Group therefore wishes to caution readers that, being subject to risks, uncertainties and other factors, TDK Group’s actual results, performance, achievements or financial position could be materially different from any future results, performance, achievements or financial position expressed or implied by these forward-looking statements, and TDK Group undertakes no obligation to publicly update or revise any forward-looking statements after the issue of this material except as provided for in laws and ordinances.The electronics markets in which TDK Group operates are highly susceptible to rapid changes. Risks, uncertainties and other factors that can have significant effects on TDK Group include, but are not limited to, shifts in technology, fluctuations in demand, prices, interest and foreign exchange rates, and changes in economic environments, conditions of competition, laws and regulations. Also, since the purpose of these materials is only to give readers a general outline of business performance, many numerical values are shown in units of a billion yen. Because original values, which are managed in units of a million yen, are rounded off, the totals, differences, etc. shown in these materials may appear inaccurate. If detailed figures are necessary, please refer to our financial statements and supplementary materials.
Text data including Q&A of performance briefing will be uploaded on following sitehttp://www.global.tdk.com/ir/ir_events/conference/2014/2q_1.htm