Embed Size (px)
Citation preview
TDK CorporationCorporate Communications Group
July 30, 2020
Performance Briefing1Q of Fiscal Year March 2021
Performance Briefing 1Q of Fiscal Year March 2021 © TDK Corporation 2020Corporate Communications Group July 30, 2020 2
●Consolidated Results for 1Q of FY March 2021Tetsuji Yamanishi, Executive Vice President
Performance Briefing 1Q of Fiscal Year March 2021 © TDK Corporation 2020Corporate Communications Group July 30, 2020 3
Consolidated Results for1Q of FY March 2021
Tetsuji YamanishiExecutive Vice President
Performance Briefing 1Q of Fiscal Year March 2021 © TDK Corporation 2020Corporate Communications Group July 30, 2020 4
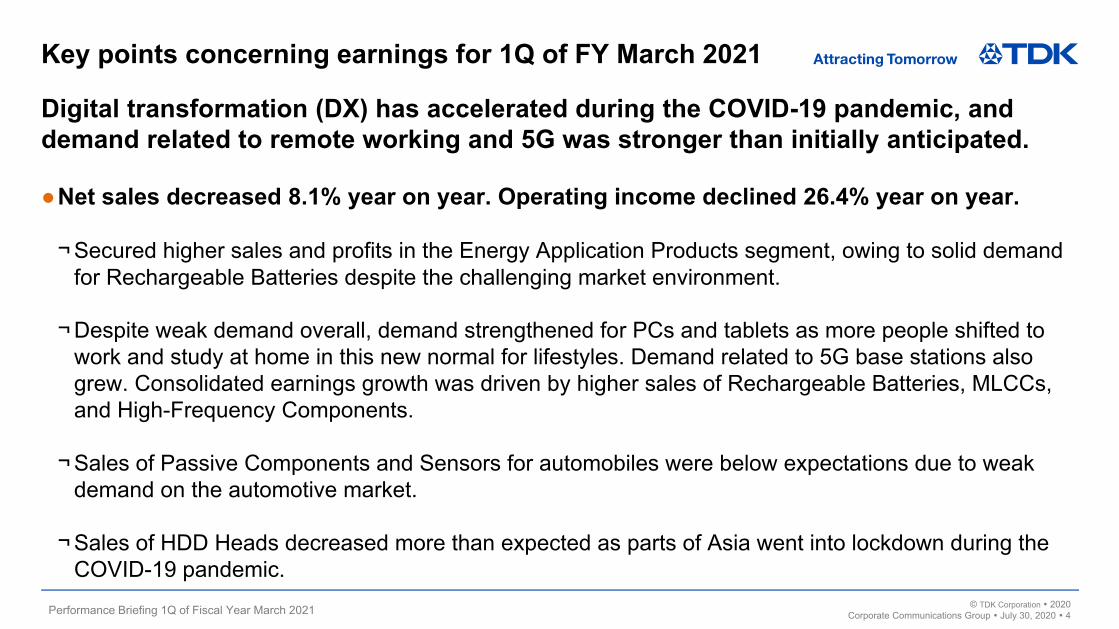
Key points concerning earnings for 1Q of FY March 2021
Digital transformation (DX) has accelerated during the COVID-19 pandemic, and demand related to remote working and 5G was stronger than initially anticipated.
●Net sales decreased 8.1% year on year. Operating income declined 26.4% year on year.
¬ Secured higher sales and profits in the Energy Application Products segment, owing to solid demand for Rechargeable Batteries despite the challenging market environment.
¬ Despite weak demand overall, demand strengthened for PCs and tablets as more people shifted to work and study at home in this new normal for lifestyles. Demand related to 5G base stations also grew. Consolidated earnings growth was driven by higher sales of Rechargeable Batteries, MLCCs, and High-Frequency Components.
¬ Sales of Passive Components and Sensors for automobiles were below expectations due to weak demand on the automotive market.
¬ Sales of HDD Heads decreased more than expected as parts of Asia went into lockdown during the COVID-19 pandemic.
Performance Briefing 1Q of Fiscal Year March 2021 © TDK Corporation 2020Corporate Communications Group July 30, 2020 5
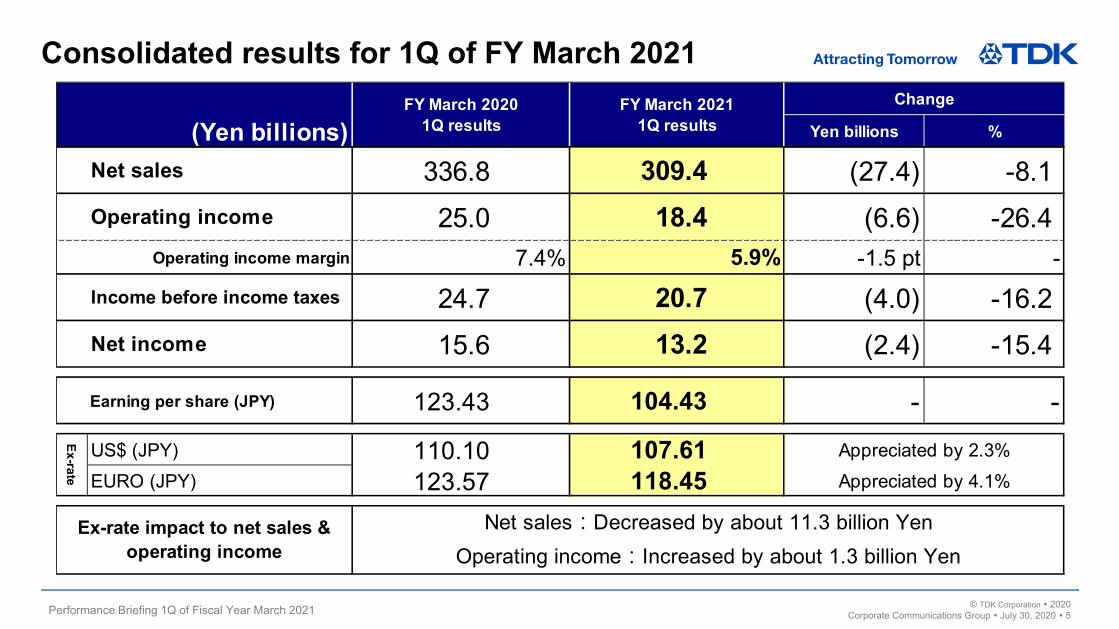
Consolidated results for 1Q of FY March 2021
Yen billions %
Net sales 336.8 309.4 (27.4) -8.1Operating income 25.0 18.4 (6.6) -26.4
Operating income margin 7.4% 5.9% -1.5 pt -Income before income taxes 24.7 20.7 (4.0) -16.2Net income 15.6 13.2 (2.4) -15.4
Earning per share (JPY) 123.43 104.43 - -US$ (JPY) 110.10 107.61EURO (JPY) 123.57 118.45
Change
(Yen billions)FY March 2020
1Q resultsFY March 2021
1Q results
Appreciated by 2.3%Appreciated by 4.1%
Ex-rate
Ex-rate impact to net sales &operating income
Net sales:Decreased by about 11.3 billion YenOperating income:Increased by about 1.3 billion Yen
Performance Briefing 1Q of Fiscal Year March 2021 © TDK Corporation 2020Corporate Communications Group July 30, 2020 6
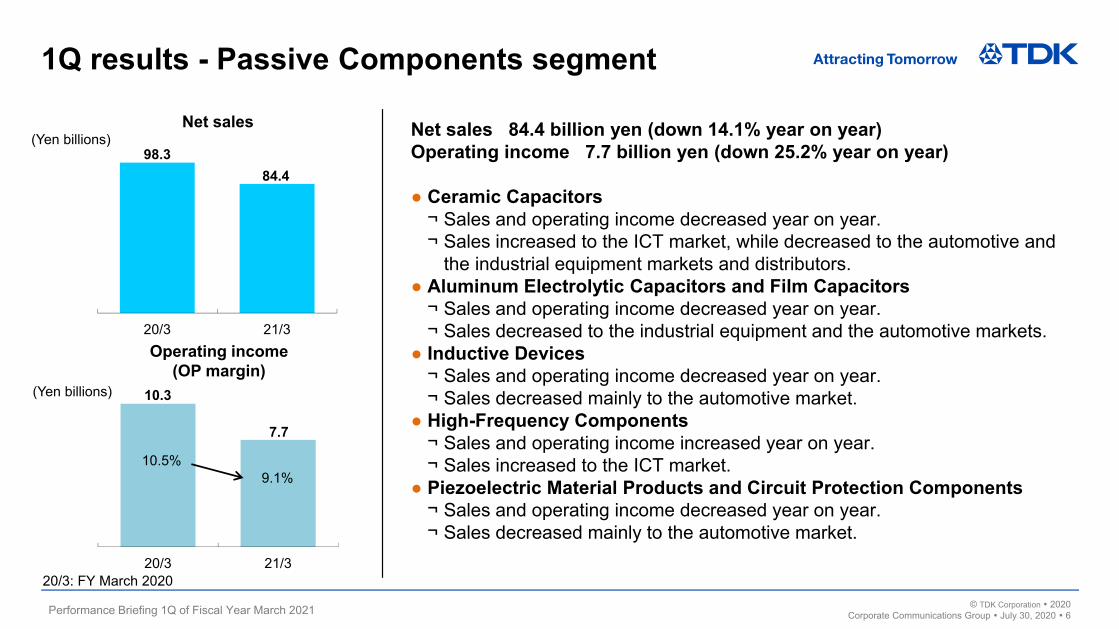
10.3
7.7
20/3 21/3
98.3 84.4
20/3 21/3
1Q results - Passive Components segment
Net sales 84.4 billion yen (down 14.1% year on year)Operating income 7.7 billion yen (down 25.2% year on year)
● Ceramic Capacitors¬ Sales and operating income decreased year on year.¬ Sales increased to the ICT market, while decreased to the automotive and
the industrial equipment markets and distributors.● Aluminum Electrolytic Capacitors and Film Capacitors
¬ Sales and operating income decreased year on year.¬ Sales decreased to the industrial equipment and the automotive markets.
● Inductive Devices¬ Sales and operating income decreased year on year.¬ Sales decreased mainly to the automotive market.
● High-Frequency Components¬ Sales and operating income increased year on year.¬ Sales increased to the ICT market.
● Piezoelectric Material Products and Circuit Protection Components¬ Sales and operating income decreased year on year.¬ Sales decreased mainly to the automotive market.
Net sales(Yen billions)
Operating income(OP margin)
(Yen billions)
10.5%9.1%
20/3: FY March 2020
Performance Briefing 1Q of Fiscal Year March 2021 © TDK Corporation 2020Corporate Communications Group July 30, 2020 7
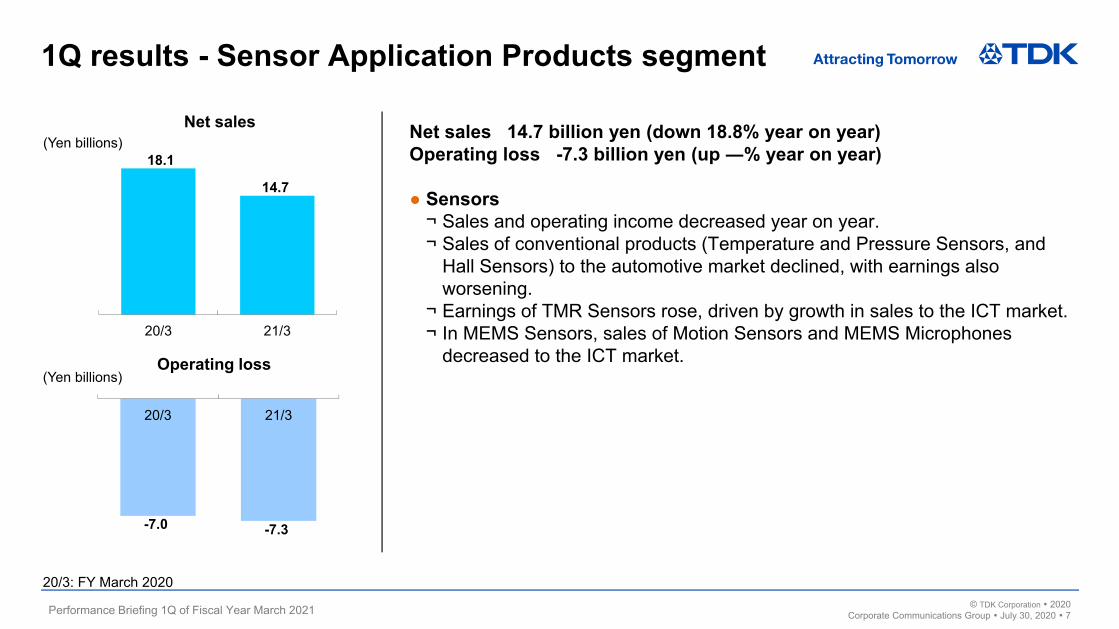
-7.0 -7.3
20/3 21/3
18.1
14.7
20/3 21/3
1Q results - Sensor Application Products segment
Net sales 14.7 billion yen (down 18.8% year on year)Operating loss -7.3 billion yen (up ―% year on year)
● Sensors¬ Sales and operating income decreased year on year.¬ Sales of conventional products (Temperature and Pressure Sensors, and
Hall Sensors) to the automotive market declined, with earnings also worsening.
¬ Earnings of TMR Sensors rose, driven by growth in sales to the ICT market.¬ In MEMS Sensors, sales of Motion Sensors and MEMS Microphones
decreased to the ICT market.
Net sales(Yen billions)
Operating loss(Yen billions)
20/3: FY March 2020
Performance Briefing 1Q of Fiscal Year March 2021 © TDK Corporation 2020Corporate Communications Group July 30, 2020 8
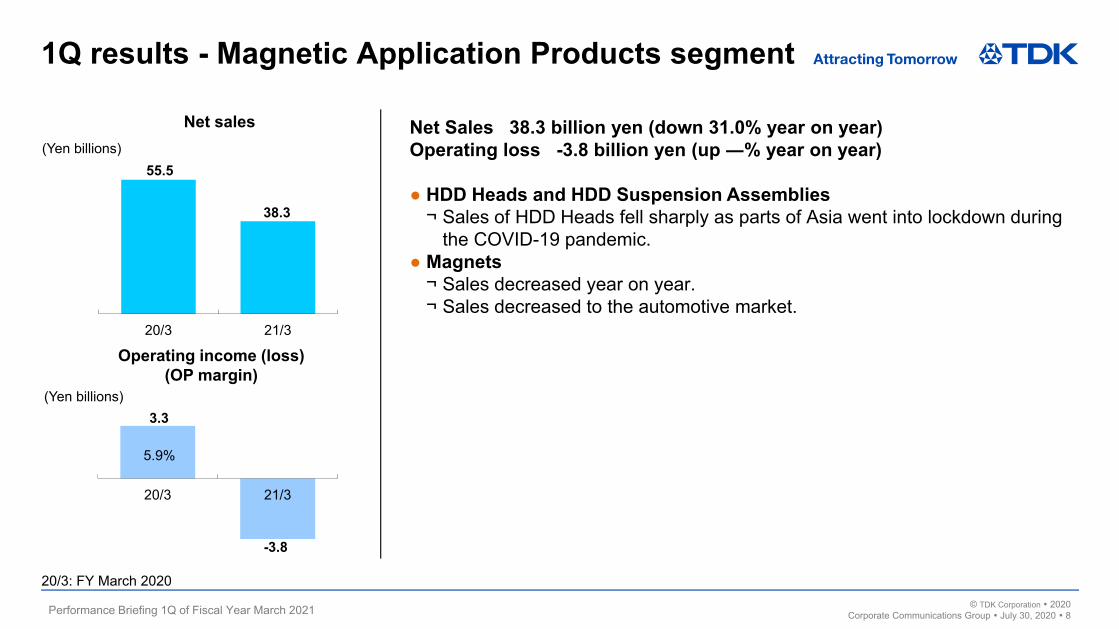
3.3
-3.8
20/3 21/3
55.5
38.3
20/3 21/3
1Q results - Magnetic Application Products segment
Net Sales 38.3 billion yen (down 31.0% year on year)Operating loss -3.8 billion yen (up ―% year on year)
● HDD Heads and HDD Suspension Assemblies¬ Sales of HDD Heads fell sharply as parts of Asia went into lockdown during
the COVID-19 pandemic.● Magnets
¬ Sales decreased year on year.¬ Sales decreased to the automotive market.
Net sales(Yen billions)
Operating income (loss)(OP margin)
(Yen billions)
5.9%
20/3: FY March 2020
Performance Briefing 1Q of Fiscal Year March 2021 © TDK Corporation 2020Corporate Communications Group July 30, 2020 9
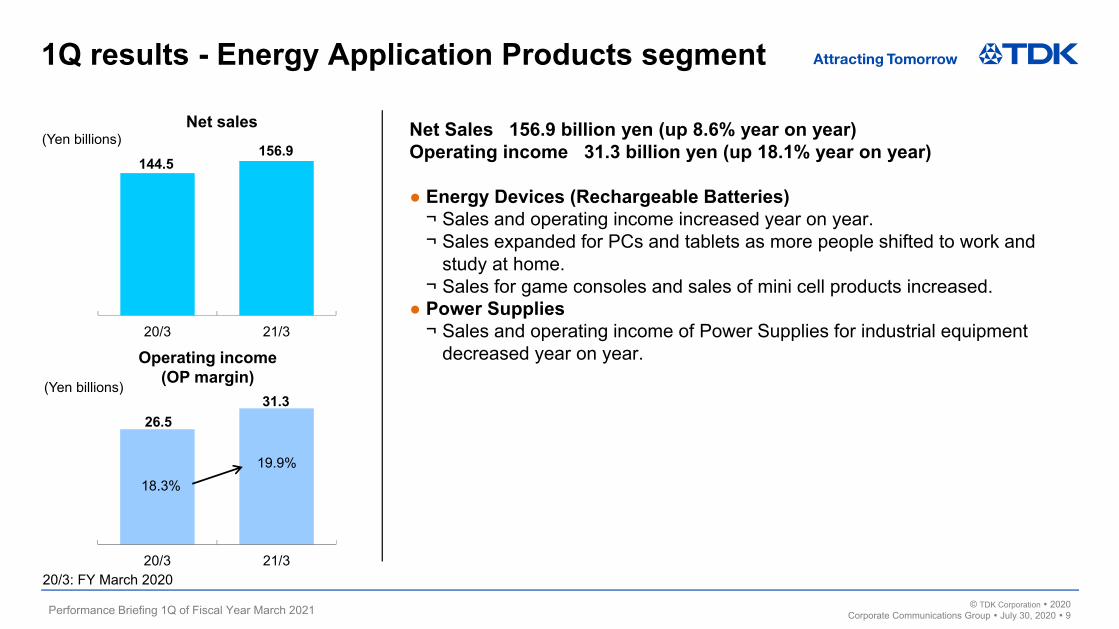
26.5 31.3
20/3 21/3
144.5 156.9
20/3 21/3
1Q results - Energy Application Products segment
Net Sales 156.9 billion yen (up 8.6% year on year)Operating income 31.3 billion yen (up 18.1% year on year)
● Energy Devices (Rechargeable Batteries)¬ Sales and operating income increased year on year.¬ Sales expanded for PCs and tablets as more people shifted to work and
study at home.¬ Sales for game consoles and sales of mini cell products increased.
● Power Supplies¬ Sales and operating income of Power Supplies for industrial equipment
decreased year on year.
Net sales(Yen billions)
Operating income(OP margin)(Yen billions)
18.3%19.9%
20/3: FY March 2020
Performance Briefing 1Q of Fiscal Year March 2021 © TDK Corporation 2020Corporate Communications Group July 30, 2020 10
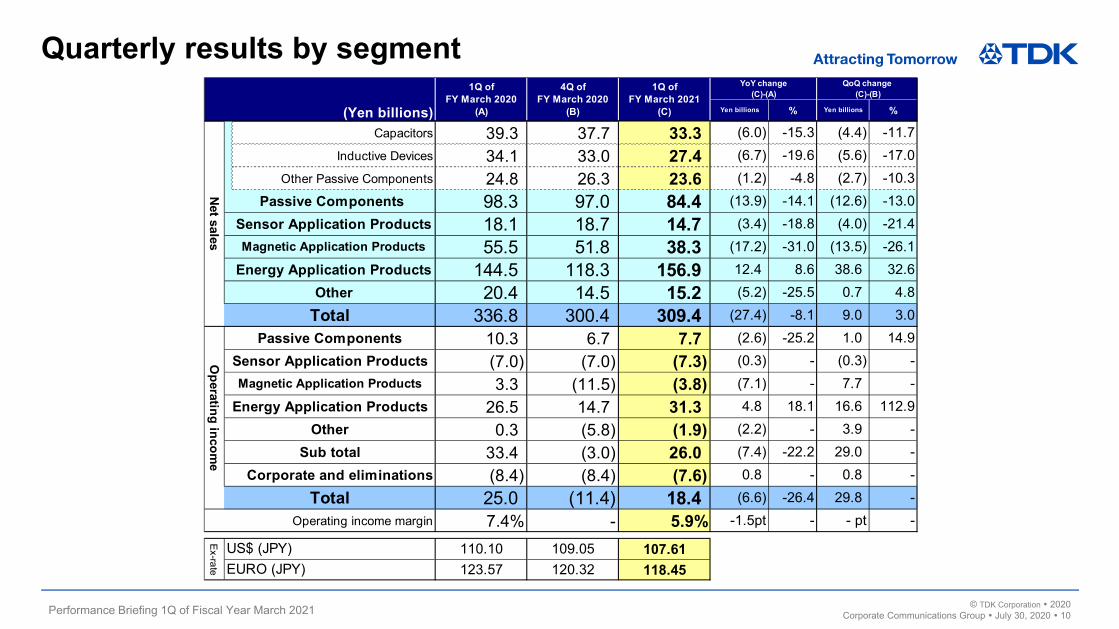
Quarterly results by segmentYen billions % Yen billions %
Capacitors 39.3 37.7 33.3 (6.0) -15.3 (4.4) -11.7Inductive Devices 34.1 33.0 27.4 (6.7) -19.6 (5.6) -17.0
Other Passive Components 24.8 26.3 23.6 (1.2) -4.8 (2.7) -10.3Passive Components 98.3 97.0 84.4 (13.9) -14.1 (12.6) -13.0
Sensor Application Products 18.1 18.7 14.7 (3.4) -18.8 (4.0) -21.4Magnetic Application Products 55.5 51.8 38.3 (17.2) -31.0 (13.5) -26.1
Energy Application Products 144.5 118.3 156.9 12.4 8.6 38.6 32.6Other 20.4 14.5 15.2 (5.2) -25.5 0.7 4.8
336.8 300.4 309.4 (27.4) -8.1 9.0 3.0
10.3 6.7 7.7 (2.6) -25.2 1.0 14.9
(7.0) (7.0) (7.3) (0.3) - (0.3) -
3.3 (11.5) (3.8) (7.1) - 7.7 -
26.5 14.7 31.3 4.8 18.1 16.6 112.9
0.3 (5.8) (1.9) (2.2) - 3.9 -
33.4 (3.0) 26.0 (7.4) -22.2 29.0 -
(8.4) (8.4) (7.6) 0.8 - 0.8 -
25.0 (11.4) 18.4 (6.6) -26.4 29.8 -Operating income margin 7.4% - 5.9% -1.5pt - - pt -
110.10 109.05 107.61123.57 120.32 118.45
Sensor Application Products
Ex-rate
Energy Application ProductsOther
Sub totalCorporate and eliminations
Total
US$ (JPY)EURO (JPY)
Operating incom
e
Passive Components
Magnetic Application Products
QoQ change (C)-(B)
(Yen billions)
1Q ofFY March 2020
(A)
4Q ofFY March 2020
(B)
1Q ofFY March 2021
(C)
YoY change(C)-(A)
Net sales
Total
Performance Briefing 1Q of Fiscal Year March 2021 © TDK Corporation 2020Corporate Communications Group July 30, 2020 11
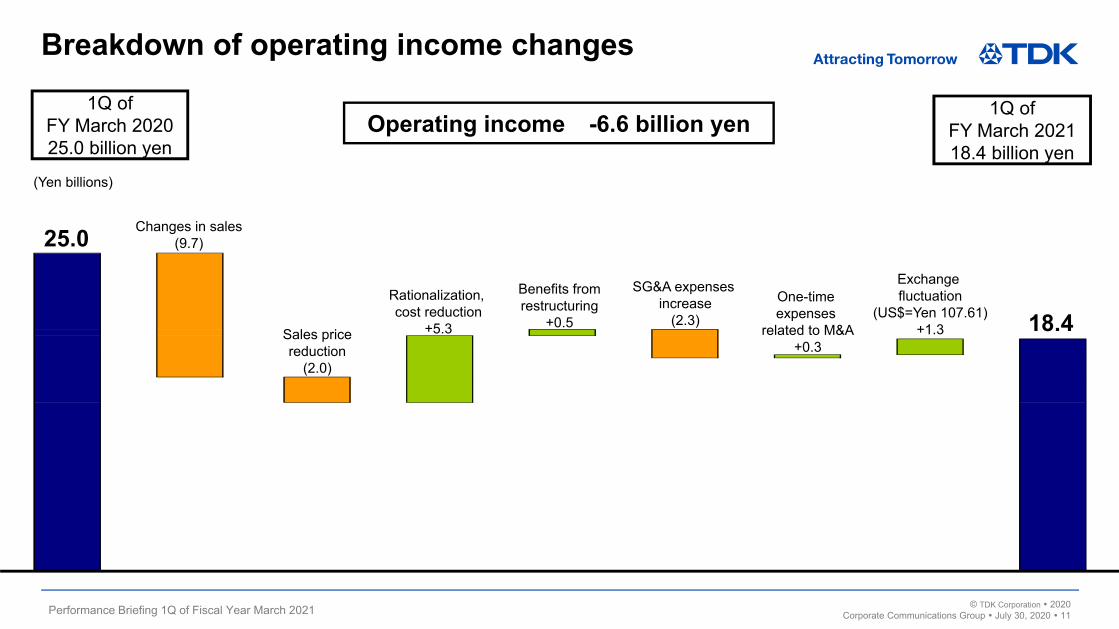
Breakdown of operating income changes
Operating income -6.6 billion yen1Q of
FY March 202025.0 billion yen
1Q ofFY March 202118.4 billion yen
18.4
25.0 Changes in sales(9.7)
Sales pricereduction
(2.0)
Exchange fluctuation
(US$=Yen 107.61)+1.3
Rationalization, cost reduction
+5.3
Benefits fromrestructuring
+0.5
SG&A expenses increase
(2.3)
(Yen billions)
One-time expenses
related to M&A+0.3
Performance Briefing 1Q of Fiscal Year March 2021 © TDK Corporation 2020Corporate Communications Group July 30, 2020 12
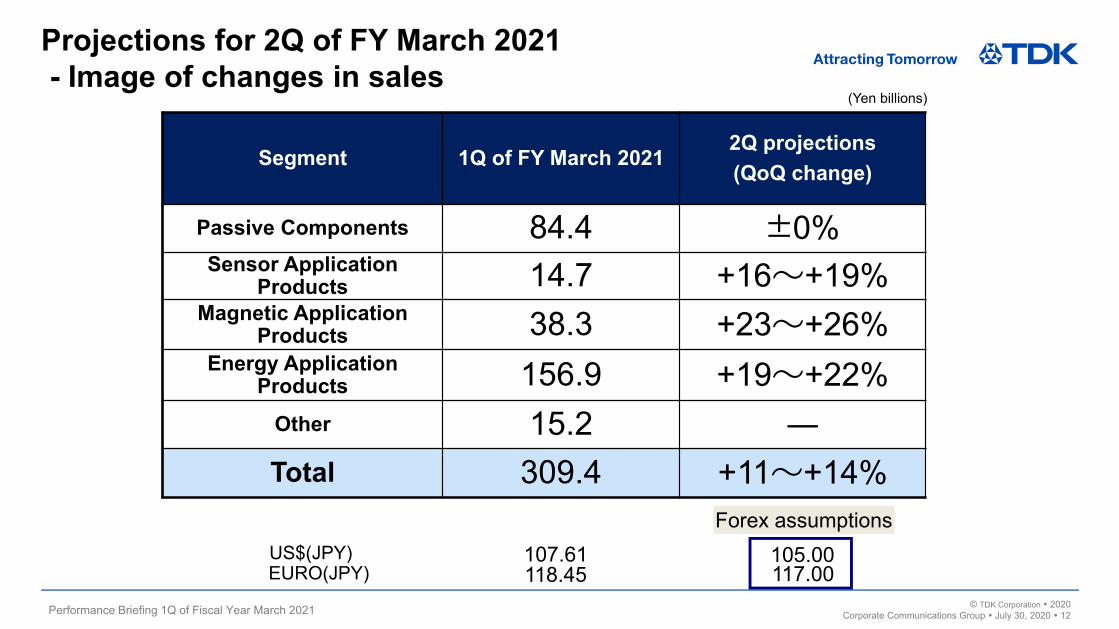
Projections for 2Q of FY March 2021- Image of changes in sales
Segment 1Q of FY March 20212Q projections(QoQ change)
Passive Components 84.4 ±0%Sensor Application
Products 14.7 +16~+19%Magnetic Application
Products 38.3 +23~+26%Energy Application
Products 156.9 +19~+22%Other 15.2 ―Total 309.4 +11~+14%
US$(JPY) 107.61 105.00EURO(JPY) 118.45 117.00
Forex assumptions
(Yen billions)
Performance Briefing 1Q of Fiscal Year March 2021 © TDK Corporation 2020Corporate Communications Group July 30, 2020 13
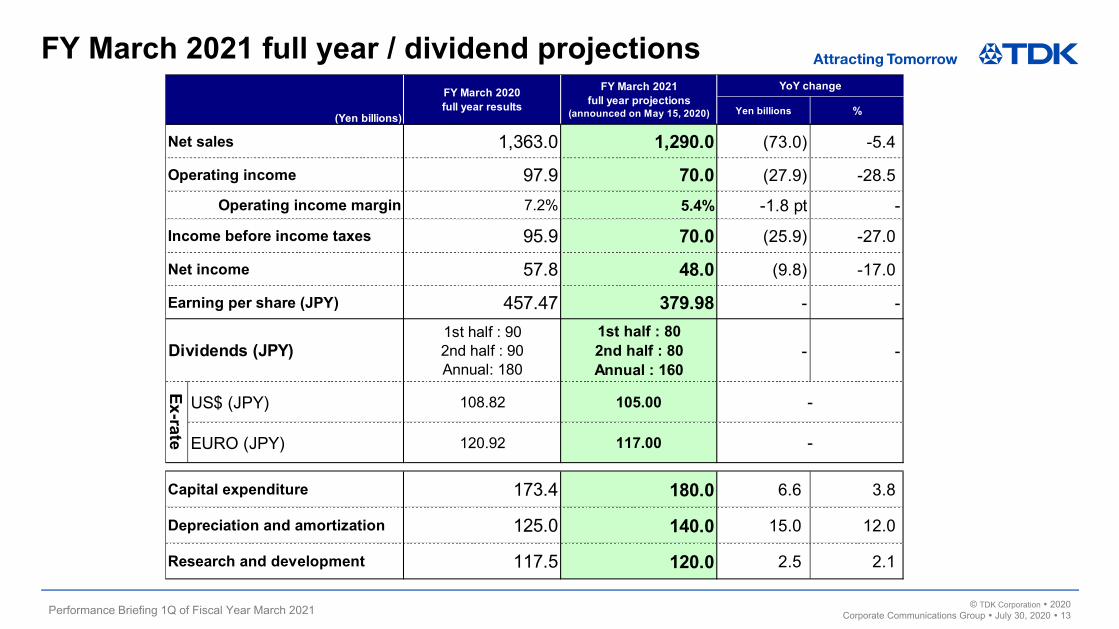
FY March 2021 full year / dividend projections
Yen billions %
1,363.0 1,290.0 (73.0) -5.4
97.9 70.0 (27.9) -28.5
7.2% 5.4% -1.8 pt -
95.9 70.0 (25.9) -27.0
57.8 48.0 (9.8) -17.0
457.47 379.98 - -1st half : 902nd half : 90Annual: 180
1st half : 802nd half : 80Annual : 160
- -
US$ (JPY) 108.82 105.00
EURO (JPY) 120.92 117.00
173.4 180.0 6.6 3.8
125.0 140.0 15.0 12.0
117.5 120.0 2.5 2.1
FY March 2021full year projections
(announced on May 15, 2020)
YoY change
Net sales
Operating income
(Yen billions)
FY March 2020full year results
-
-
Operating income margin
Income before income taxes
Net income
Earning per share (JPY)
Dividends (JPY)
Ex-rate
Capital expenditure
Depreciation and amortization
Research and development
Performance Briefing 1Q of Fiscal Year March 2021 © TDK Corporation 2020Corporate Communications Group July 30, 2020 14
Supplementary Data
Performance Briefing 1Q of Fiscal Year March 2021 © TDK Corporation 2020Corporate Communications Group July 30, 2020 15
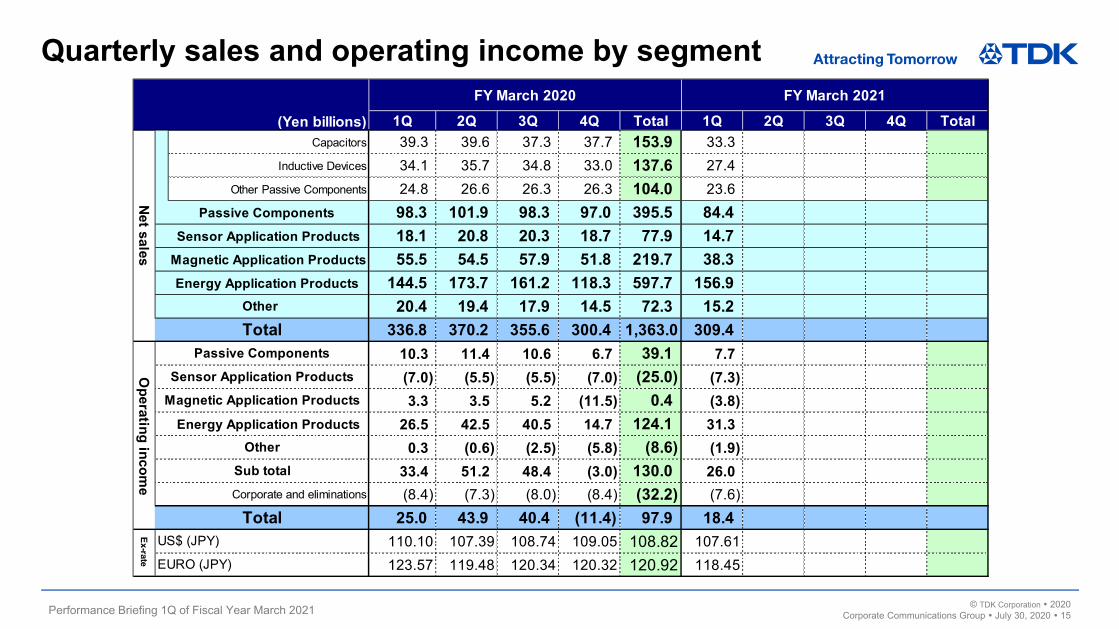
Quarterly sales and operating income by segment
1Q 2Q 3Q 4Q Total 1Q 2Q 3Q 4Q TotalCapacitors 39.3 39.6 37.3 37.7 153.9 33.3
Inductive Devices 34.1 35.7 34.8 33.0 137.6 27.4Other Passive Components 24.8 26.6 26.3 26.3 104.0 23.6
Passive Components 98.3 101.9 98.3 97.0 395.5 84.4Sensor Application Products 18.1 20.8 20.3 18.7 77.9 14.7
Magnetic Application Products 55.5 54.5 57.9 51.8 219.7 38.3Energy Application Products 144.5 173.7 161.2 118.3 597.7 156.9
20.4 19.4 17.9 14.5 72.3 15.2336.8 370.2 355.6 300.4 1,363.0 309.4
10.3 11.4 10.6 6.7 39.1 7.7(7.0) (5.5) (5.5) (7.0) (25.0) (7.3)3.3 3.5 5.2 (11.5) 0.4 (3.8)
Energy Application Products 26.5 42.5 40.5 14.7 124.1 31.30.3 (0.6) (2.5) (5.8) (8.6) (1.9)
33.4 51.2 48.4 (3.0) 130.0 26.0(8.4) (7.3) (8.0) (8.4) (32.2) (7.6)
25.0 43.9 40.4 (11.4) 97.9 18.4110.10 107.39 108.74 109.05 108.82 107.61123.57 119.48 120.34 120.32 120.92 118.45
Total
Ex-rate
US$ (JPY)
EURO (JPY)
Other
Sub totalCorporate and eliminations
Total
Operating incom
e
Passive Components
Sensor Application ProductsMagnetic Application Products
Net sales
Other
FY March 2021
(Yen billions)
FY March 2020
Performance Briefing 1Q of Fiscal Year March 2021 © TDK Corporation 2020Corporate Communications Group July 30, 2020 16
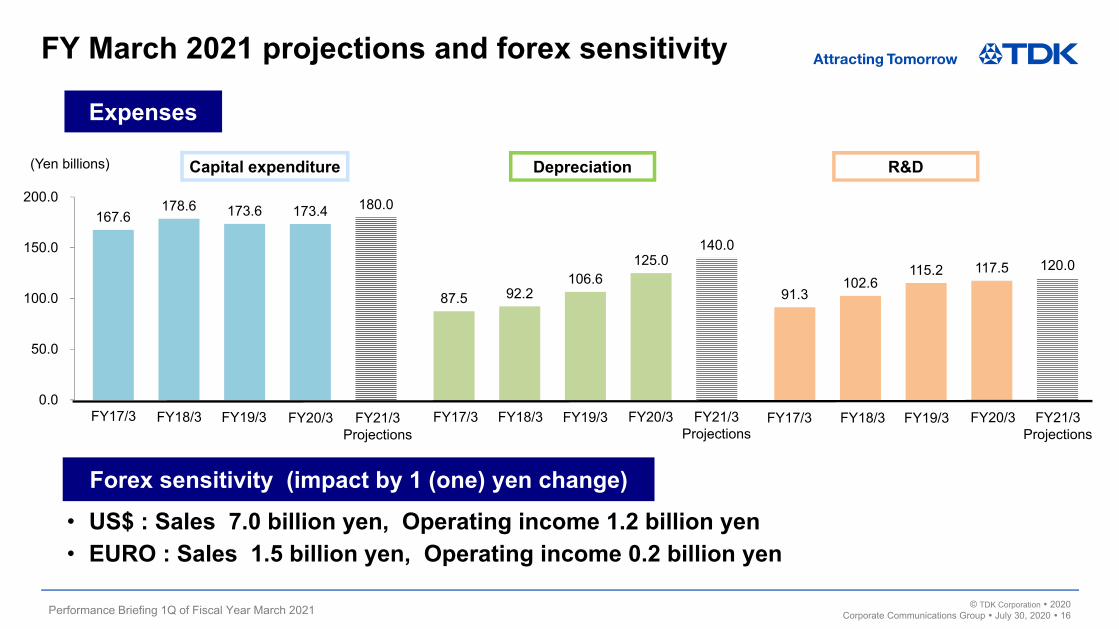
167.6
87.5 91.3
178.6
92.2102.6
173.6
106.6 115.2
173.4
125.0 117.5
180.0
140.0120.0
0.0
50.0
100.0
150.0
200.0
FY March 2021 projections and forex sensitivity
(Yen billions) Capital expenditure Depreciation R&D
FY17/3 FY18/3 FY19/3 FY20/3
Expenses
Forex sensitivity (impact by 1 (one) yen change)・ US$ : Sales 7.0 billion yen, Operating income 1.2 billion yen・ EURO : Sales 1.5 billion yen, Operating income 0.2 billion yen
FY21/3Projections
FY17/3 FY18/3 FY19/3 FY20/3 FY21/3Projections
FY17/3 FY18/3 FY19/3 FY20/3 FY21/3Projections
Performance Briefing 1Q of Fiscal Year March 2021 © TDK Corporation 2020Corporate Communications Group July 30, 2020 17
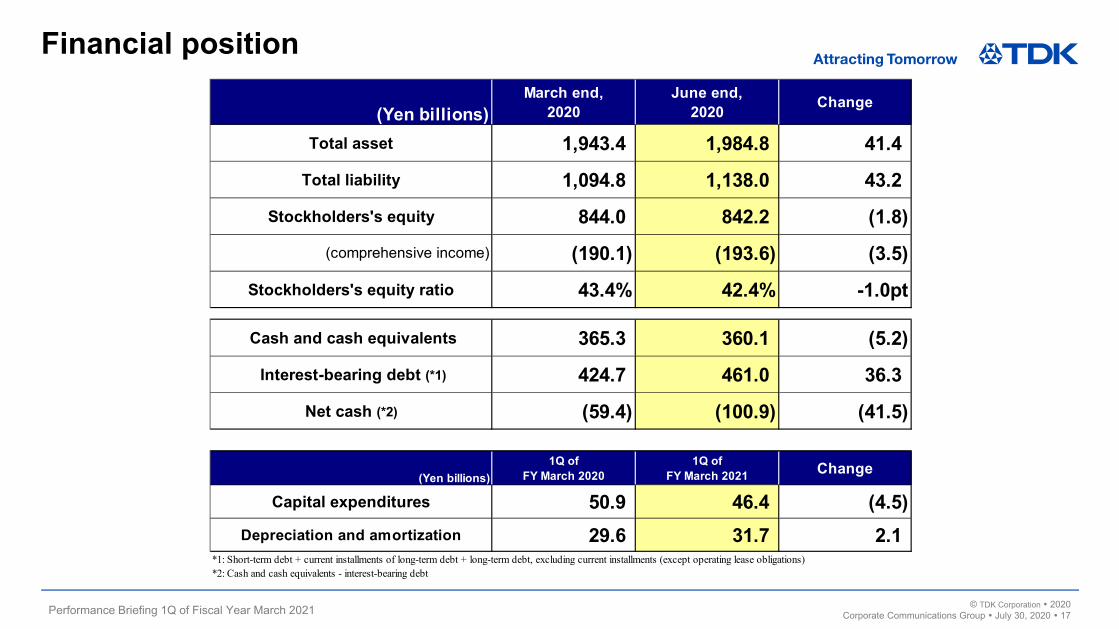
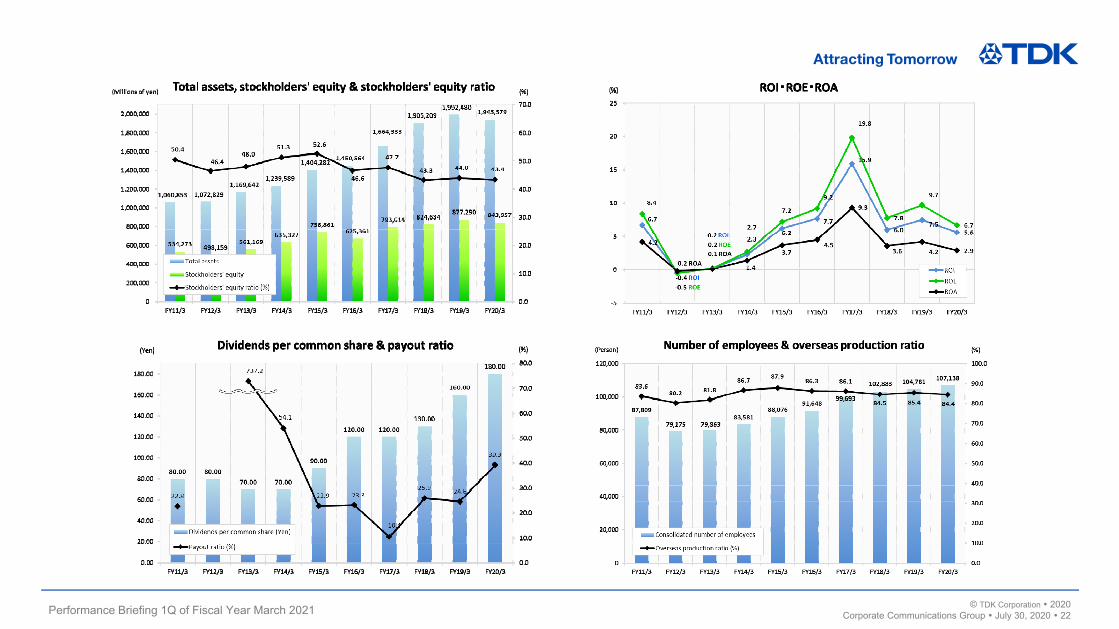
Financial position
(Yen billions)March end,
2020June end,
2020 Change
Total asset 1,943.4 1,984.8 41.4
Total liability 1,094.8 1,138.0 43.2
Stockholders's equity 844.0 842.2 (1.8)(comprehensive income) (190.1) (193.6) (3.5)
Stockholders's equity ratio 43.4% 42.4% -1.0pt
Cash and cash equivalents 365.3 360.1 (5.2)
Interest-bearing debt (*1) 424.7 461.0 36.3
Net cash (*2) (59.4) (100.9) (41.5)
(Yen billions)1Q of
FY March 20201Q of
FY March 2021 Change
Capital expenditures 50.9 46.4 (4.5)Depreciation and amortization 29.6 31.7 2.1
*1: Short-term debt + current installments of long-term debt + long-term debt, excluding current installments (except operating lease obligations)*2: Cash and cash equivalents - interest-bearing debt
Performance Briefing 1Q of Fiscal Year March 2021 © TDK Corporation 2020Corporate Communications Group July 30, 2020 18
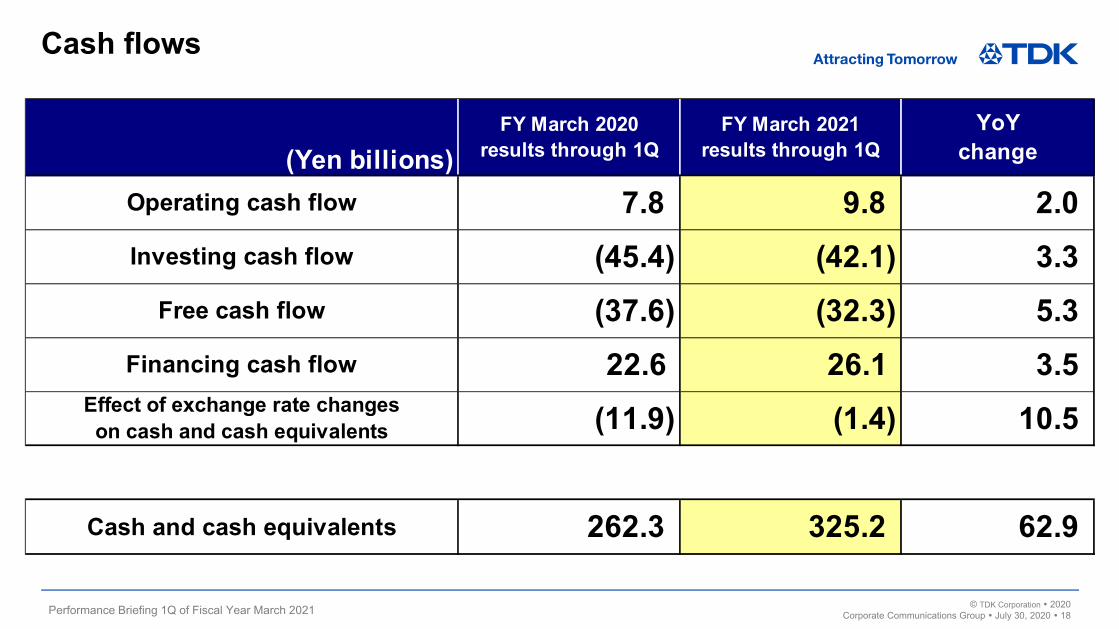
Cash flows
7.8 9.8 2.0(45.4) (42.1) 3.3(37.6) (32.3) 5.322.6 26.1 3.5
(11.9) (1.4) 10.5
262.3 325.2 62.9
FY March 2020results through 1Q
FY March 2021results through 1Q
YoYchange
Effect of exchange rate changeson cash and cash equivalents
Cash and cash equivalents
(Yen billions)Operating cash flow
Investing cash flow
Free cash flow
Financing cash flow
Performance Briefing 1Q of Fiscal Year March 2021 © TDK Corporation 2020Corporate Communications Group July 30, 2020 19
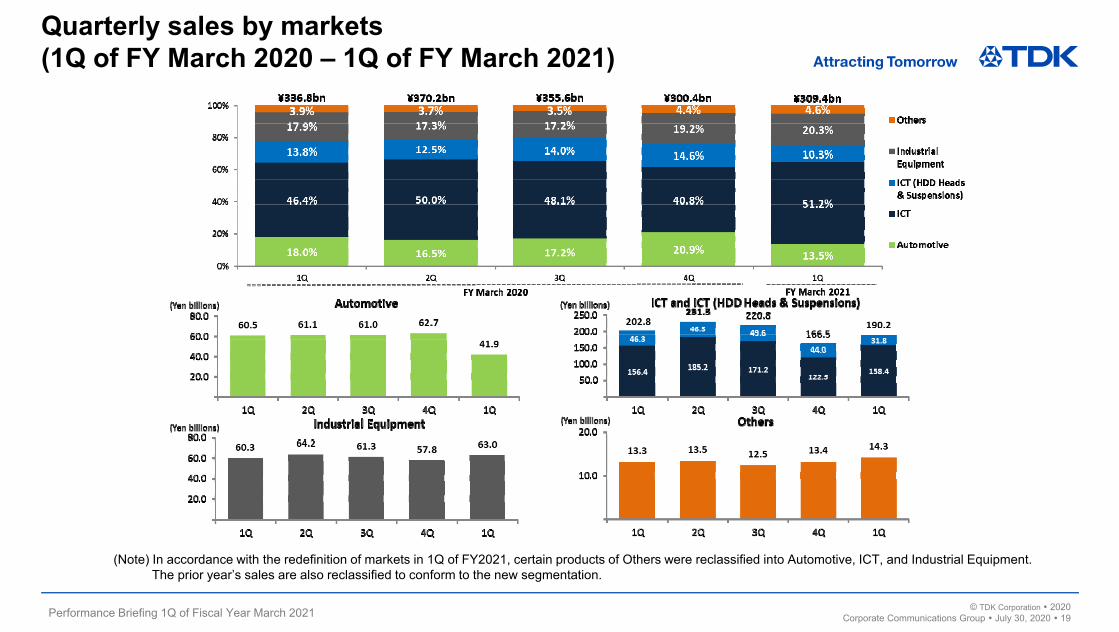
Quarterly sales by markets (1Q of FY March 2020 – 1Q of FY March 2021)
(Note) In accordance with the redefinition of markets in 1Q of FY2021, certain products of Others were reclassified into Automotive, ICT, and Industrial Equipment.The prior year’s sales are also reclassified to conform to the new segmentation.
Performance Briefing 1Q of Fiscal Year March 2021 © TDK Corporation 2020Corporate Communications Group July 30, 2020 20
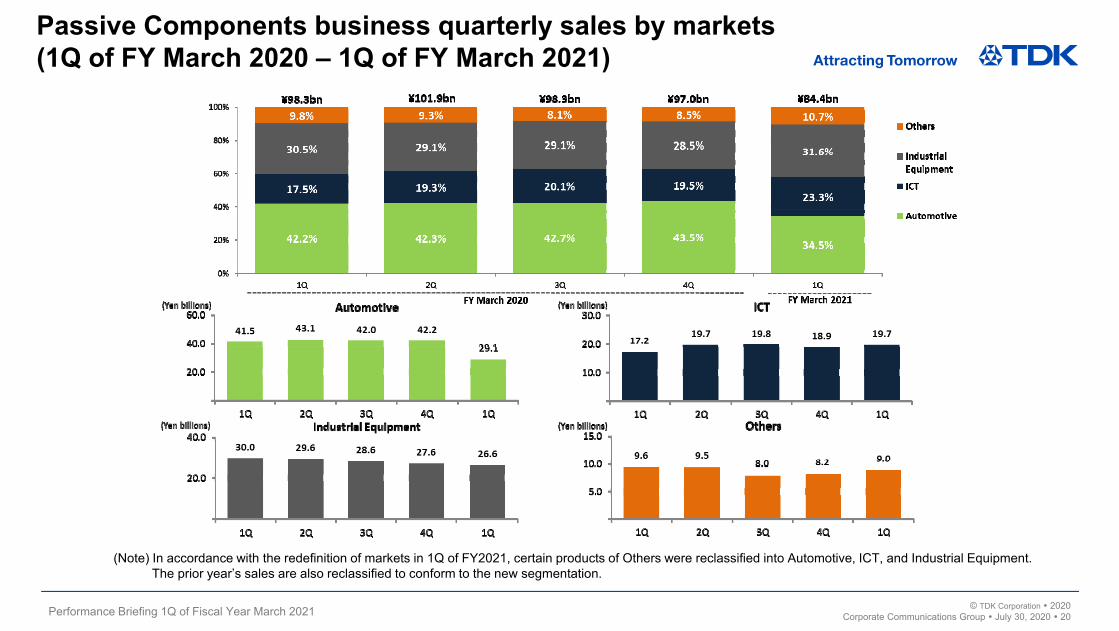
Passive Components business quarterly sales by markets(1Q of FY March 2020 – 1Q of FY March 2021)
(Note) In accordance with the redefinition of markets in 1Q of FY2021, certain products of Others were reclassified into Automotive, ICT, and Industrial Equipment.The prior year’s sales are also reclassified to conform to the new segmentation.
Performance Briefing 1Q of Fiscal Year March 2021 © TDK Corporation 2020Corporate Communications Group July 30, 2020 21
Performance Briefing 1Q of Fiscal Year March 2021 © TDK Corporation 2020Corporate Communications Group July 30, 2020 22
Performance Briefing 1Q of Fiscal Year March 2021 © TDK Corporation 2020Corporate Communications Group July 30, 2020 23
Cautionary statements with respect to forward-looking statements
This material contains forward-looking statements, including projections, plans, policies, management strategies, targets, schedules, understandings, and evaluations about TDK, or its group companies (TDK Group). These forward-looking statements are based on the current forecasts, estimates, assumptions, plans, beliefs, and evaluations of the TDK Group in light of the information currently available to it, and contain known and unknown risks, uncertainties, and other factors. The TDK Group therefore wishes to caution readers that, being subject to risks, uncertainties, and other factors, the TDK Group’s actual results, performance, achievements, or financial position could be materially different from any future results, performance, achievements, or financial position expressed or implied by these forward-looking statements, and the TDK Group undertakes no obligation to publicly update or revise any forward-looking statements after the issue of this material except as provided for in laws and ordinances.
The electronics markets in which the TDK Group operates are highly susceptible to rapid changes, risks, uncertainties, and other factors that can have significant effects on the TDK Group including, but not limited to, shifts in technology, fluctuations in demand, prices, interest and foreign exchange rates, and changes in economic environments, conditions of competition, laws and regulations. Also, since the purpose of these materials is only to give readers a general outline of business performance, many numerical values are shown in units of a billion yen. Because original values, which are managed in units of a million yen, are rounded off, the totals, differences, etc. shown in these materials may appear inaccurate. If detailed figures are necessary, please refer to our financial statements and supplementary materials.
Text data including Q&A of performance briefing will be uploaded on following site.https://www.tdk.com/corp/en/ir/ir_events/conference/2021/1q_1.htm