Embed Size (px)
Citation preview
November 2006
Research Report: UCPRC-RR-2006-16
PPPeeerrrfffooorrrmmmaaannnccceee---BBBaaassseeeddd PPPaaayyy FFFaaaccctttooorrrsss fffooorrr
AAAsssppphhhaaalllttt CCCooonnncccrrreeettteee CCCooonnnssstttrrruuuccctttiiiooonnn::: CCCooommmpppaaarrriiisssooonnn wwwiiittthhh aaa CCCuuurrrrrreeennntttlllyyy UUUssseeeddd
EEExxxpppeeerrriiieeennnccceee---BBBaaassseeeddd AAApppppprrroooaaaccchhh
Authors:L. Popescu and
C. L. Monismith
Work Conducted Under “Development of New Asphalt Concrete QC/QA Pay Factor Tables” as part of Partnered Pavement Research Center Strategic Plan Element No. 3.1.5
PREPARED FOR: California Department of Transportation (Caltrans) Division of Construction
PREPARED BY:
University of California Pavement Research Center
UC Davis and Berkeley

UCPRC-RR-2006-16 ii
DOCUMENT RETRIEVAL PAGE Research Report Number: UCPRC-RR-2006-16
Title: Performance-Based Pay Factors for Asphalt Concrete Construction: Comparison with a Currently Used Experience-Based Approach Authors: L. Popescu and C. L. Monismith Prepared for: Caltrans Division of Construction
FHWA No.: CA091888A
Date Work Submitted: October 12, 2007
Report Date:November 2006
Strategic Plan Element No: 3.1.5
Status: Stage 6 final approved
Version No:1
Abstract: Document summarizes a procedure to establish pay factors for asphalt concrete pavement construction using performance models for fatigue and rutting based on the analysis of accelerated pavement tests from the Caltrans Heavy Vehicle Simulator (HVS) and the WesTrack accelerated pavement performance test program. Results of the performance-based approach are compared with pay factors determined by the current Caltrans procedure using percent defective and experience-based weighting factors.
Keywords: pay factor, performance models, rutting performance model, fatigue performance model, percent within limits (PWL), percent defective
Proposals for implementation: • Based on the results presented in the report, it is recommended that Caltrans take the necessary steps to
implement the performance-based approach using the pay factor methodology described herein. A Pay Factor Calculator using some of the spreadsheet features of Microsoft® Excel is available, which makes use of the six pay factor tables included in the report.
• A suggested approach for implementation is to select a series of QC/QA construction projects and determine pay factors by both the current procedure and the proposed performance-based approach. The results from both procedures could then be evaluated by the Joint Caltrans/Industry Task Group to determine the efficacy of implementing the performance-based approach at the completion of this evaluation.
If the above recommendation is followed a thickness measurement would be required in addition to the conventional mix parameters.
Related documents: • J. A. Deacon, C. L. Monismith, and J. T. Harvey. “Pay Factors for Asphalt-Concrete Construction: Effect
of Construction Quality on Agency Costs”. TM-UCB-CAL/APT-97-1. Pavement Research Center, Institute of Transportation Studies, University of California, Berkeley, April 1997, 47 pp.
• J.A. Deacon, C.L. Monismith, J.T. Harvey, and L. Popescu. “Pay Factors for Asphalt Concrete Construction: Effect of Construction Quality on Agency Costs”. TM-UCB-PR-2001-1. Pavement Research Center, Institute for Transportation Studies, University of California, Berkeley, February 2001, 97 pp.
Signatures: L. Popescu First Author
C. Suszko Technical Review
D. Spinner Editor
C. L. Monismith Principal Investigator
T. Joe Holland Caltrans Contract Manager
UCPRC-RR-2006-16
iii
DISCLAIMER
The contents of this report reflect the views of the authors who are responsible for the facts and
accuracy of the data presented herein. The contents do not necessarily reflect the official views
or policies of the State of California or the Federal Highway Administration. This report does not
constitute a standard, specification, or regulation.
PROJECT OBJECTIVES This report addresses Strategic Plan Elements (SPE) 3.1.5 and 4.13.
ACKNOWLEDGEMENTS The research that serves as the basis for this report has been supported by the California
Department of Transportation (Caltrans), the Federal Highway Administration, and the National
Cooperative Research Program of the Transportation Research Board (WesTrack, rutting
performance model).
The authors are grateful to: Dr. J. A. Deacon for his significant contributions to the
proposed approach for pay factor determinations; Mr. Paul Benson of Materials Engineering and
Testing Services (METS) for the data for the Caltrans-determined pay factors contained in Table
B1; and representatives of the pavement construction industry in California for the data in Table
8. Mr. David Spinner of the UC Pavement Research Center prepared the manuscript in final form
and his efforts are gratefully acknowledged.

UCPRC-RR-2006-16 iv

UCPRC-RR-2006-16
v
EXECUTIVE SUMMARY
The report briefly summarizes a procedure to establish pay factors for asphalt concrete pavement
construction using performance models for fatigue and rutting. These models are based on a
combination of mechanistic-empirical pavement analyses, SHRP-developed laboratory test data
on hot-mix asphalt (HMA) to provide measures of the effects of mix variables on fatigue and
rutting behavior, and accelerated performance tests under full-scale traffic loading. The approach
should be applicable to any type of HMA. For mixes with aggregate gradations different than the
conventional dense-graded materials used in this study, additional laboratory testing should be
performed.
The performance models make use of means and variances rather than the percent within
limits (PWL) approach currently used by many agencies* for asphalt concrete construction
parameters. For rutting, the influence of asphalt content, air-void content, and aggregate
gradation are considered. For fatigue, air-void content, asphalt content, and asphalt concrete
thickness are included. Using a preselected target (design) value and a reasonable standard
deviation (excluding test variance) for a specific mix property or pavement parameter, the
relative performance (RP) of the as-constructed mix can be determined based on its measured
mean property and standard deviation. In this instance RP is defined as the ratio of off-target
traffic (ESALs) to target or design traffic (ESALs).
Costs are established using a cost model considering only agency cost consequences
(road user costs are not included) of delaying or accelerating the time to the next rehabilitation.
Pay factors are combined for a specific distress mode, making use of a multiplicative procedure,
which Monte Carlo simulations have demonstrated is a simple yet reasonable method. The
shortest RP for the combined RPs for mix and pavement characteristics considered for a specific
distress mode permits determination of the pay factor from the cost model.
With this approach it is likely that both incentives and disincentives may be understated
because only the first rehabilitation cycle is considered. Nevertheless, understated
incentives/disincentives measured in terms of bonuses/penalties are likely to be more appropriate
than overstated ones for initial use of this methodology. The methodology provides for a full
bonus for superior construction and a full penalty for inferior construction. Based on current
* Caltrans uses “percent defective.”

UCPRC-RR-2006-16 vi
practice, the potential bonus to be awarded usually does not exceed some prescribed level
established by the transportation agency. The current upper limit for Caltrans is a bonus of 5
percent. The performance-based analysis does not provide a basis for setting such an upper limit
since improved materials quality and construction does, in fact, improve pavement life and
reduce life-cycle costs.
The argument is made that this performance model approach, based on the use of target
values and standard deviations, is a sounder approach to establishing pay factors than the current
procedure using percent defective is based on relative weighting of the mix parameters
considered to affect performance.
The approach emphasizes the importance of adhering to the target value for a specific
pavement characteristic (mix property and layer thickness) and maintaining uniformity (low
standard deviation) to achieve or exceed the desired performance level.
Combined pay factors for rutting and fatigue based on the cost model shown in Figure 8
are based on: target lives of 10 and 20 years, a 2 percent annual traffic growth rate, a 5 percent
discount rate, a 2.5 percent inflation rate, and rehabilitation costs equal to 0.5 times the initial
construction cost for rutting and fatigue. Other parameters, e.g., changed target lives and
rehabilitation costs, will result in different values for the combined pay factors. Moreover these
pay factors have been developed for asphalt concrete pavements on granular base and subbase
over the subgrade.
Until further research becomes available, the approach for rutting would appear
applicable for asphalt concrete overlays on portland cement concrete (PCC) pavements. Rutting
resulting from shear deformations in asphalt concrete is usually limited to the upper 75–100 mm
and overlays on PCC pavement usually have thicknesses of at least these values. On the other
hand, cracking in overlay pavements (both cracked asphalt concrete and PCC) is likely to be
reflection cracking rather than the classical fatigue cracking which can occur in conventional
asphalt concrete pavements. Reference (1) provides some evidence that this is the case for
asphalt concrete overlays on cracked asphalt concrete pavements. It is probable that the factors
that affect fatigue cracking will also affect reflection cracking. The relative effects of these
factors may not be exactly the same as for fatigue; nevertheless they can serve as a starting point.
UCPRC-RR-2006-16
vii
Results from the process used by Caltrans for obtaining a combined pay factor, using
weighting factors for selected mix parameters, are compared with the multiplicative procedure.
The comparison suggests that weighting factors for specific mix parameters are dependent on the
mode of distress; for example, the effect of asphalt content is different for fatigue and rutting.
The available evidence suggests that the effects of the mix variables using PWL (or
percent defective) are based solely on experience. It is possible that the performance-based
approach could be used to establish PWL; however, the authors are not aware of any such
examples of this approach. In the Caltrans methodology, for example, both rutting and fatigue
effects are lumped together. A major advantage of the performance-based approach is that it
emphasizes the mix and pavement structure characteristics that most affect performance. As an
example, the rutting model emphasizes the importance of asphalt content, degree of compaction,
and aggregate gradation as defined by the P200 fraction, while the fatigue model emphasizes
degree of compaction, pavement thickness, and asphalt content. While the contractor might
consider increasing the binder content somewhat for improved degree of compaction for fatigue,
this increase of the asphalt content above the design target is precluded because of rutting
considerations. Moreover, as illustrated in Table 13, for rutting, the relative weighting of the pay
factors are different than those for fatigue. For example, an asphalt content difference relative to
the target value is more critical for rutting than fatigue, particularly on the high side. Similarly, a
compaction difference (as measured by Vair) above the target value has a more significant effect
on fatigue performance than on rutting propensity. These comparisons necessarily have to be
based on reasonable differences relative to target values. For example, if the mix is compacted
very poorly, at a Vair in the 12 percent range, considerable rutting could occur prematurely due to
the volume change in the mix.
The examples presented in Table 11 and Table 12 also illustrate the advantage of the
performance-based approach. For example, in Table 11, while the percent defective procedure
illustrated relative uniform mix production, the performance-based approach suggested
otherwise. Similarly the data in Table 12 indicate that the contractor required a number of days
to achieve a mix of high quality using the performance-based approach, whereas the percent
defective approach suggested a uniform mix during the entire period of production.

UCPRC-RR-2006-16 viii
In general, the performance-based approach emphasizes the importance of uniformity in
both materials production and placement with reasonable controls placed on inherent variability.
Moreover, it emphasizes the importance of adhering to design target values and, very
importantly, reflects only the materials and construction variance by eliminating the influence of
test variance.
To change from the experience-based percent defective approach to the use of
performance-based equations like those used herein (based on mechanistic-empirical analyses
and Monte Carlo simulations) is now feasible with the introduction of mechanistic-empirical (M-
E) design, e.g., CAL-ME This design methodology includes performance equations for asphalt
concrete pavement (e.g., fatigue and rutting). These equations include HMA variables such as
those included herein.
Field performance data are required to make this change; linking of a database containing
the initial design, materials, and construction data to the pavement management system
containing the field performance data will be required. An excellent example of this tie between
materials and construction and field performance data has been demonstrated by the Maryland
DOT in a Federal Highway Administration-supported study completed in 2003. Also, there are
studies underway that are sponsored by the National Cooperative Highway Research Program
(e.g., NCHRP Project 1-40B) to specifically accomplish this objective associated with the
implementation of the New Design Guide.
Based on the results presented herein, it is recommended that Caltrans take the necessary
steps to implement the performance-based approach to the pay factor methodology described in
this report. A “Pay Factor Calculator” using some of the spreadsheet features of Microsoft®
Excel is available and is included in Appendix C, which makes use of the six pay factor tables
included in Appendix A. One approach that might be followed is to select a series of quality
control/quality assurance (QC/QA) construction projects and determine pay factors by both the
current procedure and the proposed performance-based approach. The results from both
procedures could then be evaluated by the Joint Caltrans/Industry Task Group at an appropriate
time following construction to determine the efficacy of implementing the performance-based
approach.

UCPRC-RR-2006-16
ix
TABLE OF CONTENTS
Executive Summary ...................................................................................................................................... v List of Figures ............................................................................................................................................... x List of Tables ................................................................................................................................................ x 1.0 Introduction...................................................................................................................................... 1 2.0 Approach.......................................................................................................................................... 3 3.0 Selection of Mix Variables .............................................................................................................. 5
3.1 Variability Considerations........................................................................................................... 5 4.0 Permanent Deformation ................................................................................................................... 8 5.0 Fatigue Cracking.............................................................................................................................. 9 6.0 Effects of Construction Quality on Simulated In-Situ Performance.............................................. 10 7.0 Cost Model..................................................................................................................................... 13 8.0 Pay Factors..................................................................................................................................... 14 9.0 Comparison of Pay Factors Using the Performance-Based Approach and the Experience-Based
Procedure ....................................................................................................................................... 18 10.0 Pay Factor Determinations Based on Daily Versus Total Project Production............................... 24 11.0 Discussion of Weighting Factors to Determine Combined Pay Factors........................................ 26 12.0 Summary........................................................................................................................................ 27 Appendices.................................................................................................................................................. 30
Appendix A: Relative Performance Tables for Rutting and Fatigue..................................................... 30 Appendix B: Caltrans Project Data ........................................................................................................ 33 Appendix C: Computer Application—Pay Factor Determinations ........................................................ 35
References................................................................................................................................................... 37

UCPRC-RR-2006-16 x
LIST OF FIGURES
Figure 1: Effect of mix variables on simulated ESALs to 15-mm (0.6 in.) rut depth for a range in asphalt
contents; P200 = 6%, fine aggregate = 28%........................................................................................... 8 Figure 2: Influence of as-constructed asphalt content on rutting performance........................................... 11 Figure 3: Influence of as-constructed air-void content on rutting performance ......................................... 11 Figure 4: Effects of as-constructed air-void content on pavement fatigue performance. ........................... 12 Figure 5: Effects of as-constructed asphalt concrete thickness on pavement fatigue performance. ........... 12 Figure 6: Effects of as-constructed asphalt content on pavement fatigue performance.............................. 12 Figure 7: Comparison of the Combined Relative Performance for Rutting using the Multiplicative
Procedure versus Combined Relative Performance from Monte Carlo simulations. ......................... 15 Figure 8: Pay Factors for Rutting and Fatigue as a function of Combined Relative Performance. ............ 17 Figure 9. Comparison of performance-based and experience-based pay factors for a set of QC/QA
projects. .............................................................................................................................................. 19 Figure 10. Variation of pay factor values when rutting is the predicted distress. ...................................... 20 Figure 11. Variation of pay factor values when fatigue is the predicted distress. ..................................... 20
LIST OF TABLES
Table 1: Construction Variation of Mix and Structural Characteristics........................................................ 6 Table 2: Material/Construction Component of Total Construction Variance............................................... 6 Table 3: Variation of Mix and Structural Characteristics for Monte Carlo Simulations .............................. 7 Table 4: Construction Targets..................................................................................................................... 10 Table 5: Levels and Ranges for Variable Evaluated................................................................................... 10 Table 6: Relative Performance for Rutting as a Function of Asphalt Content. .......................................... 16 Table 7: Relative Performance for Fatigue as a Function of Air-Void Content ......................................... 16 Table 8: Contractor Data............................................................................................................................. 21 Table 9. Shadowing Study Data.................................................................................................................. 23 Table 10: Pay Factor Values Calculated both on Tonnage for Each Day's Production and on the Total
Project................................................................................................................................................. 24 Table 11: Project A—Daily Production Data and Pay Factors** ................................................................ 25 Table 12: Project B—Daily Production Data and Pay Factors**................................................................. 25 Table 13. The Effect of Mix Parameters on Relative Performance (RP).................................................... 26

UCPRC-RR-2006-16
1
1.0 INTRODUCTION
The quality of a pavement upon completion of construction is a major factor in determining how
well it will perform under traffic loading and environmental influences. To improve the
construction process, quality control/quality assurance (QC/QA) procedures and pay
incentives/disincentives (pay factors) have been instituted in the U.S. in recent years. This
document briefly describes a rational and feasible method for quantitatively establishing such
pay factors for asphalt concrete construction with the initial emphasis placed on new hot-mix
asphalt (HMA) pavements.
The approach to pay factor determination makes use of performance models for asphalt
concrete* developed from results of the CAL/APT program [California Accelerated Pavement
Testing Program, a pavement research program supported by the California Department of
Transportation (Caltrans) at the University of California Berkeley] (1) and from WesTrack [a
Federal Highway Administration (FHWA) and National Cooperative Highway Research
Program (NCHRP) project entitled “Accelerated Field Test of Performance-Related
Specifications for Hot-Mix Asphalt Construction,” which incorporated an experimental road test
facility near Carson City, Nevada] (2). The performance model for fatigue resulted from the
CAL/APT program; the model for rutting was developed from results of mix performance in the
WesTrack experiment. For the fatigue mode of distress, the system considers the means and
variances of asphalt content, air-void content, and asphalt thickness. For the rutting distress, the
means and variances of asphalt content, air-void content, and aggregate gradation are included.
In estimating fatigue damage under traffic loading, the pavement is treated as a multilayer elastic
system. The performance models permit computation of pavement life, expressed in Equivalent
Standard Axle Loads (ESALs), using Monte Carlo simulation techniques.
Costs are established using a cost model, which considers only agency cost consequences
of delaying or accelerating the time to the next surfacing or rehabilitation activity. This model
understates agency costs by ignoring the possible effects of construction quality on future
rehabilitation costs. It ignores future rehabilitation activity beyond the first cycle and requires an
* In September 2007, the term “asphalt concrete” was changed to “hot-mix asphalt” (HMA). Asphalt concrete will be retained in this report since the draft was completed prior to the 2007 date.
UCPRC-RR-2006-16 2
exogenous estimate of future rehabilitation costs, traffic growth, expected years of new pavement
life, and a discount rate representing the time value of money.
Determination of an appropriate pay factor is based on determining the relative
performance (RP). For the as-constructed mix this is defined as the ratio of off-target ESALs
resulting from the mix and pavement characteristics considered in the performance models to the
target ESALs. The RP governing the Contractor’s pay factor is that associated with the shortest
life determined for the two distress modes. With the shortest RP, the pay factor, reflecting the
combined effects of the as-constructed mix and structural parameters, is then determined from
the cost model.
Pay factors determined by this approach are compared with those determined from an
experience-based approach used by the California Department of Transportation (Caltrans) since
1997 for Quality Control/Quality Assurance (QC/QA) projects constructed in the period January
1997 to June 2000. Comparisons are included for approximately 80 QC/QA projects.
At this time, the Caltrans Pavement Condition Survey includes both rutting and fatigue
cracking data for a limited number of the approximately 80 projects noted above. Comparisons
of the actual and computed pay factors are included for these projects as well as the actual
performance data.
Two paving contractors supplied their information for some of the projects included
among the 80 QC/QA projects noted above. Comparisons of the Caltrans and the performance-
based pay factors are also presented.
Some agencies base pay factors on daily tonnage while others reimburse the Contractor at
the end of the project based on the overall average of parameters used to determine these factors.
A comparison of the results using both approaches is included.

UCPRC-RR-2006-16
3
2.0 APPROACH
The approach adopted for the development of pay factors focuses primarily on the economic
impacts to the highway agency. The assumption is made that an appropriate disincentive
(penalty) for inferior construction should be the added cost to the agency and that the incentive
(bonus) for superior construction should be no greater than the added savings to the agency.† The
bonuses coupled with the penalties may provide sufficient incentive to the contractor to improve
construction quality.
For new construction, for example, these agency costs/savings are associated primarily
with subsequent pavement rehabilitation. Inferior construction hastens the need for future
rehabilitation and may increase the cost of rehabilitation as well. As a result, inferior
construction increases the present worth of future rehabilitation costs. Superior construction, on
the other hand, reduces the present worth of these costs, largely by deferring the future
rehabilitation. The difference in present worth of rehabilitation costs, as-constructed versus as-
specified and as-expected, provides a rational basis for setting the level of penalty/bonus for
inferior/superior construction quality.
To compute the differential present worth of future rehabilitation requires two different
types of models: (1) a performance-based model or models for determining the effect of
construction quality on expected pavement performance, and (2) a cost model for translating
these effects into rehabilitation dollars.
Two performance models are utilized: one for rutting and one for fatigue cracking. For
most construction situations, both performance models will be utilized to develop appropriate
pay factors. For these circumstances, the pay factors resulting from the use of the performance
models are based on the distress mode yielding the most beneficial consequence to the agency.
The performance model used for rutting is based on mix performance data developed at
WesTrack (2). It is based on regression analysis, although multilayer elastic analysis of
representative pavement structures was used in its development.
The model used for fatigue is based on the mix analysis and design system originally
developed as a part of the Strategic Highway Research Program (SHRP) (3), extended to
† Subsequently the terms bonus and penalty are used for incentive and disincentive, respectively.
UCPRC-RR-2006-16 4
efficiently treat in-situ temperatures (4), calibrated to the current Caltrans flexible pavement
design system (5), extended to incorporate construction variability, and used in interpreting the
results of HVS tests on flexible pavements, both new and overlaid, constructed at the Richmond
Field Station according to Caltrans Standards (1). In estimating damaging strains under traffic for
fatigue cracking, the pavement is treated as a multilayer elastic system.
Using a preselected target (design) value and a reasonable standard deviation (excluding
test variance) for a specific mix property or pavement parameter, the relative performance (RP)
of the as-constructed mix can be determined based on its measured mean and standard deviation.
Monte Carlo simulations were used to quantify the effects of construction quality on
simulated in-situ performance.
The cost model considers only the time to the next rehabilitation activity, i.e., it ignores
future rehabilitation measures beyond the first cycle. It requires an estimate of future
rehabilitation cost; it considers annual inflation of rehabilitation costs, traffic growth, expected
years of the constructed life of the asphalt concrete, and a discount rate representing the time
value of money.
The approach emphasizes the importance of adhering to the target value for a specific
pavement characteristic (mix property and layer thickness) and maintaining uniformity (low
standard deviation) to achieve or exceed the desired performance level. In addition, pay factors
are combined for a specific distress mode, making use of a multiplicative procedure, which
Monte Carlo simulations have demonstrated is a simple yet reasonable method. The results from
the process used by Caltrans for obtaining a combined pay factor, using weighting factors for
selected mix parameters, are compared with the results from the multiplicative procedure. As
will be shown, the weighting factors for specific mix parameters are dependent on the mode of
distress.
UCPRC-RR-2006-16
5
3.0 SELECTION OF MIX VARIABLES
For rutting, the variables considered are air-void content (Vair), asphalt content (PWasp), and
aggregate gradation expressed in terms of the percent passing the No. 200 (0.075 mm) sieve
(P200), and the fraction passing the No. 8 (2.38 mm) sieve and retained on the No. 200 (0.075
mm) sieve (fa). As will be seen subsequently, the factor fa is not included in the pay factor
determinations since its influence for the range in parameters investigated was relatively small.
The parameters selected for aggregate gradation were, in part, based on current control
parameters (P200) and in part on controlling sieves in the Superpave mix design method (the
No. 8 × No. 200 fraction). Thickness of the asphalt concrete was not included since the mix
components and degree of compaction are the controlling factors for asphalt mix rutting
(stability).
For fatigue, the variables include air-void content, Vair, asphalt content, PWasp, and
asphalt concrete thickness, tAC. Aggregate grading effects have not been included in the
performance models since the WesTrack experiment as well as the other studies discussed in
Reference (2) suggest that these effects are comparatively small relative to the parameters Vair,
PWasp, and tAC.
3.1 Variability Considerations
The performance models make use of means and variances for asphalt concrete construction
parameters.
Random selection of the variables has assumed normally distributed random variables
with known or assumed means and variances. Of particular significance are the variances that
might be expected under normal construction operations. Estimates of these variances were
obtained from a combination of literature evaluation, backcalculation of moduli from falling
weight deflectometer (FWD) measurements, and data collected as a part of the WesTrack project
(2). A summary of these results is presented in Table 1.
UCPRC-RR-2006-16 6
Table 1: Construction Variation of Mix and Structural Characteristics
Property Measure of Variation Value or Range Source
0.15–0.44% Table 12.46 (8) 0.1–0.4% Individual WesTrack sections (8)
0.31% WesTrack composite (8) Asphalt Content Standard Deviation
0.3% Table 3 (9) 0.9–1.9% Table 12.55 (8) 0.4–1.5% Individual WesTrack sections (8)
1.5% WesTrack composite (8) Air-Void Content Standard Deviation
1.94% Table 3 (9) Coefficient of
Variation 12.5–15% Table 12.58 (8)
0–0.5 cm Individual WesTrack sections (8) 0.58 cm WesTrack composite (8)
Thickness Standard Deviation
0.99 cm Table 3 (9) 11.3–14.7% HVS test sections at UCB (1) 17.3–44.7% Segment of highway in KY* 3.6–17.7% Individual WesTrack sections (8)
Foundation Modulus
Coefficient of Variation
14.2–28.5% WesTrack composite (8) *Unpublished data, Kentucky DOT
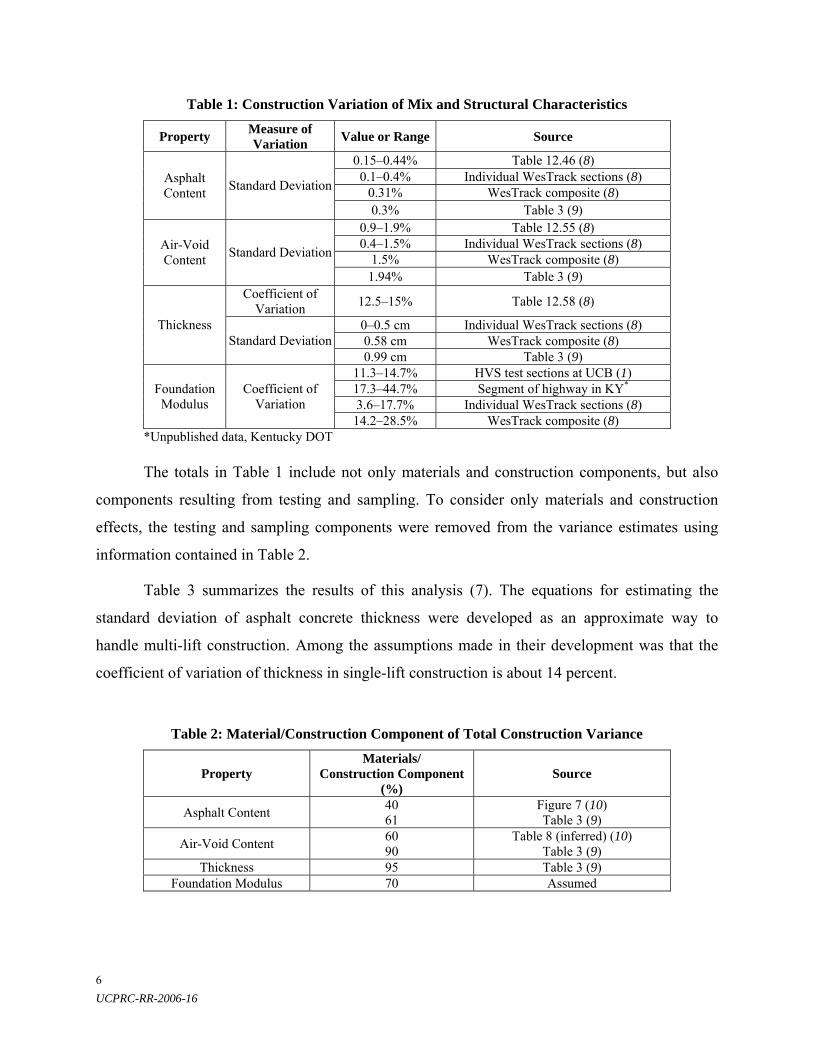
The totals in Table 1 include not only materials and construction components, but also
components resulting from testing and sampling. To consider only materials and construction
effects, the testing and sampling components were removed from the variance estimates using
information contained in Table 2.
Table 3 summarizes the results of this analysis (7). The equations for estimating the
standard deviation of asphalt concrete thickness were developed as an approximate way to
handle multi-lift construction. Among the assumptions made in their development was that the
coefficient of variation of thickness in single-lift construction is about 14 percent.
Table 2: Material/Construction Component of Total Construction Variance
Property Materials/
Construction Component (%)
Source
Asphalt Content 40 61
Figure 7 (10) Table 3 (9)
Air-Void Content 60 90
Table 8 (inferred) (10) Table 3 (9)
Thickness 95 Table 3 (9) Foundation Modulus 70 Assumed

UCPRC-RR-2006-16
7
Table 3: Variation of Mix and Structural Characteristics for Monte Carlo Simulations
Property Total Standard Deviation
Percentage of Variance Due to
Materials/ Construction
Materials/ Construction
Component of Standard Deviation
Asphalt Content 0.30% 40 0.19% Air-Void Content 1.6% 60 1.2%
Asphalt Concrete
Thickness, t ( )cmt 69.0200.0 ⋅ 80 ( )cmt 69.0173.0 ⋅
Foundation Modulus
30% (coefficient of variation) 70 25%

UCPRC-RR-2006-16 8
4.0 PERMANENT DEFORMATION
The performance model used for permanent deformation is a regression equation based on
performance data obtained from the WesTrack experiment (1). This model includes the effects of
air-void content, asphalt content, and aggregate gradation. The equation is based on analysis of
both the field performance of 23 test sections which exhibited rutting (but no observed fatigue
cracking) and the results of simple shear tests on laboratory-prepared mixes containing gradings
representative of the coarse and fine gradations at WesTrack. Three gradations were used for
each of the mixes: the target values and two variations of these gradations.
Reference (1) describes the procedure used to combine the field and laboratory measured
performance data. Briefly stated, this procedure is based on combining mechanistic-empirical
analyses with regressions. Simulations utilized five asphalt contents (4.5–6.5 percent), five air-
void contents (4.5–8.5 percent), five values for P200 (4.5–6.5 percent), and five values for the fa
parameter (20–36 percent). Caveats pertaining to the use of this experiment are also contained in
Reference (1).
Figure 1 illustrates the effects of asphalt content on ESALs to a rut depth of 15 mm
(0.6 in.). While other rut depths could be used for these computations, the 15-mm rut depth was
considered reasonable since it is in the range where remedial action is required. Results shown in
this figure certainly pass the test of engineering reasonableness.
Figure 1: Effect of mix variables on simulated ESALs to 15-mm (0.6 in.) rut depth for a range in
asphalt contents; P200 = 6%, fine aggregate = 28%
.
UCPRC-RR-2006-16
9
5.0 FATIGUE CRACKING
The performance model used for fatigue is based on the procedure described in Reference (4)
utilizing fatigue test data representative of mixes containing dense-graded aggregates meeting
State of California specifications (14).
Multilayer elastic analysis with ELSYM5 was used to simulate the stress and strain states
for a range in structural pavement sections. Loading consisted of a dual-tire assembly of 40 kN
(9,000 lb) with a center-to-center spacing of 300 mm (12 in.) and a tire contact pressure of
690 kPa (100 psi). The critically stressed location for fatigue was assumed to be at the bottom
boundary of the asphalt concrete layer. Mix properties for the analyses were obtained from tests
on a representative State of California mix containing a dense-graded aggregate and
a representative asphalt content. Details of the analyses are described in References (9, 10).
The 10th percentile fatigue life was used as the basic performance estimate. This life
corresponds to about 10 percent fatigue cracking in the wheelpaths. As verified by sensitivity
analysis, incremental agency costs due to off-target construction (of either inferior or superior
quality) are not significantly affected by the chosen performance percentile (at least within a
reasonable range of the 1st to the 20th percentile) (8).

UCPRC-RR-2006-16 10
6.0 EFFECTS OF CONSTRUCTION QUALITY ON SIMULATED IN-SITU PERFORMANCE
For the performance simulations, target values and standard deviations used for the selected mix
parameters are shown in Table 4. This Table also contains an expression for the standard
deviation of thickness used for the sections analyzed herein.
Monte Carlo simulations were used to quantify the effects of construction quality on
simulated in-situ performance. The levels and ranges used for these simulations are shown in
Table 5, Monte Carlo simulations [described in References (8, 9, 10)] were performed to define
relationships between ESALs to 10 percent rutting [15 mm (0.6 in.)] or more and the mix
parameters shown in Table 5.
Figure 2 and Figure 3 illustrate the effects of as-constructed asphalt content and air-void
content on the ESALs to 10 percent rutting [15 mm (0.6 in.) or more] for a range in standard
deviations for each of the parameters.
Table 4: Construction Targets
Variable Mean Total Standard
Deviation (Including Sampling and Testing)
Percent of Variance Attributed to Materials
and Construction Asphalt Content (%) 5.0 0.3 40
Air-Void Content (%)
7.0 1.5 60
Mineral Filler* (%) 5.5 0.9 75 Fine Aggregate (%) 30.0 3.0 85 Asphalt-Concrete
Thickness (in.) 4 pavement structures
0.15 × AC thickness0.69 75
* Mineral filler: percent passing No. 200 sieve.
Table 5: Levels and Ranges for Variable Evaluated
Mean As-Constructed Standard Deviation Variable
Levels Range Levels Range Asphalt Content
21 4.0 to 6.0 9 0.114 to 0.266
Air-Void Content
21 5.0 to 9.75 9 0.648 to 1.596
Mineral Filler* 21 3.0 to 8.0 9 0.467 to 1.09 Fine Aggregate 21 24.0 to 36.0 9 1.660 to 3.872
Thickness 21 for each of 4 pavement sections -1.0 to 1.0 9 4.8% to 11.2%
* Mineral filler: percent passing No. 200 sieve.

UCPRC-RR-2006-16
11
0.00
0.50
1.00
1.50
2.00
2.50
3.00
3.50
4.00
4.4 4.6 4.8 5 5.2 5.4
As-constructed average asphalt content (%)
Sim
ulat
ed E
SALs
to 1
0% ru
tting
(15m
m o
r mor
eru
t dep
th) e
xpre
ssed
as
fract
ion
of ta
rget
ESA
Ls0.114
0.19
0.266
As-constructed
standard deviation of
asphalt content (%)
Figure 2: Influence of as-constructed asphalt content on rutting performance.
As with rutting, Monte Carlo simulations were used to quantify the effects of
construction quality on fatigue. Results for a structure consisting of asphalt concrete [244 mm
(10 in.) thick] resting on a granular base and subbase [366 mm (14 in.) total thickness] and a
subgrade with a modulus of 84 MPa (12,000 psi) are shown in Figure 4 and Figure 5, illustrating
the effects of air-void content and asphalt concrete thickness, respectively. Reference (8)
contains additional results for a range of HMA thicknesses. Not so critical proves to be the effect
of asphalt content on fatigue performance as seen in Figure 6.
0
0.4
0.8
1.2
1.6
5.5 6 6.5 7 7.5As-constructed average air-void content (%)
Sim
ulat
ed E
SALs
to 1
0% ru
tting
(15
mm
or m
ore
rut d
epth
) exp
ress
ed a
s m
ultip
le o
f tar
get E
SALs
0.651.121.60
As-constructedstandard
deviation Of air void
content (%)
Figure 3: Influence of as-constructed air-void content on rutting performance

UCPRC-RR-2006-16 12
0.0
0.5
1.0
1.5
2.0
2.5
3.0
5.0 5.5 6.0 6.5 7.0 7.5 8.0 8.5 9.0
As-constructed average air-void content (%)
Estim
ated
fatig
ue li
fe (m
ultip
le o
f tar
get
ESA
Ls a
t 90%
relia
bilit
y)
0.65%1.20%1.60%
As-constructedstandard
deviation ofair-void
content (%)
Figure 4: Effects of as-constructed air-void content on pavement fatigue performance.
0.0
0.5
1.0
1.5
2.0
2.5
3.0
8.5 9.0 9.5 10.0 10.5
As-constructed average surface thickness (in)
Estim
ated
fatig
ue li
fe (m
ultip
le o
f tar
get
ESA
Ls a
t 90%
relia
bilit
y)
0.31 in0.62 in0.93 in
As-constructedstandard
deviation ofsurface
thickness (in)
Figure 5: Effects of as-constructed asphalt concrete thickness on pavement fatigue performance.
0.0
0.5
1.0
1.5
2.0
2.5
3.0
4.0 4.5 5.0 5.5 6.0
As-constructed average asphalt content (%)
Estim
ated
fatig
ue li
fe (m
ultip
le o
f tar
get
ESA
Ls a
t 90%
relia
bilit
y)
0.114
0.190
0.266
As-constructedstandard
deviation ofasphalt
content (%)
Figure 6: Effects of as-constructed asphalt content on pavement fatigue performance.

UCPRC-RR-2006-16
13
7.0 COST MODEL
The performance models yield the 10th percentile in-situ expected pavement lives for ruts [15
mm (0.6 in.) depth] and fatigue cracking (10 percent in wheelpaths) for both expected or on-
target construction quality as well as off-target construction quality. The relative performance
(RP), the performance input to the cost model, is computed as follows:
ESALs target-onESALs target-offRP = (1)
The cost model requires that a determination of the off-target pavement life in years
(OTY) be obtained from the simulated performance differential. Equation (2) is used to compute
the OTY parameter assuming that the traffic grows geometrically:
( )[ ]( )( )g
gRPOTYTY
+−++
=1ln
111ln (2)
In this expression: 1. g is the annual rate of traffic growth expressed as a decimal; 2. TY is the number of years of pavement life resulting from on-target construction
activity. The cost model assesses the present worth of moving the first rehabilitation cycle from its
target position, TY, to its off-target position, OTY. Development of an expression for the net
present worth, expressed as a percentage of the rehabilitation costs (in current-year dollars) is
described in Reference (10).
The difference between the present worth of the TY and OTY (DPW) is expressed as
follows:
( )( )
( )( )
( )( ) ⎟
⎟⎠
⎞⎜⎜⎝
⎛
+
−+⎟⎟⎠
⎞⎜⎜⎝
⎛
−+
+−
−+
+=Δ OTY
OTY
TY
TY
OTY
OTY
dd
dr
drCPW
111
111
111
(3)
In this expression:
1. C is the resurfacing /rehabilitation cost in current-year dollars; 2. TY is the target pavement life; 3. r is the annual rate of growth in resurfacing/rehabilitation cost, that is, the
construction cost index; 4. d is the annual discount rate.
When OTY exceeds the target life, the service life for comparison purposes may be set at
either the target life or the longer OTY. It should be noted that if the longer period is chosen, it is
beneficial to the contractor’s interests.

UCPRC-RR-2006-16 14
8.0 PAY FACTORS
With the above information, it is then possible to determine as constructed pay factors for asphalt
concrete. The following assumptions are reflected in the approach discussed herein: (1) the
contractor should generally be charged a penalty for inferior construction that is out of
specification and the magnitude of this penalty should equal the full added cost to the agency for
failure to meet the construction target; (2) the contractor should generally be rewarded for
superior construction that is within specification; (3) schedules should incorporate average and
standard-deviation categories consistent with the accuracy within which estimates are determined
from field measurements; and (4) the standard deviations shown in the schedules must reflect
expected testing and sampling errors as well as materials/construction variables.
For the pay factors developed in this section, bonuses for superior construction and
penalties for inferior construction reflect full agency cost increments. In addition, the examples
reflect the following:
1. The sole construction quality effect is the date of first resurfacing/rehabilitation.
2. Relative performance (RP) is determined independently for the rutting and fatigue
modes of distress.
3. Relative performance for rutting reflects the effects of: (1) asphalt content, PWasp;
(2) air-void content, Vair; and (3) Percent Passing No. 200 sieve, P200. The fine
aggregate, fa, factor has not been included since it has, for the range of the
parameters evaluated, a minor influence on relative performance and therefore on
the pay factor.
4. Relative performance for fatigue is based on: (1) asphalt content, PWasp; (2) air-
void content, Vair; and (3) the thickness of the asphalt concrete layer, tAC.
The combined RP for rutting is determined from the following expression:
200rutRP combined PVPW RPRPRPairasp⋅⋅= (4)
Similarly for fatigue, the combined RP is:
ACairasp tVPW RPRPRP ⋅⋅=fatRP combined (5) Figure 7 illustrates, for rutting, that this multiplicative approach provides the same results
as Monte Carlo simulations considering random combinations of the RP for the rutting variables.

UCPRC-RR-2006-16
15
Reference (8) illustrates that such an approach is also applicable for fatigue. Thus this
methodology provides a sound, yet simpler procedure for combining pay factors for each distress
mode.
y = 0.9981x - 0.036R2 = 0.9982
0
0.5
1
1.5
2
2.5
3
0.000 0.500 1.000 1.500 2.000 2.500 3.000Combined relative performance from computations- multiplicative method
Com
bine
d re
lativ
e pe
rfor
man
ce fr
om s
imul
atio
x=y
Figure 7: Comparison of the Combined Relative Performance for Rutting using the Multiplicative Procedure versus Combined Relative Performance from Monte Carlo simulations.
1. The relative performance which governs the contractor’s pay factor is that
associated with the shortest life determined from the two distress modes.
2. As stated earlier: (1) rutting life corresponds to ESALs to 10-percent of rutting
with downward depths of 15 mm (0.6 in.) or more based on WesTrack
performance; and (2) fatigue to ESALs to 10-percent cracking based on Caltrans
experience as described earlier.
Reference (10) includes tables for the relative performance factors for rutting based on
PWasp, Vair, and P200 and for those for fatigue based on PWasp, Vair, tAC. Table 6 and Table 7 are
examples for both rutting and fatigue.

UCPRC-RR-2006-16 16
Table 6: Relative Performance for Rutting as a Function of Asphalt Content.
As-Measured Standard Deviation of Asphalt Content (%)
Difference Between As-Measured Average
Asphalt Content and Design Asphalt Content
(%)
Low Variability
(Below 0.255)
Average Variability
(0.255 to 0.345)
High Variability (Above 0.345)
-1.1 to –0.91 5.816 5.552 5.233 -0.90 to –0.71 4.528 4.265 3.957 -0.70 to –0.51 3.381 3.151 2.870 -0.50 to –0.31 2.439 2.236 2.011 -0.30 to –0.11 1.688 1.526 1.349
-0.1 to 0.09 1.127 0.997 0.868 0.10 to 0.29 0.720 0.629 0.534 0.30 to 0.49 0.439 0.375 0.314 0.50 to 0.69 0.255 0.212 0.173 0.70 to 0.89 0.138 0.112 0.087 0.90 to 1.09 0.067 0.051 0.039
Table 7: Relative Performance for Fatigue as a Function of Air-Void Content
As-Measured Standard Deviation of Air-Void Content (%)
Difference Between As-Measured Average Air-
Void Content and Design Air-Void Content (%)
Low variability (Below 1.32)
Average Variability(1.32 to 1.78)
High Variability (Above 1.78)
-2.24 to –1.76 2.275 2.093 1.899 -1.75 to –1.30 1.981 1.763 1.595 -1.29 to –0.82 1.624 1.482 1.339 -0.81 to –0.35 1.367 1.284 1.125 -0.34 to 0.13 1.151 1.048 0.945 0.14 to 0.60 0.968 0.882 0.796 0.61 to 1.08 0.816 0.743 0.671 1.09 to 1.55 0.732 0.628 0.568 1.56 to 2.03 0.581 0.532 0.483 2.04 to 2.5 0.493 0.454 0.415 2.51 to 2.99 0.422 0.391 0.361
With this information, pay factors can then be established for combined relative
performance for rutting and fatigue. For the computations shown herein, expected pavement
lives (target years, TY), in Equation (3) of 10 and 20 years have been assumed and the following
cost parameters have been utilized:
1. A 2 percent annual rate of inflation in resurfacing/rehabilitation cost (r);
2. A 2.5 percent annual rate of traffic growth (g);

UCPRC-RR-2006-16
17
3. A 5 percent discount rate (d); rutting failure results in resurfacing which costs
20 percent or 50 percent of the cost of new pavement construction in current-year
dollars;
4. Fatigue failure results in rehabilitation which costs 50 percent of the cost of new
pavement construction in current-year dollars. Figure 8 shows the pay factors for
both rutting and fatigue for rehabilitation cost equal to 50 percent of the initial
construction cost.
While the RP for asphalt content for rutting is high for asphalt contents below the target
value, for fatigue, durability, and compaction considerations would preclude this from occurring.
A “Pay Factor Calculator” using some of the spreadsheet features of Microsoft® Excel is
available in Appendix C Reference (13). This program makes use of the six pay factor tables
included in Appendix A.
-50
-40
-30
-20
-10
0
10
20
30
0 0.2 0.4 0.6 0.8 1 1.2 1.4 1.6 1.8 2
Combined Relative Performance for Rutting and Fatigue
Pay
Fact
or --
Rut
ting
and
Fatig
ue(%
)
TY=20 Years
TY=10 Years
Figure 8: Pay Factors for Rutting and Fatigue as a function of Combined Relative Performance.

UCPRC-RR-2006-16 18
9.0 COMPARISON OF PAY FACTORS USING THE PERFORMANCE-BASED APPROACH AND THE EXPERIENCE-BASED PROCEDURE
The State of California Department of Transportation (Caltrans) introduced the use of pay factors
in 1997 with the inception of a Quality Control/Quality Assurance Program for projects requiring
10,000 or more tons of asphalt concrete (11). Determination of the pay factors is based on
asphalt content, degree of compaction, and aggregate gradation. Weighting factors are assigned
to these parameters as follows:
1. 0.3 of the PWasp for asphalt content;
2. 0.4 of the percent of the theoretical maximum density, γtm, for degree of
compaction;
3. 0.30 for aggregate gradation, of which approximately 23 percent (a value of 0.07)
is assigned to the P200.
Data were supplied by Caltrans for approximately eighty QC/QA projects constructed
during the period 1997–2000. The data from the projects, asphalt content and degree of
compaction, are included in Appendix B. Pay factors have been determined for these projects
according to the Caltrans method and are shown in Figure 9. The data shown in this figure are
summarized in Table B1; also shown in this table are pay factors for the same two parameters
according to the performance-based approach described in the preceding section (for these
computations, RP for thickness and aggregate gradation have been assumed to be 1.0). Pay
factors for the performance-based approach are based on the parameters used to compute Tables
A1 through A6; i.e., d = 5 percent, r = 2 percent, g = 2.5 percent.
From data presented in Table B1 it can be seen that the pay factors for fatigue are
generally larger. Relative to this point, it must be emphasized that Caltrans has set an upper limit
for the pay factor at 5 percent. Performance-based pay factors illustrated herein have not
included this limit, primarily to emphasize the potential future savings which could be achieved.
Data in Table B1 were further grouped in two sets. One set included all pay factors for
which rutting was the predicted mode of failure (Figure 10) and the second set included pay
factors for which the predicted mode of failure was fatigue (Figure 11). Comparison between
performance-based pay factors for which rutting was the predicted mode of failure and the

UCPRC-RR-2006-16
19
experience-based pay factors with few exceptions, were in the range +/-5%. Data in Figure 11
emphasize what was stated earlier, namely the fact that the performance-based pay factors are in
general higher than the experience-based ones. This emphasizes the potential savings to the
Agency resulting from good compaction and being on target in terms of thickness since repairing
fatigue damage is a more expensive activity than rut-depth correction.
-20
-15
-10
-5
0
5
10
15
20
25
01-34
4804
01-35
0204
02-26
1604
02-28
8524
02-32
6504
03-2A
5804
03-38
4504
03-39
4504
03-44
16U4*
03-44
5104
*
04-10
37U4
04-16
3014
04-23
3104
04-23
3334
05-39
9504
05-44
2504
06-33
8404
06-35
7604
06-38
31U4
06-38
7604
06-39
1214
06-42
1404
06-42
1604
08-35
0704
08-36
2804
08-39
79U4
08-39
8804
08-42
6704
09-24
9704
09-25
0004
09-25
0304
09-26
4304
09-27
1604
10-39
1704
11-19
4834
11-21
7704
Project
Pay
Fact
or (%
)
Performance based pay factor
Experience based pay factor
Figure 9. Comparison of performance-based and experience-based pay factors for a set of QC/QA
projects.
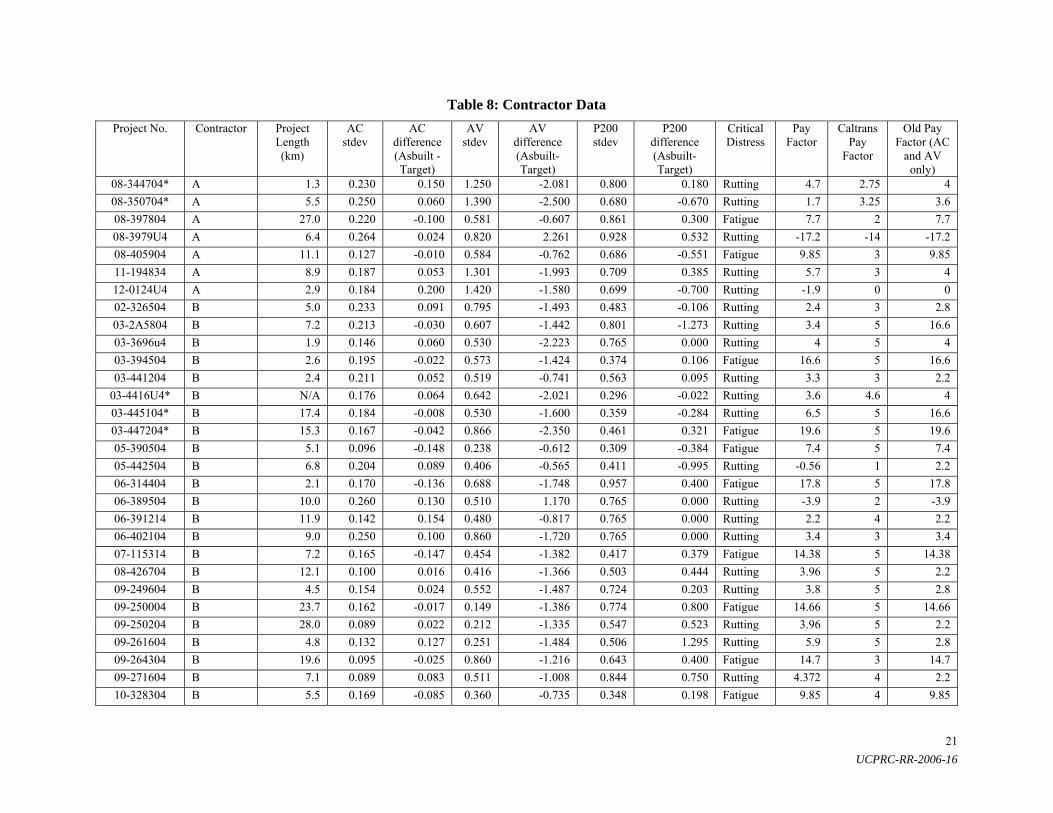
Two contractors supplied information for projects listed in Table 8. The pay factors
calculated in Table B1, only considered variations from the target for asphalt content and air-
void content. The P200 and thickness were assumed to be on target (relative performances of 1 for
both parameters). However, the performance-based pay factors in Table 8 reflect the effect of the
P200; as for Table B1 thicknesses were assumed to be on target. For comparison, both
performance-based pay factors (with and without the P200 effect) were included in Table 8.
Caltrans pay factors still reflect only the effect of air-void content and asphalt content except for
a few projects marked with an asterisk (*) for which detailed QC/QA data—including individual
pay factor values for P200, asphalt content and air-void content—were available. This information
allowed the recalculation of the pay factor that the contractor might had been given based only

UCPRC-RR-2006-16 20
on the three parameters mentioned above. The majority of projects in Table 8, although QC/QA
test data were made available by Caltrans, did not include the values of the individual pay
factors, hence it was not possible to calculate pay factors that represent the experience-based
approach.
-6
-4
-2
0
2
4
6
8
01-34
4804
01-34
6004
01-35
0204
02-32
6504
02-32
6604
*
03-36
96u4
03-38
4504
03-44
1204
03-44
16U4*
04-13
2454
04-23
2904
04-23
3164
04-23
3334
05-44
0804
05-44
2504
06-33
8404
06-36
4404
06-38
31U4
06-38
7404
06-38
7604
06-38
9504
06-39
1214
06-40
2104
06-42
1404
06-42
1504
06-42
1604
08-35
0704
08-35
8204
08-36
2804
08-39
8804
08-42
6704
09-24
9604
09-24
98U4
09-25
0204
09-26
1604
09-27
1604
10-39
1704
11-19
4834
11-21
7604
11-21
7704
12-01
24U4
Project
Pay
Fact
or (%
)
Performance based pay factor
Experience based pay factor
Figure 10. Variation of pay factor values when rutting is the predicted distress.
-20
-15
-10
-5
0
5
10
15
20
25
02-25
9104
02-26
1604
02-28
8524
02-32
1304
03-2A
5804
03-38
4604
03-39
4504
03-44
4904
03-44
5104
03-44
7204
04-10
37U4
04-16
3014
04-23
3104
05-39
0504
05-39
9504
06-31
4404
06-33
8614
06-35
7604
07-11
5314
08-36
4804
08-39
79U4
08-39
8704
08-40
5904
09-24
9704
09-25
0004
09-25
0304
09-26
4304
09-26
5904
10-38
2304
11-09
3504
Project
Pay
Fact
or (%
)
Performance based pay factor
Experience based pay factor
Figure 11. Variation of pay factor values when fatigue is the predicted distress.
UCPRC-RR-2006-16
21
Table 8: Contractor Data Project No. Contractor Project
Length (km)
AC stdev
AC difference (Asbuilt -Target)
AV stdev
AV difference (Asbuilt-Target)
P200 stdev
P200 difference (Asbuilt-Target)
Critical Distress
Pay Factor
Caltrans Pay
Factor
Old Pay Factor (AC
and AV only)
08-344704* A 1.3 0.230 0.150 1.250 -2.081 0.800 0.180 Rutting 4.7 2.75 4 08-350704* A 5.5 0.250 0.060 1.390 -2.500 0.680 -0.670 Rutting 1.7 3.25 3.6 08-397804 A 27.0 0.220 -0.100 0.581 -0.607 0.861 0.300 Fatigue 7.7 2 7.7 08-3979U4 A 6.4 0.264 0.024 0.820 2.261 0.928 0.532 Rutting -17.2 -14 -17.2 08-405904 A 11.1 0.127 -0.010 0.584 -0.762 0.686 -0.551 Fatigue 9.85 3 9.85 11-194834 A 8.9 0.187 0.053 1.301 -1.993 0.709 0.385 Rutting 5.7 3 4 12-0124U4 A 2.9 0.184 0.200 1.420 -1.580 0.699 -0.700 Rutting -1.9 0 0 02-326504 B 5.0 0.233 0.091 0.795 -1.493 0.483 -0.106 Rutting 2.4 3 2.8 03-2A5804 B 7.2 0.213 -0.030 0.607 -1.442 0.801 -1.273 Rutting 3.4 5 16.6 03-3696u4 B 1.9 0.146 0.060 0.530 -2.223 0.765 0.000 Rutting 4 5 4 03-394504 B 2.6 0.195 -0.022 0.573 -1.424 0.374 0.106 Fatigue 16.6 5 16.6 03-441204 B 2.4 0.211 0.052 0.519 -0.741 0.563 0.095 Rutting 3.3 3 2.2
03-4416U4* B N/A 0.176 0.064 0.642 -2.021 0.296 -0.022 Rutting 3.6 4.6 4 03-445104* B 17.4 0.184 -0.008 0.530 -1.600 0.359 -0.284 Rutting 6.5 5 16.6 03-447204* B 15.3 0.167 -0.042 0.866 -2.350 0.461 0.321 Fatigue 19.6 5 19.6 05-390504 B 5.1 0.096 -0.148 0.238 -0.612 0.309 -0.384 Fatigue 7.4 5 7.4 05-442504 B 6.8 0.204 0.089 0.406 -0.565 0.411 -0.995 Rutting -0.56 1 2.2 06-314404 B 2.1 0.170 -0.136 0.688 -1.748 0.957 0.400 Fatigue 17.8 5 17.8 06-389504 B 10.0 0.260 0.130 0.510 1.170 0.765 0.000 Rutting -3.9 2 -3.9 06-391214 B 11.9 0.142 0.154 0.480 -0.817 0.765 0.000 Rutting 2.2 4 2.2 06-402104 B 9.0 0.250 0.100 0.860 -1.720 0.765 0.000 Rutting 3.4 3 3.4 07-115314 B 7.2 0.165 -0.147 0.454 -1.382 0.417 0.379 Fatigue 14.38 5 14.38 08-426704 B 12.1 0.100 0.016 0.416 -1.366 0.503 0.444 Rutting 3.96 5 2.2 09-249604 B 4.5 0.154 0.024 0.552 -1.487 0.724 0.203 Rutting 3.8 5 2.8 09-250004 B 23.7 0.162 -0.017 0.149 -1.386 0.774 0.800 Fatigue 14.66 5 14.66 09-250204 B 28.0 0.089 0.022 0.212 -1.335 0.547 0.523 Rutting 3.96 5 2.2 09-261604 B 4.8 0.132 0.127 0.251 -1.484 0.506 1.295 Rutting 5.9 5 2.8 09-264304 B 19.6 0.095 -0.025 0.860 -1.216 0.643 0.400 Fatigue 14.7 3 14.7 09-271604 B 7.1 0.089 0.083 0.511 -1.008 0.844 0.750 Rutting 4.372 4 2.2 10-328304 B 5.5 0.169 -0.085 0.360 -0.735 0.348 0.198 Fatigue 9.85 4 9.85
UCPRC-RR-2006-16 22
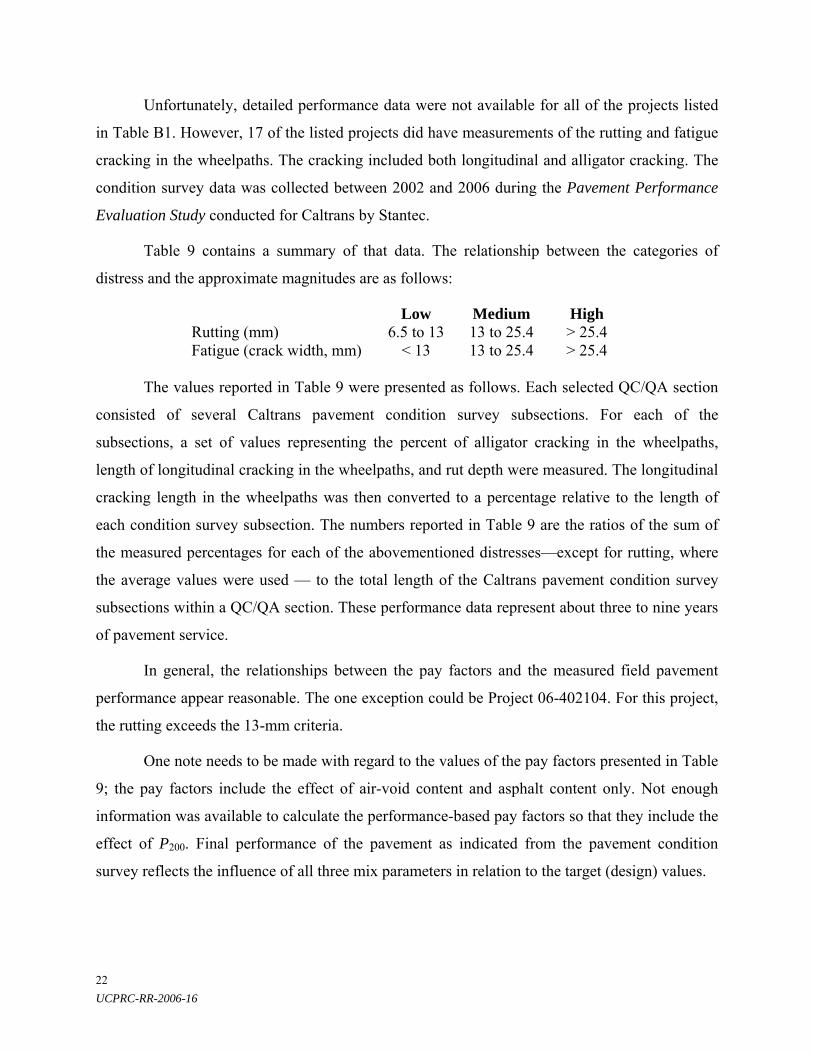
Unfortunately, detailed performance data were not available for all of the projects listed
in Table B1. However, 17 of the listed projects did have measurements of the rutting and fatigue
cracking in the wheelpaths. The cracking included both longitudinal and alligator cracking. The
condition survey data was collected between 2002 and 2006 during the Pavement Performance
Evaluation Study conducted for Caltrans by Stantec.
Table 9 contains a summary of that data. The relationship between the categories of
distress and the approximate magnitudes are as follows:
Low Medium High Rutting (mm) 6.5 to 13 13 to 25.4 > 25.4 Fatigue (crack width, mm) < 13 13 to 25.4 > 25.4
The values reported in Table 9 were presented as follows. Each selected QC/QA section
consisted of several Caltrans pavement condition survey subsections. For each of the
subsections, a set of values representing the percent of alligator cracking in the wheelpaths,
length of longitudinal cracking in the wheelpaths, and rut depth were measured. The longitudinal
cracking length in the wheelpaths was then converted to a percentage relative to the length of
each condition survey subsection. The numbers reported in Table 9 are the ratios of the sum of
the measured percentages for each of the abovementioned distresses—except for rutting, where
the average values were used — to the total length of the Caltrans pavement condition survey
subsections within a QC/QA section. These performance data represent about three to nine years
of pavement service.
In general, the relationships between the pay factors and the measured field pavement
performance appear reasonable. The one exception could be Project 06-402104. For this project,
the rutting exceeds the 13-mm criteria.
One note needs to be made with regard to the values of the pay factors presented in Table
9; the pay factors include the effect of air-void content and asphalt content only. Not enough
information was available to calculate the performance-based pay factors so that they include the
effect of P200. Final performance of the pavement as indicated from the pavement condition
survey reflects the influence of all three mix parameters in relation to the target (design) values.

UCPRC-RR-2006-16
23
Table 9. Shadowing Study Data
Wheelpath Long. Cracking (%)/ Total Length of
Condition Survey Subsections
Alligator Cracking (% area)/
Total Length of Condition Survey
Subsections
Rutting (%)/ Total Length of
Condition Survey Subsections
EA Direction Low Med High Low Med High Low Med High
Predicted Critical Distress
Pay Factor Caltrans (Based on
AC and AV)
Performance-Based Pay
Factor (Based on AC
and AV)
03-411204 L2 and R2 0.0 0.0 0.0 0.0 0.0 0.0 100.0 0.0 0.0 Rutting 3 2.2 03-3696U4 L2 and R2 0.0 0.0 0.0 0.0 0.0 0.0 100.0 0.0 0.0 Rutting 5 4 05-390504 L1 1.7 0.4 0.0 0.0 3.5 0.1 100.0 0.0 0.0 Fatigue 5 7.4 05-390504 R1 5.4 4.2 0.0 0.3 4.0 0.0 100.0 0.0 0.0 Fatigue 5 7.4 06-402104 L2 0.5 0.0 0.0 0.0 0.0 0.0 29.0 71.0 0.0 Rutting 3 3.4 06-402104 R2 20.4 0.0 0.0 0.1 0.2 0.0 3.0 97.0 0.0 Rutting 3 3.4 08-398804 L2 and R4 0.0 0.0 0.0 0.0 0.0 0.0 100.0 0.0 0.0 Rutting 4 5 09-265904 L 5.5 0.0 0.0 0.4 0.0 0.0 96.0 0.0 0.0 Fatigue 5 19.6 09-265904 R 2.3 0.0 0.0 0.1 0.0 0.0 100.0 0.0 0.0 Fatigue 5 19.6 01-344704 R 0.0 0.0 0.0 0.0 0.0 0.0 62.0 0.0 0.0 Rutting 4.1 01-344804 L 0.0 0.0 0.0 0.0 0.0 0.0 98.0 0.0 0.0 Rutting 3 2.2 01-350204 R 3.6 0.0 0.0 0.4 0.0 0.0 67.4 0.0 0.0 Rutting 2 2.21 01-350204 L 3.0 0.2 0.0 0.0 0.0 0.0 99.5 0.5 0.0 Rutting 2 2.21 01-346004 R 1.4 0.0 0.0 0.0 0.0 0.0 100.0 0.0 0.0 Rutting 3 2.8 05-399504 R 0.0 0.0 0.0 0.0 0.0 0.0 95 0.0 0.0 Fatigue 4.0 16.6 05-440804 R 0.0 0.0 0.0 0.0 0.0 0.0 100 0.0 0.0 Rutting 4.0 4.0 09-250004 R 0.0 0.0 0.0 0.0 0.0 0.0 100 0.0 0.0 Fatigue 5.0 14.7 11-093504 R 0.0 0.0 0.0 0.0 0.0 0.0 100 0.0 0.0 Fatigue 4.0 11.9 11-194834 L 1.4 0.0 0.0 0.0 0.0 0.0 100.0 0.0 0.0 Rutting 3 4.0 11-217604 R 17.0 2.0 0.0 0.0 0.0 0.0 100.0 0.0 0.0 Rutting 4 2.2 11-217704 R 38.0 0.0 0.0 3.4 0.0 0.0 92.0 6.0 0.0 Rutting 5 2.2

UCPRC-RR-2006-16 24
10.0 PAY FACTOR DETERMINATIONS BASED ON DAILY VERSUS TOTAL PROJECT PRODUCTION
Pay factors used to make payment adjustments to contractors for asphalt concrete can be based
on either of the following:
1. Results of tests on the tonnage per each day’s production.
2. Results of tests on the total project tonnage.
Data contained in Appendices A, B, and C of Reference (17) provide information for
these two analyses.
Calculations using these two procedures for six projects are summarized in Table 10.
Day-by-day results for two of these projects are shown in Table 11 and Table 12. When using the
total tonnage basis, it is important to recognize that one cannot include mixes falling below some
minimum standard.
In Table 10, which is based on the performance-based pay factors results, it will be noted
that there is not a consistent pattern between the average for the daily pay factors and the pay
factor based on total production.
When comparing Table 11 and Table 12, which include both the performance-based and
experience-based pay factors, two patterns of production are observed. In Table 11, the
performance-based pay factors suggest a somewhat variable daily production whereas the data in
Table 12 suggest, based on the performance-based pay factors, a gradually improving daily
production to a relatively consistent pattern after the eighth day.
Table 10: Pay Factor Values Calculated both on Tonnage for Each Day's Production and on the Total Project§
Target Values Pay Factor (%) Project AC (%)
AV (%)
P200 (%)
End Project
Avg. of Daily PF
Production Days
Avg. Samples per Day
02-288524 4.4 8.8 4 14.7 10.4 10 6 02-326604 4.8 8.8 5 7 10.3 14 6 06-338614 4.9 8.8 4.7 16.3 15.3 18 9 06-357604 4.7 8.8 5.7 14.4 10 23 5 06-3831u4 5.3 8.8 4.2 2.5 2.9 6 4 08-344704 5.3 8.8 4.2 4.7 5.8 8 6
§ Appendices A, B, and C References (17)

UCPRC-RR-2006-16
25
Table 11: Project A—Daily Production Data and Pay Factors**
Date No. of Samples
Performance-Based Pay Factor
Experience-Based Pay Factor
Daily Production (tons)
6/29/99 5 19.4 3.36 2421 6/30/99 3 -4.1 3.36 2359 7/1/99 6 0.9 3.36 2118 7/6/99 3 1.4 3.36 2434 7/7/99 6 2.5 3.36 2089 7/8/99 3 -3 3.36 1568
**Appendix B, Reference (17)
Table 12: Project B—Daily Production Data and Pay Factors**
Date No. of Samples
Performance-Based Pay Factor
Experience-Based Pay Factor
Daily Production (tons)
7/6/99 5 1.4 0.87 2093 7/7/99 8 7 4.47 3569 7/8/99 7 2.2 4.07 3186 7/9/99 8 6.7 3.67 3547
7/12/99 8 5.6 3.11 3482 7/13/99 4 4.9 3.41 1838 7/14/99 7 4.9 2.91 3347 7/16/99 3 18.1 2.81 2866 7/19/99 8 16.6 3.11 3507 7/20/99 7 14.7 2.91 2930 7/21/99 8 7 3.41 3590 7/22/99 3 17.8 3.71 1635 7/23/99 4 17.6 3.71 1606
**Appendix Reference (17)

UCPRC-RR-2006-16 26
11.0 DISCUSSION OF WEIGHTING FACTORS TO DETERMINE COMBINED PAY FACTORS
An additional argument in favor of the performance-based approach (in lieu of the
current Caltrans procedure) is related to the use of fixed weighting factors in the experience-
based approach to arrive at a combined pay factor. In Section 9 it was noted that Caltrans uses
weighting factors of 0.3, 0.4, and 0.07 for PWasp, Vair, and P200 respectively (0.3 is assigned to
aggregate grading controls with 23 percent [0.07] assigned to the P200 fraction).
As shown in the following example, weighting factors for mix parameters differ between
distress modes. Consider a mix with the following characteristics: PWasp 0.5% above target, Vair
2.0% higher than target, P200 1.0% less than target, and tAC 0.2 in. less than target. According to
the performance-based approach, the RPs shown in Table 13 would be obtained. The pay factor
for rutting is a 35 percent reduction from Figure 8 based on a combined RP of 0.17
(0.3 x 0.75 x 0.75). For fatigue, not considering asphalt concrete thickness (currently not used by
Caltrans), a reduction of 17 percent is obtained from Figure 8 based on an RP of 0.52 (1.07 x
0.49). If thickness is considered, a 20 percent reduction would result in a combined RP of 0.44
(1.07 x 0.49 x 0.84). As seen in Table 13 the RP for PWasp indicates a significant reduction in
rutting performance but a better than designed fatigue cracking performance. In this case the
weighting factor for asphalt content would be higher for rutting than that for fatigue. On the
other hand the weighting factor for Vair would be larger for fatigue than for rutting.
Further, relative to the above example, if the mix was placed as an overlay and rutting
was the primary concern, the relative weights for PWasp, Vair, and P200 from Table 13 are 0.59,
0.205, and 0.205 respectively. Considering the Caltrans weighting factors and only that
associated with P200 fraction, the values of 0.3, 0.4, and 0.07 (0.23 x 0.3) become 0.42, 0.52, and
0.09. In this case degree of compaction would be given a considerably higher weight than that
resulting from the performance-based approach (0.52 vs. 0.205).
Table 13. The Effect of Mix Parameters on Relative Performance (RP)
Performance Characteristics
Asphalt Content
Air-Void Content
P200 (rutting)/ tAC (fatigue)
Rutting + 0.5% RP = 0.30
+ 2.0% RP = 0.75
– 1% RP = 0.75
Fatigue + 0.5% RP = 1.07
+ 2.0% RP = 0.49
– 0.2 in. RP = 0.84

UCPRC-RR-2006-16
27
12.0 SUMMARY
The performance-based approach to pay-factor determination as used herein should be applicable
to any type of hot-mix asphalt. For mixes with aggregate gradings different than the conventional
dense-graded materials used in this study, additional laboratory testing should be performed. It is
likely, however, that both incentives and disincentives may be understated because only the first
rehabilitation cycle is considered. Nevertheless, understated incentives/disincentives are likely to
be more appropriate than overstated ones for initial use of this methodology.
The approach provides for a full incentive (bonus) for superior construction and a full
disincentive (penalty) for inferior construction. Based on current practice, the potential incentive
usually does not exceed some prescribed level. For example, the current limit for Caltrans is a
bonus of 5 percent. The performance-based analysis does not provide a basis for setting such an
upper limit since improved construction does, in fact, improve pavement life.
It must be emphasized that the combined pay factors for rutting and fatigue shown in
Figure 8 are based on: a target life of 10 or 20 years, a 2 percent annual traffic growth rate, a 5
percent discount rate, a 2.5 percent inflation rate, and rehabilitation costs 0.5 times the initial
construction cost for fatigue and rutting (Figure 8). Other parameters, e.g., changed target lives
and rehabilitation costs, will result in different values for the combined pay factors.
Pay factors shown in Figure 8 have been developed for asphalt concrete on granular base
and subbase over the subgrade. The approach for rutting may also be applied to asphalt concrete
overlays on portland cement concrete (PCC) pavements until further research becomes available.
Rutting resulting from shear deformations in the asphalt concrete is usually limited to the upper
75–100 mm; overlays on PCC pavement usually have thicknesses of at least 100 mm. On the
other hand, cracking in overlay pavements (both cracked asphalt concrete and PCC) is likely to
be reflection cracking rather than the classical fatigue cracking that can occur in conventional
asphalt concrete pavements. Reference (1) provides some evidence that this is the case for
asphalt concrete overlays on cracked asphalt concrete pavements. While it is probable that the
factors which affect fatigue cracking also will affect reflection cracking, it is not readily apparent
that the relative effects of these factors will be the same as for fatigue; nevertheless, however,
they could serve as a starting point. (14)

UCPRC-RR-2006-16 28
It should be noted that while the rutting model is based on a regression model derived
from the WesTrack performance data, it involved laboratory testing and mechanistic-empirical
analysis of the pavement sections in its development. Reference (2) provides a methodology
whereby a mechanistic-empirical procedure like that used for fatigue, can be developed using the
results of the SHRP-developed shear test and multilayer elastic analysis.
An example of a process that could be used to eventually implement performance-based
pay factors has been presented using approximately 80 projects constructed by Caltrans that
include incentives and disincentives. Comparisons of actual pay factors assigned to these
projects with those determined by the performance-based approach are included.
Changing from the experience-based PWL approach to the use of performance-based
equations like those used herein (based on mechanistic-empirical analyses and Monte Carlo
simulations) is now feasible with the introduction of the M-E pavement design procedures [e.g.,
CalME (15)]. CalME includes performance equations for asphalt concrete pavement
performance (e.g., fatigue and rutting). These equations include HMA variables such as those
included herein.
When this change is made, field performance data will be required to validate the system;
based on these data some modifications to the relative performance tables may be required.
Linking of databases containing the design, materials, and initial construction data to the
pavement management system containing the field performance data will be required. An
excellent example of this tie between materials and construction data and field performance data
has been described in Reference (16).
One of the advantages of the performance-base approach is that it emphasizes the mix
and pavement structure characteristics that most affect performance. As an example, the rutting
model emphasizes the importance of asphalt content, degree of compaction, and aggregate
gradation as defined by the P200 fraction while the fatigue model emphasizes degree of
compaction, pavement thickness, and asphalt content. While the contractor might consider
increasing the binder content somewhat for improved degree of compaction for fatigue, increase
of the asphalt content above the design target precludes this because of rutting considerations.
In general, the performance-based approach emphasizes the importance of uniformity in
both materials production and placement with reasonable controls placed on inherent variability.

UCPRC-RR-2006-16
29
Moreover, it emphasizes the importance of adhering to design target values. It also attempts to
consider only the materials and construction variance by eliminating the influence of test
variance.
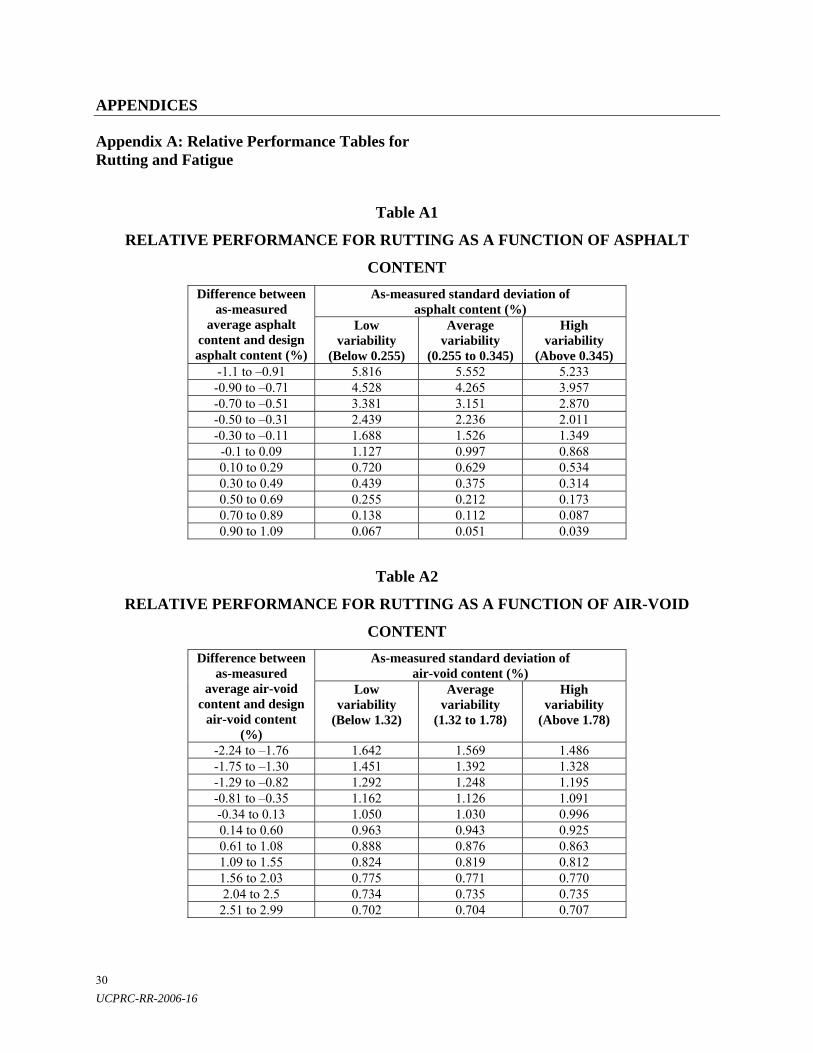
UCPRC-RR-2006-16 30
APPENDICES
Appendix A: Relative Performance Tables for Rutting and Fatigue
Table A1
RELATIVE PERFORMANCE FOR RUTTING AS A FUNCTION OF ASPHALT
CONTENT As-measured standard deviation of
asphalt content (%) Difference between
as-measured average asphalt
content and design asphalt content (%)
Low variability
(Below 0.255)
Average variability
(0.255 to 0.345)
High variability
(Above 0.345) -1.1 to –0.91 5.816 5.552 5.233 -0.90 to –0.71 4.528 4.265 3.957 -0.70 to –0.51 3.381 3.151 2.870 -0.50 to –0.31 2.439 2.236 2.011 -0.30 to –0.11 1.688 1.526 1.349 -0.1 to 0.09 1.127 0.997 0.868 0.10 to 0.29 0.720 0.629 0.534 0.30 to 0.49 0.439 0.375 0.314 0.50 to 0.69 0.255 0.212 0.173 0.70 to 0.89 0.138 0.112 0.087 0.90 to 1.09 0.067 0.051 0.039
Table A2
RELATIVE PERFORMANCE FOR RUTTING AS A FUNCTION OF AIR-VOID
CONTENT As-measured standard deviation of
air-void content (%) Difference between
as-measured average air-void
content and design air-void content
(%)
Low variability
(Below 1.32)
Average variability
(1.32 to 1.78)
High variability
(Above 1.78)
-2.24 to –1.76 1.642 1.569 1.486 -1.75 to –1.30 1.451 1.392 1.328 -1.29 to –0.82 1.292 1.248 1.195 -0.81 to –0.35 1.162 1.126 1.091 -0.34 to 0.13 1.050 1.030 0.996 0.14 to 0.60 0.963 0.943 0.925 0.61 to 1.08 0.888 0.876 0.863 1.09 to 1.55 0.824 0.819 0.812 1.56 to 2.03 0.775 0.771 0.770 2.04 to 2.5 0.734 0.735 0.735
2.51 to 2.99 0.702 0.704 0.707

UCPRC-RR-2006-16
31
Table A3
RELATIVE PERFORMANCE FOR RUTTING AS A FUNCTION OF MINERAL
FILLER AMOUNT As-measured standard deviation of mineral filler*
content (%) Difference between
as-measured average mineral
filler* content and design mineral
filler content (%)
Low variability
(Below 0.765)
Average variability
(0.765 to 1.035)
High variability
(Above 1.035)
-2.76 to –2.26 0.494 0.477 0.458 -2.25 to –1.76 0.574 0.554 0.530 -1.75 to –1.26 0.666 0.643 0.615 -1.25 to –0.76 0.769 0.745 0.714 -0.75 to –0.26 0.890 0.861 0.827 -0.25 to 0.24 1.033 0.996 0.955 0.25 to 0.74 1.190 1.155 1.104 0.75 to 1.24 1.376 1.332 1.280 1.25 to 1.74 1.593 1.538 1.477 1.75 to 2.24 1.841 1.781 1.704 2.25 to 2.74 2.121 2.057 1.973
* Mineral filler: percent passing No. 200 sieve.
Table A4
RELATIVE PERFORMANCE FOR FATIGUE AS A FUNCTION OF AIR-VOID
CONTENT As-measured standard deviation of air-void content
(%) Difference between
as-measured average air-void
content and design air-void content
(%)
Low variability(Below 1.32)
Average variability
(1.32 to 1.78)
High variability
(Above 1.78)
-2.24 to –1.76 2.275 2.093 1.899 -1.75 to –1.30 1.981 1.763 1.595 -1.29 to –0.82 1.624 1.482 1.339 -0.81 to –0.35 1.367 1.284 1.125 -0.34 to 0.13 1.151 1.048 0.945 0.14 to 0.60 0.968 0.882 0.796 0.61 to 1.08 0.816 0.743 0.671 1.09 to 1.55 0.732 0.628 0.568 1.56 to 2.03 0.581 0.532 0.483 2.04 to 2.5 0.493 0.454 0.415
2.51 to 2.99 0.422 0.391 0.361
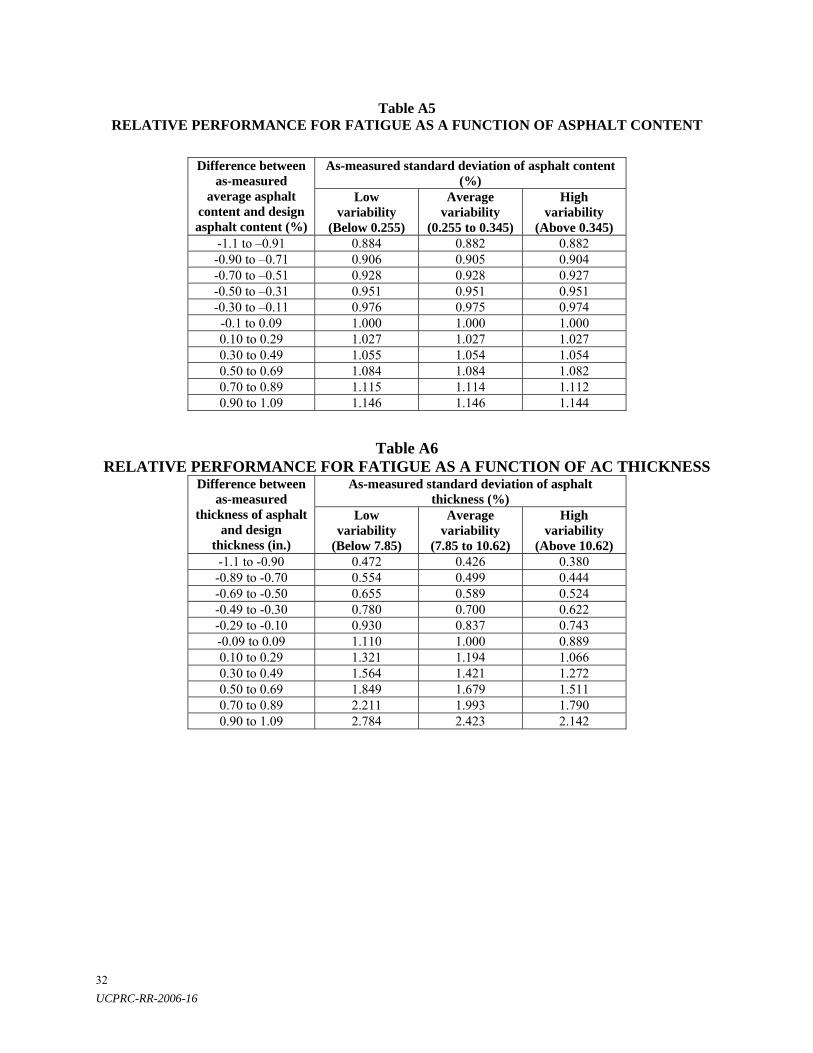
UCPRC-RR-2006-16 32
Table A5 RELATIVE PERFORMANCE FOR FATIGUE AS A FUNCTION OF ASPHALT CONTENT
As-measured standard deviation of asphalt content (%)
Difference between as-measured
average asphalt content and design asphalt content (%)
Low variability
(Below 0.255)
Average variability
(0.255 to 0.345)
High variability
(Above 0.345) -1.1 to –0.91 0.884 0.882 0.882 -0.90 to –0.71 0.906 0.905 0.904 -0.70 to –0.51 0.928 0.928 0.927 -0.50 to –0.31 0.951 0.951 0.951 -0.30 to –0.11 0.976 0.975 0.974 -0.1 to 0.09 1.000 1.000 1.000 0.10 to 0.29 1.027 1.027 1.027 0.30 to 0.49 1.055 1.054 1.054 0.50 to 0.69 1.084 1.084 1.082 0.70 to 0.89 1.115 1.114 1.112 0.90 to 1.09 1.146 1.146 1.144
Table A6 RELATIVE PERFORMANCE FOR FATIGUE AS A FUNCTION OF AC THICKNESS
As-measured standard deviation of asphalt thickness (%)
Difference between as-measured
thickness of asphalt and design
thickness (in.)
Low variability
(Below 7.85)
Average variability
(7.85 to 10.62)
High variability
(Above 10.62) -1.1 to -0.90 0.472 0.426 0.380 -0.89 to -0.70 0.554 0.499 0.444 -0.69 to -0.50 0.655 0.589 0.524 -0.49 to -0.30 0.780 0.700 0.622 -0.29 to -0.10 0.930 0.837 0.743 -0.09 to 0.09 1.110 1.000 0.889 0.10 to 0.29 1.321 1.194 1.066 0.30 to 0.49 1.564 1.421 1.272 0.50 to 0.69 1.849 1.679 1.511 0.70 to 0.89 2.211 1.993 1.790 0.90 to 1.09 2.784 2.423 2.142

UCPRC-RR-2006-16
33
Appendix B: Caltrans Project Data
Table B1: Caltrans Project Data
Project AC std. dev.
AC diff
AV std. dev.
AV diff Critical Distress
Performance-Based Pay Factor (%)
Caltrans Pay Factor
(%) 01-344804 0.218 0.021 0.910 -1.270 Rutting 2.2 3 01-346004 0.255 0.087 0.850 -1.910 Rutting 2.8 3 01-350204 0.228 0.105 0.580 -0.874 Rutting 2.2 2 02-259104 0.157 -0.172 1.030 -0.675 Fatigue 7.4 -5 02-261604 0.153 -0.018 1.170 -2.024 Fatigue 19.6 4 02-288404 0.200 -0.037 0.610 -1.074 Rutting 11.9 4 02-288524 0.250 -0.090 0.810 -1.340 Fatigue 14.7 3.5 02-321304 0.175 -0.116 0.500 -1.131 Fatigue 11.9 4 02-326504 0.233 0.091 0.790 -1.492 Rutting 2.8 3 02-326604* 0.230 0.080 0.990 -2.546 Rutting 4 4.5 03-2A5804 0.213 -0.030 0.610 -1.444 Fatigue 16.6 5 03-3696u4 0.146 0.060 0.530 -2.223 Rutting 4 5 03-384504 0.137 0.046 0.980 -1.511 Rutting 2.8 3 03-384604 0.153 -0.120 0.920 -1.359 Fatigue 14.7 3 03-394504 0.195 -0.022 0.570 -1.425 Fatigue 16.6 5 03-441204 0.211 0.052 0.520 -0.741 Rutting 2.2 3 03-4416U4* 0.176 0.064 0.642 -2.020 Rutting 4 4.6 03-444904 0.141 -0.072 0.550 -2.014 Fatigue 19.6 5 03-445104* 0.184 -0.008 0.530 -1.600 Fatigue 16.6 5 03-447204 0.166 -0.042 0.866 -2.349 Fatigue 19.6 5 04-1037U4 0.188 -0.022 2.140 -0.494 Fatigue 2.7 -12 04-132454 0.384 0.035 1.310 -2.375 Rutting 1.2 -1 04-163014 0.149 -0.130 0.520 -1.207 Fatigue 14.7 4 04-232904 0.243 0.297 0.670 -1.843 Rutting -1.4 0 04-233104 0.053 -0.257 0.250 -2.242 Fatigue 19.1 5 04-233164 0.340 -0.062 1.140 -1.501 Rutting 5.8 -3 04-233334 0.345 -0.082 1.340 -1.501 Rutting 4.2 -5 05-390504 0.096 -0.148 0.240 -0.608 Fatigue 7.4 5 05-399504 0.122 -0.054 0.700 -1.473 Fatigue 16.6 4 05-440804 0.165 0.043 1.110 -2.689 Rutting 4 4 05-442504 0.203 0.098 0.600 -0.675 Rutting 2.2 1 06-314404 0.170 -0.136 0.690 -1.748 Fatigue 17.8 5 06-338404 0.277 0.076 0.670 -2.518 Rutting 2.8 4 06-338614 0.100 -0.190 0.320 1.670 Fatigue -12.2 4.34 06-357604 0.120 -0.160 0.380 -1.292 Fatigue 14.4 4.42 06-364404 0.264 0.039 0.630 -2.147 Rutting 2.8 4 06-3831U4 0.240 0.130 0.570 -1.283 Rutting 2.2 3.36 06-387404 0.211 0.018 0.640 -0.893 Rutting 2.2 2 06-387604 0.305 0.046 0.660 -0.760 Rutting 0.9 -3 06-389504 0.260 0.130 0.510 1.170 Rutting -3.9 2 06-391214 0.142 0.154 0.480 -0.817 Rutting 2.2 4

UCPRC-RR-2006-16 34
Project AC std. dev.
AC diff
AV std. dev.
AV diff Critical Distress
Performance-Based Pay Factor (%)
Caltrans Pay Factor
(%) 06-402104 0.250 0.100 0.860 -1.720 Rutting 3.4 3 06-421404 0.210 0.090 0.580 -1.330 Rutting 2.2 4 06-421504 0.170 0.030 0.710 -1.500 Rutting 2.8 4 06-421604 0.220 0.060 0.470 1.380 Rutting 2.2 5 07-115314 0.165 -0.147 0.450 -1.387 Fatigue 14.4 5 08-350704 0.250 0.060 1.390 -2.499 Rutting 3.6 3.25 08-358204 0.169 0.023 0.630 -0.817 Rutting 2.2 3 08-362804 0.206 0.295 1.680 -3.791 Rutting -1.2 1 08-364804 0.169 -0.041 0.450 -0.589 Fatigue 7.7 2 08-3979U4 0.264 0.024 0.820 2.261 Fatigue -17.2 -14 08-398704 0.170 -0.028 0.630 -1.112 Fatigue 11.9 4 08-398804 0.142 0.006 0.720 -1.615 Rutting 5 4 08-405904 0.127 -0.010 0.580 -0.760 Fatigue 9.85 3 08-426704 0.100 0.016 0.420 -1.368 Rutting 2.2 5 09-249604 0.154 0.024 0.550 -1.482 Rutting 2.8 5 09-249704 0.172 -0.128 0.770 -1.387 Fatigue 14.7 4 09-2498U4 0.168 0.005 0.950 -2.309 Rutting 6.1 5 09-250004 0.162 -0.017 0.160 -1.378 Fatigue 14.7 5 09-250204 0.089 0.022 0.210 -1.340 Rutting 2.2 5 09-250304 0.164 -0.032 0.510 -0.827 Fatigue 9.9 4 09-261604 0.132 0.127 0.250 -1.482 Rutting 2.8 5 09-264304 0.094 -0.025 0.860 -1.216 Fatigue 14.7 3 09-265904 0.142 -0.027 0.610 -1.919 Fatigue 19.6 5 09-271604 0.089 0.083 0.510 -1.007 Rutting 2.2 4 10-382304 0.169 -0.085 0.360 -0.732 Fatigue 9.9 4 10-391704 0.253 0.109 1.120 -1.615 Rutting 2.8 2 11-093504 0.132 -0.057 0.450 -1.064 Fatigue 11.9 4 11-194834 0.187 0.053 1.300 -1.995 Rutting 4 3 11-217604 0.190 0.055 0.420 -0.865 Rutting 2.2 4 11-217704 0.198 0.095 0.430 -1.112 Rutting 2.2 5 12-0124U4 0.180 0.188 1.420 -1.577 Rutting 0 0 Note: Projects marked (*) used data provided by the Contractor to estimate pay factors by the performance based method. In the computation of the Caltrans pay factors only the weightig factors for compaction degree and asphalt content were considered. Additionally, Seventy (70) percent of the projects listed in Table B1 represent rehabilitation and new construction projects; the remaining 30 percent being resurfacing projects.

UCPRC-RR-2006-16
35
Appendix C: Computer Application—Pay Factor Determinations
The “Pay Factor Calculator” is a simple application using some of the spreadsheet features of
Microsoft® Excel. Based on the inputs in the main screen (Figure C1), the program finds the
individual relative performances of each of the pay factor parameters by looking up the
appropriate value in Tables A1 to A6 stored in a separate spreadsheet, “Relative Performance.”
The application then calculates the combined relative performance for both rutting and fatigue
and picks the lower value of the two (the case least beneficial to the Agency) to calculate the pay
factor. Input parameters such as traffic growth, annual discount rate, construction index cost, cost
of resurfacing, cost of rehabilitation, and design life can be changed. The results can be saved in
a separate spreadsheet named “SavedScenarios” by clicking the “Save Scenario” button.

UCPRC-RR-2006-16 36
Project EA: Bid Item #
Design Relative compaction
Avg Relative compaction
Difference measured-design converted into AV
96 97.67 -1.5865Combined RP
Rutting:RP 2.027 Rutting
Fatigue:RP 1.934 Fatigue
RESULTSOTY 33PW(%) 16.3 Caltrans PF 1.0186
Mineral Filler: difference between
measured and target
AC Thickness: difference between
measured and target
Std Mineral Filler
Cost of rehab % (C)
50
Cost of resurfacing% (C)
20
1.000
1.688 0.827
0.976 1.981
1.451
-0.19 -1.5865 -0.67 0
Std AC Thickness
0.32 0.68 7.850.1
Std AC
Annual rate of traffic growth (g)
1.025
Std AV
Construction-cost index (r)
08-350704
AC: difference between measured and target
AV: difference between measured and target
1.02
Annual discount rate (d)
1.05
Design life (years)
20
Save Scenario
Figure C1. Pay factor calculator.

UCPRC-RR-2006-16
37
REFERENCES
1. J. T. Harvey, J. Roesler, N. F. Coetzee, and C. L. Monismith. “Caltrans Accelerated
Pavement Test Program, Summary Report Six Year Period: 1994–2000”. Prepared for the California Department of Transportation, Pavement Research Center, University of California, Berkeley, June 2000, 112 pp.
2. C. L. Monismith, J. A. Deacon, and J. T. Harvey. “WesTrack: Performance Models for Permanent Deformation and Fatigue”. Pavement Research Center, University of California, Berkeley, June, 2000, 373 pp. N.B. The results of this report are summarized in NCHRP Report 455, “Recommended Performance0-Related Specifications for Hot-Mix Asphalt Construction: Results of the WesTrack Project,” Transportation Research Board Washington, D.C., 2002, 496 pp.
3. J. A. Deacon, A. A. Tayebali, J. S. Coplantz, F. N. Finn, and C. L. Monismith. “Fatigue Response of Asphalt-Aggregate Mixtures: Part III, Mix Design and Analysis”. Report SHRP A-404, Strategic Highway Research Program, National Research Council, Washington, D. C., 1994, 309 pp.
4. J. A. Deacon, J. S. Coplantz, A. A. Tayebali, and C. L. Monismith. “Temperature Considerations in Asphalt-Aggregate Mixture Analysis and Design.” Research Record 1454. Transportation Research Board, Washington, D. C., 1994, pp. 97-112.
5. J. T. Harvey, J. A. Deacon, B. W. Tsai, and C. L. Monismith. “Fatigue Performance of Asphalt Concrete Mixes and Its Relationship to Asphalt Concrete Pavement Performance in California”. University of California, Berkeley, Institute of Transportation Studies, Asphalt Research Program, CAL/APT Program, 1995, 188 pp.
6. J. T. Harvey, J. A. Deacon, A. A. Tayebali, R. B. Leahy, and C. L. Monismith. “A Reliability-Based Mix Design and Analysis System for Mitigating Fatigue Distress.” Proceedings. 8th International Conference on Asphalt Pavements. University of Washington, Seattle, August 1997, I: 301-323.
7. J. A. Deacon, C. L. Monismith, and J. T. Harvey. “Pay Factors for Asphalt-Concrete Construction: Effect of Construction Quality on Agency Costs”. TM-UCB-CAL/APT-97-1. Pavement Research Center, Institute of Transportation Studies, University of California, Berkeley, April 1997, 47 pp.
8. J. Epps. “Accelerated Field Test of Performance-Related Specifications for Hot-Mix Asphalt Construction—Task G, Interim Report”. Submitted to the Federal Highway Administration. Nevada Automotive Test Center. Chapter 12, 1996.
9. P. Benson. “Comparison of End-Result and Method Specifications for Managing Quality”. Paper presented at the 74th Transportation Research Board Annual Meeting, Washington, D.C., 1995.
10. E. Granley. “Part 4—Variations of Bituminous Construction.” Public Roads. Vol. 35, No. 9, 1969.
11. Caltrans, Division of Construction. “Quality Control Quality Assurance Manual”, Sacramento, CA, June 2002, 84 pp.
12. C.L. Monismith, L. Popescu, and J.T. Harvey. “Performance-Based Pay Factors for Asphalt Concrete Construction; Comparison with a Currently Used Experience-Based Approach”.

UCPRC-RR-2006-16 38
Paper presented at the 79th Association of Asphalt Paving Technologists annual meeting, Baton Rouge, Louisiana, 2004.
13. C. L. Monismith, and L. Popescu. “Performance Specifications without Percent within Limits (PWLs); a Counter Point of View”. Paper presented at the 81st Association of Asphalt Paving Technologists meeting, Savannah, Georgia, 2006.
14. Sousa, J. Development of a Mechanistic Overlay Design Method Based on Reflective Cracking Concepts. Arizona DOT Materials Group, Report AZ-2001A, Phoenix, AZ, August 2002.
15. CalME Software package under development for Caltrans. 16. C. Schwartz, L. Michael, and G. Burke, “Performance of Stone Matrix Asphalt Pavements in
Maryland.” Journal. Association of Asphalt Paving Technologists, Vol. 72, 2003. 17. Bressette, T., Cook, M. C., and Dietz, J. QC/QA Bleeding Investigation (Tr-299, Mad-41,
Sbd-15, 40), Engineering Service Center, Office of Flexible Pavement Materials, Caltrans. Draft, January 2002.

![Asphalt Paving Essentials QA/QC · 2018-03-09 · Pat [Pick the date] Asphalt Paving Essentials QA/QC Plan Sample Good for smaller projects and bid qualifications Has All the Essential](https://img.pdfslide.us/doc/110x75/5e6d27a5284dc1024112022e/asphalt-paving-essentials-qaqc-2018-03-09-pat-pick-the-date-asphalt-paving.jpg)