Embed Size (px)
Citation preview

Performance Based Learning and Assessment Task
Activity/Task Title I. ASSESSSMENT TASK OVERVIEW & PURPOSE:
Students will be asked to find various characteristics of a polynomial function, modeled by a roller coaster’s path. Students will be asked to find increasing and decreasing intervals, roots of a function, maxima and minima, as well as writing the equation of the curve of the roller coaster’s path.
II. UNIT AUTHOR: Robin Malone, Hanover High School, Hanover County Schools
III. COURSE: Algebra II
IV. CONTENT STRAND: Algebra
V. OBJECTIVES: Students will assess the polynomial path of a roller coaster and find increasing and decreasing intervals, roots of the equation, describe the journey of the roller coaster in relative terms, and write the equation of the path it follows.
VI. REFERENCE/RESOURCE MATERIALS: Students will use the high school Algebra II textbook available to them in their classroom.
VII. PRIMARY ASSESSMENT STRATEGIES: Students will be assessed on how well they compete each portion of the task; how complete and accurate their findings are. Students will also be assessed on the quality of their descriptions and explanations as required by the rubric.
VIII. EVALUATION CRITERIA: Self-assessments and teacher assessments are attached at the end of this document, as well as a benchmark of what students are expected to produce.
IX. INSTRUCTIONAL TIME: This activity should take one 90-minute class period.
2
“FUN-ctions” Find the Equation of a Scream Strand Algebra Mathematical Objective(s) The goal of this activity is for the students to apply their knowledge of quadratics and other polynomial functions to the problem of the curves and arcs of a roller coaster. Students will need to superimpose a coordinate axis over the track of a roller coaster, find maxima and minima, increasing and decreasing intervals, as well as roots of the path of the roller coaster. Students should be able to discuss the trip on the roller coaster as if they were riding it, discussing relative speeds and heights of the ride. Students will also use the coordinate plane to help them find points from which they can write the equation of the curves of a roller coaster. Related SOL List all applicable SOL for each task. SOL# and/or bullet letter only
A.4.f. The students will solve multistep linear and quadratic equations in two variables
including solving real-world problems involving equations and systems of equations.
A.II.4.b. The student will solve algebraically and graphically quadratic equations over the set
of complex numbers.
A.II.7.a. The student will investigate and analyze functions algebraically and graphically.
Key concepts include a) domain and range, including limited and discontinuous domains
and ranges; b) zeros; c) x- and y-intercepts; d) intervals in which the function is increasing
or decreasing. Graphing calculators will be used as a tool to assist in investigation of
functions.
AFDA.4. The student will transfer between and analyze multiple representations of
functions, including algebraic formulas, graphs, tables and words. Students will select and
use appropriate representations for analysis, interpretation and prediction.
NCTM Standards
Understand relations and functions and select, convert flexibly among, and use various representations for them
Apply and adapt a variety of appropriate strategies to solve problems
Analyze functions of one variable by investigating rates of change, intercepts, zeros, asymptotes, and local and global behavior
Identify essential quantitative relationships in a situation and determine the class or classes of functions that might model the relationships
Draw reasonable conclusions about a situation being modeled
Communicate mathematical thinking coherently and clearly to peers, teachers, and others Additional Objectives for Student Learning (include if relevant; may not be math-related):
PH.2.a The student will investigate and understand how to analyze and interpret data. Key concepts include a description of a physical problem is translated into a mathematical statement in order to find a solution;
PH.4.a The student will investigate and understand how applications of physics affect the world. Key concepts include examples from the real world; and
3
Materials/Resources Classroom set of graphing calculators Students will need a copy of the activity sheets that follow, as well as the rubrics and assessment sheets. Teacher may want to have transparencies of coordinate grids available. Assumption of Prior Knowledge
Students should know the formula for a quadratic, and know how to find the equation of a specific function given points on the curve.
Students should be operating on Analysis level on Van Hiele scale with respect to polynomial functions.
Students should know and be able to use correctly the following terms: increasing, decreasing, intervals, maxima, minima, roots, function, relative speed, domain and range.
This might be used as an introduction to the application of physics and engineering on amusement park rides, a potential field of college study.
4
Introduction: Setting Up the Mathematical Task This activity will use one 90-minute block and should be done in groups of two or three. Students will apply their knowledge of quadratics and other polynomial functions to the problem of the curves and arcs of a roller coaster. Students will need to superimpose a coordinate axis over the track of a roller coaster, find maxima and minima, increasing and decreasing intervals, as well as roots of the path of the roller coaster. Students should be able to discuss the trip on the roller coaster as if they were riding it, discussing relative speeds and heights of the ride. Students will also use the coordinate plane to help them find points from which they can write the equation of part, or all, of the path. There are activity sheets for the students to complete as they progress through the task, and a rubric for grading as well as a self/team-assessment will be given to the students at the start of the task.
Student Exploration Student/Teacher Actions:
The teacher can introduce the task with some pictures of various roller coasters, coasters from nearby theme parks, or a clip of a coaster in action. The teacher can draw the students’ attention to the shape of the tracks, how they move up and down, as well as discussing relative time and speed of various sections of the track.
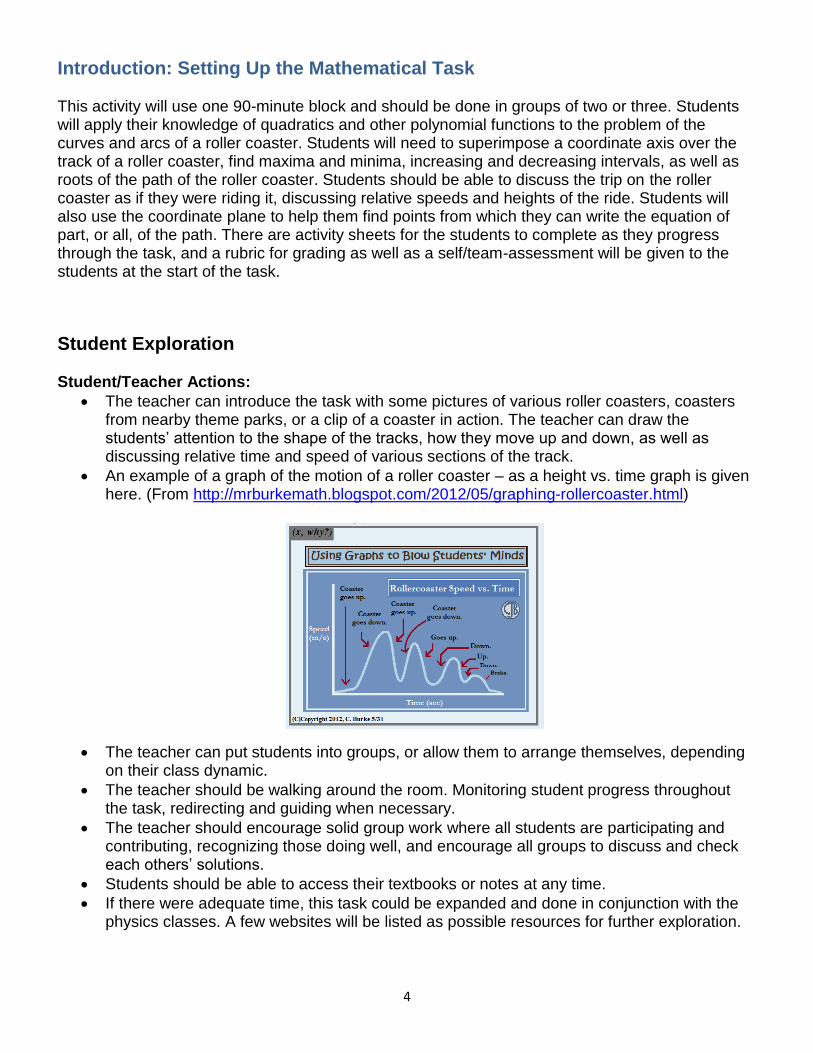
An example of a graph of the motion of a roller coaster – as a height vs. time graph is given here. (From http://mrburkemath.blogspot.com/2012/05/graphing-rollercoaster.html)
The teacher can put students into groups, or allow them to arrange themselves, depending on their class dynamic.
The teacher should be walking around the room. Monitoring student progress throughout the task, redirecting and guiding when necessary.
The teacher should encourage solid group work where all students are participating and contributing, recognizing those doing well, and encourage all groups to discuss and check each others’ solutions.
Students should be able to access their textbooks or notes at any time.
If there were adequate time, this task could be expanded and done in conjunction with the physics classes. A few websites will be listed as possible resources for further exploration.
5
Monitoring Student Responses
Students will discuss in their groups how to complete each part of the task.
All members of the group should be participating: contributing thoughts and ideas, and helping to come up with solutions and explanations.
Students should show their work on the activity sheet and be able to explain the process on paper and verbally.
Students may struggle with deciding how to get the curve of the roller coaster’s path onto a grid. The teacher may have graph paper and/or transparencies available to help with this.
The teacher should be monitoring progress, but minimize the amount of help given to groups. Instead, the teacher may encourage group brainstorming, or suggest they consult their text or class notes if needed.
If a group has finished very quickly, and is correct, the teacher may direct them to a website regarding the physics behind roller coasters, which they could read and summarize, or to one of the referenced websites which encourage interactive roller coaster building.
The teacher will be able to assess student knowledge on their completed activity sheets, as well as through regular monitoring throughout the in-class activity.
As a summary, groups may share the work with the class, and the various groups can see if they all found the same equation for the first hill of the coaster – perhaps writing them on the board, or using a document camera to show their work.
The following were found at http://goddardusd.com/page/178143_4 http://science.howstuffworks.com/engineering/structural/roller-coaster.htm/printable
Video/Simulations:
http://www.sciencechannel.com/video-topics/engineering-construction/machines-rollercoaster.htm
http://www.britannica.com/coasters/ride.html?cameFromBol=true
http://kpts.pbslearningmedia.org/asset/mck05_int_rollercoaster/
Interactive Sites:
Design a Roller Coaster -
http://www.learner.org/interactives/parkphysics/coaster/
Amusement Park Physics -
http://www.glencoe.com/sec/science/cgi-bin/splitwindow.cgi?top=http://www.glencoe.com/sec/science/top2.html&link=http://www.learner.org/exhibits/parkphysics/
Roller Coaster Game -
http://www.glencoe.com/sec/science/cgi-bin/splitwindow.cgi?top=http://www.glencoe.com/sec/science/top2.html&link=http://www.Funderstanding.com/k12/coaster/
Roller Coaster Creator -
http://rollercoastergames.net/rollercoaster-creator/
Disney –
http://dep.disney.go.com/sodi_app/index.html?st=2
6
Assessment List and Benchmarks
Students will be assessed on their group’s correct completion of the activity sheet. The rubric and
self-assessment sheets are attached and should be used in grading all the group-work. If a student
had a need for a regularly addressed accommodation, the task should be modified to meet his/her
requirements.
7
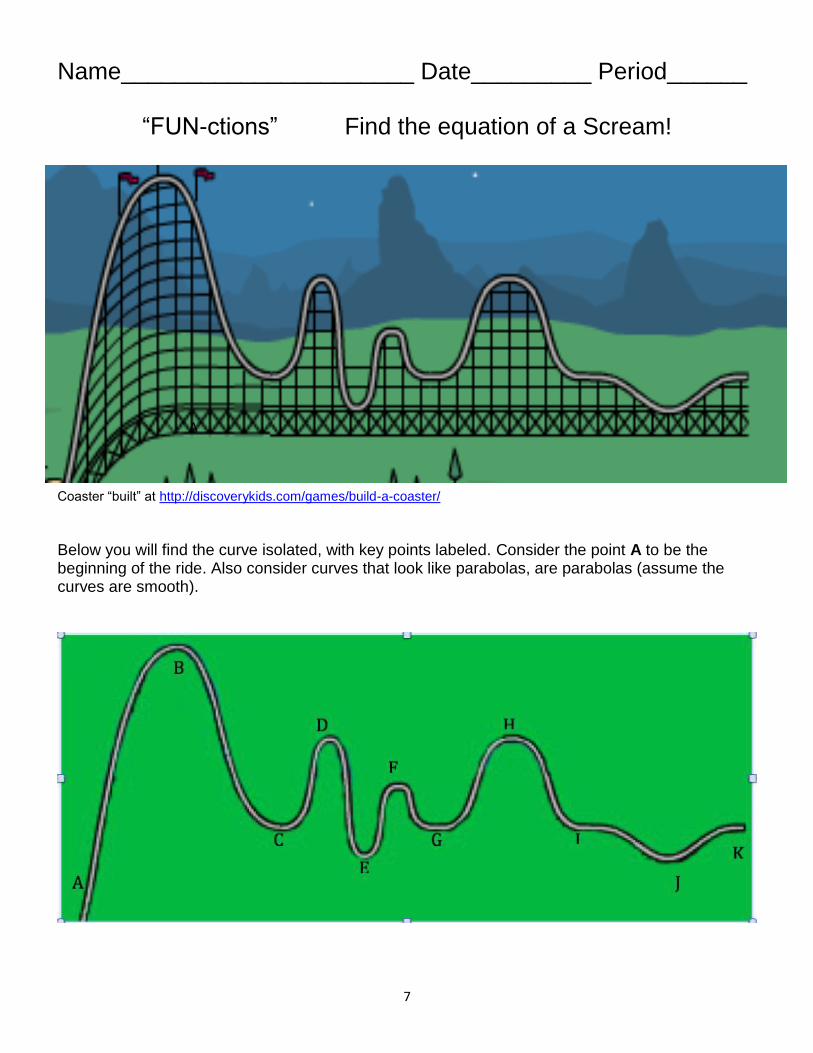
Name______________________ Date_________ Period______
“FUN-ctions” Find the equation of a Scream! Coaster “built” at http://discoverykids.com/games/build-a-coaster/
Below you will find the curve isolated, with key points labeled. Consider the point A to be the beginning of the ride. Also consider curves that look like parabolas, are parabolas (assume the curves are smooth).
A
8
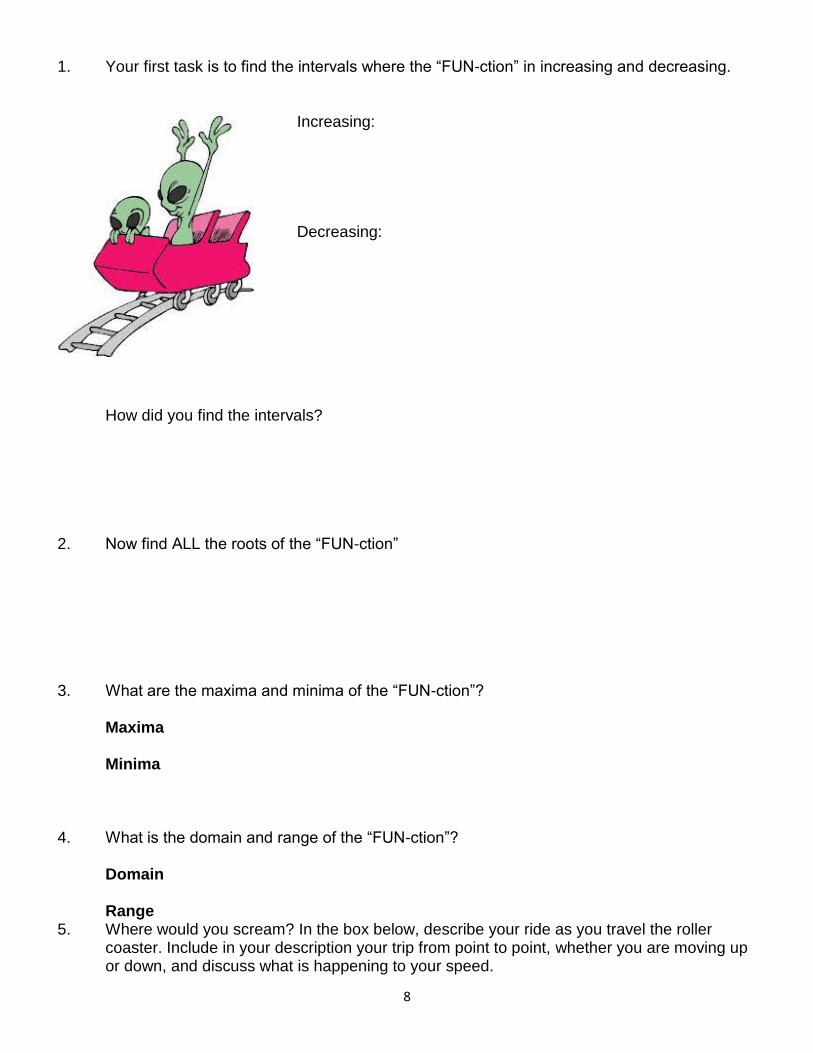
1. Your first task is to find the intervals where the “FUN-ction” in increasing and decreasing. Increasing: Decreasing:
How did you find the intervals? 2. Now find ALL the roots of the “FUN-ction” 3. What are the maxima and minima of the “FUN-ction”? Maxima Minima 4. What is the domain and range of the “FUN-ction”? Domain Range 5. Where would you scream? In the box below, describe your ride as you travel the roller
coaster. Include in your description your trip from point to point, whether you are moving up or down, and discuss what is happening to your speed.
9
6. At what point on the coaster would you be going the fastest? The slowest? Explain why you
chose these points. Fastest at Slowest at
10
7. Write the equation of the first “scream”! Find the equation of the first hill – the complete curve up and down again, from point A – C. Show all your work, with explanations when needed.
8. Looking at the first hill and its equation, how HIGH off the ground would you be after you
have traveled 60 feet horizontally. Show your work and explain how you got the answer.
11
Name __________________________________ Date___________
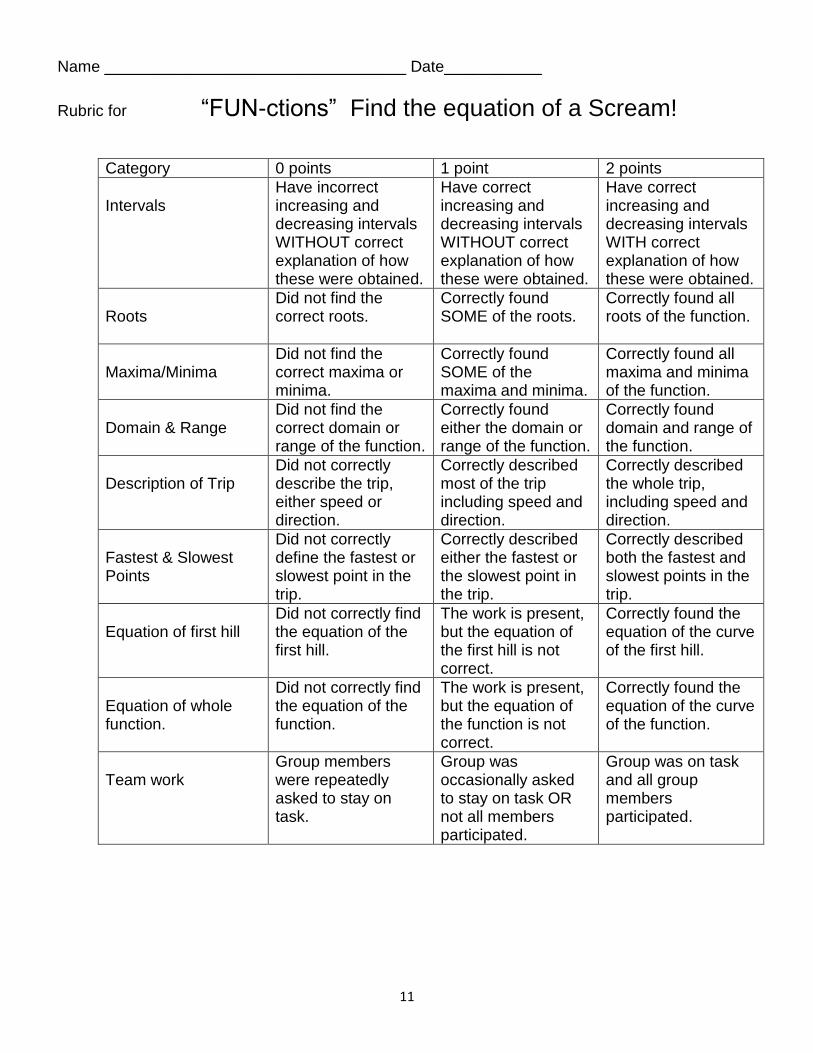
Rubric for “FUN-ctions” Find the equation of a Scream!
Category 0 points 1 point 2 points
Intervals
Have incorrect increasing and decreasing intervals WITHOUT correct explanation of how these were obtained.
Have correct increasing and decreasing intervals WITHOUT correct explanation of how these were obtained.
Have correct increasing and decreasing intervals WITH correct explanation of how these were obtained.
Roots
Did not find the correct roots.
Correctly found SOME of the roots.
Correctly found all roots of the function.
Maxima/Minima
Did not find the correct maxima or minima.
Correctly found SOME of the maxima and minima.
Correctly found all maxima and minima of the function.
Domain & Range
Did not find the correct domain or range of the function.
Correctly found either the domain or range of the function.
Correctly found domain and range of the function.
Description of Trip
Did not correctly describe the trip, either speed or direction.
Correctly described most of the trip including speed and direction.
Correctly described the whole trip, including speed and direction.
Fastest & Slowest Points
Did not correctly define the fastest or slowest point in the trip.
Correctly described either the fastest or the slowest point in the trip.
Correctly described both the fastest and slowest points in the trip.
Equation of first hill
Did not correctly find the equation of the first hill.
The work is present, but the equation of the first hill is not correct.
Correctly found the equation of the curve of the first hill.
Equation of whole function.
Did not correctly find the equation of the function.
The work is present, but the equation of the function is not correct.
Correctly found the equation of the curve of the function.
Team work
Group members were repeatedly asked to stay on task.
Group was occasionally asked to stay on task OR not all members participated.
Group was on task and all group members participated.
12
Name __________________________________ Date___________
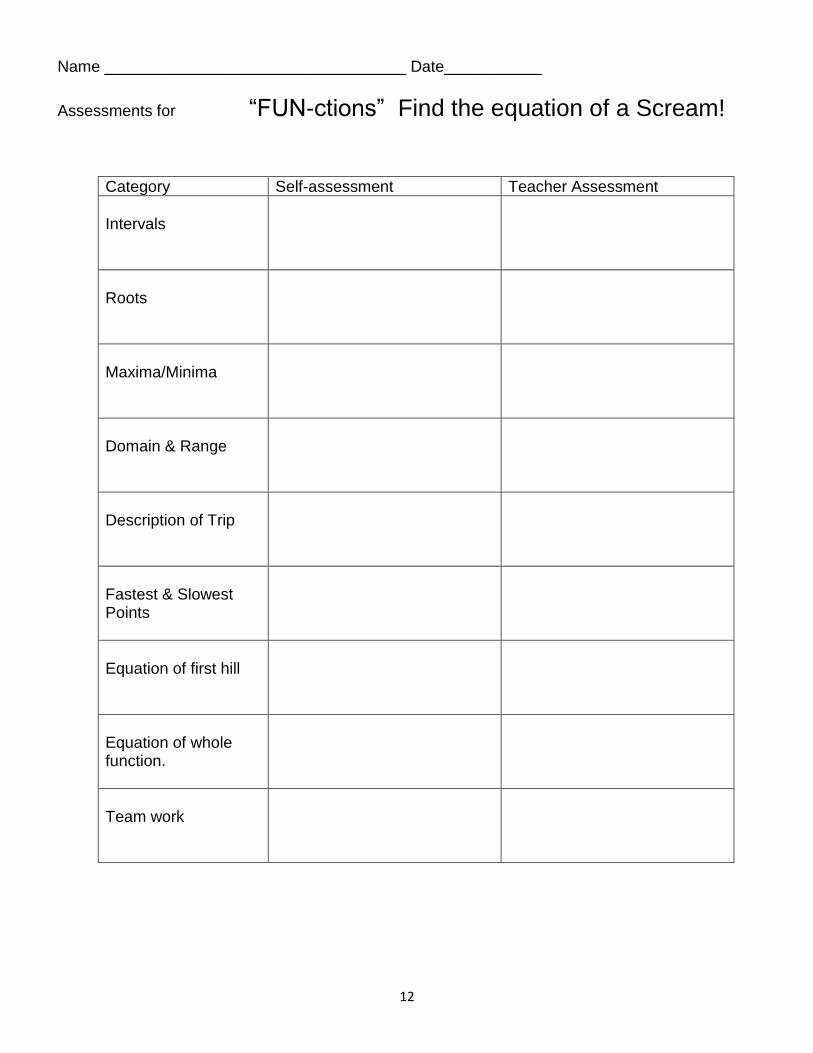
Assessments for “FUN-ctions” Find the equation of a Scream!
Category Self-assessment Teacher Assessment
Intervals
Roots
Maxima/Minima
Domain & Range
Description of Trip
Fastest & Slowest Points
Equation of first hill
Equation of whole function.
Team work
13
Name_____KEY______________ Date__KEY___ Period_KEY_
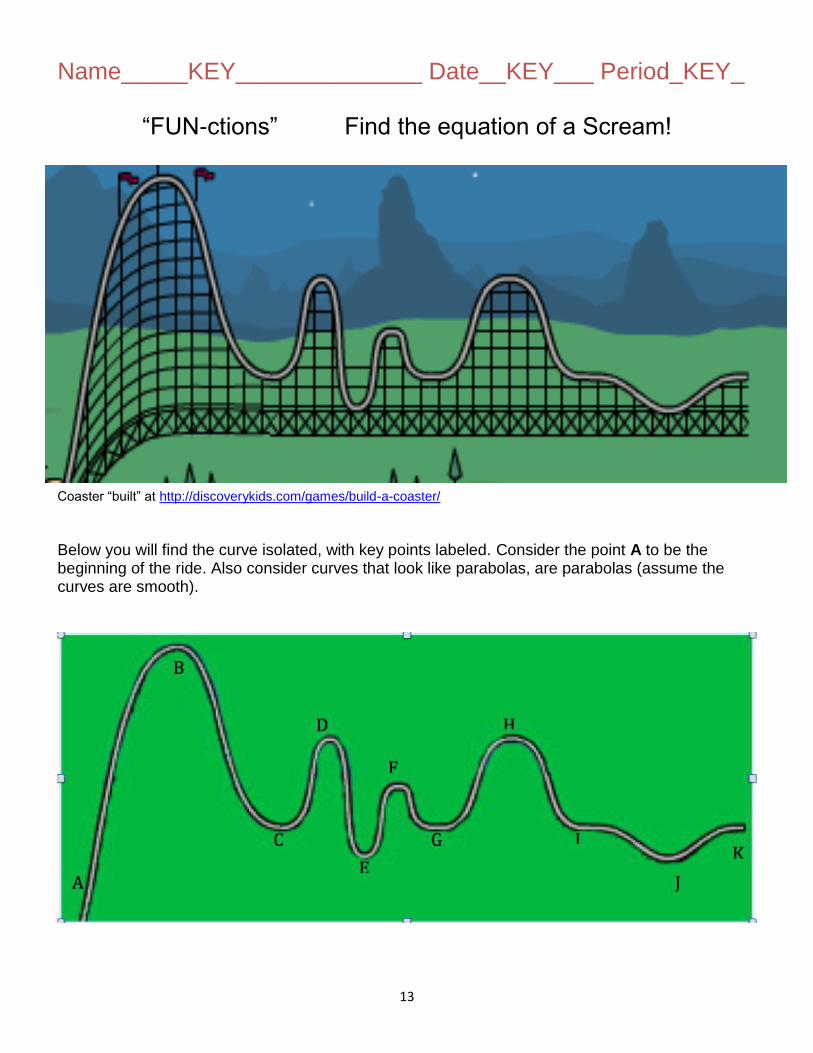
“FUN-ctions” Find the equation of a Scream! Coaster “built” at http://discoverykids.com/games/build-a-coaster/
Below you will find the curve isolated, with key points labeled. Consider the point A to be the beginning of the ride. Also consider curves that look like parabolas, are parabolas (assume the curves are smooth).
A
14
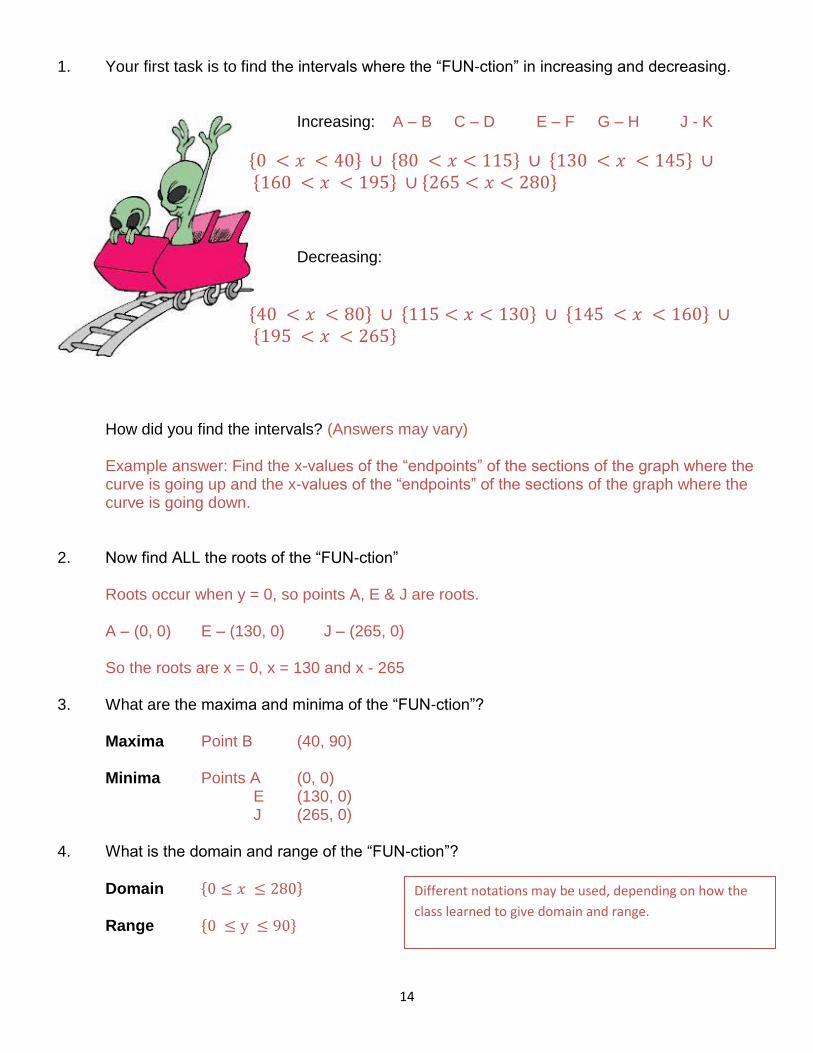
1. Your first task is to find the intervals where the “FUN-ction” in increasing and decreasing. Increasing: A – B C – D E – F G – H J - K
{0 < 𝑥 < 40} ∪ {80 < 𝑥 < 115} ∪ {130 < 𝑥 < 145} ∪ {160 < 𝑥 < 195} ∪ {265 < 𝑥 < 280} Decreasing:
{40 < 𝑥 < 80} ∪ {115 < 𝑥 < 130} ∪ {145 < 𝑥 < 160} ∪ {195 < 𝑥 < 265}
How did you find the intervals? (Answers may vary)
Example answer: Find the x-values of the “endpoints” of the sections of the graph where the curve is going up and the x-values of the “endpoints” of the sections of the graph where the curve is going down.
2. Now find ALL the roots of the “FUN-ction” Roots occur when y = 0, so points A, E & J are roots. A – (0, 0) E – (130, 0) J – (265, 0) So the roots are x = 0, x = 130 and x - 265 3. What are the maxima and minima of the “FUN-ction”? Maxima Point B (40, 90) Minima Points A (0, 0) E (130, 0) J (265, 0) 4. What is the domain and range of the “FUN-ction”?
Domain {0 ≤ 𝑥 ≤ 280}
Range {0 ≤ y ≤ 90}
Different notations may be used, depending on how the
class learned to give domain and range.
15
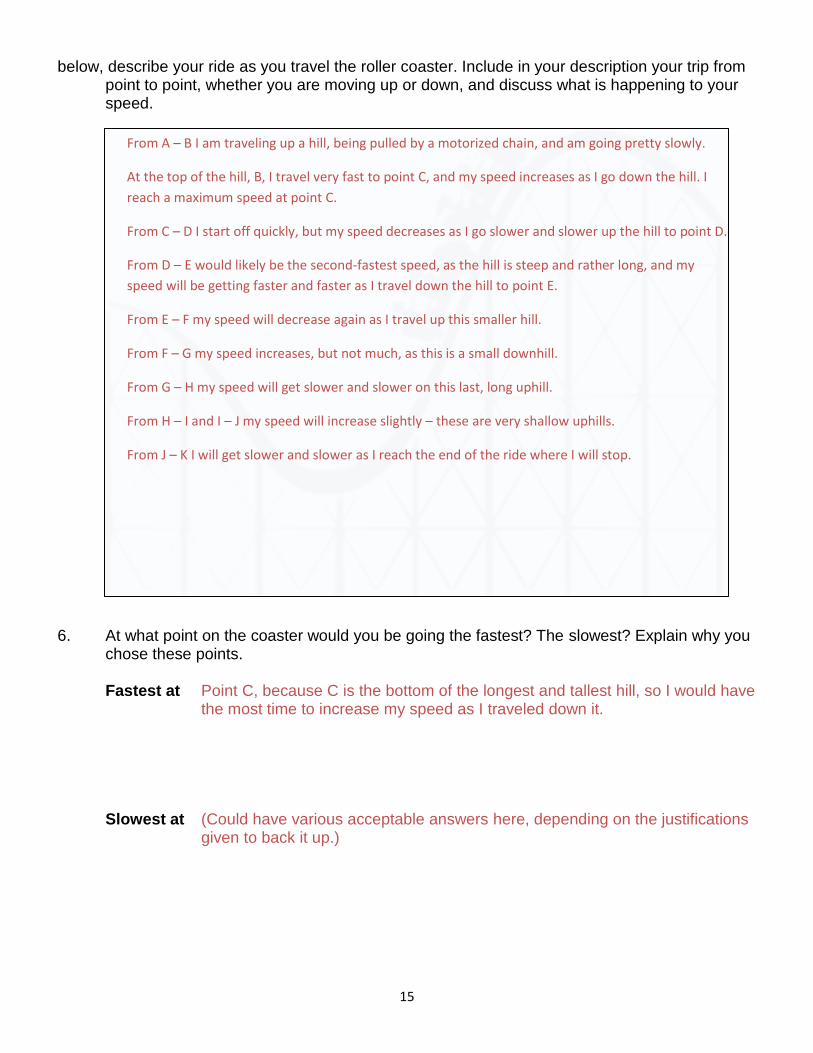
below, describe your ride as you travel the roller coaster. Include in your description your trip from point to point, whether you are moving up or down, and discuss what is happening to your speed.
6. At what point on the coaster would you be going the fastest? The slowest? Explain why you
chose these points.
Fastest at Point C, because C is the bottom of the longest and tallest hill, so I would have the most time to increase my speed as I traveled down it.
Slowest at (Could have various acceptable answers here, depending on the justifications given to back it up.)
From A – B I am traveling up a hill, being pulled by a motorized chain, and am going pretty slowly.
At the top of the hill, B, I travel very fast to point C, and my speed increases as I go down the hill. I
reach a maximum speed at point C.
From C – D I start off quickly, but my speed decreases as I go slower and slower up the hill to point D.
From D – E would likely be the second-fastest speed, as the hill is steep and rather long, and my
speed will be getting faster and faster as I travel down the hill to point E.
From E – F my speed will decrease again as I travel up this smaller hill.
From F – G my speed increases, but not much, as this is a small downhill.
From G – H my speed will get slower and slower on this last, long uphill.
From H – I and I – J my speed will increase slightly – these are very shallow uphills.
From J – K I will get slower and slower as I reach the end of the ride where I will stop.
16
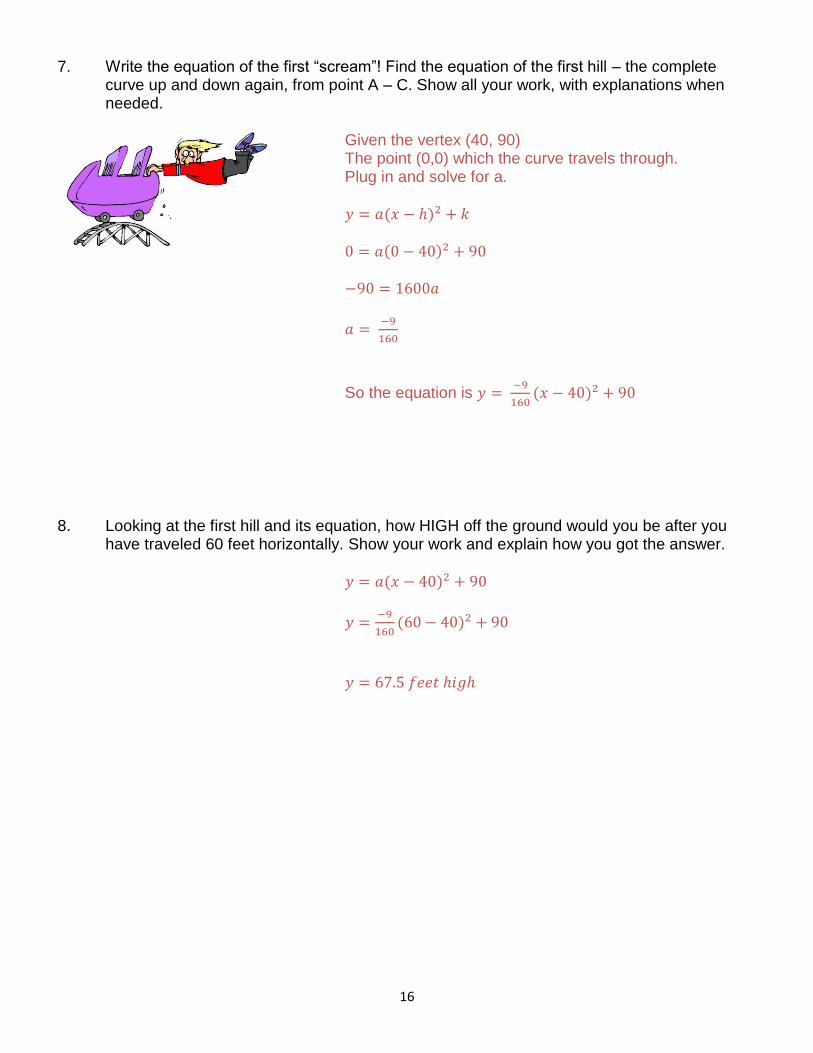
7. Write the equation of the first “scream”! Find the equation of the first hill – the complete curve up and down again, from point A – C. Show all your work, with explanations when needed.
Given the vertex (40, 90) The point (0,0) which the curve travels through. Plug in and solve for a.
𝑦 = 𝑎(𝑥 − ℎ)2 + 𝑘
0 = 𝑎(0 − 40)2 + 90
−90 = 1600𝑎
𝑎 = −9
160
So the equation is 𝑦 = −9
160(𝑥 − 40)2 + 90
8. Looking at the first hill and its equation, how HIGH off the ground would you be after you
have traveled 60 feet horizontally. Show your work and explain how you got the answer.
𝑦 = 𝑎(𝑥 − 40)2 + 90
𝑦 =−9
160(60 − 40)2 + 90
𝑦 = 67.5 𝑓𝑒𝑒𝑡 ℎ𝑖𝑔ℎ
17
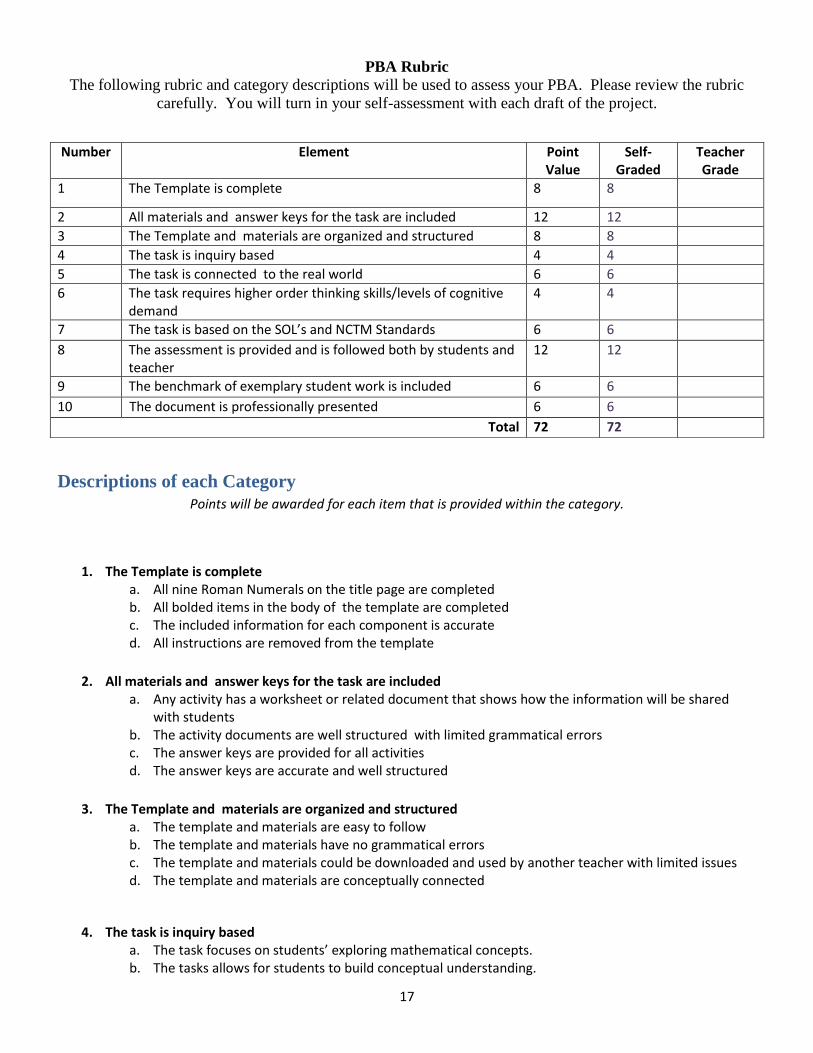
PBA Rubric
The following rubric and category descriptions will be used to assess your PBA. Please review the rubric
carefully. You will turn in your self-assessment with each draft of the project.
Descriptions of each Category
Points will be awarded for each item that is provided within the category.
1. The Template is complete a. All nine Roman Numerals on the title page are completed b. All bolded items in the body of the template are completed c. The included information for each component is accurate d. All instructions are removed from the template
2. All materials and answer keys for the task are included a. Any activity has a worksheet or related document that shows how the information will be shared
with students b. The activity documents are well structured with limited grammatical errors c. The answer keys are provided for all activities d. The answer keys are accurate and well structured
3. The Template and materials are organized and structured a. The template and materials are easy to follow b. The template and materials have no grammatical errors c. The template and materials could be downloaded and used by another teacher with limited issues d. The template and materials are conceptually connected
4. The task is inquiry based a. The task focuses on students’ exploring mathematical concepts. b. The tasks allows for students to build conceptual understanding.
Number Element Point Value
Self-Graded
Teacher Grade
1 The Template is complete 8 8
2 All materials and answer keys for the task are included 12 12
3 The Template and materials are organized and structured 8 8
4 The task is inquiry based 4 4
5 The task is connected to the real world 6 6
6 The task requires higher order thinking skills/levels of cognitive demand
4 4
7 The task is based on the SOL’s and NCTM Standards 6 6
8 The assessment is provided and is followed both by students and teacher
12 12
9 The benchmark of exemplary student work is included 6 6
10 The document is professionally presented 6 6
Total 72 72
18
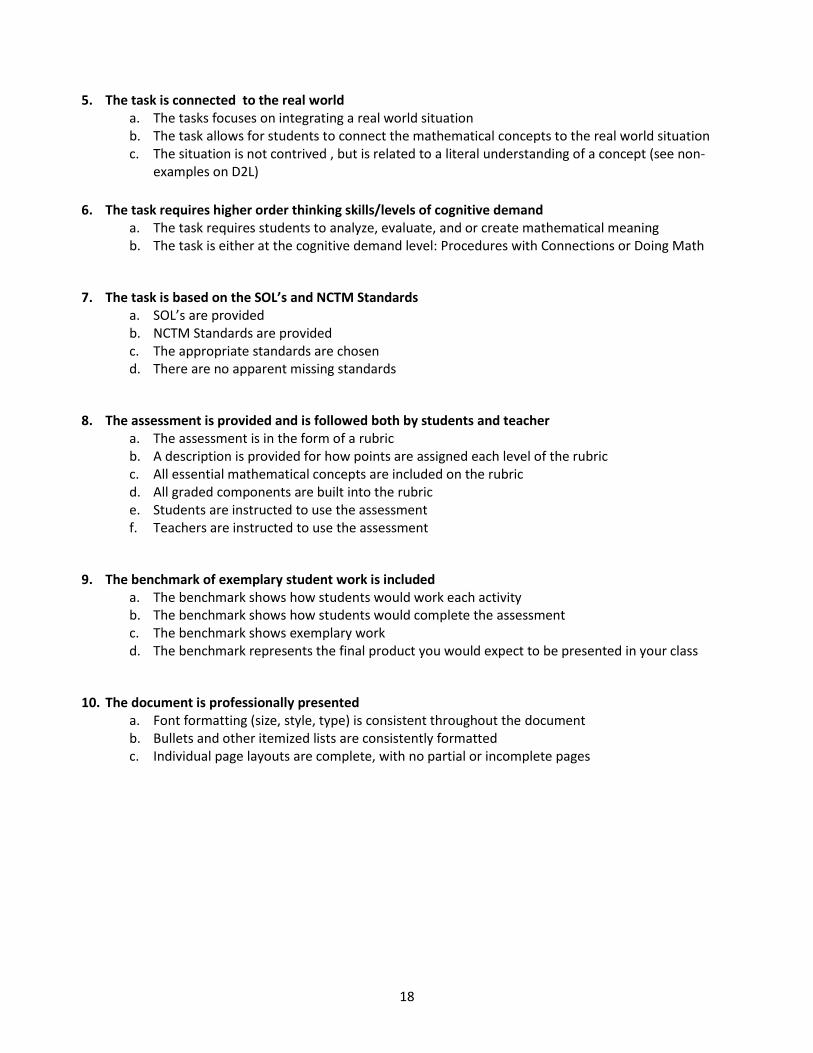
5. The task is connected to the real world a. The tasks focuses on integrating a real world situation b. The task allows for students to connect the mathematical concepts to the real world situation c. The situation is not contrived , but is related to a literal understanding of a concept (see non-
examples on D2L)
6. The task requires higher order thinking skills/levels of cognitive demand a. The task requires students to analyze, evaluate, and or create mathematical meaning b. The task is either at the cognitive demand level: Procedures with Connections or Doing Math
7. The task is based on the SOL’s and NCTM Standards a. SOL’s are provided b. NCTM Standards are provided c. The appropriate standards are chosen d. There are no apparent missing standards
8. The assessment is provided and is followed both by students and teacher a. The assessment is in the form of a rubric b. A description is provided for how points are assigned each level of the rubric c. All essential mathematical concepts are included on the rubric d. All graded components are built into the rubric e. Students are instructed to use the assessment f. Teachers are instructed to use the assessment
9. The benchmark of exemplary student work is included a. The benchmark shows how students would work each activity b. The benchmark shows how students would complete the assessment c. The benchmark shows exemplary work d. The benchmark represents the final product you would expect to be presented in your class
10. The document is professionally presented a. Font formatting (size, style, type) is consistent throughout the document b. Bullets and other itemized lists are consistently formatted c. Individual page layouts are complete, with no partial or incomplete pages