Embed Size (px)
Citation preview

Performance-based design and assessment of critical facilities considering soil-structure interaction
Anastasios SextosProfessor of Earthquake Engineering

Length: 850m (left branch), 640 (right branch) Deck: continuous, box-shaped, prestressed concrete
Curvature: 450m radius (the larger curved bridge in Greece) Number of spans: 10
Maximum pier heightConstruction method: Incremental launching
Foundation: piles
SSI: Large scale numerical modelling

Introduction
q Questionable accuracy
q Intensity or frequency
independent
q limited to the most common
scenarios
Analytical solution of the PDE equations
Direct FEM simulation
Simplified closed form
approximationsq Capable of simulating
complex behaviorq High Computational
Cost
Kwon et al (2008)
Seismic Reliability-Based Design Optimization
Fragility assessment of structures
Presence of soil can have a detrimental impact on the behaviour of a structure.
Khatibinia et al (2015)
FEM method non viable under the framework of:

SSI: Analytical LPM modelling
Direct FEM simulation
Model Order Reduction
computationally viable
q Global Stability IssuesqLimited to Viscous-Elastic Systems
us usReduction of sub soil domain through internal DOF elimination in the
frequency domain
Finite element formulation
Lumped Parameter (LP) modeling Method
Dyn
amic
Stif
fnes
s
Frequency (Hz)
Target IF Real PartTarget IF Imag PartLP approximation Real PartLP approximation Imag Part
Lesgidis, N., Sextos, A.G. and Kwon, O.-S. (2018) “A frequency- and intensity-dependent macroelement for reduced order soil-structure interaction analysis”, Earthquake Engineering and Structural Dynamics (available online, DOI: 10.1002/eqe.3063).

Stability issues in LP method
( ) ( )( )
( ) ( )( ) ( )NNo
NNo
LPLPLPsqsqqspsppS
sQsPSsS
×++×+
×++×+×=×=
++
!
!
1
111
0,0,
LP model represented as a polynomial fraction in the frequency domain:
Polynomial coefficients calibrated for:
Translation to an ODE system (decomposition of polynomial fraction and term by termtranslation to physical components):
Sufficient condition to emulate the Steady state behavior. It will not necessarily lead to an ODE system with stable complementary solutions.
( ) ( )sSsS tarLP =
( ) ( )ååå-+
=
-+
== ÷øöç
èæ +-
-+
÷øöç
èæ +-
-+
-==
2/1
22
2/1
221)(
)( MN
Mi ii
i
i
iMN
Mi ii
M
i i
i
s
q
s
srsq
sQsP
ba
bb
a
ba
a ii
Example of 1st
order term:Example of 2nd
order term:

Use of a predefined LPmodel:
Restriction of usedcomponents on positiveregion through boundconstraints in thecalibration process.
Bridge deck
SLP,ry
SLP,gy
SLP,gx-cx
SLP,gx
SLP,gx-x
SLP,gy-y
Expansion joint gap δy
Bearing Connection System
SLP,z
SLP,cx
SLP,cy
SLP,y
SLP,rx
Expansion joint gap δx
Bearing located after
the gap
SLP,rz
SLP,x
Pier base region:
Abutment-Embankment region:
6x6 dynamic stiffness matrix
9x9 dynamicstiffness matrix
Proposed Stable LP method

Frequency-dependent SSI effect on system fragility
Case Study: investigation of the impact of frequency dependence for different bridge SSI configurations in their fragility.
Pedini Overpass: Bridge PropertiesOverall length 78
Span Arrangement 19.00m -32.00m -19.00m Deck Section box girder, non prismatic
Piers(P1,P2) solid circular section, height : 8.50 m
Abutments ( A1,A2) laying on PTFE pot bearings
Different soil
ScenariosSoil type
S1 Soft ClayS2 Loose SandS3 Medium ClayS4 Medium SandS5 Hard Clay
0
0.5
1
1.5
2
2.5
3
3.5
0 0.5 1 1.5 2
Spec
tral
acc
elar
atio
n/Pg
a
Period T ( sec)
mean Responsespectrummean ± standardDeviation
a/v <0.8
0
0.5
1
1.5
2
2.5
3
3.5
0 0.5 1 1.5 2
Spec
tral
acc
elar
atio
n/Pg
a
Period T ( sec)
0
0.5
1
1.5
2
2.5
3
3.5
0 0.5 1 1.5 2
Spec
tral
acc
elar
atio
n/Pg
a
Period T ( sec)
0.8<a/v <1.2 1.2<a/v
Excitation sets based on the frequency content:
8
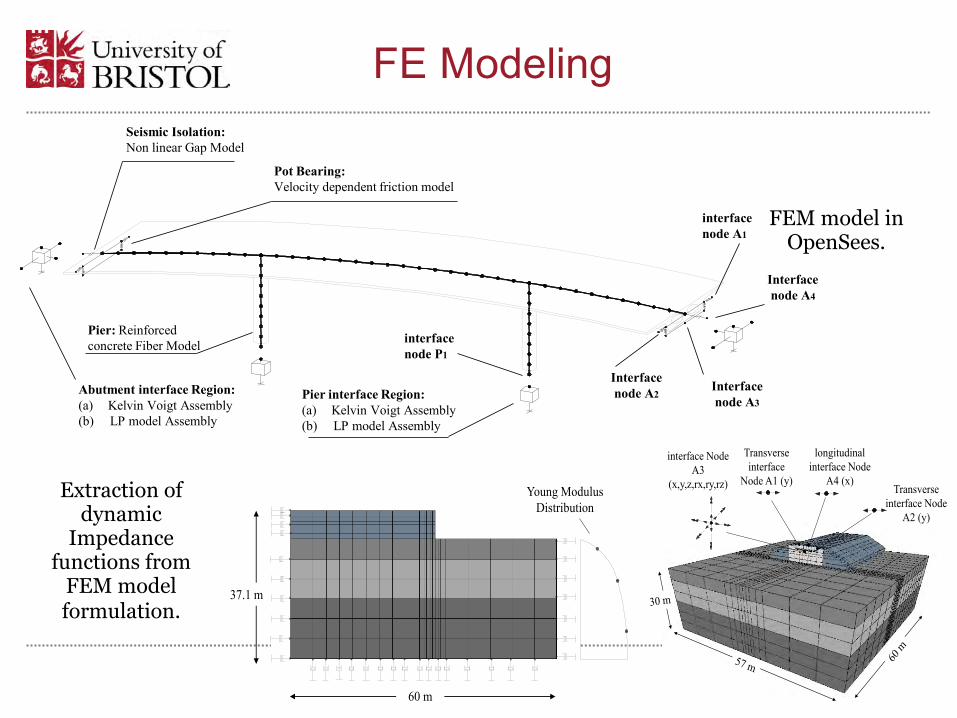
FE Modeling
Pier: Reinforced concrete Fiber Model
Pier interface Region: (a) Kelvin Voigt Assembly (b) LP model Assembly
interface node P1
interface node A1
Interface node A2
Interface node A3
Interface node A4
Pot Bearing: Velocity dependent friction model
Seismic Isolation: Non linear Gap Model
Abutment interface Region: (a) Kelvin Voigt Assembly (b) LP model Assembly
Transverse interface Node
A2 (y)
longitudinal interface Node
A4 (x)
Transverse interface
Node A1 (y)
interface Node A3
(x,y,z,rx,ry,rz) Young Modulus Distribution
60 m
37.1 m
FEM model in OpenSees.
Extraction of dynamic
Impedance functions from
FEM model formulation.

9
Error induced when neglecting frequency-dependence
(a)
m
LS1 -Serviceability
LS3 – Collapse prevention
(b)
m
(c)
m
LS2 – Damage control
Percentage error in probability of reaching threshold limit states:

10
Inelastic LP modeling method
Selection and extraction of representative properties of target dynamic system:
Extraction of Dynamic stiffness matrix for selected variable states in
inelastic range
Extraction of dynamic returning force matrix for selected variable
states in inelastic range

Complementary Component:(M.1): Externally controlled Spring
(M.2):Conventional spring
Base Component:Macroelement
Complementary Component:Conventional Mass
Complementary Component:Conventional Dashpot
( ) compbasebasecompcomp uukF !! ×= ,α
( )nbasebasen
obasebase
n
o
basebasecomp
uif
Unloadingoruif
k
kuk
cαc
cαα
<<
<
ïî
ïí
ì=
T-
T
][
][
,1
,
, !
Frequency- and intensity- dependent LPMs
SSI: Analytical LPM modelling
Lesgidis, N., Sextos, A.G. and Kwon, O.-S. (2018) “A frequency- and intensity-dependent macroelement for reduced order soil-structure interaction analysis”, Earthquake Engineering and Structural Dynamics

-650
-450
-250
-50
150
350
-0.0012 -0.0007 -0.0002 0.0003
Mom
ent M
y (KN
m)
rotation θ (rad)
Fo=800KN
FxMy
Fo
Verification example
d = 1.6m
H=50m
L=6 m
Soil Propeties:fy=100 MPav=0.409E=169090 MPaHo=20000
xm !!×
Sample of Dynamic Properties in the Frequency domain:
0
2
4
6
8
10
12
14
0 2 4 6 8 10 12 14
Dyn
amic
Stif
fnes
s Kx
Rea
l Par
t (K
N/m
)
Frequency (Hz)
Simp. LP method (M.2) vs.2-vs.9Complete LP method (M.1) vs.2-vs.9FEM solution vs.2-vs.9Simp. LP method (M.2) vs.1Complete LP method (M.1) vs.1FEM solution vs.1
0
2
4
6
8
10
12
14
16
18
20
0 2 4 6 8 10 12 14
Dyn
amic
Stif
fnes
s K
x Im
ag P
art (
KN
/m)
Frequency (Hz)
Static Properties Calibration:
-450.0
-350.0
-250.0
-150.0
-50.0
50.0
150.0
250.0
350.0
450.0
-1.5 -1.0 -0.5 0.0 0.5 1.0 1.5
Mom
ent a
t Fou
ndati
on (K
Nm)
Foundation Rotation (mrad)
-80.0
-60.0
-40.0
-20.0
0.0
20.0
40.0
60.0
80.0
-1.5 -1.0 -0.5 0.0 0.5 1.0 1.5
Hor
izon
tal F
orce
at F
ound
atio
n (K
N)
Foundation Displacement (mm)
FEM solutionComplete LP model (M.1)Simp. LP model (M.2)NL Macroelement
Model verification results:

13
High intensity dynamic response (F-d & d(t))
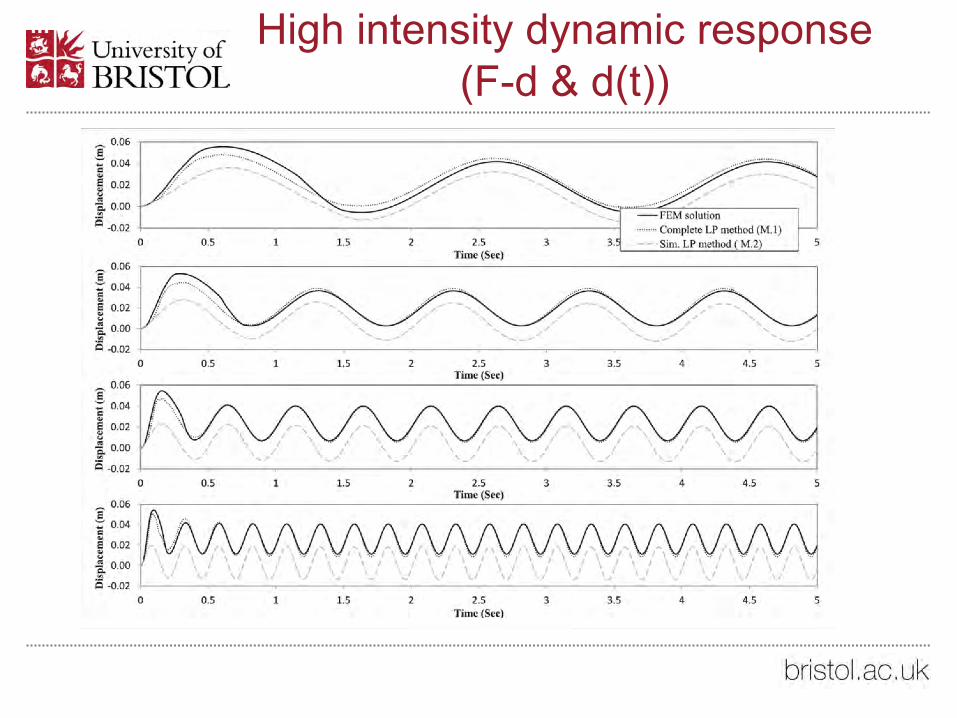
High intensity dynamic response (F-d & d(t))

15
BRAIS: Bridge Risk Assessment Integrated System
•Smooth automations to minimize the time required for pre-processing.
•Expert decision making at every step of the simulation and order reduction process.
•Computationally optimized stochastic sampling procedures for the assessment of the conditional probability failure.
•Ad-hoc developed 3D visualization engine that allows the inspection of the fragility assessment results.

16
Ground Motion Selection Module
Preliminary selection:
Final Selection:
• specific bridge structure (site faults properties
known- M and Re)
• portfolio representative bridge (site faults
properties generated by the system)
Development of greedy search algorithm with constrained scaling

17
Automated FE model construction module
Procedural knowledge Base
Element type selection rules
Mesh refinement selection rules
Constitutive law selection rules
reduced regions selection rules Damage state selection rules
User Interface
Inference Engine
bridge structuredescription
Pier i (a) elements type, (b) mesh Refinement, (c)
constitutive laws.(d)
Span i (a) elements type, (b) mesh Refinement, (c)
constitutive laws (d)
Interconnection regions , (a)Modelling approach (b)
constitutive laws
(a) Line fiber element(b) EDP selection(c) Mesh refinement (d) Constitutive laws
Box section overpass Bridge
(a) Line element(b) Mesh refinement
(a) Bearing model(b) Gap/bounce model(c) EDP selection
Modelling OptionsBridge Description by User
Flow chart of modelling expert system Architecture.
Illustration of Bridge description and Model
generated by the integrated System.

18
Order reduction moduleSuperstructure FEM model
Abutment “B” soil domain FEM model
Abutment “A” soil domain FEM model
Pier Foundation soil domain FEM model
Reduced orderLP models
Order reduction in accordance to previously presented LP methods.
Automated construction of FEM models of subsoil interface
regions.

19
Fragility assessment

SSI: Analytical LPM modelling
-1.20E+00
-1.00E+00
-8.00E-01
-6.00E-01
-4.00E-01
-2.00E-01
0.00E+00
2.00E-01
5 5.2 5.4 5.6 5.8 6 6.2 6.4
Disp
lace
men
t (Nr
omal
ized)
Time (sec)
MeasurementsLP modelWinkler Model

Project objectives
• R&I project implemented via secondments
• Brain circulation between Europe, US, Canada; Academia and Industry
• Have a big structural effect in EU
• Shift from research culture to innovation culture
• Establish sustainable networking
Challenges

Limited EU & US design guidelines for construction and assessment of NG pipelines is seismic areas
• In Eurocodes there is no procedure prescribed as to mitigate seismic risk of NG pipelines
• No means for quick inspection and rehabilitation in case of an earthquake event.
• Guidelines too general (summarized in 4 pages)
• Wave-induced earthquake loading in 2 pages informative Annex based 1967 Newmark method
Challenges

Spatially variable earthquake induced displacements along the pipeline axis are ignored
• Seismic loading is not deemed critical for buried pipelines
• Deformations are not uniform along the pipe length
• (particularly for abruptly changing and/or liquefiable soil profiles)
• Analytical and experimental justification is required
Challenges

Soil-pipeline interaction modeling is simplified
• Only bi-linear, force-displacement relationships, similar to those adopted by
ALA(2001) document in the U.S. are most commonly used
• Challenge is to develop reliable cyclic force-deformation relationships for (a) axial,
(b) transverse horizontal and (c) transverse vertical springs
Challenges

Experimental verification of failure modes is very limited
• Need for reliable laboratory testing of soil-pipe systems
Cross-section distortion (e.g. section ovalization)
Local bucklingAxial strain-rupture
Upheal buckling
Challenges

Empirical fragility assessment of
natural gas pipelines
• Current fragility curves are empirical
based on the Repair Ratio
• Few works on local damage (tension
cracks; local buckling; beam buckling)
• No consideration of spatially variable
ground displacements and soil-pipeline
interaction
• Fragility expressions for the
Metering/Regulating stations linking the
High Pressure Natural Gas Transmission
System to the local Natural Gas
Distribution Network are only empirical.
Challenges

Need for optimal pre-earthquake retrofitChallenges
&
Pre-quake Post-quake
National Research Council (2011) National Earthquake Resilience, Washington, DC
The less vulnerable the critical components (pipeline segments. connections) -> the less the initial functionality loss
The more efficient the post-earthquake mitigation-> the faster the functionality recovery
=f(t)due to aging

Hybrid experimentation on principle failure
modes of the soil-pipeline systemStructure
WP02

SSI: nonlinear numerical modelling
Scenario 1 Scenario 2

SSI: nonlinear numerical modelling
Ux
σyy σyy
Ux
SV- waves
P- waves

tcr
Time-variation of εa,gat the surface of the equivalent-linear site axial displacement (top), vertical displacement
(bottom) at tcr

2( )S ext=F u p
( )( )
( ) ( )
j
Sj j¶D =
¶u
F uu R
u( 1) ( ) ( )j j j+ = + Du u u
3D soil-pipe interaction analysis
x
,g yu
,g xu
40
( );g g crx t=u u
zx
y ( )xu t!!
‘Global’subdomain
‘Local’subdomain
,( ) ( ) ( ) ( )g g g r s r bt t t V u tr+ + =Μu Cu Ku J!! ! !
2D plane strain site response analysis
Instantaneous ground motion X-profiles
tcr whenεg,xx = min
crt t=
crt t=
FirmSoft
SSI: FEM substructuring

Nick Psyrras, PhD student
zx
y
R(mm)
t(mm)
R/t(-)
σy(MPa) P/Py
hemb(m)
εu(%)
450 12 37.5 450 0.63 1000 4
( )0.5 ~ 0.9 tanµ j=(O’Rourke & El Hmadi, 1988)
SSI: nonlinear numerical modelling
Psyrras, N., Gerasimidis, S., Kwon, O-S. & Sextos, A.G. (2018) “Can a buried natural gas pipeline buckle locally during earthquake ground shaking?”, Soil Dynamics and Earthquake Engineering (accepted for publication).

SSI: nonlinear numerical modelling

SSI: probabilistic assessment of geohazards (including seismic risk and loss)
De Risi, R., De Luca, F. Kwon, O.-S., Sextos, A.G. (2018) “Post-earthquake risk assessment for buried gas pipelines at regional scale”, ASCE Journal of Pipeline Systems (accepted for publication).

SSI: experimental investigation (shaking table + shear stack)

SSI: experimental investigation (shaking table + shear stack)
• Modal analysisEmpty: fo,1 = 2.97 Hz (after tuning of rubber stiffness)
Full: fo,1 = 18.03 Hz
Mode 1
Mode 2

SSI: experimental investigation (shaking table + shear stack)
• Minimum required pipe anchorage length
Mode 1Lan = ?
Po
Free pipe ends
tu
ou an o an
u
Pt L P Lt
= Þ =
( )1 2 23
ou
Kt H R Rµg p+æ ö= +ç ÷è ø
hcov
hcov
Exact expression
21 243
oK Rµg +æ ö+ ç ÷è ø
Prototype scale
R
t
P
,maxp p
anL L³,max
4.8 4.8
pp pan
m
LL LnL
= = =!

SSI: experimental investigation (shaking table + shear stack)
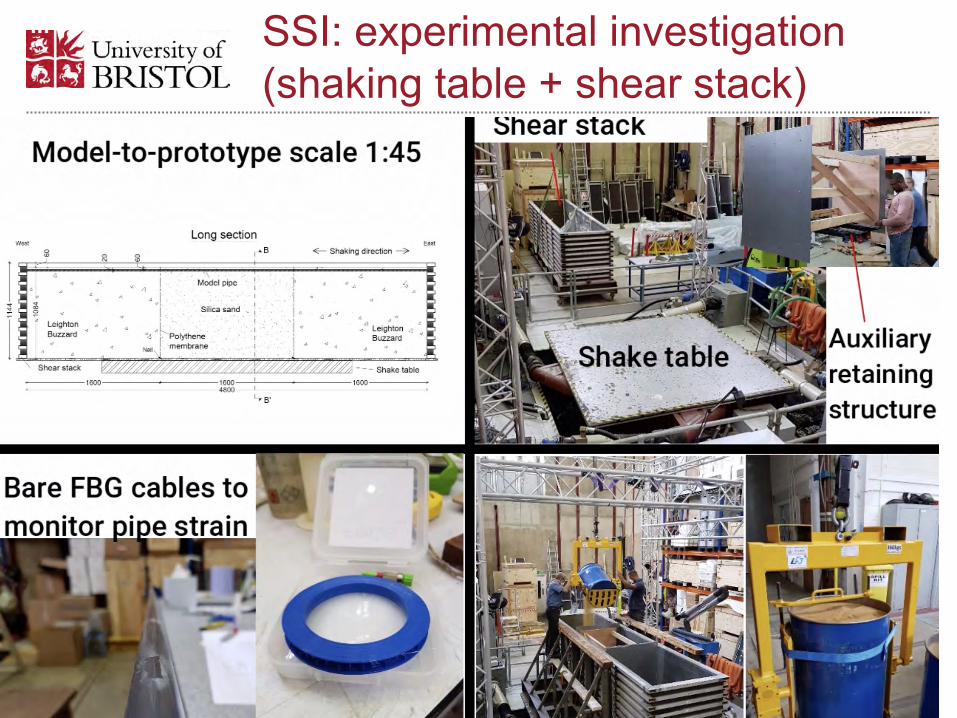
SSI: experimental investigation (shaking table + shear stack)

SSI: experimental investigation (soil isolation)
Nick Alexander, Anastasis Tsiavos, Anastasios Sextos

SSI: hybrid testing
Static DOFDynamic DOFBearing modeled numericallyBearing physically tested
Bousias, S., Sextos, A.G., Kwon, O.-S., Taskari, O., Elnashai, A., Evangeliou, N. and Di Sarno, L. (2017) “Intercontinental Hybrid Simulation for the Assessment of a Three-span R/C Highway Overpass”, Journal of Earthquake Engineering

ConcreteCompressive
Strength fc (MPa) 35
Tensile Strength ft (MPa) 2
Modulus of Elasticity (GPa) 28
Poisson's Ratio 0.2Strain at
compressivestrength
0.0035
Density (kg/m3) 2500Steel
Modulus of Elasticity (GPa) 200
Yield Stress (MPa) 460Density (kg/m3) 7850
SSI: geometrically nonlinear numerical modelling

SSI: FEM substructuring & effect on equipment
Sextos, A.G., Manolis, G.D., Ioannidis, N., Athanasiou, A. (2016) “Seismically induced uplift effects on nuclear power plants. Part I&II: Containment building rocking spectra”, Nuclear Engineering and Design

Sextos, A.G., Manolis, G.D., Ioannidis, N., Athanasiou, A. (2016) “Seismically induced uplift effects on nuclear power plants. Part I&II: Containment building rocking spectra”, Nuclear Engineering and Design
SSI: FEM substructuring & effect on equipment

SSI: geometrically nonlinear numerical modelling

National Soil-Foundation-Structure Interaction Laboratory

UKCRIC has the ambition to build a £500m national research programme, over the next 10 years.
The £12m National Soil-Foundation-Structure Interaction (SoFSI) Facility, is a nationally shared facility to be hosted at the University of Bristol.
SoFSI will be a core component of the Government’s £138m UK Collaboratorium for Research in Infrastructure and Cities (UKCRIC) initiative, which will drive forward the national infrastructure research investments for the next 30 years and beyond.

Earthquake Shaking Table at the existing lab
3m by 3m platform supported by 8 hydraulic actuators that carry up to 15t Acceleration up to 5g with peak displacements of ±150mm