Embed Size (px)
Citation preview
Performance Based Budget
2021-22 to 2023-24
Government of Pakistan
Finance Division
Islamabad
i
Preface
This document has been prepared to comply with the requirement laid down in Section 9 of Public Finance Management
Act, 2019. The medium-term Performance Based Budget which is referred to as the "Green Book" is an endeavor to
specify the purposes i.e. output and outcomes expected to be achieved with funds appropriated by Parliament. The Green
Book provides supplementary information to the details of Demands for Grants and Appropriations, which set out the
details of the Budget by accounting Budget line according to the functional and object classifications of the Chart of
Accounts.
The key elements of Green Book are:
Three-year framework for budgetary planning which lies at the heart of the MTBF reforms. Under this process
ministries make their plans and prepare budgetary estimates for a rolling 3-year budgetary horizon. This includes
the 2021-22 estimates, which are to be appropriated by Parliament, and two additional or "outer" years estimates (in
this case 2022-23 and 2023-24) for planning purposes.
Breakdown of each Ministry's Budget by "Outputs". Outputs represent major lines of service delivery of each ministry.
Each ministry identifies its main lines of service delivery and the costs associated with the delivery of each main line
of service, down to the level of the individual spending unit. This would enable Parliament and other stakeholders to
assess whether value for money in terms of delivery of services is being achieved.
Linkage of service delivery with total budgetary allocations for each Ministry / Division (current and development). As
the government budget is divided between the recurrent budget and development budget, the delivery of outputs and
outcomes requires a combination of allocations through the recurrent budget to meet the operations costs and
development budget to meet cost of expansion of access to services or improvement of the future quality of public
services.
Development of indicators, which should be used for measuring the quantity and quality of services (outputs) to be
delivered. The Green Book also provides targets for the levels of services, which the ministries and divisions are
expecting to achieve. Budgetary preparation based on specified outputs/services, provides a basis for monitoring of
the results expected from public spending.
Identification of outcomes that represent effects of service delivery on the target population. Outcomes are often more
difficult to measure than outputs and are typically measured less frequently.
I hope that this document would be of value in terms of describing the linkage between budgetary allocations and the
public services delivered.
YUSUF KHAN
Secretary to the Government of Pakistan
Finance Division
Islamabad, the 11th June 2021
�
�
�
�
�
ii
Cabinet Secretariat
Ministry of Defence
Ministry of Energy
Ministry of Federal Education, Professional Training, National Heritage & Culture
Cabinet Division
President's Secretariat - Personal
President's Secretariat - Public
Prime Minister's Office (Public)
Prime Minister's Office (Internal)
National Disaster Management Authority
Board of Investment
Prime Minister's Inspection Commission
Naya Pakistan Housing Development Authority
Pakistan Atomic Energy Commission
Pakistan Nuclear Regulatory Authority
Pakistan Space and Upper Atmosphere Research Commission
Establishment Division
Federal Public Service Commission
National School of Public Policy
Civil Services Academy
Poverty Alleviation & Social Safety Division
Benazir Income Support Programme
Pakistan Bait-ul-Mal
Aviation Division
National Security Division
Earthquake Reconstruction and Rehabilitation Authority
Defence Division
Survey of Pakistan
Power Division
Petroleum Division
Federal Education and Professional Training Division
Higher Education Commission
Table of ContentsComposition of this document
Summary of the Medium-Term Budget
v
vii
Detailed Medium-Term Budget Estimates by Services Delivery
Page
1
4
5
6
7
8
10
13
15
17
19
21
23
27
29
31
32
34
36
38
41
43
44
47
51
54
57
59
61
64
66
69
75
Climate Change Division
Commerce Division
Communications Division
Defence Production Division
Economic Affairs Division
iii
Ministry of Finance & Revenue
Ministry of Industries and Production
Ministry of Law and Justice
Ministry of Planning, Development and Special Initiatives
National Vocational and Technical Training Commission
National Heritage and Culture Division
Finance Division
Controller General of Accounts
Revenue Division / Federal Board of Revenue
Auditor General of Pakistan
Industries and Production Division
Financial Action Task Force National FATF Secretariat
Law and Justice Division
Supreme Court of Pakistan
Islamabad High Court
Federal Shariat Court
National Accountability Bureau
Federal Ombudsman Secretariat for protection against harassment of women at workplace
Election Commission of Pakistan
Council of Islamic Ideology
Federal Judicial Academy
Planning, Development and Special Initiatives Division
China Pakistan Economic Corridor Authority
79
81
86
91
94
98
100
102
105
109
114
115
119
122
125
131
134
137
139
141
143
145
147
150
152
153
155
157
160
163
168
172
174
176
180
181
183
187
190
Foreign Affairs Division
Housing and Works Division
Human Rights Division
Information and Broadcasting Division
Information Technology and Telecommunication Division
Inter Provincial Coordination Division
Interior Division
Kashmir Affairs and Gilgit-Baltistan Division
Federal Tax Ombudsman Secretariat
Wafaqi Mohtasib Secretariat
Maritime Affairs Division
Narcotics Control Division
National Food Security and Research Division
National Health Services, Regulations and Coordination Division
Overseas Pakistanis and Human Resource Development Division
Parliamentary Affairs Division
Privatization Division
Railways Division
Religious Affairs and Inter-Faith Harmony Division
Science and Technology Division
iv
National Assembly and The Senate
National Assembly
The Senate
198
200
204
206
States and Frontier Regions Division
Water Resources Division
v
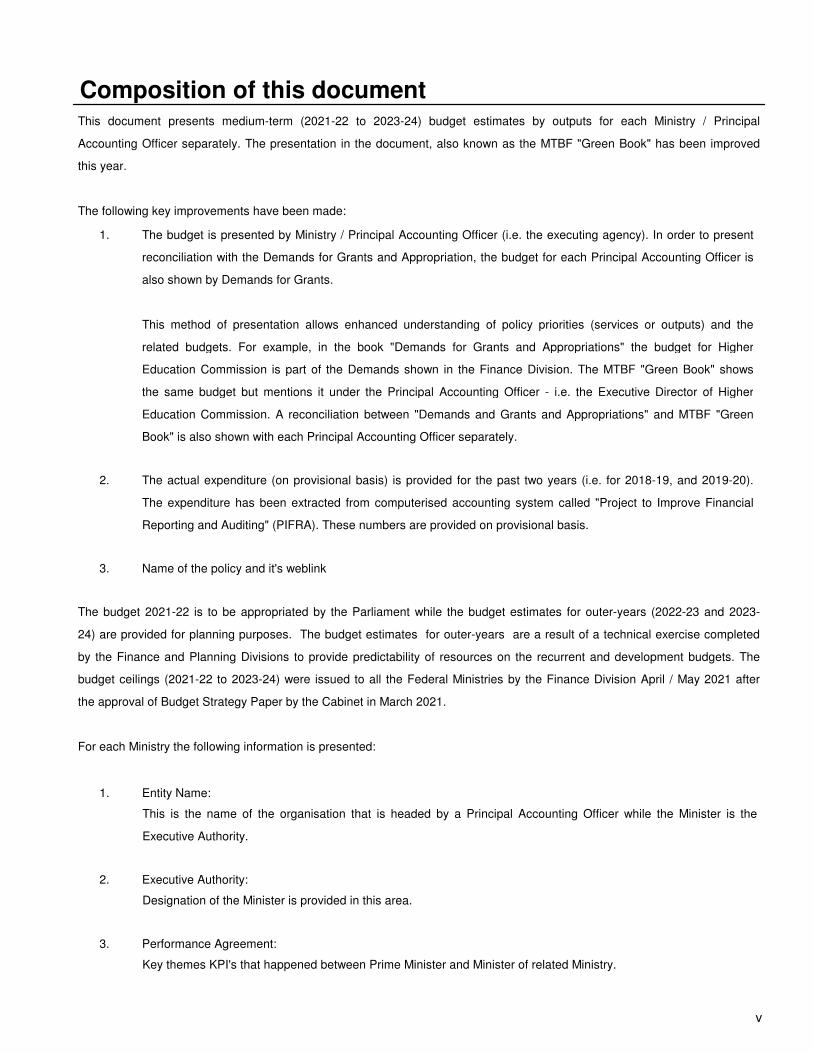
Composition of this documentThis document presents medium-term (2021-22 to 2023-24) budget estimates by outputs for each Ministry / Principal
Accounting Officer separately. The presentation in the document, also known as the MTBF "Green Book" has been improved
this year.
The following key improvements have been made:
The budget 2021-22 is to be appropriated by the Parliament while the budget estimates for outer-years (2022-23 and 2023-
24) are provided for planning purposes. The budget estimates for outer-years are a result of a technical exercise completed
by the Finance and Planning Divisions to provide predictability of resources on the recurrent and development budgets. The
budget ceilings (2021-22 to 2023-24) were issued to all the Federal Ministries by the Finance Division April / May 2021 after
the approval of Budget Strategy Paper by the Cabinet in March 2021.
For each Ministry the following information is presented:
The budget is presented by Ministry / Principal Accounting Officer (i.e. the executing agency). In order to present
reconciliation with the Demands for Grants and Appropriation, the budget for each Principal Accounting Officer is
also shown by Demands for Grants.
This method of presentation allows enhanced understanding of policy priorities (services or outputs) and the
related budgets. For example, in the book "Demands for Grants and Appropriations" the budget for Higher
Education Commission is part of the Demands shown in the Finance Division. The MTBF "Green Book" shows
the same budget but mentions it under the Principal Accounting Officer - i.e. the Executive Director of Higher
Education Commission. A reconciliation between "Demands and Grants and Appropriations" and MTBF "Green
Book" is also shown with each Principal Accounting Officer separately.
The actual expenditure (on provisional basis) is provided for the past two years (i.e. for 2018-19, and 2019-20).
The expenditure has been extracted from computerised accounting system called "Project to Improve Financial
Reporting and Auditing" (PIFRA). These numbers are provided on provisional basis.
Name of the policy and it's weblink
Entity Name:
Executive Authority:
Performance Agreement:
1.
2.
3.
1.
2.
3.
This is the name of the organisation that is headed by a Principal Accounting Officer while the Minister is the
Executive Authority.
Designation of the Minister is provided in this area.
Key themes KPI's that happened between Prime Minister and Minister of related Ministry.
vi
Goal:
Policy Document:
Budget Information:
Performance Indicators and Targets:
4.
5.
6.
7.
A high-level statement providing overall goal of the organisation (Ministry / Division / Principal Accounting Officer)
is included.
Relevant policy document is provided in this section.
In this section actual expenditure, budget, and forecast estimates are provided by:
For each of the Output selected performance indicators and targets are provided in this section.
Outputs-Office Responsible: These are the services delivered by an organisation (Ministry /
Division / Principal
Demands for Grants: Demands for Grants are the method of appropriation. In this section
reconciliation between Demands for Grants and budget by Principal Accounting Officer is provided.
Inputs: These are the line-items - or object classification of the Chart of Accounts.
�
�
�
Please note that the Actual Expenditure shown in this document is based on provisional figures obtained from
the relevant Ministries and Accountant General of Pakistan Revenue (AGPR).
Note
vii
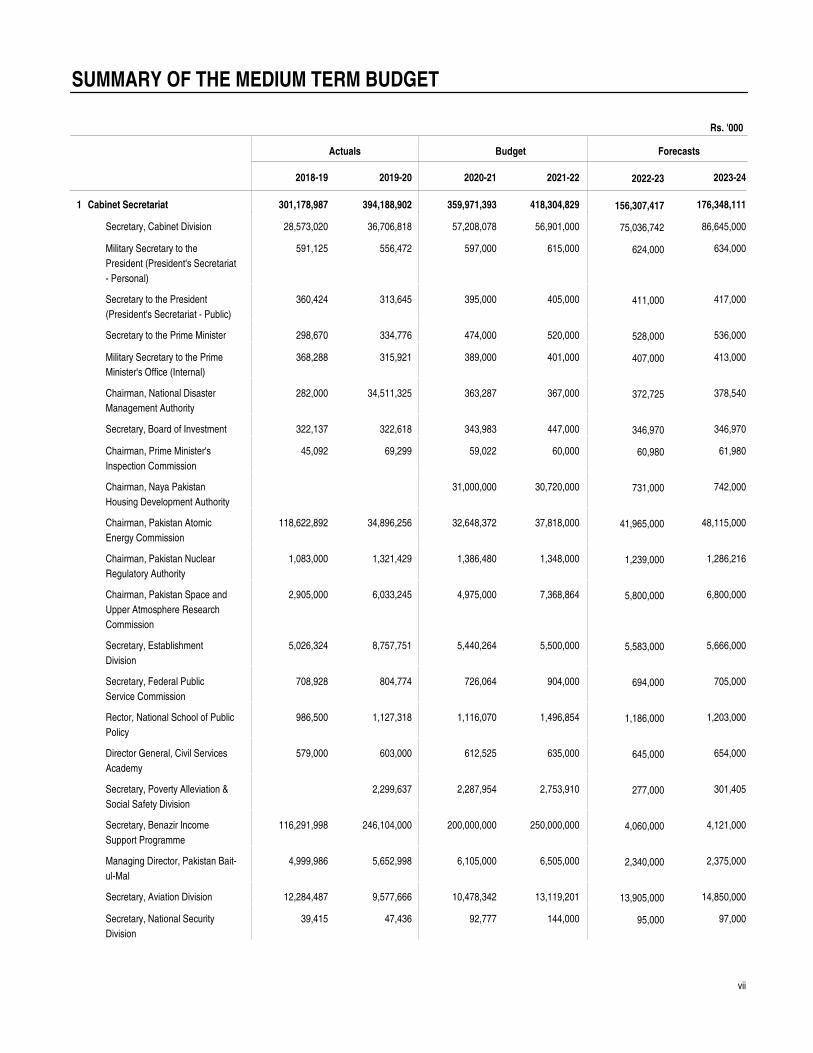
Cabinet Secretariat 301,178,987
SUMMARY OF THE MEDIUM TERM BUDGET
Secretary, Cabinet Division
Military Secretary to the
President (President's Secretariat
- Personal)
Secretary to the President
(President's Secretariat - Public)
Secretary to the Prime Minister
Military Secretary to the Prime
Minister's Office (Internal)
Chairman, National Disaster
Management Authority
Secretary, Board of Investment
Chairman, Prime Minister's
Inspection Commission
Chairman, Naya Pakistan
Housing Development Authority
Chairman, Pakistan Atomic
Energy Commission
Chairman, Pakistan Nuclear
Regulatory Authority
Chairman, Pakistan Space and
Upper Atmosphere Research
Commission
Secretary, Establishment
Division
Secretary, Federal Public
Service Commission
Rector, National School of Public
Policy
Director General, Civil Services
Academy
Secretary, Poverty Alleviation &
Social Safety Division
Secretary, Benazir Income
Support Programme
Managing Director, Pakistan Bait-
ul-Mal
Secretary, Aviation Division
Secretary, National Security
Division
28,573,020
591,125
360,424
298,670
368,288
282,000
322,137
45,092
118,622,892
1,083,000
2,905,000
5,026,324
708,928
986,500
579,000
116,291,998
4,999,986
12,284,487
39,415
36,706,818
556,472
313,645
334,776
315,921
34,511,325
322,618
69,299
34,896,256
1,321,429
6,033,245
8,757,751
804,774
1,127,318
603,000
2,299,637
246,104,000
5,652,998
9,577,666
47,436
57,208,078
597,000
395,000
474,000
389,000
363,287
343,983
59,022
31,000,000
32,648,372
1,386,480
4,975,000
5,440,264
726,064
1,116,070
612,525
2,287,954
200,000,000
6,105,000
10,478,342
92,777
56,901,000
615,000
405,000
520,000
401,000
367,000
447,000
60,000
30,720,000
37,818,000
1,348,000
7,368,864
5,500,000
904,000
1,496,854
635,000
2,753,910
250,000,000
6,505,000
13,119,201
144,000
86,645,000
634,000
417,000
536,000
413,000
378,540
346,970
61,980
742,000
48,115,000
1,286,216
6,800,000
5,666,000
705,000
1,203,000
654,000
301,405
4,121,000
2,375,000
14,850,000
97,000
Rs. '000
1
75,036,742
624,000
411,000
528,000
407,000
372,725
346,970
60,980
731,000
41,965,000
1,239,000
5,800,000
5,583,000
694,000
1,186,000
645,000
277,000
4,060,000
2,340,000
13,905,000
95,000
394,188,902 359,971,393 418,304,829 156,307,417 176,348,111
Actuals Budget Forecasts
2018-19 2019-20 2020-21 2021-22 2022-23 2023-24
viii
Ministry of Climate Change
Ministry of Commerce
Ministry of Communications
Ministry of Defence
Ministry of Defence Production
Ministry of Economic Affairs
Ministry of Energy
Ministry of Federal Education,
Professional Training, National
Heritage & Culture
Ministry of Finance & Revenue
Ministry of Foreign Affairs
Ministry of Housing and Works
Ministry of Human Rights
Ministry of Industries and
Production
943,276
12,752,200
244,768,671
1,193,583,509
3,298,270
1,378,928,424
193,237,451
104,546,355
45,020,859,239
18,913,773
8,040,142
441,721
12,416,079
Chairman, Earthquake
Reconstruction and Rehabilitation
Authority*
Secretary, Defence Division
Surveyor General, Survey of
Pakistan
Secretary, Power Division
Secretary, Petroleum Division
Secretary, Federal Education and
Professional Training Division
Executive Director, Higher
Education Commission
Executive Director, National
Vocational and Technical
Training Commission
Secretary, National Heritage and
Culture Division
Secretary, Finance Division
Controller General of Accounts
Secretary, Revenue Division /
Chairman, Federal Board of
Revenue
Additional Auditor General
Secretary, Industries and
Production Division
6,810,700
1,193,583,509
181,431,499
11,805,952
17,123,751
83,818,719
2,376,000
1,227,886
44,978,602,223
7,907,983
28,778,950
5,570,083
12,416,079
3,832,517
1,222,931,343
286,273,199
64,934,698
17,101,296
93,146,882
928,326
1,402,067
18,759,627,208
7,581,511
126,558,986
5,365,000
45,601,507
3,273,175
1,300,952,037
39,932,040
12,952,133
18,156,422
93,570,000
544,591
1,617,075
14,155,536,737
5,923,620
29,838,496
5,201,291
11,215,460
276,000
1,382,641,635
1,501,969
399,945,047
24,489,540
23,490,000
108,700,000
5,614,000
1,863,926
26,293,014,387
7,720,000
32,902,067
5,952,900
16,547,082
1,382,587,000
523,569,000
2,581,125
17,663,063
109,630,000
7,211,000
1,481,000
29,966,592,636
6,408,000
32,451,000
5,559,000
3,707,000
2
3
4
5
6
7
8
9
10
11
12
13
14
1,362,325,000
567,289,000
2,358,000
17,643,000
103,015,000
6,205,000
1,538,000
26,784,089,636
6,313,000
31,611,000
5,477,000
4,600,847
7,929,713
64,685,579
233,788,790
1,222,931,343
2,347,947
1,788,488,894
351,207,897
112,578,570
18,899,132,705
23,903,243
13,351,185
1,234,224
45,601,507
5,462,824
17,018,320
151,520,666
1,300,952,037
2,220,676
1,963,422,594
52,884,173
113,888,088
14,196,500,144
21,782,902
13,735,733
1,428,184
11,215,460
14,795,000
28,399,500
149,501,322
1,384,143,604
2,694,000
2,056,236,402
424,434,587
139,667,926
26,339,589,354
23,137,000
30,208,005
1,464,200
16,632,082
14,475,000
6,652,000
138,470,000
1,362,325,000
1,632,719
1,606,129,800
569,647,000
128,401,000
26,827,490,636
22,673,000
16,022,000
1,255,000
4,686,847
16,982,000
6,752,000
161,642,000
1,382,587,000
1,818,000
1,062,492,720
526,150,125
135,985,063
30,011,010,636
23,013,000
18,095,000
1,268,400
3,795,000
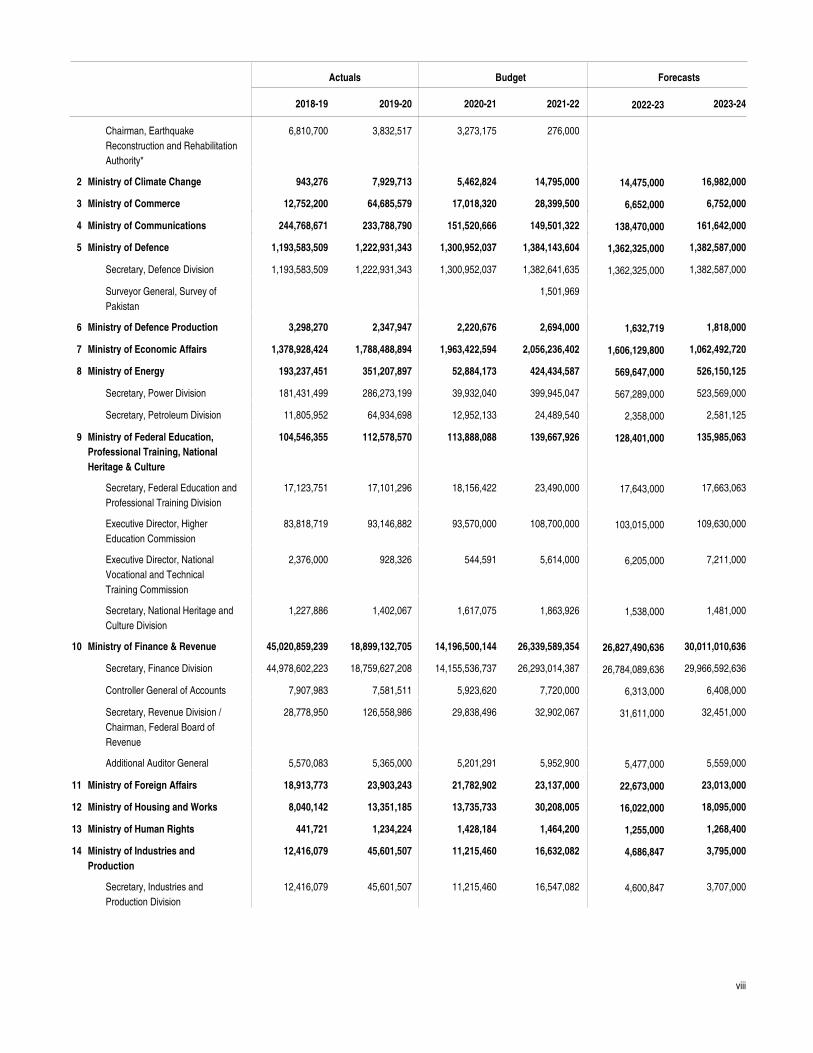
Actuals Budget Forecasts
2018-19 2019-20 2020-21 2021-22 2022-23 2023-24
ix
Ministry of Information and
Broadcasting
Ministry of Information
Technology and
Telecommunication
Ministry of Inter-Provincial
Coordination
Ministry of Interior
Ministry of Kashmir Affairs and
Gilgit-Baltistan
Ministry of Law and Justice
Federal Tax Ombudsman
Secretariat
Wafaqi Mohtasib Secretariat
Ministry of Maritime Affairs
Ministry of Narcotics Control
Ministry of National Food
Security and Research
Ministry of National Health
Services, Regulations and
Coordination
Ministry of Overseas Pakistanis
and Human Resource
Development
Ministry of Parliamentary Affairs
10,444,878
5,855,292
2,238,588
161,143,923
139,734,064
33,407,207
240,603
696,251
1,837,293
2,842,667
24,964,854
21,300,878
3,812,314
331,839
Director General, Financial Action
Task Force National FATF
Secretariat
Secretary, Law and Justice
Division
Registrar, Supreme Court of
Pakistan
Registrar, Islamabad High Court
Registrar, Federal Shariat Court
Chairman, National
Accountability Bureau
Federal Ombudsman, for
protection against harassment of
women at workplace
Secretary, Election Commission
of Pakistan
Chairman, Council of Islamic
Ideology
Director General, Federal Judicial
Academy
4,363,843
1,807,110
962,858
401,109
3,990,456
72,542
21,675,494
133,795
4,948,215
2,014,922
1,110,054
443,872
9,068,067
70,000
4,396,756
141,594
5,314,929
2,443,000
1,313,943
477,384
5,080,805
72,822
3,148,561
138,702
85,000
11,549,351
2,810,000
1,731,000
494,000
5,137,000
77,000
3,827,000
140,000
210,000
88,000
12,128,000
2,895,000
1,784,000
509,000
5,292,000
79,000
3,428,000
144,000
343,375
15
16
17
18
19
20
21
22
23
24
25
26
27
28
86,000
10,919,000
2,852,000
1,757,000
501,000
5,214,000
78,000
3,377,000
142,000
313,586
9,104,259
9,755,896
1,534,968
176,081,253
154,513,573
22,193,479
245,252
710,151
1,365,449
2,830,450
26,402,455
24,832,525
1,394,553
406,118
9,196,593
12,482,608
2,571,608
172,479,640
161,350,072
17,990,146
264,810
793,787
3,841,030
2,948,442
24,879,742
39,695,000
1,559,179
411,533
11,071,683
15,233,056
5,395,736
184,094,715
200,410,903
25,975,351
279,000
837,000
5,651,911
4,023,393
25,135,280
49,796,506
1,626,000
482,000
10,521,400
12,960,000
2,836,000
174,666,951
91,201,916
25,153,586
283,000
850,000
2,120,000
4,248,000
6,159,000
27,775,000
1,651,000
439,000
10,771,400
14,049,000
3,066,135
173,658,993
105,442,000
26,602,375
287,000
862,000
2,336,000
4,378,000
6,252,000
29,024,000
1,676,000
445,000
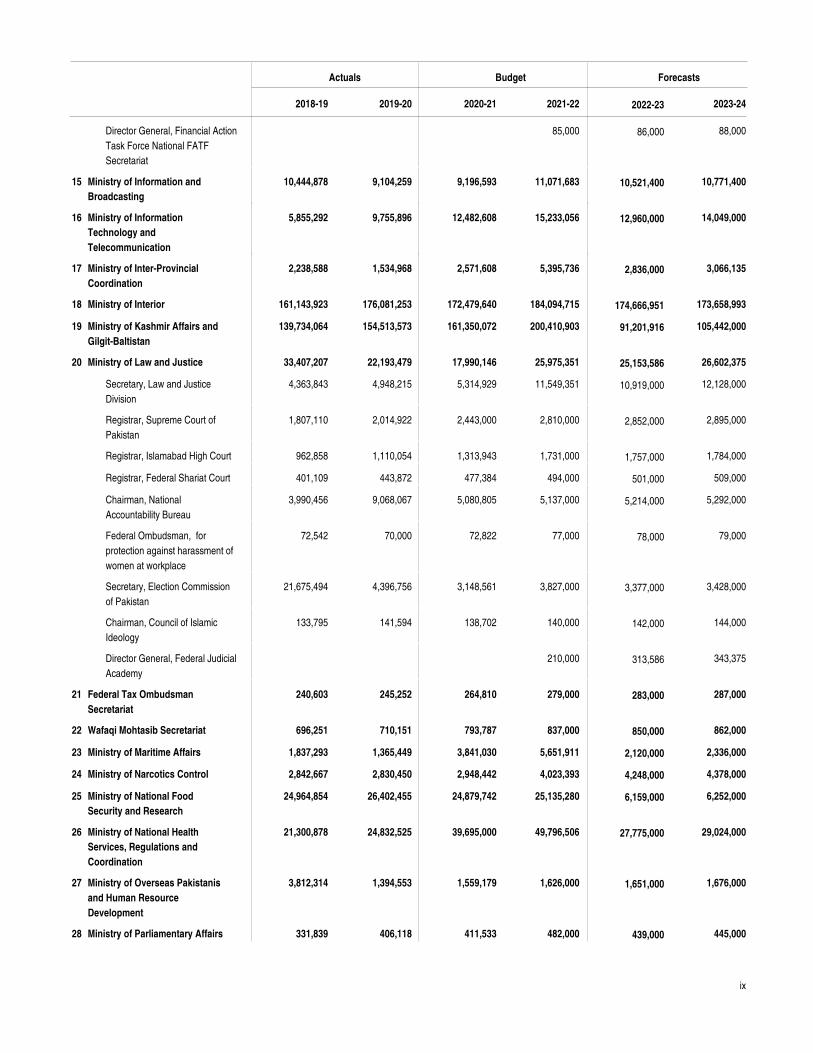
Actuals Budget Forecasts
2018-19 2019-20 2020-21 2021-22 2022-23 2023-24
x
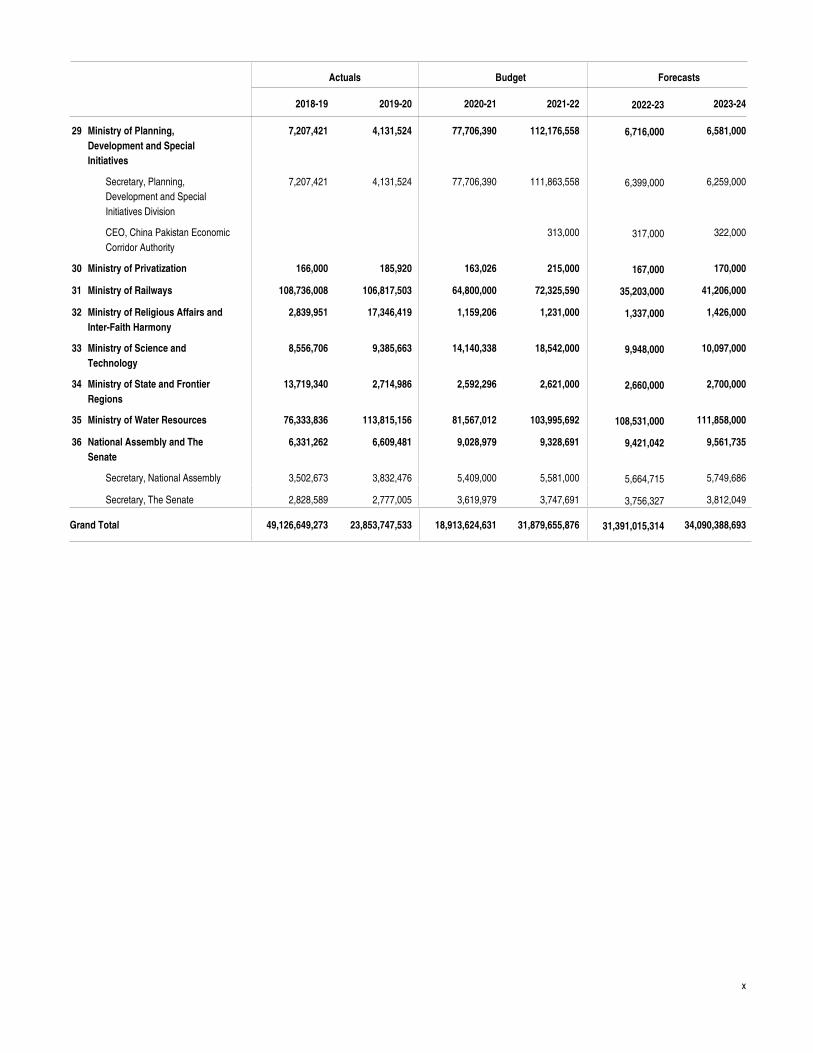
Ministry of Planning,
Development and Special
Initiatives
Ministry of Privatization
Ministry of Railways
Ministry of Religious Affairs and
Inter-Faith Harmony
Ministry of Science and
Technology
Ministry of State and Frontier
Regions
Ministry of Water Resources
National Assembly and The
Senate
7,207,421
166,000
108,736,008
2,839,951
8,556,706
13,719,340
76,333,836
6,331,262
Secretary, Planning,
Development and Special
Initiatives Division
CEO, China Pakistan Economic
Corridor Authority
Secretary, National Assembly
Secretary, The Senate
7,207,421
3,502,673
2,828,589
4,131,524
3,832,476
2,777,005
77,706,390
5,409,000
3,619,979
111,863,558
313,000
5,581,000
3,747,691
6,259,000
322,000
5,749,686
3,812,049
29
30
31
32
33
34
35
36
6,399,000
317,000
5,664,715
3,756,327
4,131,524
185,920
106,817,503
17,346,419
9,385,663
2,714,986
113,815,156
6,609,481
77,706,390
163,026
64,800,000
1,159,206
14,140,338
2,592,296
81,567,012
9,028,979
112,176,558
215,000
72,325,590
1,231,000
18,542,000
2,621,000
103,995,692
9,328,691
6,716,000
167,000
35,203,000
1,337,000
9,948,000
2,660,000
108,531,000
9,421,042
6,581,000
170,000
41,206,000
1,426,000
10,097,000
2,700,000
111,858,000
9,561,735
Actuals Budget Forecasts
2018-19 2019-20 2020-21 2021-22 2022-23 2023-24
49,126,649,273 23,853,747,533 18,913,624,631 31,879,655,876 34,090,388,693 31,391,015,314Grand Total
1Cabinet Secretariat
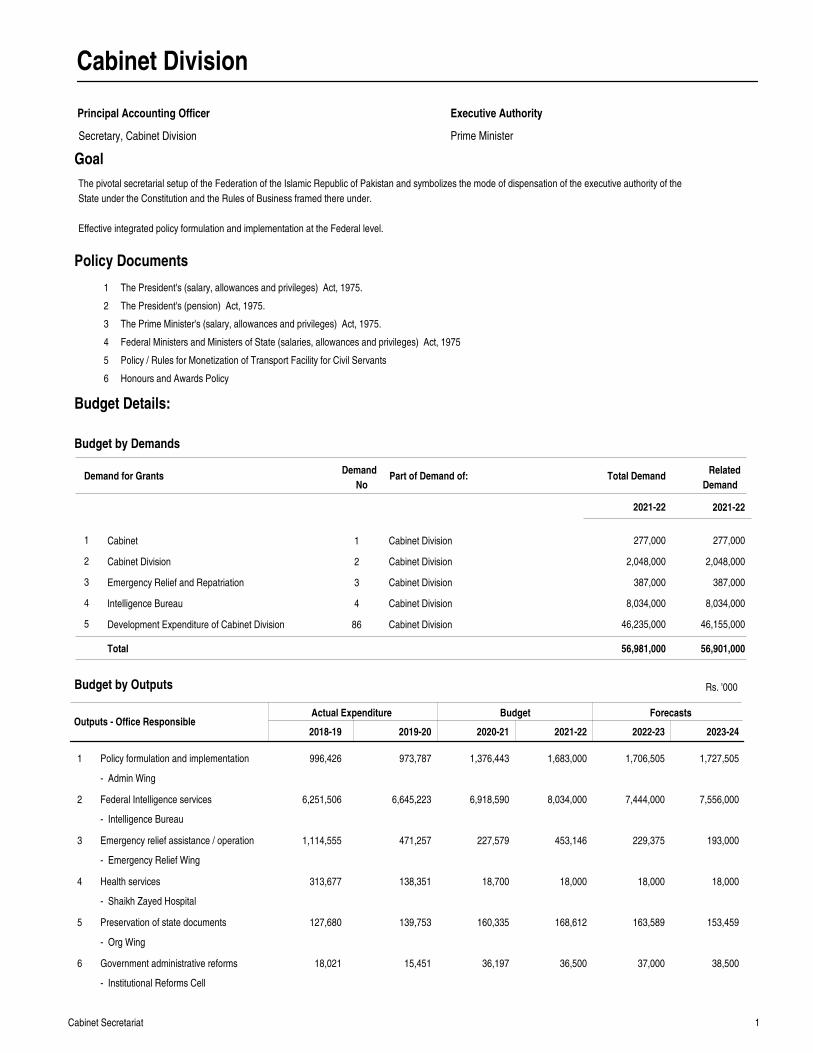
Cabinet Division
Principal Accounting Officer
Prime Minister
Executive Authority
Goal
Outputs - Office ResponsibleActual Expenditure Budget Forecasts
2018-19 2019-20 2020-21 2021-22 2022-23 2023-24
Policy formulation and implementation
Federal Intelligence services
Emergency relief assistance / operation
Health services
Preservation of state documents
Government administrative reforms
996,426
6,251,506
1,114,555
313,677
127,680
18,021
973,787
6,645,223
471,257
138,351
139,753
15,451
1,376,443
6,918,590
227,579
18,700
160,335
36,197
1,683,000
8,034,000
453,146
18,000
168,612
36,500
1,706,505
7,444,000
229,375
18,000
163,589
37,000
1,727,505
7,556,000
193,000
18,000
153,459
38,500
1
2
3
4
5
6
Rs. '000
Cabinet
Cabinet Division
Emergency Relief and Repatriation
Intelligence Bureau
Development Expenditure of Cabinet Division
1
2
3
4
5
1
2
3
4
86
Cabinet Division
Cabinet Division
Cabinet Division
Cabinet Division
Cabinet Division
277,000
2,048,000
387,000
8,034,000
46,235,000
277,000
2,048,000
387,000
8,034,000
46,155,000
Demand for GrantsDemand
NoPart of Demand of: Total Demand
2021-22
56,981,000 56,901,000Total
1
2
3
4
5
6
The President's (salary, allowances and privileges) Act, 1975.
The President's (pension) Act, 1975.
The Prime Minister's (salary, allowances and privileges) Act, 1975.
Federal Ministers and Ministers of State (salaries, allowances and privileges) Act, 1975
Policy / Rules for Monetization of Transport Facility for Civil Servants
Honours and Awards Policy
Policy Documents
Budget by Outputs
Budget by Demands
The pivotal secretarial setup of the Federation of the Islamic Republic of Pakistan and symbolizes the mode of dispensation of the executive authority of the
State under the Constitution and the Rules of Business framed there under.
Effective integrated policy formulation and implementation at the Federal level.
Secretary, Cabinet Division
Budget Details:
- Admin Wing
- Intelligence Bureau
- Emergency Relief Wing
- Shaikh Zayed Hospital
- Org Wing
- Institutional Reforms Cell
2021-22
Related
Demand
2Cabinet Secretariat
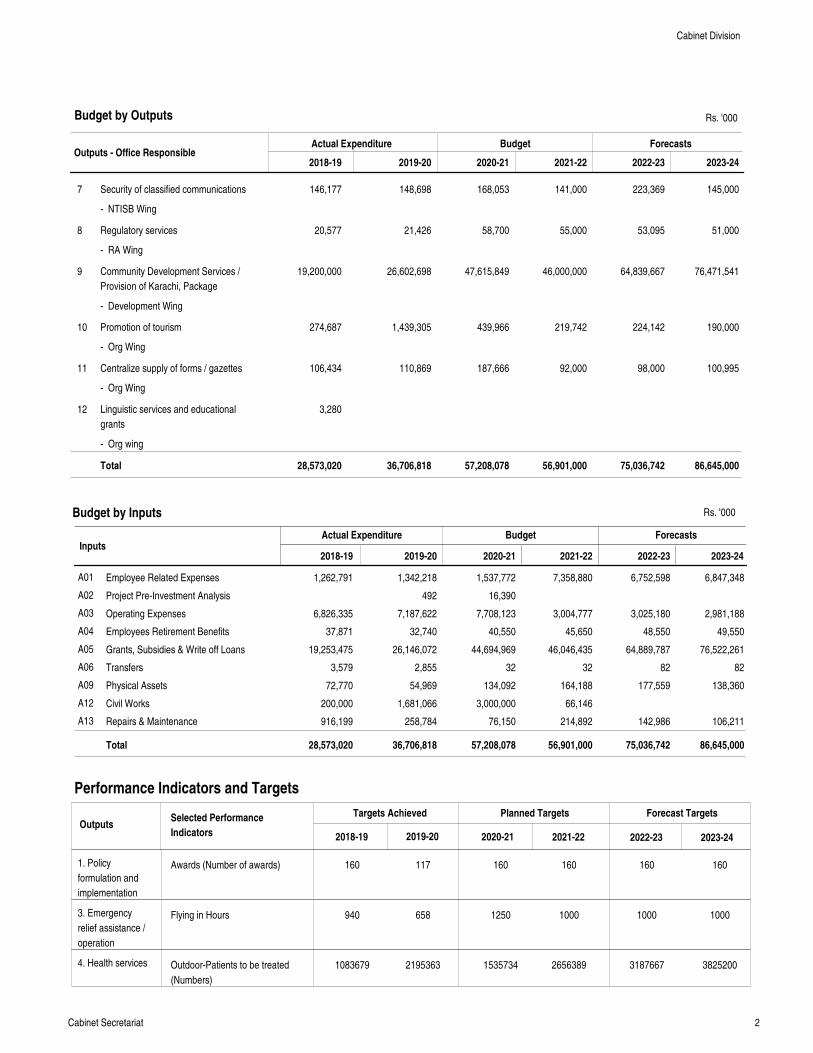
Outputs - Office ResponsibleActual Expenditure Budget Forecasts
2018-19 2019-20 2020-21 2021-22 2022-23 2023-24
Security of classified communications
Regulatory services
Community Development Services /
Provision of Karachi, Package
Promotion of tourism
Centralize supply of forms / gazettes
Linguistic services and educational
grants
146,177
20,577
19,200,000
274,687
106,434
3,280
148,698
21,426
26,602,698
1,439,305
110,869
168,053
58,700
47,615,849
439,966
187,666
141,000
55,000
46,000,000
219,742
92,000
223,369
53,095
64,839,667
224,142
98,000
145,000
51,000
76,471,541
190,000
100,995
7
8
9
10
11
12
Total 28,573,020 36,706,818 57,208,078 56,901,000 75,036,742 86,645,000
Rs. '000
InputsActual Expenditure Budget Forecasts
Employee Related Expenses
Project Pre-Investment Analysis
Operating Expenses
Employees Retirement Benefits
Grants, Subsidies & Write off Loans
Transfers
Physical Assets
Civil Works
Repairs & Maintenance
1,262,791
6,826,335
37,871
19,253,475
3,579
72,770
200,000
916,199
1,342,218
492
7,187,622
32,740
26,146,072
2,855
54,969
1,681,066
258,784
1,537,772
16,390
7,708,123
40,550
44,694,969
32
134,092
3,000,000
76,150
7,358,880
3,004,777
45,650
46,046,435
32
164,188
66,146
214,892
6,752,598
3,025,180
48,550
64,889,787
82
177,559
142,986
6,847,348
2,981,188
49,550
76,522,261
82
138,360
106,211
A01
A02
A03
A04
A05
A06
A09
A12
A13
Total 28,573,020 36,706,818 57,208,078 56,901,000 75,036,742 86,645,000
2018-19 2019-20 2020-21 2021-22 2022-23 2023-24
Performance Indicators and Targets
OutputsTargets Achieved Planned Targets Forecast Targets
2018-19 2019-20 2020-21 2021-22 2022-23 2023-24
Selected Performance
Indicators
1. Policy
formulation and
implementation
3. Emergency
relief assistance /
operation
4. Health services
Budget by Outputs
Budget by Inputs
Awards (Number of awards)
Flying in Hours
Outdoor-Patients to be treated
(Numbers)
160
940
1083679
117
658
2195363
160
1250
1535734
160
1000
2656389
160
1000
3187667
160
1000
3825200
Cabinet Division
- NTISB Wing
- RA Wing
- Development Wing
- Org Wing
- Org Wing
- Org wing
Rs. '000
3Cabinet Secretariat
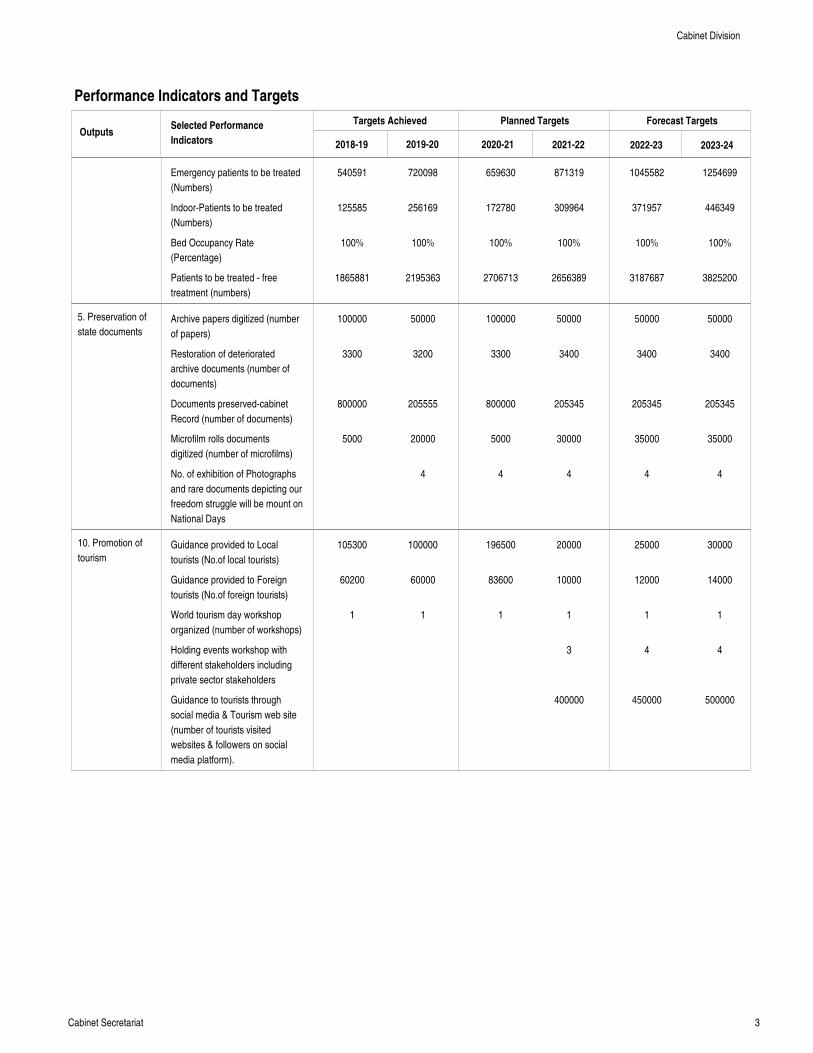
Performance Indicators and Targets
OutputsTargets Achieved Planned Targets Forecast Targets
2018-19 2019-20 2020-21 2021-22 2022-23 2023-24
Selected Performance
Indicators
5. Preservation of
state documents
10. Promotion of
tourism
Emergency patients to be treated
(Numbers)
Indoor-Patients to be treated
(Numbers)
Bed Occupancy Rate
(Percentage)
Patients to be treated - free
treatment (numbers)
Archive papers digitized (number
of papers)
Restoration of deteriorated
archive documents (number of
documents)
Documents preserved-cabinet
Record (number of documents)
Microfilm rolls documents
digitized (number of microfilms)
No. of exhibition of Photographs
and rare documents depicting our
freedom struggle will be mount on
National Days
Guidance provided to Local
tourists (No.of local tourists)
Guidance provided to Foreign
tourists (No.of foreign tourists)
World tourism day workshop
organized (number of workshops)
Holding events workshop with
different stakeholders including
private sector stakeholders
Guidance to tourists through
social media & Tourism web site
(number of tourists visited
websites & followers on social
media platform).
540591
125585
100%
1865881
100000
3300
800000
5000
105300
60200
1
720098
256169
100%
2195363
50000
3200
205555
20000
4
100000
60000
1
659630
172780
100%
2706713
100000
3300
800000
5000
4
196500
83600
1
871319
309964
100%
2656389
50000
3400
205345
30000
4
20000
10000
1
3
400000
1045582
371957
100%
3187687
50000
3400
205345
35000
4
25000
12000
1
4
450000
1254699
446349
100%
3825200
50000
3400
205345
35000
4
30000
14000
1
4
500000
Cabinet Division
4Cabinet Secretariat
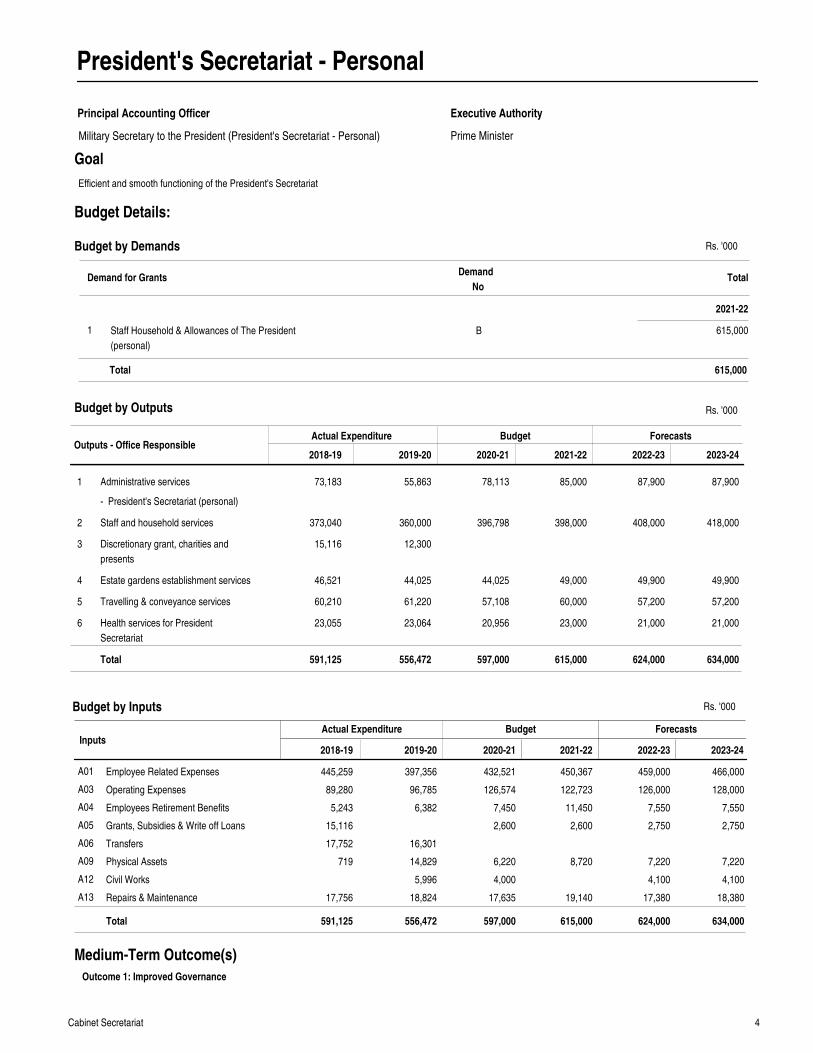
President's Secretariat - Personal
Principal Accounting Officer
Prime Minister
Executive Authority
Goal
Outputs - Office ResponsibleActual Expenditure Budget Forecasts
2018-19 2019-20 2020-21 2021-22 2022-23 2023-24
Administrative services
Staff and household services
Discretionary grant, charities and
presents
Estate gardens establishment services
Travelling & conveyance services
Health services for President
Secretariat
73,183
373,040
15,116
46,521
60,210
23,055
55,863
360,000
12,300
44,025
61,220
23,064
78,113
396,798
44,025
57,108
20,956
85,000
398,000
49,000
60,000
23,000
87,900
408,000
49,900
57,200
21,000
87,900
418,000
49,900
57,200
21,000
1
2
3
4
5
6
Total 591,125 556,472 597,000 615,000 624,000 634,000
Rs. '000
InputsActual Expenditure Budget Forecasts
Employee Related Expenses
Operating Expenses
Employees Retirement Benefits
Grants, Subsidies & Write off Loans
Transfers
Physical Assets
Civil Works
Repairs & Maintenance
445,259
89,280
5,243
15,116
17,752
719
17,756
397,356
96,785
6,382
16,301
14,829
5,996
18,824
432,521
126,574
7,450
2,600
6,220
4,000
17,635
450,367
122,723
11,450
2,600
8,720
19,140
459,000
126,000
7,550
2,750
7,220
4,100
17,380
466,000
128,000
7,550
2,750
7,220
4,100
18,380
A01
A03
A04
A05
A06
A09
A12
A13
Total 591,125 556,472 597,000 615,000 624,000 634,000
2018-19 2019-20 2020-21 2021-22 2022-23 2023-24
Medium-Term Outcome(s)
Outcome 1: Improved Governance
Budget by Outputs
Budget by Inputs
Efficient and smooth functioning of the President's Secretariat
Demand for GrantsDemand
NoTotal
2021-22
Budget by Demands
Staff Household & Allowances of The President
(personal)
1 B 615,000
615,000Total
Military Secretary to the President (President's Secretariat - Personal)
Budget Details:
- President's Secretariat (personal)
Rs. '000
Rs. '000
5Cabinet Secretariat
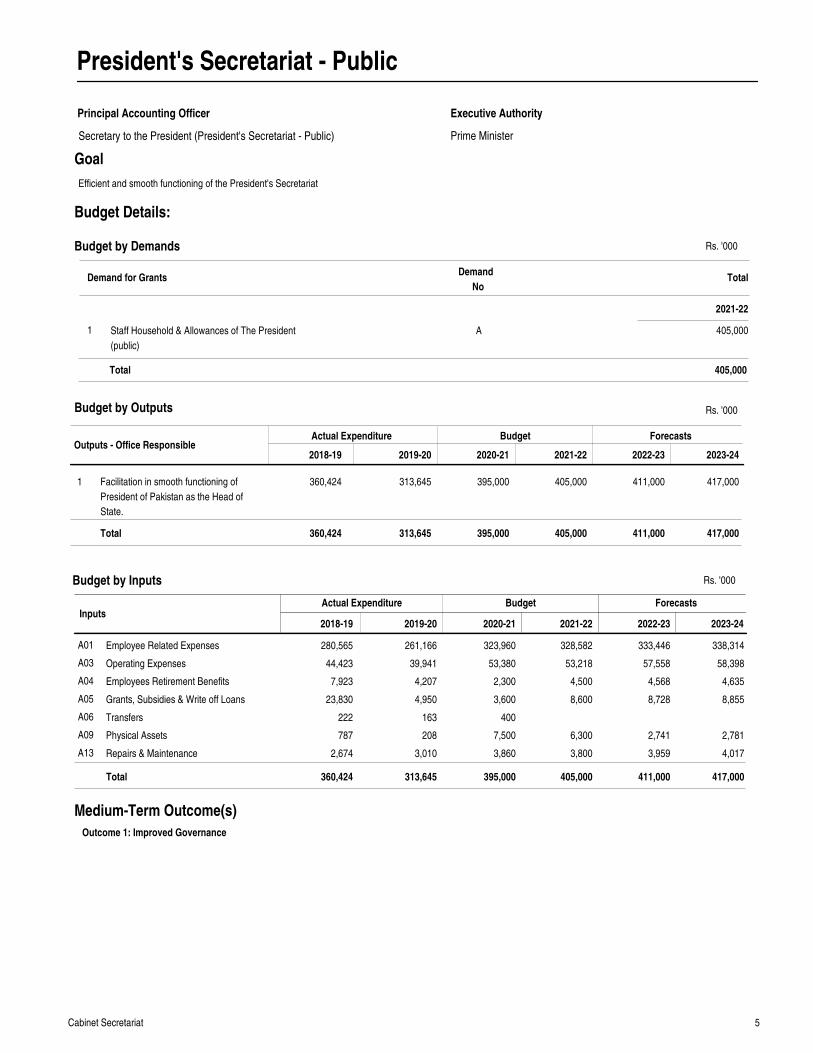
President's Secretariat - Public
Principal Accounting Officer
Prime Minister
Executive Authority
Goal
Outputs - Office ResponsibleActual Expenditure Budget Forecasts
2018-19 2019-20 2020-21 2021-22 2022-23 2023-24
Facilitation in smooth functioning of
President of Pakistan as the Head of
State.
360,424 313,645 395,000 405,000 411,000 417,0001
Total 360,424 313,645 395,000 405,000 411,000 417,000
Rs. '000
InputsActual Expenditure Budget Forecasts
Employee Related Expenses
Operating Expenses
Employees Retirement Benefits
Grants, Subsidies & Write off Loans
Transfers
Physical Assets
Repairs & Maintenance
280,565
44,423
7,923
23,830
222
787
2,674
261,166
39,941
4,207
4,950
163
208
3,010
323,960
53,380
2,300
3,600
400
7,500
3,860
328,582
53,218
4,500
8,600
6,300
3,800
333,446
57,558
4,568
8,728
2,741
3,959
338,314
58,398
4,635
8,855
2,781
4,017
A01
A03
A04
A05
A06
A09
A13
Total 360,424 313,645 395,000 405,000 411,000 417,000
2018-19 2019-20 2020-21 2021-22 2022-23 2023-24
Medium-Term Outcome(s)
Outcome 1: Improved Governance
Budget by Outputs
Budget by Inputs
Efficient and smooth functioning of the President's Secretariat
Demand for GrantsDemand
NoTotal
2021-22
Budget by Demands
Staff Household & Allowances of The President
(public)
1 A 405,000
405,000Total
Secretary to the President (President's Secretariat - Public)
Budget Details:
Rs. '000
Rs. '000
6Cabinet Secretariat
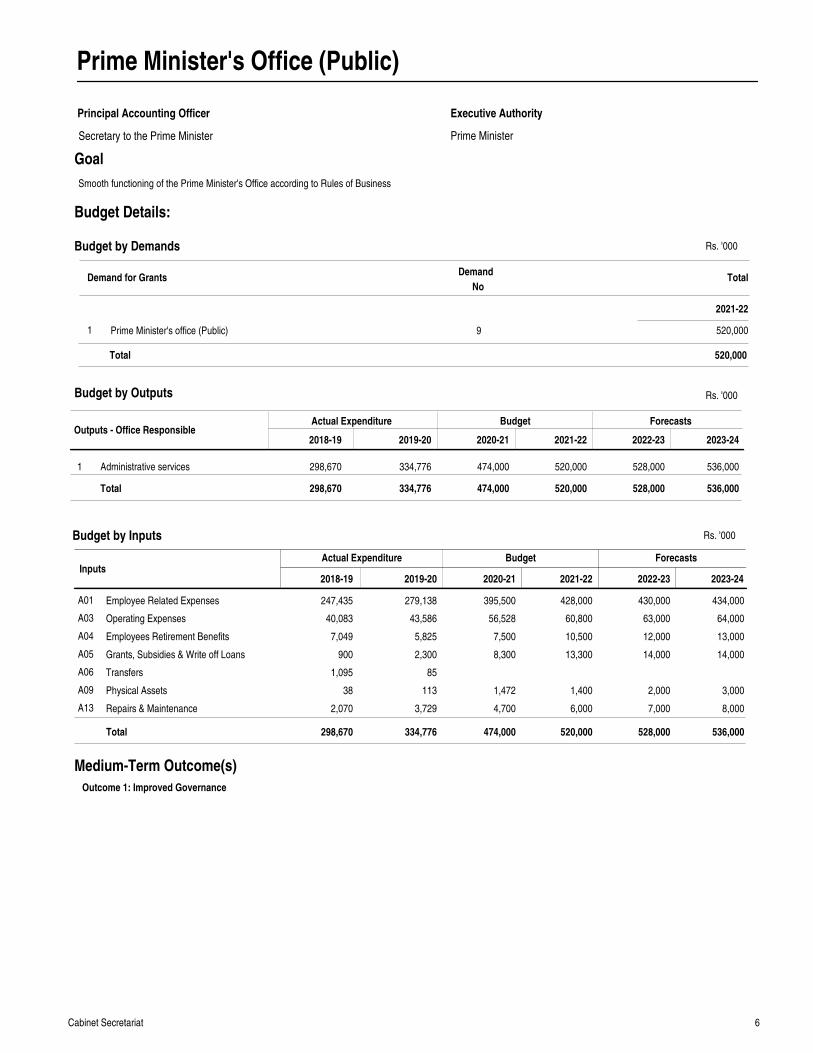
Prime Minister's Office (Public)
Principal Accounting Officer
Prime Minister
Executive Authority
Goal
Outputs - Office ResponsibleActual Expenditure Budget Forecasts
2018-19 2019-20 2020-21 2021-22 2022-23 2023-24
Administrative services 298,670 334,776 474,000 520,000 528,000 536,0001
Total 298,670 334,776 474,000 520,000 528,000 536,000
Rs. '000
InputsActual Expenditure Budget Forecasts
Employee Related Expenses
Operating Expenses
Employees Retirement Benefits
Grants, Subsidies & Write off Loans
Transfers
Physical Assets
Repairs & Maintenance
247,435
40,083
7,049
900
1,095
38
2,070
279,138
43,586
5,825
2,300
85
113
3,729
395,500
56,528
7,500
8,300
1,472
4,700
428,000
60,800
10,500
13,300
1,400
6,000
430,000
63,000
12,000
14,000
2,000
7,000
434,000
64,000
13,000
14,000
3,000
8,000
A01
A03
A04
A05
A06
A09
A13
Total 298,670 334,776 474,000 520,000 528,000 536,000
2018-19 2019-20 2020-21 2021-22 2022-23 2023-24
Medium-Term Outcome(s)
Outcome 1: Improved Governance
Budget by Outputs
Budget by Inputs
Smooth functioning of the Prime Minister's Office according to Rules of Business
Demand for GrantsDemand
NoTotal
2021-22
Budget by Demands
Prime Minister's office (Public)1 9 520,000
520,000Total
Secretary to the Prime Minister
Budget Details:
Rs. '000
Rs. '000
7Cabinet Secretariat
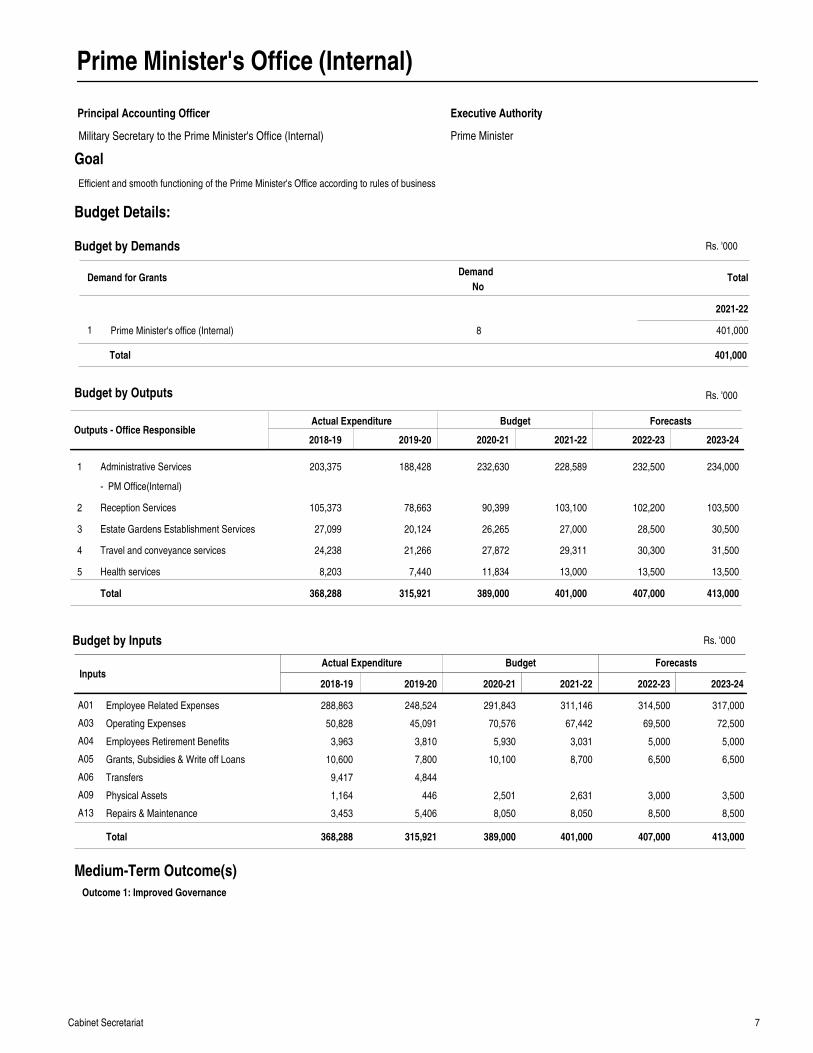
Prime Minister's Office (Internal)
Principal Accounting Officer
Prime Minister
Executive Authority
Goal
Outputs - Office ResponsibleActual Expenditure Budget Forecasts
2018-19 2019-20 2020-21 2021-22 2022-23 2023-24
Administrative Services
Reception Services
Estate Gardens Establishment Services
Travel and conveyance services
Health services
203,375
105,373
27,099
24,238
8,203
188,428
78,663
20,124
21,266
7,440
232,630
90,399
26,265
27,872
11,834
228,589
103,100
27,000
29,311
13,000
232,500
102,200
28,500
30,300
13,500
234,000
103,500
30,500
31,500
13,500
1
2
3
4
5
Total 368,288 315,921 389,000 401,000 407,000 413,000
Rs. '000
InputsActual Expenditure Budget Forecasts
Employee Related Expenses
Operating Expenses
Employees Retirement Benefits
Grants, Subsidies & Write off Loans
Transfers
Physical Assets
Repairs & Maintenance
288,863
50,828
3,963
10,600
9,417
1,164
3,453
248,524
45,091
3,810
7,800
4,844
446
5,406
291,843
70,576
5,930
10,100
2,501
8,050
311,146
67,442
3,031
8,700
2,631
8,050
314,500
69,500
5,000
6,500
3,000
8,500
317,000
72,500
5,000
6,500
3,500
8,500
A01
A03
A04
A05
A06
A09
A13
Total 368,288 315,921 389,000 401,000 407,000 413,000
2018-19 2019-20 2020-21 2021-22 2022-23 2023-24
Medium-Term Outcome(s)
Outcome 1: Improved Governance
Budget by Outputs
Budget by Inputs
Efficient and smooth functioning of the Prime Minister's Office according to rules of business
Demand for GrantsDemand
NoTotal
2021-22
Budget by Demands
Prime Minister's office (Internal)1 8 401,000
401,000Total
Military Secretary to the Prime Minister's Office (Internal)
Budget Details:
- PM Office(Internal)
Rs. '000
Rs. '000
8Cabinet Secretariat
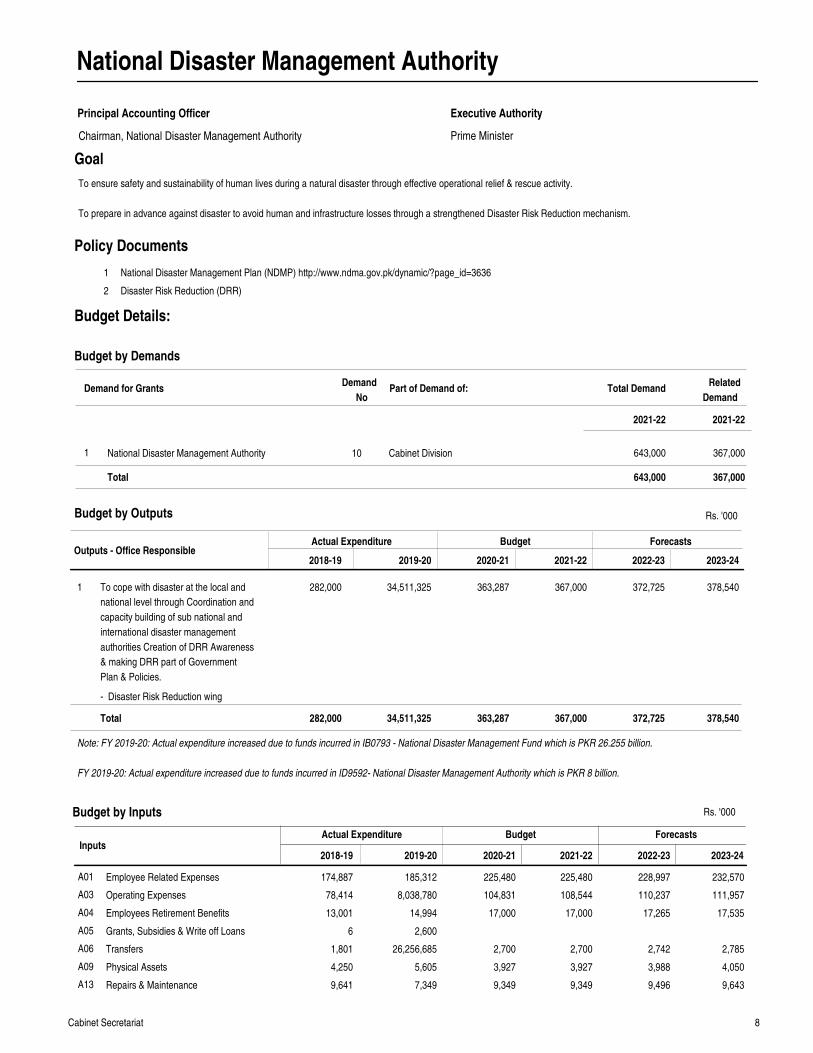
National Disaster Management Authority
Principal Accounting Officer
Prime Minister
Executive Authority
Goal
Outputs - Office ResponsibleActual Expenditure Budget Forecasts
2018-19 2019-20 2020-21 2021-22 2022-23 2023-24
To cope with disaster at the local and
national level through Coordination and
capacity building of sub national and
international disaster management
authorities Creation of DRR Awareness
& making DRR part of Government
Plan & Policies.
282,000 34,511,325 363,287 367,000 372,725 378,5401
Total 282,000 34,511,325 363,287 367,000 372,725 378,540
Note: FY 2019-20: Actual expenditure increased due to funds incurred in IB0793 - National Disaster Management Fund which is PKR 26.255 billion.
FY 2019-20: Actual expenditure increased due to funds incurred in ID9592- National Disaster Management Authority which is PKR 8 billion.
Rs. '000
National Disaster Management Authority1 10 Cabinet Division 643,000 367,000
Demand for GrantsDemand
NoPart of Demand of: Total Demand
2021-22
643,000 367,000Total
InputsActual Expenditure Budget Forecasts
Employee Related Expenses
Operating Expenses
Employees Retirement Benefits
Grants, Subsidies & Write off Loans
Transfers
Physical Assets
Repairs & Maintenance
174,887
78,414
13,001
6
1,801
4,250
9,641
185,312
8,038,780
14,994
2,600
26,256,685
5,605
7,349
225,480
104,831
17,000
2,700
3,927
9,349
225,480
108,544
17,000
2,700
3,927
9,349
228,997
110,237
17,265
2,742
3,988
9,496
232,570
111,957
17,535
2,785
4,050
9,643
A01
A03
A04
A05
A06
A09
A13
2018-19 2019-20 2020-21 2021-22 2022-23 2023-24
1
2
National Disaster Management Plan (NDMP) http://www.ndma.gov.pk/dynamic/?page_id=3636
Disaster Risk Reduction (DRR)
Policy Documents
Budget by Outputs
Budget by Demands
Budget by Inputs
To ensure safety and sustainability of human lives during a natural disaster through effective operational relief & rescue activity.
To prepare in advance against disaster to avoid human and infrastructure losses through a strengthened Disaster Risk Reduction mechanism.
Chairman, National Disaster Management Authority
Budget Details:
- Disaster Risk Reduction wing
Rs. '000
2021-22
Related
Demand
9Cabinet Secretariat
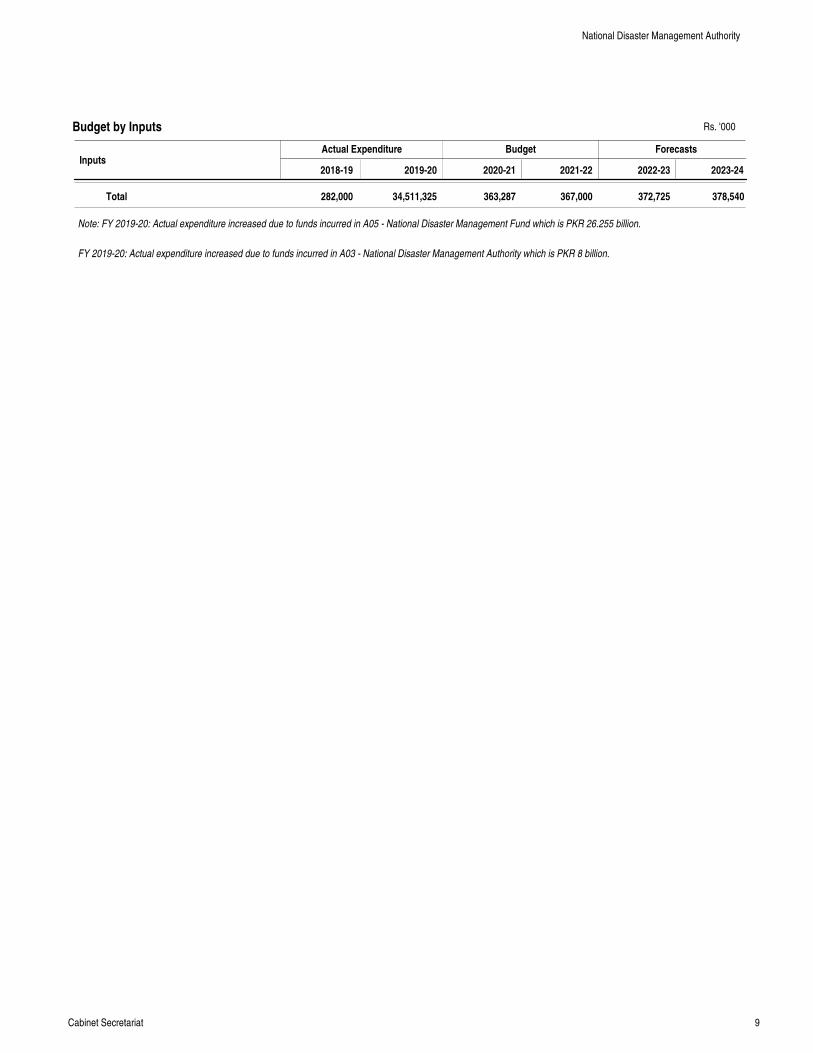
InputsActual Expenditure Budget Forecasts
Total 282,000 34,511,325 363,287 367,000 372,725 378,540
Note: FY 2019-20: Actual expenditure increased due to funds incurred in A05 - National Disaster Management Fund which is PKR 26.255 billion.
FY 2019-20: Actual expenditure increased due to funds incurred in A03 - National Disaster Management Authority which is PKR 8 billion.
2018-19 2019-20 2020-21 2021-22 2022-23 2023-24
Budget by Inputs
National Disaster Management Authority
Rs. '000
10Cabinet Secretariat
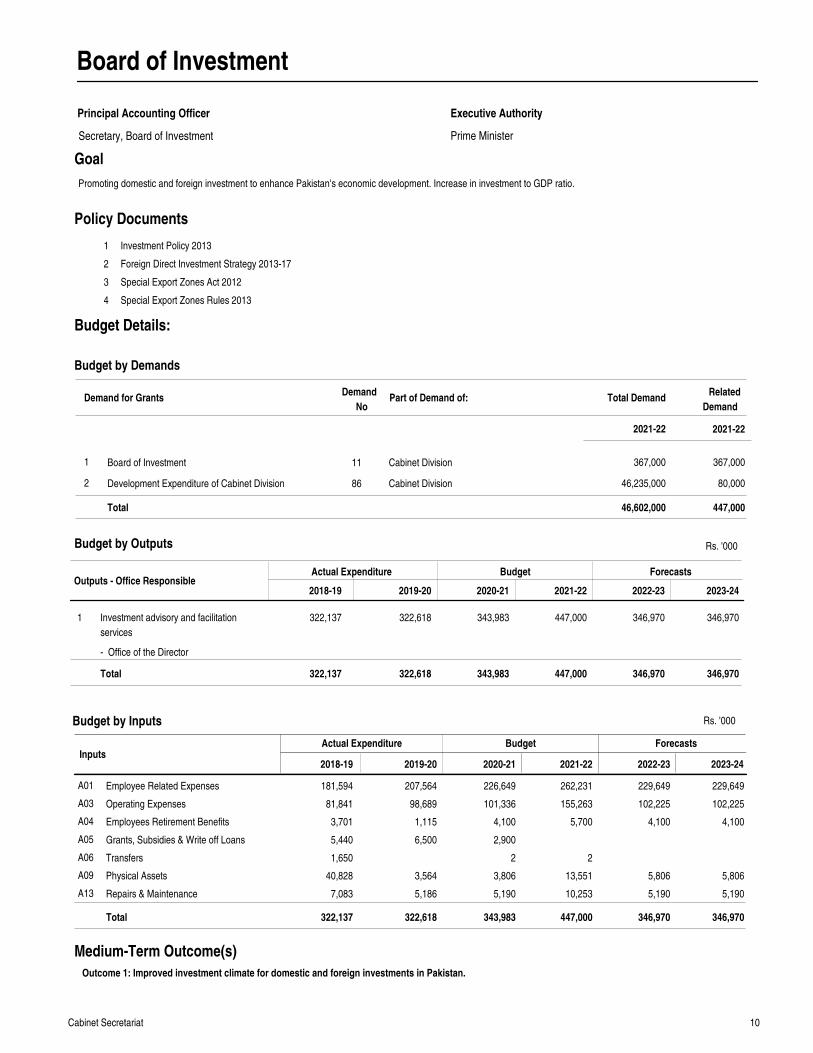
Board of Investment
Principal Accounting Officer
Prime Minister
Executive Authority
Goal
Outputs - Office ResponsibleActual Expenditure Budget Forecasts
2018-19 2019-20 2020-21 2021-22 2022-23 2023-24
Investment advisory and facilitation
services
322,137 322,618 343,983 447,000 346,970 346,9701
Total 322,137 322,618 343,983 447,000 346,970 346,970
Rs. '000
Board of Investment
Development Expenditure of Cabinet Division
1
2
11
86
Cabinet Division
Cabinet Division
367,000
46,235,000
367,000
80,000
Demand for GrantsDemand
NoPart of Demand of: Total Demand
2021-22
46,602,000 447,000Total
InputsActual Expenditure Budget Forecasts
Employee Related Expenses
Operating Expenses
Employees Retirement Benefits
Grants, Subsidies & Write off Loans
Transfers
Physical Assets
Repairs & Maintenance
181,594
81,841
3,701
5,440
1,650
40,828
7,083
207,564
98,689
1,115
6,500
3,564
5,186
226,649
101,336
4,100
2,900
2
3,806
5,190
262,231
155,263
5,700
2
13,551
10,253
229,649
102,225
4,100
5,806
5,190
229,649
102,225
4,100
5,806
5,190
A01
A03
A04
A05
A06
A09
A13
Total 322,137 322,618 343,983 447,000 346,970 346,970
2018-19 2019-20 2020-21 2021-22 2022-23 2023-24
1
2
3
4
Investment Policy 2013
Foreign Direct Investment Strategy 2013-17
Special Export Zones Act 2012
Special Export Zones Rules 2013
Policy Documents
Medium-Term Outcome(s)
Outcome 1: Improved investment climate for domestic and foreign investments in Pakistan.
Budget by Outputs
Budget by Demands
Budget by Inputs
Promoting domestic and foreign investment to enhance Pakistan's economic development. Increase in investment to GDP ratio.
Secretary, Board of Investment
Budget Details:
- Office of the Director
Rs. '000
2021-22
Related
Demand
11Cabinet Secretariat
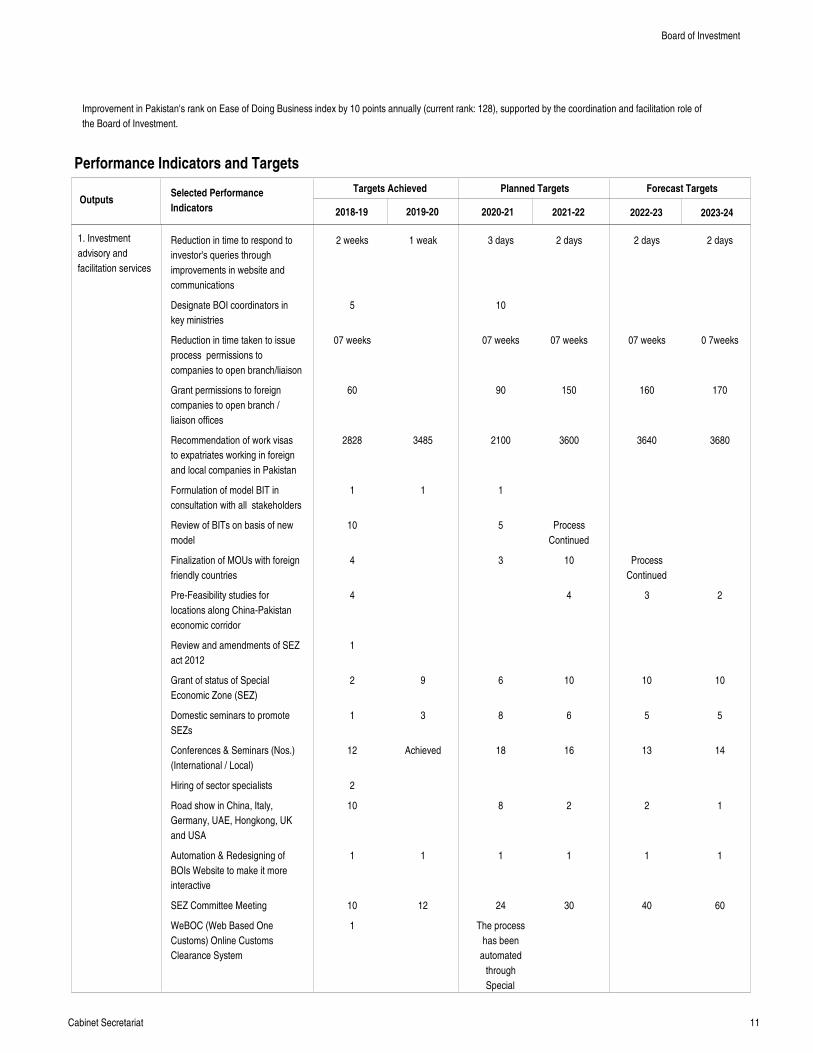
Improvement in Pakistan's rank on Ease of Doing Business index by 10 points annually (current rank: 128), supported by the coordination and facilitation role of
the Board of Investment.
Performance Indicators and Targets
OutputsTargets Achieved Planned Targets Forecast Targets
2018-19 2019-20 2020-21 2021-22 2022-23 2023-24
Selected Performance
Indicators
1. Investment
advisory and
facilitation services
Reduction in time to respond to
investor's queries through
improvements in website and
communications
Designate BOI coordinators in
key ministries
Reduction in time taken to issue
process permissions to
companies to open branch/liaison
Grant permissions to foreign
companies to open branch /
liaison offices
Recommendation of work visas
to expatriates working in foreign
and local companies in Pakistan
Formulation of model BIT in
consultation with all stakeholders
Review of BITs on basis of new
model
Finalization of MOUs with foreign
friendly countries
Pre-Feasibility studies for
locations along China-Pakistan
economic corridor
Review and amendments of SEZ
act 2012
Grant of status of Special
Economic Zone (SEZ)
Domestic seminars to promote
SEZs
Conferences & Seminars (Nos.)
(International / Local)
Hiring of sector specialists
Road show in China, Italy,
Germany, UAE, Hongkong, UK
and USA
Automation & Redesigning of
BOIs Website to make it more
interactive
SEZ Committee Meeting
WeBOC (Web Based One
Customs) Online Customs
Clearance System
2 weeks
5
07 weeks
60
2828
1
10
4
4
1
2
1
12
2
10
1
10
1
1 weak
3485
1
9
3
Achieved
1
12
3 days
10
07 weeks
90
2100
1
5
3
6
8
18
8
1
24
The process
has been
automated
through
Special
2 days
07 weeks
150
3600
Process
Continued
10
4
10
6
16
2
1
30
2 days
07 weeks
160
3640
Process
Continued
3
10
5
13
2
1
40
2 days
0 7weeks
170
3680
2
10
5
14
1
1
60
Board of Investment
12Cabinet Secretariat
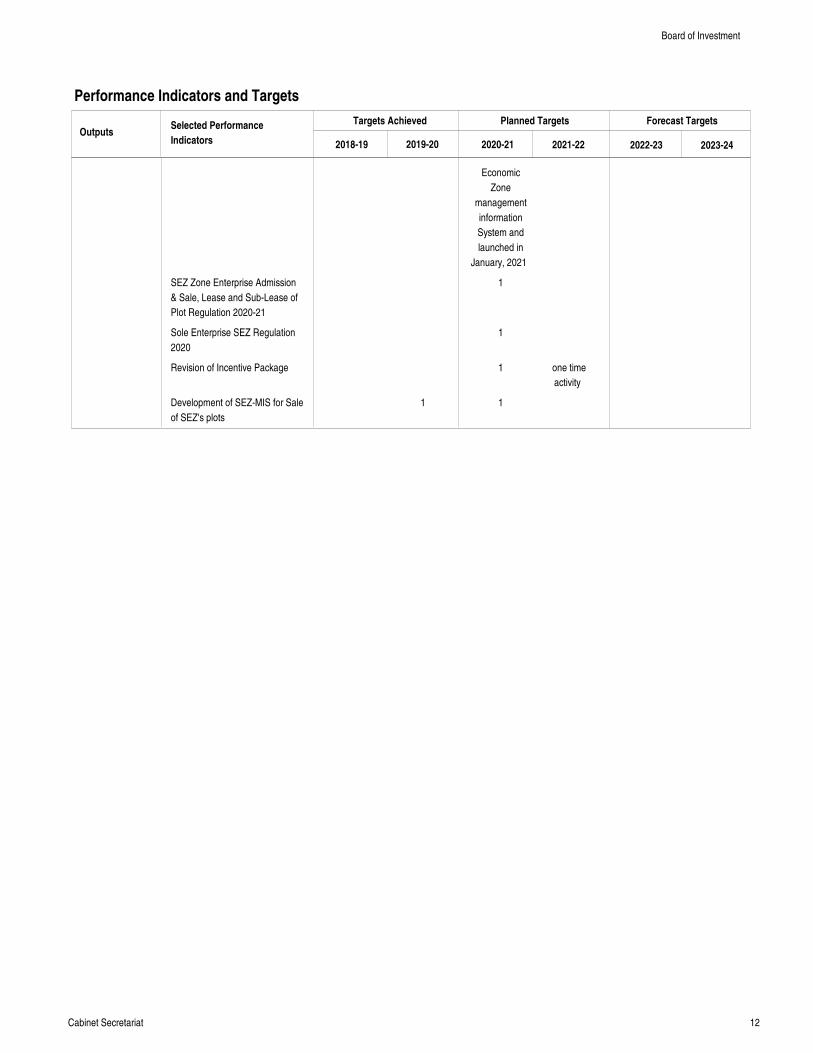
Performance Indicators and Targets
OutputsTargets Achieved Planned Targets Forecast Targets
2018-19 2019-20 2020-21 2021-22 2022-23 2023-24
Selected Performance
Indicators
SEZ Zone Enterprise Admission
& Sale, Lease and Sub-Lease of
Plot Regulation 2020-21
Sole Enterprise SEZ Regulation
2020
Revision of Incentive Package
Development of SEZ-MIS for Sale
of SEZ's plots
1
Economic
Zone
management
information
System and
launched in
January, 2021
1
1
1
1
one time
activity
Board of Investment
13Cabinet Secretariat
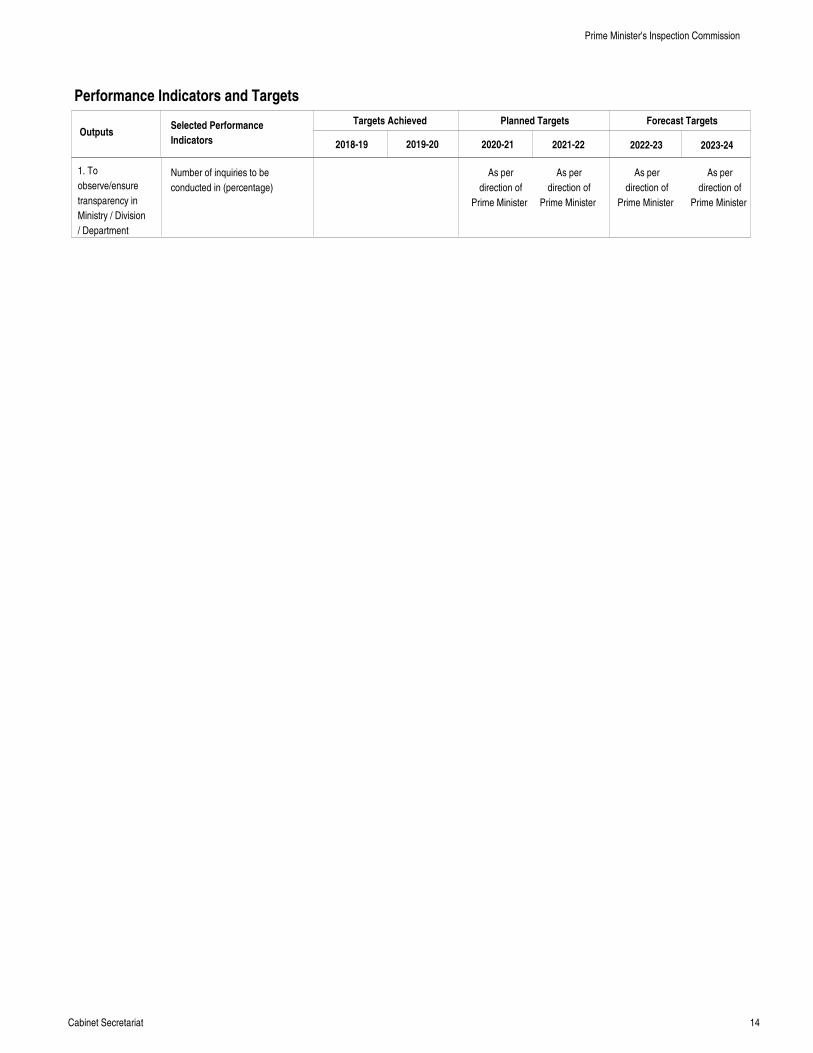
Prime Minister's Inspection Commission
Principal Accounting Officer
Prime Minister
Executive Authority
Goal
Outputs - Office ResponsibleActual Expenditure Budget Forecasts
2018-19 2019-20 2020-21 2021-22 2022-23 2023-24
To observe/ensure transparency in
Ministry / Division / Department
45,092 69,299 59,022 60,000 60,980 61,9801
Total 45,092 69,299 59,022 60,000 60,980 61,980
Rs. '000
InputsActual Expenditure Budget Forecasts
Employee Related Expenses
Operating Expenses
Employees Retirement Benefits
Grants, Subsidies & Write off Loans
Transfers
Physical Assets
Repairs & Maintenance
34,217
8,205
2,104
9
170
388
48,470
9,147
1,084
9,939
300
359
47,040
8,447
100
2,992
443
49,079
8,935
1,600
40
20
326
50,000
8,994
1,600
40
20
326
51,000
8,994
1,600
40
20
326
A01
A03
A04
A05
A06
A09
A13
Total 45,092 69,299 59,022 60,000 60,980 61,980
2018-19 2019-20 2020-21 2021-22 2022-23 2023-24
1 Martial Law Order No. 58 of 1978
Policy Documents
Medium-Term Outcome(s)
Outcome 1: To improve transparency in Government Business.
Budget by Outputs
Budget by Inputs
The Commission shall if so directed by the Prime Minister to carry out the inspections and may conduct inquiries in respect of any
Ministry/Division/Department/Office/Corporation and employee on various charges / allegations and any other assignments given by the Prime Minister.
Demand for GrantsDemand
NoTotal
2021-22
Budget by Demands
Prime Minister's Inspection Commission1 12 60,000
60,000Total
Chairman, Prime Minister's Inspection Commission
Budget Details:
- Prime Minister's Inspection
Commission
Rs. '000
Rs. '000
14Cabinet Secretariat
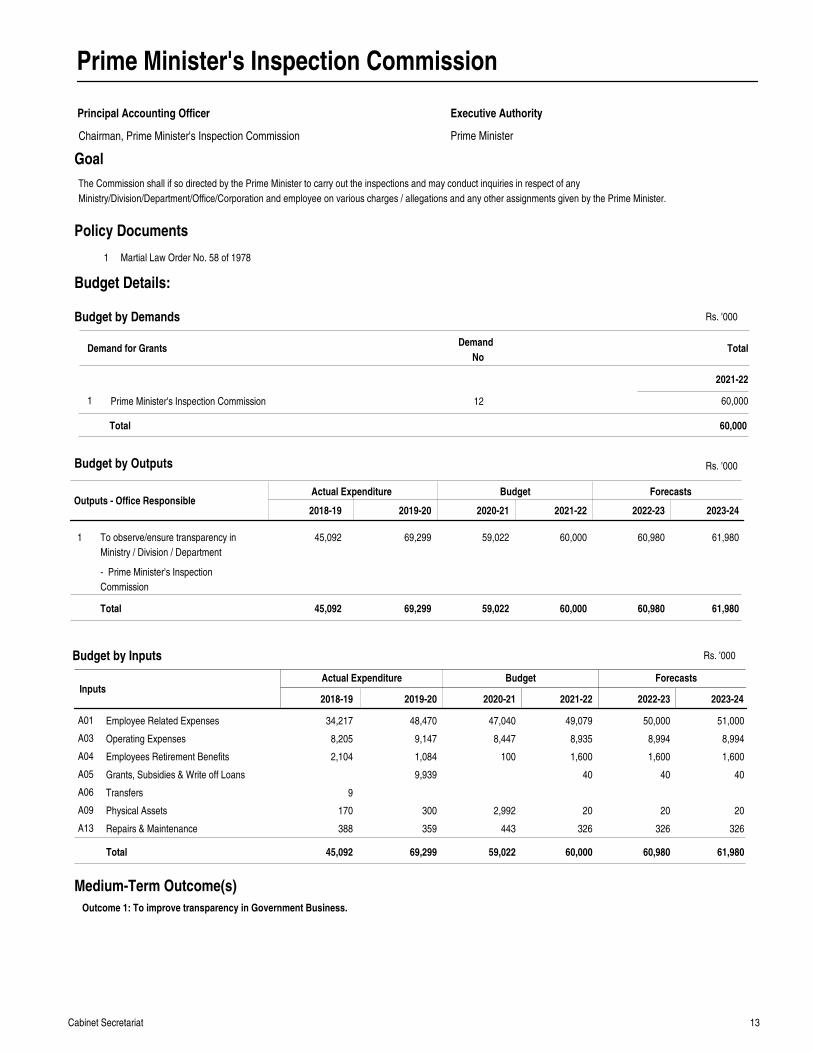
Performance Indicators and Targets
OutputsTargets Achieved Planned Targets Forecast Targets
2018-19 2019-20 2020-21 2021-22 2022-23 2023-24
Selected Performance
Indicators
1. To
observe/ensure
transparency in
Ministry / Division
/ Department
Number of inquiries to be
conducted in (percentage)
As per
direction of
Prime Minister
As per
direction of
Prime Minister
As per
direction of
Prime Minister
As per
direction of
Prime Minister
Prime Minister's Inspection Commission
15Cabinet Secretariat
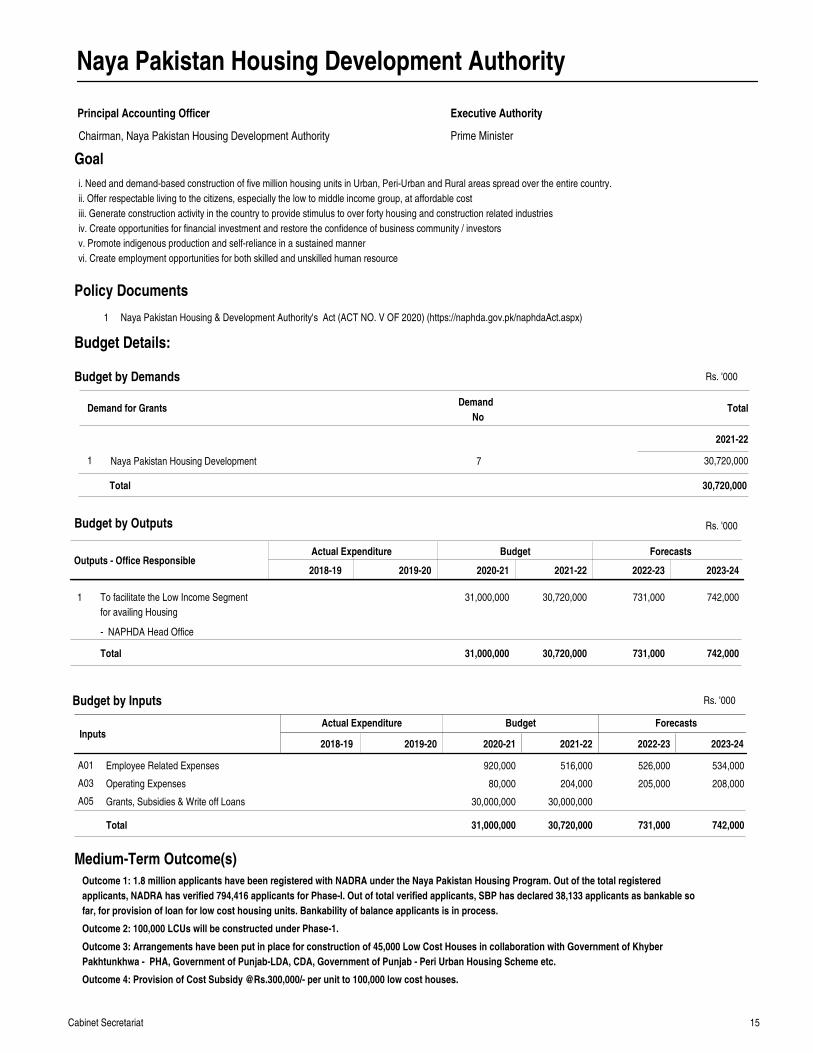
Naya Pakistan Housing Development Authority
Principal Accounting Officer
Prime Minister
Executive Authority
Goal
Outputs - Office ResponsibleActual Expenditure Budget Forecasts
2018-19 2019-20 2020-21 2021-22 2022-23 2023-24
To facilitate the Low Income Segment
for availing Housing
31,000,000 30,720,000 731,000 742,0001
Total 31,000,000 30,720,000 731,000 742,000
Rs. '000
InputsActual Expenditure Budget Forecasts
Employee Related Expenses
Operating Expenses
Grants, Subsidies & Write off Loans
920,000
80,000
30,000,000
516,000
204,000
30,000,000
526,000
205,000
534,000
208,000
A01
A03
A05
Total 31,000,000 30,720,000 731,000 742,000
2018-19 2019-20 2020-21 2021-22 2022-23 2023-24
1 Naya Pakistan Housing & Development Authority's Act (ACT NO. V OF 2020) (https://naphda.gov.pk/naphdaAct.aspx)
Policy Documents
Medium-Term Outcome(s)
Outcome 1: 1.8 million applicants have been registered with NADRA under the Naya Pakistan Housing Program. Out of the total registered
applicants, NADRA has verified 794,416 applicants for Phase-I. Out of total verified applicants, SBP has declared 38,133 applicants as bankable so
far, for provision of loan for low cost housing units. Bankability of balance applicants is in process.
Outcome 2: 100,000 LCUs will be constructed under Phase-1.
Outcome 3: Arrangements have been put in place for construction of 45,000 Low Cost Houses in collaboration with Government of Khyber
Pakhtunkhwa - PHA, Government of Punjab-LDA, CDA, Government of Punjab - Peri Urban Housing Scheme etc.
Outcome 4: Provision of Cost Subsidy @Rs.300,000/- per unit to 100,000 low cost houses.
Budget by Outputs
Budget by Inputs
i. Need and demand-based construction of five million housing units in Urban, Peri-Urban and Rural areas spread over the entire country.
ii. Offer respectable living to the citizens, especially the low to middle income group, at affordable cost
iii. Generate construction activity in the country to provide stimulus to over forty housing and construction related industries
iv. Create opportunities for financial investment and restore the confidence of business community / investors
v. Promote indigenous production and self-reliance in a sustained manner
vi. Create employment opportunities for both skilled and unskilled human resource
Demand for GrantsDemand
NoTotal
2021-22
Budget by Demands
Naya Pakistan Housing Development1 7 30,720,000
30,720,000Total
Chairman, Naya Pakistan Housing Development Authority
Budget Details:
- NAPHDA Head Office
Rs. '000
Rs. '000
16Cabinet Secretariat
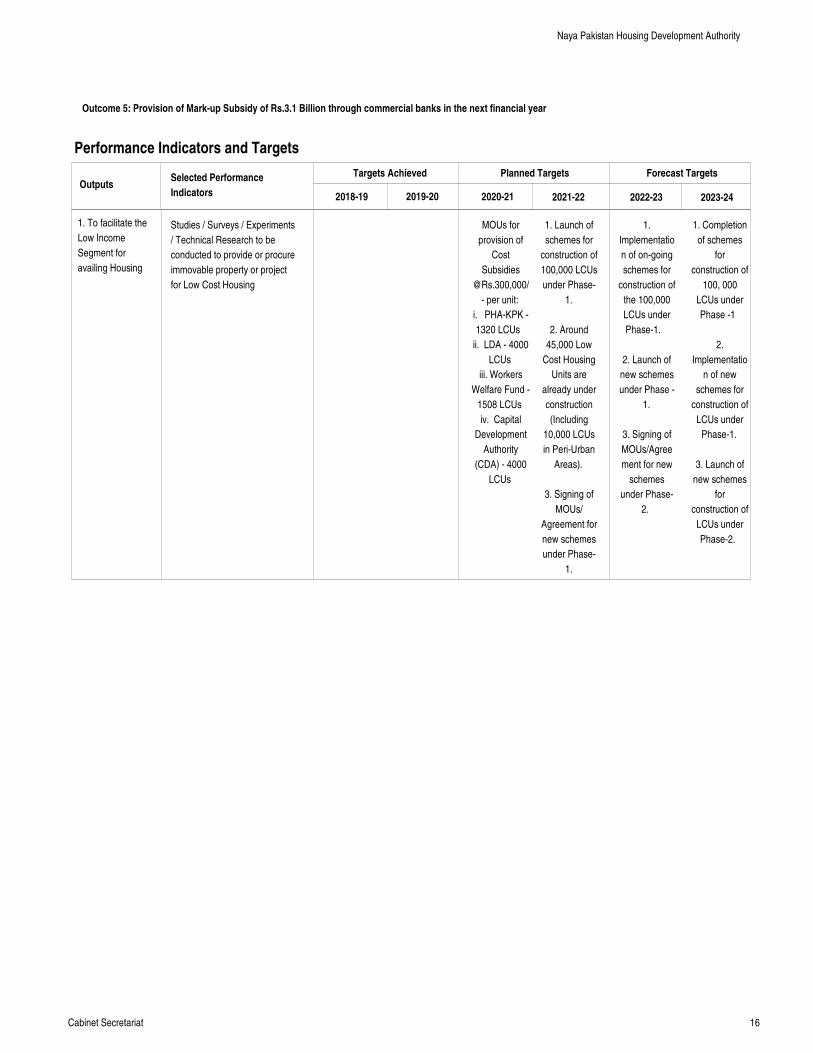
Outcome 5: Provision of Mark-up Subsidy of Rs.3.1 Billion through commercial banks in the next financial year
Performance Indicators and Targets
OutputsTargets Achieved Planned Targets Forecast Targets
2018-19 2019-20 2020-21 2021-22 2022-23 2023-24
Selected Performance
Indicators
1. To facilitate the
Low Income
Segment for
availing Housing
Studies / Surveys / Experiments
/ Technical Research to be
conducted to provide or procure
immovable property or project
for Low Cost Housing
MOUs for
provision of
Cost
Subsidies
@Rs.300,000/
- per unit:
i. PHA-KPK -
1320 LCUs
ii. LDA - 4000
LCUs
iii. Workers
Welfare Fund -
1508 LCUs
iv. Capital
Development
Authority
(CDA) - 4000
LCUs
1. Launch of
schemes for
construction of
100,000 LCUs
under Phase-
1.
2. Around
45,000 Low
Cost Housing
Units are
already under
construction
(Including
10,000 LCUs
in Peri-Urban
Areas).
3. Signing of
MOUs/
Agreement for
new schemes
under Phase-
1.
1.
Implementatio
n of on-going
schemes for
construction of
the 100,000
LCUs under
Phase-1.
2. Launch of
new schemes
under Phase -
1.
3. Signing of
MOUs/Agree
ment for new
schemes
under Phase-
2.
1. Completion
of schemes
for
construction of
100, 000
LCUs under
Phase -1
2.
Implementatio
n of new
schemes for
construction of
LCUs under
Phase-1.
3. Launch of
new schemes
for
construction of
LCUs under
Phase-2.
Naya Pakistan Housing Development Authority
17Cabinet Secretariat
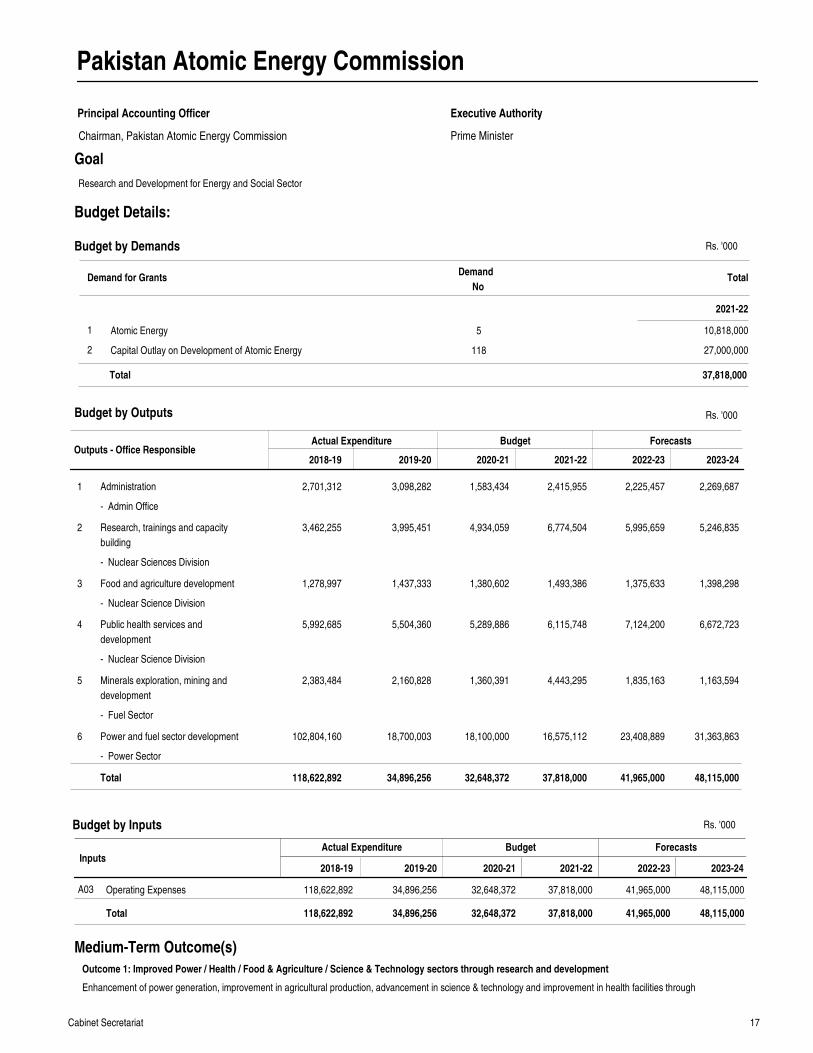
Pakistan Atomic Energy Commission
Principal Accounting Officer
Prime Minister
Executive Authority
Goal
Outputs - Office ResponsibleActual Expenditure Budget Forecasts
2018-19 2019-20 2020-21 2021-22 2022-23 2023-24
Administration
Research, trainings and capacity
building
Food and agriculture development
Public health services and
development
Minerals exploration, mining and
development
Power and fuel sector development
2,701,312
3,462,255
1,278,997
5,992,685
2,383,484
102,804,160
3,098,282
3,995,451
1,437,333
5,504,360
2,160,828
18,700,003
1,583,434
4,934,059
1,380,602
5,289,886
1,360,391
18,100,000
2,415,955
6,774,504
1,493,386
6,115,748
4,443,295
16,575,112
2,225,457
5,995,659
1,375,633
7,124,200
1,835,163
23,408,889
2,269,687
5,246,835
1,398,298
6,672,723
1,163,594
31,363,863
1
2
3
4
5
6
Total 118,622,892 34,896,256 32,648,372 37,818,000 41,965,000 48,115,000
Rs. '000
InputsActual Expenditure Budget Forecasts
Operating Expenses 118,622,892 34,896,256 32,648,372 37,818,000 41,965,000 48,115,000A03
Total 118,622,892 34,896,256 32,648,372 37,818,000 41,965,000 48,115,000
2018-19 2019-20 2020-21 2021-22 2022-23 2023-24
Enhancement of power generation, improvement in agricultural production, advancement in science & technology and improvement in health facilities through
Medium-Term Outcome(s)
Outcome 1: Improved Power / Health / Food & Agriculture / Science & Technology sectors through research and development
Budget by Outputs
Budget by Inputs
Research and Development for Energy and Social Sector
Demand for GrantsDemand
NoTotal
2021-22
Budget by Demands
Atomic Energy
Capital Outlay on Development of Atomic Energy
1
2
5
118
10,818,000
27,000,000
37,818,000Total
Chairman, Pakistan Atomic Energy Commission
Budget Details:
- Admin Office
- Nuclear Sciences Division
- Nuclear Science Division
- Nuclear Science Division
- Fuel Sector
- Power Sector
Rs. '000
Rs. '000
18Cabinet Secretariat
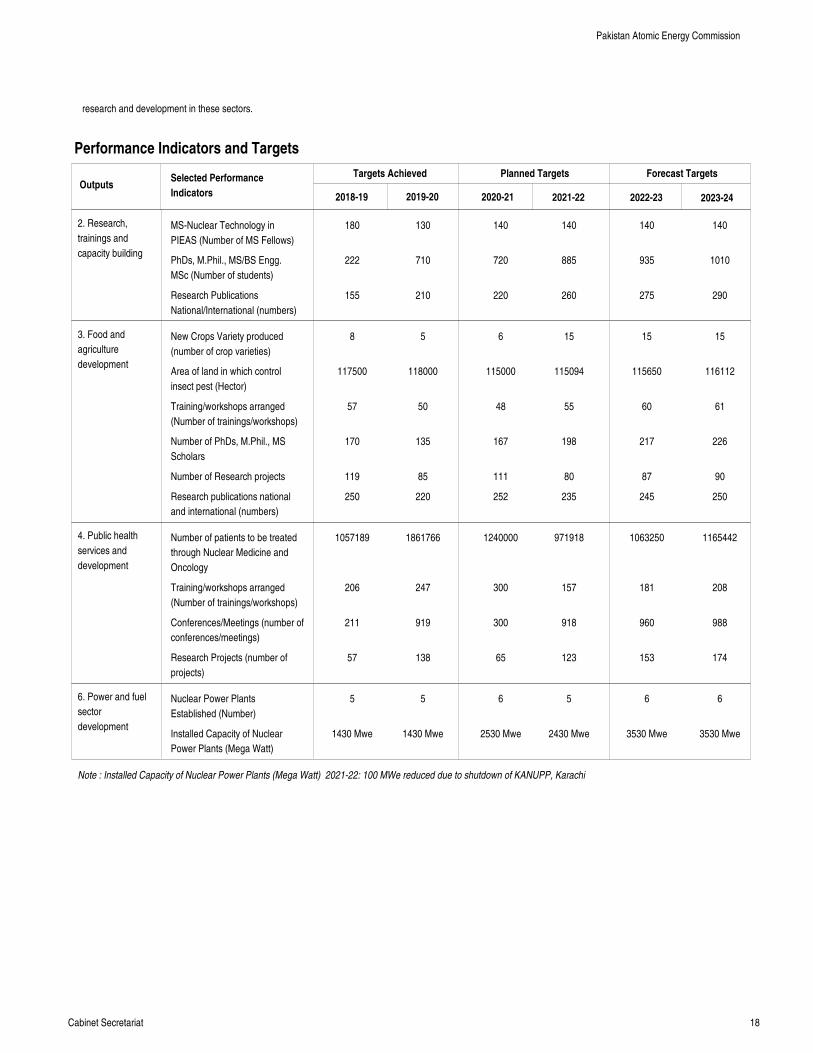
research and development in these sectors.
Performance Indicators and Targets
OutputsTargets Achieved Planned Targets Forecast Targets
2018-19 2019-20 2020-21 2021-22 2022-23 2023-24
Selected Performance
Indicators
2. Research,
trainings and
capacity building
3. Food and
agriculture
development
4. Public health
services and
development
6. Power and fuel
sector
development
Note : Installed Capacity of Nuclear Power Plants (Mega Watt) 2021-22: 100 MWe reduced due to shutdown of KANUPP, Karachi
MS-Nuclear Technology in
PIEAS (Number of MS Fellows)
PhDs, M.Phil., MS/BS Engg.
MSc (Number of students)
Research Publications
National/International (numbers)
New Crops Variety produced
(number of crop varieties)
Area of land in which control
insect pest (Hector)
Training/workshops arranged
(Number of trainings/workshops)
Number of PhDs, M.Phil., MS
Scholars
Number of Research projects
Research publications national
and international (numbers)
Number of patients to be treated
through Nuclear Medicine and
Oncology
Training/workshops arranged
(Number of trainings/workshops)
Conferences/Meetings (number of
conferences/meetings)
Research Projects (number of
projects)
Nuclear Power Plants
Established (Number)
Installed Capacity of Nuclear
Power Plants (Mega Watt)
180
222
155
8
117500
57
170
119
250
1057189
206
211
57
5
1430 Mwe
130
710
210
5
118000
50
135
85
220
1861766
247
919
138
5
1430 Mwe
140
720
220
6
115000
48
167
111
252
1240000
300
300
65
6
2530 Mwe
140
885
260
15
115094
55
198
80
235
971918
157
918
123
5
2430 Mwe
140
935
275
15
115650
60
217
87
245
1063250
181
960
153
6
3530 Mwe
140
1010
290
15
116112
61
226
90
250
1165442
208
988
174
6
3530 Mwe
Pakistan Atomic Energy Commission
19Cabinet Secretariat
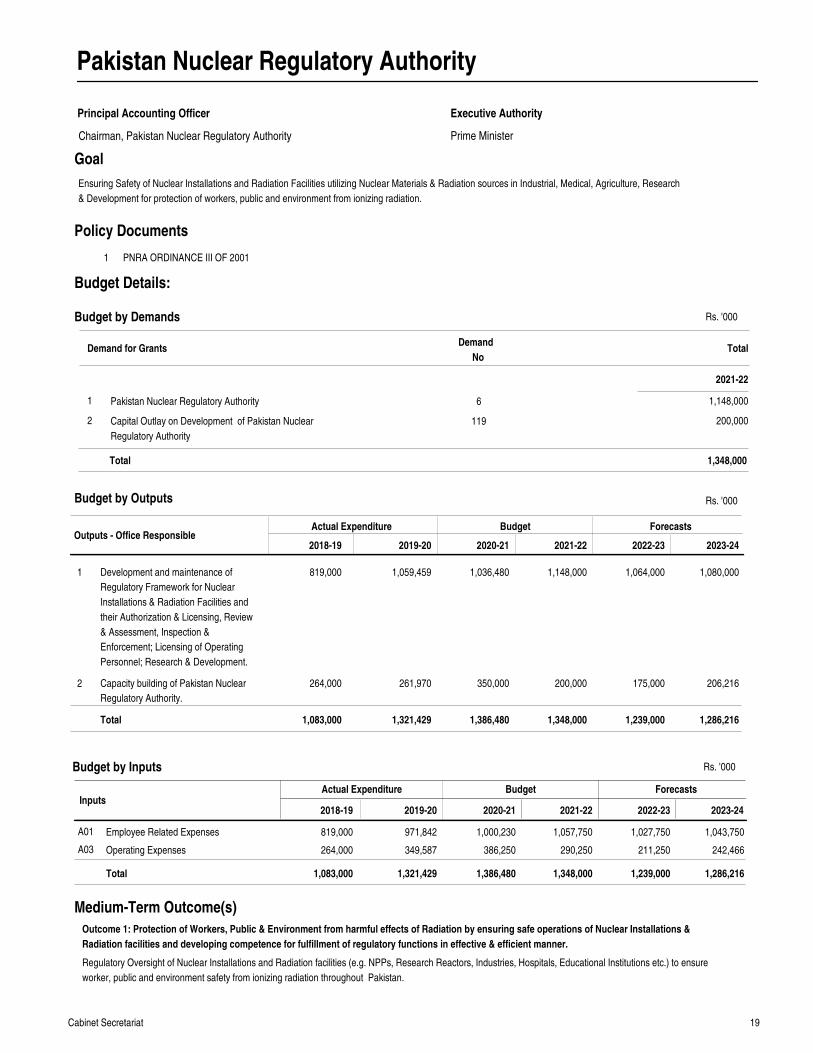
Pakistan Nuclear Regulatory Authority
Principal Accounting Officer
Prime Minister
Executive Authority
Goal
Outputs - Office ResponsibleActual Expenditure Budget Forecasts
2018-19 2019-20 2020-21 2021-22 2022-23 2023-24
Development and maintenance of
Regulatory Framework for Nuclear
Installations & Radiation Facilities and
their Authorization & Licensing, Review
& Assessment, Inspection &
Enforcement; Licensing of Operating
Personnel; Research & Development.
Capacity building of Pakistan Nuclear
Regulatory Authority.
819,000
264,000
1,059,459
261,970
1,036,480
350,000
1,148,000
200,000
1,064,000
175,000
1,080,000
206,216
1
2
Total 1,083,000 1,321,429 1,386,480 1,348,000 1,239,000 1,286,216
Rs. '000
InputsActual Expenditure Budget Forecasts
Employee Related Expenses
Operating Expenses
819,000
264,000
971,842
349,587
1,000,230
386,250
1,057,750
290,250
1,027,750
211,250
1,043,750
242,466
A01
A03
Total 1,083,000 1,321,429 1,386,480 1,348,000 1,239,000 1,286,216
2018-19 2019-20 2020-21 2021-22 2022-23 2023-24
1 PNRA ORDINANCE III OF 2001
Policy Documents
Regulatory Oversight of Nuclear Installations and Radiation facilities (e.g. NPPs, Research Reactors, Industries, Hospitals, Educational Institutions etc.) to ensure
worker, public and environment safety from ionizing radiation throughout Pakistan.
Medium-Term Outcome(s)
Outcome 1: Protection of Workers, Public & Environment from harmful effects of Radiation by ensuring safe operations of Nuclear Installations &
Radiation facilities and developing competence for fulfillment of regulatory functions in effective & efficient manner.
Budget by Outputs
Budget by Inputs
Ensuring Safety of Nuclear Installations and Radiation Facilities utilizing Nuclear Materials & Radiation sources in Industrial, Medical, Agriculture, Research
& Development for protection of workers, public and environment from ionizing radiation.
Demand for GrantsDemand
NoTotal
2021-22
Budget by Demands
Pakistan Nuclear Regulatory Authority
Capital Outlay on Development of Pakistan Nuclear
Regulatory Authority
1
2
6
119
1,148,000
200,000
1,348,000Total
Chairman, Pakistan Nuclear Regulatory Authority
Budget Details:
Rs. '000
Rs. '000
20Cabinet Secretariat
Performance Indicators and Targets
OutputsTargets Achieved Planned Targets Forecast Targets
2018-19 2019-20 2020-21 2021-22 2022-23 2023-24
Selected Performance
Indicators
1. Development
and maintenance of
Regulatory
Framework for
Nuclear
Installations &
Radiation Facilities
and their
Authorization &
Licensing, Review
& Assessment,
Inspection &
Enforcement;
Licensing of
Operating
Personnel;
Research &
Development.
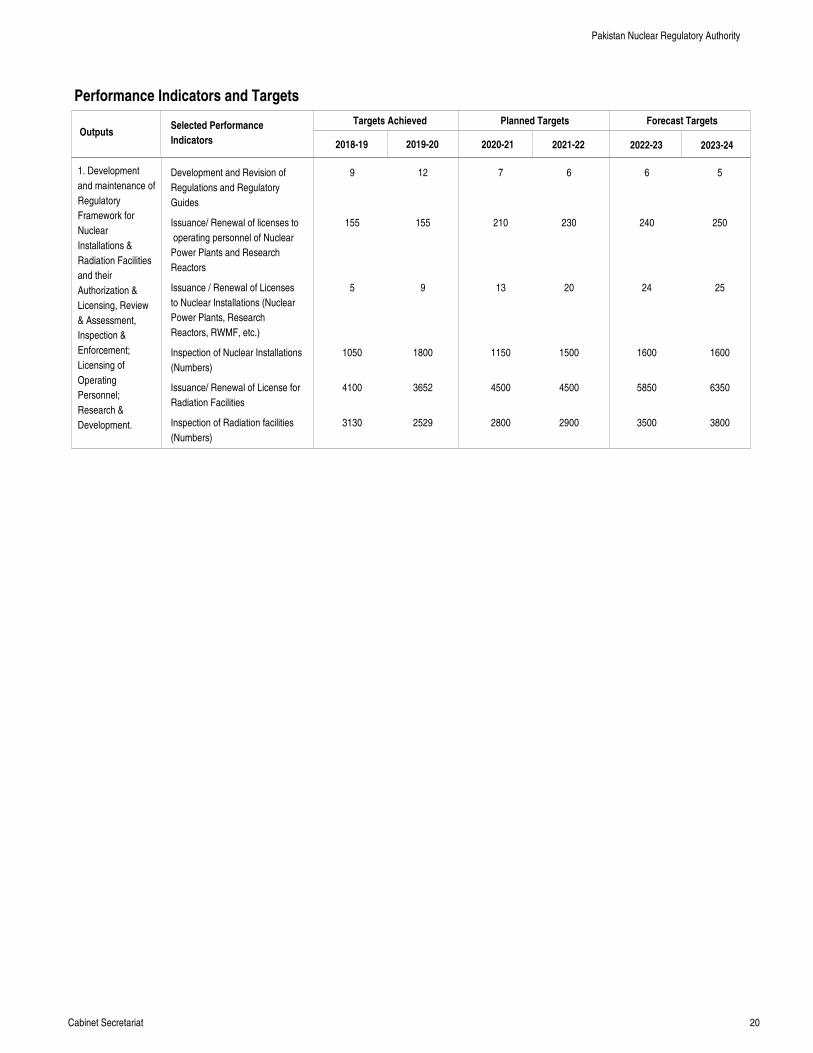
Development and Revision of
Regulations and Regulatory
Guides
Issuance/ Renewal of licenses to
operating personnel of Nuclear
Power Plants and Research
Reactors
Issuance / Renewal of Licenses
to Nuclear Installations (Nuclear
Power Plants, Research
Reactors, RWMF, etc.)
Inspection of Nuclear Installations
(Numbers)
Issuance/ Renewal of License for
Radiation Facilities
Inspection of Radiation facilities
(Numbers)
9
155
5
1050
4100
3130
12
155
9
1800
3652
2529
7
210
13
1150
4500
2800
6
230
20
1500
4500
2900
6
240
24
1600
5850
3500
5
250
25
1600
6350
3800
Pakistan Nuclear Regulatory Authority
21Cabinet Secretariat
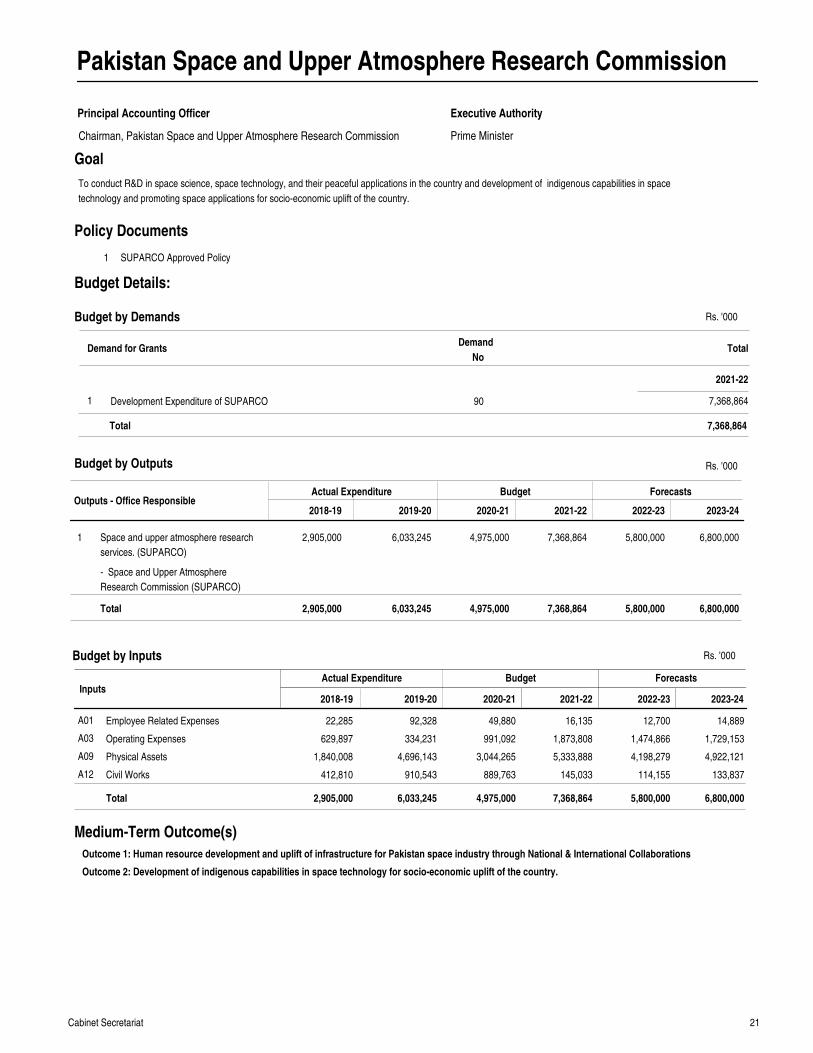
Pakistan Space and Upper Atmosphere Research Commission
Principal Accounting Officer
Prime Minister
Executive Authority
Goal
Outputs - Office ResponsibleActual Expenditure Budget Forecasts
2018-19 2019-20 2020-21 2021-22 2022-23 2023-24
Space and upper atmosphere research
services. (SUPARCO)
2,905,000 6,033,245 4,975,000 7,368,864 5,800,000 6,800,0001
Total 2,905,000 6,033,245 4,975,000 7,368,864 5,800,000 6,800,000
Rs. '000
InputsActual Expenditure Budget Forecasts
Employee Related Expenses
Operating Expenses
Physical Assets
Civil Works
22,285
629,897
1,840,008
412,810
92,328
334,231
4,696,143
910,543
49,880
991,092
3,044,265
889,763
16,135
1,873,808
5,333,888
145,033
12,700
1,474,866
4,198,279
114,155
14,889
1,729,153
4,922,121
133,837
A01
A03
A09
A12
Total 2,905,000 6,033,245 4,975,000 7,368,864 5,800,000 6,800,000
2018-19 2019-20 2020-21 2021-22 2022-23 2023-24
1 SUPARCO Approved Policy
Policy Documents
Medium-Term Outcome(s)
Outcome 1: Human resource development and uplift of infrastructure for Pakistan space industry through National & International Collaborations
Outcome 2: Development of indigenous capabilities in space technology for socio-economic uplift of the country.
Budget by Outputs
Budget by Inputs
To conduct R&D in space science, space technology, and their peaceful applications in the country and development of indigenous capabilities in space
technology and promoting space applications for socio-economic uplift of the country.
Demand for GrantsDemand
NoTotal
2021-22
Budget by Demands
Development Expenditure of SUPARCO1 90 7,368,864
7,368,864Total
Chairman, Pakistan Space and Upper Atmosphere Research Commission
Budget Details:
- Space and Upper Atmosphere
Research Commission (SUPARCO)
Rs. '000
Rs. '000
22Cabinet Secretariat
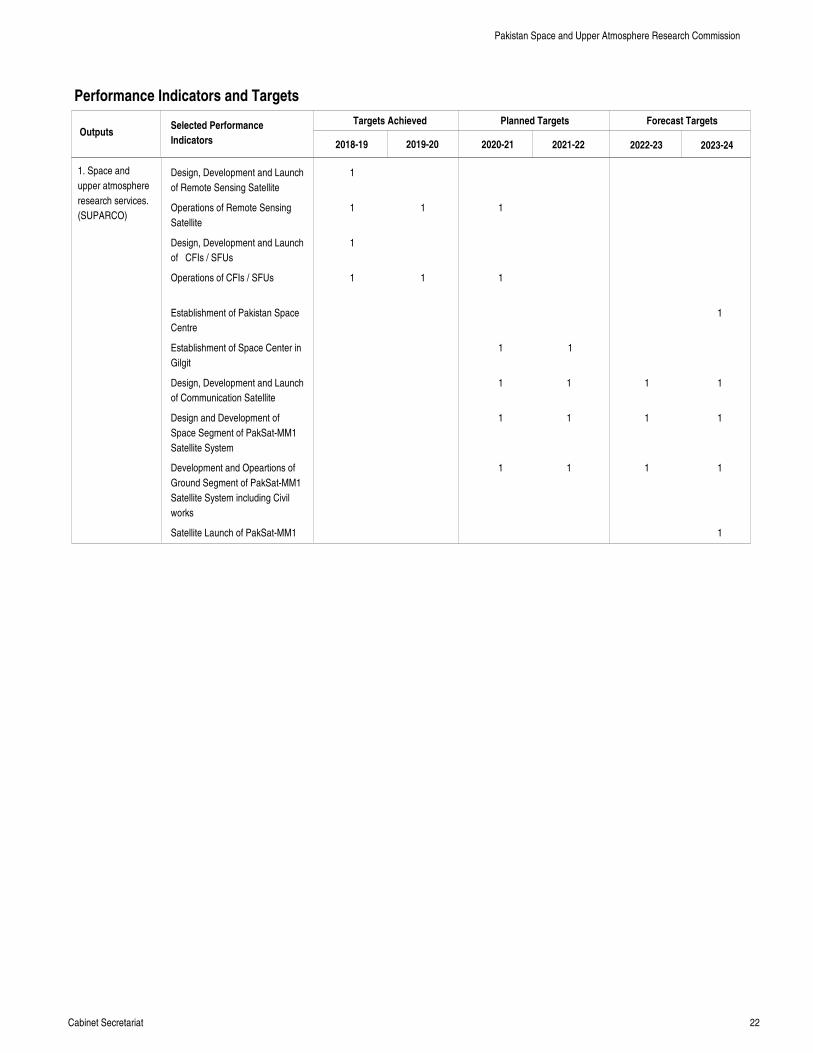
Performance Indicators and Targets
OutputsTargets Achieved Planned Targets Forecast Targets
2018-19 2019-20 2020-21 2021-22 2022-23 2023-24
Selected Performance
Indicators
1. Space and
upper atmosphere
research services.
(SUPARCO)
Design, Development and Launch
of Remote Sensing Satellite
Operations of Remote Sensing
Satellite
Design, Development and Launch
of CFIs / SFUs
Operations of CFIs / SFUs
Establishment of Pakistan Space
Centre
Establishment of Space Center in
Gilgit
Design, Development and Launch
of Communication Satellite
Design and Development of
Space Segment of PakSat-MM1
Satellite System
Development and Opeartions of
Ground Segment of PakSat-MM1
Satellite System including Civil
works
Satellite Launch of PakSat-MM1
1
1
1
1
1
1
1
1
1
1
1
1
1
1
1
1
1
1
1
1
1
1
1
1
Pakistan Space and Upper Atmosphere Research Commission
23Cabinet Secretariat
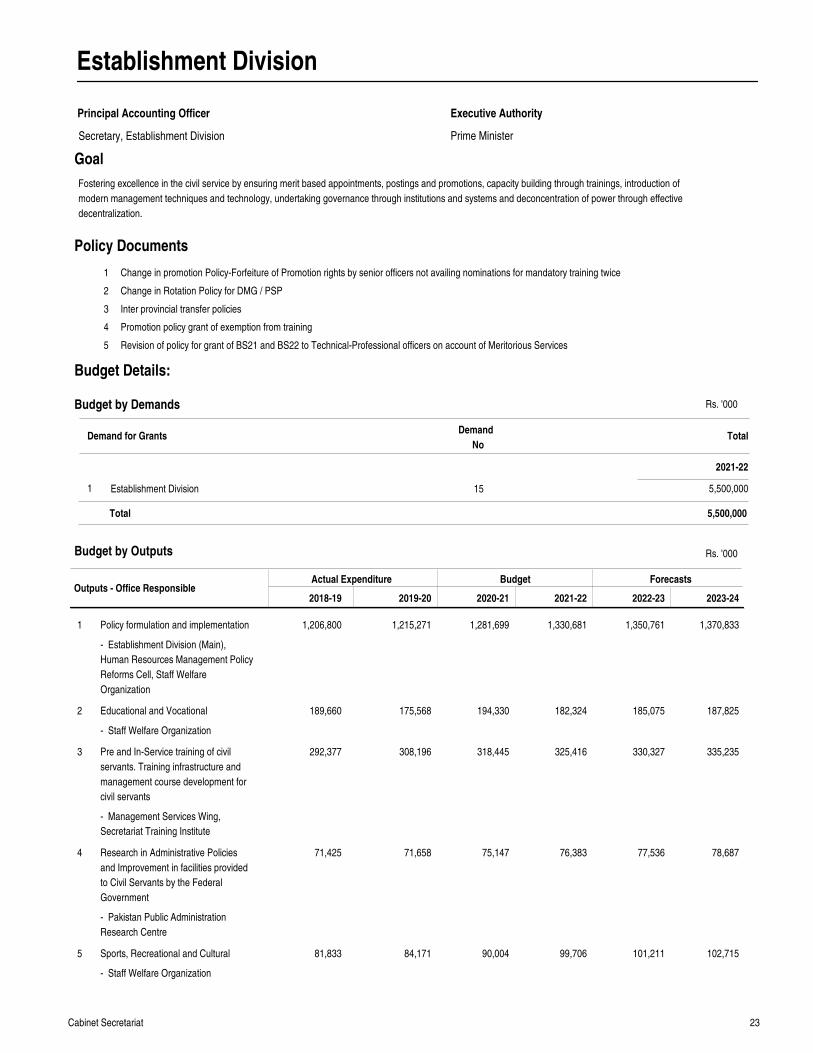
Establishment Division
Principal Accounting Officer
Prime Minister
Executive Authority
Goal
Outputs - Office ResponsibleActual Expenditure Budget Forecasts
2018-19 2019-20 2020-21 2021-22 2022-23 2023-24
Policy formulation and implementation
Educational and Vocational
Pre and In-Service training of civil
servants. Training infrastructure and
management course development for
civil servants
Research in Administrative Policies
and Improvement in facilities provided
to Civil Servants by the Federal
Government
Sports, Recreational and Cultural
1,206,800
189,660
292,377
71,425
81,833
1,215,271
175,568
308,196
71,658
84,171
1,281,699
194,330
318,445
75,147
90,004
1,330,681
182,324
325,416
76,383
99,706
1,350,761
185,075
330,327
77,536
101,211
1,370,833
187,825
335,235
78,687
102,715
1
2
3
4
5
Rs. '000
1
2
3
4
5
Change in promotion Policy-Forfeiture of Promotion rights by senior officers not availing nominations for mandatory training twice
Change in Rotation Policy for DMG / PSP
Inter provincial transfer policies
Promotion policy grant of exemption from training
Revision of policy for grant of BS21 and BS22 to Technical-Professional officers on account of Meritorious Services
Policy Documents
Budget by Outputs
Fostering excellence in the civil service by ensuring merit based appointments, postings and promotions, capacity building through trainings, introduction of
modern management techniques and technology, undertaking governance through institutions and systems and deconcentration of power through effective
decentralization.
Demand for GrantsDemand
NoTotal
2021-22
Budget by Demands
Establishment Division1 15 5,500,000
5,500,000Total
Secretary, Establishment Division
Budget Details:
- Establishment Division (Main),
Human Resources Management Policy
Reforms Cell, Staff Welfare
Organization
- Staff Welfare Organization
- Management Services Wing,
Secretariat Training Institute
- Pakistan Public Administration
Research Centre
- Staff Welfare Organization
Rs. '000
24Cabinet Secretariat
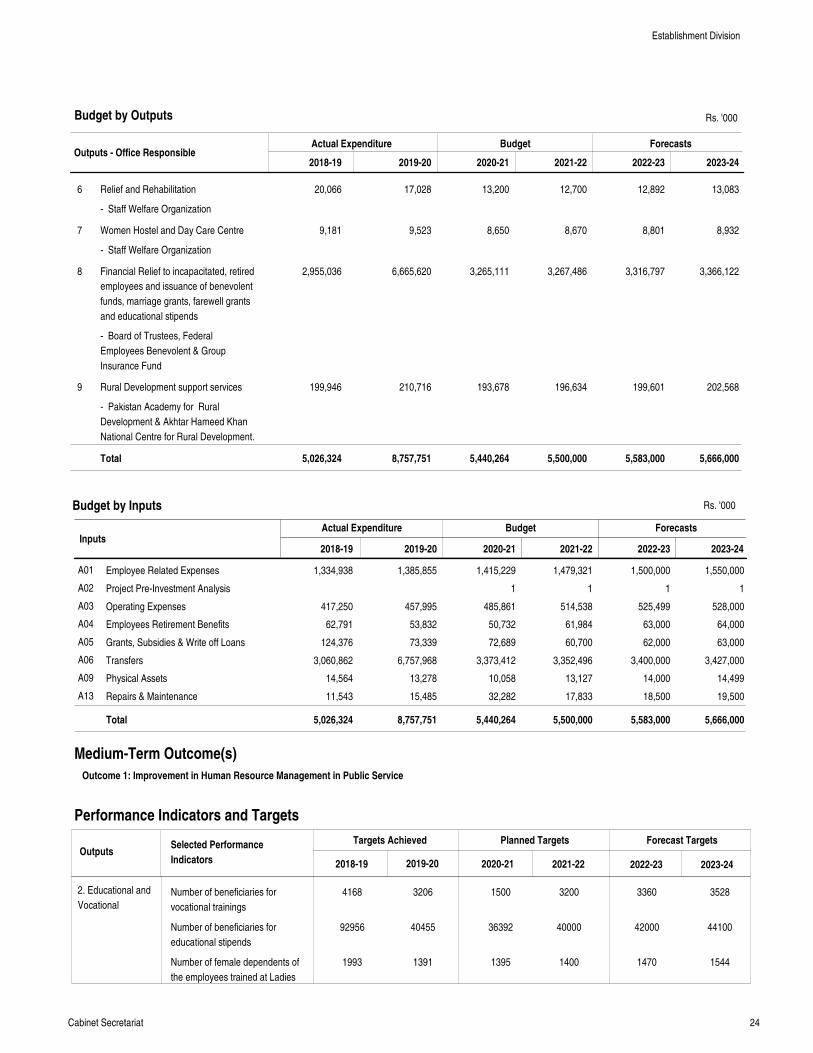
Outputs - Office ResponsibleActual Expenditure Budget Forecasts
2018-19 2019-20 2020-21 2021-22 2022-23 2023-24
Relief and Rehabilitation
Women Hostel and Day Care Centre
Financial Relief to incapacitated, retired
employees and issuance of benevolent
funds, marriage grants, farewell grants
and educational stipends
Rural Development support services
20,066
9,181
2,955,036
199,946
17,028
9,523
6,665,620
210,716
13,200
8,650
3,265,111
193,678
12,700
8,670
3,267,486
196,634
12,892
8,801
3,316,797
199,601
13,083
8,932
3,366,122
202,568
6
7
8
9
Total 5,026,324 8,757,751 5,440,264 5,500,000 5,583,000 5,666,000
Rs. '000
InputsActual Expenditure Budget Forecasts
Employee Related Expenses
Project Pre-Investment Analysis
Operating Expenses
Employees Retirement Benefits
Grants, Subsidies & Write off Loans
Transfers
Physical Assets
Repairs & Maintenance
1,334,938
417,250
62,791
124,376
3,060,862
14,564
11,543
1,385,855
457,995
53,832
73,339
6,757,968
13,278
15,485
1,415,229
1
485,861
50,732
72,689
3,373,412
10,058
32,282
1,479,321
1
514,538
61,984
60,700
3,352,496
13,127
17,833
1,500,000
1
525,499
63,000
62,000
3,400,000
14,000
18,500
1,550,000
1
528,000
64,000
63,000
3,427,000
14,499
19,500
A01
A02
A03
A04
A05
A06
A09
A13
Total 5,026,324 8,757,751 5,440,264 5,500,000 5,583,000 5,666,000
2018-19 2019-20 2020-21 2021-22 2022-23 2023-24
Medium-Term Outcome(s)
Outcome 1: Improvement in Human Resource Management in Public Service
Performance Indicators and Targets
OutputsTargets Achieved Planned Targets Forecast Targets
2018-19 2019-20 2020-21 2021-22 2022-23 2023-24
Selected Performance
Indicators
2. Educational and
Vocational
Budget by Outputs
Budget by Inputs
Number of beneficiaries for
vocational trainings
Number of beneficiaries for
educational stipends
Number of female dependents of
the employees trained at Ladies
4168
92956
1993
3206
40455
1391
1500
36392
1395
3200
40000
1400
3360
42000
1470
3528
44100
1544
Establishment Division
- Staff Welfare Organization
- Staff Welfare Organization
- Board of Trustees, Federal
Employees Benevolent & Group
Insurance Fund
- Pakistan Academy for Rural
Development & Akhtar Hameed Khan
National Centre for Rural Development.
Rs. '000
25Cabinet Secretariat
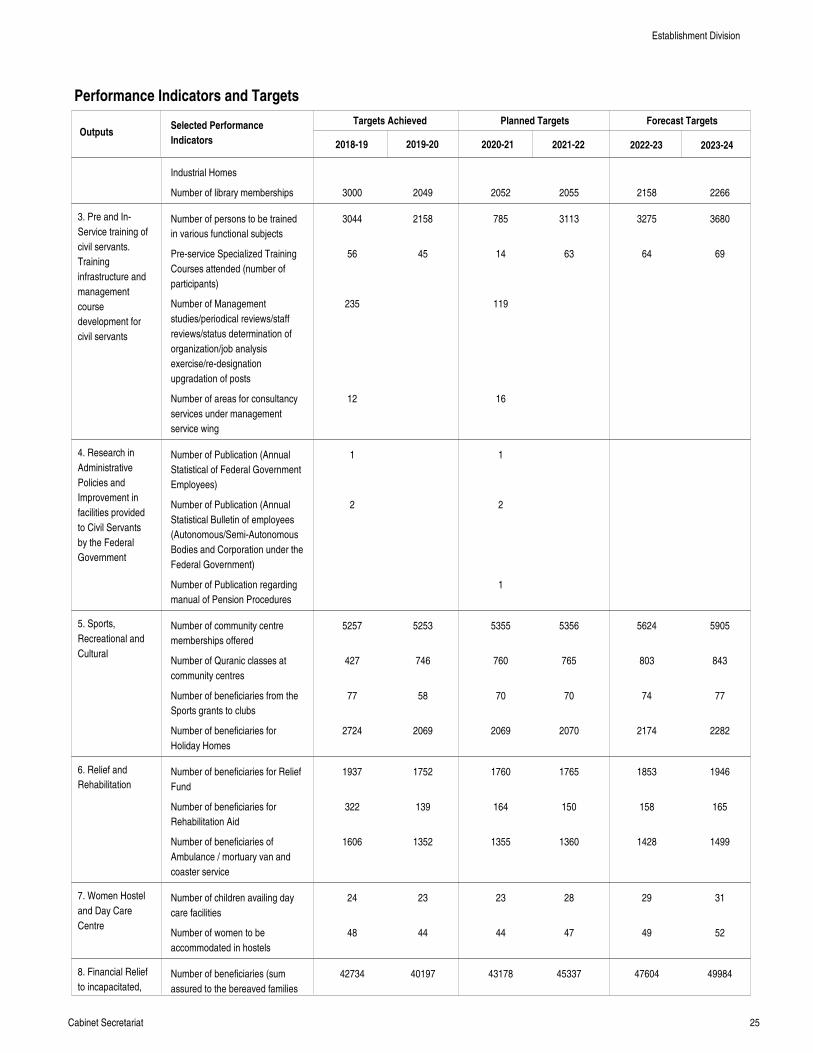
Performance Indicators and Targets
OutputsTargets Achieved Planned Targets Forecast Targets
2018-19 2019-20 2020-21 2021-22 2022-23 2023-24
Selected Performance
Indicators
3. Pre and In-
Service training of
civil servants.
Training
infrastructure and
management
course
development for
civil servants
4. Research in
Administrative
Policies and
Improvement in
facilities provided
to Civil Servants
by the Federal
Government
5. Sports,
Recreational and
Cultural
6. Relief and
Rehabilitation
7. Women Hostel
and Day Care
Centre
8. Financial Relief
to incapacitated,
Industrial Homes
Number of library memberships
Number of persons to be trained
in various functional subjects
Pre-service Specialized Training
Courses attended (number of
participants)
Number of Management
studies/periodical reviews/staff
reviews/status determination of
organization/job analysis
exercise/re-designation
upgradation of posts
Number of areas for consultancy
services under management
service wing
Number of Publication (Annual
Statistical of Federal Government
Employees)
Number of Publication (Annual
Statistical Bulletin of employees
(Autonomous/Semi-Autonomous
Bodies and Corporation under the
Federal Government)
Number of Publication regarding
manual of Pension Procedures
Number of community centre
memberships offered
Number of Quranic classes at
community centres
Number of beneficiaries from the
Sports grants to clubs
Number of beneficiaries for
Holiday Homes
Number of beneficiaries for Relief
Fund
Number of beneficiaries for
Rehabilitation Aid
Number of beneficiaries of
Ambulance / mortuary van and
coaster service
Number of children availing day
care facilities
Number of women to be
accommodated in hostels
Number of beneficiaries (sum
assured to the bereaved families
3000
3044
56
235
12
1
2
5257
427
77
2724
1937
322
1606
24
48
42734
2049
2158
45
5253
746
58
2069
1752
139
1352
23
44
40197
2052
785
14
119
16
1
2
1
5355
760
70
2069
1760
164
1355
23
44
43178
2055
3113
63
5356
765
70
2070
1765
150
1360
28
47
45337
2158
3275
64
5624
803
74
2174
1853
158
1428
29
49
47604
2266
3680
69
5905
843
77
2282
1946
165
1499
31
52
49984
Establishment Division
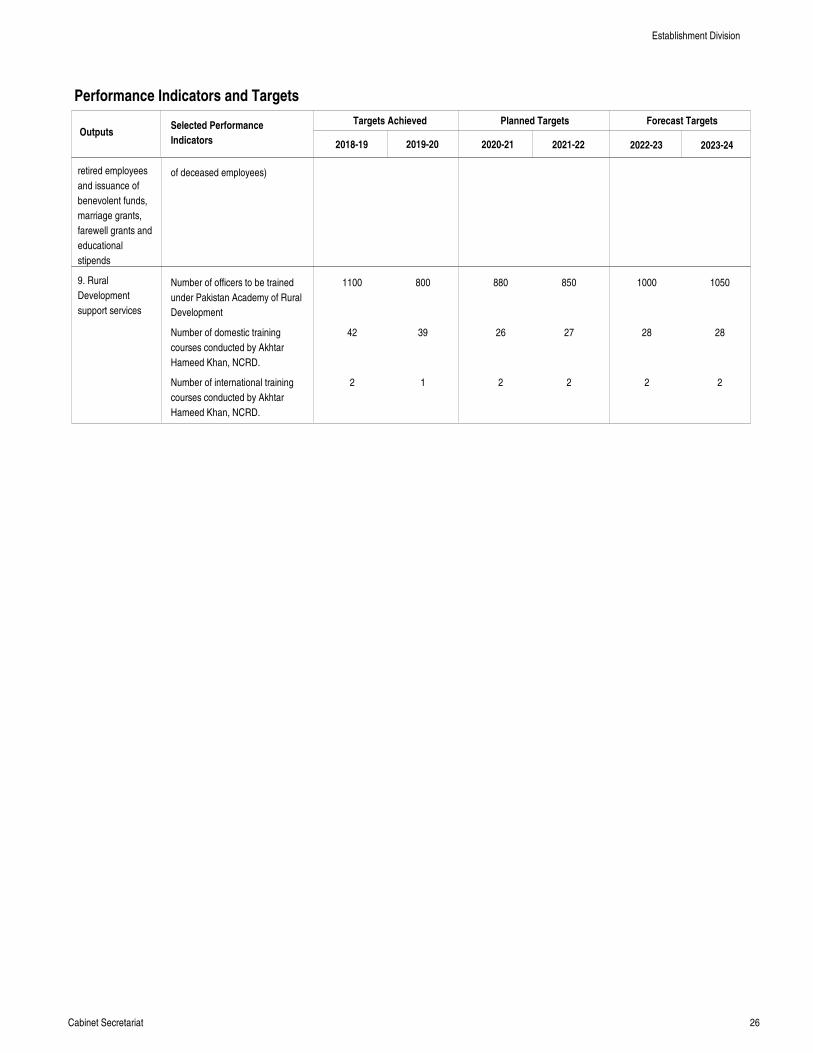
26Cabinet Secretariat
Performance Indicators and Targets
OutputsTargets Achieved Planned Targets Forecast Targets
2018-19 2019-20 2020-21 2021-22 2022-23 2023-24
Selected Performance
Indicators
retired employees
and issuance of
benevolent funds,
marriage grants,
farewell grants and
educational
stipends
9. Rural
Development
support services
of deceased employees)
Number of officers to be trained
under Pakistan Academy of Rural
Development
Number of domestic training
courses conducted by Akhtar
Hameed Khan, NCRD.
Number of international training
courses conducted by Akhtar
Hameed Khan, NCRD.
1100
42
2
800
39
1
880
26
2
850
27
2
1000
28
2
1050
28
2
Establishment Division
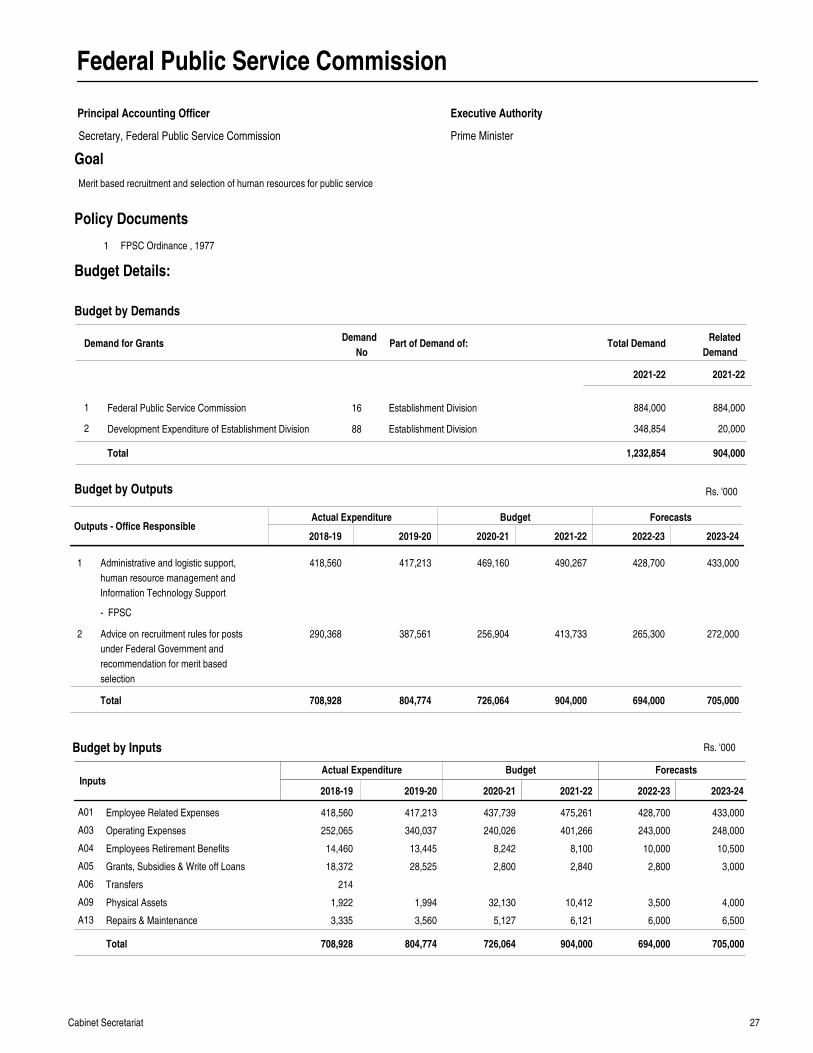
27Cabinet Secretariat
Federal Public Service Commission
Principal Accounting Officer
Prime Minister
Executive Authority
Goal
Outputs - Office ResponsibleActual Expenditure Budget Forecasts
2018-19 2019-20 2020-21 2021-22 2022-23 2023-24
Administrative and logistic support,
human resource management and
Information Technology Support
Advice on recruitment rules for posts
under Federal Government and
recommendation for merit based
selection
418,560
290,368
417,213
387,561
469,160
256,904
490,267
413,733
428,700
265,300
433,000
272,000
1
2
Total 708,928 804,774 726,064 904,000 694,000 705,000
Rs. '000
Federal Public Service Commission
Development Expenditure of Establishment Division
1
2
16
88
Establishment Division
Establishment Division
884,000
348,854
884,000
20,000
Demand for GrantsDemand
NoPart of Demand of: Total Demand
2021-22
1,232,854 904,000Total
InputsActual Expenditure Budget Forecasts
Employee Related Expenses
Operating Expenses
Employees Retirement Benefits
Grants, Subsidies & Write off Loans
Transfers
Physical Assets
Repairs & Maintenance
418,560
252,065
14,460
18,372
214
1,922
3,335
417,213
340,037
13,445
28,525
1,994
3,560
437,739
240,026
8,242
2,800
32,130
5,127
475,261
401,266
8,100
2,840
10,412
6,121
428,700
243,000
10,000
2,800
3,500
6,000
433,000
248,000
10,500
3,000
4,000
6,500
A01
A03
A04
A05
A06
A09
A13
Total 708,928 804,774 726,064 904,000 694,000 705,000
2018-19 2019-20 2020-21 2021-22 2022-23 2023-24
1 FPSC Ordinance , 1977
Policy Documents
Budget by Outputs
Budget by Demands
Budget by Inputs
Merit based recruitment and selection of human resources for public service
Secretary, Federal Public Service Commission
Budget Details:
- FPSC
Rs. '000
2021-22
Related
Demand
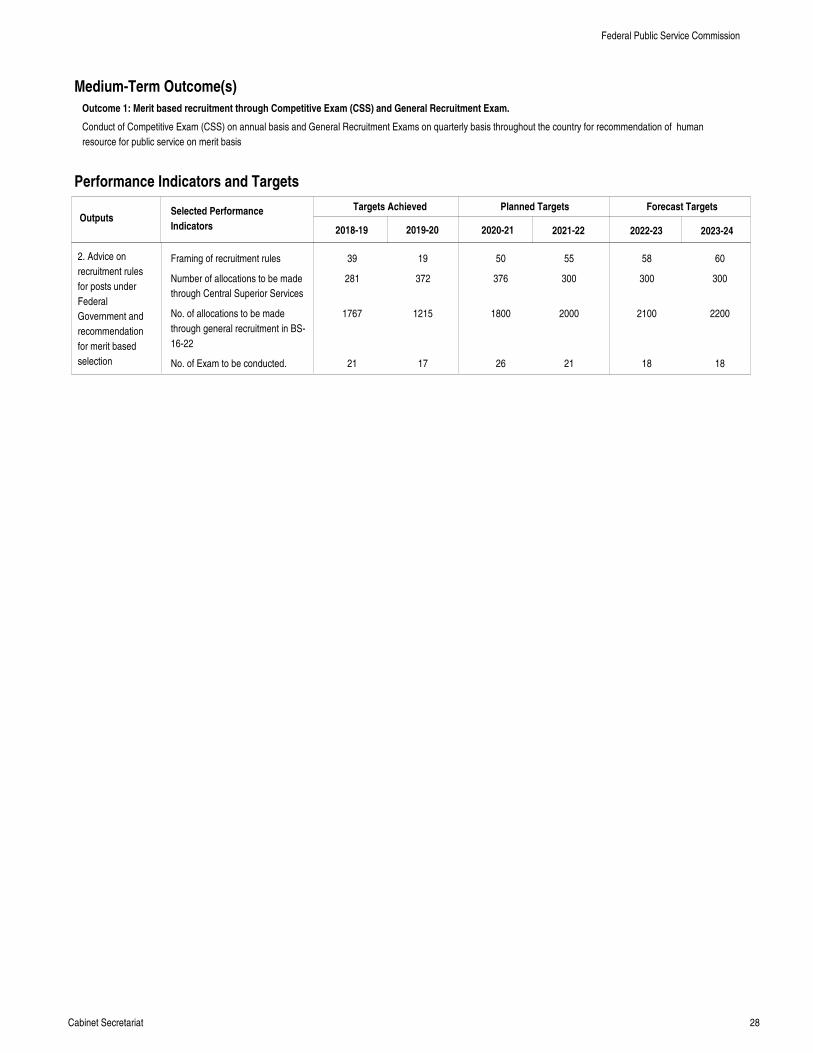
28Cabinet Secretariat
Conduct of Competitive Exam (CSS) on annual basis and General Recruitment Exams on quarterly basis throughout the country for recommendation of human
resource for public service on merit basis
Medium-Term Outcome(s)
Outcome 1: Merit based recruitment through Competitive Exam (CSS) and General Recruitment Exam.
Performance Indicators and Targets
OutputsTargets Achieved Planned Targets Forecast Targets
2018-19 2019-20 2020-21 2021-22 2022-23 2023-24
Selected Performance
Indicators
2. Advice on
recruitment rules
for posts under
Federal
Government and
recommendation
for merit based
selection
Framing of recruitment rules
Number of allocations to be made
through Central Superior Services
No. of allocations to be made
through general recruitment in BS-
16-22
No. of Exam to be conducted.
39
281
1767
21
19
372
1215
17
50
376
1800
26
55
300
2000
21
58
300
2100
18
60
300
2200
18
Federal Public Service Commission
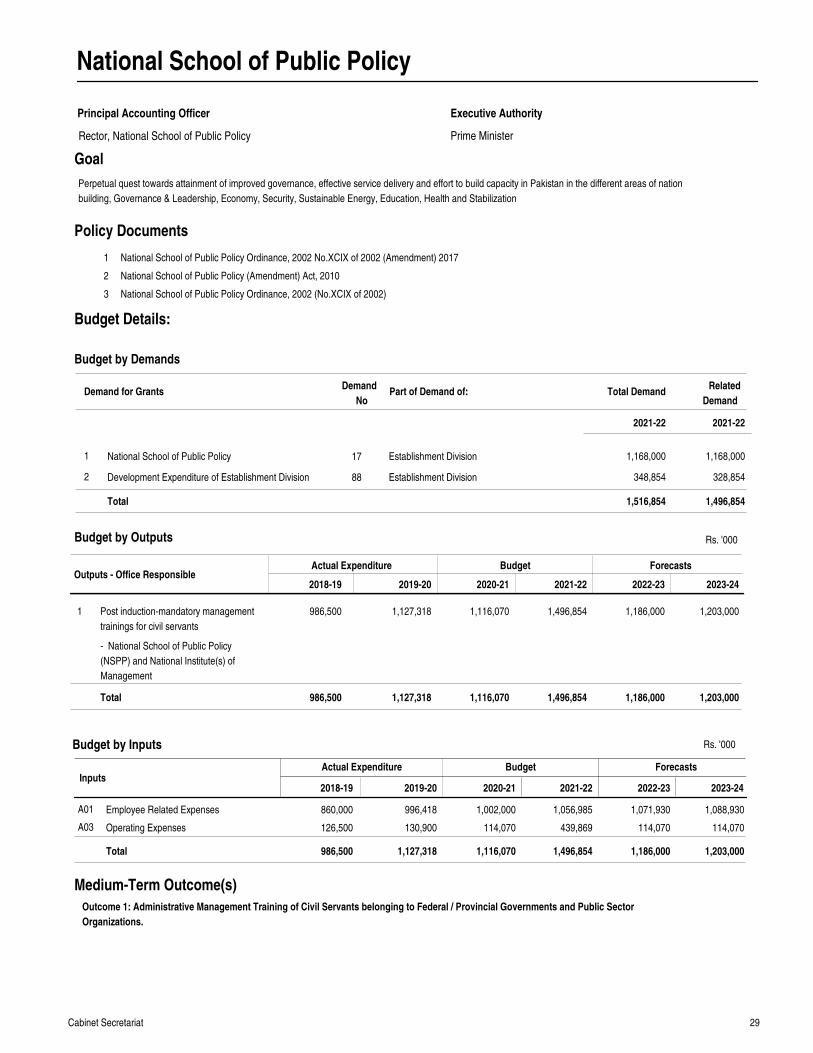
29Cabinet Secretariat
National School of Public Policy
Principal Accounting Officer
Prime Minister
Executive Authority
Goal
Outputs - Office ResponsibleActual Expenditure Budget Forecasts
2018-19 2019-20 2020-21 2021-22 2022-23 2023-24
Post induction-mandatory management
trainings for civil servants
986,500 1,127,318 1,116,070 1,496,854 1,186,000 1,203,0001
Total 986,500 1,127,318 1,116,070 1,496,854 1,186,000 1,203,000
Rs. '000
National School of Public Policy
Development Expenditure of Establishment Division
1
2
17
88
Establishment Division
Establishment Division
1,168,000
348,854
1,168,000
328,854
Demand for GrantsDemand
NoPart of Demand of: Total Demand
2021-22
1,516,854 1,496,854Total
InputsActual Expenditure Budget Forecasts
Employee Related Expenses
Operating Expenses
860,000
126,500
996,418
130,900
1,002,000
114,070
1,056,985
439,869
1,071,930
114,070
1,088,930
114,070
A01
A03
Total 986,500 1,127,318 1,116,070 1,496,854 1,186,000 1,203,000
2018-19 2019-20 2020-21 2021-22 2022-23 2023-24
1
2
3
National School of Public Policy Ordinance, 2002 No.XCIX of 2002 (Amendment) 2017
National School of Public Policy (Amendment) Act, 2010
National School of Public Policy Ordinance, 2002 (No.XCIX of 2002)
Policy Documents
Medium-Term Outcome(s)
Outcome 1: Administrative Management Training of Civil Servants belonging to Federal / Provincial Governments and Public Sector
Organizations.
Budget by Outputs
Budget by Demands
Budget by Inputs
Perpetual quest towards attainment of improved governance, effective service delivery and effort to build capacity in Pakistan in the different areas of nation
building, Governance & Leadership, Economy, Security, Sustainable Energy, Education, Health and Stabilization
Rector, National School of Public Policy
Budget Details:
- National School of Public Policy
(NSPP) and National Institute(s) of
Management
Rs. '000
2021-22
Related
Demand
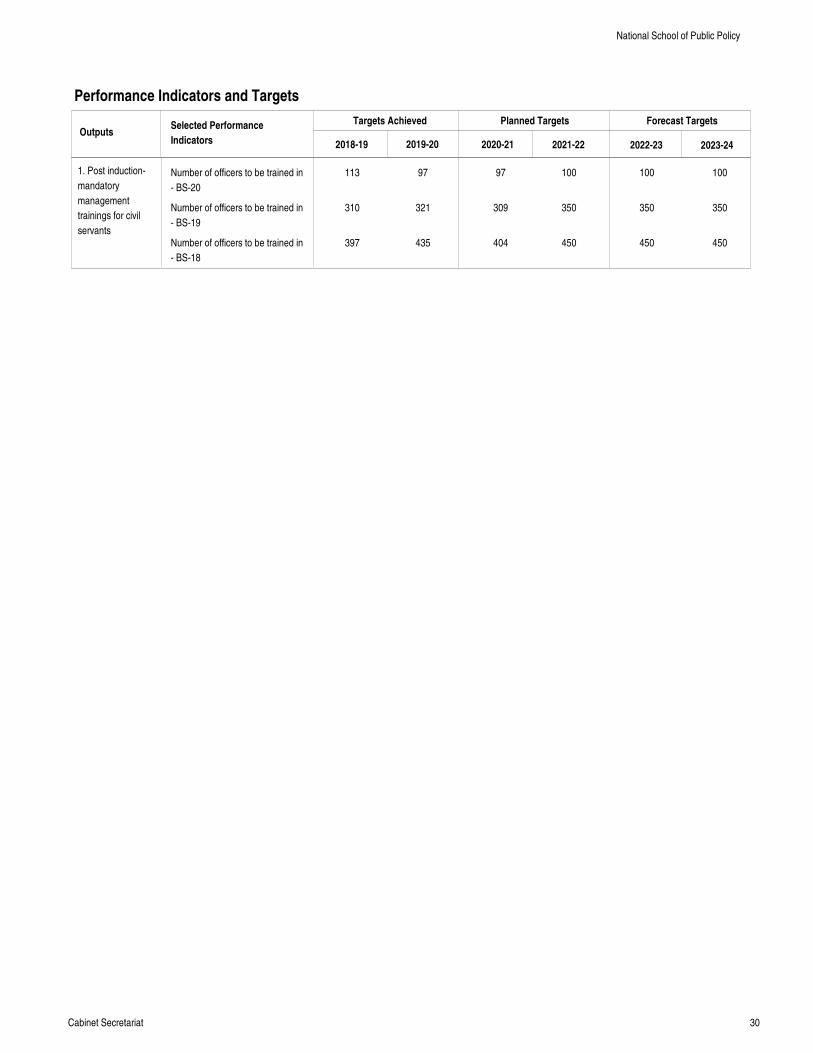
30Cabinet Secretariat
Performance Indicators and Targets
OutputsTargets Achieved Planned Targets Forecast Targets
2018-19 2019-20 2020-21 2021-22 2022-23 2023-24
Selected Performance
Indicators
1. Post induction-
mandatory
management
trainings for civil
servants
Number of officers to be trained in
- BS-20
Number of officers to be trained in
- BS-19
Number of officers to be trained in
- BS-18
113
310
397
97
321
435
97
309
404
100
350
450
100
350
450
100
350
450
National School of Public Policy
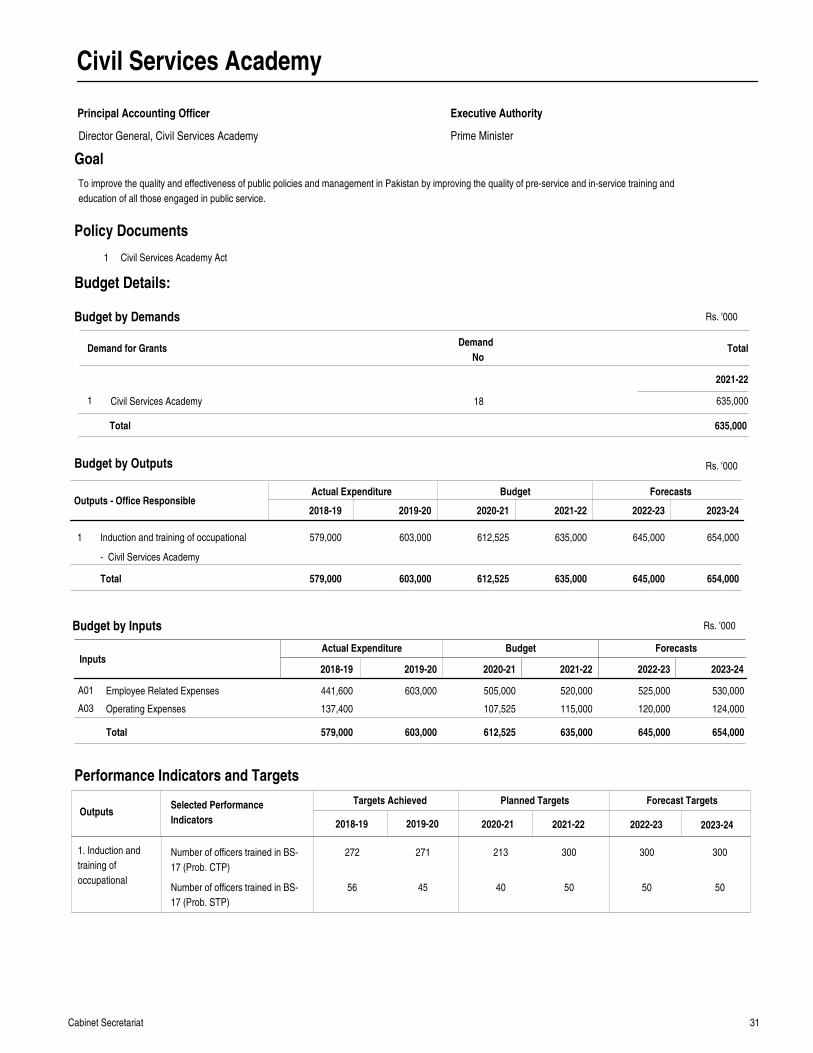
31Cabinet Secretariat
Civil Services Academy
Principal Accounting Officer
Prime Minister
Executive Authority
Goal
Outputs - Office ResponsibleActual Expenditure Budget Forecasts
2018-19 2019-20 2020-21 2021-22 2022-23 2023-24
Induction and training of occupational 579,000 603,000 612,525 635,000 645,000 654,0001
Total 579,000 603,000 612,525 635,000 645,000 654,000
Rs. '000
InputsActual Expenditure Budget Forecasts
Employee Related Expenses
Operating Expenses
441,600
137,400
603,000 505,000
107,525
520,000
115,000
525,000
120,000
530,000
124,000
A01
A03
Total 579,000 603,000 612,525 635,000 645,000 654,000
2018-19 2019-20 2020-21 2021-22 2022-23 2023-24
1 Civil Services Academy Act
Policy Documents
Performance Indicators and Targets
OutputsTargets Achieved Planned Targets Forecast Targets
2018-19 2019-20 2020-21 2021-22 2022-23 2023-24
Selected Performance
Indicators
1. Induction and
training of
occupational
Budget by Outputs
Budget by Inputs
To improve the quality and effectiveness of public policies and management in Pakistan by improving the quality of pre-service and in-service training and
education of all those engaged in public service.
Number of officers trained in BS-
17 (Prob. CTP)
Number of officers trained in BS-
17 (Prob. STP)
272
56
271
45
213
40
300
50
300
50
300
50
Demand for GrantsDemand
NoTotal
2021-22
Budget by Demands
Civil Services Academy1 18 635,000
635,000Total
Director General, Civil Services Academy
Budget Details:
- Civil Services Academy
Rs. '000
Rs. '000
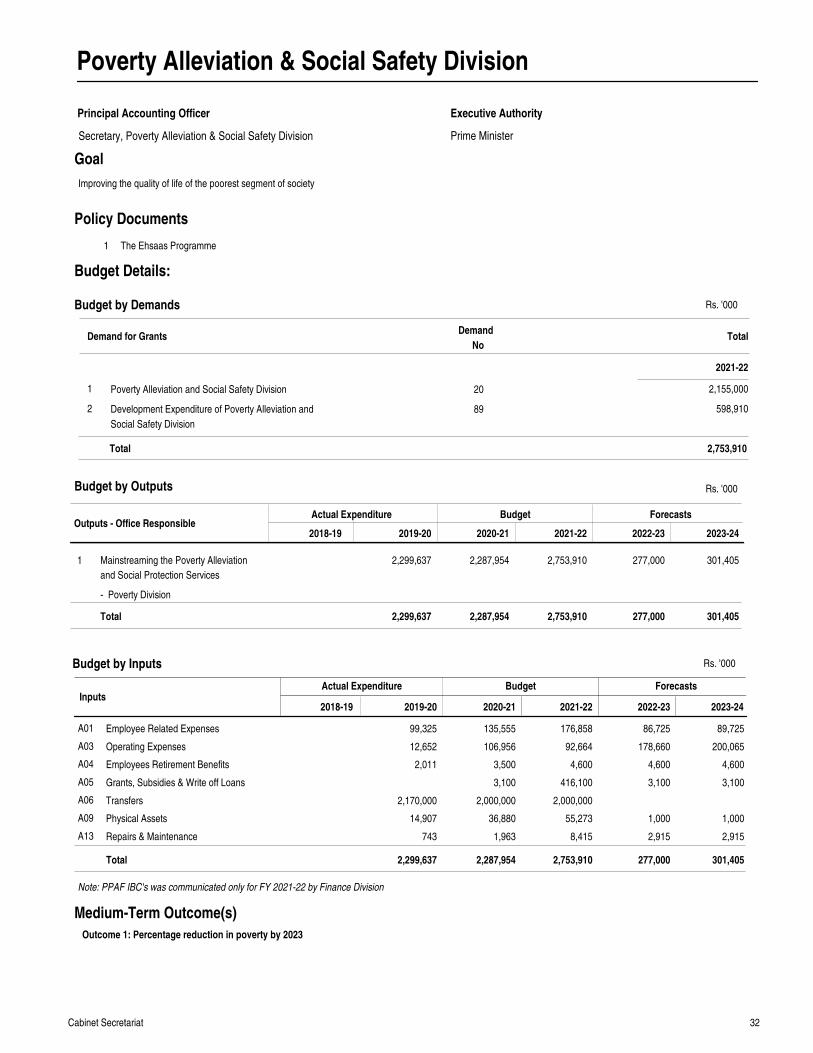
32Cabinet Secretariat
Poverty Alleviation & Social Safety Division
Principal Accounting Officer
Prime Minister
Executive Authority
Goal
Outputs - Office ResponsibleActual Expenditure Budget Forecasts
2018-19 2019-20 2020-21 2021-22 2022-23 2023-24
Mainstreaming the Poverty Alleviation
and Social Protection Services
2,299,637 2,287,954 2,753,910 277,000 301,4051
Total 2,299,637 2,287,954 2,753,910 277,000 301,405
Rs. '000
InputsActual Expenditure Budget Forecasts
Employee Related Expenses
Operating Expenses
Employees Retirement Benefits
Grants, Subsidies & Write off Loans
Transfers
Physical Assets
Repairs & Maintenance
99,325
12,652
2,011
2,170,000
14,907
743
135,555
106,956
3,500
3,100
2,000,000
36,880
1,963
176,858
92,664
4,600
416,100
2,000,000
55,273
8,415
86,725
178,660
4,600
3,100
1,000
2,915
89,725
200,065
4,600
3,100
1,000
2,915
A01
A03
A04
A05
A06
A09
A13
Total 2,299,637 2,287,954 2,753,910 277,000 301,405
Note: PPAF IBC's was communicated only for FY 2021-22 by Finance Division
2018-19 2019-20 2020-21 2021-22 2022-23 2023-24
1 The Ehsaas Programme
Policy Documents
Medium-Term Outcome(s)
Outcome 1: Percentage reduction in poverty by 2023
Budget by Outputs
Budget by Inputs
Improving the quality of life of the poorest segment of society
Demand for GrantsDemand
NoTotal
2021-22
Budget by Demands
Poverty Alleviation and Social Safety Division
Development Expenditure of Poverty Alleviation and
Social Safety Division
1
2
20
89
2,155,000
598,910
2,753,910Total
Secretary, Poverty Alleviation & Social Safety Division
Budget Details:
- Poverty Division
Rs. '000
Rs. '000
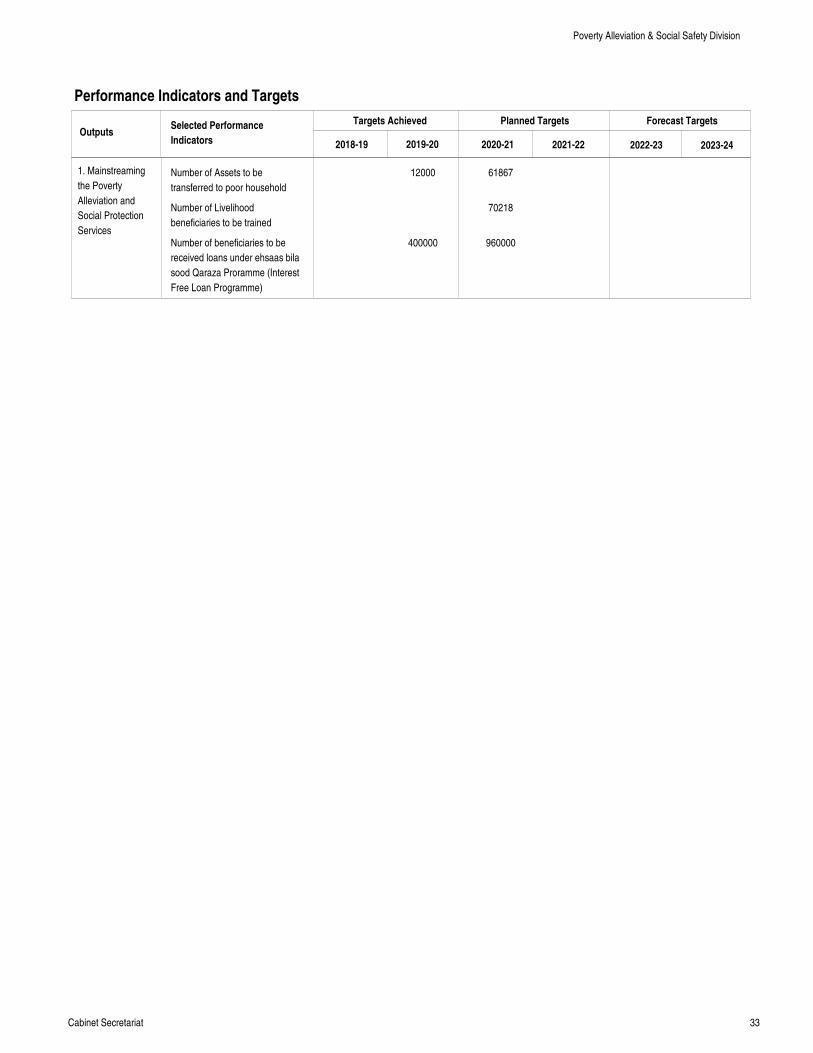
33Cabinet Secretariat
Performance Indicators and Targets
OutputsTargets Achieved Planned Targets Forecast Targets
2018-19 2019-20 2020-21 2021-22 2022-23 2023-24
Selected Performance
Indicators
1. Mainstreaming
the Poverty
Alleviation and
Social Protection
Services
Number of Assets to be
transferred to poor household
Number of Livelihood
beneficiaries to be trained
Number of beneficiaries to be
received loans under ehsaas bila
sood Qaraza Proramme (Interest
Free Loan Programme)
12000
400000
61867
70218
960000
Poverty Alleviation & Social Safety Division
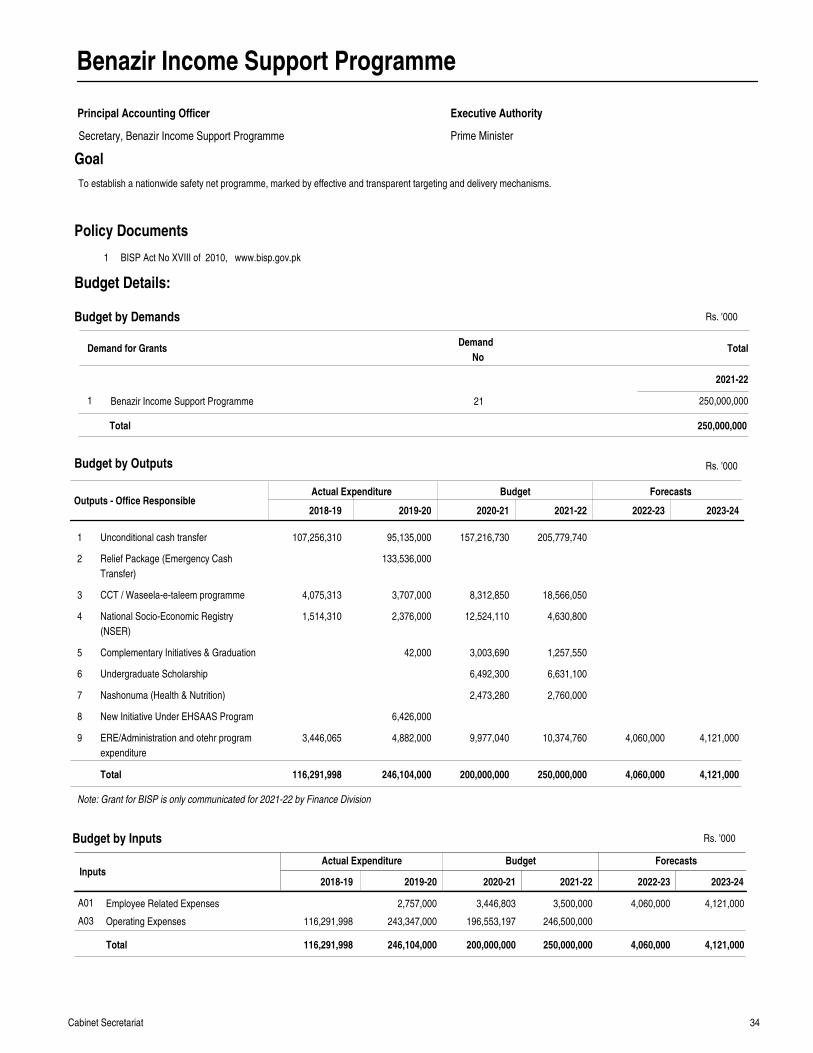
34Cabinet Secretariat
Benazir Income Support Programme
Principal Accounting Officer
Prime Minister
Executive Authority
Goal
Outputs - Office ResponsibleActual Expenditure Budget Forecasts
2018-19 2019-20 2020-21 2021-22 2022-23 2023-24
Unconditional cash transfer
Relief Package (Emergency Cash
Transfer)
CCT / Waseela-e-taleem programme
National Socio-Economic Registry
(NSER)
Complementary Initiatives & Graduation
Undergraduate Scholarship
Nashonuma (Health & Nutrition)
New Initiative Under EHSAAS Program
ERE/Administration and otehr program
expenditure
107,256,310
4,075,313
1,514,310
3,446,065
95,135,000
133,536,000
3,707,000
2,376,000
42,000
6,426,000
4,882,000
157,216,730
8,312,850
12,524,110
3,003,690
6,492,300
2,473,280
9,977,040
205,779,740
18,566,050
4,630,800
1,257,550
6,631,100
2,760,000
10,374,760 4,060,000 4,121,000
1
2
3
4
5
6
7
8
9
Total 116,291,998 246,104,000 200,000,000 250,000,000 4,060,000 4,121,000
Note: Grant for BISP is only communicated for 2021-22 by Finance Division
Rs. '000
InputsActual Expenditure Budget Forecasts
Employee Related Expenses
Operating Expenses 116,291,998
2,757,000
243,347,000
3,446,803
196,553,197
3,500,000
246,500,000
4,060,000 4,121,000A01
A03
Total 116,291,998 246,104,000 200,000,000 250,000,000 4,060,000 4,121,000
2018-19 2019-20 2020-21 2021-22 2022-23 2023-24
1 BISP Act No XVIII of 2010, www.bisp.gov.pk
Policy Documents
Budget by Outputs
Budget by Inputs
To establish a nationwide safety net programme, marked by effective and transparent targeting and delivery mechanisms.
Demand for GrantsDemand
NoTotal
2021-22
Budget by Demands
Benazir Income Support Programme1 21 250,000,000
250,000,000Total
Secretary, Benazir Income Support Programme
Budget Details:
Rs. '000
Rs. '000
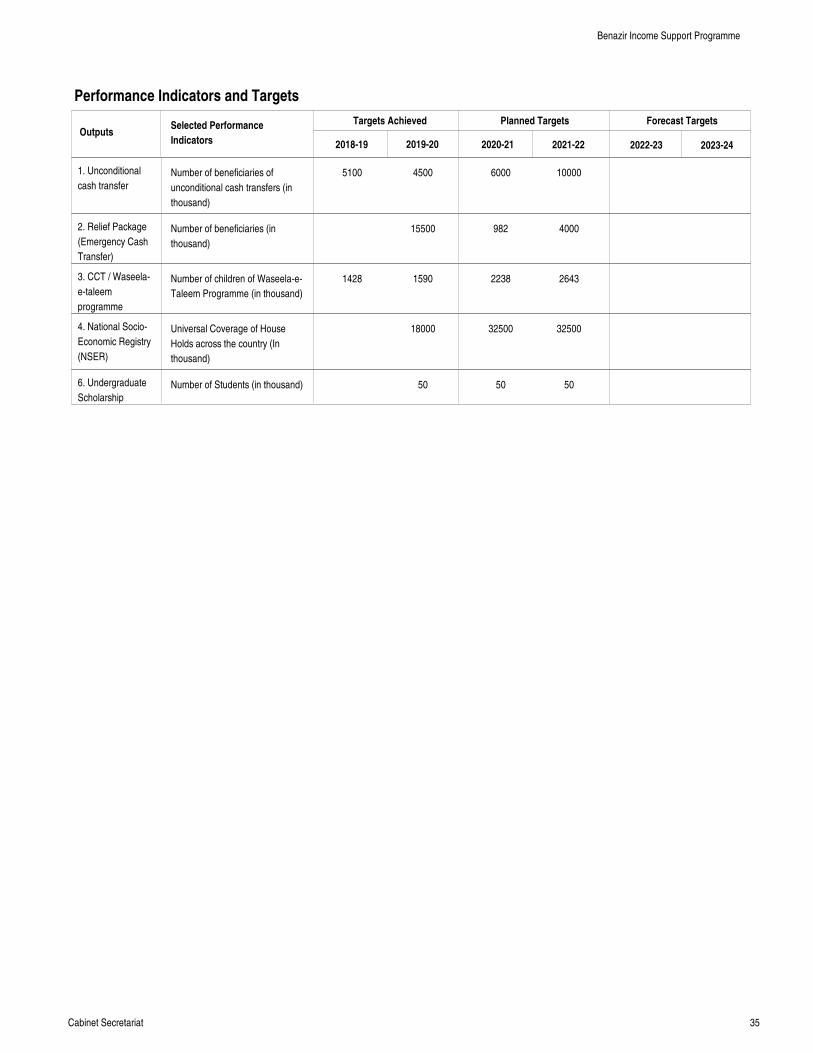
35Cabinet Secretariat
Performance Indicators and Targets
OutputsTargets Achieved Planned Targets Forecast Targets
2018-19 2019-20 2020-21 2021-22 2022-23 2023-24
Selected Performance
Indicators
1. Unconditional
cash transfer
2. Relief Package
(Emergency Cash
Transfer)
3. CCT / Waseela-
e-taleem
programme
4. National Socio-
Economic Registry
(NSER)
6. Undergraduate
Scholarship
Number of beneficiaries of
unconditional cash transfers (in
thousand)
Number of beneficiaries (in
thousand)
Number of children of Waseela-e-
Taleem Programme (in thousand)
Universal Coverage of House
Holds across the country (In
thousand)
Number of Students (in thousand)
5100
1428
4500
15500
1590
18000
50
6000
982
2238
32500
50
10000
4000
2643
32500
50
Benazir Income Support Programme
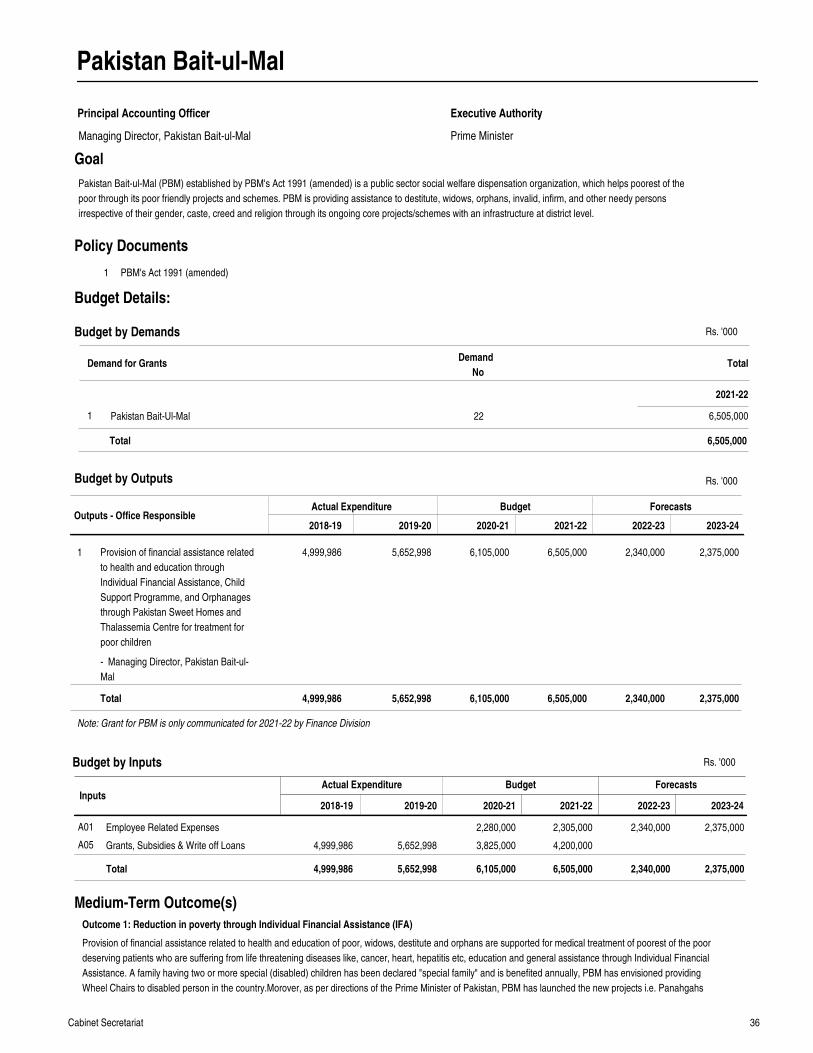
36Cabinet Secretariat
Pakistan Bait-ul-Mal
Principal Accounting Officer
Prime Minister
Executive Authority
Goal
Outputs - Office ResponsibleActual Expenditure Budget Forecasts
2018-19 2019-20 2020-21 2021-22 2022-23 2023-24
Provision of financial assistance related
to health and education through
Individual Financial Assistance, Child
Support Programme, and Orphanages
through Pakistan Sweet Homes and
Thalassemia Centre for treatment for
poor children
4,999,986 5,652,998 6,105,000 6,505,000 2,340,000 2,375,0001
Total 4,999,986 5,652,998 6,105,000 6,505,000 2,340,000 2,375,000
Note: Grant for PBM is only communicated for 2021-22 by Finance Division
Rs. '000
InputsActual Expenditure Budget Forecasts
Employee Related Expenses
Grants, Subsidies & Write off Loans 4,999,986 5,652,998
2,280,000
3,825,000
2,305,000
4,200,000
2,340,000 2,375,000A01
A05
Total 4,999,986 5,652,998 6,105,000 6,505,000 2,340,000 2,375,000
2018-19 2019-20 2020-21 2021-22 2022-23 2023-24
1 PBM's Act 1991 (amended)
Policy Documents
Provision of financial assistance related to health and education of poor, widows, destitute and orphans are supported for medical treatment of poorest of the poor
deserving patients who are suffering from life threatening diseases like, cancer, heart, hepatitis etc, education and general assistance through Individual Financial
Assistance. A family having two or more special (disabled) children has been declared "special family" and is benefited annually, PBM has envisioned providing
Wheel Chairs to disabled person in the country.Morover, as per directions of the Prime Minister of Pakistan, PBM has launched the new projects i.e. Panahgahs
Medium-Term Outcome(s)
Outcome 1: Reduction in poverty through Individual Financial Assistance (IFA)
Budget by Outputs
Budget by Inputs
Pakistan Bait-ul-Mal (PBM) established by PBM's Act 1991 (amended) is a public sector social welfare dispensation organization, which helps poorest of the
poor through its poor friendly projects and schemes. PBM is providing assistance to destitute, widows, orphans, invalid, infirm, and other needy persons
irrespective of their gender, caste, creed and religion through its ongoing core projects/schemes with an infrastructure at district level.
Demand for GrantsDemand
NoTotal
2021-22
Budget by Demands
Pakistan Bait-Ul-Mal1 22 6,505,000
6,505,000Total
Managing Director, Pakistan Bait-ul-Mal
Budget Details:
- Managing Director, Pakistan Bait-ul-
Mal
Rs. '000
Rs. '000
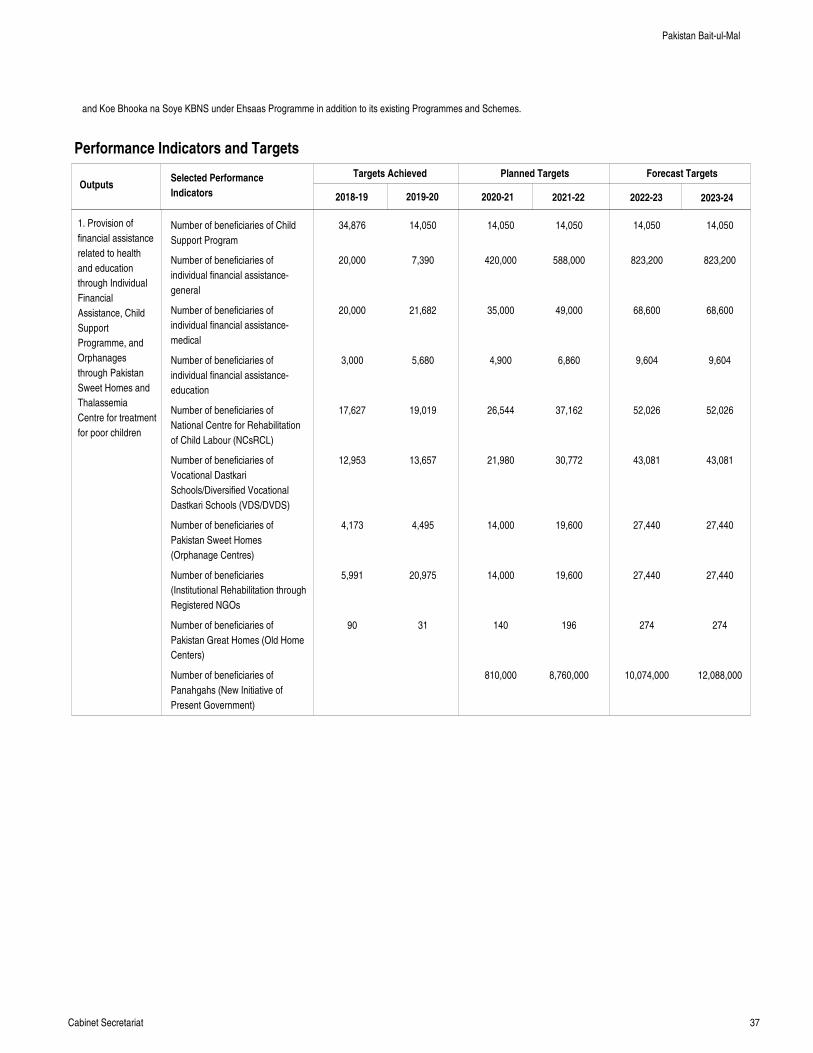
37Cabinet Secretariat
and Koe Bhooka na Soye KBNS under Ehsaas Programme in addition to its existing Programmes and Schemes.
Performance Indicators and Targets
OutputsTargets Achieved Planned Targets Forecast Targets
2018-19 2019-20 2020-21 2021-22 2022-23 2023-24
Selected Performance
Indicators
1. Provision of
financial assistance
related to health
and education
through Individual
Financial
Assistance, Child
Support
Programme, and
Orphanages
through Pakistan
Sweet Homes and
Thalassemia
Centre for treatment
for poor children
Number of beneficiaries of Child
Support Program
Number of beneficiaries of
individual financial assistance-
general
Number of beneficiaries of
individual financial assistance-
medical
Number of beneficiaries of
individual financial assistance-
education
Number of beneficiaries of
National Centre for Rehabilitation
of Child Labour (NCsRCL)
Number of beneficiaries of
Vocational Dastkari
Schools/Diversified Vocational
Dastkari Schools (VDS/DVDS)
Number of beneficiaries of
Pakistan Sweet Homes
(Orphanage Centres)
Number of beneficiaries
(Institutional Rehabilitation through
Registered NGOs
Number of beneficiaries of
Pakistan Great Homes (Old Home
Centers)
Number of beneficiaries of
Panahgahs (New Initiative of
Present Government)
34,876
20,000
20,000
3,000
17,627
12,953
4,173
5,991
90
14,050
7,390
21,682
5,680
19,019
13,657
4,495
20,975
31
14,050
420,000
35,000
4,900
26,544
21,980
14,000
14,000
140
810,000
14,050
588,000
49,000
6,860
37,162
30,772
19,600
19,600
196
8,760,000
14,050
823,200
68,600
9,604
52,026
43,081
27,440
27,440
274
10,074,000
14,050
823,200
68,600
9,604
52,026
43,081
27,440
27,440
274
12,088,000
Pakistan Bait-ul-Mal
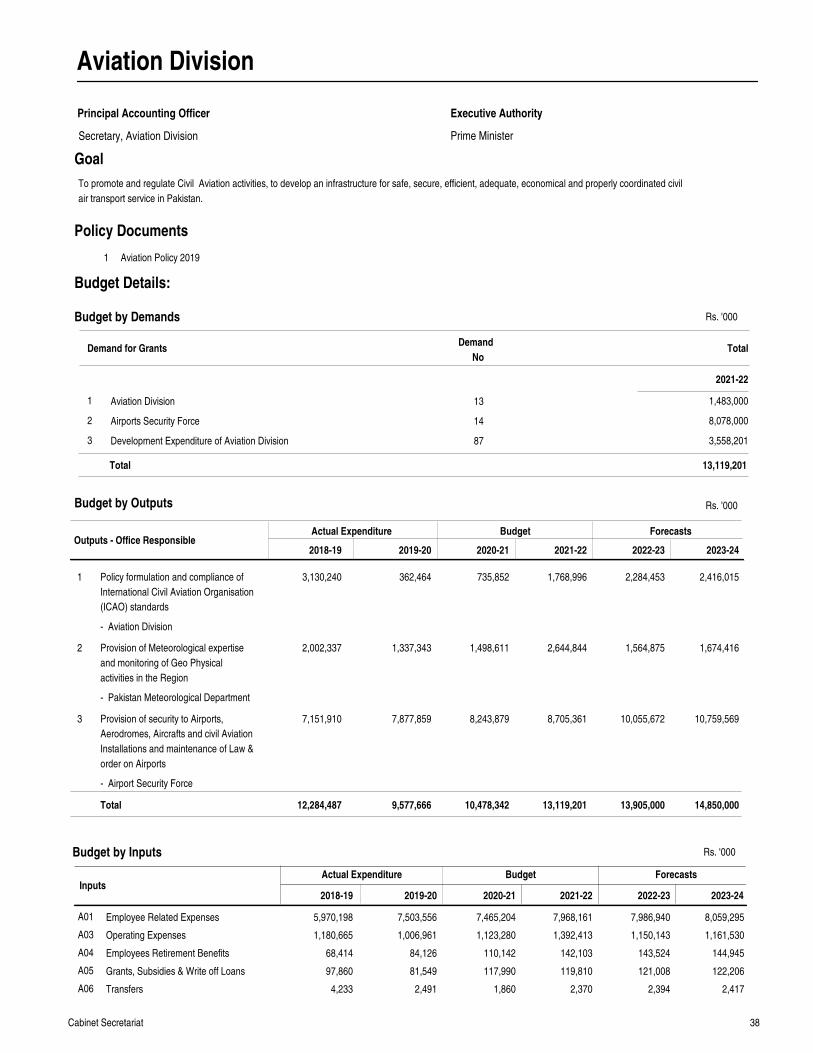
38Cabinet Secretariat
Aviation Division
Principal Accounting Officer
Prime Minister
Executive Authority
Goal
Outputs - Office ResponsibleActual Expenditure Budget Forecasts
2018-19 2019-20 2020-21 2021-22 2022-23 2023-24
Policy formulation and compliance of
International Civil Aviation Organisation
(ICAO) standards
Provision of Meteorological expertise
and monitoring of Geo Physical
activities in the Region
Provision of security to Airports,
Aerodromes, Aircrafts and civil Aviation
Installations and maintenance of Law &
order on Airports
3,130,240
2,002,337
7,151,910
362,464
1,337,343
7,877,859
735,852
1,498,611
8,243,879
1,768,996
2,644,844
8,705,361
2,284,453
1,564,875
10,055,672
2,416,015
1,674,416
10,759,569
1
2
3
Total 12,284,487 9,577,666 10,478,342 13,119,201 13,905,000 14,850,000
Rs. '000
InputsActual Expenditure Budget Forecasts
Employee Related Expenses
Operating Expenses
Employees Retirement Benefits
Grants, Subsidies & Write off Loans
Transfers
5,970,198
1,180,665
68,414
97,860
4,233
7,503,556
1,006,961
84,126
81,549
2,491
7,465,204
1,123,280
110,142
117,990
1,860
7,968,161
1,392,413
142,103
119,810
2,370
7,986,940
1,150,143
143,524
121,008
2,394
8,059,295
1,161,530
144,945
122,206
2,417
A01
A03
A04
A05
A06
2018-19 2019-20 2020-21 2021-22 2022-23 2023-24
1 Aviation Policy 2019
Policy Documents
Budget by Outputs
Budget by Inputs
To promote and regulate Civil Aviation activities, to develop an infrastructure for safe, secure, efficient, adequate, economical and properly coordinated civil
air transport service in Pakistan.
Demand for GrantsDemand
NoTotal
2021-22
Budget by Demands
Aviation Division
Airports Security Force
Development Expenditure of Aviation Division
1
2
3
13
14
87
1,483,000
8,078,000
3,558,201
13,119,201Total
Secretary, Aviation Division
Budget Details:
- Aviation Division
- Pakistan Meteorological Department
- Airport Security Force
Rs. '000
Rs. '000
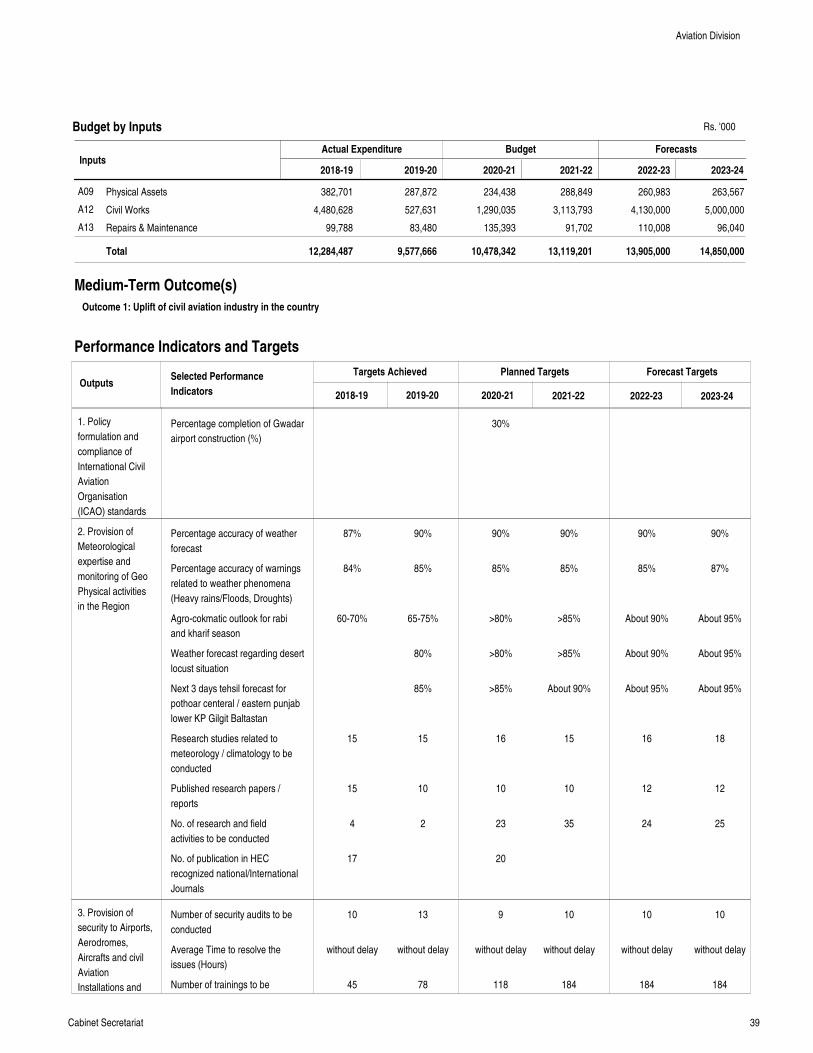
39Cabinet Secretariat
InputsActual Expenditure Budget Forecasts
Physical Assets
Civil Works
Repairs & Maintenance
382,701
4,480,628
99,788
287,872
527,631
83,480
234,438
1,290,035
135,393
288,849
3,113,793
91,702
260,983
4,130,000
110,008
263,567
5,000,000
96,040
A09
A12
A13
Total 12,284,487 9,577,666 10,478,342 13,119,201 13,905,000 14,850,000
2018-19 2019-20 2020-21 2021-22 2022-23 2023-24
Medium-Term Outcome(s)
Outcome 1: Uplift of civil aviation industry in the country
Performance Indicators and Targets
OutputsTargets Achieved Planned Targets Forecast Targets
2018-19 2019-20 2020-21 2021-22 2022-23 2023-24
Selected Performance
Indicators
1. Policy
formulation and
compliance of
International Civil
Aviation
Organisation
(ICAO) standards
2. Provision of
Meteorological
expertise and
monitoring of Geo
Physical activities
in the Region
3. Provision of
security to Airports,
Aerodromes,
Aircrafts and civil
Aviation
Installations and
Budget by Inputs
Percentage completion of Gwadar
airport construction (%)
Percentage accuracy of weather
forecast
Percentage accuracy of warnings
related to weather phenomena
(Heavy rains/Floods, Droughts)
Agro-cokmatic outlook for rabi
and kharif season
Weather forecast regarding desert
locust situation
Next 3 days tehsil forecast for
pothoar centeral / eastern punjab
lower KP Gilgit Baltastan
Research studies related to
meteorology / climatology to be
conducted
Published research papers /
reports
No. of research and field
activities to be conducted
No. of publication in HEC
recognized national/International
Journals
Number of security audits to be
conducted
Average Time to resolve the
issues (Hours)
Number of trainings to be
87%
84%
60-70%
15
15
4
17
10
without delay
45
90%
85%
65-75%
80%
85%
15
10
2
13
without delay
78
30%
90%
85%
>80%
>80%
>85%
16
10
23
20
9
without delay
118
90%
85%
>85%
>85%
About 90%
15
10
35
10
without delay
184
90%
85%
About 90%
About 90%
About 95%
16
12
24
10
without delay
184
90%
87%
About 95%
About 95%
About 95%
18
12
25
10
without delay
184
Aviation Division
Rs. '000
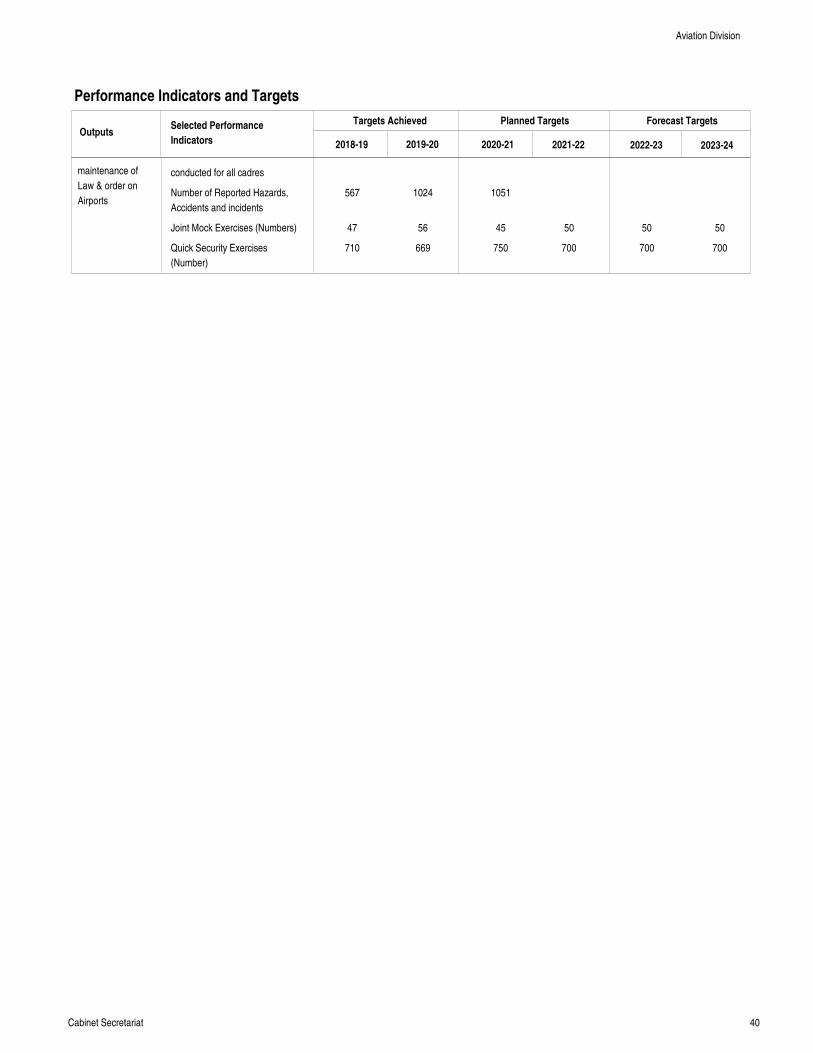
40Cabinet Secretariat
Performance Indicators and Targets
OutputsTargets Achieved Planned Targets Forecast Targets
2018-19 2019-20 2020-21 2021-22 2022-23 2023-24
Selected Performance
Indicators
maintenance of
Law & order on
Airports
conducted for all cadres
Number of Reported Hazards,
Accidents and incidents
Joint Mock Exercises (Numbers)
Quick Security Exercises
(Number)
567
47
710
1024
56
669
1051
45
750
50
700
50
700
50
700
Aviation Division
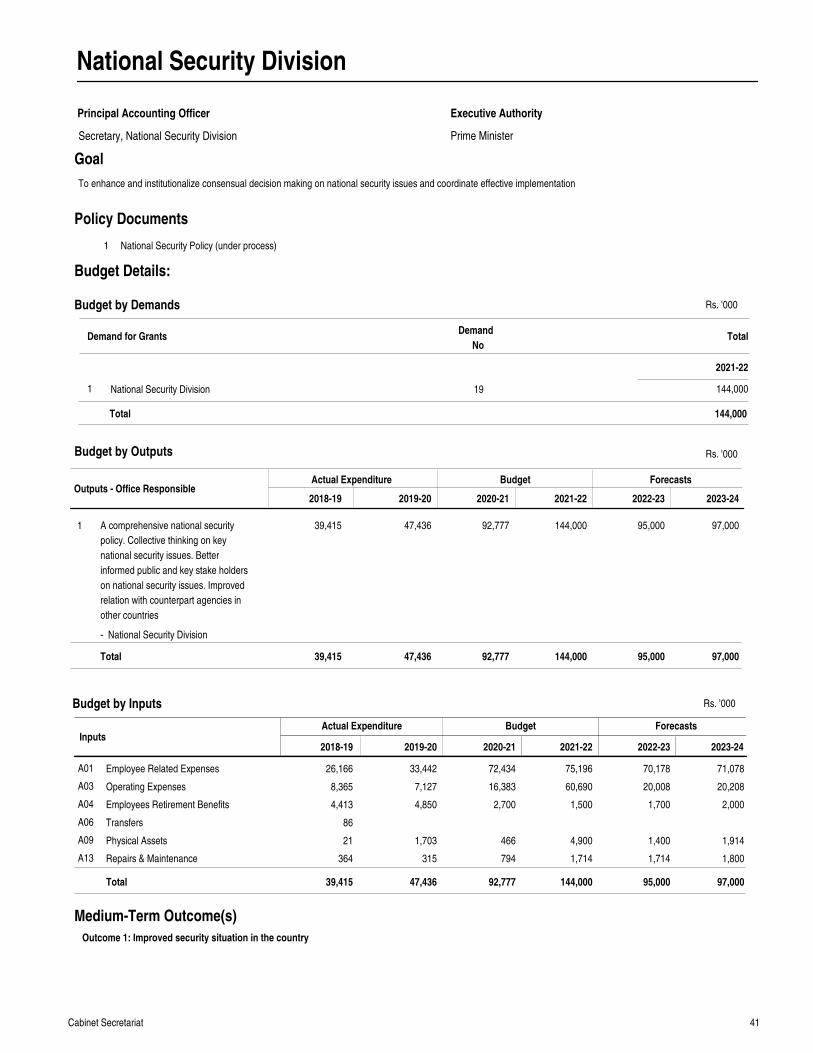
41Cabinet Secretariat
National Security Division
Principal Accounting Officer
Prime Minister
Executive Authority
Goal
Outputs - Office ResponsibleActual Expenditure Budget Forecasts
2018-19 2019-20 2020-21 2021-22 2022-23 2023-24
A comprehensive national security
policy. Collective thinking on key
national security issues. Better
informed public and key stake holders
on national security issues. Improved
relation with counterpart agencies in
other countries
39,415 47,436 92,777 144,000 95,000 97,0001
Total 39,415 47,436 92,777 144,000 95,000 97,000
Rs. '000
InputsActual Expenditure Budget Forecasts
Employee Related Expenses
Operating Expenses
Employees Retirement Benefits
Transfers
Physical Assets
Repairs & Maintenance
26,166
8,365
4,413
86
21
364
33,442
7,127
4,850
1,703
315
72,434
16,383
2,700
466
794
75,196
60,690
1,500
4,900
1,714
70,178
20,008
1,700
1,400
1,714
71,078
20,208
2,000
1,914
1,800
A01
A03
A04
A06
A09
A13
Total 39,415 47,436 92,777 144,000 95,000 97,000
2018-19 2019-20 2020-21 2021-22 2022-23 2023-24
1 National Security Policy (under process)
Policy Documents
Medium-Term Outcome(s)
Outcome 1: Improved security situation in the country
Budget by Outputs
Budget by Inputs
To enhance and institutionalize consensual decision making on national security issues and coordinate effective implementation
Demand for GrantsDemand
NoTotal
2021-22
Budget by Demands
National Security Division1 19 144,000
144,000Total
Secretary, National Security Division
Budget Details:
- National Security Division
Rs. '000
Rs. '000
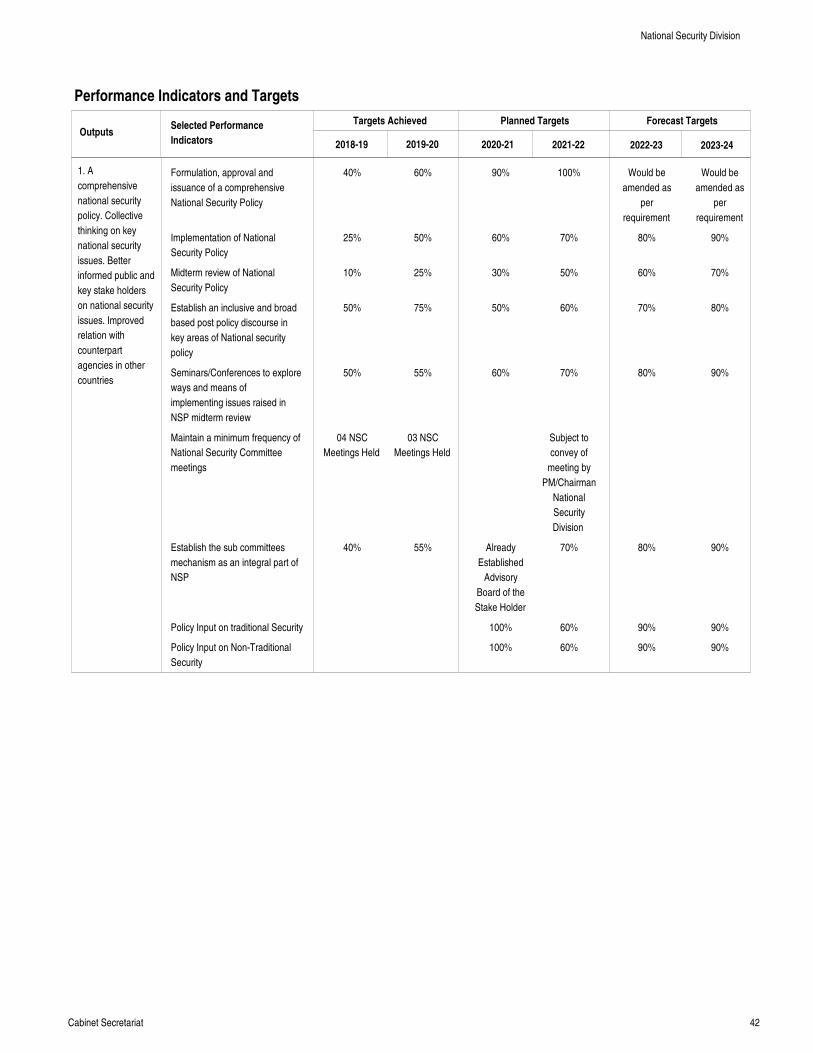
42Cabinet Secretariat
Performance Indicators and Targets
OutputsTargets Achieved Planned Targets Forecast Targets
2018-19 2019-20 2020-21 2021-22 2022-23 2023-24
Selected Performance
Indicators
1. A
comprehensive
national security
policy. Collective
thinking on key
national security
issues. Better
informed public and
key stake holders
on national security
issues. Improved
relation with
counterpart
agencies in other
countries
Formulation, approval and
issuance of a comprehensive
National Security Policy
Implementation of National
Security Policy
Midterm review of National
Security Policy
Establish an inclusive and broad
based post policy discourse in
key areas of National security
policy
Seminars/Conferences to explore
ways and means of
implementing issues raised in
NSP midterm review
Maintain a minimum frequency of
National Security Committee
meetings
Establish the sub committees
mechanism as an integral part of
NSP
Policy Input on traditional Security
Policy Input on Non-Traditional
Security
40%
25%
10%
50%
50%
04 NSC
Meetings Held
40%
60%
50%
25%
75%
55%
03 NSC
Meetings Held
55%
90%
60%
30%
50%
60%
Already
Established
Advisory
Board of the
Stake Holder
100%
100%
100%
70%
50%
60%
70%
Subject to
convey of
meeting by
PM/Chairman
National
Security
Division
70%
60%
60%
Would be
amended as
per
requirement
80%
60%
70%
80%
80%
90%
90%
Would be
amended as
per
requirement
90%
70%
80%
90%
90%
90%
90%
National Security Division
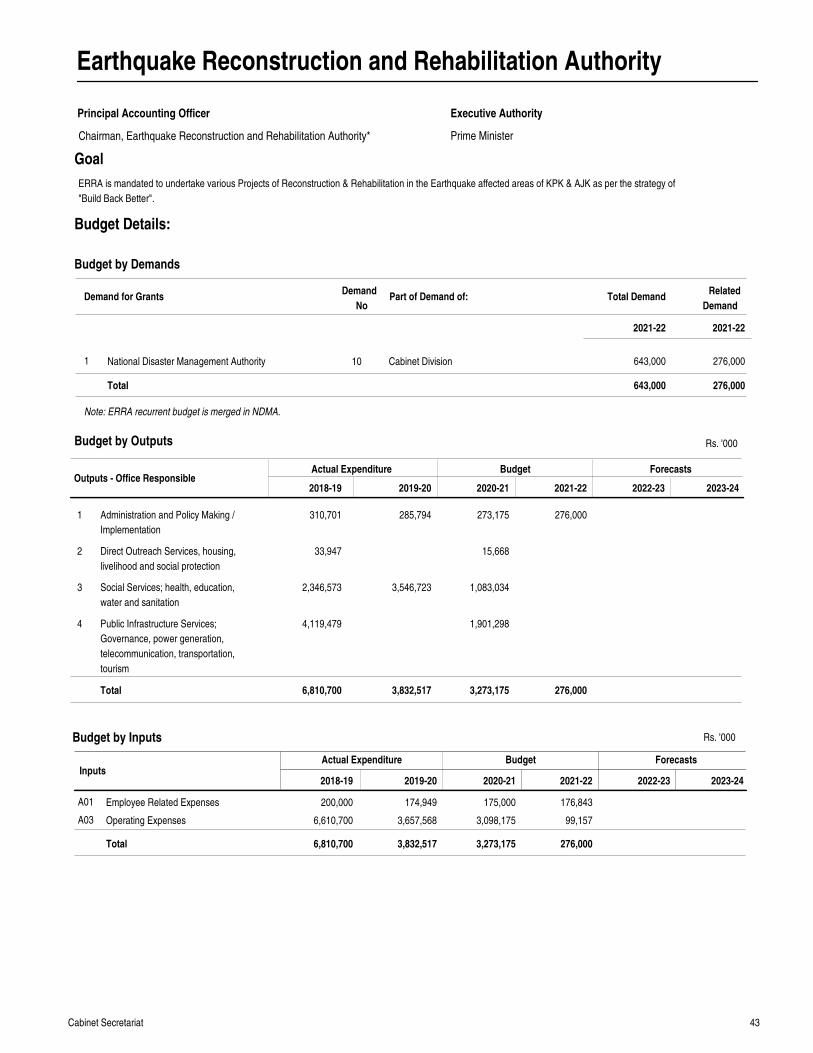
43Cabinet Secretariat
Earthquake Reconstruction and Rehabilitation Authority
Principal Accounting Officer
Prime Minister
Executive Authority
Goal
Outputs - Office ResponsibleActual Expenditure Budget Forecasts
2018-19 2019-20 2020-21 2021-22 2022-23 2023-24
Administration and Policy Making /
Implementation
Direct Outreach Services, housing,
livelihood and social protection
Social Services; health, education,
water and sanitation
Public Infrastructure Services;
Governance, power generation,
telecommunication, transportation,
tourism
310,701
33,947
2,346,573
4,119,479
285,794
3,546,723
273,175
15,668
1,083,034
1,901,298
276,0001
2
3
4
Total 6,810,700 3,832,517 3,273,175 276,000
Rs. '000
National Disaster Management Authority1 10 Cabinet Division 643,000 276,000
Demand for GrantsDemand
NoPart of Demand of: Total Demand
2021-22
643,000 276,000Total
Note: ERRA recurrent budget is merged in NDMA.
InputsActual Expenditure Budget Forecasts
Employee Related Expenses
Operating Expenses
200,000
6,610,700
174,949
3,657,568
175,000
3,098,175
176,843
99,157
A01
A03
Total 6,810,700 3,832,517 3,273,175 276,000
2018-19 2019-20 2020-21 2021-22 2022-23 2023-24
Budget by Outputs
Budget by Demands
Budget by Inputs
ERRA is mandated to undertake various Projects of Reconstruction & Rehabilitation in the Earthquake affected areas of KPK & AJK as per the strategy of
"Build Back Better".
Chairman, Earthquake Reconstruction and Rehabilitation Authority*
Budget Details:
Rs. '000
2021-22
Related
Demand
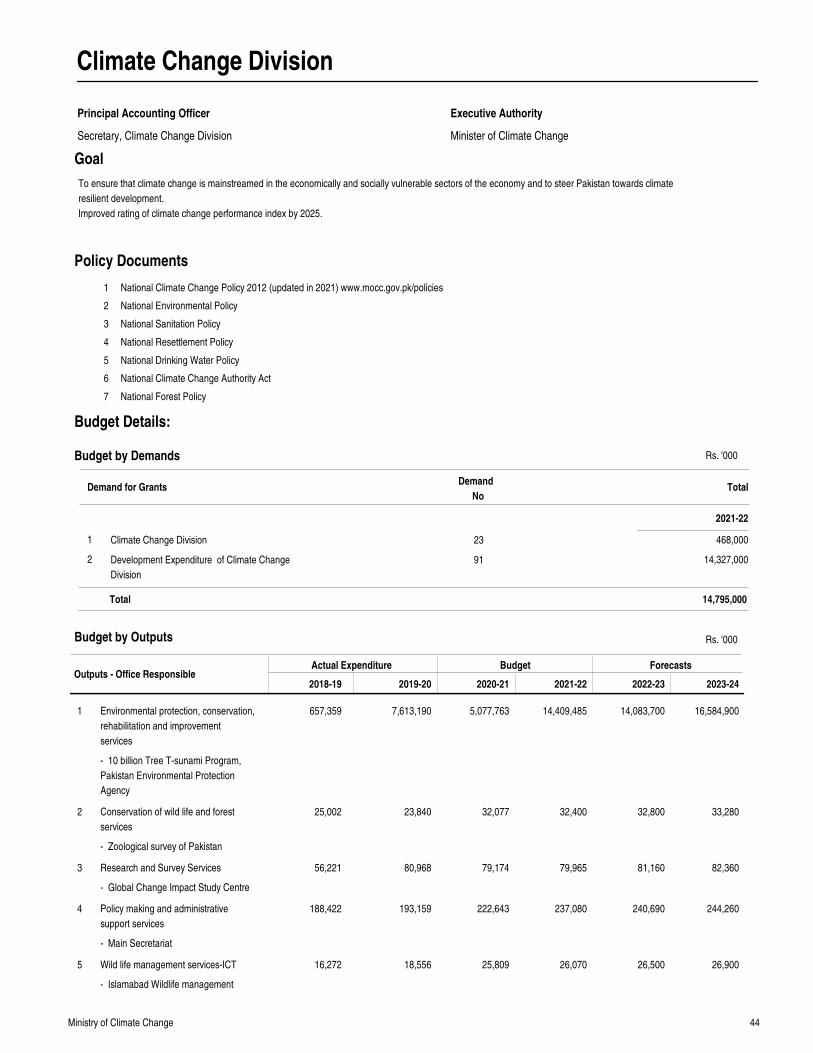
44Ministry of Climate Change
Climate Change Division
Principal Accounting Officer
Secretary, Climate Change Division Minister of Climate Change
Executive Authority
Goal
Outputs - Office ResponsibleActual Expenditure Budget Forecasts
2018-19 2019-20 2020-21 2021-22 2022-23 2023-24
Environmental protection, conservation,
rehabilitation and improvement
services
Conservation of wild life and forest
services
Research and Survey Services
Policy making and administrative
support services
Wild life management services-ICT
657,359
25,002
56,221
188,422
16,272
7,613,190
23,840
80,968
193,159
18,556
5,077,763
32,077
79,174
222,643
25,809
14,409,485
32,400
79,965
237,080
26,070
14,083,700
32,800
81,160
240,690
26,500
16,584,900
33,280
82,360
244,260
26,900
1
2
3
4
5
Rs. '000
1
2
3
4
5
6
7
National Climate Change Policy 2012 (updated in 2021) www.mocc.gov.pk/policies
National Environmental Policy
National Sanitation Policy
National Resettlement Policy
National Drinking Water Policy
National Climate Change Authority Act
National Forest Policy
Policy Documents
Budget by Outputs
To ensure that climate change is mainstreamed in the economically and socially vulnerable sectors of the economy and to steer Pakistan towards climate
resilient development.
Improved rating of climate change performance index by 2025.
Demand for GrantsDemand
NoTotal
2021-22
Budget by Demands
Climate Change Division
Development Expenditure of Climate Change
Division
1
2
23
91
468,000
14,327,000
14,795,000Total
Budget Details:
- 10 billion Tree T-sunami Program,
Pakistan Environmental Protection
Agency
- Zoological survey of Pakistan
- Global Change Impact Study Centre
- Main Secretariat
- Islamabad Wildlife management
Rs. '000
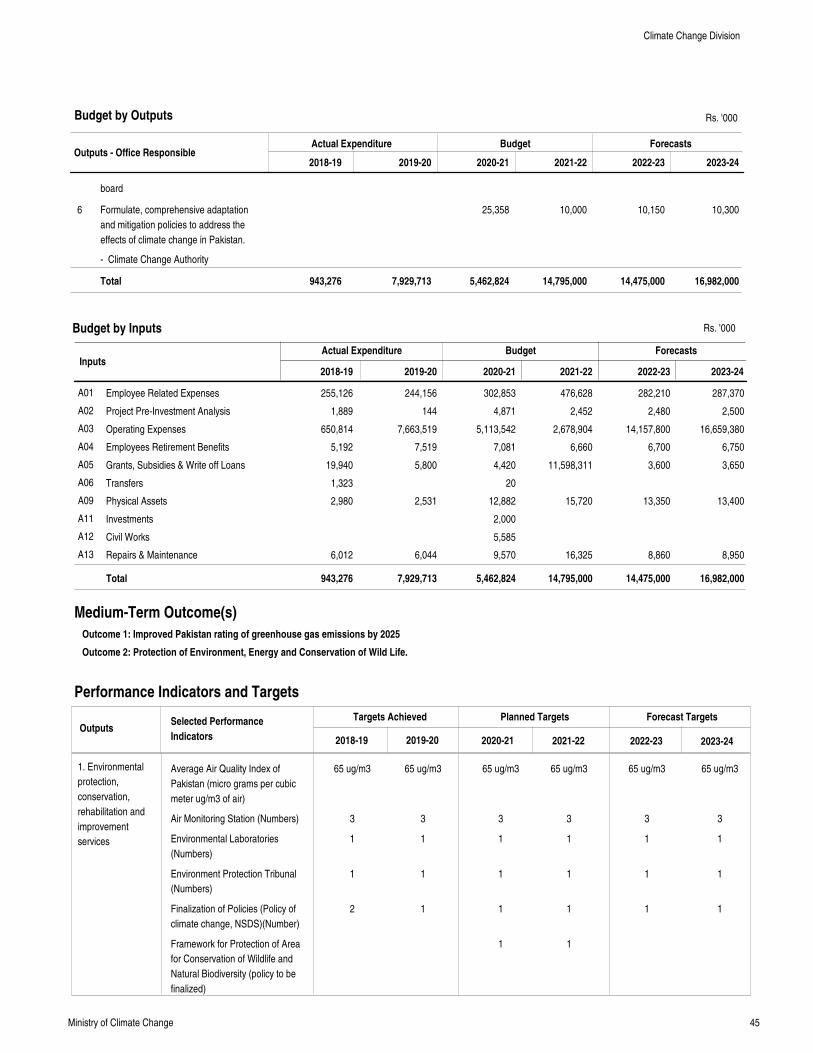
45Ministry of Climate Change
Outputs - Office ResponsibleActual Expenditure Budget Forecasts
2018-19 2019-20 2020-21 2021-22 2022-23 2023-24
Formulate, comprehensive adaptation
and mitigation policies to address the
effects of climate change in Pakistan.
25,358 10,000 10,150 10,3006
Total 943,276 7,929,713 5,462,824 14,795,000 14,475,000 16,982,000
Rs. '000
InputsActual Expenditure Budget Forecasts
Employee Related Expenses
Project Pre-Investment Analysis
Operating Expenses
Employees Retirement Benefits
Grants, Subsidies & Write off Loans
Transfers
Physical Assets
Investments
Civil Works
Repairs & Maintenance
255,126
1,889
650,814
5,192
19,940
1,323
2,980
6,012
244,156
144
7,663,519
7,519
5,800
2,531
6,044
302,853
4,871
5,113,542
7,081
4,420
20
12,882
2,000
5,585
9,570
476,628
2,452
2,678,904
6,660
11,598,311
15,720
16,325
282,210
2,480
14,157,800
6,700
3,600
13,350
8,860
287,370
2,500
16,659,380
6,750
3,650
13,400
8,950
A01
A02
A03
A04
A05
A06
A09
A11
A12
A13
Total 943,276 7,929,713 5,462,824 14,795,000 14,475,000 16,982,000
2018-19 2019-20 2020-21 2021-22 2022-23 2023-24
Medium-Term Outcome(s)
Outcome 1: Improved Pakistan rating of greenhouse gas emissions by 2025
Outcome 2: Protection of Environment, Energy and Conservation of Wild Life.
Performance Indicators and Targets
OutputsTargets Achieved Planned Targets Forecast Targets
2018-19 2019-20 2020-21 2021-22 2022-23 2023-24
Selected Performance
Indicators
1. Environmental
protection,
conservation,
rehabilitation and
improvement
services
Budget by Outputs
Budget by Inputs
Average Air Quality Index of
Pakistan (micro grams per cubic
meter ug/m3 of air)
Air Monitoring Station (Numbers)
Environmental Laboratories
(Numbers)
Environment Protection Tribunal
(Numbers)
Finalization of Policies (Policy of
climate change, NSDS)(Number)
Framework for Protection of Area
for Conservation of Wildlife and
Natural Biodiversity (policy to be
finalized)
65 ug/m3
3
1
1
2
65 ug/m3
3
1
1
1
65 ug/m3
3
1
1
1
1
65 ug/m3
3
1
1
1
1
65 ug/m3
3
1
1
1
65 ug/m3
3
1
1
1
Climate Change Division
board
- Climate Change Authority
Rs. '000
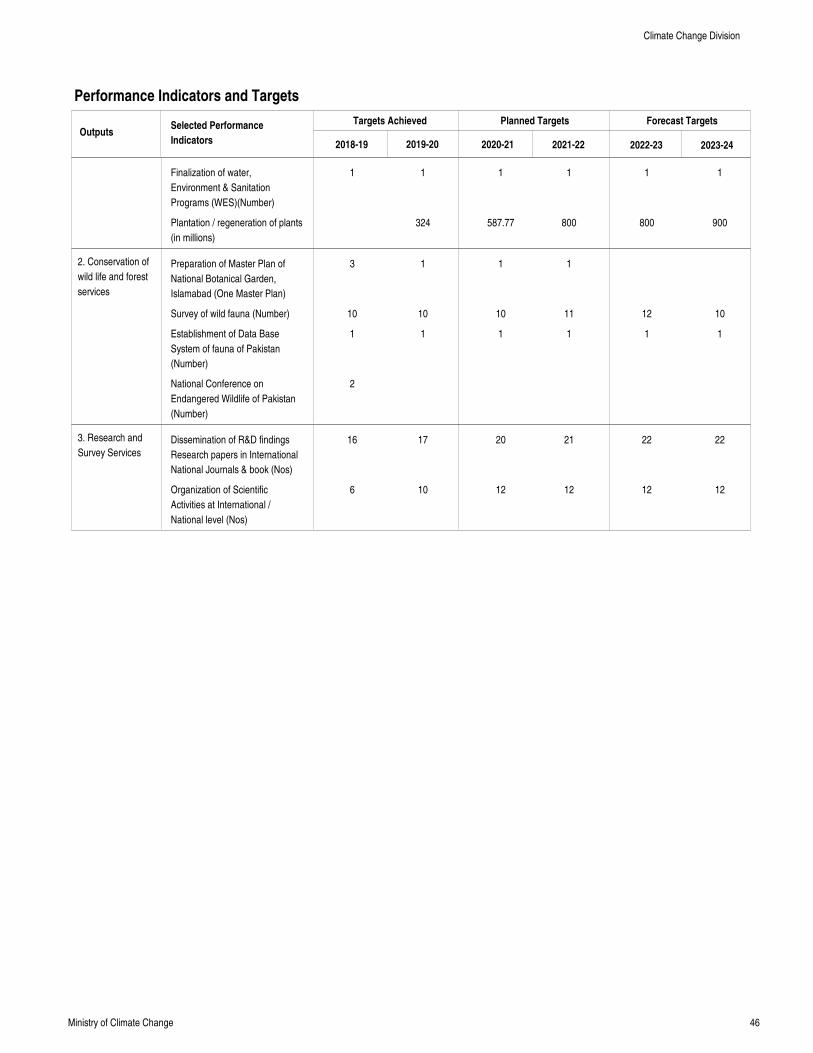
46Ministry of Climate Change
Performance Indicators and Targets
OutputsTargets Achieved Planned Targets Forecast Targets
2018-19 2019-20 2020-21 2021-22 2022-23 2023-24
Selected Performance
Indicators
2. Conservation of
wild life and forest
services
3. Research and
Survey Services
Finalization of water,
Environment & Sanitation
Programs (WES)(Number)
Plantation / regeneration of plants
(in millions)
Preparation of Master Plan of
National Botanical Garden,
Islamabad (One Master Plan)
Survey of wild fauna (Number)
Establishment of Data Base
System of fauna of Pakistan
(Number)
National Conference on
Endangered Wildlife of Pakistan
(Number)
Dissemination of R&D findings
Research papers in International
National Journals & book (Nos)
Organization of Scientific
Activities at International /
National level (Nos)
1
3
10
1
2
16
6
1
324
1
10
1
17
10
1
587.77
1
10
1
20
12
1
800
1
11
1
21
12
1
800
12
1
22
12
1
900
10
1
22
12
Climate Change Division
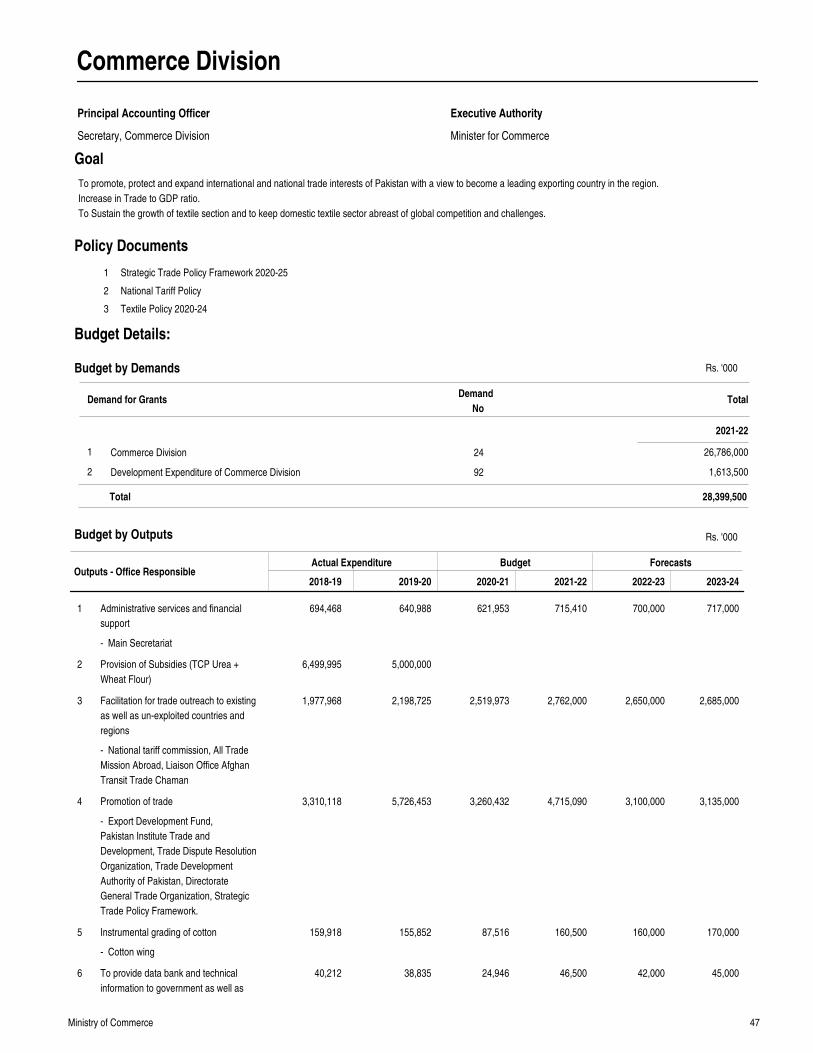
47Ministry of Commerce
Commerce Division
Principal Accounting Officer
Secretary, Commerce Division Minister for Commerce
Executive Authority
Goal
Outputs - Office ResponsibleActual Expenditure Budget Forecasts
2018-19 2019-20 2020-21 2021-22 2022-23 2023-24
Administrative services and financial
support
Provision of Subsidies (TCP Urea +
Wheat Flour)
Facilitation for trade outreach to existing
as well as un-exploited countries and
regions
Promotion of trade
Instrumental grading of cotton
To provide data bank and technical
information to government as well as
694,468
6,499,995
1,977,968
3,310,118
159,918
40,212
640,988
5,000,000
2,198,725
5,726,453
155,852
38,835
621,953
2,519,973
3,260,432
87,516
24,946
715,410
2,762,000
4,715,090
160,500
46,500
700,000
2,650,000
3,100,000
160,000
42,000
717,000
2,685,000
3,135,000
170,000
45,000
1
2
3
4
5
6
Rs. '000
1
2
3
Strategic Trade Policy Framework 2020-25
National Tariff Policy
Textile Policy 2020-24
Policy Documents
Budget by Outputs
To promote, protect and expand international and national trade interests of Pakistan with a view to become a leading exporting country in the region.
Increase in Trade to GDP ratio.
To Sustain the growth of textile section and to keep domestic textile sector abreast of global competition and challenges.
Demand for GrantsDemand
NoTotal
2021-22
Budget by Demands
Commerce Division
Development Expenditure of Commerce Division
1
2
24
92
26,786,000
1,613,500
28,399,500Total
Budget Details:
- Main Secretariat
- National tariff commission, All Trade
Mission Abroad, Liaison Office Afghan
Transit Trade Chaman
- Export Development Fund,
Pakistan Institute Trade and
Development, Trade Dispute Resolution
Organization, Trade Development
Authority of Pakistan, Directorate
General Trade Organization, Strategic
Trade Policy Framework.
- Cotton wing
Rs. '000
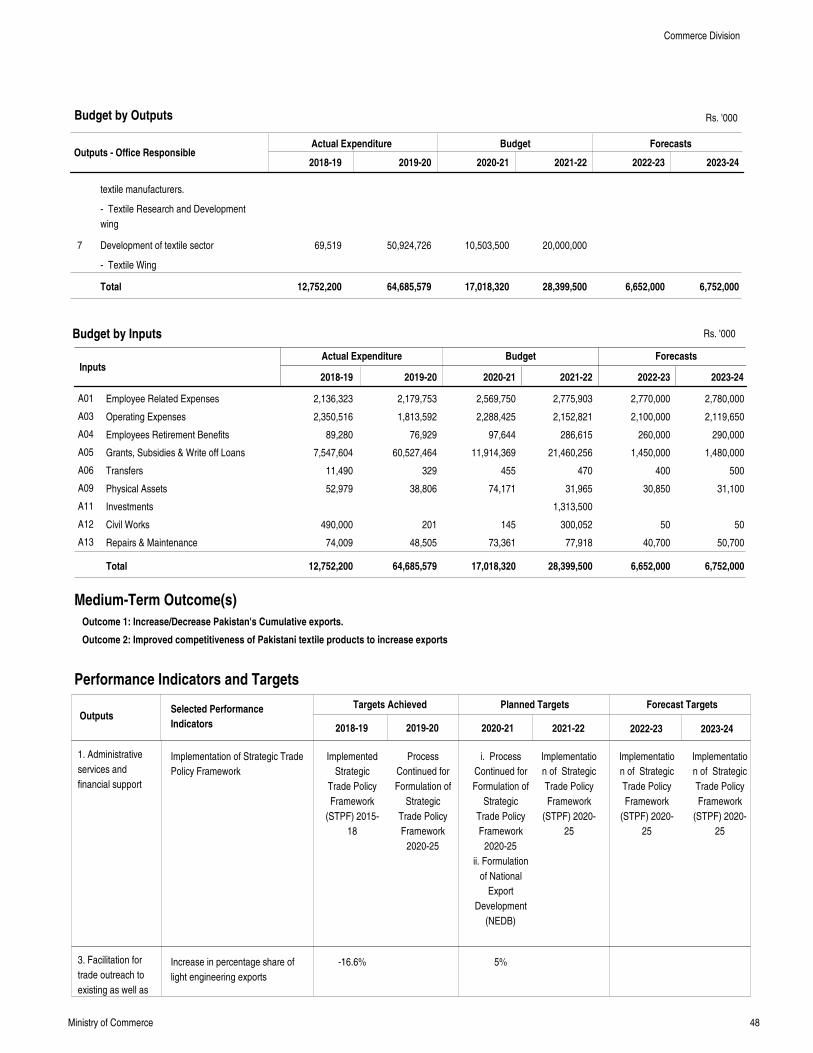
48Ministry of Commerce
Outputs - Office ResponsibleActual Expenditure Budget Forecasts
2018-19 2019-20 2020-21 2021-22 2022-23 2023-24
textile manufacturers.
Development of textile sector 69,519 50,924,726 10,503,500 20,000,0007
Total 12,752,200 64,685,579 17,018,320 28,399,500 6,652,000 6,752,000
Rs. '000
InputsActual Expenditure Budget Forecasts
Employee Related Expenses
Operating Expenses
Employees Retirement Benefits
Grants, Subsidies & Write off Loans
Transfers
Physical Assets
Investments
Civil Works
Repairs & Maintenance
2,136,323
2,350,516
89,280
7,547,604
11,490
52,979
490,000
74,009
2,179,753
1,813,592
76,929
60,527,464
329
38,806
201
48,505
2,569,750
2,288,425
97,644
11,914,369
455
74,171
145
73,361
2,775,903
2,152,821
286,615
21,460,256
470
31,965
1,313,500
300,052
77,918
2,770,000
2,100,000
260,000
1,450,000
400
30,850
50
40,700
2,780,000
2,119,650
290,000
1,480,000
500
31,100
50
50,700
A01
A03
A04
A05
A06
A09
A11
A12
A13
Total 12,752,200 64,685,579 17,018,320 28,399,500 6,652,000 6,752,000
2018-19 2019-20 2020-21 2021-22 2022-23 2023-24
Medium-Term Outcome(s)
Outcome 1: Increase/Decrease Pakistan's Cumulative exports.
Outcome 2: Improved competitiveness of Pakistani textile products to increase exports
Performance Indicators and Targets
OutputsTargets Achieved Planned Targets Forecast Targets
2018-19 2019-20 2020-21 2021-22 2022-23 2023-24
Selected Performance
Indicators
1. Administrative
services and
financial support
3. Facilitation for
trade outreach to
existing as well as
Budget by Outputs
Budget by Inputs
Implementation of Strategic Trade
Policy Framework
Increase in percentage share of
light engineering exports
Implemented
Strategic
Trade Policy
Framework
(STPF) 2015-
18
-16.6%
Process
Continued for
Formulation of
Strategic
Trade Policy
Framework
2020-25
i. Process
Continued for
Formulation of
Strategic
Trade Policy
Framework
2020-25
ii. Formulation
of National
Export
Development
(NEDB)
5%
Implementatio
n of Strategic
Trade Policy
Framework
(STPF) 2020-
25
Implementatio
n of Strategic
Trade Policy
Framework
(STPF) 2020-
25
Implementatio
n of Strategic
Trade Policy
Framework
(STPF) 2020-
25
Commerce Division
- Textile Research and Development
wing
- Textile Wing
Rs. '000
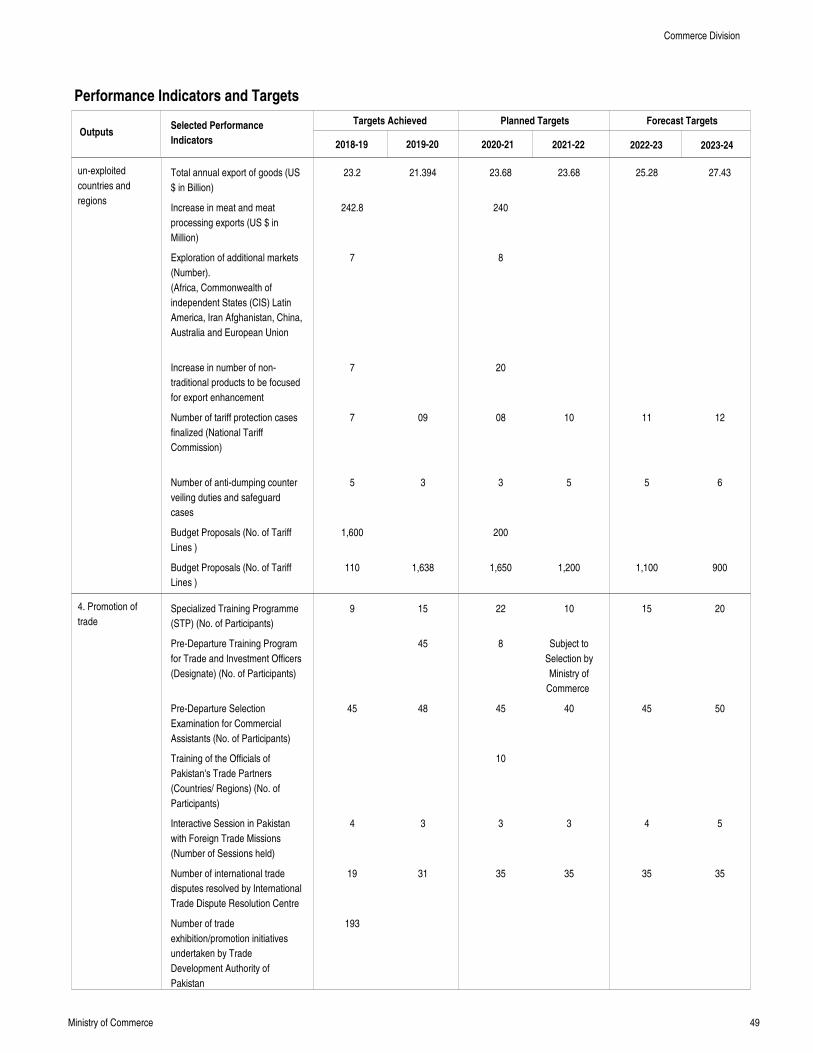
49Ministry of Commerce
Performance Indicators and Targets
OutputsTargets Achieved Planned Targets Forecast Targets
2018-19 2019-20 2020-21 2021-22 2022-23 2023-24
Selected Performance
Indicators
un-exploited
countries and
regions
4. Promotion of
trade
Total annual export of goods (US
$ in Billion)
Increase in meat and meat
processing exports (US $ in
Million)
Exploration of additional markets
(Number).
(Africa, Commonwealth of
independent States (CIS) Latin
America, Iran Afghanistan, China,
Australia and European Union
Increase in number of non-
traditional products to be focused
for export enhancement
Number of tariff protection cases
finalized (National Tariff
Commission)
Number of anti-dumping counter
veiling duties and safeguard
cases
Budget Proposals (No. of Tariff
Lines )
Budget Proposals (No. of Tariff
Lines )
Specialized Training Programme
(STP) (No. of Participants)
Pre-Departure Training Program
for Trade and Investment Officers
(Designate) (No. of Participants)
Pre-Departure Selection
Examination for Commercial
Assistants (No. of Participants)
Training of the Officials of
Pakistan's Trade Partners
(Countries/ Regions) (No. of
Participants)
Interactive Session in Pakistan
with Foreign Trade Missions
(Number of Sessions held)
Number of international trade
disputes resolved by International
Trade Dispute Resolution Centre
Number of trade
exhibition/promotion initiatives
undertaken by Trade
Development Authority of
Pakistan
23.2
242.8
7
7
7
5
1,600
110
9
45
4
19
193
21.394
09
3
1,638
15
45
48
3
31
23.68
240
8
20
08
3
200
1,650
22
8
45
10
3
35
23.68
10
5
1,200
10
Subject to
Selection by
Ministry of
Commerce
40
3
35
25.28
11
5
1,100
15
45
4
35
27.43
12
6
900
20
50
5
35
Commerce Division
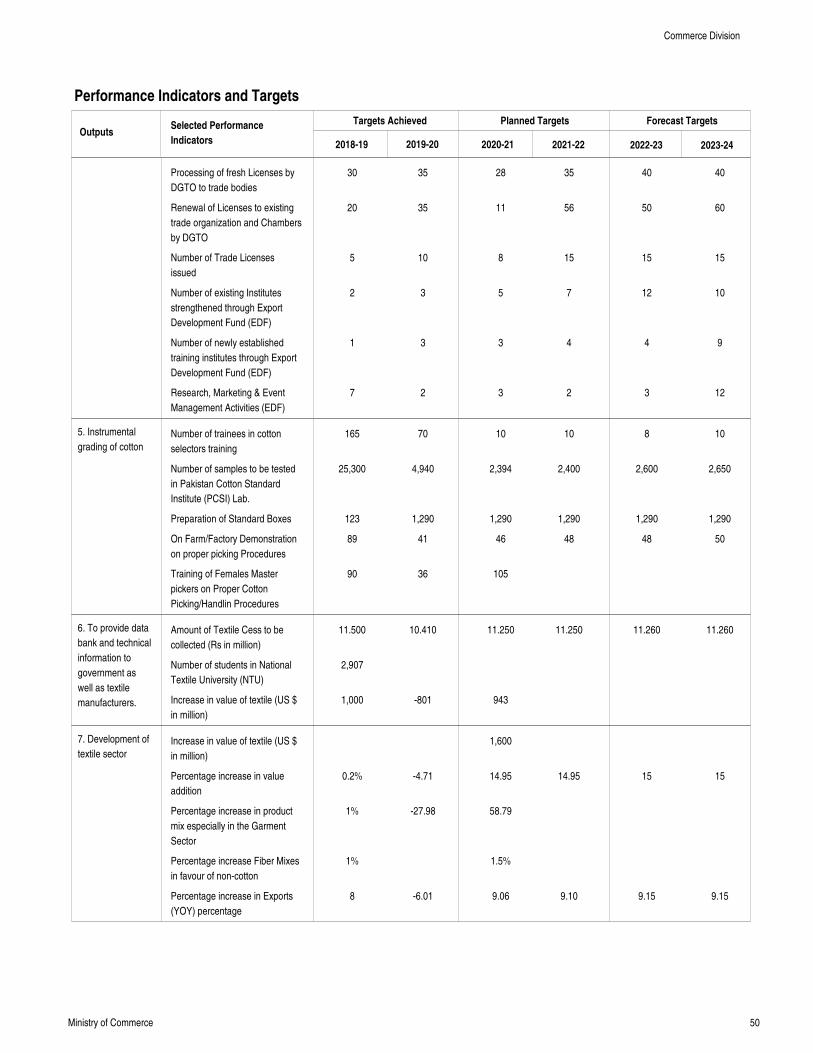
50Ministry of Commerce
Performance Indicators and Targets
OutputsTargets Achieved Planned Targets Forecast Targets
2018-19 2019-20 2020-21 2021-22 2022-23 2023-24
Selected Performance
Indicators
5. Instrumental
grading of cotton
6. To provide data
bank and technical
information to
government as
well as textile
manufacturers.
7. Development of
textile sector
Processing of fresh Licenses by
DGTO to trade bodies
Renewal of Licenses to existing
trade organization and Chambers
by DGTO
Number of Trade Licenses
issued
Number of existing Institutes
strengthened through Export
Development Fund (EDF)
Number of newly established
training institutes through Export
Development Fund (EDF)
Research, Marketing & Event
Management Activities (EDF)
Number of trainees in cotton
selectors training
Number of samples to be tested
in Pakistan Cotton Standard
Institute (PCSI) Lab.
Preparation of Standard Boxes
On Farm/Factory Demonstration
on proper picking Procedures
Training of Females Master
pickers on Proper Cotton
Picking/Handlin Procedures
Amount of Textile Cess to be
collected (Rs in million)
Number of students in National
Textile University (NTU)
Increase in value of textile (US $
in million)
Increase in value of textile (US $
in million)
Percentage increase in value
addition
Percentage increase in product
mix especially in the Garment
Sector
Percentage increase Fiber Mixes
in favour of non-cotton
Percentage increase in Exports
(YOY) percentage
30
20
5
2
1
7
165
25,300
123
89
90
11.500
2,907
1,000
0.2%
1%
1%
8
35
35
10
3
3
2
70
4,940
1,290
41
36
10.410
-801
-4.71
-27.98
-6.01
28
11
8
5
3
3
10
2,394
1,290
46
105
11.250
943
1,600
14.95
58.79
1.5%
9.06
35
56
15
7
4
2
10
2,400
1,290
48
11.250
14.95
9.10
40
50
15
12
4
3
8
2,600
1,290
48
11.260
15
9.15
40
60
15
10
9
12
10
2,650
1,290
50
11.260
15
9.15
Commerce Division
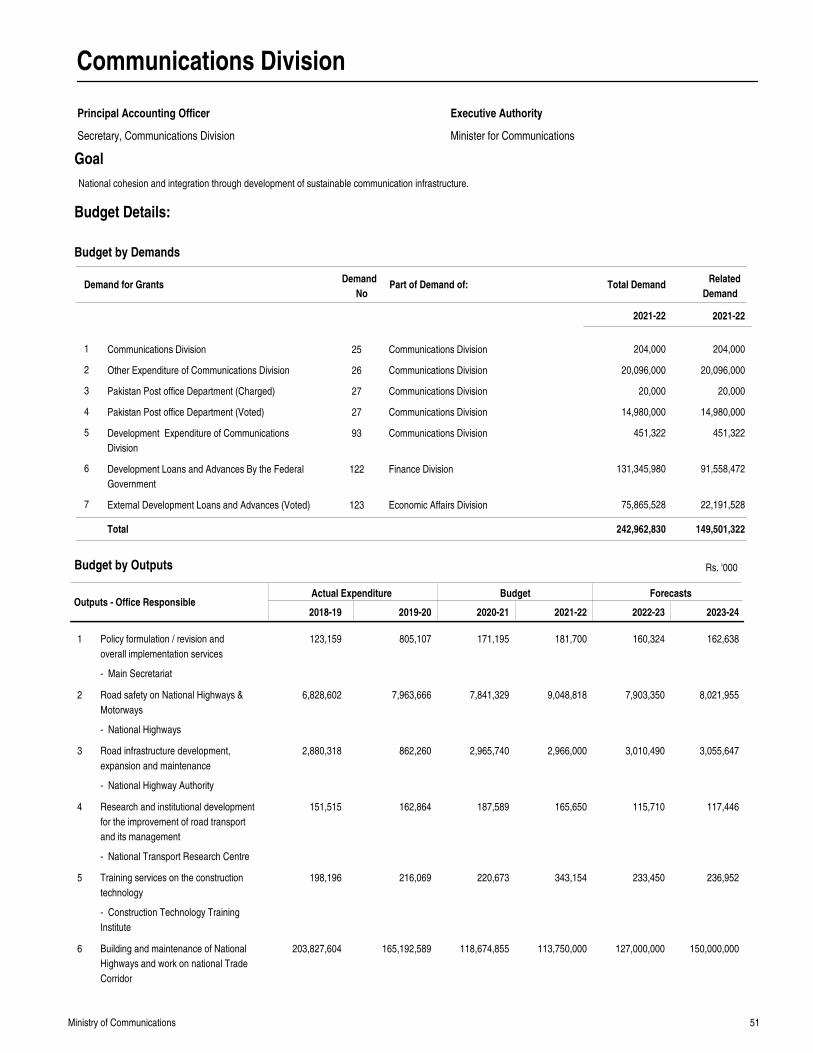
51Ministry of Communications
Communications Division
Principal Accounting Officer
Secretary, Communications Division Minister for Communications
Executive Authority
Goal
Outputs - Office ResponsibleActual Expenditure Budget Forecasts
2018-19 2019-20 2020-21 2021-22 2022-23 2023-24
Policy formulation / revision and
overall implementation services
Road safety on National Highways &
Motorways
Road infrastructure development,
expansion and maintenance
Research and institutional development
for the improvement of road transport
and its management
Training services on the construction
technology
Building and maintenance of National
Highways and work on national Trade
Corridor
123,159
6,828,602
2,880,318
151,515
198,196
203,827,604
805,107
7,963,666
862,260
162,864
216,069
165,192,589
171,195
7,841,329
2,965,740
187,589
220,673
118,674,855
181,700
9,048,818
2,966,000
165,650
343,154
113,750,000
160,324
7,903,350
3,010,490
115,710
233,450
127,000,000
162,638
8,021,955
3,055,647
117,446
236,952
150,000,000
1
2
3
4
5
6
Rs. '000
Communications Division
Other Expenditure of Communications Division
Pakistan Post office Department (Charged)
Pakistan Post office Department (Voted)
Development Expenditure of Communications
Division
Development Loans and Advances By the Federal
Government
External Development Loans and Advances (Voted)
1
2
3
4
5
6
7
25
26
27
27
93
122
123
Communications Division
Communications Division
Communications Division
Communications Division
Communications Division
Finance Division
Economic Affairs Division
204,000
20,096,000
20,000
14,980,000
451,322
131,345,980
75,865,528
204,000
20,096,000
20,000
14,980,000
451,322
91,558,472
22,191,528
Demand for GrantsDemand
NoPart of Demand of: Total Demand
2021-22
242,962,830 149,501,322Total
Budget by Outputs
Budget by Demands
National cohesion and integration through development of sustainable communication infrastructure.
Budget Details:
- Main Secretariat
- National Highways
- National Highway Authority
- National Transport Research Centre
- Construction Technology Training
Institute
2021-22
Related
Demand
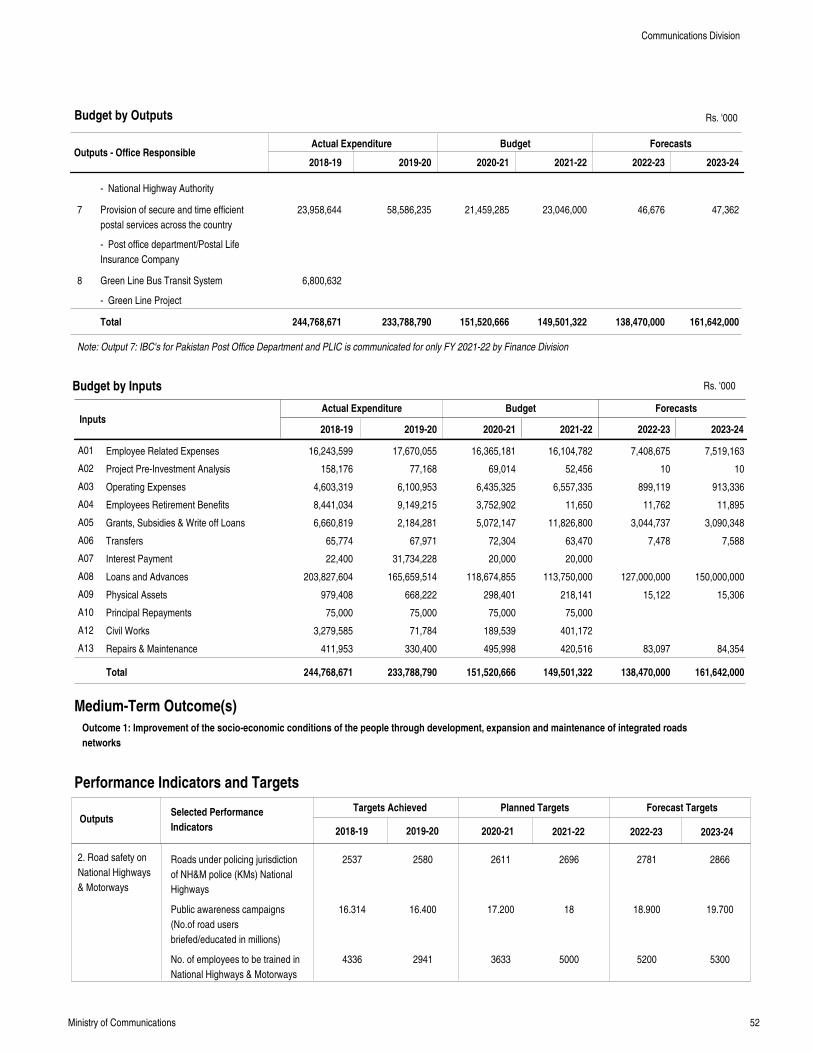
52Ministry of Communications
Outputs - Office ResponsibleActual Expenditure Budget Forecasts
2018-19 2019-20 2020-21 2021-22 2022-23 2023-24
Provision of secure and time efficient
postal services across the country
Green Line Bus Transit System
23,958,644
6,800,632
58,586,235 21,459,285 23,046,000 46,676 47,3627
8
Total 244,768,671 233,788,790 151,520,666 149,501,322 138,470,000 161,642,000
Note: Output 7: IBC's for Pakistan Post Office Department and PLIC is communicated for only FY 2021-22 by Finance Division
Rs. '000
InputsActual Expenditure Budget Forecasts
Employee Related Expenses
Project Pre-Investment Analysis
Operating Expenses
Employees Retirement Benefits
Grants, Subsidies & Write off Loans
Transfers
Interest Payment
Loans and Advances
Physical Assets
Principal Repayments
Civil Works
Repairs & Maintenance
16,243,599
158,176
4,603,319
8,441,034
6,660,819
65,774
22,400
203,827,604
979,408
75,000
3,279,585
411,953
17,670,055
77,168
6,100,953
9,149,215
2,184,281
67,971
31,734,228
165,659,514
668,222
75,000
71,784
330,400
16,365,181
69,014
6,435,325
3,752,902
5,072,147
72,304
20,000
118,674,855
298,401
75,000
189,539
495,998
16,104,782
52,456
6,557,335
11,650
11,826,800
63,470
20,000
113,750,000
218,141
75,000
401,172
420,516
7,408,675
10
899,119
11,762
3,044,737
7,478
127,000,000
15,122
83,097
7,519,163
10
913,336
11,895
3,090,348
7,588
150,000,000
15,306
84,354
A01
A02
A03
A04
A05
A06
A07
A08
A09
A10
A12
A13
Total 244,768,671 233,788,790 151,520,666 149,501,322 138,470,000 161,642,000
2018-19 2019-20 2020-21 2021-22 2022-23 2023-24
Medium-Term Outcome(s)
Outcome 1: Improvement of the socio-economic conditions of the people through development, expansion and maintenance of integrated roads
networks
Performance Indicators and Targets
OutputsTargets Achieved Planned Targets Forecast Targets
2018-19 2019-20 2020-21 2021-22 2022-23 2023-24
Selected Performance
Indicators
2. Road safety on
National Highways
& Motorways
Budget by Outputs
Budget by Inputs
Roads under policing jurisdiction
of NH&M police (KMs) National
Highways
Public awareness campaigns
(No.of road users
briefed/educated in millions)
No. of employees to be trained in
National Highways & Motorways
2537
16.314
4336
2580
16.400
2941
2611
17.200
3633
2696
18
5000
2781
18.900
5200
2866
19.700
5300
Communications Division
- National Highway Authority
- Post office department/Postal Life
Insurance Company
- Green Line Project
Rs. '000
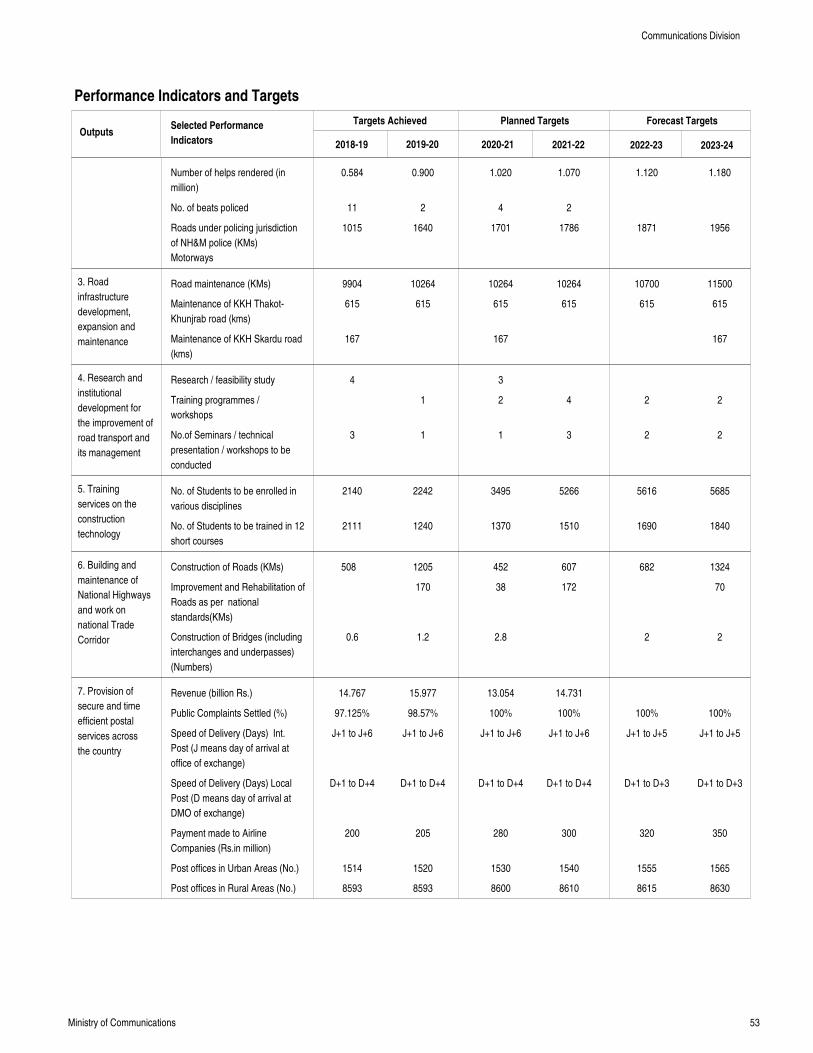
53Ministry of Communications
Performance Indicators and Targets
OutputsTargets Achieved Planned Targets Forecast Targets
2018-19 2019-20 2020-21 2021-22 2022-23 2023-24
Selected Performance
Indicators
3. Road
infrastructure
development,
expansion and
maintenance
4. Research and
institutional
development for
the improvement of
road transport and
its management
5. Training
services on the
construction
technology
6. Building and
maintenance of
National Highways
and work on
national Trade
Corridor
7. Provision of
secure and time
efficient postal
services across
the country
Number of helps rendered (in
million)
No. of beats policed
Roads under policing jurisdiction
of NH&M police (KMs)
Motorways
Road maintenance (KMs)
Maintenance of KKH Thakot-
Khunjrab road (kms)
Maintenance of KKH Skardu road
(kms)
Research / feasibility study
Training programmes /
workshops
No.of Seminars / technical
presentation / workshops to be
conducted
No. of Students to be enrolled in
various disciplines
No. of Students to be trained in 12
short courses
Construction of Roads (KMs)
Improvement and Rehabilitation of
Roads as per national
standards(KMs)
Construction of Bridges (including
interchanges and underpasses)
(Numbers)
Revenue (billion Rs.)
Public Complaints Settled (%)
Speed of Delivery (Days) Int.
Post (J means day of arrival at
office of exchange)
Speed of Delivery (Days) Local
Post (D means day of arrival at
DMO of exchange)
Payment made to Airline
Companies (Rs.in million)
Post offices in Urban Areas (No.)
Post offices in Rural Areas (No.)
0.584
11
1015
9904
615
167
4
3
2140
2111
508
0.6
14.767
97.125%
J+1 to J+6
D+1 to D+4
200
1514
8593
0.900
2
1640
10264
615
1
1
2242
1240
1205
170
1.2
15.977
98.57%
J+1 to J+6
D+1 to D+4
205
1520
8593
1.020
4
1701
10264
615
167
3
2
1
3495
1370
452
38
2.8
13.054
100%
J+1 to J+6
D+1 to D+4
280
1530
8600
1.070
2
1786
10264
615
4
3
5266
1510
607
172
14.731
100%
J+1 to J+6
D+1 to D+4
300
1540
8610
1.120
1871
10700
615
2
2
5616
1690
682
2
100%
J+1 to J+5
D+1 to D+3
320
1555
8615
1.180
1956
11500
615
167
2
2
5685
1840
1324
70
2
100%
J+1 to J+5
D+1 to D+3
350
1565
8630
Communications Division
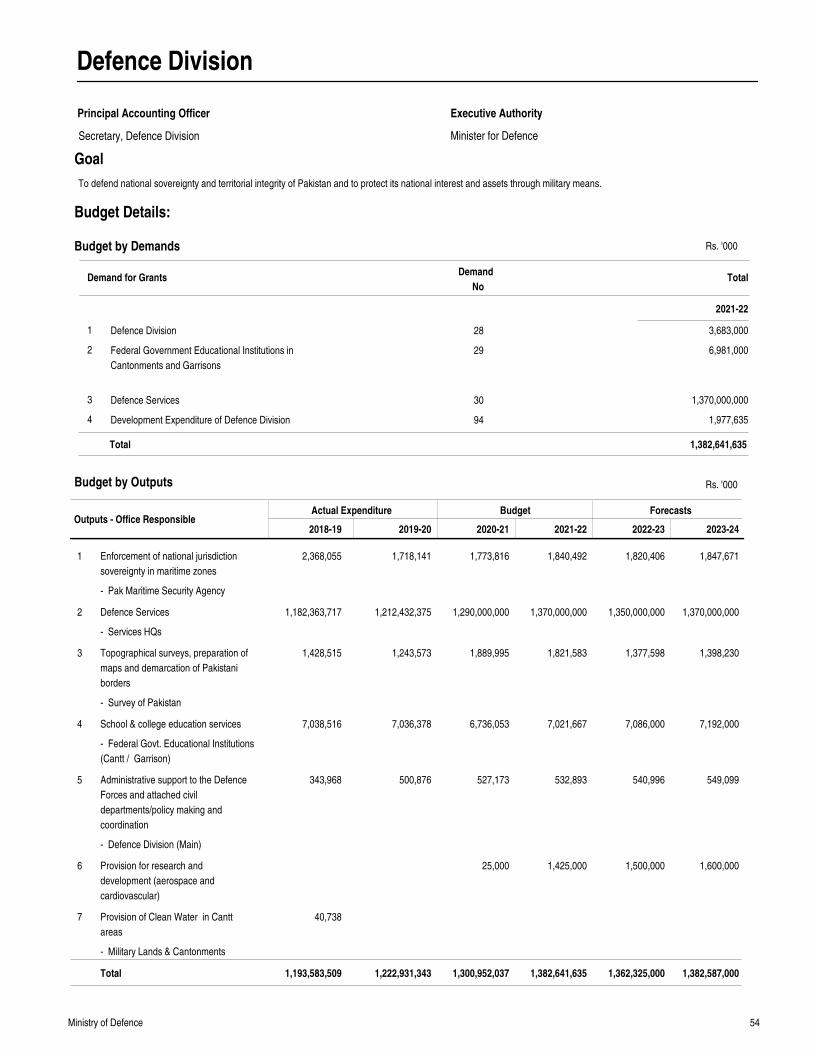
54Ministry of Defence
Defence Division
Principal Accounting Officer
Minister for Defence
Executive Authority
Goal
Outputs - Office ResponsibleActual Expenditure Budget Forecasts
2018-19 2019-20 2020-21 2021-22 2022-23 2023-24
Enforcement of national jurisdiction
sovereignty in maritime zones
Defence Services
Topographical surveys, preparation of
maps and demarcation of Pakistani
borders
School & college education services
Administrative support to the Defence
Forces and attached civil
departments/policy making and
coordination
Provision for research and
development (aerospace and
cardiovascular)
Provision of Clean Water in Cantt
areas
2,368,055
1,182,363,717
1,428,515
7,038,516
343,968
40,738
1,718,141
1,212,432,375
1,243,573
7,036,378
500,876
1,773,816
1,290,000,000
1,889,995
6,736,053
527,173
25,000
1,840,492
1,370,000,000
1,821,583
7,021,667
532,893
1,425,000
1,820,406
1,350,000,000
1,377,598
7,086,000
540,996
1,500,000
1,847,671
1,370,000,000
1,398,230
7,192,000
549,099
1,600,000
1
2
3
4
5
6
7
Total 1,193,583,509 1,222,931,343 1,300,952,037 1,382,641,635 1,362,325,000 1,382,587,000
Rs. '000Budget by Outputs
To defend national sovereignty and territorial integrity of Pakistan and to protect its national interest and assets through military means.
Demand for GrantsDemand
NoTotal
2021-22
Budget by Demands
Defence Division
Federal Government Educational Institutions in
Cantonments and Garrisons
Defence Services
Development Expenditure of Defence Division
1
2
3
4
28
29
30
94
3,683,000
6,981,000
1,370,000,000
1,977,635
1,382,641,635Total
Secretary, Defence Division
Budget Details:
- Pak Maritime Security Agency
- Services HQs
- Survey of Pakistan
- Federal Govt. Educational Institutions
(Cantt / Garrison)
- Defence Division (Main)
- Military Lands & Cantonments
Rs. '000
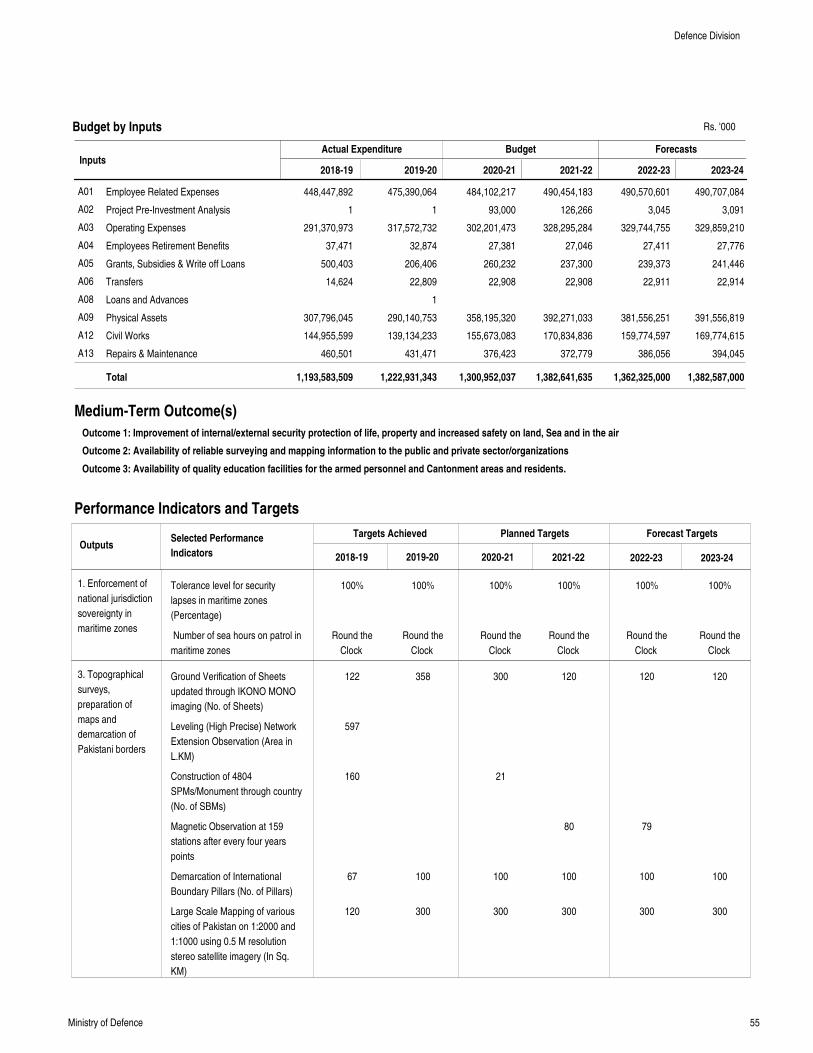
55Ministry of Defence
InputsActual Expenditure Budget Forecasts
Employee Related Expenses
Project Pre-Investment Analysis
Operating Expenses
Employees Retirement Benefits
Grants, Subsidies & Write off Loans
Transfers
Loans and Advances
Physical Assets
Civil Works
Repairs & Maintenance
448,447,892
1
291,370,973
37,471
500,403
14,624
307,796,045
144,955,599
460,501
475,390,064
1
317,572,732
32,874
206,406
22,809
1
290,140,753
139,134,233
431,471
484,102,217
93,000
302,201,473
27,381
260,232
22,908
358,195,320
155,673,083
376,423
490,454,183
126,266
328,295,284
27,046
237,300
22,908
392,271,033
170,834,836
372,779
490,570,601
3,045
329,744,755
27,411
239,373
22,911
381,556,251
159,774,597
386,056
490,707,084
3,091
329,859,210
27,776
241,446
22,914
391,556,819
169,774,615
394,045
A01
A02
A03
A04
A05
A06
A08
A09
A12
A13
Total 1,193,583,509 1,222,931,343 1,300,952,037 1,382,641,635 1,362,325,000 1,382,587,000
2018-19 2019-20 2020-21 2021-22 2022-23 2023-24
Medium-Term Outcome(s)
Outcome 1: Improvement of internal/external security protection of life, property and increased safety on land, Sea and in the air
Outcome 2: Availability of reliable surveying and mapping information to the public and private sector/organizations
Outcome 3: Availability of quality education facilities for the armed personnel and Cantonment areas and residents.
Performance Indicators and Targets
OutputsTargets Achieved Planned Targets Forecast Targets
2018-19 2019-20 2020-21 2021-22 2022-23 2023-24
Selected Performance
Indicators
1. Enforcement of
national jurisdiction
sovereignty in
maritime zones
3. Topographical
surveys,
preparation of
maps and
demarcation of
Pakistani borders
Budget by Inputs
Tolerance level for security
lapses in maritime zones
(Percentage)
Number of sea hours on patrol in
maritime zones
Ground Verification of Sheets
updated through IKONO MONO
imaging (No. of Sheets)
Leveling (High Precise) Network
Extension Observation (Area in
L.KM)
Construction of 4804
SPMs/Monument through country
(No. of SBMs)
Magnetic Observation at 159
stations after every four years
points
Demarcation of International
Boundary Pillars (No. of Pillars)
Large Scale Mapping of various
cities of Pakistan on 1:2000 and
1:1000 using 0.5 M resolution
stereo satellite imagery (In Sq.
KM)
100%
Round the
Clock
122
597
160
67
120
100%
Round the
Clock
358
100
300
100%
Round the
Clock
300
21
100
300
100%
Round the
Clock
120
80
100
300
100%
Round the
Clock
120
79
100
300
100%
Round the
Clock
120
100
300
Defence Division
Rs. '000
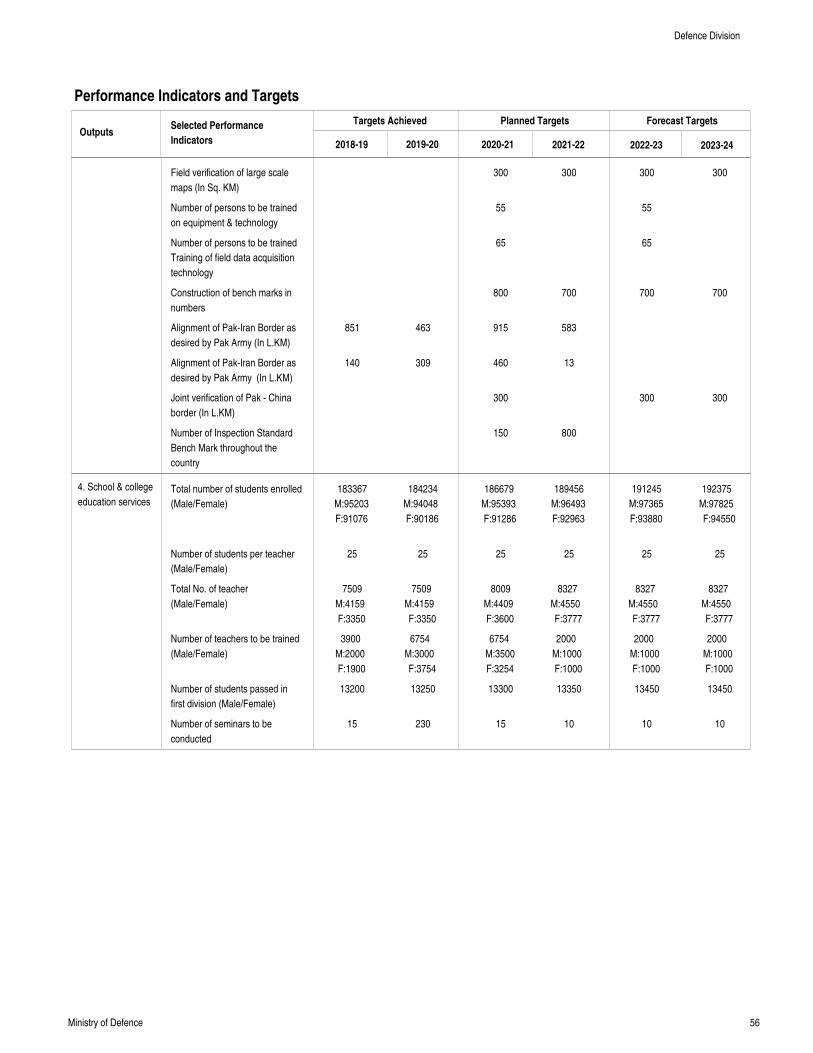
56Ministry of Defence
Performance Indicators and Targets
OutputsTargets Achieved Planned Targets Forecast Targets
2018-19 2019-20 2020-21 2021-22 2022-23 2023-24
Selected Performance
Indicators
4. School & college
education services
Field verification of large scale
maps (In Sq. KM)
Number of persons to be trained
on equipment & technology
Number of persons to be trained
Training of field data acquisition
technology
Construction of bench marks in
numbers
Alignment of Pak-Iran Border as
desired by Pak Army (In L.KM)
Alignment of Pak-Iran Border as
desired by Pak Army (In L.KM)
Joint verification of Pak - China
border (In L.KM)
Number of Inspection Standard
Bench Mark throughout the
country
Total number of students enrolled
(Male/Female)
Number of students per teacher
(Male/Female)
Total No. of teacher
(Male/Female)
Number of teachers to be trained
(Male/Female)
Number of students passed in
first division (Male/Female)
Number of seminars to be
conducted
851
140
183367
M:95203
F:91076
25
7509
M:4159
F:3350
3900
M:2000
F:1900
13200
15
463
309
184234
M:94048
F:90186
25
7509
M:4159
F:3350
6754
M:3000
F:3754
13250
230
300
55
65
800
915
460
300
150
186679
M:95393
F:91286
25
8009
M:4409
F:3600
6754
M:3500
F:3254
13300
15
300
700
583
13
800
189456
M:96493
F:92963
25
8327
M:4550
F:3777
2000
M:1000
F:1000
13350
10
300
55
65
700
300
191245
M:97365
F:93880
25
8327
M:4550
F:3777
2000
M:1000
F:1000
13450
10
300
700
300
192375
M:97825
F:94550
25
8327
M:4550
F:3777
2000
M:1000
F:1000
13450
10
Defence Division
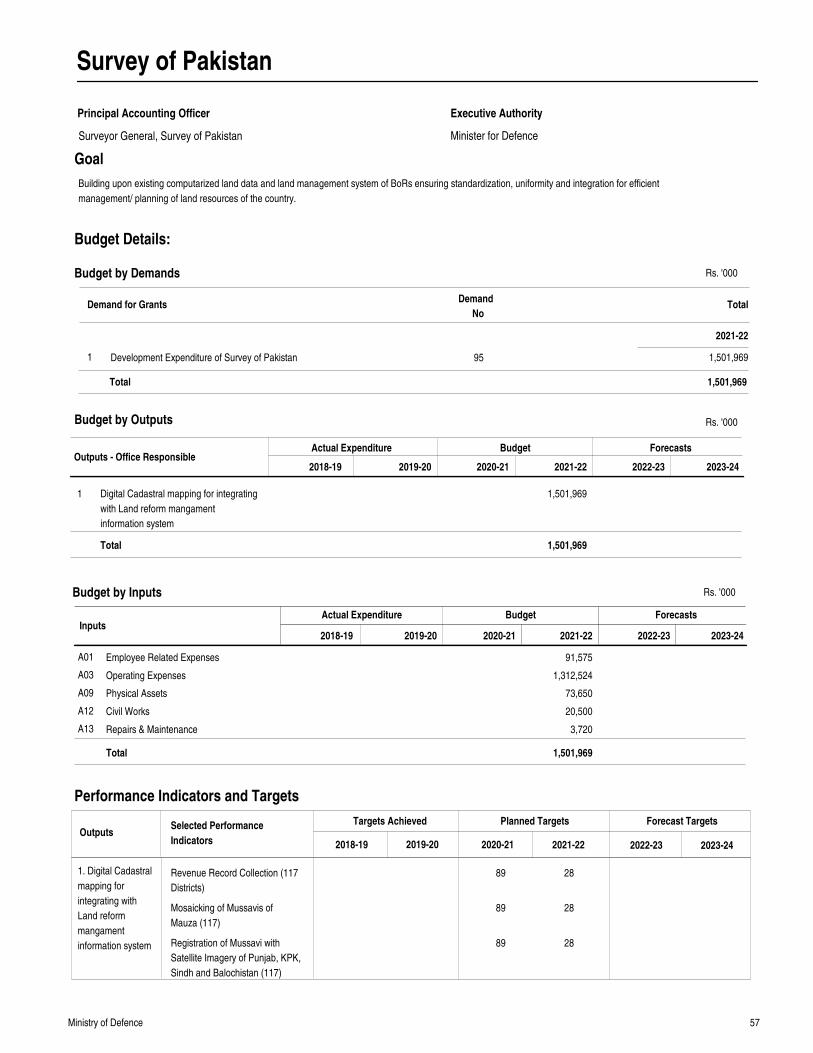
57Ministry of Defence
Survey of Pakistan
Principal Accounting Officer
Minister for Defence
Executive Authority
Goal
Outputs - Office ResponsibleActual Expenditure Budget Forecasts
2018-19 2019-20 2020-21 2021-22 2022-23 2023-24
Digital Cadastral mapping for integrating
with Land reform mangament
information system
1,501,9691
Total 1,501,969
Rs. '000
InputsActual Expenditure Budget Forecasts
Employee Related Expenses
Operating Expenses
Physical Assets
Civil Works
Repairs & Maintenance
91,575
1,312,524
73,650
20,500
3,720
A01
A03
A09
A12
A13
Total 1,501,969
2018-19 2019-20 2020-21 2021-22 2022-23 2023-24
Performance Indicators and Targets
OutputsTargets Achieved Planned Targets Forecast Targets
2018-19 2019-20 2020-21 2021-22 2022-23 2023-24
Selected Performance
Indicators
1. Digital Cadastral
mapping for
integrating with
Land reform
mangament
information system
Budget by Outputs
Budget by Inputs
Building upon existing computarized land data and land management system of BoRs ensuring standardization, uniformity and integration for efficient
management/ planning of land resources of the country.
Revenue Record Collection (117
Districts)
Mosaicking of Mussavis of
Mauza (117)
Registration of Mussavi with
Satellite Imagery of Punjab, KPK,
Sindh and Balochistan (117)
89
89
89
28
28
28
Demand for GrantsDemand
NoTotal
2021-22
Budget by Demands
Development Expenditure of Survey of Pakistan1 95 1,501,969
1,501,969Total
Surveyor General, Survey of Pakistan
Budget Details:
Rs. '000
Rs. '000
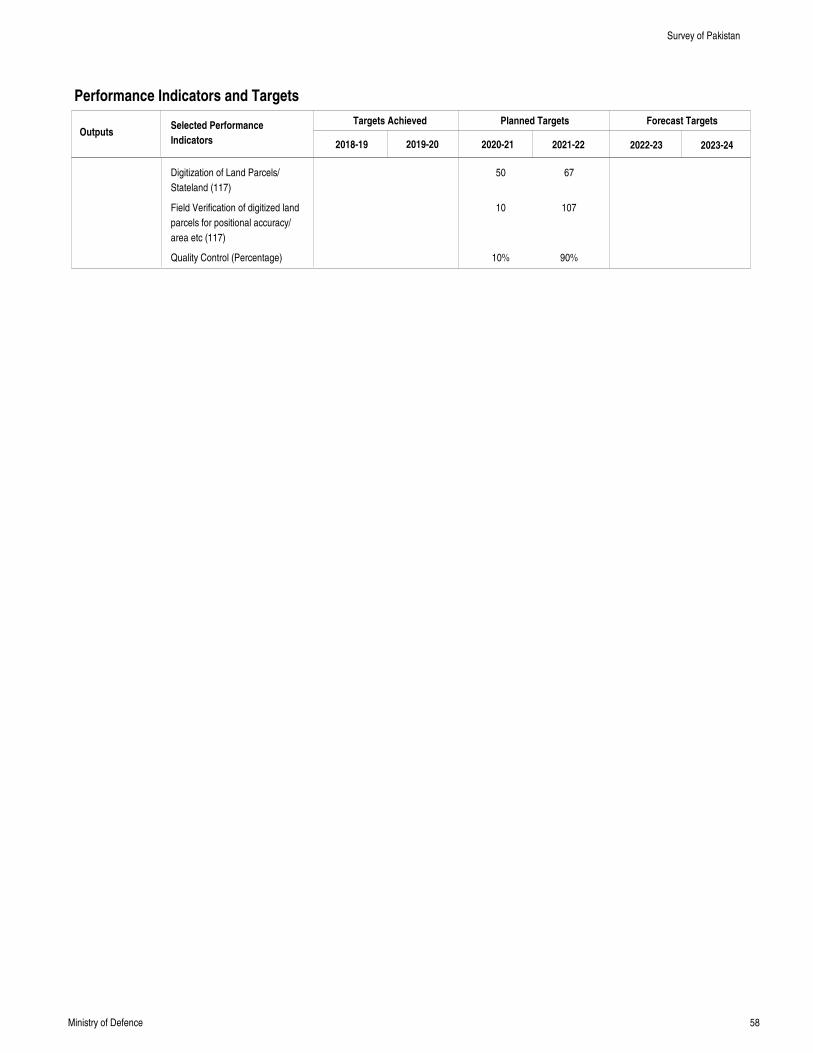
58Ministry of Defence
Performance Indicators and Targets
OutputsTargets Achieved Planned Targets Forecast Targets
2018-19 2019-20 2020-21 2021-22 2022-23 2023-24
Selected Performance
Indicators
Digitization of Land Parcels/
Stateland (117)
Field Verification of digitized land
parcels for positional accuracy/
area etc (117)
Quality Control (Percentage)
50
10
10%
67
107
90%
Survey of Pakistan
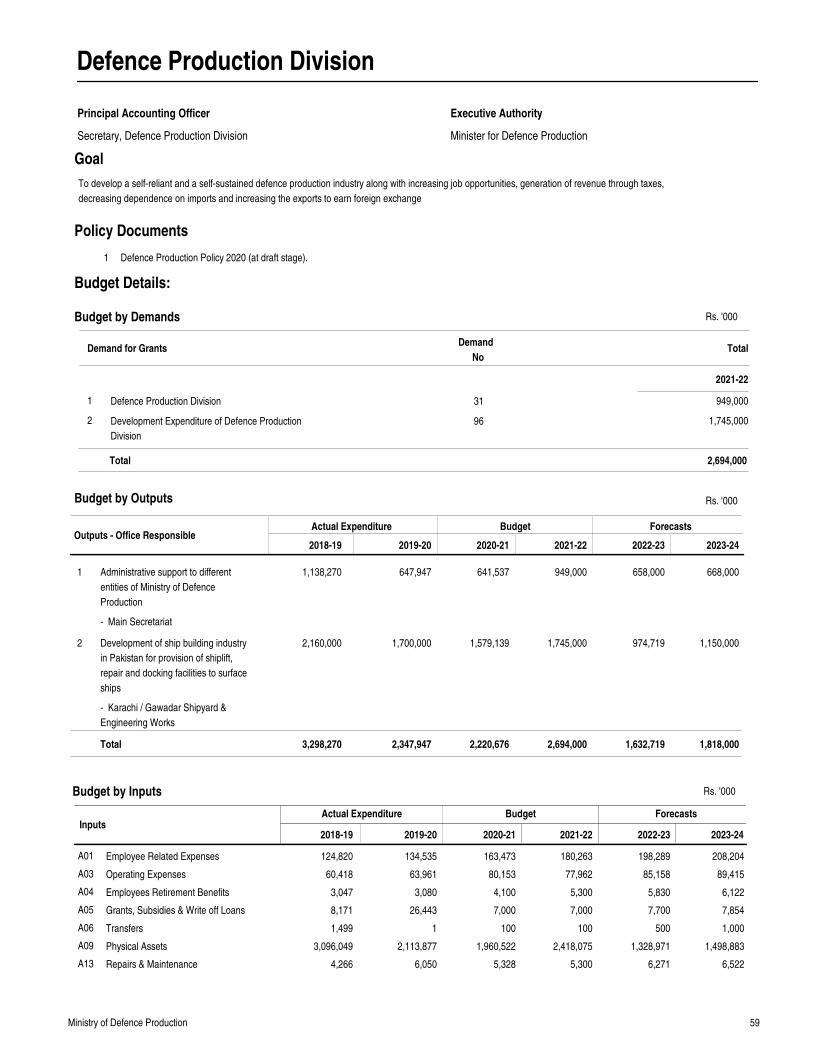
59Ministry of Defence Production
Defence Production Division
Principal Accounting Officer
Secretary, Defence Production Division Minister for Defence Production
Executive Authority
Goal
Outputs - Office ResponsibleActual Expenditure Budget Forecasts
2018-19 2019-20 2020-21 2021-22 2022-23 2023-24
Administrative support to different
entities of Ministry of Defence
Production
Development of ship building industry
in Pakistan for provision of shiplift,
repair and docking facilities to surface
ships
1,138,270
2,160,000
647,947
1,700,000
641,537
1,579,139
949,000
1,745,000
658,000
974,719
668,000
1,150,000
1
2
Total 3,298,270 2,347,947 2,220,676 2,694,000 1,632,719 1,818,000
Rs. '000
InputsActual Expenditure Budget Forecasts
Employee Related Expenses
Operating Expenses
Employees Retirement Benefits
Grants, Subsidies & Write off Loans
Transfers
Physical Assets
Repairs & Maintenance
124,820
60,418
3,047
8,171
1,499
3,096,049
4,266
134,535
63,961
3,080
26,443
1
2,113,877
6,050
163,473
80,153
4,100
7,000
100
1,960,522
5,328
180,263
77,962
5,300
7,000
100
2,418,075
5,300
198,289
85,158
5,830
7,700
500
1,328,971
6,271
208,204
89,415
6,122
7,854
1,000
1,498,883
6,522
A01
A03
A04
A05
A06
A09
A13
2018-19 2019-20 2020-21 2021-22 2022-23 2023-24
1 Defence Production Policy 2020 (at draft stage).
Policy Documents
Budget by Outputs
Budget by Inputs
To develop a self-reliant and a self-sustained defence production industry along with increasing job opportunities, generation of revenue through taxes,
decreasing dependence on imports and increasing the exports to earn foreign exchange
Demand for GrantsDemand
NoTotal
2021-22
Budget by Demands
Defence Production Division
Development Expenditure of Defence Production
Division
1
2
31
96
949,000
1,745,000
2,694,000Total
Budget Details:
- Main Secretariat
- Karachi / Gawadar Shipyard &
Engineering Works
Rs. '000
Rs. '000
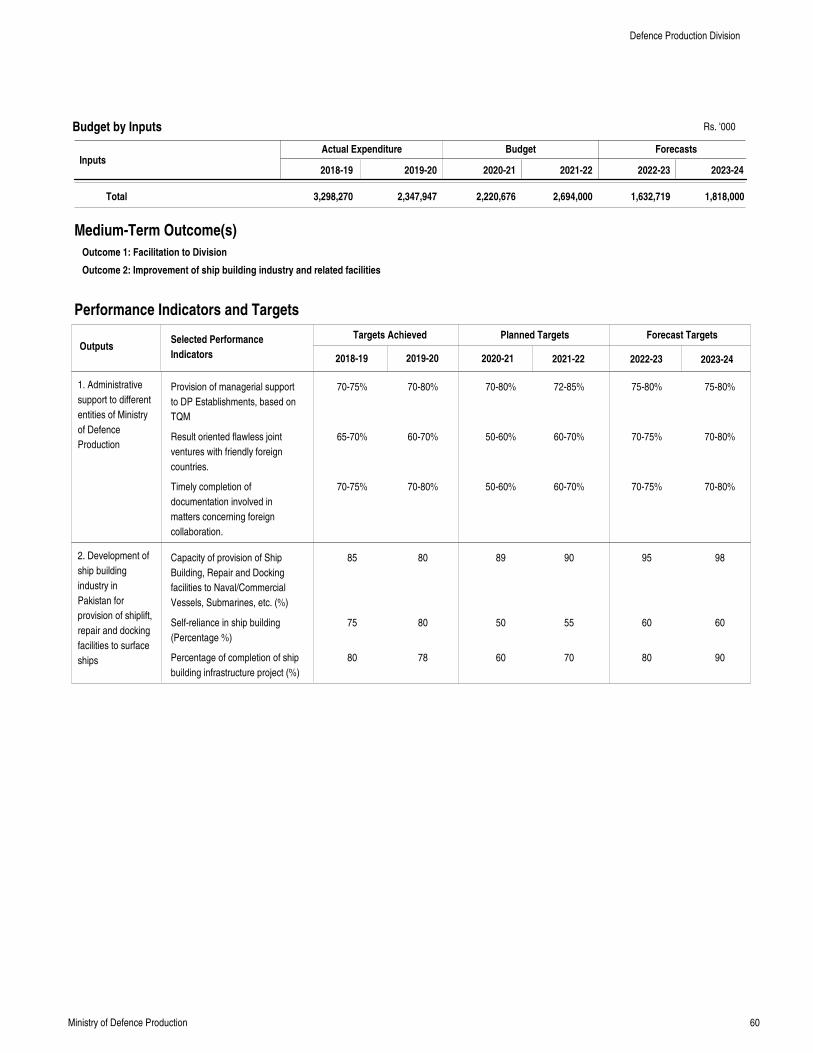
60Ministry of Defence Production
InputsActual Expenditure Budget Forecasts
Total 3,298,270 2,347,947 2,220,676 2,694,000 1,632,719 1,818,000
2018-19 2019-20 2020-21 2021-22 2022-23 2023-24
Medium-Term Outcome(s)
Outcome 1: Facilitation to Division
Outcome 2: Improvement of ship building industry and related facilities
Performance Indicators and Targets
OutputsTargets Achieved Planned Targets Forecast Targets
2018-19 2019-20 2020-21 2021-22 2022-23 2023-24
Selected Performance
Indicators
1. Administrative
support to different
entities of Ministry
of Defence
Production
2. Development of
ship building
industry in
Pakistan for
provision of shiplift,
repair and docking
facilities to surface
ships
Budget by Inputs
Provision of managerial support
to DP Establishments, based on
TQM
Result oriented flawless joint
ventures with friendly foreign
countries.
Timely completion of
documentation involved in
matters concerning foreign
collaboration.
Capacity of provision of Ship
Building, Repair and Docking
facilities to Naval/Commercial
Vessels, Submarines, etc. (%)
Self-reliance in ship building
(Percentage %)
Percentage of completion of ship
building infrastructure project (%)
70-75%
65-70%
70-75%
85
75
80
70-80%
60-70%
70-80%
80
80
78
70-80%
50-60%
50-60%
89
50
60
72-85%
60-70%
60-70%
90
55
70
75-80%
70-75%
70-75%
95
60
80
75-80%
70-80%
70-80%
98
60
90
Defence Production Division
Rs. '000
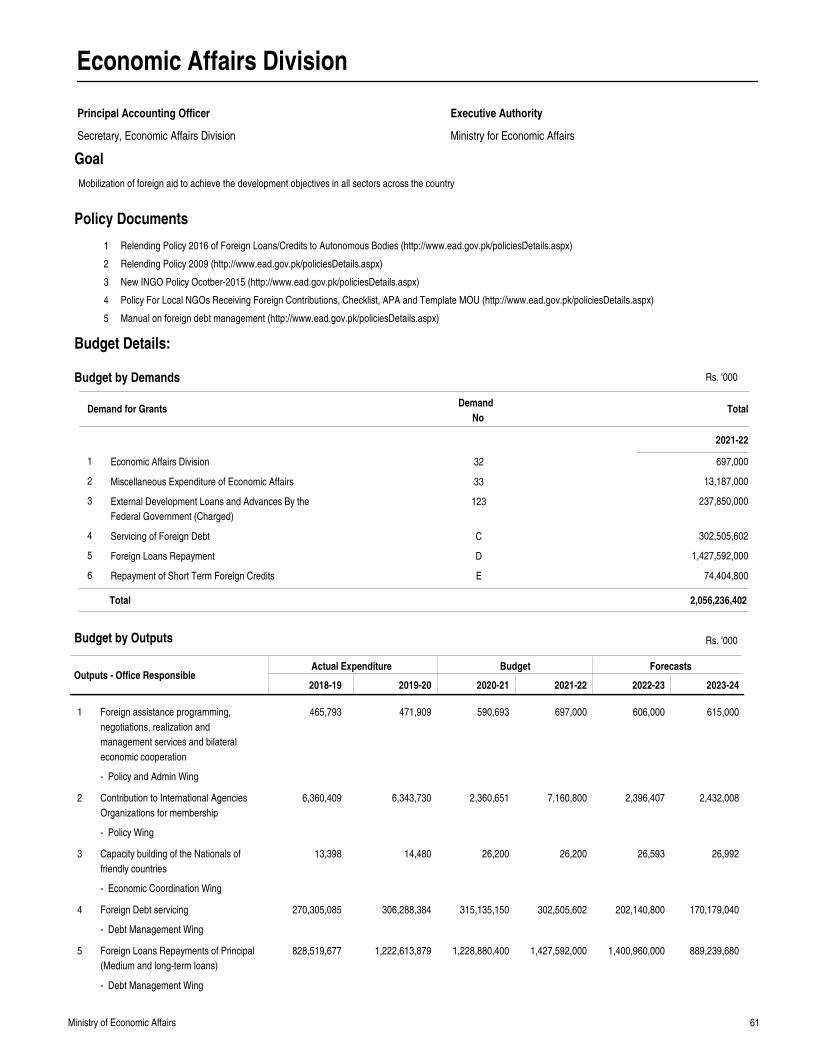
61Ministry of Economic Affairs
Economic Affairs Division
Principal Accounting Officer
Secretary, Economic Affairs Division Ministry for Economic Affairs
Executive Authority
Goal
Outputs - Office ResponsibleActual Expenditure Budget Forecasts
2018-19 2019-20 2020-21 2021-22 2022-23 2023-24
Foreign assistance programming,
negotiations, realization and
management services and bilateral
economic cooperation
Contribution to International Agencies
Organizations for membership
Capacity building of the Nationals of
friendly countries
Foreign Debt servicing
Foreign Loans Repayments of Principal
(Medium and long-term loans)
465,793
6,360,409
13,398
270,305,085
828,519,677
471,909
6,343,730
14,480
306,288,384
1,222,613,879
590,693
2,360,651
26,200
315,135,150
1,228,880,400
697,000
7,160,800
26,200
302,505,602
1,427,592,000
606,000
2,396,407
26,593
202,140,800
1,400,960,000
615,000
2,432,008
26,992
170,179,040
889,239,680
1
2
3
4
5
Rs. '000
1
2
3
4
5
Relending Policy 2016 of Foreign Loans/Credits to Autonomous Bodies (http://www.ead.gov.pk/policiesDetails.aspx)
Relending Policy 2009 (http://www.ead.gov.pk/policiesDetails.aspx)
New INGO Policy Ocotber-2015 (http://www.ead.gov.pk/policiesDetails.aspx)
Policy For Local NGOs Receiving Foreign Contributions, Checklist, APA and Template MOU (http://www.ead.gov.pk/policiesDetails.aspx)
Manual on foreign debt management (http://www.ead.gov.pk/policiesDetails.aspx)
Policy Documents
Budget by Outputs
Mobilization of foreign aid to achieve the development objectives in all sectors across the country
Demand for GrantsDemand
NoTotal
2021-22
Budget by Demands
Economic Affairs Division
Miscellaneous Expenditure of Economic Affairs
External Development Loans and Advances By the
Federal Government (Charged)
Servicing of Foreign Debt
Foreign Loans Repayment
Repayment of Short Term Foreign Credits
1
2
3
4
5
6
32
33
123
C
D
E
697,000
13,187,000
237,850,000
302,505,602
1,427,592,000
74,404,800
2,056,236,402Total
Budget Details:
- Policy and Admin Wing
- Policy Wing
- Economic Coordination Wing
- Debt Management Wing
- Debt Management Wing
Rs. '000
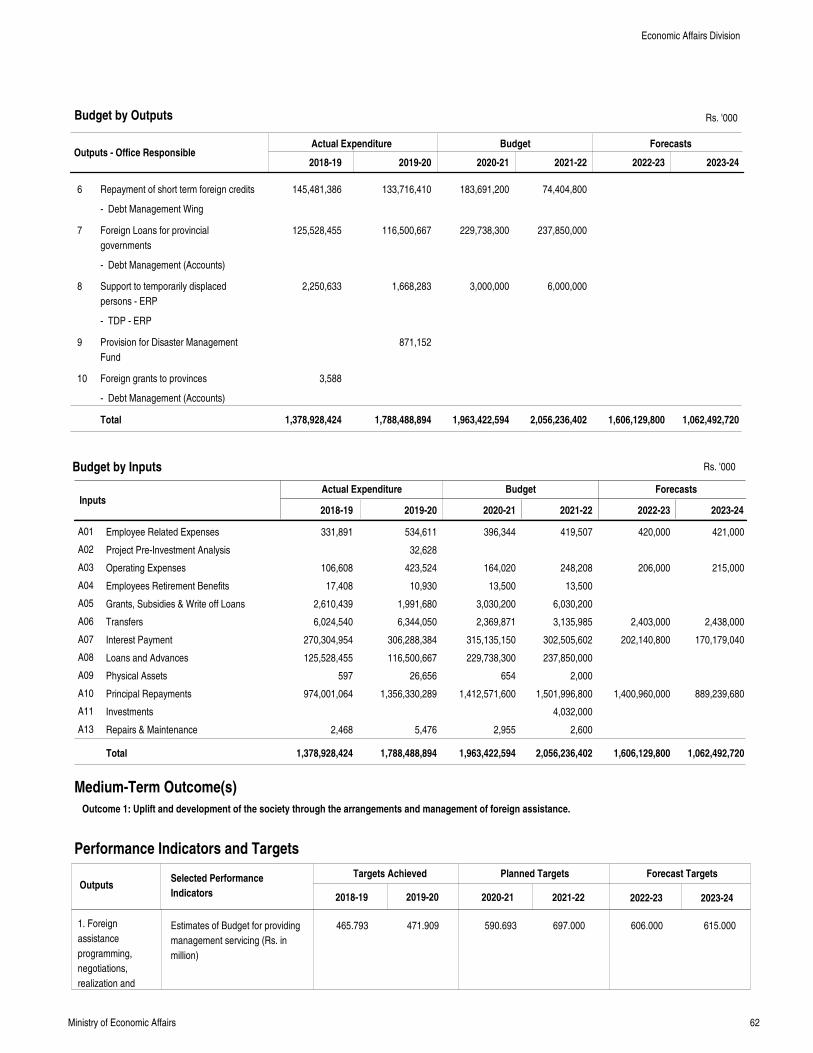
62Ministry of Economic Affairs
Outputs - Office ResponsibleActual Expenditure Budget Forecasts
2018-19 2019-20 2020-21 2021-22 2022-23 2023-24
Repayment of short term foreign credits
Foreign Loans for provincial
governments
Support to temporarily displaced
persons - ERP
Provision for Disaster Management
Fund
Foreign grants to provinces
145,481,386
125,528,455
2,250,633
3,588
133,716,410
116,500,667
1,668,283
871,152
183,691,200
229,738,300
3,000,000
74,404,800
237,850,000
6,000,000
6
7
8
9
10
Total 1,378,928,424 1,788,488,894 1,963,422,594 2,056,236,402 1,606,129,800 1,062,492,720
Rs. '000
InputsActual Expenditure Budget Forecasts
Employee Related Expenses
Project Pre-Investment Analysis
Operating Expenses
Employees Retirement Benefits
Grants, Subsidies & Write off Loans
Transfers
Interest Payment
Loans and Advances
Physical Assets
Principal Repayments
Investments
Repairs & Maintenance
331,891
106,608
17,408
2,610,439
6,024,540
270,304,954
125,528,455
597
974,001,064
2,468
534,611
32,628
423,524
10,930
1,991,680
6,344,050
306,288,384
116,500,667
26,656
1,356,330,289
5,476
396,344
164,020
13,500
3,030,200
2,369,871
315,135,150
229,738,300
654
1,412,571,600
2,955
419,507
248,208
13,500
6,030,200
3,135,985
302,505,602
237,850,000
2,000
1,501,996,800
4,032,000
2,600
420,000
206,000
2,403,000
202,140,800
1,400,960,000
421,000
215,000
2,438,000
170,179,040
889,239,680
A01
A02
A03
A04
A05
A06
A07
A08
A09
A10
A11
A13
Total 1,378,928,424 1,788,488,894 1,963,422,594 2,056,236,402 1,606,129,800 1,062,492,720
2018-19 2019-20 2020-21 2021-22 2022-23 2023-24
Medium-Term Outcome(s)
Outcome 1: Uplift and development of the society through the arrangements and management of foreign assistance.
Performance Indicators and Targets
OutputsTargets Achieved Planned Targets Forecast Targets
2018-19 2019-20 2020-21 2021-22 2022-23 2023-24
Selected Performance
Indicators
1. Foreign
assistance
programming,
negotiations,
realization and
Budget by Outputs
Budget by Inputs
Estimates of Budget for providing
management servicing (Rs. in
million)
465.793 471.909 590.693 697.000 606.000 615.000
Economic Affairs Division
- Debt Management Wing
- Debt Management (Accounts)
- TDP - ERP
- Debt Management (Accounts)
Rs. '000
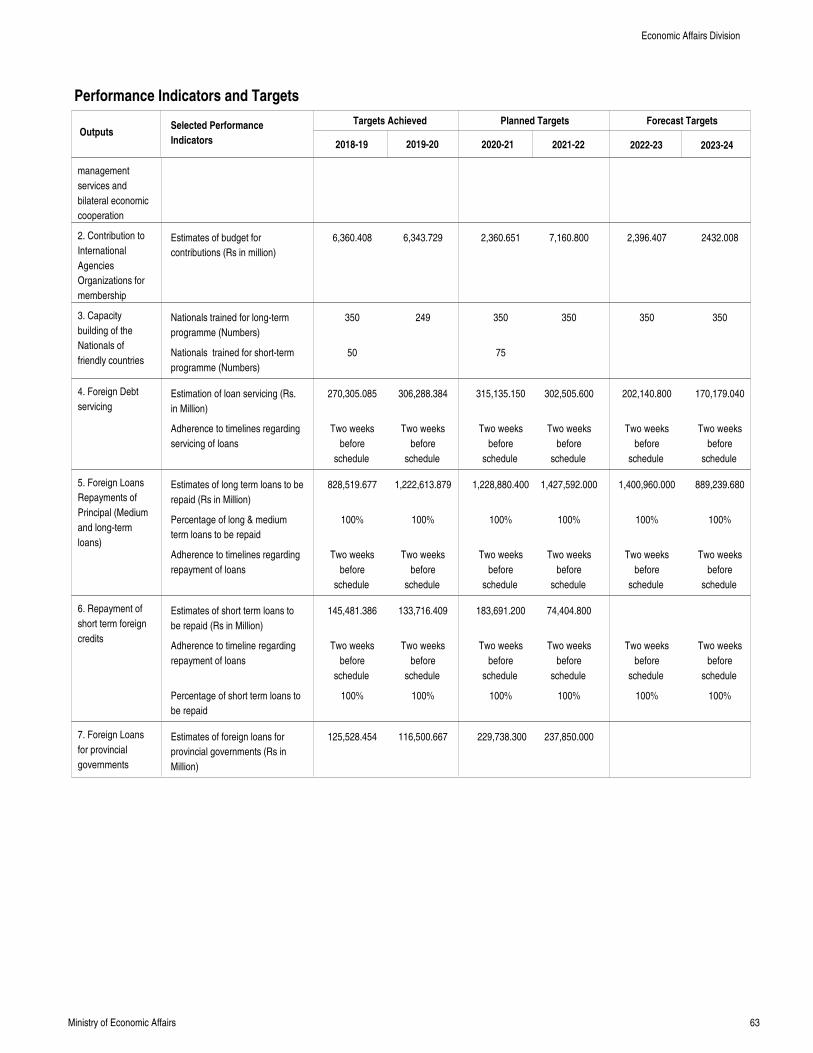
63Ministry of Economic Affairs
Performance Indicators and Targets
OutputsTargets Achieved Planned Targets Forecast Targets
2018-19 2019-20 2020-21 2021-22 2022-23 2023-24
Selected Performance
Indicators
management
services and
bilateral economic
cooperation
2. Contribution to
International
Agencies
Organizations for
membership
3. Capacity
building of the
Nationals of
friendly countries
4. Foreign Debt
servicing
5. Foreign Loans
Repayments of
Principal (Medium
and long-term
loans)
6. Repayment of
short term foreign
credits
7. Foreign Loans
for provincial
governments
Estimates of budget for
contributions (Rs in million)
Nationals trained for long-term
programme (Numbers)
Nationals trained for short-term
programme (Numbers)
Estimation of loan servicing (Rs.
in Million)
Adherence to timelines regarding
servicing of loans
Estimates of long term loans to be
repaid (Rs in Million)
Percentage of long & medium
term loans to be repaid
Adherence to timelines regarding
repayment of loans
Estimates of short term loans to
be repaid (Rs in Million)
Adherence to timeline regarding
repayment of loans
Percentage of short term loans to
be repaid
Estimates of foreign loans for
provincial governments (Rs in
Million)
6,360.408
350
50
270,305.085
Two weeks
before
schedule
828,519.677
100%
Two weeks
before
schedule
145,481.386
Two weeks
before
schedule
100%
125,528.454
6,343.729
249
306,288.384
Two weeks
before
schedule
1,222,613.879
100%
Two weeks
before
schedule
133,716.409
Two weeks
before
schedule
100%
116,500.667
2,360.651
350
75
315,135.150
Two weeks
before
schedule
1,228,880.400
100%
Two weeks
before
schedule
183,691.200
Two weeks
before
schedule
100%
229,738.300
7,160.800
350
302,505.600
Two weeks
before
schedule
1,427,592.000
100%
Two weeks
before
schedule
74,404.800
Two weeks
before
schedule
100%
237,850.000
2,396.407
350
202,140.800
Two weeks
before
schedule
1,400,960.000
100%
Two weeks
before
schedule
Two weeks
before
schedule
100%
2432.008
350
170,179.040
Two weeks
before
schedule
889,239.680
100%
Two weeks
before
schedule
Two weeks
before
schedule
100%
Economic Affairs Division
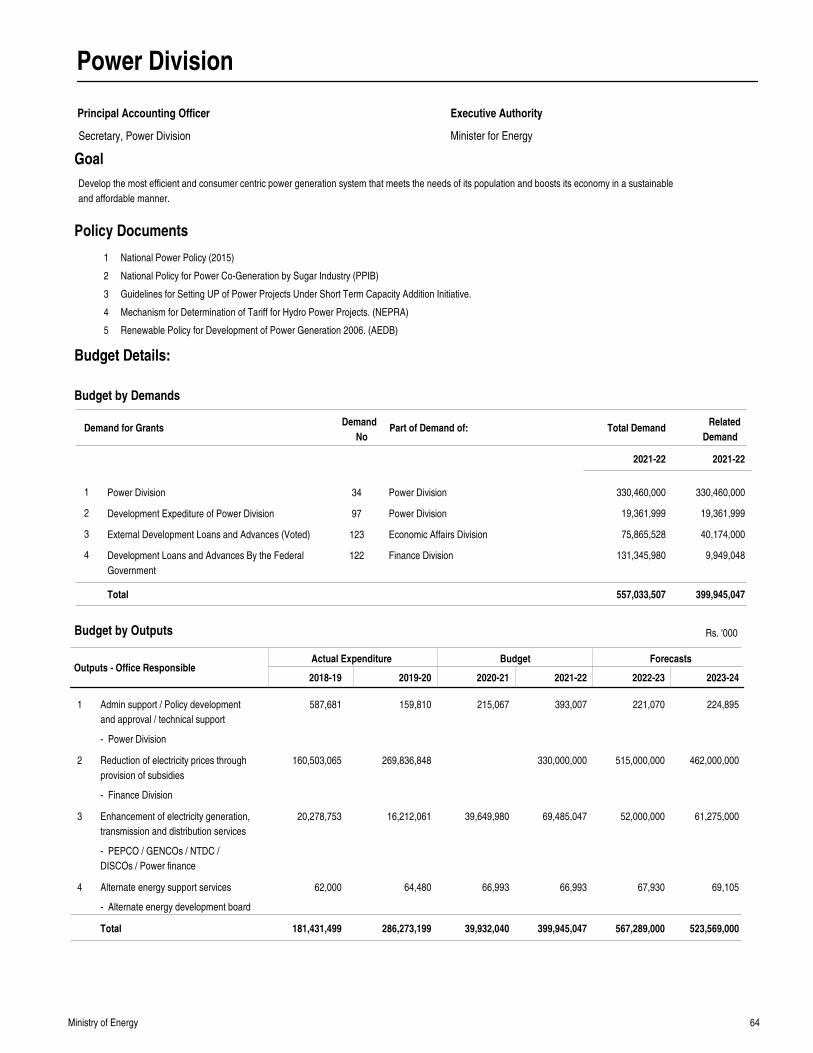
64Ministry of Energy
Power Division
Principal Accounting Officer
Minister for Energy
Executive Authority
Goal
Outputs - Office ResponsibleActual Expenditure Budget Forecasts
2018-19 2019-20 2020-21 2021-22 2022-23 2023-24
Admin support / Policy development
and approval / technical support
Reduction of electricity prices through
provision of subsidies
Enhancement of electricity generation,
transmission and distribution services
Alternate energy support services
587,681
160,503,065
20,278,753
62,000
159,810
269,836,848
16,212,061
64,480
215,067
39,649,980
66,993
393,007
330,000,000
69,485,047
66,993
221,070
515,000,000
52,000,000
67,930
224,895
462,000,000
61,275,000
69,105
1
2
3
4
Total 181,431,499 286,273,199 39,932,040 399,945,047 567,289,000 523,569,000
Rs. '000
Power Division
Development Expediture of Power Division
External Development Loans and Advances (Voted)
Development Loans and Advances By the Federal
Government
1
2
3
4
34
97
123
122
Power Division
Power Division
Economic Affairs Division
Finance Division
330,460,000
19,361,999
75,865,528
131,345,980
330,460,000
19,361,999
40,174,000
9,949,048
Demand for GrantsDemand
NoPart of Demand of: Total Demand
2021-22
557,033,507 399,945,047Total
1
2
3
4
5
National Power Policy (2015)
National Policy for Power Co-Generation by Sugar Industry (PPIB)
Guidelines for Setting UP of Power Projects Under Short Term Capacity Addition Initiative.
Mechanism for Determination of Tariff for Hydro Power Projects. (NEPRA)
Renewable Policy for Development of Power Generation 2006. (AEDB)
Policy Documents
Budget by Outputs
Budget by Demands
Develop the most efficient and consumer centric power generation system that meets the needs of its population and boosts its economy in a sustainable
and affordable manner.
Secretary, Power Division
Budget Details:
- Power Division
- Finance Division
- PEPCO / GENCOs / NTDC /
DISCOs / Power finance
- Alternate energy development board
2021-22
Related
Demand
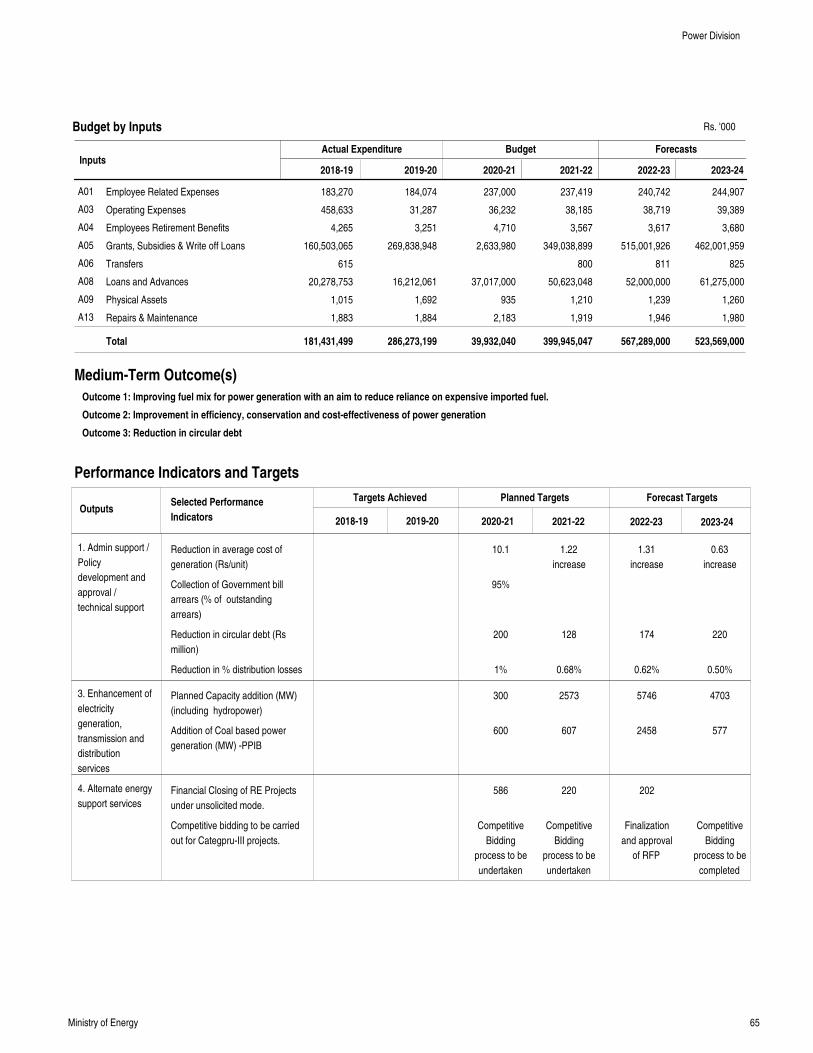
65Ministry of Energy
InputsActual Expenditure Budget Forecasts
Employee Related Expenses
Operating Expenses
Employees Retirement Benefits
Grants, Subsidies & Write off Loans
Transfers
Loans and Advances
Physical Assets
Repairs & Maintenance
183,270
458,633
4,265
160,503,065
615
20,278,753
1,015
1,883
184,074
31,287
3,251
269,838,948
16,212,061
1,692
1,884
237,000
36,232
4,710
2,633,980
37,017,000
935
2,183
237,419
38,185
3,567
349,038,899
800
50,623,048
1,210
1,919
240,742
38,719
3,617
515,001,926
811
52,000,000
1,239
1,946
244,907
39,389
3,680
462,001,959
825
61,275,000
1,260
1,980
A01
A03
A04
A05
A06
A08
A09
A13
Total 181,431,499 286,273,199 39,932,040 399,945,047 567,289,000 523,569,000
2018-19 2019-20 2020-21 2021-22 2022-23 2023-24
Medium-Term Outcome(s)
Outcome 1: Improving fuel mix for power generation with an aim to reduce reliance on expensive imported fuel.
Outcome 2: Improvement in efficiency, conservation and cost-effectiveness of power generation
Outcome 3: Reduction in circular debt
Performance Indicators and Targets
OutputsTargets Achieved Planned Targets Forecast Targets
2018-19 2019-20 2020-21 2021-22 2022-23 2023-24
Selected Performance
Indicators
1. Admin support /
Policy
development and
approval /
technical support
3. Enhancement of
electricity
generation,
transmission and
distribution
services
4. Alternate energy
support services
Budget by Inputs
Reduction in average cost of
generation (Rs/unit)
Collection of Government bill
arrears (% of outstanding
arrears)
Reduction in circular debt (Rs
million)
Reduction in % distribution losses
Planned Capacity addition (MW)
(including hydropower)
Addition of Coal based power
generation (MW) -PPIB
Financial Closing of RE Projects
under unsolicited mode.
Competitive bidding to be carried
out for Categpru-III projects.
10.1
95%
200
1%
300
600
586
Competitive
Bidding
process to be
undertaken
1.22
increase
128
0.68%
2573
607
220
Competitive
Bidding
process to be
undertaken
1.31
increase
174
0.62%
5746
2458
202
Finalization
and approval
of RFP
0.63
increase
220
0.50%
4703
577
Competitive
Bidding
process to be
completed
Power Division
Rs. '000
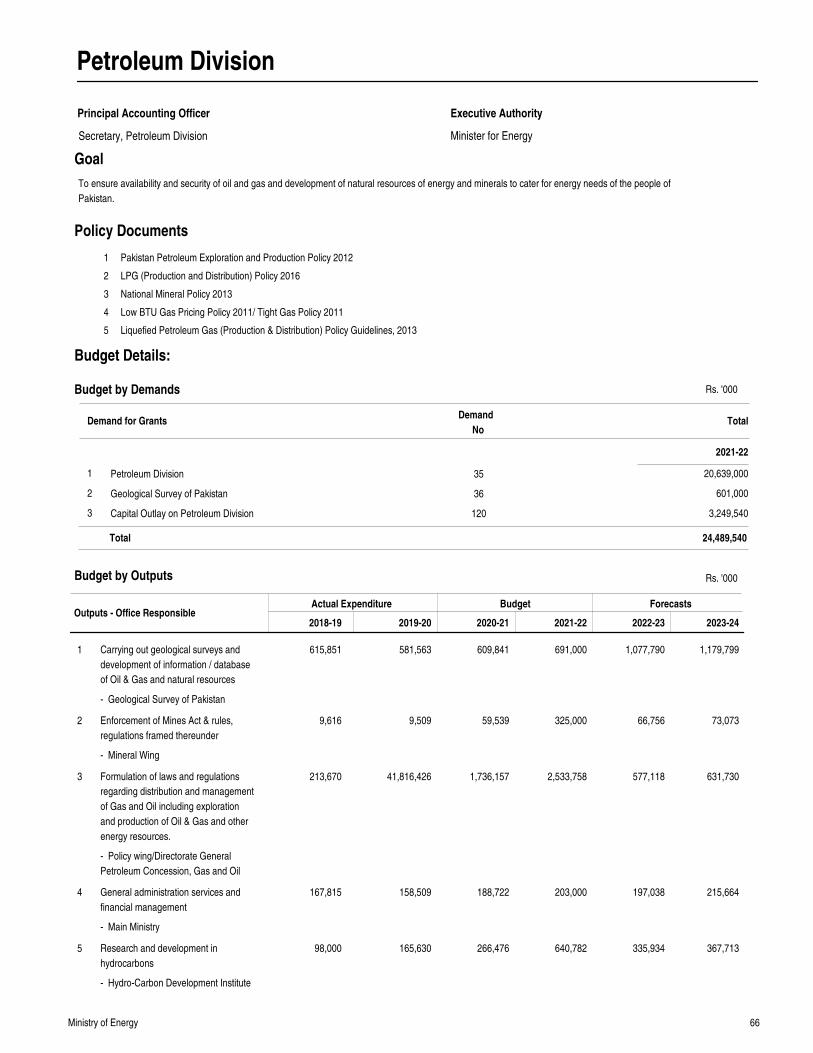
66Ministry of Energy
Petroleum Division
Principal Accounting Officer
Minister for Energy
Executive Authority
Goal
Outputs - Office ResponsibleActual Expenditure Budget Forecasts
2018-19 2019-20 2020-21 2021-22 2022-23 2023-24
Carrying out geological surveys and
development of information / database
of Oil & Gas and natural resources
Enforcement of Mines Act & rules,
regulations framed thereunder
Formulation of laws and regulations
regarding distribution and management
of Gas and Oil including exploration
and production of Oil & Gas and other
energy resources.
General administration services and
financial management
Research and development in
hydrocarbons
615,851
9,616
213,670
167,815
98,000
581,563
9,509
41,816,426
158,509
165,630
609,841
59,539
1,736,157
188,722
266,476
691,000
325,000
2,533,758
203,000
640,782
1,077,790
66,756
577,118
197,038
335,934
1,179,799
73,073
631,730
215,664
367,713
1
2
3
4
5
Rs. '000
1
2
3
4
5
Pakistan Petroleum Exploration and Production Policy 2012
LPG (Production and Distribution) Policy 2016
National Mineral Policy 2013
Low BTU Gas Pricing Policy 2011/ Tight Gas Policy 2011
Liquefied Petroleum Gas (Production & Distribution) Policy Guidelines, 2013
Policy Documents
Budget by Outputs
To ensure availability and security of oil and gas and development of natural resources of energy and minerals to cater for energy needs of the people of
Pakistan.
Demand for GrantsDemand
NoTotal
2021-22
Budget by Demands
Petroleum Division
Geological Survey of Pakistan
Capital Outlay on Petroleum Division
1
2
3
35
36
120
20,639,000
601,000
3,249,540
24,489,540Total
Secretary, Petroleum Division
Budget Details:
- Geological Survey of Pakistan
- Mineral Wing
- Policy wing/Directorate General
Petroleum Concession, Gas and Oil
- Main Ministry
- Hydro-Carbon Development Institute
Rs. '000
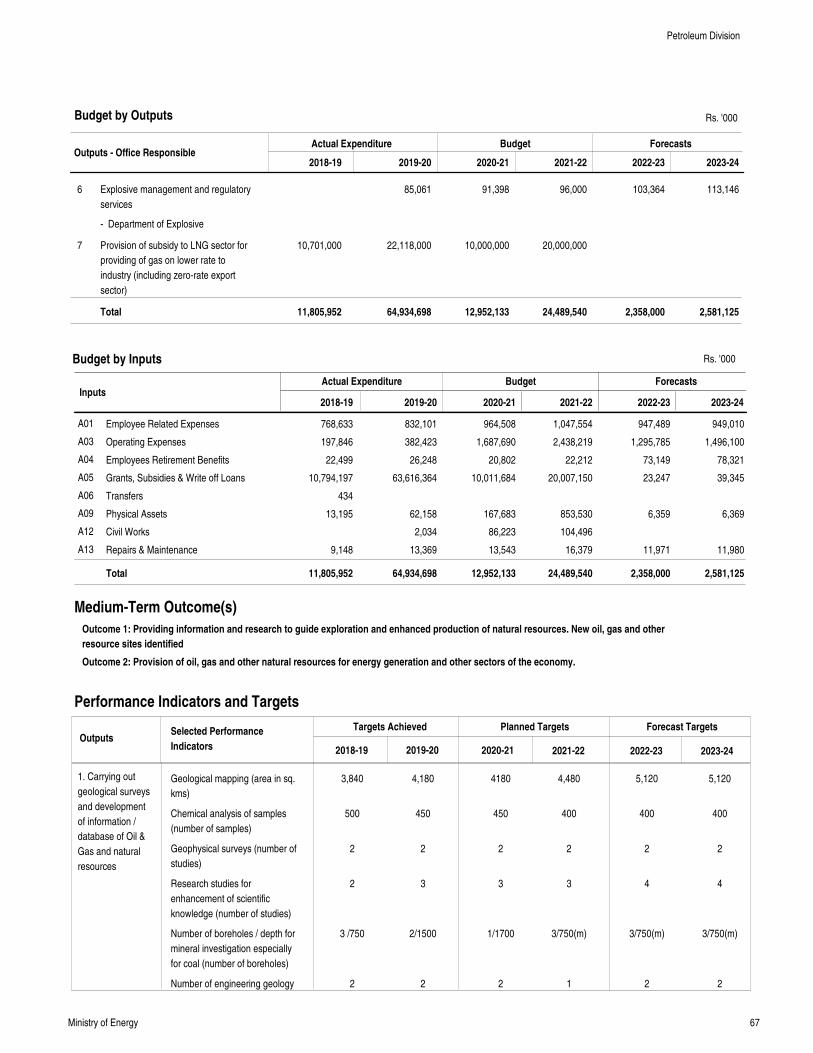
67Ministry of Energy
Outputs - Office ResponsibleActual Expenditure Budget Forecasts
2018-19 2019-20 2020-21 2021-22 2022-23 2023-24
Explosive management and regulatory
services
Provision of subsidy to LNG sector for
providing of gas on lower rate to
industry (including zero-rate export
sector)
10,701,000
85,061
22,118,000
91,398
10,000,000
96,000
20,000,000
103,364 113,1466
7
Total 11,805,952 64,934,698 12,952,133 24,489,540 2,358,000 2,581,125
Rs. '000
InputsActual Expenditure Budget Forecasts
Employee Related Expenses
Operating Expenses
Employees Retirement Benefits
Grants, Subsidies & Write off Loans
Transfers
Physical Assets
Civil Works
Repairs & Maintenance
768,633
197,846
22,499
10,794,197
434
13,195
9,148
832,101
382,423
26,248
63,616,364
62,158
2,034
13,369
964,508
1,687,690
20,802
10,011,684
167,683
86,223
13,543
1,047,554
2,438,219
22,212
20,007,150
853,530
104,496
16,379
947,489
1,295,785
73,149
23,247
6,359
11,971
949,010
1,496,100
78,321
39,345
6,369
11,980
A01
A03
A04
A05
A06
A09
A12
A13
Total 11,805,952 64,934,698 12,952,133 24,489,540 2,358,000 2,581,125
2018-19 2019-20 2020-21 2021-22 2022-23 2023-24
Medium-Term Outcome(s)
Outcome 1: Providing information and research to guide exploration and enhanced production of natural resources. New oil, gas and other
resource sites identified
Outcome 2: Provision of oil, gas and other natural resources for energy generation and other sectors of the economy.
Performance Indicators and Targets
OutputsTargets Achieved Planned Targets Forecast Targets
2018-19 2019-20 2020-21 2021-22 2022-23 2023-24
Selected Performance
Indicators
1. Carrying out
geological surveys
and development
of information /
database of Oil &
Gas and natural
resources
Budget by Outputs
Budget by Inputs
Geological mapping (area in sq.
kms)
Chemical analysis of samples
(number of samples)
Geophysical surveys (number of
studies)
Research studies for
enhancement of scientific
knowledge (number of studies)
Number of boreholes / depth for
mineral investigation especially
for coal (number of boreholes)
Number of engineering geology
3,840
500
2
2
3 /750
2
4,180
450
2
3
2/1500
2
4180
450
2
3
1/1700
2
4,480
400
2
3
3/750(m)
1
5,120
400
2
4
3/750(m)
2
5,120
400
2
4
3/750(m)
2
Petroleum Division
- Department of Explosive
Rs. '000
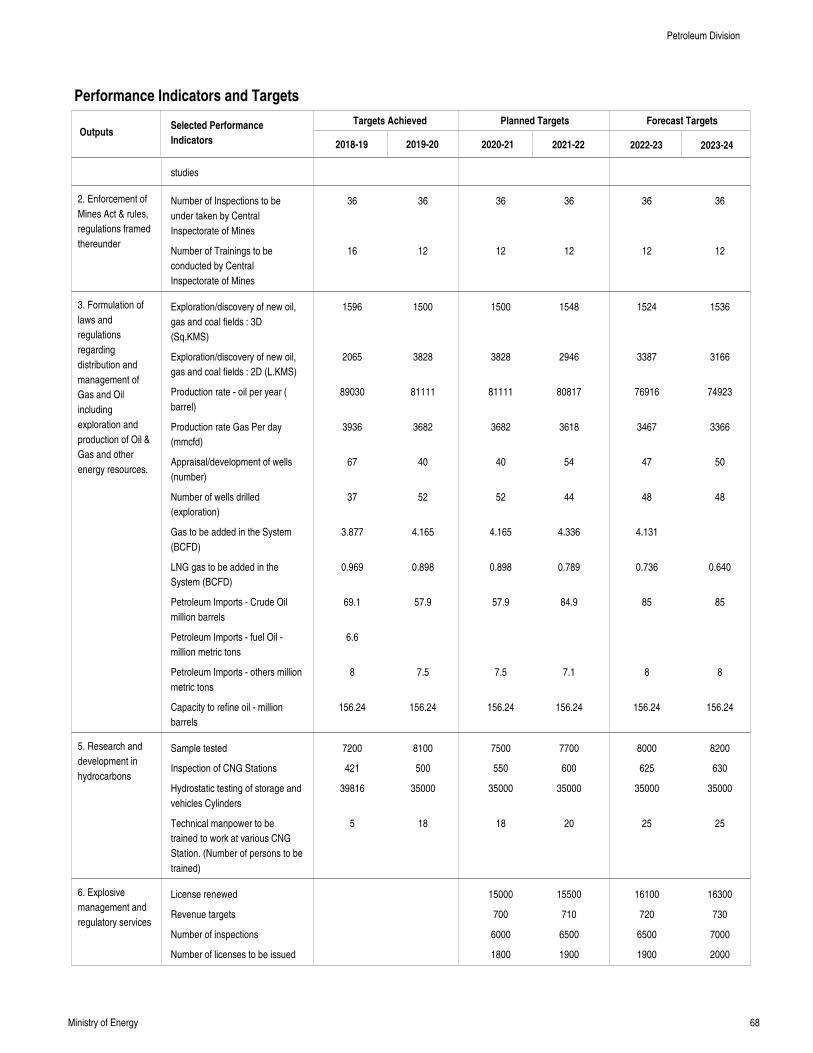
68Ministry of Energy
Performance Indicators and Targets
OutputsTargets Achieved Planned Targets Forecast Targets
2018-19 2019-20 2020-21 2021-22 2022-23 2023-24
Selected Performance
Indicators
2. Enforcement of
Mines Act & rules,
regulations framed
thereunder
3. Formulation of
laws and
regulations
regarding
distribution and
management of
Gas and Oil
including
exploration and
production of Oil &
Gas and other
energy resources.
5. Research and
development in
hydrocarbons
6. Explosive
management and
regulatory services
studies
Number of Inspections to be
under taken by Central
Inspectorate of Mines
Number of Trainings to be
conducted by Central
Inspectorate of Mines
Exploration/discovery of new oil,
gas and coal fields : 3D
(Sq.KMS)
Exploration/discovery of new oil,
gas and coal fields : 2D (L.KMS)
Production rate - oil per year (
barrel)
Production rate Gas Per day
(mmcfd)
Appraisal/development of wells
(number)
Number of wells drilled
(exploration)
Gas to be added in the System
(BCFD)
LNG gas to be added in the
System (BCFD)
Petroleum Imports - Crude Oil
million barrels
Petroleum Imports - fuel Oil -
million metric tons
Petroleum Imports - others million
metric tons
Capacity to refine oil - million
barrels
Sample tested
Inspection of CNG Stations
Hydrostatic testing of storage and
vehicles Cylinders
Technical manpower to be
trained to work at various CNG
Station. (Number of persons to be
trained)
License renewed
Revenue targets
Number of inspections
Number of licenses to be issued
36
16
1596
2065
89030
3936
67
37
3.877
0.969
69.1
6.6
8
156.24
7200
421
39816
5
36
12
1500
3828
81111
3682
40
52
4.165
0.898
57.9
7.5
156.24
8100
500
35000
18
36
12
1500
3828
81111
3682
40
52
4.165
0.898
57.9
7.5
156.24
7500
550
35000
18
15000
700
6000
1800
36
12
1548
2946
80817
3618
54
44
4.336
0.789
84.9
7.1
156.24
7700
600
35000
20
15500
710
6500
1900
36
12
1524
3387
76916
3467
47
48
4.131
0.736
85
8
156.24
8000
625
35000
25
16100
720
6500
1900
36
12
1536
3166
74923
3366
50
48
0.640
85
8
156.24
8200
630
35000
25
16300
730
7000
2000
Petroleum Division
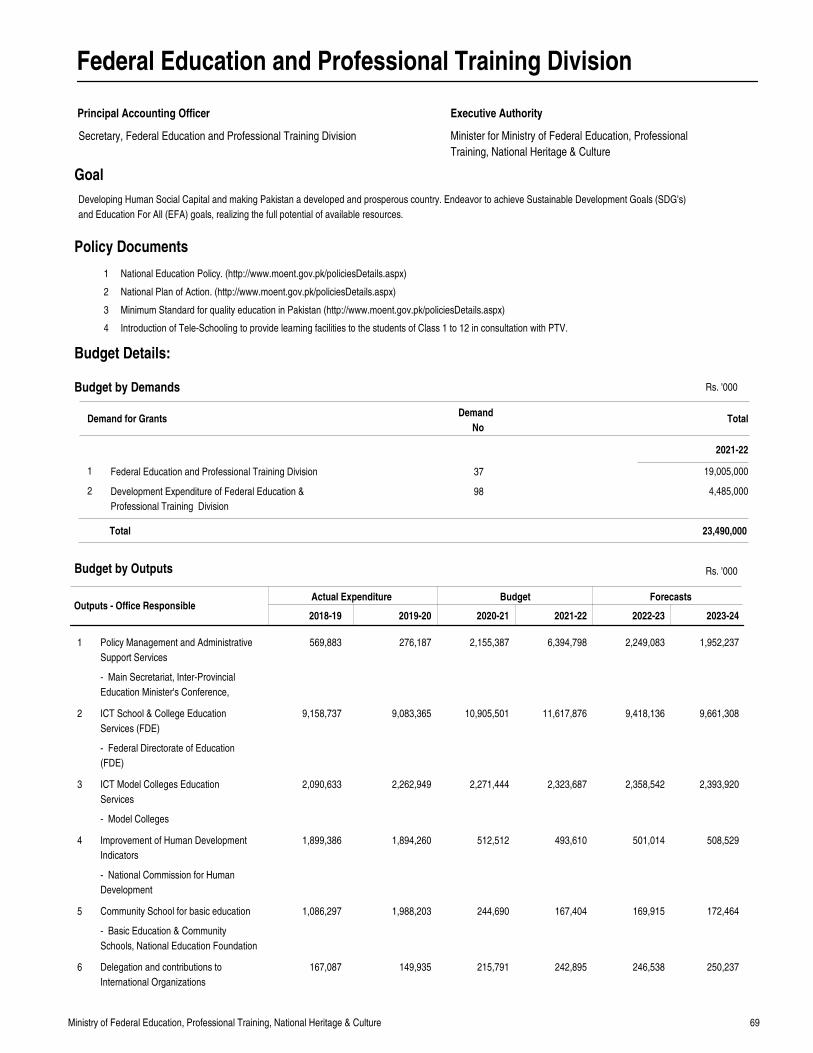
69Ministry of Federal Education, Professional Training, National Heritage & Culture
Federal Education and Professional Training Division
Principal Accounting Officer
Minister for Ministry of Federal Education, Professional
Training, National Heritage & Culture
Executive Authority
Goal
Outputs - Office ResponsibleActual Expenditure Budget Forecasts
2018-19 2019-20 2020-21 2021-22 2022-23 2023-24
Policy Management and Administrative
Support Services
ICT School & College Education
Services (FDE)
ICT Model Colleges Education
Services
Improvement of Human Development
Indicators
Community School for basic education
Delegation and contributions to
International Organizations
569,883
9,158,737
2,090,633
1,899,386
1,086,297
167,087
276,187
9,083,365
2,262,949
1,894,260
1,988,203
149,935
2,155,387
10,905,501
2,271,444
512,512
244,690
215,791
6,394,798
11,617,876
2,323,687
493,610
167,404
242,895
2,249,083
9,418,136
2,358,542
501,014
169,915
246,538
1,952,237
9,661,308
2,393,920
508,529
172,464
250,237
1
2
3
4
5
6
Rs. '000
1
2
3
4
National Education Policy. (http://www.moent.gov.pk/policiesDetails.aspx)
National Plan of Action. (http://www.moent.gov.pk/policiesDetails.aspx)
Minimum Standard for quality education in Pakistan (http://www.moent.gov.pk/policiesDetails.aspx)
Introduction of Tele-Schooling to provide learning facilities to the students of Class 1 to 12 in consultation with PTV.
Policy Documents
Budget by Outputs
Developing Human Social Capital and making Pakistan a developed and prosperous country. Endeavor to achieve Sustainable Development Goals (SDG's)
and Education For All (EFA) goals, realizing the full potential of available resources.
Demand for GrantsDemand
NoTotal
2021-22
Budget by Demands
Federal Education and Professional Training Division
Development Expenditure of Federal Education &
Professional Training Division
1
2
37
98
19,005,000
4,485,000
23,490,000Total
Secretary, Federal Education and Professional Training Division
Budget Details:
- Main Secretariat, Inter-Provincial
Education Minister's Conference,
- Federal Directorate of Education
(FDE)
- Model Colleges
- National Commission for Human
Development
- Basic Education & Community
Schools, National Education Foundation
Rs. '000
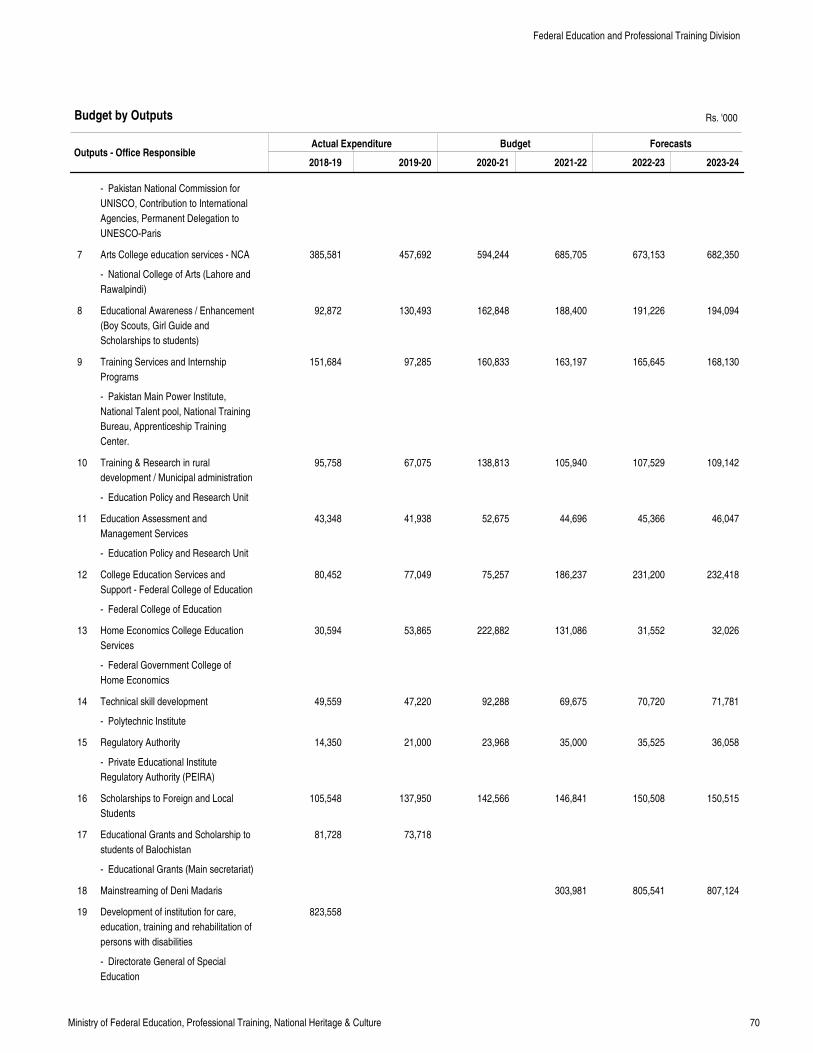
70Ministry of Federal Education, Professional Training, National Heritage & Culture
Outputs - Office ResponsibleActual Expenditure Budget Forecasts
2018-19 2019-20 2020-21 2021-22 2022-23 2023-24
Arts College education services - NCA
Educational Awareness / Enhancement
(Boy Scouts, Girl Guide and
Scholarships to students)
Training Services and Internship
Programs
Training & Research in rural
development / Municipal administration
Education Assessment and
Management Services
College Education Services and
Support - Federal College of Education
Home Economics College Education
Services
Technical skill development
Regulatory Authority
Scholarships to Foreign and Local
Students
Educational Grants and Scholarship to
students of Balochistan
Mainstreaming of Deni Madaris
Development of institution for care,
education, training and rehabilitation of
persons with disabilities
385,581
92,872
151,684
95,758
43,348
80,452
30,594
49,559
14,350
105,548
81,728
823,558
457,692
130,493
97,285
67,075
41,938
77,049
53,865
47,220
21,000
137,950
73,718
594,244
162,848
160,833
138,813
52,675
75,257
222,882
92,288
23,968
142,566
685,705
188,400
163,197
105,940
44,696
186,237
131,086
69,675
35,000
146,841
303,981
673,153
191,226
165,645
107,529
45,366
231,200
31,552
70,720
35,525
150,508
805,541
682,350
194,094
168,130
109,142
46,047
232,418
32,026
71,781
36,058
150,515
807,124
7
8
9
10
11
12
13
14
15
16
17
18
19
Rs. '000Budget by Outputs
Federal Education and Professional Training Division
- Pakistan National Commission for
UNISCO, Contribution to International
Agencies, Permanent Delegation to
UNESCO-Paris
- National College of Arts (Lahore and
Rawalpindi)
- Pakistan Main Power Institute,
National Talent pool, National Training
Bureau, Apprenticeship Training
Center.
- Education Policy and Research Unit
- Education Policy and Research Unit
- Federal College of Education
- Federal Government College of
Home Economics
- Polytechnic Institute
- Private Educational Institute
Regulatory Authority (PEIRA)
- Educational Grants (Main secretariat)
- Directorate General of Special
Education
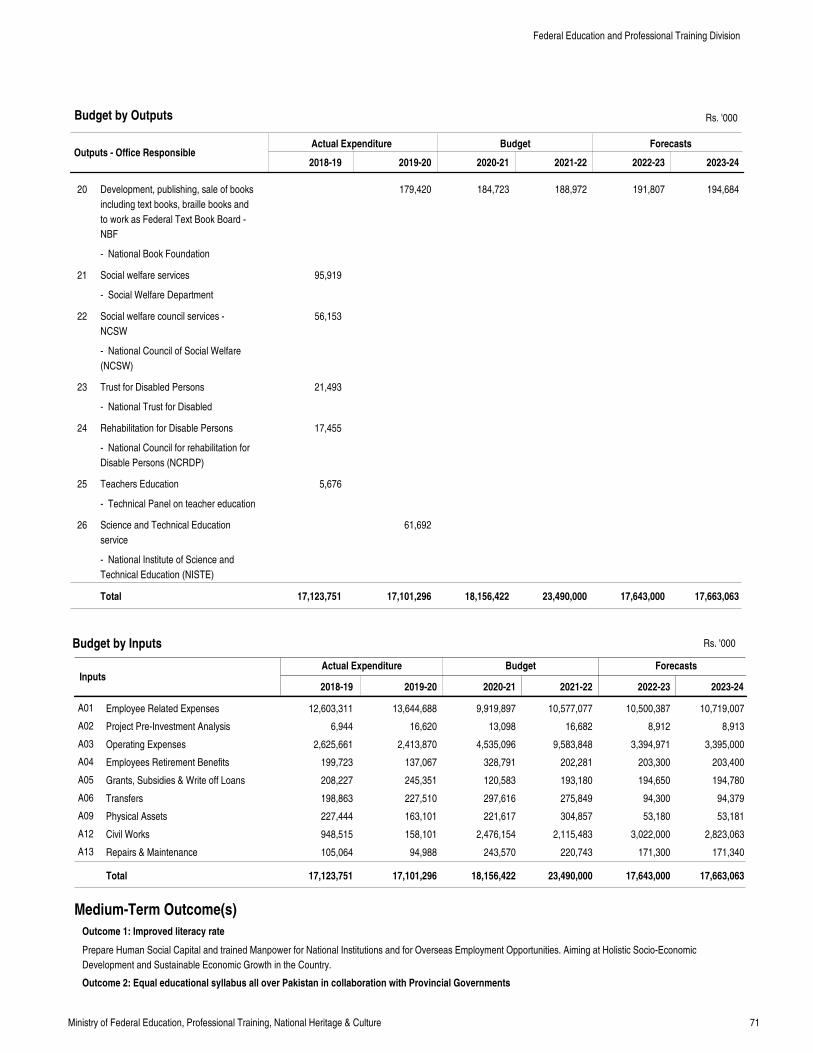
71Ministry of Federal Education, Professional Training, National Heritage & Culture
Outputs - Office ResponsibleActual Expenditure Budget Forecasts
2018-19 2019-20 2020-21 2021-22 2022-23 2023-24
Development, publishing, sale of books
including text books, braille books and
to work as Federal Text Book Board -
NBF
Social welfare services
Social welfare council services -
NCSW
Trust for Disabled Persons
Rehabilitation for Disable Persons
Teachers Education
Science and Technical Education
service
95,919
56,153
21,493
17,455
5,676
179,420
61,692
184,723 188,972 191,807 194,68420
21
22
23
24
25
26
Total 17,123,751 17,101,296 18,156,422 23,490,000 17,643,000 17,663,063
Rs. '000
InputsActual Expenditure Budget Forecasts
Employee Related Expenses
Project Pre-Investment Analysis
Operating Expenses
Employees Retirement Benefits
Grants, Subsidies & Write off Loans
Transfers
Physical Assets
Civil Works
Repairs & Maintenance
12,603,311
6,944
2,625,661
199,723
208,227
198,863
227,444
948,515
105,064
13,644,688
16,620
2,413,870
137,067
245,351
227,510
163,101
158,101
94,988
9,919,897
13,098
4,535,096
328,791
120,583
297,616
221,617
2,476,154
243,570
10,577,077
16,682
9,583,848
202,281
193,180
275,849
304,857
2,115,483
220,743
10,500,387
8,912
3,394,971
203,300
194,650
94,300
53,180
3,022,000
171,300
10,719,007
8,913
3,395,000
203,400
194,780
94,379
53,181
2,823,063
171,340
A01
A02
A03
A04
A05
A06
A09
A12
A13
Total 17,123,751 17,101,296 18,156,422 23,490,000 17,643,000 17,663,063
2018-19 2019-20 2020-21 2021-22 2022-23 2023-24
Prepare Human Social Capital and trained Manpower for National Institutions and for Overseas Employment Opportunities. Aiming at Holistic Socio-Economic
Development and Sustainable Economic Growth in the Country.
Medium-Term Outcome(s)
Outcome 1: Improved literacy rate
Outcome 2: Equal educational syllabus all over Pakistan in collaboration with Provincial Governments
Budget by Outputs
Budget by Inputs
Federal Education and Professional Training Division
- National Book Foundation
- Social Welfare Department
- National Council of Social Welfare
(NCSW)
- National Trust for Disabled
- National Council for rehabilitation for
Disable Persons (NCRDP)
- Technical Panel on teacher education
- National Institute of Science and
Technical Education (NISTE)
Rs. '000
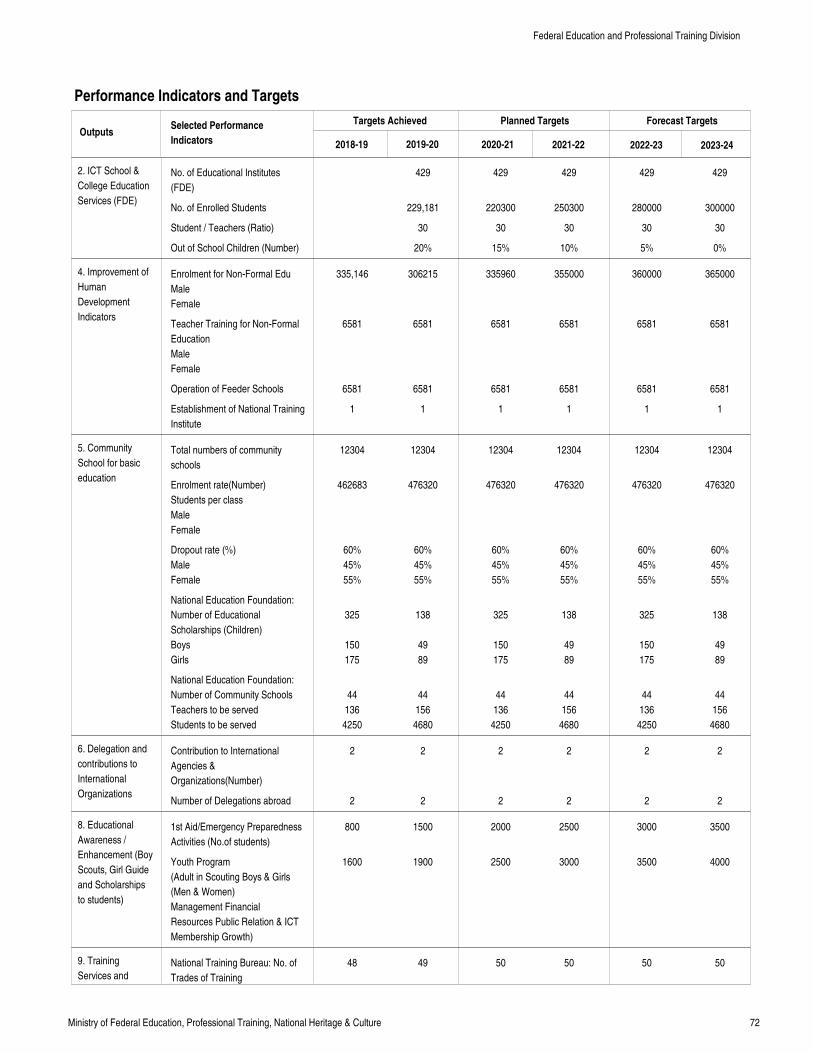
72Ministry of Federal Education, Professional Training, National Heritage & Culture
Performance Indicators and Targets
OutputsTargets Achieved Planned Targets Forecast Targets
2018-19 2019-20 2020-21 2021-22 2022-23 2023-24
Selected Performance
Indicators
2. ICT School &
College Education
Services (FDE)
4. Improvement of
Human
Development
Indicators
5. Community
School for basic
education
6. Delegation and
contributions to
International
Organizations
8. Educational
Awareness /
Enhancement (Boy
Scouts, Girl Guide
and Scholarships
to students)
9. Training
Services and
No. of Educational Institutes
(FDE)
No. of Enrolled Students
Student / Teachers (Ratio)
Out of School Children (Number)
Enrolment for Non-Formal Edu
Male
Female
Teacher Training for Non-Formal
Education
Male
Female
Operation of Feeder Schools
Establishment of National Training
Institute
Total numbers of community
schools
Enrolment rate(Number)
Students per class
Male
Female
Dropout rate (%)
Male
Female
National Education Foundation:
Number of Educational
Scholarships (Children)
Boys
Girls
National Education Foundation:
Number of Community Schools
Teachers to be served
Students to be served
Contribution to International
Agencies &
Organizations(Number)
Number of Delegations abroad
1st Aid/Emergency Preparedness
Activities (No.of students)
Youth Program
(Adult in Scouting Boys & Girls
(Men & Women)
Management Financial
Resources Public Relation & ICT
Membership Growth)
National Training Bureau: No. of
Trades of Training
335,146
6581
6581
1
12304
462683
60%
45%
55%
325
150
175
44
136
4250
2
2
800
1600
48
429
229,181
30
20%
306215
6581
6581
1
12304
476320
60%
45%
55%
138
49
89
44
156
4680
2
2
1500
1900
49
429
220300
30
15%
335960
6581
6581
1
12304
476320
60%
45%
55%
325
150
175
44
136
4250
2
2
2000
2500
50
429
250300
30
10%
355000
6581
6581
1
12304
476320
60%
45%
55%
138
49
89
44
156
4680
2
2
2500
3000
50
429
280000
30
5%
360000
6581
6581
1
12304
476320
60%
45%
55%
325
150
175
44
136
4250
2
2
3000
3500
50
429
300000
30
0%
365000
6581
6581
1
12304
476320
60%
45%
55%
138
49
89
44
156
4680
2
2
3500
4000
50
Federal Education and Professional Training Division
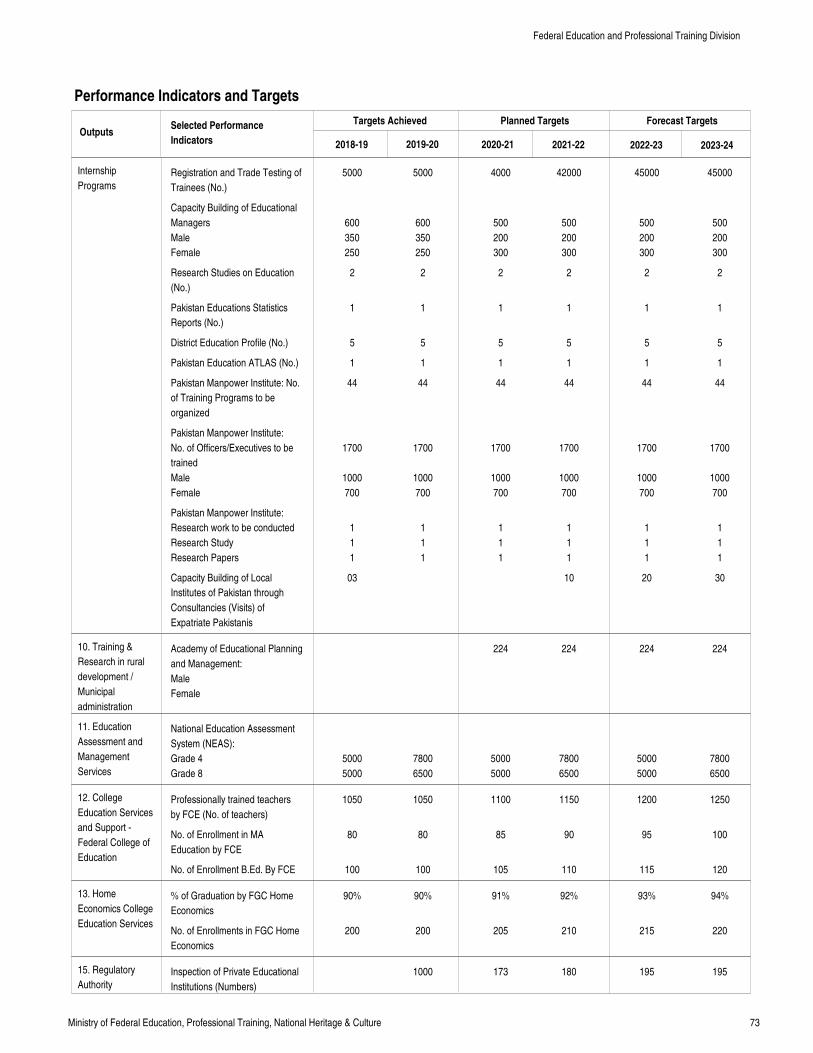
73Ministry of Federal Education, Professional Training, National Heritage & Culture
Performance Indicators and Targets
OutputsTargets Achieved Planned Targets Forecast Targets
2018-19 2019-20 2020-21 2021-22 2022-23 2023-24
Selected Performance
Indicators
Internship
Programs
10. Training &
Research in rural
development /
Municipal
administration
11. Education
Assessment and
Management
Services
12. College
Education Services
and Support -
Federal College of
Education
13. Home
Economics College
Education Services
15. Regulatory
Authority
Registration and Trade Testing of
Trainees (No.)
Capacity Building of Educational
Managers
Male
Female
Research Studies on Education
(No.)
Pakistan Educations Statistics
Reports (No.)
District Education Profile (No.)
Pakistan Education ATLAS (No.)
Pakistan Manpower Institute: No.
of Training Programs to be
organized
Pakistan Manpower Institute:
No. of Officers/Executives to be
trained
Male
Female
Pakistan Manpower Institute:
Research work to be conducted
Research Study
Research Papers
Capacity Building of Local
Institutes of Pakistan through
Consultancies (Visits) of
Expatriate Pakistanis
Academy of Educational Planning
and Management:
Male
Female
National Education Assessment
System (NEAS):
Grade 4
Grade 8
Professionally trained teachers
by FCE (No. of teachers)
No. of Enrollment in MA
Education by FCE
No. of Enrollment B.Ed. By FCE
% of Graduation by FGC Home
Economics
No. of Enrollments in FGC Home
Economics
Inspection of Private Educational
Institutions (Numbers)
5000
600
350
250
2
1
5
1
44
1700
1000
700
1
1
1
03
5000
5000
1050
80
100
90%
200
5000
600
350
250
2
1
5
1
44
1700
1000
700
1
1
1
7800
6500
1050
80
100
90%
200
1000
4000
500
200
300
2
1
5
1
44
1700
1000
700
1
1
1
224
5000
5000
1100
85
105
91%
205
173
42000
500
200
300
2
1
5
1
44
1700
1000
700
1
1
1
10
224
7800
6500
1150
90
110
92%
210
180
45000
500
200
300
2
1
5
1
44
1700
1000
700
1
1
1
20
224
5000
5000
1200
95
115
93%
215
195
45000
500
200
300
2
1
5
1
44
1700
1000
700
1
1
1
30
224
7800
6500
1250
100
120
94%
220
195
Federal Education and Professional Training Division
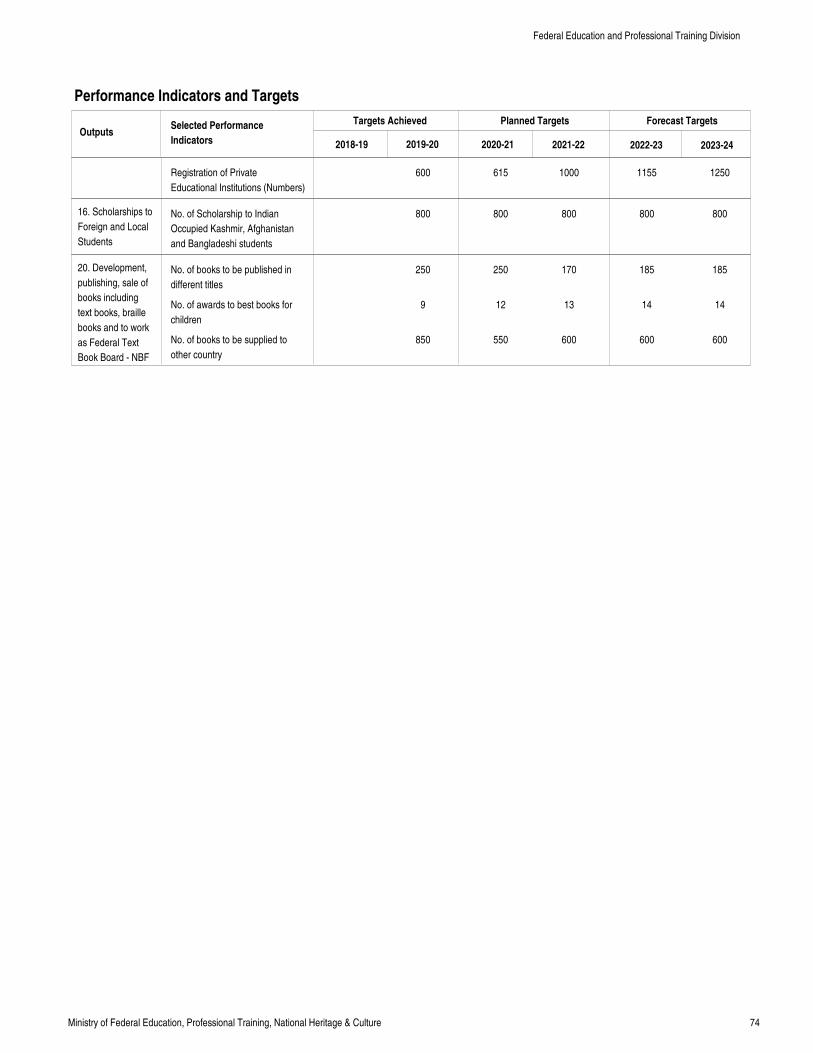
74Ministry of Federal Education, Professional Training, National Heritage & Culture
Performance Indicators and Targets
OutputsTargets Achieved Planned Targets Forecast Targets
2018-19 2019-20 2020-21 2021-22 2022-23 2023-24
Selected Performance
Indicators
16. Scholarships to
Foreign and Local
Students
20. Development,
publishing, sale of
books including
text books, braille
books and to work
as Federal Text
Book Board - NBF
Registration of Private
Educational Institutions (Numbers)
No. of Scholarship to Indian
Occupied Kashmir, Afghanistan
and Bangladeshi students
No. of books to be published in
different titles
No. of awards to best books for
children
No. of books to be supplied to
other country
600
800
250
9
850
615
800
250
12
550
1000
800
170
13
600
1155
800
185
14
600
1250
800
185
14
600
Federal Education and Professional Training Division
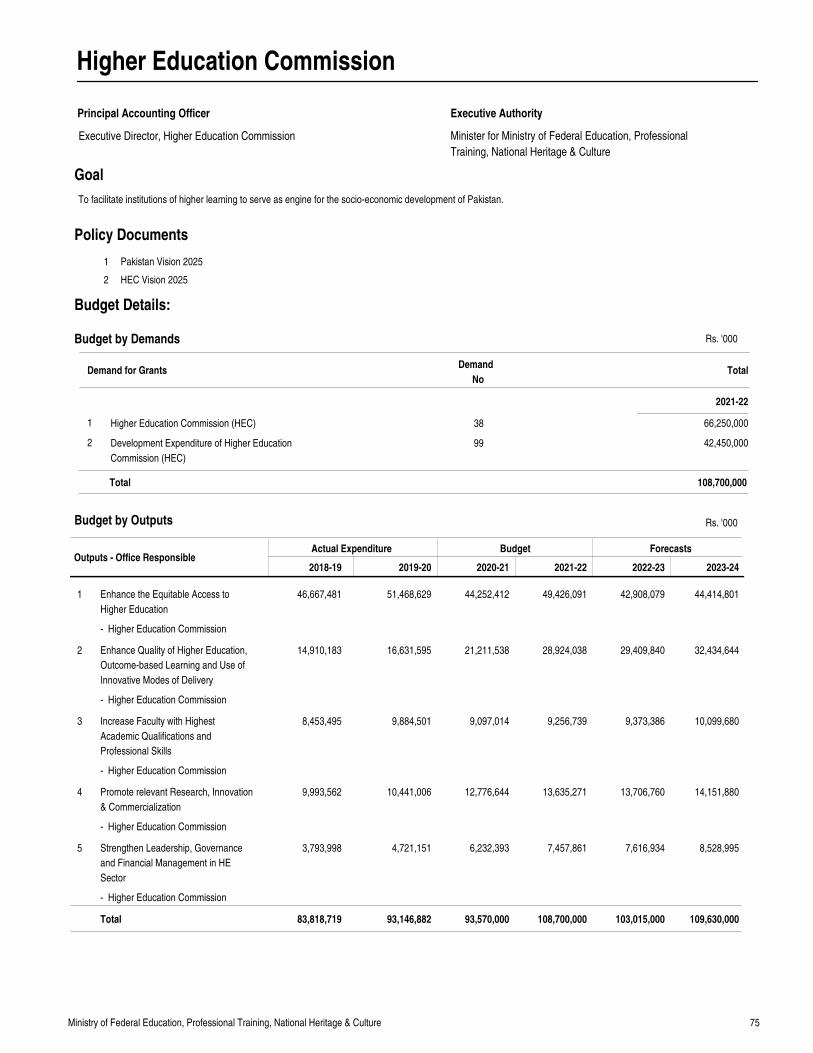
75Ministry of Federal Education, Professional Training, National Heritage & Culture
Higher Education Commission
Principal Accounting Officer
Minister for Ministry of Federal Education, Professional
Training, National Heritage & Culture
Executive Authority
Goal
Outputs - Office ResponsibleActual Expenditure Budget Forecasts
2018-19 2019-20 2020-21 2021-22 2022-23 2023-24
Enhance the Equitable Access to
Higher Education
Enhance Quality of Higher Education,
Outcome-based Learning and Use of
Innovative Modes of Delivery
Increase Faculty with Highest
Academic Qualifications and
Professional Skills
Promote relevant Research, Innovation
& Commercialization
Strengthen Leadership, Governance
and Financial Management in HE
Sector
46,667,481
14,910,183
8,453,495
9,993,562
3,793,998
51,468,629
16,631,595
9,884,501
10,441,006
4,721,151
44,252,412
21,211,538
9,097,014
12,776,644
6,232,393
49,426,091
28,924,038
9,256,739
13,635,271
7,457,861
42,908,079
29,409,840
9,373,386
13,706,760
7,616,934
44,414,801
32,434,644
10,099,680
14,151,880
8,528,995
1
2
3
4
5
Total 83,818,719 93,146,882 93,570,000 108,700,000 103,015,000 109,630,000
Rs. '000
1
2
Pakistan Vision 2025
HEC Vision 2025
Policy Documents
Budget by Outputs
To facilitate institutions of higher learning to serve as engine for the socio-economic development of Pakistan.
Demand for GrantsDemand
NoTotal
2021-22
Budget by Demands
Higher Education Commission (HEC)
Development Expenditure of Higher Education
Commission (HEC)
1
2
38
99
66,250,000
42,450,000
108,700,000Total
Executive Director, Higher Education Commission
Budget Details:
- Higher Education Commission
- Higher Education Commission
- Higher Education Commission
- Higher Education Commission
- Higher Education Commission
Rs. '000
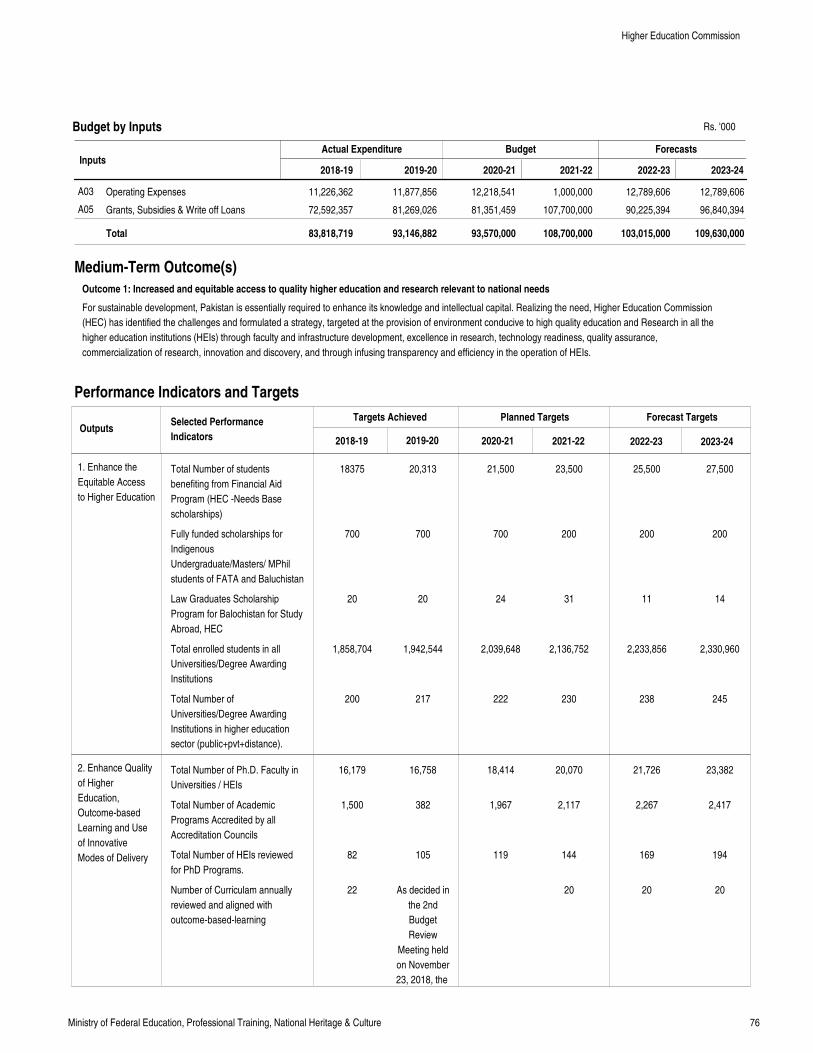
76Ministry of Federal Education, Professional Training, National Heritage & Culture
InputsActual Expenditure Budget Forecasts
Operating Expenses
Grants, Subsidies & Write off Loans
11,226,362
72,592,357
11,877,856
81,269,026
12,218,541
81,351,459
1,000,000
107,700,000
12,789,606
90,225,394
12,789,606
96,840,394
A03
A05
Total 83,818,719 93,146,882 93,570,000 108,700,000 103,015,000 109,630,000
2018-19 2019-20 2020-21 2021-22 2022-23 2023-24
For sustainable development, Pakistan is essentially required to enhance its knowledge and intellectual capital. Realizing the need, Higher Education Commission
(HEC) has identified the challenges and formulated a strategy, targeted at the provision of environment conducive to high quality education and Research in all the
higher education institutions (HEIs) through faculty and infrastructure development, excellence in research, technology readiness, quality assurance,
commercialization of research, innovation and discovery, and through infusing transparency and efficiency in the operation of HEIs.
Medium-Term Outcome(s)
Outcome 1: Increased and equitable access to quality higher education and research relevant to national needs
Performance Indicators and Targets
OutputsTargets Achieved Planned Targets Forecast Targets
2018-19 2019-20 2020-21 2021-22 2022-23 2023-24
Selected Performance
Indicators
1. Enhance the
Equitable Access
to Higher Education
2. Enhance Quality
of Higher
Education,
Outcome-based
Learning and Use
of Innovative
Modes of Delivery
Budget by Inputs
Total Number of students
benefiting from Financial Aid
Program (HEC -Needs Base
scholarships)
Fully funded scholarships for
Indigenous
Undergraduate/Masters/ MPhil
students of FATA and Baluchistan
Law Graduates Scholarship
Program for Balochistan for Study
Abroad, HEC
Total enrolled students in all
Universities/Degree Awarding
Institutions
Total Number of
Universities/Degree Awarding
Institutions in higher education
sector (public+pvt+distance).
Total Number of Ph.D. Faculty in
Universities / HEIs
Total Number of Academic
Programs Accredited by all
Accreditation Councils
Total Number of HEIs reviewed
for PhD Programs.
Number of Curriculam annually
reviewed and aligned with
outcome-based-learning
18375
700
20
1,858,704
200
16,179
1,500
82
22
20,313
700
20
1,942,544
217
16,758
382
105
As decided in
the 2nd
Budget
Review
Meeting held
on November
23, 2018, the
21,500
700
24
2,039,648
222
18,414
1,967
119
23,500
200
31
2,136,752
230
20,070
2,117
144
20
25,500
200
11
2,233,856
238
21,726
2,267
169
20
27,500
200
14
2,330,960
245
23,382
2,417
194
20
Higher Education Commission
Rs. '000
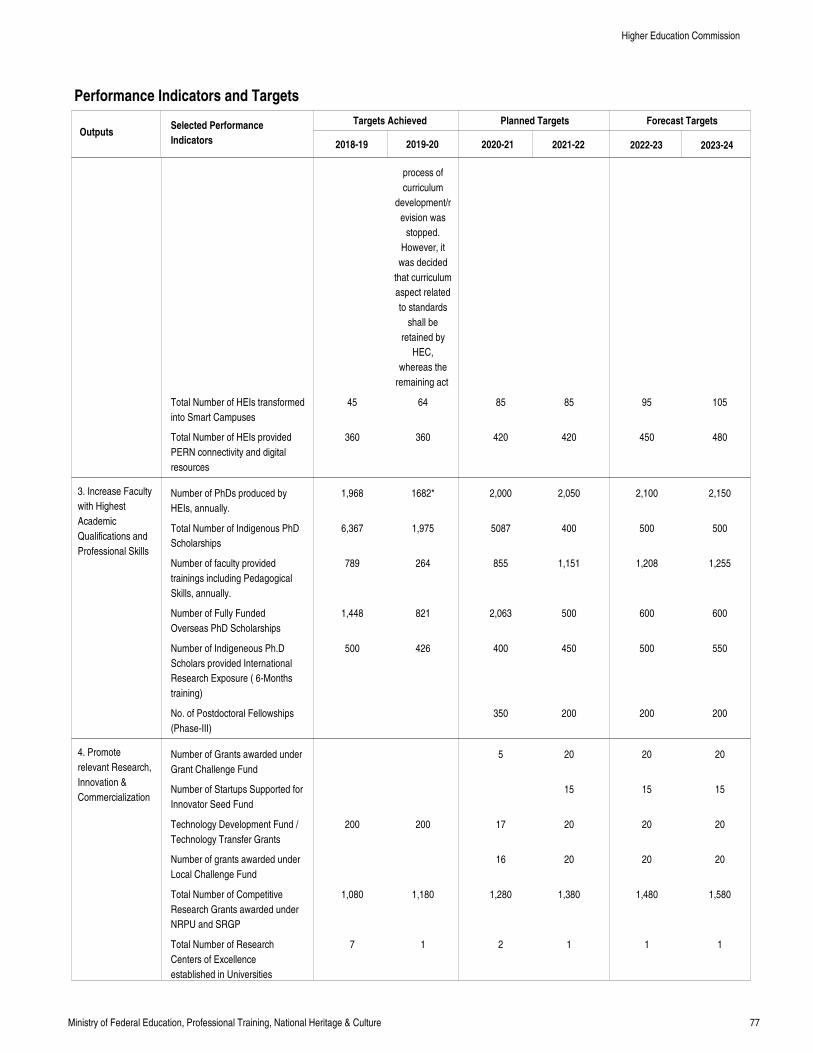
77Ministry of Federal Education, Professional Training, National Heritage & Culture
Performance Indicators and Targets
OutputsTargets Achieved Planned Targets Forecast Targets
2018-19 2019-20 2020-21 2021-22 2022-23 2023-24
Selected Performance
Indicators
3. Increase Faculty
with Highest
Academic
Qualifications and
Professional Skills
4. Promote
relevant Research,
Innovation &
Commercialization
Total Number of HEIs transformed
into Smart Campuses
Total Number of HEIs provided
PERN connectivity and digital
resources
Number of PhDs produced by
HEIs, annually.
Total Number of Indigenous PhD
Scholarships
Number of faculty provided
trainings including Pedagogical
Skills, annually.
Number of Fully Funded
Overseas PhD Scholarships
Number of Indigeneous Ph.D
Scholars provided International
Research Exposure ( 6-Months
training)
No. of Postdoctoral Fellowships
(Phase-III)
Number of Grants awarded under
Grant Challenge Fund
Number of Startups Supported for
Innovator Seed Fund
Technology Development Fund /
Technology Transfer Grants
Number of grants awarded under
Local Challenge Fund
Total Number of Competitive
Research Grants awarded under
NRPU and SRGP
Total Number of Research
Centers of Excellence
established in Universities
45
360
1,968
6,367
789
1,448
500
200
1,080
7
process of
curriculum
development/r
evision was
stopped.
However, it
was decided
that curriculum
aspect related
to standards
shall be
retained by
HEC,
whereas the
remaining act
64
360
1682*
1,975
264
821
426
200
1,180
1
85
420
2,000
5087
855
2,063
400
350
5
17
16
1,280
2
85
420
2,050
400
1,151
500
450
200
20
15
20
20
1,380
1
95
450
2,100
500
1,208
600
500
200
20
15
20
20
1,480
1
105
480
2,150
500
1,255
600
550
200
20
15
20
20
1,580
1
Higher Education Commission
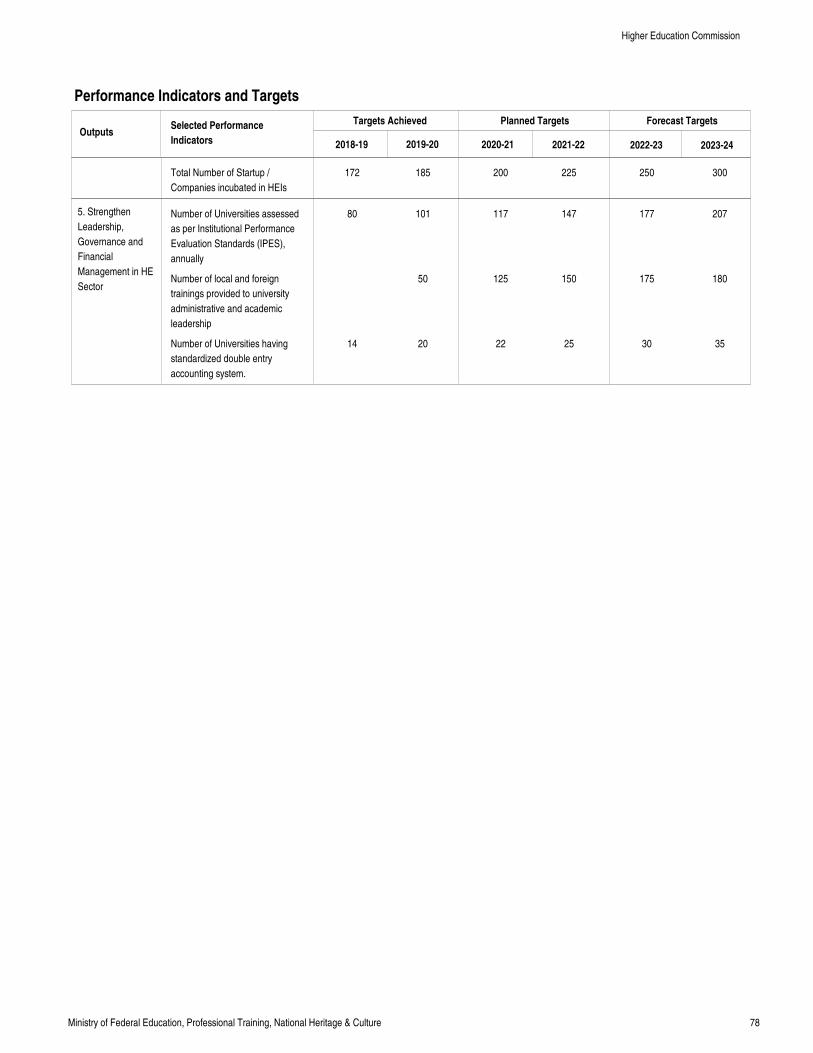
78Ministry of Federal Education, Professional Training, National Heritage & Culture
Performance Indicators and Targets
OutputsTargets Achieved Planned Targets Forecast Targets
2018-19 2019-20 2020-21 2021-22 2022-23 2023-24
Selected Performance
Indicators
5. Strengthen
Leadership,
Governance and
Financial
Management in HE
Sector
Total Number of Startup /
Companies incubated in HEIs
Number of Universities assessed
as per Institutional Performance
Evaluation Standards (IPES),
annually
Number of local and foreign
trainings provided to university
administrative and academic
leadership
Number of Universities having
standardized double entry
accounting system.
172
80
14
185
101
50
20
200
117
125
22
225
147
150
25
250
177
175
30
300
207
180
35
Higher Education Commission
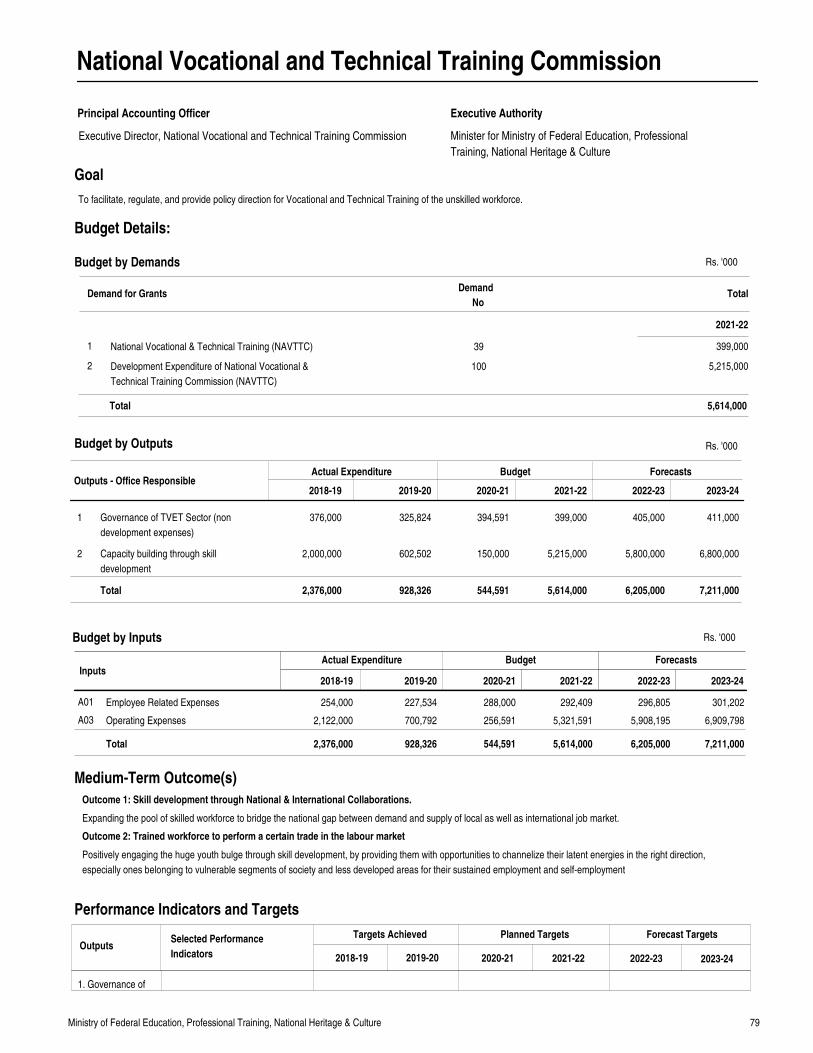
79Ministry of Federal Education, Professional Training, National Heritage & Culture
National Vocational and Technical Training Commission
Principal Accounting Officer
Minister for Ministry of Federal Education, Professional
Training, National Heritage & Culture
Executive Authority
Goal
Outputs - Office ResponsibleActual Expenditure Budget Forecasts
2018-19 2019-20 2020-21 2021-22 2022-23 2023-24
Governance of TVET Sector (non
development expenses)
Capacity building through skill
development
376,000
2,000,000
325,824
602,502
394,591
150,000
399,000
5,215,000
405,000
5,800,000
411,000
6,800,000
1
2
Total 2,376,000 928,326 544,591 5,614,000 6,205,000 7,211,000
Rs. '000
InputsActual Expenditure Budget Forecasts
Employee Related Expenses
Operating Expenses
254,000
2,122,000
227,534
700,792
288,000
256,591
292,409
5,321,591
296,805
5,908,195
301,202
6,909,798
A01
A03
Total 2,376,000 928,326 544,591 5,614,000 6,205,000 7,211,000
2018-19 2019-20 2020-21 2021-22 2022-23 2023-24
Expanding the pool of skilled workforce to bridge the national gap between demand and supply of local as well as international job market.
Positively engaging the huge youth bulge through skill development, by providing them with opportunities to channelize their latent energies in the right direction,
especially ones belonging to vulnerable segments of society and less developed areas for their sustained employment and self-employment
Medium-Term Outcome(s)
Outcome 1: Skill development through National & International Collaborations.
Outcome 2: Trained workforce to perform a certain trade in the labour market
Performance Indicators and Targets
OutputsTargets Achieved Planned Targets Forecast Targets
2018-19 2019-20 2020-21 2021-22 2022-23 2023-24
Selected Performance
Indicators
1. Governance of
Budget by Outputs
Budget by Inputs
To facilitate, regulate, and provide policy direction for Vocational and Technical Training of the unskilled workforce.
Demand for GrantsDemand
NoTotal
2021-22
Budget by Demands
National Vocational & Technical Training (NAVTTC)
Development Expenditure of National Vocational &
Technical Training Commission (NAVTTC)
1
2
39
100
399,000
5,215,000
5,614,000Total
Executive Director, National Vocational and Technical Training Commission
Budget Details:
Rs. '000
Rs. '000
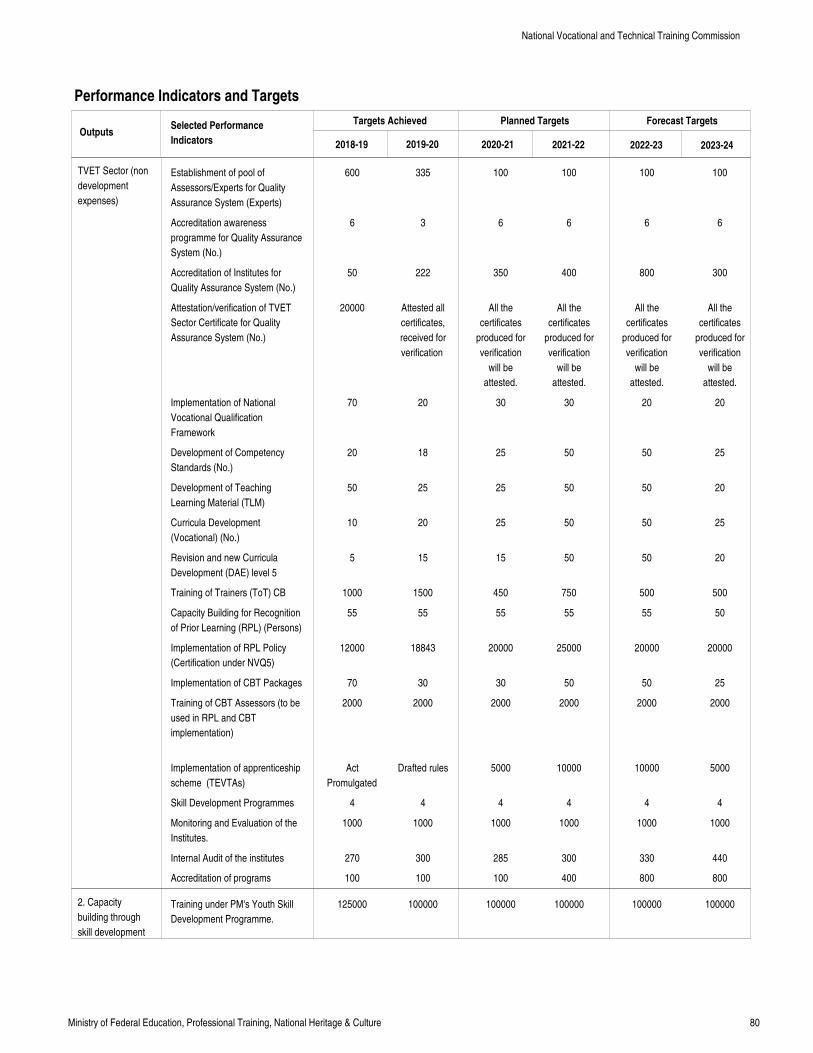
80Ministry of Federal Education, Professional Training, National Heritage & Culture
Performance Indicators and Targets
OutputsTargets Achieved Planned Targets Forecast Targets
2018-19 2019-20 2020-21 2021-22 2022-23 2023-24
Selected Performance
Indicators
TVET Sector (non
development
expenses)
2. Capacity
building through
skill development
Establishment of pool of
Assessors/Experts for Quality
Assurance System (Experts)
Accreditation awareness
programme for Quality Assurance
System (No.)
Accreditation of Institutes for
Quality Assurance System (No.)
Attestation/verification of TVET
Sector Certificate for Quality
Assurance System (No.)
Implementation of National
Vocational Qualification
Framework
Development of Competency
Standards (No.)
Development of Teaching
Learning Material (TLM)
Curricula Development
(Vocational) (No.)
Revision and new Curricula
Development (DAE) level 5
Training of Trainers (ToT) CB
Capacity Building for Recognition
of Prior Learning (RPL) (Persons)
Implementation of RPL Policy
(Certification under NVQ5)
Implementation of CBT Packages
Training of CBT Assessors (to be
used in RPL and CBT
implementation)
Implementation of apprenticeship
scheme (TEVTAs)
Skill Development Programmes
Monitoring and Evaluation of the
Institutes.
Internal Audit of the institutes
Accreditation of programs
Training under PM's Youth Skill
Development Programme.
600
6
50
20000
70
20
50
10
5
1000
55
12000
70
2000
Act
Promulgated
4
1000
270
100
125000
335
3
222
Attested all
certificates,
received for
verification
20
18
25
20
15
1500
55
18843
30
2000
Drafted rules
4
1000
300
100
100000
100
6
350
All the
certificates
produced for
verification
will be
attested.
30
25
25
25
15
450
55
20000
30
2000
5000
4
1000
285
100
100000
100
6
400
All the
certificates
produced for
verification
will be
attested.
30
50
50
50
50
750
55
25000
50
2000
10000
4
1000
300
400
100000
100
6
800
All the
certificates
produced for
verification
will be
attested.
20
50
50
50
50
500
55
20000
50
2000
10000
4
1000
330
800
100000
100
6
300
All the
certificates
produced for
verification
will be
attested.
20
25
20
25
20
500
50
20000
25
2000
5000
4
1000
440
800
100000
National Vocational and Technical Training Commission
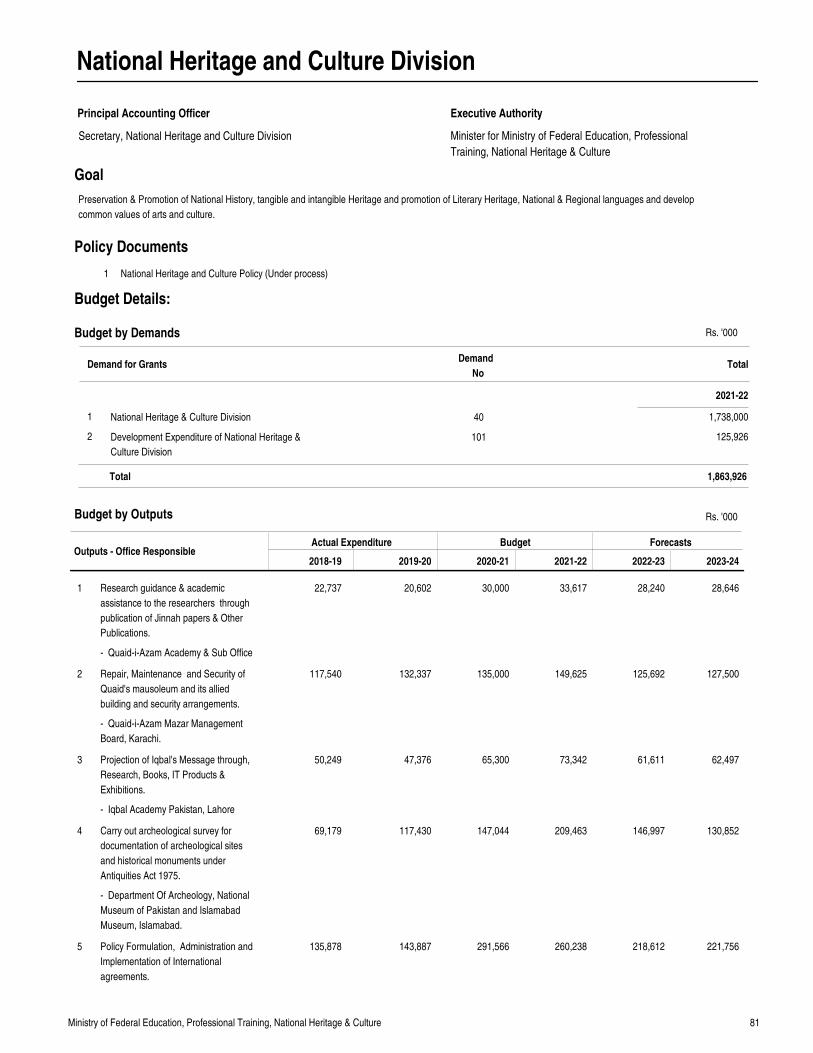
81Ministry of Federal Education, Professional Training, National Heritage & Culture
National Heritage and Culture Division
Principal Accounting Officer
Minister for Ministry of Federal Education, Professional
Training, National Heritage & Culture
Executive Authority
Goal
Outputs - Office ResponsibleActual Expenditure Budget Forecasts
2018-19 2019-20 2020-21 2021-22 2022-23 2023-24
Research guidance & academic
assistance to the researchers through
publication of Jinnah papers & Other
Publications.
Repair, Maintenance and Security of
Quaid's mausoleum and its allied
building and security arrangements.
Projection of Iqbal's Message through,
Research, Books, IT Products &
Exhibitions.
Carry out archeological survey for
documentation of archeological sites
and historical monuments under
Antiquities Act 1975.
Policy Formulation, Administration and
Implementation of International
agreements.
22,737
117,540
50,249
69,179
135,878
20,602
132,337
47,376
117,430
143,887
30,000
135,000
65,300
147,044
291,566
33,617
149,625
73,342
209,463
260,238
28,240
125,692
61,611
146,997
218,612
28,646
127,500
62,497
130,852
221,756
1
2
3
4
5
Rs. '000
1 National Heritage and Culture Policy (Under process)
Policy Documents
Budget by Outputs
Preservation & Promotion of National History, tangible and intangible Heritage and promotion of Literary Heritage, National & Regional languages and develop
common values of arts and culture.
Demand for GrantsDemand
NoTotal
2021-22
Budget by Demands
National Heritage & Culture Division
Development Expenditure of National Heritage &
Culture Division
1
2
40
101
1,738,000
125,926
1,863,926Total
Secretary, National Heritage and Culture Division
Budget Details:
- Quaid-i-Azam Academy & Sub Office
- Quaid-i-Azam Mazar Management
Board, Karachi.
- Iqbal Academy Pakistan, Lahore
- Department Of Archeology, National
Museum of Pakistan and Islamabad
Museum, Islamabad.
Rs. '000
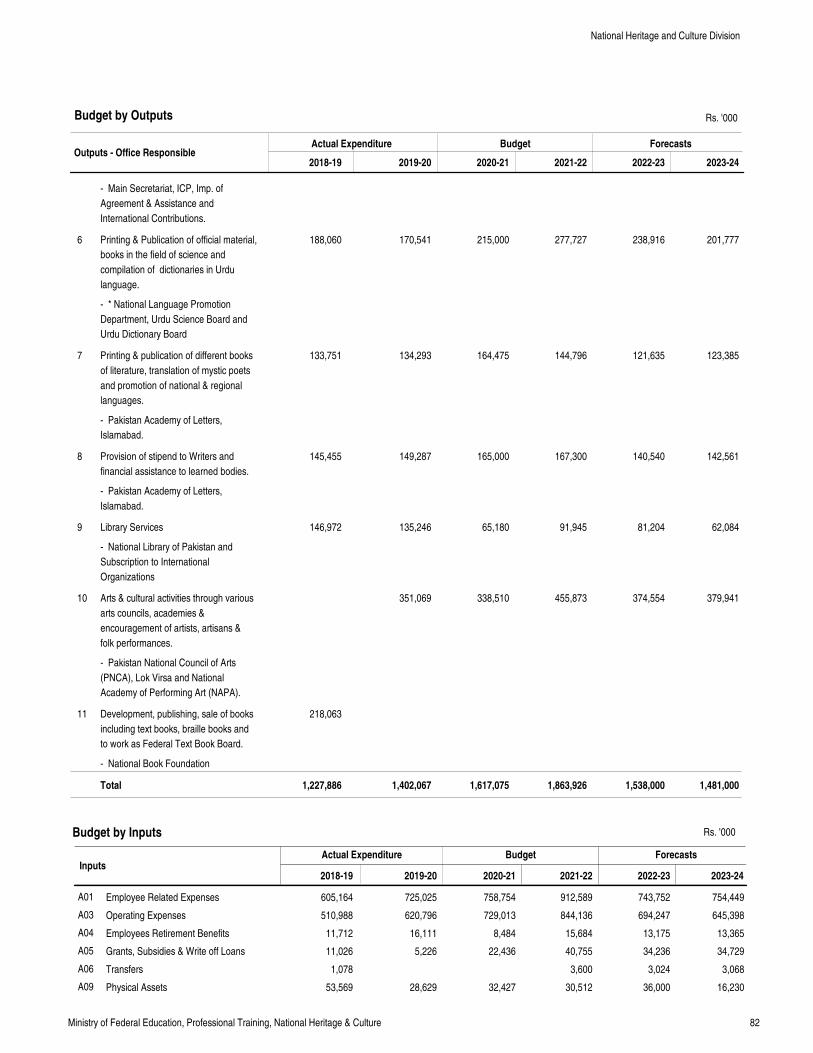
82Ministry of Federal Education, Professional Training, National Heritage & Culture
Outputs - Office ResponsibleActual Expenditure Budget Forecasts
2018-19 2019-20 2020-21 2021-22 2022-23 2023-24
Printing & Publication of official material,
books in the field of science and
compilation of dictionaries in Urdu
language.
Printing & publication of different books
of literature, translation of mystic poets
and promotion of national & regional
languages.
Provision of stipend to Writers and
financial assistance to learned bodies.
Library Services
Arts & cultural activities through various
arts councils, academies &
encouragement of artists, artisans &
folk performances.
Development, publishing, sale of books
including text books, braille books and
to work as Federal Text Book Board.
188,060
133,751
145,455
146,972
218,063
170,541
134,293
149,287
135,246
351,069
215,000
164,475
165,000
65,180
338,510
277,727
144,796
167,300
91,945
455,873
238,916
121,635
140,540
81,204
374,554
201,777
123,385
142,561
62,084
379,941
6
7
8
9
10
11
Total 1,227,886 1,402,067 1,617,075 1,863,926 1,538,000 1,481,000
Rs. '000
InputsActual Expenditure Budget Forecasts
Employee Related Expenses
Operating Expenses
Employees Retirement Benefits
Grants, Subsidies & Write off Loans
Transfers
Physical Assets
605,164
510,988
11,712
11,026
1,078
53,569
725,025
620,796
16,111
5,226
28,629
758,754
729,013
8,484
22,436
32,427
912,589
844,136
15,684
40,755
3,600
30,512
743,752
694,247
13,175
34,236
3,024
36,000
754,449
645,398
13,365
34,729
3,068
16,230
A01
A03
A04
A05
A06
A09
2018-19 2019-20 2020-21 2021-22 2022-23 2023-24
Budget by Outputs
Budget by Inputs
National Heritage and Culture Division
- Main Secretariat, ICP, Imp. of
Agreement & Assistance and
International Contributions.
- * National Language Promotion
Department, Urdu Science Board and
Urdu Dictionary Board
- Pakistan Academy of Letters,
Islamabad.
- Pakistan Academy of Letters,
Islamabad.
- National Library of Pakistan and
Subscription to International
Organizations
- Pakistan National Council of Arts
(PNCA), Lok Virsa and National
Academy of Performing Art (NAPA).
- National Book Foundation
Rs. '000
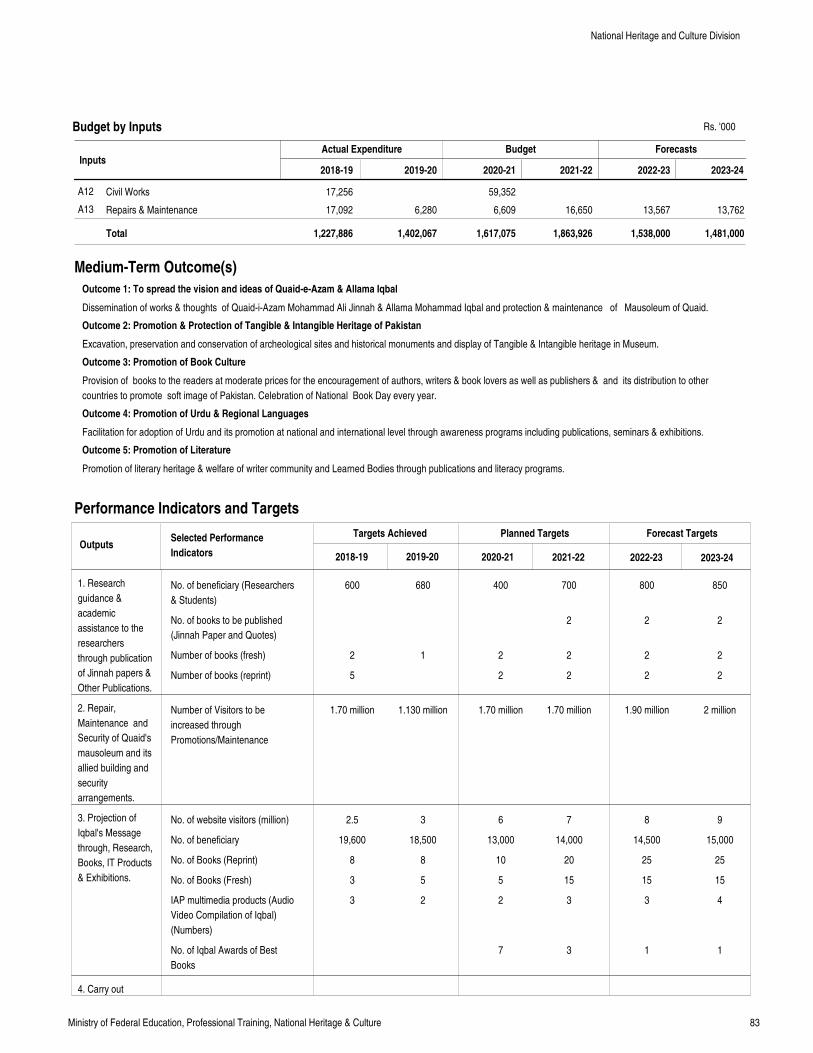
83Ministry of Federal Education, Professional Training, National Heritage & Culture
InputsActual Expenditure Budget Forecasts
Civil Works
Repairs & Maintenance
17,256
17,092 6,280
59,352
6,609 16,650 13,567 13,762
A12
A13
Total 1,227,886 1,402,067 1,617,075 1,863,926 1,538,000 1,481,000
2018-19 2019-20 2020-21 2021-22 2022-23 2023-24
Dissemination of works & thoughts of Quaid-i-Azam Mohammad Ali Jinnah & Allama Mohammad Iqbal and protection & maintenance of Mausoleum of Quaid.
Excavation, preservation and conservation of archeological sites and historical monuments and display of Tangible & Intangible heritage in Museum.
Provision of books to the readers at moderate prices for the encouragement of authors, writers & book lovers as well as publishers & and its distribution to other
countries to promote soft image of Pakistan. Celebration of National Book Day every year.
Facilitation for adoption of Urdu and its promotion at national and international level through awareness programs including publications, seminars & exhibitions.
Promotion of literary heritage & welfare of writer community and Learned Bodies through publications and literacy programs.
Medium-Term Outcome(s)
Outcome 1: To spread the vision and ideas of Quaid-e-Azam & Allama Iqbal
Outcome 2: Promotion & Protection of Tangible & Intangible Heritage of Pakistan
Outcome 3: Promotion of Book Culture
Outcome 4: Promotion of Urdu & Regional Languages
Outcome 5: Promotion of Literature
Performance Indicators and Targets
OutputsTargets Achieved Planned Targets Forecast Targets
2018-19 2019-20 2020-21 2021-22 2022-23 2023-24
Selected Performance
Indicators
1. Research
guidance &
academic
assistance to the
researchers
through publication
of Jinnah papers &
Other Publications.
2. Repair,
Maintenance and
Security of Quaid's
mausoleum and its
allied building and
security
arrangements.
3. Projection of
Iqbal's Message
through, Research,
Books, IT Products
& Exhibitions.
4. Carry out
Budget by Inputs
No. of beneficiary (Researchers
& Students)
No. of books to be published
(Jinnah Paper and Quotes)
Number of books (fresh)
Number of books (reprint)
Number of Visitors to be
increased through
Promotions/Maintenance
No. of website visitors (million)
No. of beneficiary
No. of Books (Reprint)
No. of Books (Fresh)
IAP multimedia products (Audio
Video Compilation of Iqbal)
(Numbers)
No. of Iqbal Awards of Best
Books
600
2
5
1.70 million
2.5
19,600
8
3
3
680
1
1.130 million
3
18,500
8
5
2
400
2
2
1.70 million
6
13,000
10
5
2
7
700
2
2
2
1.70 million
7
14,000
20
15
3
3
800
2
2
2
1.90 million
8
14,500
25
15
3
1
850
2
2
2
2 million
9
15,000
25
15
4
1
National Heritage and Culture Division
Rs. '000
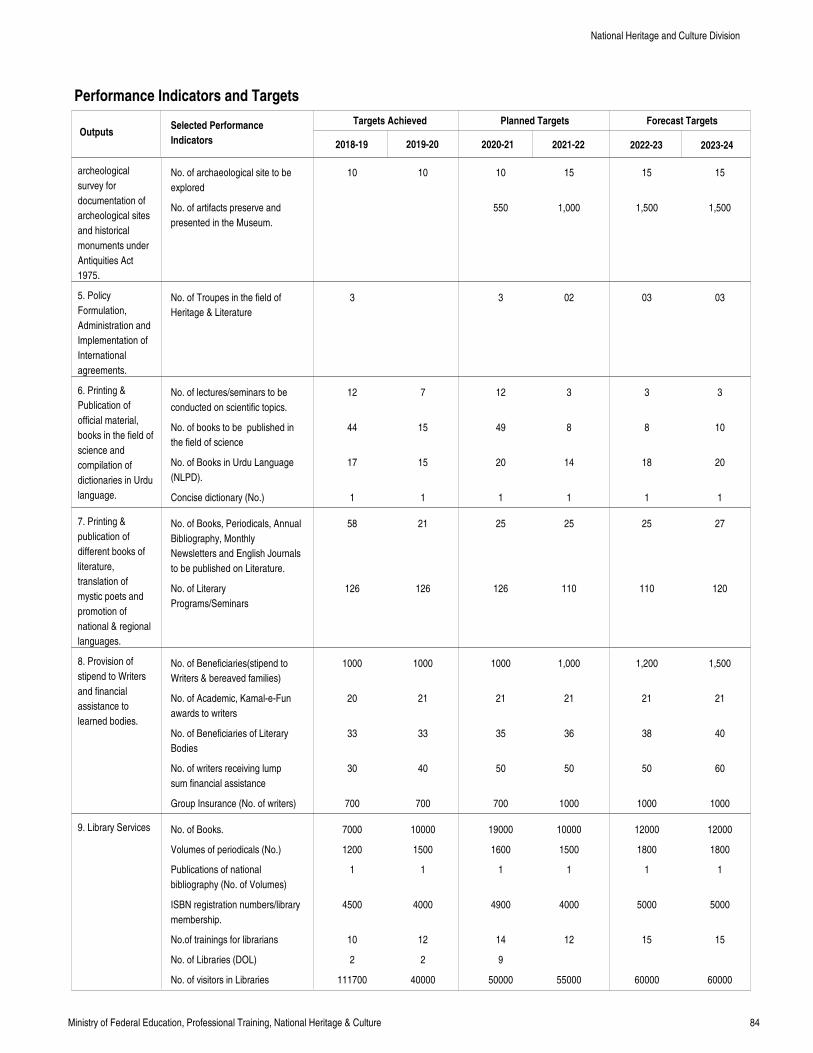
84Ministry of Federal Education, Professional Training, National Heritage & Culture
Performance Indicators and Targets
OutputsTargets Achieved Planned Targets Forecast Targets
2018-19 2019-20 2020-21 2021-22 2022-23 2023-24
Selected Performance
Indicators
archeological
survey for
documentation of
archeological sites
and historical
monuments under
Antiquities Act
1975.
5. Policy
Formulation,
Administration and
Implementation of
International
agreements.
6. Printing &
Publication of
official material,
books in the field of
science and
compilation of
dictionaries in Urdu
language.
7. Printing &
publication of
different books of
literature,
translation of
mystic poets and
promotion of
national & regional
languages.
8. Provision of
stipend to Writers
and financial
assistance to
learned bodies.
9. Library Services
No. of archaeological site to be
explored
No. of artifacts preserve and
presented in the Museum.
No. of Troupes in the field of
Heritage & Literature
No. of lectures/seminars to be
conducted on scientific topics.
No. of books to be published in
the field of science
No. of Books in Urdu Language
(NLPD).
Concise dictionary (No.)
No. of Books, Periodicals, Annual
Bibliography, Monthly
Newsletters and English Journals
to be published on Literature.
No. of Literary
Programs/Seminars
No. of Beneficiaries(stipend to
Writers & bereaved families)
No. of Academic, Kamal-e-Fun
awards to writers
No. of Beneficiaries of Literary
Bodies
No. of writers receiving lump
sum financial assistance
Group Insurance (No. of writers)
No. of Books.
Volumes of periodicals (No.)
Publications of national
bibliography (No. of Volumes)
ISBN registration numbers/library
membership.
No.of trainings for librarians
No. of Libraries (DOL)
No. of visitors in Libraries
10
3
12
44
17
1
58
126
1000
20
33
30
700
7000
1200
1
4500
10
2
111700
10
7
15
15
1
21
126
1000
21
33
40
700
10000
1500
1
4000
12
2
40000
10
550
3
12
49
20
1
25
126
1000
21
35
50
700
19000
1600
1
4900
14
9
50000
15
1,000
02
3
8
14
1
25
110
1,000
21
36
50
1000
10000
1500
1
4000
12
55000
15
1,500
03
3
8
18
1
25
110
1,200
21
38
50
1000
12000
1800
1
5000
15
60000
15
1,500
03
3
10
20
1
27
120
1,500
21
40
60
1000
12000
1800
1
5000
15
60000
National Heritage and Culture Division
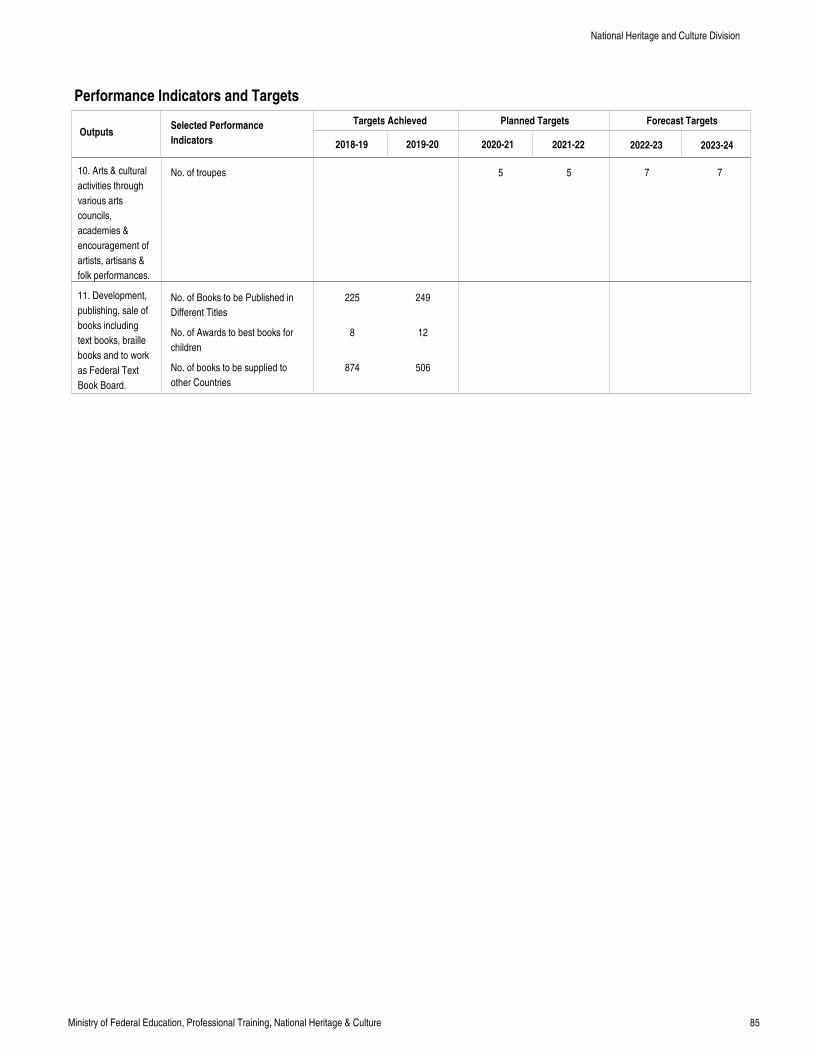
85Ministry of Federal Education, Professional Training, National Heritage & Culture
Performance Indicators and Targets
OutputsTargets Achieved Planned Targets Forecast Targets
2018-19 2019-20 2020-21 2021-22 2022-23 2023-24
Selected Performance
Indicators
10. Arts & cultural
activities through
various arts
councils,
academies &
encouragement of
artists, artisans &
folk performances.
11. Development,
publishing, sale of
books including
text books, braille
books and to work
as Federal Text
Book Board.
No. of troupes
No. of Books to be Published in
Different Titles
No. of Awards to best books for
children
No. of books to be supplied to
other Countries
225
8
874
249
12
506
5 5 7 7
National Heritage and Culture Division
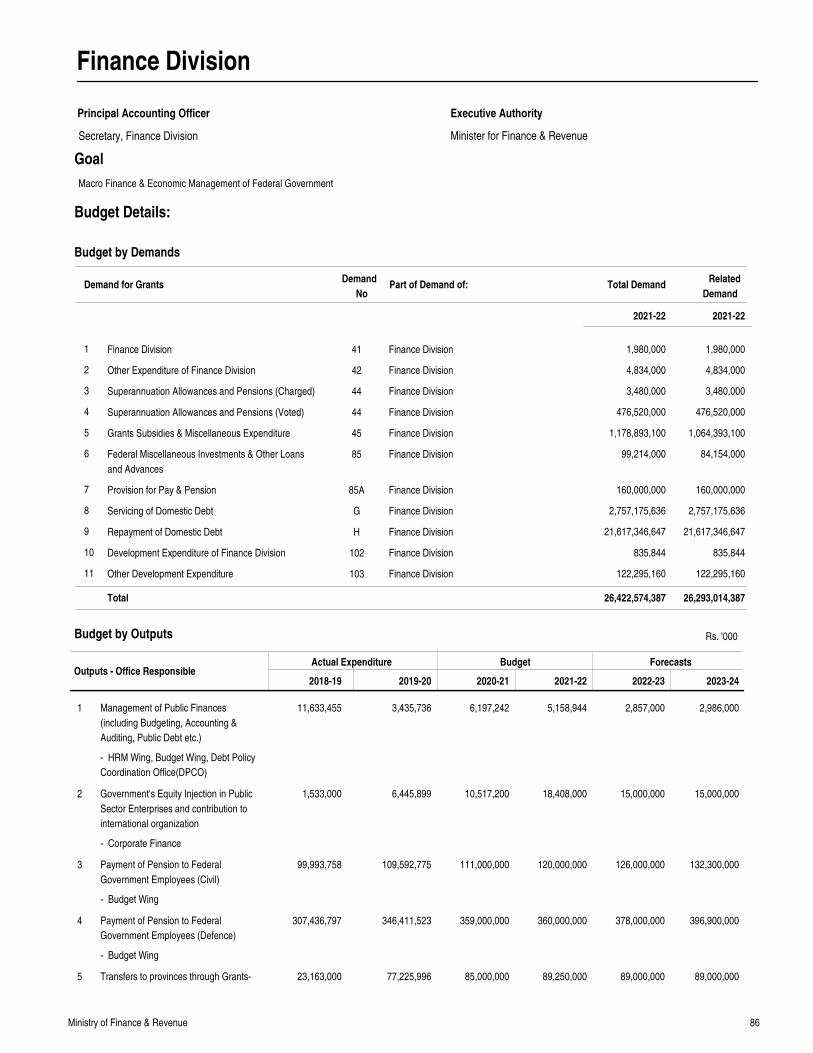
86Ministry of Finance & Revenue
Finance Division
Principal Accounting Officer
Minister for Finance & Revenue
Executive Authority
Goal
Outputs - Office ResponsibleActual Expenditure Budget Forecasts
2018-19 2019-20 2020-21 2021-22 2022-23 2023-24
Management of Public Finances
(including Budgeting, Accounting &
Auditing, Public Debt etc.)
Government's Equity Injection in Public
Sector Enterprises and contribution to
international organization
Payment of Pension to Federal
Government Employees (Civil)
Payment of Pension to Federal
Government Employees (Defence)
Transfers to provinces through Grants-
11,633,455
1,533,000
99,993,758
307,436,797
23,163,000
3,435,736
6,445,899
109,592,775
346,411,523
77,225,996
6,197,242
10,517,200
111,000,000
359,000,000
85,000,000
5,158,944
18,408,000
120,000,000
360,000,000
89,250,000
2,857,000
15,000,000
126,000,000
378,000,000
89,000,000
2,986,000
15,000,000
132,300,000
396,900,000
89,000,000
1
2
3
4
5
Rs. '000
Finance Division
Other Expenditure of Finance Division
Superannuation Allowances and Pensions (Charged)
Superannuation Allowances and Pensions (Voted)
Grants Subsidies & Miscellaneous Expenditure
Federal Miscellaneous Investments & Other Loans
and Advances
Provision for Pay & Pension
Servicing of Domestic Debt
Repayment of Domestic Debt
Development Expenditure of Finance Division
Other Development Expenditure
1
2
3
4
5
6
7
8
9
10
11
41
42
44
44
45
85
85A
G
H
102
103
Finance Division
Finance Division
Finance Division
Finance Division
Finance Division
Finance Division
Finance Division
Finance Division
Finance Division
Finance Division
Finance Division
1,980,000
4,834,000
3,480,000
476,520,000
1,178,893,100
99,214,000
160,000,000
2,757,175,636
21,617,346,647
835,844
122,295,160
1,980,000
4,834,000
3,480,000
476,520,000
1,064,393,100
84,154,000
160,000,000
2,757,175,636
21,617,346,647
835,844
122,295,160
Demand for GrantsDemand
NoPart of Demand of: Total Demand
2021-22
26,422,574,387 26,293,014,387Total
Budget by Outputs
Budget by Demands
Macro Finance & Economic Management of Federal Government
Secretary, Finance Division
Budget Details:
- HRM Wing, Budget Wing, Debt Policy
Coordination Office(DPCO)
- Corporate Finance
- Budget Wing
- Budget Wing
2021-22
Related
Demand
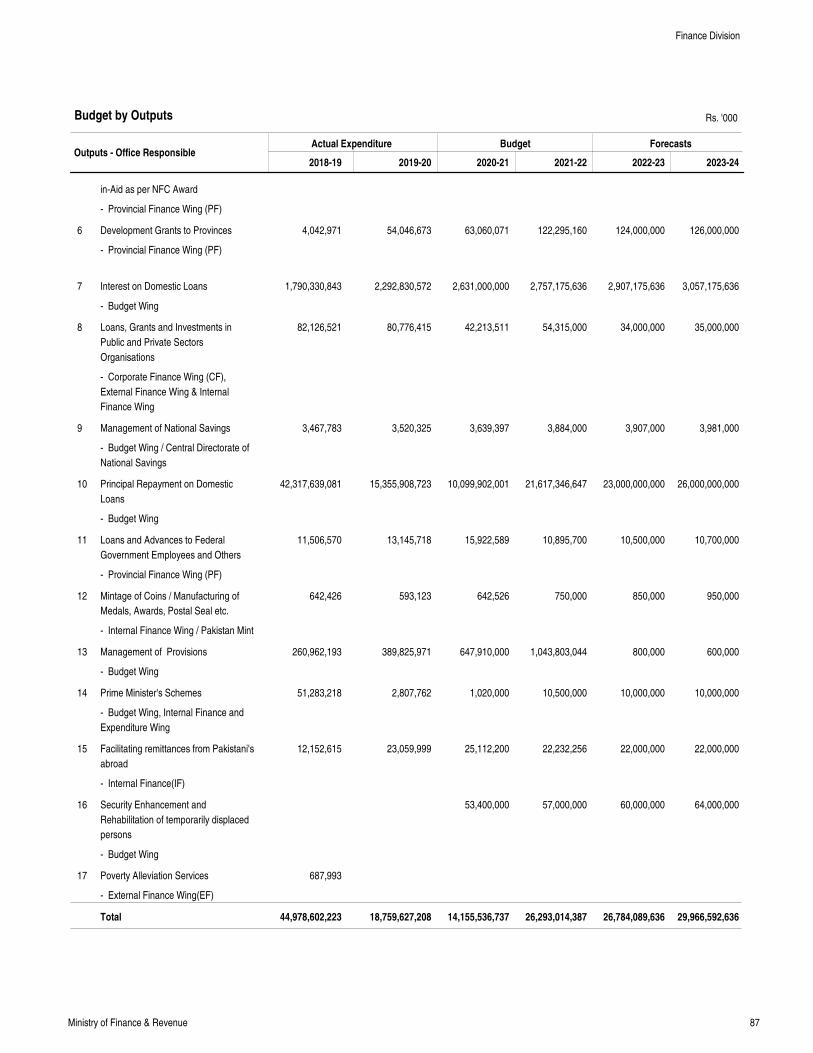
87Ministry of Finance & Revenue
Outputs - Office ResponsibleActual Expenditure Budget Forecasts
2018-19 2019-20 2020-21 2021-22 2022-23 2023-24
in-Aid as per NFC Award
Development Grants to Provinces
Interest on Domestic Loans
Loans, Grants and Investments in
Public and Private Sectors
Organisations
Management of National Savings
Principal Repayment on Domestic
Loans
Loans and Advances to Federal
Government Employees and Others
Mintage of Coins / Manufacturing of
Medals, Awards, Postal Seal etc.
Management of Provisions
Prime Minister's Schemes
Facilitating remittances from Pakistani's
abroad
Security Enhancement and
Rehabilitation of temporarily displaced
persons
Poverty Alleviation Services
4,042,971
1,790,330,843
82,126,521
3,467,783
42,317,639,081
11,506,570
642,426
260,962,193
51,283,218
12,152,615
687,993
54,046,673
2,292,830,572
80,776,415
3,520,325
15,355,908,723
13,145,718
593,123
389,825,971
2,807,762
23,059,999
63,060,071
2,631,000,000
42,213,511
3,639,397
10,099,902,001
15,922,589
642,526
647,910,000
1,020,000
25,112,200
53,400,000
122,295,160
2,757,175,636
54,315,000
3,884,000
21,617,346,647
10,895,700
750,000
1,043,803,044
10,500,000
22,232,256
57,000,000
124,000,000
2,907,175,636
34,000,000
3,907,000
23,000,000,000
10,500,000
850,000
800,000
10,000,000
22,000,000
60,000,000
126,000,000
3,057,175,636
35,000,000
3,981,000
26,000,000,000
10,700,000
950,000
600,000
10,000,000
22,000,000
64,000,000
6
7
8
9
10
11
12
13
14
15
16
17
Total 44,978,602,223 18,759,627,208 14,155,536,737 26,293,014,387 26,784,089,636 29,966,592,636
Rs. '000Budget by Outputs
Finance Division
- Provincial Finance Wing (PF)
- Provincial Finance Wing (PF)
- Budget Wing
- Corporate Finance Wing (CF),
External Finance Wing & Internal
Finance Wing
- Budget Wing / Central Directorate of
National Savings
- Budget Wing
- Provincial Finance Wing (PF)
- Internal Finance Wing / Pakistan Mint
- Budget Wing
- Budget Wing, Internal Finance and
Expenditure Wing
- Internal Finance(IF)
- Budget Wing
- External Finance Wing(EF)
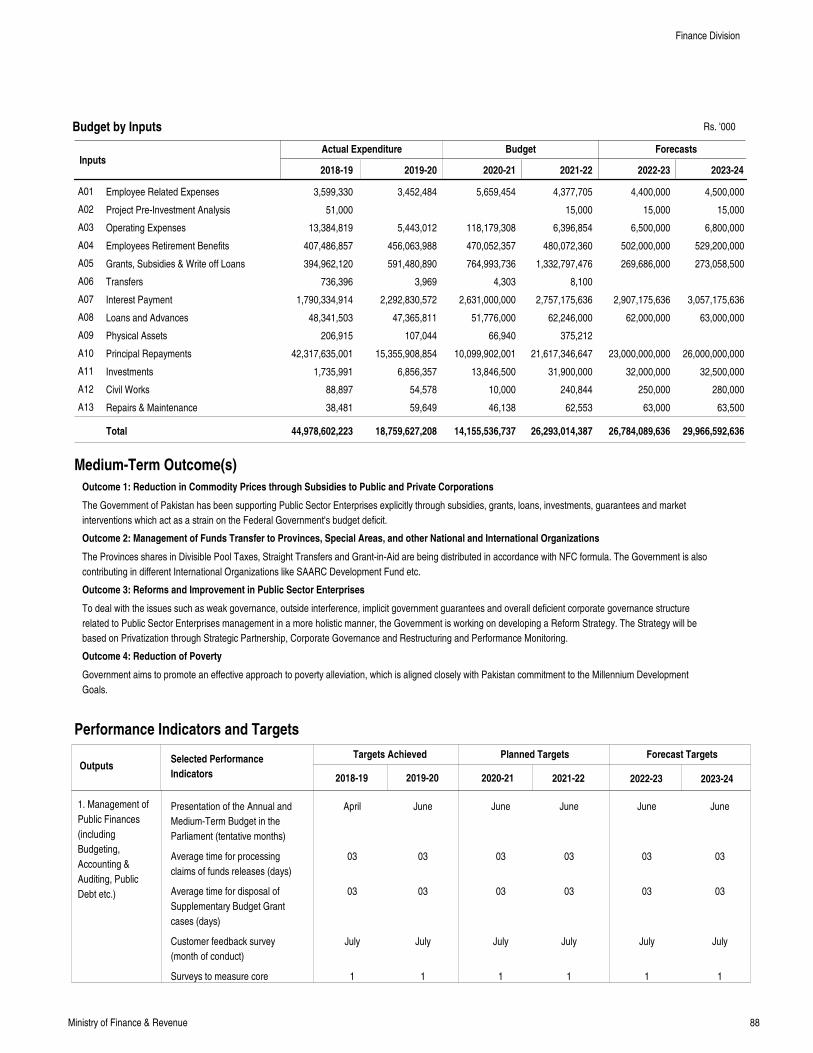
88Ministry of Finance & Revenue
InputsActual Expenditure Budget Forecasts
Employee Related Expenses
Project Pre-Investment Analysis
Operating Expenses
Employees Retirement Benefits
Grants, Subsidies & Write off Loans
Transfers
Interest Payment
Loans and Advances
Physical Assets
Principal Repayments
Investments
Civil Works
Repairs & Maintenance
3,599,330
51,000
13,384,819
407,486,857
394,962,120
736,396
1,790,334,914
48,341,503
206,915
42,317,635,001
1,735,991
88,897
38,481
3,452,484
5,443,012
456,063,988
591,480,890
3,969
2,292,830,572
47,365,811
107,044
15,355,908,854
6,856,357
54,578
59,649
5,659,454
118,179,308
470,052,357
764,993,736
4,303
2,631,000,000
51,776,000
66,940
10,099,902,001
13,846,500
10,000
46,138
4,377,705
15,000
6,396,854
480,072,360
1,332,797,476
8,100
2,757,175,636
62,246,000
375,212
21,617,346,647
31,900,000
240,844
62,553
4,400,000
15,000
6,500,000
502,000,000
269,686,000
2,907,175,636
62,000,000
23,000,000,000
32,000,000
250,000
63,000
4,500,000
15,000
6,800,000
529,200,000
273,058,500
3,057,175,636
63,000,000
26,000,000,000
32,500,000
280,000
63,500
A01
A02
A03
A04
A05
A06
A07
A08
A09
A10
A11
A12
A13
Total 44,978,602,223 18,759,627,208 14,155,536,737 26,293,014,387 26,784,089,636 29,966,592,636
2018-19 2019-20 2020-21 2021-22 2022-23 2023-24
The Government of Pakistan has been supporting Public Sector Enterprises explicitly through subsidies, grants, loans, investments, guarantees and market
interventions which act as a strain on the Federal Government's budget deficit.
The Provinces shares in Divisible Pool Taxes, Straight Transfers and Grant-in-Aid are being distributed in accordance with NFC formula. The Government is also
contributing in different International Organizations like SAARC Development Fund etc.
To deal with the issues such as weak governance, outside interference, implicit government guarantees and overall deficient corporate governance structure
related to Public Sector Enterprises management in a more holistic manner, the Government is working on developing a Reform Strategy. The Strategy will be
based on Privatization through Strategic Partnership, Corporate Governance and Restructuring and Performance Monitoring.
Government aims to promote an effective approach to poverty alleviation, which is aligned closely with Pakistan commitment to the Millennium Development
Goals.
Medium-Term Outcome(s)
Outcome 1: Reduction in Commodity Prices through Subsidies to Public and Private Corporations
Outcome 2: Management of Funds Transfer to Provinces, Special Areas, and other National and International Organizations
Outcome 3: Reforms and Improvement in Public Sector Enterprises
Outcome 4: Reduction of Poverty
Performance Indicators and Targets
OutputsTargets Achieved Planned Targets Forecast Targets
2018-19 2019-20 2020-21 2021-22 2022-23 2023-24
Selected Performance
Indicators
1. Management of
Public Finances
(including
Budgeting,
Accounting &
Auditing, Public
Debt etc.)
Budget by Inputs
Presentation of the Annual and
Medium-Term Budget in the
Parliament (tentative months)
Average time for processing
claims of funds releases (days)
Average time for disposal of
Supplementary Budget Grant
cases (days)
Customer feedback survey
(month of conduct)
Surveys to measure core
April
03
03
July
1
June
03
03
July
1
June
03
03
July
1
June
03
03
July
1
June
03
03
July
1
June
03
03
July
1
Finance Division
Rs. '000
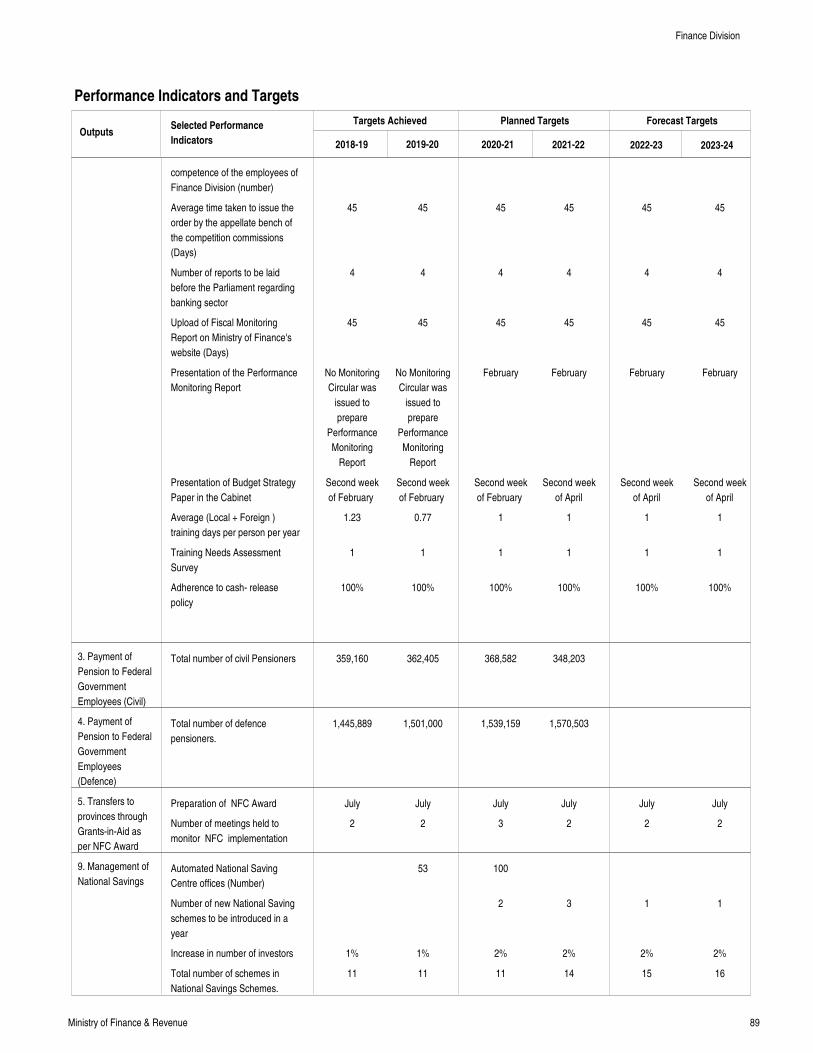
89Ministry of Finance & Revenue
Performance Indicators and Targets
OutputsTargets Achieved Planned Targets Forecast Targets
2018-19 2019-20 2020-21 2021-22 2022-23 2023-24
Selected Performance
Indicators
3. Payment of
Pension to Federal
Government
Employees (Civil)
4. Payment of
Pension to Federal
Government
Employees
(Defence)
5. Transfers to
provinces through
Grants-in-Aid as
per NFC Award
9. Management of
National Savings
competence of the employees of
Finance Division (number)
Average time taken to issue the
order by the appellate bench of
the competition commissions
(Days)
Number of reports to be laid
before the Parliament regarding
banking sector
Upload of Fiscal Monitoring
Report on Ministry of Finance's
website (Days)
Presentation of the Performance
Monitoring Report
Presentation of Budget Strategy
Paper in the Cabinet
Average (Local + Foreign )
training days per person per year
Training Needs Assessment
Survey
Adherence to cash- release
policy
Total number of civil Pensioners
Total number of defence
pensioners.
Preparation of NFC Award
Number of meetings held to
monitor NFC implementation
Automated National Saving
Centre offices (Number)
Number of new National Saving
schemes to be introduced in a
year
Increase in number of investors
Total number of schemes in
National Savings Schemes.
45
4
45
No Monitoring
Circular was
issued to
prepare
Performance
Monitoring
Report
Second week
of February
1.23
1
100%
359,160
1,445,889
July
2
1%
11
45
4
45
No Monitoring
Circular was
issued to
prepare
Performance
Monitoring
Report
Second week
of February
0.77
1
100%
362,405
1,501,000
July
2
53
1%
11
45
4
45
February
Second week
of February
1
1
100%
368,582
1,539,159
July
3
100
2
2%
11
45
4
45
February
Second week
of April
1
1
100%
348,203
1,570,503
July
2
3
2%
14
45
4
45
February
Second week
of April
1
1
100%
July
2
1
2%
15
45
4
45
February
Second week
of April
1
1
100%
July
2
1
2%
16
Finance Division
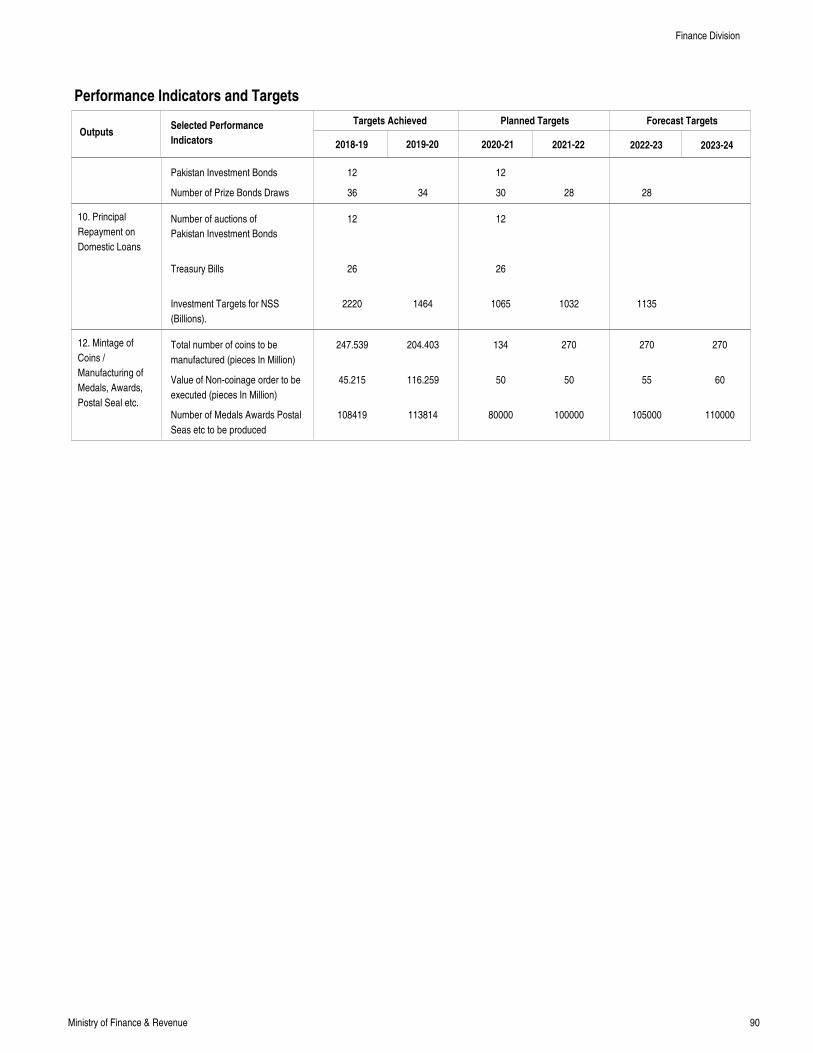
90Ministry of Finance & Revenue
Performance Indicators and Targets
OutputsTargets Achieved Planned Targets Forecast Targets
2018-19 2019-20 2020-21 2021-22 2022-23 2023-24
Selected Performance
Indicators
10. Principal
Repayment on
Domestic Loans
12. Mintage of
Coins /
Manufacturing of
Medals, Awards,
Postal Seal etc.
Pakistan Investment Bonds
Number of Prize Bonds Draws
Number of auctions of
Pakistan Investment Bonds
Treasury Bills
Investment Targets for NSS
(Billions).
Total number of coins to be
manufactured (pieces In Million)
Value of Non-coinage order to be
executed (pieces In Million)
Number of Medals Awards Postal
Seas etc to be produced
12
36
12
26
2220
247.539
45.215
108419
34
1464
204.403
116.259
113814
12
30
12
26
1065
134
50
80000
28
1032
270
50
100000
28
1135
270
55
105000
270
60
110000
Finance Division
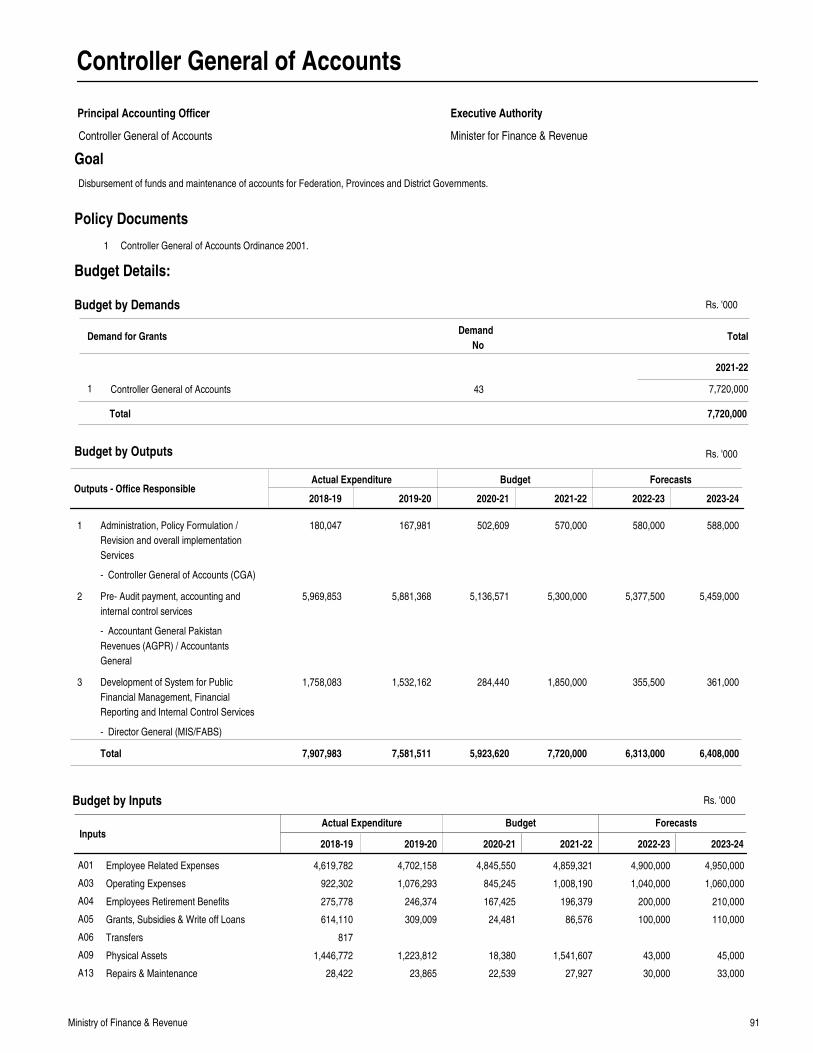
91Ministry of Finance & Revenue
Controller General of Accounts
Principal Accounting Officer
Minister for Finance & Revenue
Executive Authority
Goal
Outputs - Office ResponsibleActual Expenditure Budget Forecasts
2018-19 2019-20 2020-21 2021-22 2022-23 2023-24
Administration, Policy Formulation /
Revision and overall implementation
Services
Pre- Audit payment, accounting and
internal control services
Development of System for Public
Financial Management, Financial
Reporting and Internal Control Services
180,047
5,969,853
1,758,083
167,981
5,881,368
1,532,162
502,609
5,136,571
284,440
570,000
5,300,000
1,850,000
580,000
5,377,500
355,500
588,000
5,459,000
361,000
1
2
3
Total 7,907,983 7,581,511 5,923,620 7,720,000 6,313,000 6,408,000
Rs. '000
InputsActual Expenditure Budget Forecasts
Employee Related Expenses
Operating Expenses
Employees Retirement Benefits
Grants, Subsidies & Write off Loans
Transfers
Physical Assets
Repairs & Maintenance
4,619,782
922,302
275,778
614,110
817
1,446,772
28,422
4,702,158
1,076,293
246,374
309,009
1,223,812
23,865
4,845,550
845,245
167,425
24,481
18,380
22,539
4,859,321
1,008,190
196,379
86,576
1,541,607
27,927
4,900,000
1,040,000
200,000
100,000
43,000
30,000
4,950,000
1,060,000
210,000
110,000
45,000
33,000
A01
A03
A04
A05
A06
A09
A13
2018-19 2019-20 2020-21 2021-22 2022-23 2023-24
1 Controller General of Accounts Ordinance 2001.
Policy Documents
Budget by Outputs
Budget by Inputs
Disbursement of funds and maintenance of accounts for Federation, Provinces and District Governments.
Demand for GrantsDemand
NoTotal
2021-22
Budget by Demands
Controller General of Accounts1 43 7,720,000
7,720,000Total
Controller General of Accounts
Budget Details:
- Controller General of Accounts (CGA)
- Accountant General Pakistan
Revenues (AGPR) / Accountants
General
- Director General (MIS/FABS)
Rs. '000
Rs. '000
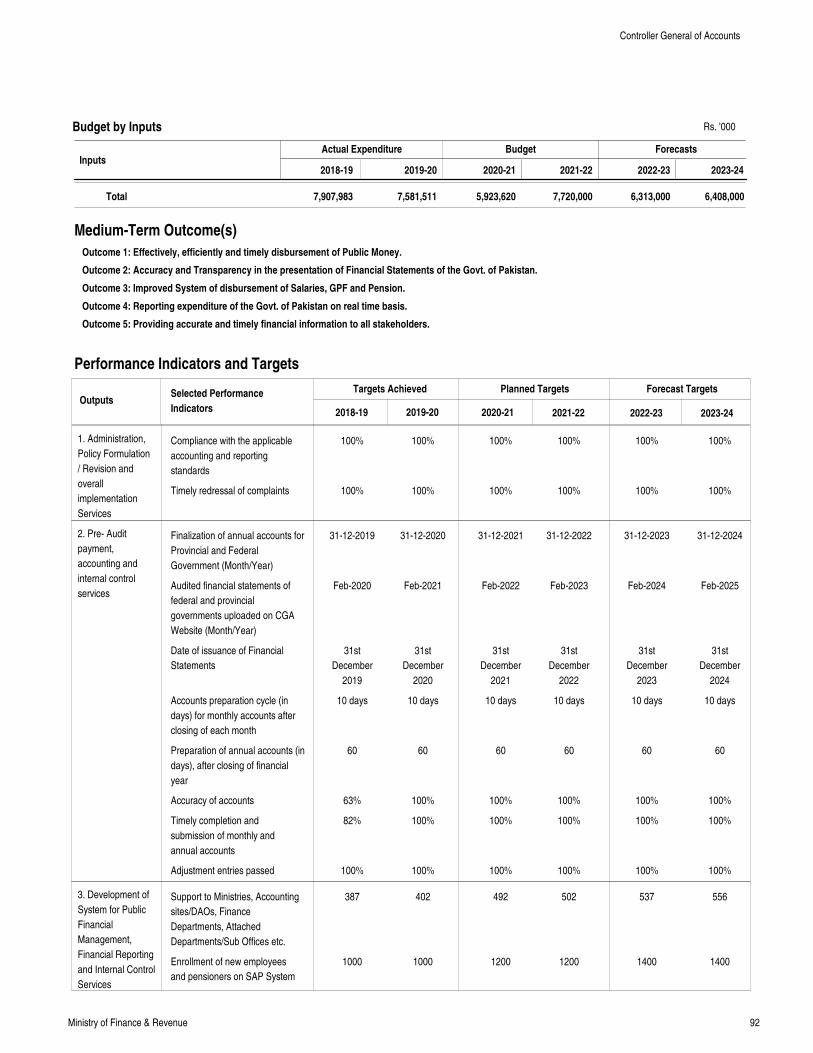
92Ministry of Finance & Revenue
InputsActual Expenditure Budget Forecasts
Total 7,907,983 7,581,511 5,923,620 7,720,000 6,313,000 6,408,000
2018-19 2019-20 2020-21 2021-22 2022-23 2023-24
Medium-Term Outcome(s)
Outcome 1: Effectively, efficiently and timely disbursement of Public Money.
Outcome 2: Accuracy and Transparency in the presentation of Financial Statements of the Govt. of Pakistan.
Outcome 3: Improved System of disbursement of Salaries, GPF and Pension.
Outcome 4: Reporting expenditure of the Govt. of Pakistan on real time basis.
Outcome 5: Providing accurate and timely financial information to all stakeholders.
Performance Indicators and Targets
OutputsTargets Achieved Planned Targets Forecast Targets
2018-19 2019-20 2020-21 2021-22 2022-23 2023-24
Selected Performance
Indicators
1. Administration,
Policy Formulation
/ Revision and
overall
implementation
Services
2. Pre- Audit
payment,
accounting and
internal control
services
3. Development of
System for Public
Financial
Management,
Financial Reporting
and Internal Control
Services
Budget by Inputs
Compliance with the applicable
accounting and reporting
standards
Timely redressal of complaints
Finalization of annual accounts for
Provincial and Federal
Government (Month/Year)
Audited financial statements of
federal and provincial
governments uploaded on CGA
Website (Month/Year)
Date of issuance of Financial
Statements
Accounts preparation cycle (in
days) for monthly accounts after
closing of each month
Preparation of annual accounts (in
days), after closing of financial
year
Accuracy of accounts
Timely completion and
submission of monthly and
annual accounts
Adjustment entries passed
Support to Ministries, Accounting
sites/DAOs, Finance
Departments, Attached
Departments/Sub Offices etc.
Enrollment of new employees
and pensioners on SAP System
100%
100%
31-12-2019
Feb-2020
31st
December
2019
10 days
60
63%
82%
100%
387
1000
100%
100%
31-12-2020
Feb-2021
31st
December
2020
10 days
60
100%
100%
100%
402
1000
100%
100%
31-12-2021
Feb-2022
31st
December
2021
10 days
60
100%
100%
100%
492
1200
100%
100%
31-12-2022
Feb-2023
31st
December
2022
10 days
60
100%
100%
100%
502
1200
100%
100%
31-12-2023
Feb-2024
31st
December
2023
10 days
60
100%
100%
100%
537
1400
100%
100%
31-12-2024
Feb-2025
31st
December
2024
10 days
60
100%
100%
100%
556
1400
Controller General of Accounts
Rs. '000
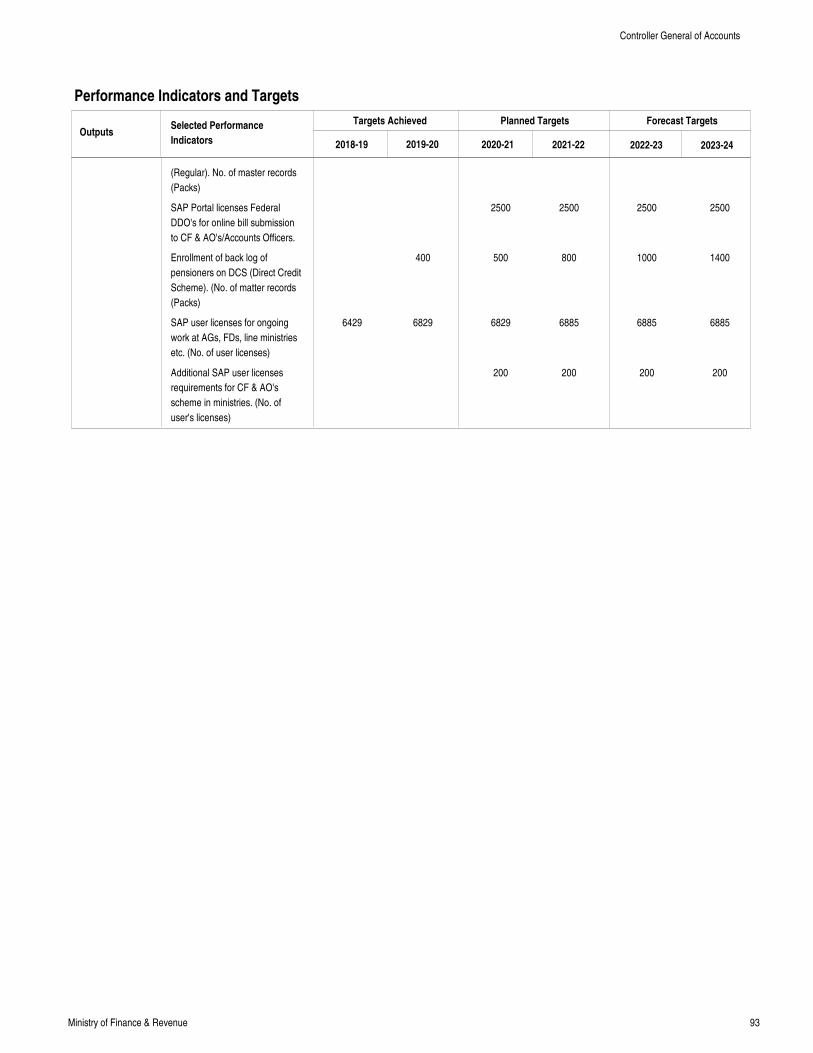
93Ministry of Finance & Revenue
Performance Indicators and Targets
OutputsTargets Achieved Planned Targets Forecast Targets
2018-19 2019-20 2020-21 2021-22 2022-23 2023-24
Selected Performance
Indicators
(Regular). No. of master records
(Packs)
SAP Portal licenses Federal
DDO's for online bill submission
to CF & AO's/Accounts Officers.
Enrollment of back log of
pensioners on DCS (Direct Credit
Scheme). (No. of matter records
(Packs)
SAP user licenses for ongoing
work at AGs, FDs, line ministries
etc. (No. of user licenses)
Additional SAP user licenses
requirements for CF & AO's
scheme in ministries. (No. of
user's licenses)
6429
400
6829
2500
500
6829
200
2500
800
6885
200
2500
1000
6885
200
2500
1400
6885
200
Controller General of Accounts
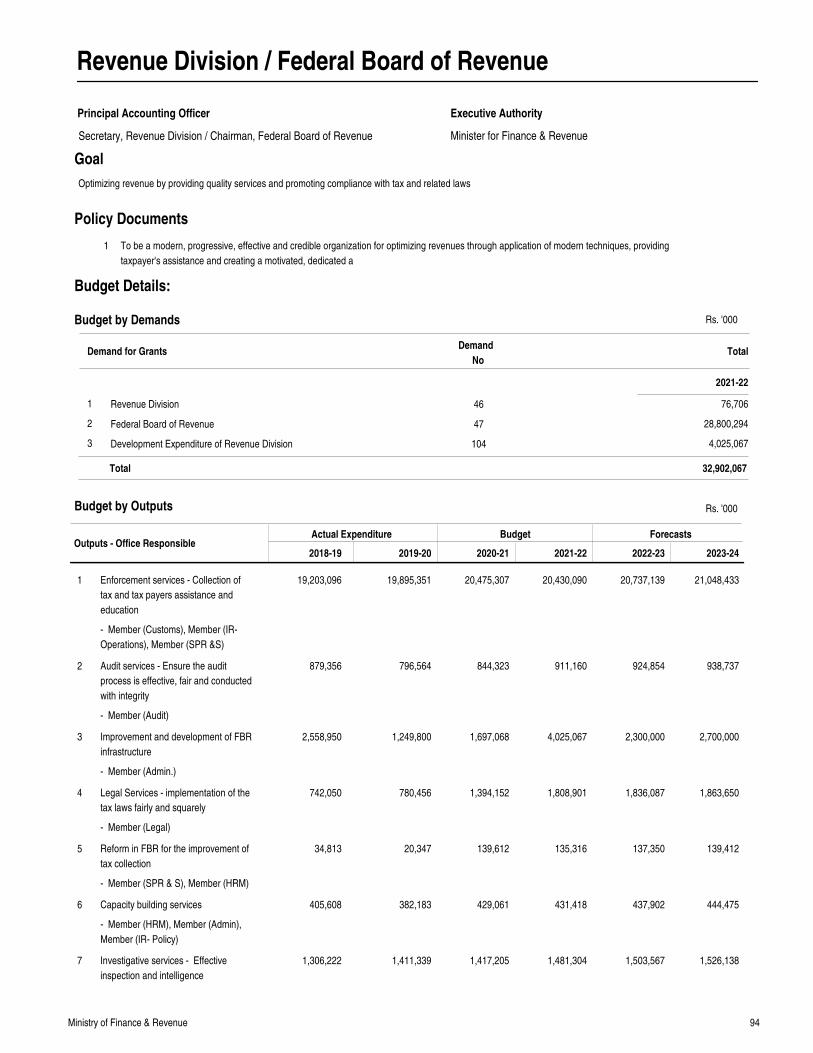
94Ministry of Finance & Revenue
Revenue Division / Federal Board of Revenue
Principal Accounting Officer
Minister for Finance & Revenue
Executive Authority
Goal
Outputs - Office ResponsibleActual Expenditure Budget Forecasts
2018-19 2019-20 2020-21 2021-22 2022-23 2023-24
Enforcement services - Collection of
tax and tax payers assistance and
education
Audit services - Ensure the audit
process is effective, fair and conducted
with integrity
Improvement and development of FBR
infrastructure
Legal Services - implementation of the
tax laws fairly and squarely
Reform in FBR for the improvement of
tax collection
Capacity building services
Investigative services - Effective
inspection and intelligence
19,203,096
879,356
2,558,950
742,050
34,813
405,608
1,306,222
19,895,351
796,564
1,249,800
780,456
20,347
382,183
1,411,339
20,475,307
844,323
1,697,068
1,394,152
139,612
429,061
1,417,205
20,430,090
911,160
4,025,067
1,808,901
135,316
431,418
1,481,304
20,737,139
924,854
2,300,000
1,836,087
137,350
437,902
1,503,567
21,048,433
938,737
2,700,000
1,863,650
139,412
444,475
1,526,138
1
2
3
4
5
6
7
Rs. '000
1 To be a modern, progressive, effective and credible organization for optimizing revenues through application of modern techniques, providing
taxpayer's assistance and creating a motivated, dedicated a
Policy Documents
Budget by Outputs
Optimizing revenue by providing quality services and promoting compliance with tax and related laws
Demand for GrantsDemand
NoTotal
2021-22
Budget by Demands
Revenue Division
Federal Board of Revenue
Development Expenditure of Revenue Division
1
2
3
46
47
104
76,706
28,800,294
4,025,067
32,902,067Total
Secretary, Revenue Division / Chairman, Federal Board of Revenue
Budget Details:
- Member (Customs), Member (IR-
Operations), Member (SPR &S)
- Member (Audit)
- Member (Admin.)
- Member (Legal)
- Member (SPR & S), Member (HRM)
- Member (HRM), Member (Admin),
Member (IR- Policy)
Rs. '000
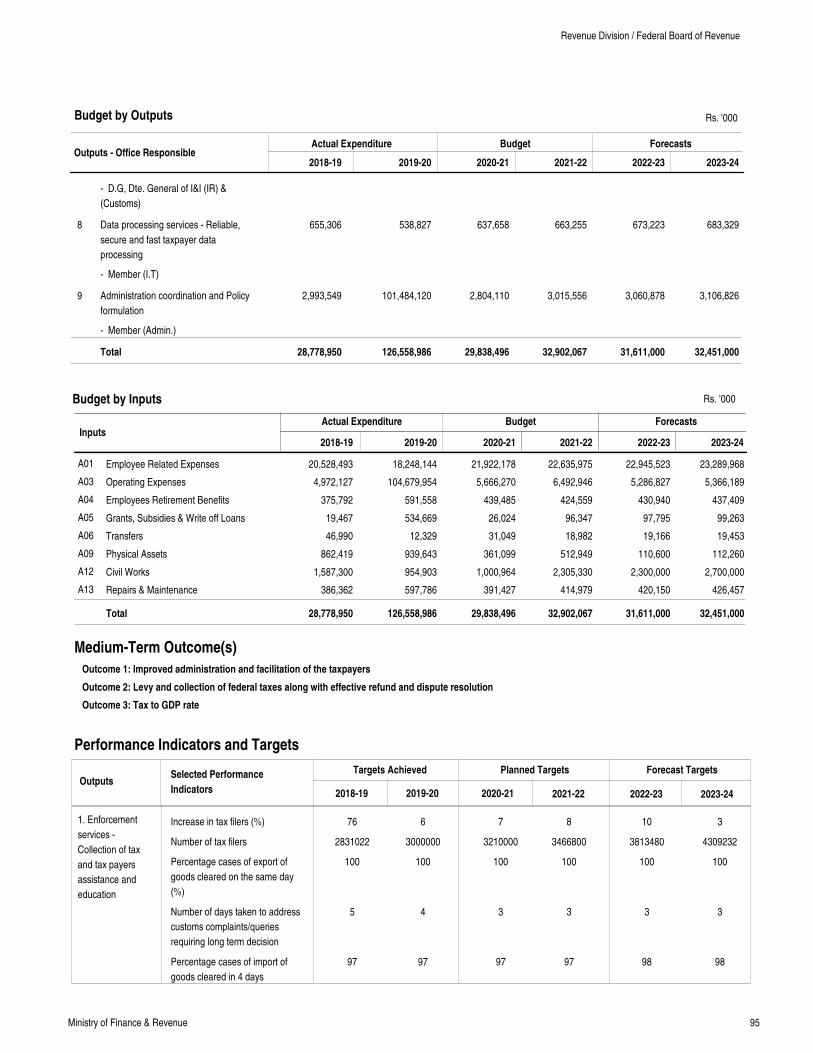
95Ministry of Finance & Revenue
Outputs - Office ResponsibleActual Expenditure Budget Forecasts
2018-19 2019-20 2020-21 2021-22 2022-23 2023-24
Data processing services - Reliable,
secure and fast taxpayer data
processing
Administration coordination and Policy
formulation
655,306
2,993,549
538,827
101,484,120
637,658
2,804,110
663,255
3,015,556
673,223
3,060,878
683,329
3,106,826
8
9
Total 28,778,950 126,558,986 29,838,496 32,902,067 31,611,000 32,451,000
Rs. '000
InputsActual Expenditure Budget Forecasts
Employee Related Expenses
Operating Expenses
Employees Retirement Benefits
Grants, Subsidies & Write off Loans
Transfers
Physical Assets
Civil Works
Repairs & Maintenance
20,528,493
4,972,127
375,792
19,467
46,990
862,419
1,587,300
386,362
18,248,144
104,679,954
591,558
534,669
12,329
939,643
954,903
597,786
21,922,178
5,666,270
439,485
26,024
31,049
361,099
1,000,964
391,427
22,635,975
6,492,946
424,559
96,347
18,982
512,949
2,305,330
414,979
22,945,523
5,286,827
430,940
97,795
19,166
110,600
2,300,000
420,150
23,289,968
5,366,189
437,409
99,263
19,453
112,260
2,700,000
426,457
A01
A03
A04
A05
A06
A09
A12
A13
Total 28,778,950 126,558,986 29,838,496 32,902,067 31,611,000 32,451,000
2018-19 2019-20 2020-21 2021-22 2022-23 2023-24
Medium-Term Outcome(s)
Outcome 1: Improved administration and facilitation of the taxpayers
Outcome 2: Levy and collection of federal taxes along with effective refund and dispute resolution
Outcome 3: Tax to GDP rate
Performance Indicators and Targets
OutputsTargets Achieved Planned Targets Forecast Targets
2018-19 2019-20 2020-21 2021-22 2022-23 2023-24
Selected Performance
Indicators
1. Enforcement
services -
Collection of tax
and tax payers
assistance and
education
Budget by Outputs
Budget by Inputs
Increase in tax filers (%)
Number of tax filers
Percentage cases of export of
goods cleared on the same day
(%)
Number of days taken to address
customs complaints/queries
requiring long term decision
Percentage cases of import of
goods cleared in 4 days
76
2831022
100
5
97
6
3000000
100
4
97
7
3210000
100
3
97
8
3466800
100
3
97
10
3813480
100
3
98
3
4309232
100
3
98
Revenue Division / Federal Board of Revenue
- D.G, Dte. General of I&I (IR) &
(Customs)
- Member (I.T)
- Member (Admin.)
Rs. '000
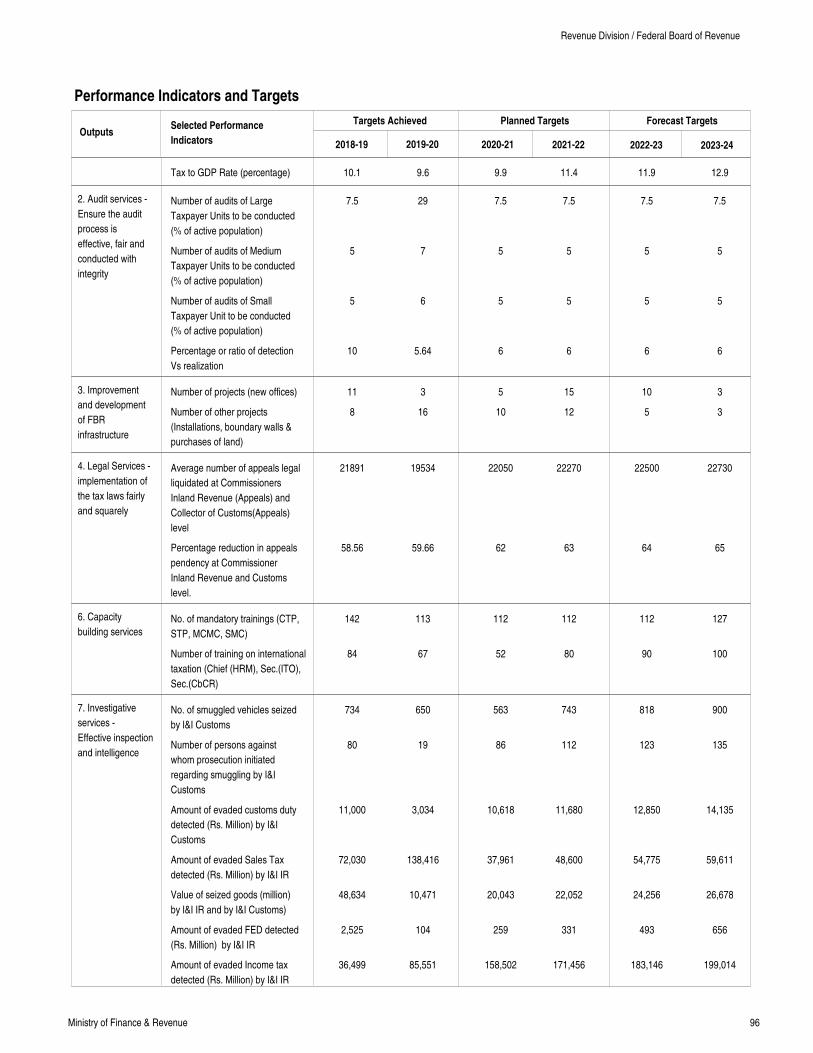
96Ministry of Finance & Revenue
Performance Indicators and Targets
OutputsTargets Achieved Planned Targets Forecast Targets
2018-19 2019-20 2020-21 2021-22 2022-23 2023-24
Selected Performance
Indicators
2. Audit services -
Ensure the audit
process is
effective, fair and
conducted with
integrity
3. Improvement
and development
of FBR
infrastructure
4. Legal Services -
implementation of
the tax laws fairly
and squarely
6. Capacity
building services
7. Investigative
services -
Effective inspection
and intelligence
Tax to GDP Rate (percentage)
Number of audits of Large
Taxpayer Units to be conducted
(% of active population)
Number of audits of Medium
Taxpayer Units to be conducted
(% of active population)
Number of audits of Small
Taxpayer Unit to be conducted
(% of active population)
Percentage or ratio of detection
Vs realization
Number of projects (new offices)
Number of other projects
(Installations, boundary walls &
purchases of land)
Average number of appeals legal
liquidated at Commissioners
Inland Revenue (Appeals) and
Collector of Customs(Appeals)
level
Percentage reduction in appeals
pendency at Commissioner
Inland Revenue and Customs
level.
No. of mandatory trainings (CTP,
STP, MCMC, SMC)
Number of training on international
taxation (Chief (HRM), Sec.(ITO),
Sec.(CbCR)
No. of smuggled vehicles seized
by I&I Customs
Number of persons against
whom prosecution initiated
regarding smuggling by I&I
Customs
Amount of evaded customs duty
detected (Rs. Million) by I&I
Customs
Amount of evaded Sales Tax
detected (Rs. Million) by I&I IR
Value of seized goods (million)
by I&I IR and by I&I Customs)
Amount of evaded FED detected
(Rs. Million) by I&I IR
Amount of evaded Income tax
detected (Rs. Million) by I&I IR
10.1
7.5
5
5
10
11
8
21891
58.56
142
84
734
80
11,000
72,030
48,634
2,525
36,499
9.6
29
7
6
5.64
3
16
19534
59.66
113
67
650
19
3,034
138,416
10,471
104
85,551
9.9
7.5
5
5
6
5
10
22050
62
112
52
563
86
10,618
37,961
20,043
259
158,502
11.4
7.5
5
5
6
15
12
22270
63
112
80
743
112
11,680
48,600
22,052
331
171,456
11.9
7.5
5
5
6
10
5
22500
64
112
90
818
123
12,850
54,775
24,256
493
183,146
12.9
7.5
5
5
6
3
3
22730
65
127
100
900
135
14,135
59,611
26,678
656
199,014
Revenue Division / Federal Board of Revenue
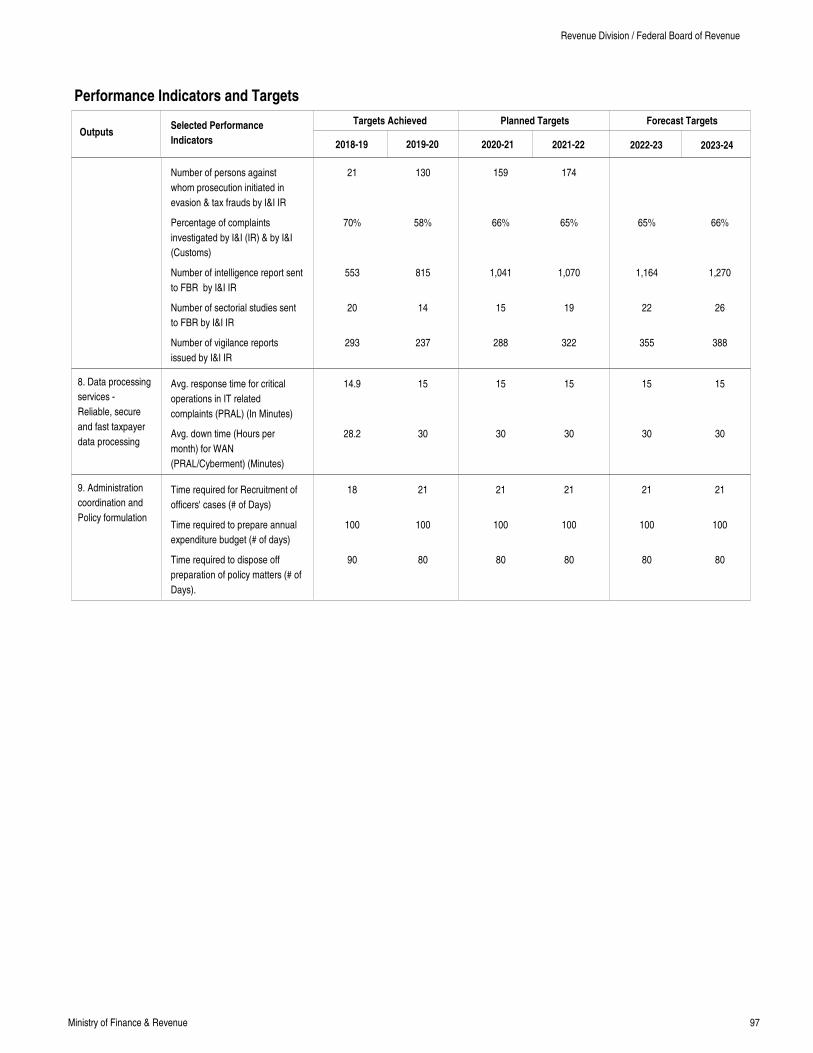
97Ministry of Finance & Revenue
Performance Indicators and Targets
OutputsTargets Achieved Planned Targets Forecast Targets
2018-19 2019-20 2020-21 2021-22 2022-23 2023-24
Selected Performance
Indicators
8. Data processing
services -
Reliable, secure
and fast taxpayer
data processing
9. Administration
coordination and
Policy formulation
Number of persons against
whom prosecution initiated in
evasion & tax frauds by I&I IR
Percentage of complaints
investigated by I&I (IR) & by I&I
(Customs)
Number of intelligence report sent
to FBR by I&I IR
Number of sectorial studies sent
to FBR by I&I IR
Number of vigilance reports
issued by I&I IR
Avg. response time for critical
operations in IT related
complaints (PRAL) (In Minutes)
Avg. down time (Hours per
month) for WAN
(PRAL/Cyberment) (Minutes)
Time required for Recruitment of
officers' cases (# of Days)
Time required to prepare annual
expenditure budget (# of days)
Time required to dispose off
preparation of policy matters (# of
Days).
21
70%
553
20
293
14.9
28.2
18
100
90
130
58%
815
14
237
15
30
21
100
80
159
66%
1,041
15
288
15
30
21
100
80
174
65%
1,070
19
322
15
30
21
100
80
65%
1,164
22
355
15
30
21
100
80
66%
1,270
26
388
15
30
21
100
80
Revenue Division / Federal Board of Revenue
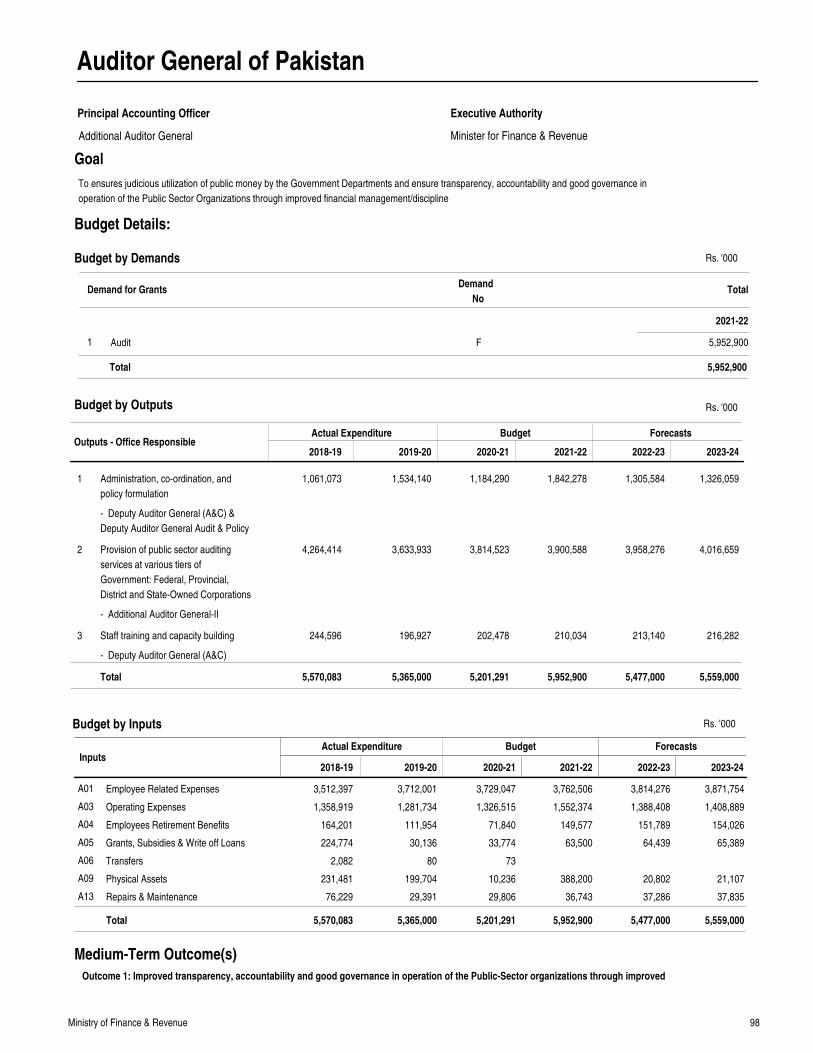
98Ministry of Finance & Revenue
Auditor General of Pakistan
Principal Accounting Officer
Minister for Finance & Revenue
Executive Authority
Goal
Outputs - Office ResponsibleActual Expenditure Budget Forecasts
2018-19 2019-20 2020-21 2021-22 2022-23 2023-24
Administration, co-ordination, and
policy formulation
Provision of public sector auditing
services at various tiers of
Government: Federal, Provincial,
District and State-Owned Corporations
Staff training and capacity building
1,061,073
4,264,414
244,596
1,534,140
3,633,933
196,927
1,184,290
3,814,523
202,478
1,842,278
3,900,588
210,034
1,305,584
3,958,276
213,140
1,326,059
4,016,659
216,282
1
2
3
Total 5,570,083 5,365,000 5,201,291 5,952,900 5,477,000 5,559,000
Rs. '000
InputsActual Expenditure Budget Forecasts
Employee Related Expenses
Operating Expenses
Employees Retirement Benefits
Grants, Subsidies & Write off Loans
Transfers
Physical Assets
Repairs & Maintenance
3,512,397
1,358,919
164,201
224,774
2,082
231,481
76,229
3,712,001
1,281,734
111,954
30,136
80
199,704
29,391
3,729,047
1,326,515
71,840
33,774
73
10,236
29,806
3,762,506
1,552,374
149,577
63,500
388,200
36,743
3,814,276
1,388,408
151,789
64,439
20,802
37,286
3,871,754
1,408,889
154,026
65,389
21,107
37,835
A01
A03
A04
A05
A06
A09
A13
Total 5,570,083 5,365,000 5,201,291 5,952,900 5,477,000 5,559,000
2018-19 2019-20 2020-21 2021-22 2022-23 2023-24
Medium-Term Outcome(s)
Outcome 1: Improved transparency, accountability and good governance in operation of the Public-Sector organizations through improved
Budget by Outputs
Budget by Inputs
To ensures judicious utilization of public money by the Government Departments and ensure transparency, accountability and good governance in
operation of the Public Sector Organizations through improved financial management/discipline
Demand for GrantsDemand
NoTotal
2021-22
Budget by Demands
Audit1 F 5,952,900
5,952,900Total
Additional Auditor General
Budget Details:
- Deputy Auditor General (A&C) &
Deputy Auditor General Audit & Policy
- Additional Auditor General-II
- Deputy Auditor General (A&C)
Rs. '000
Rs. '000
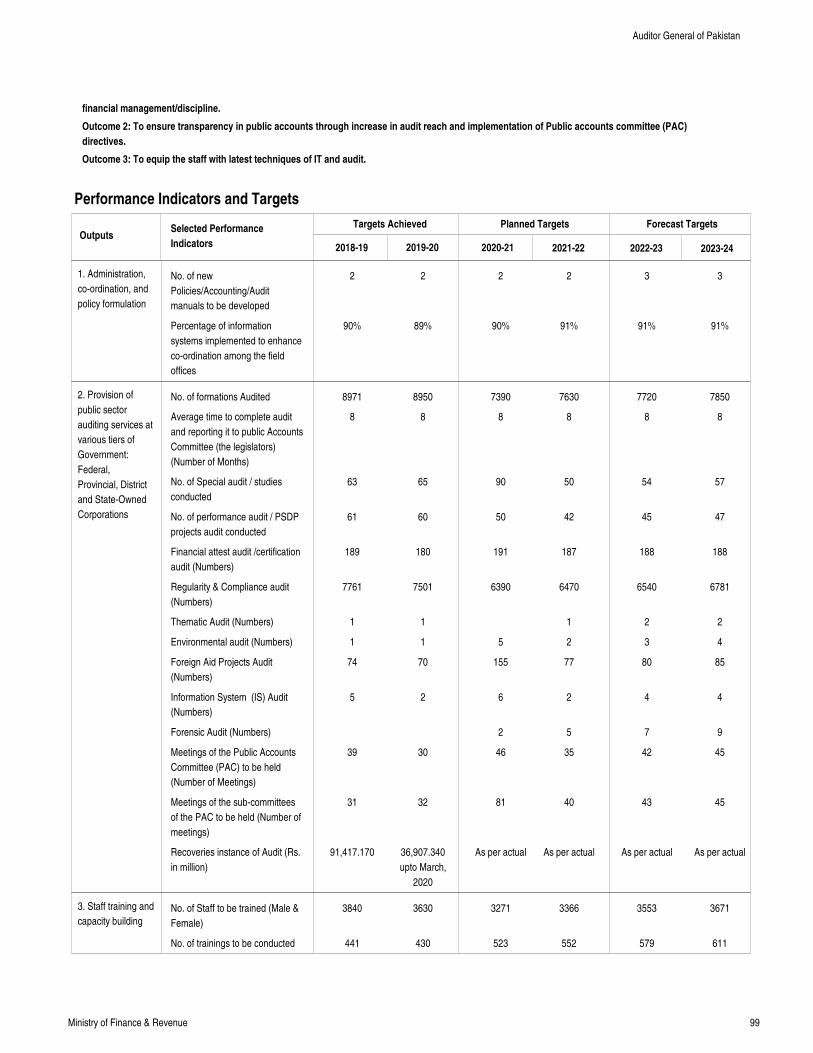
99Ministry of Finance & Revenue
financial management/discipline.
Outcome 2: To ensure transparency in public accounts through increase in audit reach and implementation of Public accounts committee (PAC)
directives.
Outcome 3: To equip the staff with latest techniques of IT and audit.
Performance Indicators and Targets
OutputsTargets Achieved Planned Targets Forecast Targets
2018-19 2019-20 2020-21 2021-22 2022-23 2023-24
Selected Performance
Indicators
1. Administration,
co-ordination, and
policy formulation
2. Provision of
public sector
auditing services at
various tiers of
Government:
Federal,
Provincial, District
and State-Owned
Corporations
3. Staff training and
capacity building
No. of new
Policies/Accounting/Audit
manuals to be developed
Percentage of information
systems implemented to enhance
co-ordination among the field
offices
No. of formations Audited
Average time to complete audit
and reporting it to public Accounts
Committee (the legislators)
(Number of Months)
No. of Special audit / studies
conducted
No. of performance audit / PSDP
projects audit conducted
Financial attest audit /certification
audit (Numbers)
Regularity & Compliance audit
(Numbers)
Thematic Audit (Numbers)
Environmental audit (Numbers)
Foreign Aid Projects Audit
(Numbers)
Information System (IS) Audit
(Numbers)
Forensic Audit (Numbers)
Meetings of the Public Accounts
Committee (PAC) to be held
(Number of Meetings)
Meetings of the sub-committees
of the PAC to be held (Number of
meetings)
Recoveries instance of Audit (Rs.
in million)
No. of Staff to be trained (Male &
Female)
No. of trainings to be conducted
2
90%
8971
8
63
61
189
7761
1
1
74
5
39
31
91,417.170
3840
441
2
89%
8950
8
65
60
180
7501
1
1
70
2
30
32
36,907.340
upto March,
2020
3630
430
2
90%
7390
8
90
50
191
6390
5
155
6
2
46
81
As per actual
3271
523
2
91%
7630
8
50
42
187
6470
1
2
77
2
5
35
40
As per actual
3366
552
3
91%
7720
8
54
45
188
6540
2
3
80
4
7
42
43
As per actual
3553
579
3
91%
7850
8
57
47
188
6781
2
4
85
4
9
45
45
As per actual
3671
611
Auditor General of Pakistan
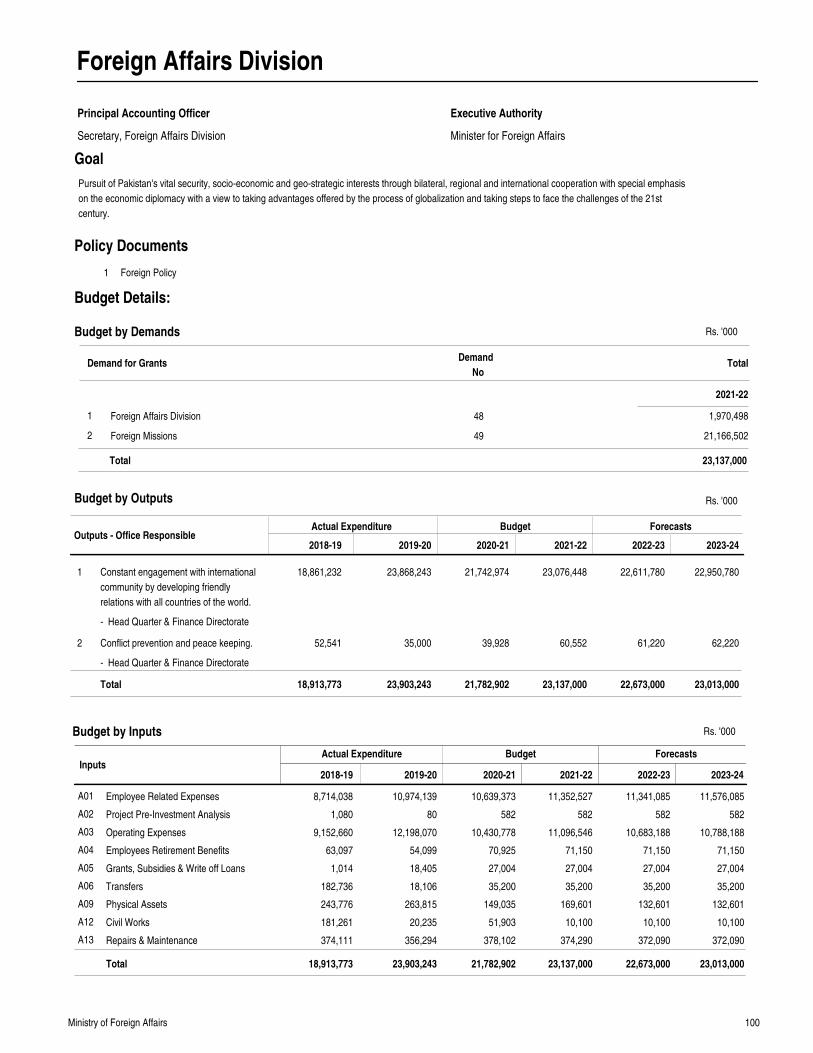
100Ministry of Foreign Affairs
Foreign Affairs Division
Principal Accounting Officer
Secretary, Foreign Affairs Division Minister for Foreign Affairs
Executive Authority
Goal
Outputs - Office ResponsibleActual Expenditure Budget Forecasts
2018-19 2019-20 2020-21 2021-22 2022-23 2023-24
Constant engagement with international
community by developing friendly
relations with all countries of the world.
Conflict prevention and peace keeping.
18,861,232
52,541
23,868,243
35,000
21,742,974
39,928
23,076,448
60,552
22,611,780
61,220
22,950,780
62,220
1
2
Total 18,913,773 23,903,243 21,782,902 23,137,000 22,673,000 23,013,000
Rs. '000
InputsActual Expenditure Budget Forecasts
Employee Related Expenses
Project Pre-Investment Analysis
Operating Expenses
Employees Retirement Benefits
Grants, Subsidies & Write off Loans
Transfers
Physical Assets
Civil Works
Repairs & Maintenance
8,714,038
1,080
9,152,660
63,097
1,014
182,736
243,776
181,261
374,111
10,974,139
80
12,198,070
54,099
18,405
18,106
263,815
20,235
356,294
10,639,373
582
10,430,778
70,925
27,004
35,200
149,035
51,903
378,102
11,352,527
582
11,096,546
71,150
27,004
35,200
169,601
10,100
374,290
11,341,085
582
10,683,188
71,150
27,004
35,200
132,601
10,100
372,090
11,576,085
582
10,788,188
71,150
27,004
35,200
132,601
10,100
372,090
A01
A02
A03
A04
A05
A06
A09
A12
A13
Total 18,913,773 23,903,243 21,782,902 23,137,000 22,673,000 23,013,000
2018-19 2019-20 2020-21 2021-22 2022-23 2023-24
1 Foreign Policy
Policy Documents
Budget by Outputs
Budget by Inputs
Pursuit of Pakistan's vital security, socio-economic and geo-strategic interests through bilateral, regional and international cooperation with special emphasis
on the economic diplomacy with a view to taking advantages offered by the process of globalization and taking steps to face the challenges of the 21st
century.
Demand for GrantsDemand
NoTotal
2021-22
Budget by Demands
Foreign Affairs Division
Foreign Missions
1
2
48
49
1,970,498
21,166,502
23,137,000Total
Budget Details:
- Head Quarter & Finance Directorate
- Head Quarter & Finance Directorate
Rs. '000
Rs. '000
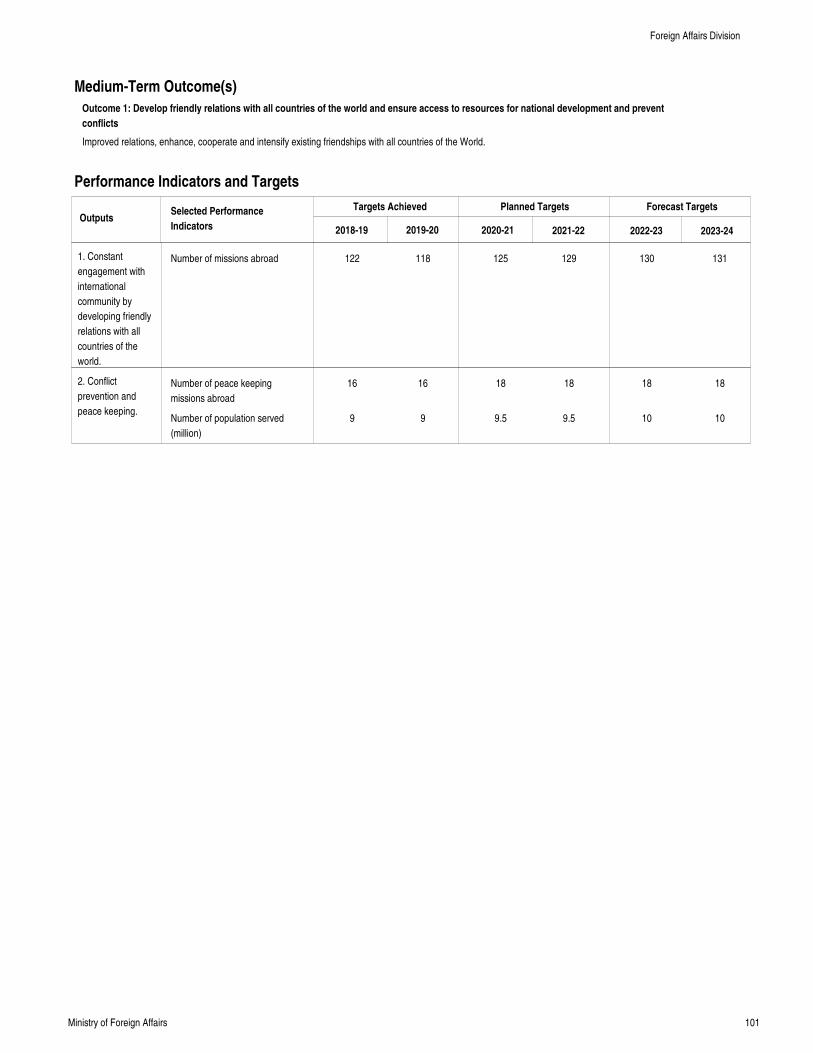
101Ministry of Foreign Affairs
Improved relations, enhance, cooperate and intensify existing friendships with all countries of the World.
Medium-Term Outcome(s)
Outcome 1: Develop friendly relations with all countries of the world and ensure access to resources for national development and prevent
conflicts
Performance Indicators and Targets
OutputsTargets Achieved Planned Targets Forecast Targets
2018-19 2019-20 2020-21 2021-22 2022-23 2023-24
Selected Performance
Indicators
1. Constant
engagement with
international
community by
developing friendly
relations with all
countries of the
world.
2. Conflict
prevention and
peace keeping.
Number of missions abroad
Number of peace keeping
missions abroad
Number of population served
(million)
122
16
9
118
16
9
125
18
9.5
129
18
9.5
130
18
10
131
18
10
Foreign Affairs Division
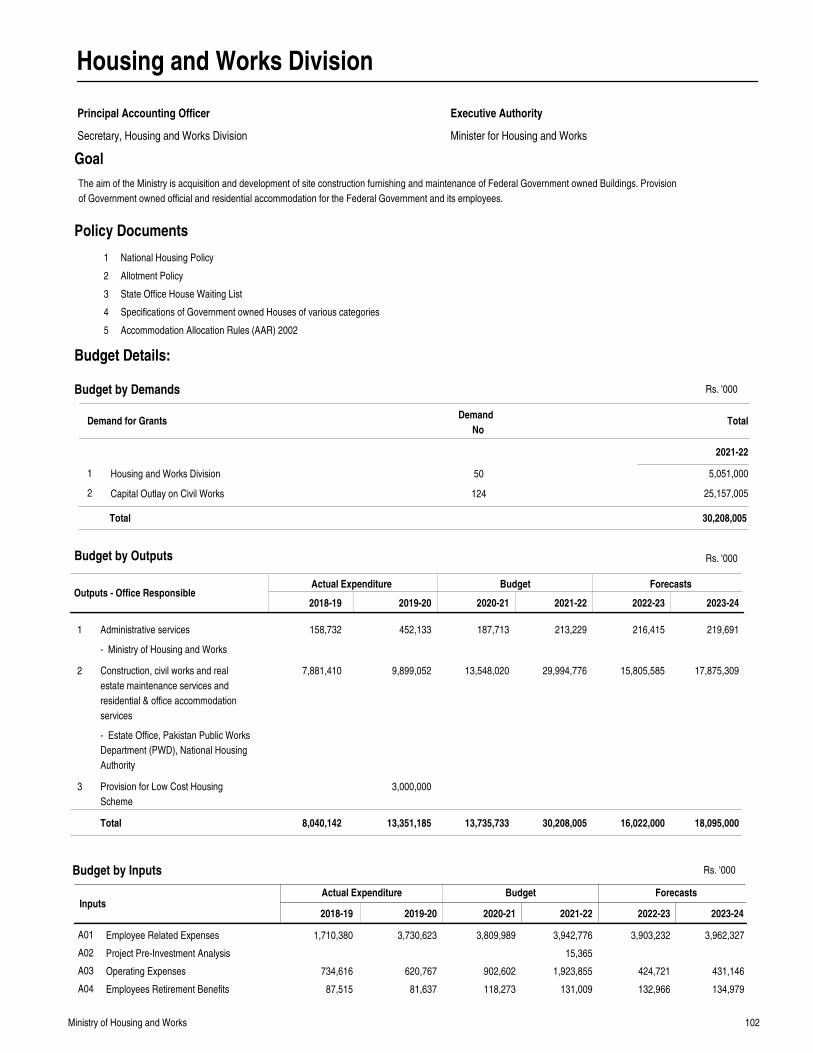
102Ministry of Housing and Works
Housing and Works Division
Principal Accounting Officer
Secretary, Housing and Works Division Minister for Housing and Works
Executive Authority
Goal
Outputs - Office ResponsibleActual Expenditure Budget Forecasts
2018-19 2019-20 2020-21 2021-22 2022-23 2023-24
Administrative services
Construction, civil works and real
estate maintenance services and
residential & office accommodation
services
Provision for Low Cost Housing
Scheme
158,732
7,881,410
452,133
9,899,052
3,000,000
187,713
13,548,020
213,229
29,994,776
216,415
15,805,585
219,691
17,875,309
1
2
3
Total 8,040,142 13,351,185 13,735,733 30,208,005 16,022,000 18,095,000
Rs. '000
InputsActual Expenditure Budget Forecasts
Employee Related Expenses
Project Pre-Investment Analysis
Operating Expenses
Employees Retirement Benefits
1,710,380
734,616
87,515
3,730,623
620,767
81,637
3,809,989
902,602
118,273
3,942,776
15,365
1,923,855
131,009
3,903,232
424,721
132,966
3,962,327
431,146
134,979
A01
A02
A03
A04
2018-19 2019-20 2020-21 2021-22 2022-23 2023-24
1
2
3
4
5
National Housing Policy
Allotment Policy
State Office House Waiting List
Specifications of Government owned Houses of various categories
Accommodation Allocation Rules (AAR) 2002
Policy Documents
Budget by Outputs
Budget by Inputs
The aim of the Ministry is acquisition and development of site construction furnishing and maintenance of Federal Government owned Buildings. Provision
of Government owned official and residential accommodation for the Federal Government and its employees.
Demand for GrantsDemand
NoTotal
2021-22
Budget by Demands
Housing and Works Division
Capital Outlay on Civil Works
1
2
50
124
5,051,000
25,157,005
30,208,005Total
Budget Details:
- Ministry of Housing and Works
- Estate Office, Pakistan Public Works
Department (PWD), National Housing
Authority
Rs. '000
Rs. '000
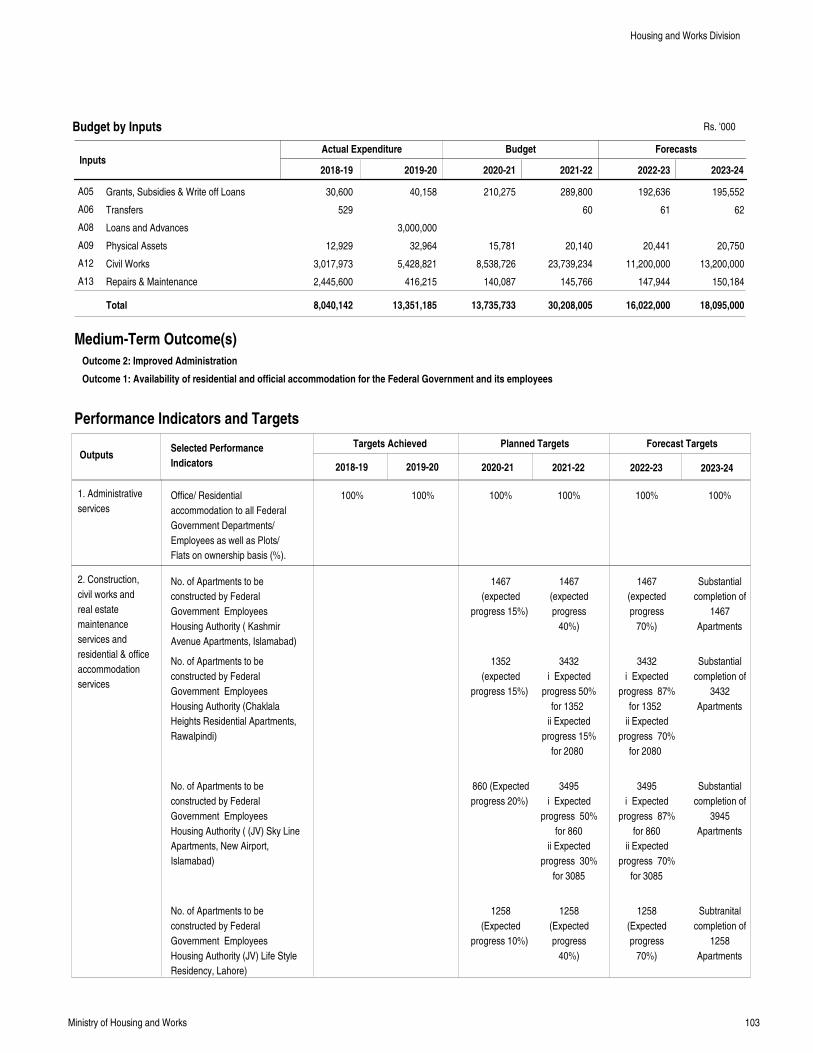
103Ministry of Housing and Works
InputsActual Expenditure Budget Forecasts
Grants, Subsidies & Write off Loans
Transfers
Loans and Advances
Physical Assets
Civil Works
Repairs & Maintenance
30,600
529
12,929
3,017,973
2,445,600
40,158
3,000,000
32,964
5,428,821
416,215
210,275
15,781
8,538,726
140,087
289,800
60
20,140
23,739,234
145,766
192,636
61
20,441
11,200,000
147,944
195,552
62
20,750
13,200,000
150,184
A05
A06
A08
A09
A12
A13
Total 8,040,142 13,351,185 13,735,733 30,208,005 16,022,000 18,095,000
2018-19 2019-20 2020-21 2021-22 2022-23 2023-24
Medium-Term Outcome(s)
Outcome 2: Improved Administration
Outcome 1: Availability of residential and official accommodation for the Federal Government and its employees
Performance Indicators and Targets
OutputsTargets Achieved Planned Targets Forecast Targets
2018-19 2019-20 2020-21 2021-22 2022-23 2023-24
Selected Performance
Indicators
1. Administrative
services
2. Construction,
civil works and
real estate
maintenance
services and
residential & office
accommodation
services
Budget by Inputs
Office/ Residential
accommodation to all Federal
Government Departments/
Employees as well as Plots/
Flats on ownership basis (%).
No. of Apartments to be
constructed by Federal
Government Employees
Housing Authority ( Kashmir
Avenue Apartments, Islamabad)
No. of Apartments to be
constructed by Federal
Government Employees
Housing Authority (Chaklala
Heights Residential Apartments,
Rawalpindi)
No. of Apartments to be
constructed by Federal
Government Employees
Housing Authority ( (JV) Sky Line
Apartments, New Airport,
Islamabad)
No. of Apartments to be
constructed by Federal
Government Employees
Housing Authority (JV) Life Style
Residency, Lahore)
100% 100% 100%
1467
(expected
progress 15%)
1352
(expected
progress 15%)
860 (Expected
progress 20%)
1258
(Expected
progress 10%)
100%
1467
(expected
progress
40%)
3432
i Expected
progress 50%
for 1352
ii Expected
progress 15%
for 2080
3495
i Expected
progress 50%
for 860
ii Expected
progress 30%
for 3085
1258
(Expected
progress
40%)
100%
1467
(expected
progress
70%)
3432
i Expected
progress 87%
for 1352
ii Expected
progress 70%
for 2080
3495
i Expected
progress 87%
for 860
ii Expected
progress 70%
for 3085
1258
(Expected
progress
70%)
100%
Substantial
completion of
1467
Apartments
Substantial
completion of
3432
Apartments
Substantial
completion of
3945
Apartments
Subtranital
completion of
1258
Apartments
Housing and Works Division
Rs. '000
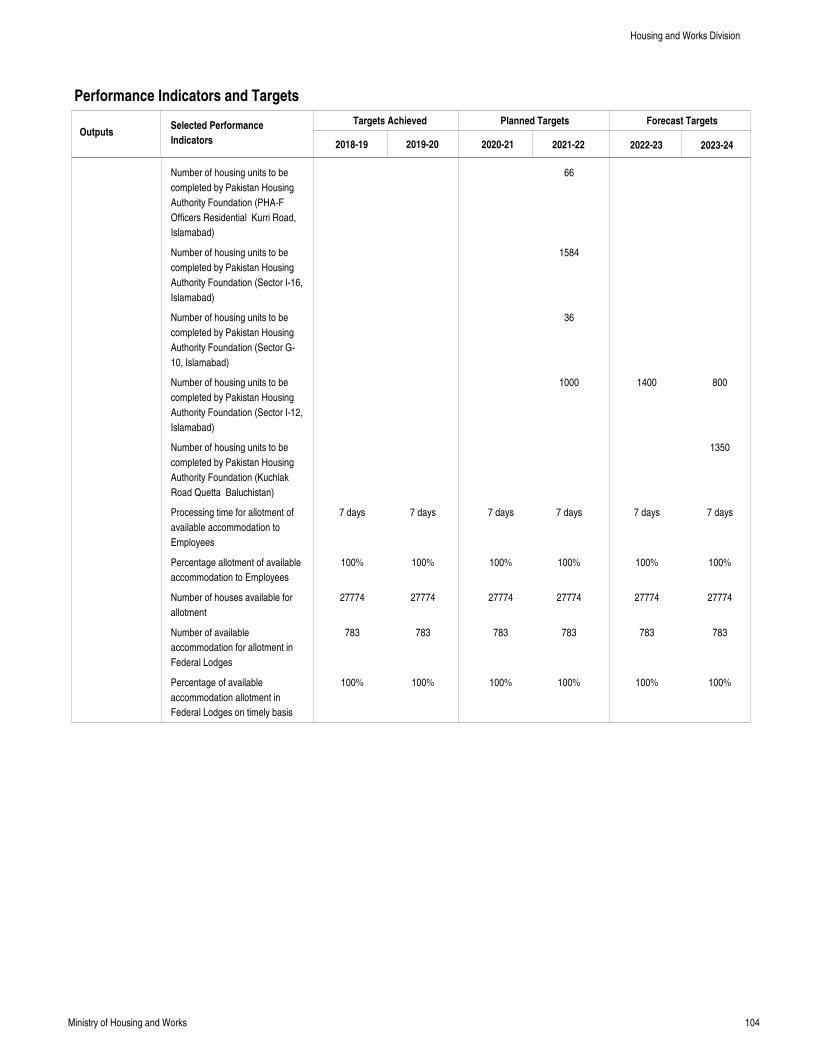
104Ministry of Housing and Works
Performance Indicators and Targets
OutputsTargets Achieved Planned Targets Forecast Targets
2018-19 2019-20 2020-21 2021-22 2022-23 2023-24
Selected Performance
Indicators
Number of housing units to be
completed by Pakistan Housing
Authority Foundation (PHA-F
Officers Residential Kurri Road,
Islamabad)
Number of housing units to be
completed by Pakistan Housing
Authority Foundation (Sector I-16,
Islamabad)
Number of housing units to be
completed by Pakistan Housing
Authority Foundation (Sector G-
10, Islamabad)
Number of housing units to be
completed by Pakistan Housing
Authority Foundation (Sector I-12,
Islamabad)
Number of housing units to be
completed by Pakistan Housing
Authority Foundation (Kuchlak
Road Quetta Baluchistan)
Processing time for allotment of
available accommodation to
Employees
Percentage allotment of available
accommodation to Employees
Number of houses available for
allotment
Number of available
accommodation for allotment in
Federal Lodges
Percentage of available
accommodation allotment in
Federal Lodges on timely basis
7 days
100%
27774
783
100%
7 days
100%
27774
783
100%
7 days
100%
27774
783
100%
66
1584
36
1000
7 days
100%
27774
783
100%
1400
7 days
100%
27774
783
100%
800
1350
7 days
100%
27774
783
100%
Housing and Works Division
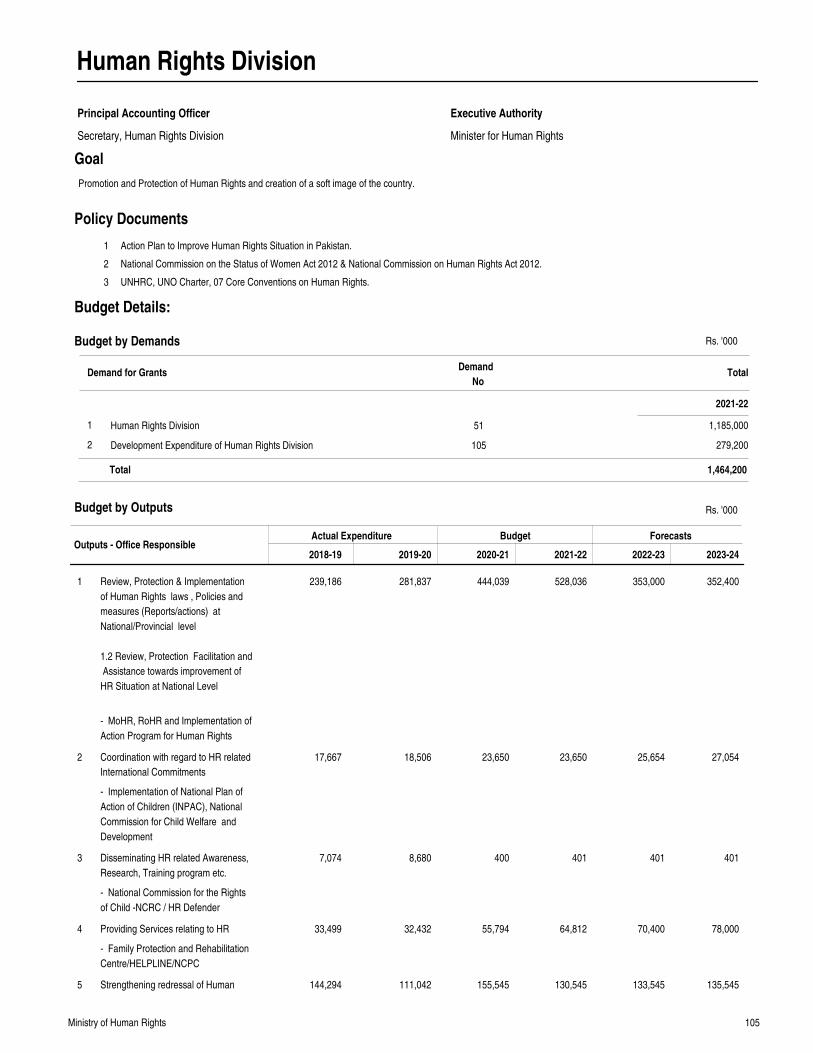
105Ministry of Human Rights
Human Rights Division
Principal Accounting Officer
Secretary, Human Rights Division Minister for Human Rights
Executive Authority
Goal
Outputs - Office ResponsibleActual Expenditure Budget Forecasts
2018-19 2019-20 2020-21 2021-22 2022-23 2023-24
Review, Protection & Implementation
of Human Rights laws , Policies and
measures (Reports/actions) at
National/Provincial level
1.2 Review, Protection Facilitation and
Assistance towards improvement of
HR Situation at National Level
Coordination with regard to HR related
International Commitments
Disseminating HR related Awareness,
Research, Training program etc.
Providing Services relating to HR
Strengthening redressal of Human
239,186
17,667
7,074
33,499
144,294
281,837
18,506
8,680
32,432
111,042
444,039
23,650
400
55,794
155,545
528,036
23,650
401
64,812
130,545
353,000
25,654
401
70,400
133,545
352,400
27,054
401
78,000
135,545
1
2
3
4
5
Rs. '000
1
2
3
Action Plan to Improve Human Rights Situation in Pakistan.
National Commission on the Status of Women Act 2012 & National Commission on Human Rights Act 2012.
UNHRC, UNO Charter, 07 Core Conventions on Human Rights.
Policy Documents
Budget by Outputs
Promotion and Protection of Human Rights and creation of a soft image of the country.
Demand for GrantsDemand
NoTotal
2021-22
Budget by Demands
Human Rights Division
Development Expenditure of Human Rights Division
1
2
51
105
1,185,000
279,200
1,464,200Total
Budget Details:
- MoHR, RoHR and Implementation of
Action Program for Human Rights
- Implementation of National Plan of
Action of Children (INPAC), National
Commission for Child Welfare and
Development
- National Commission for the Rights
of Child -NCRC / HR Defender
- Family Protection and Rehabilitation
Centre/HELPLINE/NCPC
Rs. '000
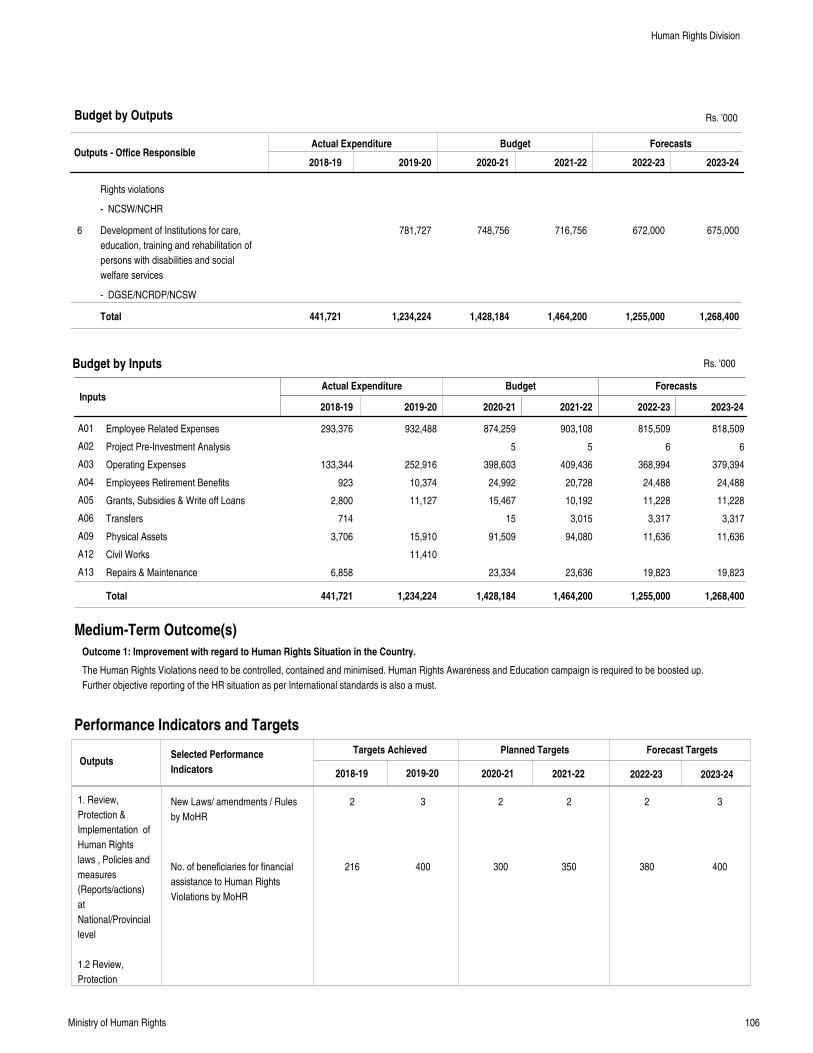
106Ministry of Human Rights
Outputs - Office ResponsibleActual Expenditure Budget Forecasts
2018-19 2019-20 2020-21 2021-22 2022-23 2023-24
Rights violations
Development of Institutions for care,
education, training and rehabilitation of
persons with disabilities and social
welfare services
781,727 748,756 716,756 672,000 675,0006
Total 441,721 1,234,224 1,428,184 1,464,200 1,255,000 1,268,400
Rs. '000
InputsActual Expenditure Budget Forecasts
Employee Related Expenses
Project Pre-Investment Analysis
Operating Expenses
Employees Retirement Benefits
Grants, Subsidies & Write off Loans
Transfers
Physical Assets
Civil Works
Repairs & Maintenance
293,376
133,344
923
2,800
714
3,706
6,858
932,488
252,916
10,374
11,127
15,910
11,410
874,259
5
398,603
24,992
15,467
15
91,509
23,334
903,108
5
409,436
20,728
10,192
3,015
94,080
23,636
815,509
6
368,994
24,488
11,228
3,317
11,636
19,823
818,509
6
379,394
24,488
11,228
3,317
11,636
19,823
A01
A02
A03
A04
A05
A06
A09
A12
A13
Total 441,721 1,234,224 1,428,184 1,464,200 1,255,000 1,268,400
2018-19 2019-20 2020-21 2021-22 2022-23 2023-24
The Human Rights Violations need to be controlled, contained and minimised. Human Rights Awareness and Education campaign is required to be boosted up.
Further objective reporting of the HR situation as per International standards is also a must.
Medium-Term Outcome(s)
Outcome 1: Improvement with regard to Human Rights Situation in the Country.
Performance Indicators and Targets
OutputsTargets Achieved Planned Targets Forecast Targets
2018-19 2019-20 2020-21 2021-22 2022-23 2023-24
Selected Performance
Indicators
1. Review,
Protection &
Implementation of
Human Rights
laws , Policies and
measures
(Reports/actions)
at
National/Provincial
level
1.2 Review,
Protection
Budget by Outputs
Budget by Inputs
New Laws/ amendments / Rules
by MoHR
No. of beneficiaries for financial
assistance to Human Rights
Violations by MoHR
2
216
3
400
2
300
2
350
2
380
3
400
Human Rights Division
- NCSW/NCHR
- DGSE/NCRDP/NCSW
Rs. '000
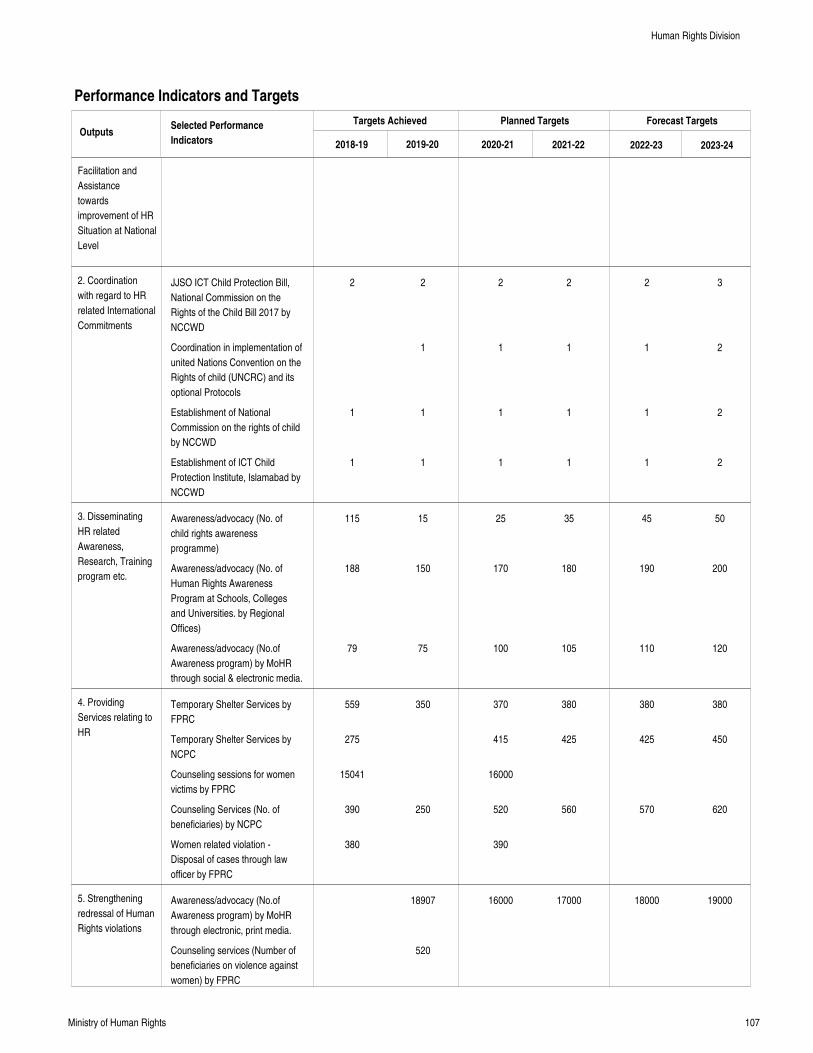
107Ministry of Human Rights
Performance Indicators and Targets
OutputsTargets Achieved Planned Targets Forecast Targets
2018-19 2019-20 2020-21 2021-22 2022-23 2023-24
Selected Performance
Indicators
Facilitation and
Assistance
towards
improvement of HR
Situation at National
Level
2. Coordination
with regard to HR
related International
Commitments
3. Disseminating
HR related
Awareness,
Research, Training
program etc.
4. Providing
Services relating to
HR
5. Strengthening
redressal of Human
Rights violations
JJSO ICT Child Protection Bill,
National Commission on the
Rights of the Child Bill 2017 by
NCCWD
Coordination in implementation of
united Nations Convention on the
Rights of child (UNCRC) and its
optional Protocols
Establishment of National
Commission on the rights of child
by NCCWD
Establishment of ICT Child
Protection Institute, Islamabad by
NCCWD
Awareness/advocacy (No. of
child rights awareness
programme)
Awareness/advocacy (No. of
Human Rights Awareness
Program at Schools, Colleges
and Universities. by Regional
Offices)
Awareness/advocacy (No.of
Awareness program) by MoHR
through social & electronic media.
Temporary Shelter Services by
FPRC
Temporary Shelter Services by
NCPC
Counseling sessions for women
victims by FPRC
Counseling Services (No. of
beneficiaries) by NCPC
Women related violation -
Disposal of cases through law
officer by FPRC
Awareness/advocacy (No.of
Awareness program) by MoHR
through electronic, print media.
Counseling services (Number of
beneficiaries on violence against
women) by FPRC
2
1
1
115
188
79
559
275
15041
390
380
2
1
1
1
15
150
75
350
250
18907
520
2
1
1
1
25
170
100
370
415
16000
520
390
16000
2
1
1
1
35
180
105
380
425
560
17000
2
1
1
1
45
190
110
380
425
570
18000
3
2
2
2
50
200
120
380
450
620
19000
Human Rights Division
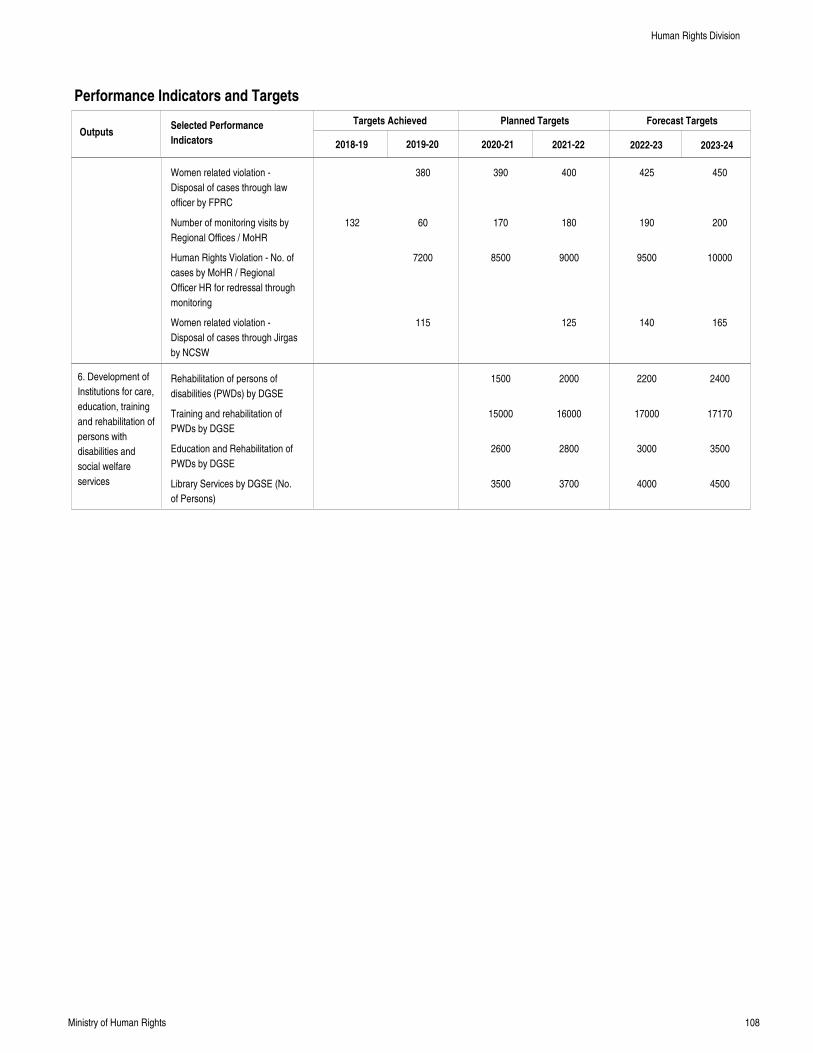
108Ministry of Human Rights
Performance Indicators and Targets
OutputsTargets Achieved Planned Targets Forecast Targets
2018-19 2019-20 2020-21 2021-22 2022-23 2023-24
Selected Performance
Indicators
6. Development of
Institutions for care,
education, training
and rehabilitation of
persons with
disabilities and
social welfare
services
Women related violation -
Disposal of cases through law
officer by FPRC
Number of monitoring visits by
Regional Offices / MoHR
Human Rights Violation - No. of
cases by MoHR / Regional
Officer HR for redressal through
monitoring
Women related violation -
Disposal of cases through Jirgas
by NCSW
Rehabilitation of persons of
disabilities (PWDs) by DGSE
Training and rehabilitation of
PWDs by DGSE
Education and Rehabilitation of
PWDs by DGSE
Library Services by DGSE (No.
of Persons)
132
380
60
7200
115
390
170
8500
1500
15000
2600
3500
400
180
9000
125
2000
16000
2800
3700
425
190
9500
140
2200
17000
3000
4000
450
200
10000
165
2400
17170
3500
4500
Human Rights Division
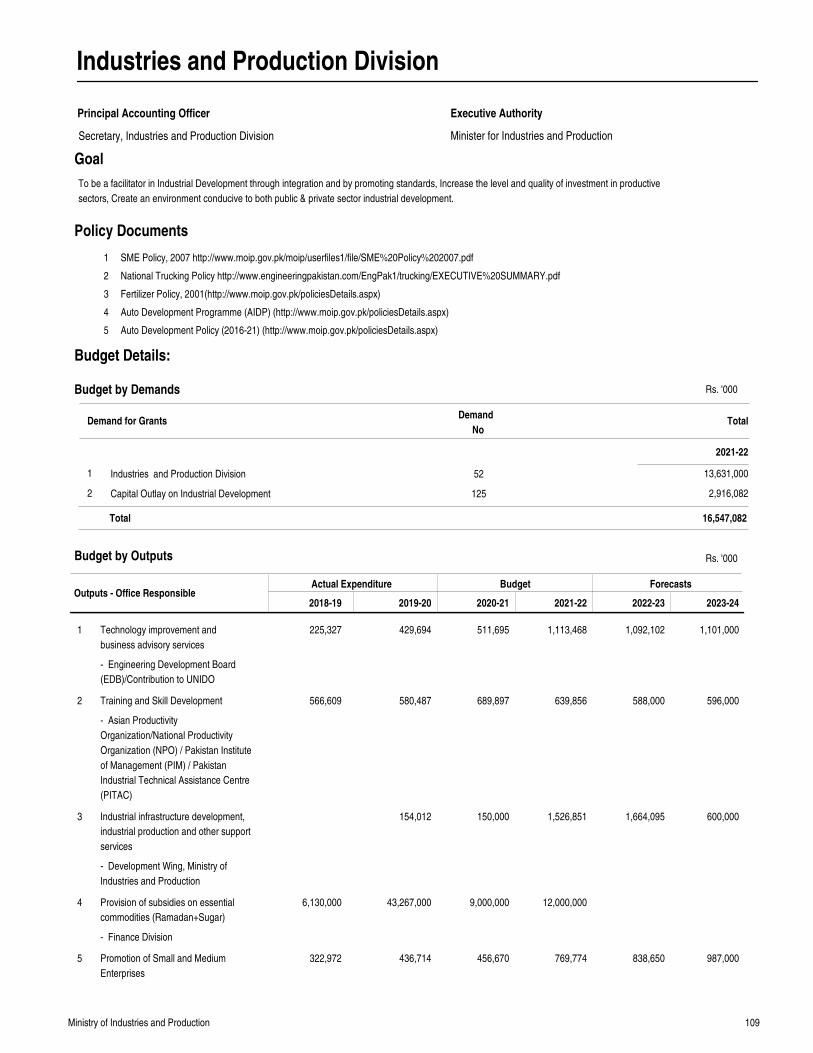
109Ministry of Industries and Production
Industries and Production Division
Principal Accounting Officer
Minister for Industries and Production
Executive Authority
Goal
Outputs - Office ResponsibleActual Expenditure Budget Forecasts
2018-19 2019-20 2020-21 2021-22 2022-23 2023-24
Technology improvement and
business advisory services
Training and Skill Development
Industrial infrastructure development,
industrial production and other support
services
Provision of subsidies on essential
commodities (Ramadan+Sugar)
Promotion of Small and Medium
Enterprises
225,327
566,609
6,130,000
322,972
429,694
580,487
154,012
43,267,000
436,714
511,695
689,897
150,000
9,000,000
456,670
1,113,468
639,856
1,526,851
12,000,000
769,774
1,092,102
588,000
1,664,095
838,650
1,101,000
596,000
600,000
987,000
1
2
3
4
5
Rs. '000
1
2
3
4
5
SME Policy, 2007 http://www.moip.gov.pk/moip/userfiles1/file/SME%20Policy%202007.pdf
National Trucking Policy http://www.engineeringpakistan.com/EngPak1/trucking/EXECUTIVE%20SUMMARY.pdf
Fertilizer Policy, 2001(http://www.moip.gov.pk/policiesDetails.aspx)
Auto Development Programme (AIDP) (http://www.moip.gov.pk/policiesDetails.aspx)
Auto Development Policy (2016-21) (http://www.moip.gov.pk/policiesDetails.aspx)
Policy Documents
Budget by Outputs
To be a facilitator in Industrial Development through integration and by promoting standards, Increase the level and quality of investment in productive
sectors, Create an environment conducive to both public & private sector industrial development.
Demand for GrantsDemand
NoTotal
2021-22
Budget by Demands
Industries and Production Division
Capital Outlay on Industrial Development
1
2
52
125
13,631,000
2,916,082
16,547,082Total
Secretary, Industries and Production Division
Budget Details:
- Engineering Development Board
(EDB)/Contribution to UNIDO
- Asian Productivity
Organization/National Productivity
Organization (NPO) / Pakistan Institute
of Management (PIM) / Pakistan
Industrial Technical Assistance Centre
(PITAC)
- Development Wing, Ministry of
Industries and Production
- Finance Division
Rs. '000
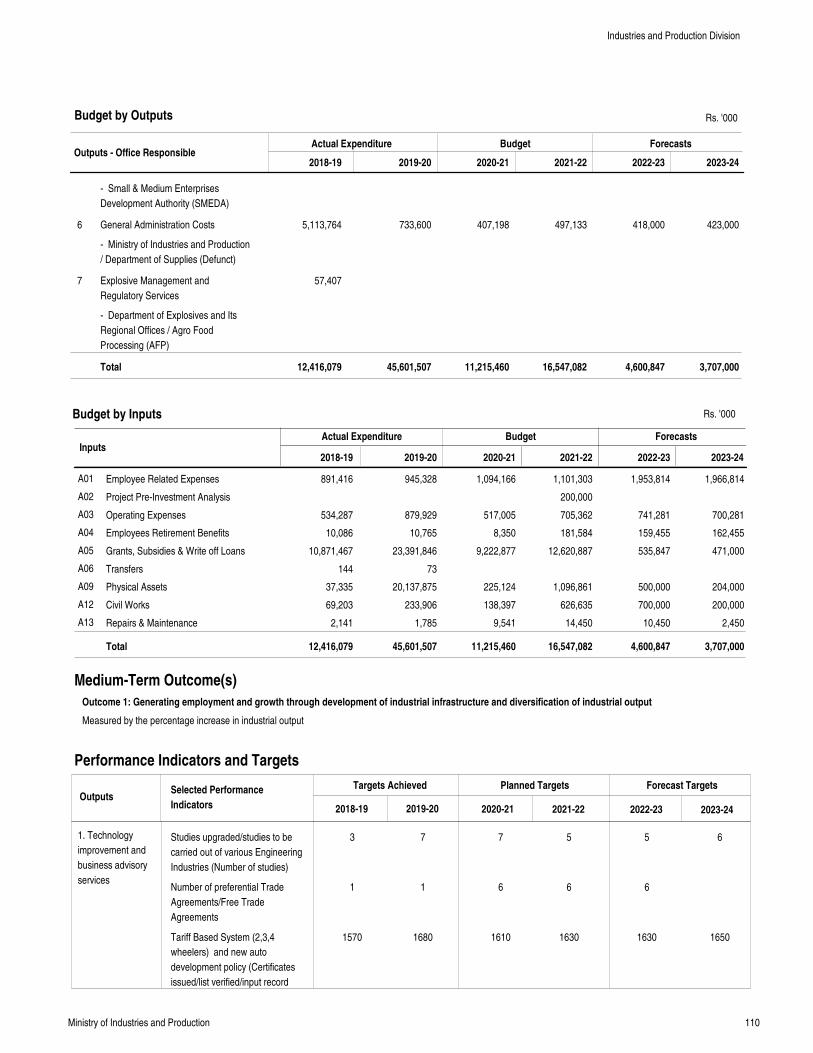
110Ministry of Industries and Production
Outputs - Office ResponsibleActual Expenditure Budget Forecasts
2018-19 2019-20 2020-21 2021-22 2022-23 2023-24
General Administration Costs
Explosive Management and
Regulatory Services
5,113,764
57,407
733,600 407,198 497,133 418,000 423,0006
7
Total 12,416,079 45,601,507 11,215,460 16,547,082 4,600,847 3,707,000
Rs. '000
InputsActual Expenditure Budget Forecasts
Employee Related Expenses
Project Pre-Investment Analysis
Operating Expenses
Employees Retirement Benefits
Grants, Subsidies & Write off Loans
Transfers
Physical Assets
Civil Works
Repairs & Maintenance
891,416
534,287
10,086
10,871,467
144
37,335
69,203
2,141
945,328
879,929
10,765
23,391,846
73
20,137,875
233,906
1,785
1,094,166
517,005
8,350
9,222,877
225,124
138,397
9,541
1,101,303
200,000
705,362
181,584
12,620,887
1,096,861
626,635
14,450
1,953,814
741,281
159,455
535,847
500,000
700,000
10,450
1,966,814
700,281
162,455
471,000
204,000
200,000
2,450
A01
A02
A03
A04
A05
A06
A09
A12
A13
Total 12,416,079 45,601,507 11,215,460 16,547,082 4,600,847 3,707,000
2018-19 2019-20 2020-21 2021-22 2022-23 2023-24
Measured by the percentage increase in industrial output
Medium-Term Outcome(s)
Outcome 1: Generating employment and growth through development of industrial infrastructure and diversification of industrial output
Performance Indicators and Targets
OutputsTargets Achieved Planned Targets Forecast Targets
2018-19 2019-20 2020-21 2021-22 2022-23 2023-24
Selected Performance
Indicators
1. Technology
improvement and
business advisory
services
Budget by Outputs
Budget by Inputs
Studies upgraded/studies to be
carried out of various Engineering
Industries (Number of studies)
Number of preferential Trade
Agreements/Free Trade
Agreements
Tariff Based System (2,3,4
wheelers) and new auto
development policy (Certificates
issued/list verified/input record
3
1
1570
7
1
1680
7
6
1610
5
6
1630
5
6
1630
6
1650
Industries and Production Division
- Small & Medium Enterprises
Development Authority (SMEDA)
- Ministry of Industries and Production
/ Department of Supplies (Defunct)
- Department of Explosives and Its
Regional Offices / Agro Food
Processing (AFP)
Rs. '000
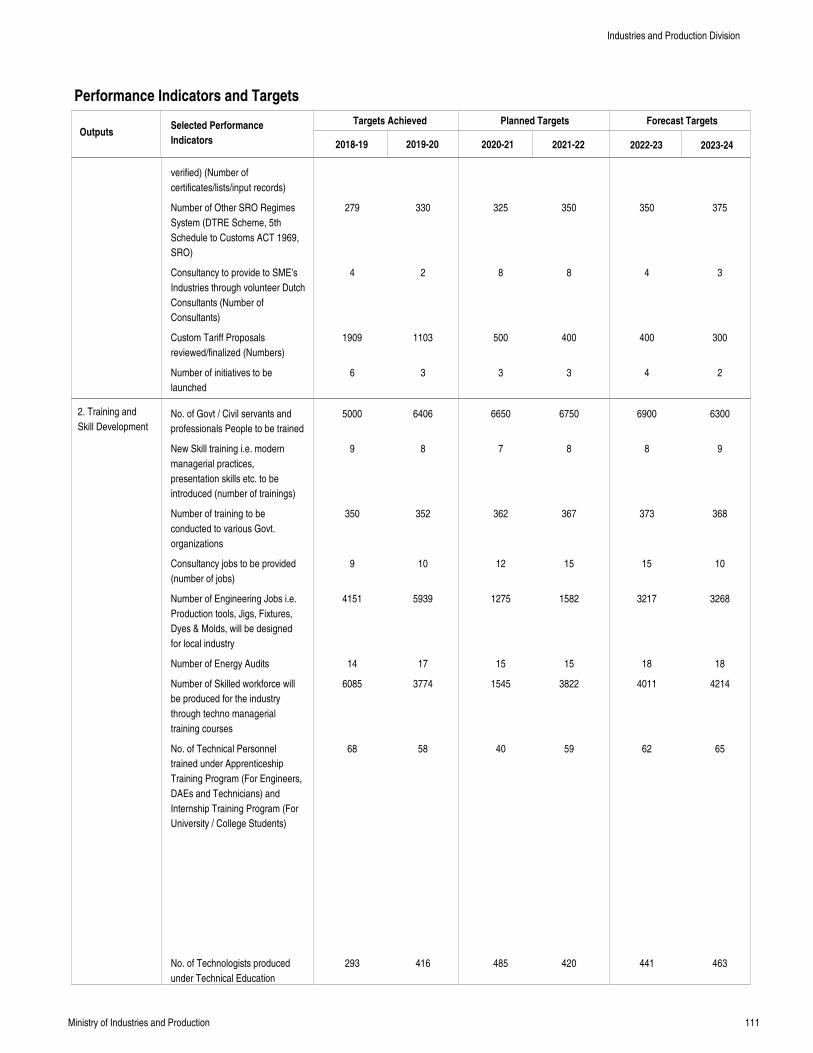
111Ministry of Industries and Production
Performance Indicators and Targets
OutputsTargets Achieved Planned Targets Forecast Targets
2018-19 2019-20 2020-21 2021-22 2022-23 2023-24
Selected Performance
Indicators
2. Training and
Skill Development
verified) (Number of
certificates/lists/input records)
Number of Other SRO Regimes
System (DTRE Scheme, 5th
Schedule to Customs ACT 1969,
SRO)
Consultancy to provide to SME's
Industries through volunteer Dutch
Consultants (Number of
Consultants)
Custom Tariff Proposals
reviewed/finalized (Numbers)
Number of initiatives to be
launched
No. of Govt / Civil servants and
professionals People to be trained
New Skill training i.e. modern
managerial practices,
presentation skills etc. to be
introduced (number of trainings)
Number of training to be
conducted to various Govt.
organizations
Consultancy jobs to be provided
(number of jobs)
Number of Engineering Jobs i.e.
Production tools, Jigs, Fixtures,
Dyes & Molds, will be designed
for local industry
Number of Energy Audits
Number of Skilled workforce will
be produced for the industry
through techno managerial
training courses
No. of Technical Personnel
trained under Apprenticeship
Training Program (For Engineers,
DAEs and Technicians) and
Internship Training Program (For
University / College Students)
No. of Technologists produced
under Technical Education
279
4
1909
6
5000
9
350
9
4151
14
6085
68
293
330
2
1103
3
6406
8
352
10
5939
17
3774
58
416
325
8
500
3
6650
7
362
12
1275
15
1545
40
485
350
8
400
3
6750
8
367
15
1582
15
3822
59
420
350
4
400
4
6900
8
373
15
3217
18
4011
62
441
375
3
300
2
6300
9
368
10
3268
18
4214
65
463
Industries and Production Division
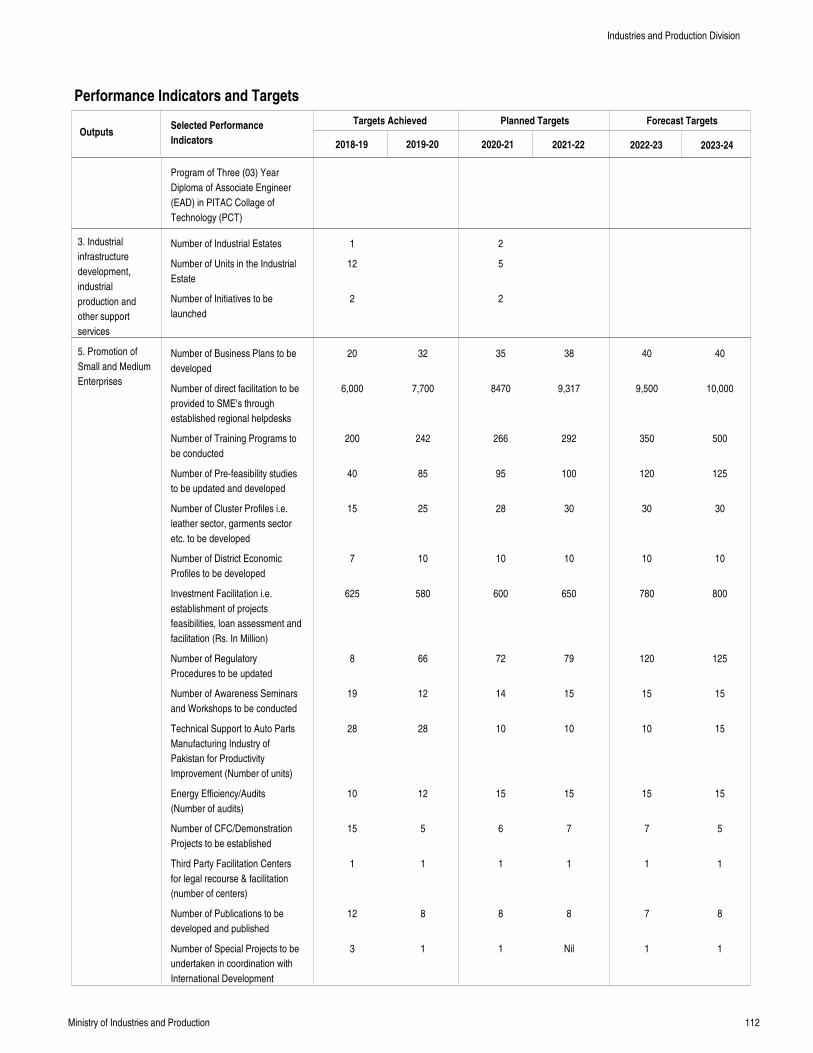
112Ministry of Industries and Production
Performance Indicators and Targets
OutputsTargets Achieved Planned Targets Forecast Targets
2018-19 2019-20 2020-21 2021-22 2022-23 2023-24
Selected Performance
Indicators
3. Industrial
infrastructure
development,
industrial
production and
other support
services
5. Promotion of
Small and Medium
Enterprises
Program of Three (03) Year
Diploma of Associate Engineer
(EAD) in PITAC Collage of
Technology (PCT)
Number of Industrial Estates
Number of Units in the Industrial
Estate
Number of Initiatives to be
launched
Number of Business Plans to be
developed
Number of direct facilitation to be
provided to SME's through
established regional helpdesks
Number of Training Programs to
be conducted
Number of Pre-feasibility studies
to be updated and developed
Number of Cluster Profiles i.e.
leather sector, garments sector
etc. to be developed
Number of District Economic
Profiles to be developed
Investment Facilitation i.e.
establishment of projects
feasibilities, loan assessment and
facilitation (Rs. In Million)
Number of Regulatory
Procedures to be updated
Number of Awareness Seminars
and Workshops to be conducted
Technical Support to Auto Parts
Manufacturing Industry of
Pakistan for Productivity
Improvement (Number of units)
Energy Efficiency/Audits
(Number of audits)
Number of CFC/Demonstration
Projects to be established
Third Party Facilitation Centers
for legal recourse & facilitation
(number of centers)
Number of Publications to be
developed and published
Number of Special Projects to be
undertaken in coordination with
International Development
1
12
2
20
6,000
200
40
15
7
625
8
19
28
10
15
1
12
3
32
7,700
242
85
25
10
580
66
12
28
12
5
1
8
1
2
5
2
35
8470
266
95
28
10
600
72
14
10
15
6
1
8
1
38
9,317
292
100
30
10
650
79
15
10
15
7
1
8
Nil
40
9,500
350
120
30
10
780
120
15
10
15
7
1
7
1
40
10,000
500
125
30
10
800
125
15
15
15
5
1
8
1
Industries and Production Division
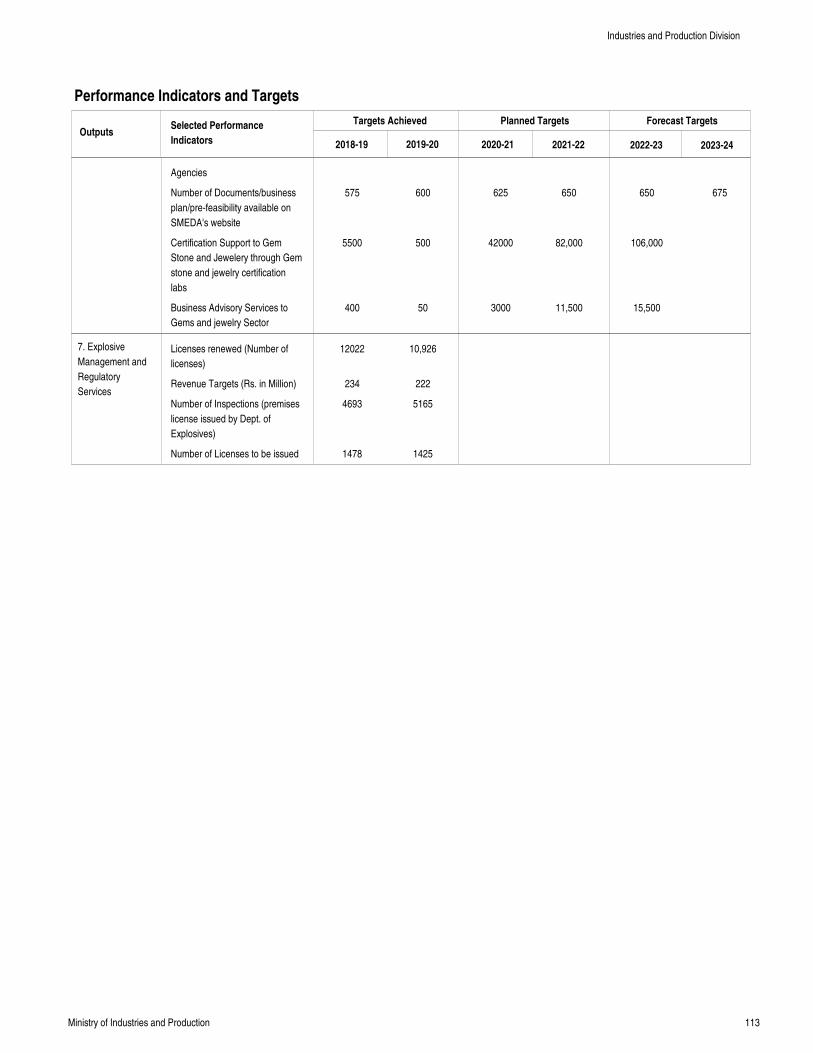
113Ministry of Industries and Production
Performance Indicators and Targets
OutputsTargets Achieved Planned Targets Forecast Targets
2018-19 2019-20 2020-21 2021-22 2022-23 2023-24
Selected Performance
Indicators
7. Explosive
Management and
Regulatory
Services
Agencies
Number of Documents/business
plan/pre-feasibility available on
SMEDA's website
Certification Support to Gem
Stone and Jewelery through Gem
stone and jewelry certification
labs
Business Advisory Services to
Gems and jewelry Sector
Licenses renewed (Number of
licenses)
Revenue Targets (Rs. in Million)
Number of Inspections (premises
license issued by Dept. of
Explosives)
Number of Licenses to be issued
575
5500
400
12022
234
4693
1478
600
500
50
10,926
222
5165
1425
625
42000
3000
650
82,000
11,500
650
106,000
15,500
675
Industries and Production Division
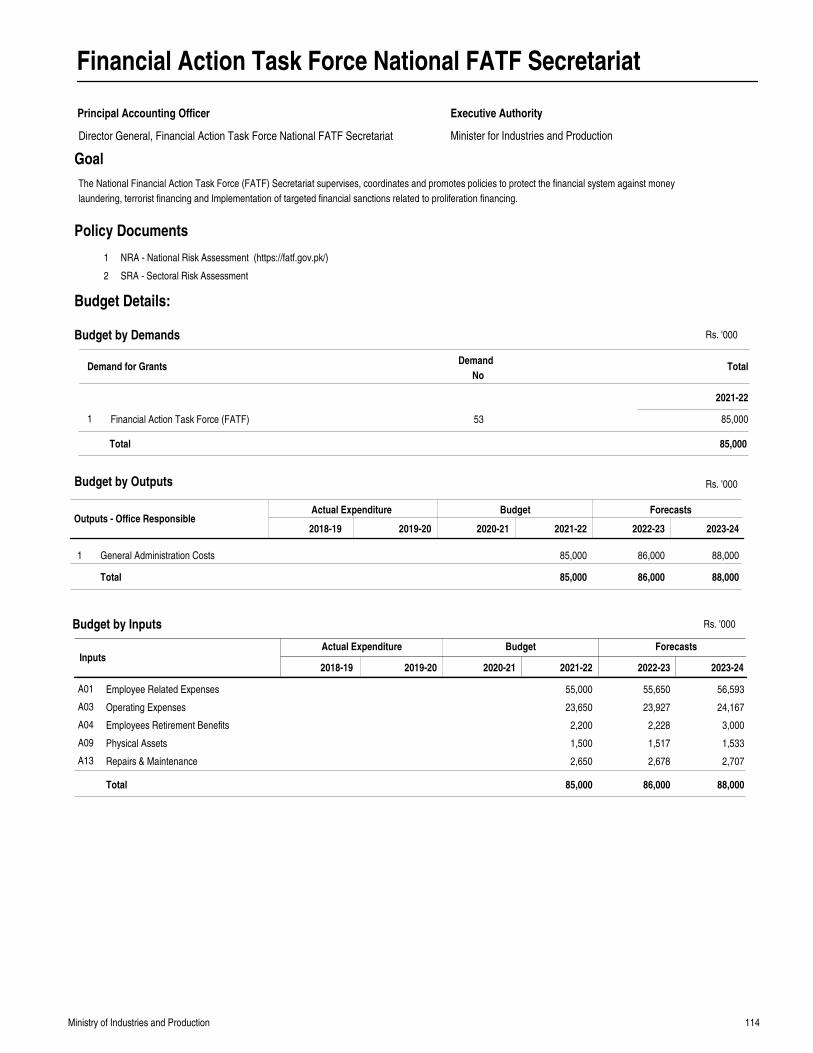
114Ministry of Industries and Production
Financial Action Task Force National FATF Secretariat
Principal Accounting Officer
Minister for Industries and Production
Executive Authority
Goal
Outputs - Office ResponsibleActual Expenditure Budget Forecasts
2018-19 2019-20 2020-21 2021-22 2022-23 2023-24
General Administration Costs 85,000 86,000 88,0001
Total 85,000 86,000 88,000
Rs. '000
InputsActual Expenditure Budget Forecasts
Employee Related Expenses
Operating Expenses
Employees Retirement Benefits
Physical Assets
Repairs & Maintenance
55,000
23,650
2,200
1,500
2,650
55,650
23,927
2,228
1,517
2,678
56,593
24,167
3,000
1,533
2,707
A01
A03
A04
A09
A13
Total 85,000 86,000 88,000
2018-19 2019-20 2020-21 2021-22 2022-23 2023-24
1
2
NRA - National Risk Assessment (https://fatf.gov.pk/)
SRA - Sectoral Risk Assessment
Policy Documents
Budget by Outputs
Budget by Inputs
The National Financial Action Task Force (FATF) Secretariat supervises, coordinates and promotes policies to protect the financial system against money
laundering, terrorist financing and Implementation of targeted financial sanctions related to proliferation financing.
Demand for GrantsDemand
NoTotal
2021-22
Budget by Demands
Financial Action Task Force (FATF)1 53 85,000
85,000Total
Director General, Financial Action Task Force National FATF Secretariat
Budget Details:
Rs. '000
Rs. '000
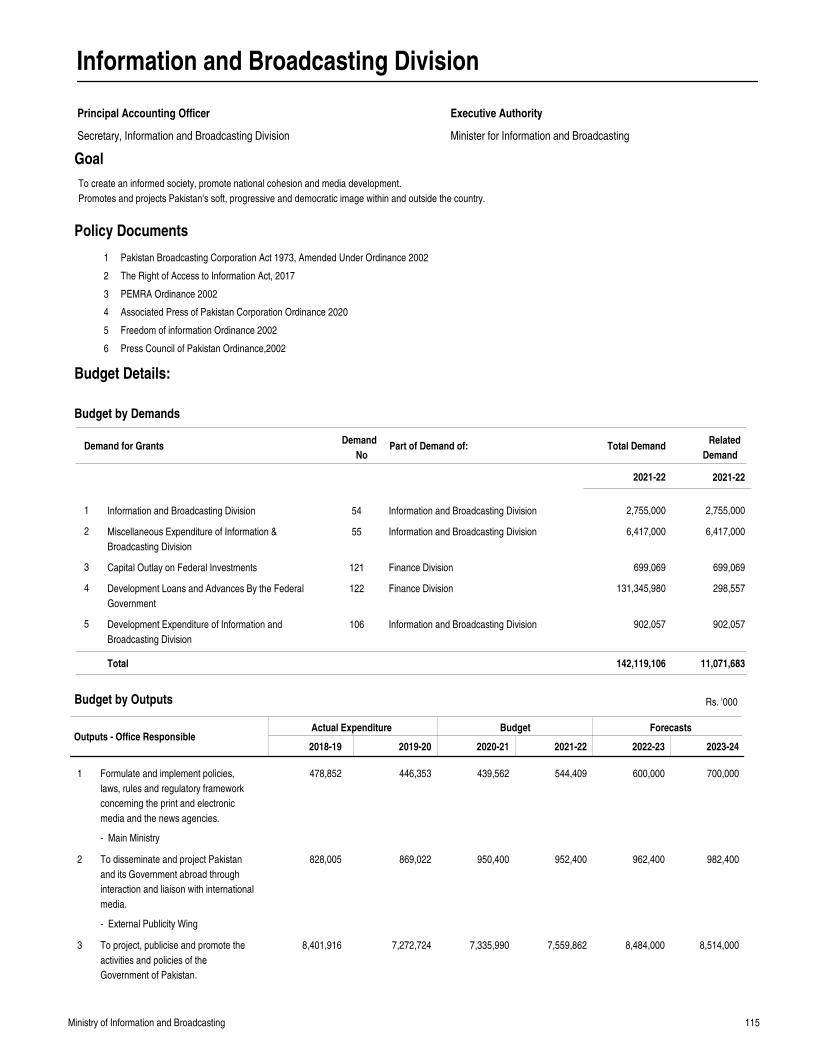
115Ministry of Information and Broadcasting
Information and Broadcasting Division
Principal Accounting Officer
Secretary, Information and Broadcasting Division Minister for Information and Broadcasting
Executive Authority
Goal
Outputs - Office ResponsibleActual Expenditure Budget Forecasts
2018-19 2019-20 2020-21 2021-22 2022-23 2023-24
Formulate and implement policies,
laws, rules and regulatory framework
concerning the print and electronic
media and the news agencies.
To disseminate and project Pakistan
and its Government abroad through
interaction and liaison with international
media.
To project, publicise and promote the
activities and policies of the
Government of Pakistan.
478,852
828,005
8,401,916
446,353
869,022
7,272,724
439,562
950,400
7,335,990
544,409
952,400
7,559,862
600,000
962,400
8,484,000
700,000
982,400
8,514,000
1
2
3
Rs. '000
Information and Broadcasting Division
Miscellaneous Expenditure of Information &
Broadcasting Division
Capital Outlay on Federal Investments
Development Loans and Advances By the Federal
Government
Development Expenditure of Information and
Broadcasting Division
1
2
3
4
5
54
55
121
122
106
Information and Broadcasting Division
Information and Broadcasting Division
Finance Division
Finance Division
Information and Broadcasting Division
2,755,000
6,417,000
699,069
131,345,980
902,057
2,755,000
6,417,000
699,069
298,557
902,057
Demand for GrantsDemand
NoPart of Demand of: Total Demand
2021-22
142,119,106 11,071,683Total
1
2
3
4
5
6
Pakistan Broadcasting Corporation Act 1973, Amended Under Ordinance 2002
The Right of Access to Information Act, 2017
PEMRA Ordinance 2002
Associated Press of Pakistan Corporation Ordinance 2020
Freedom of information Ordinance 2002
Press Council of Pakistan Ordinance,2002
Policy Documents
Budget by Outputs
Budget by Demands
To create an informed society, promote national cohesion and media development.
Promotes and projects Pakistan's soft, progressive and democratic image within and outside the country.
Budget Details:
- Main Ministry
- External Publicity Wing
2021-22
Related
Demand
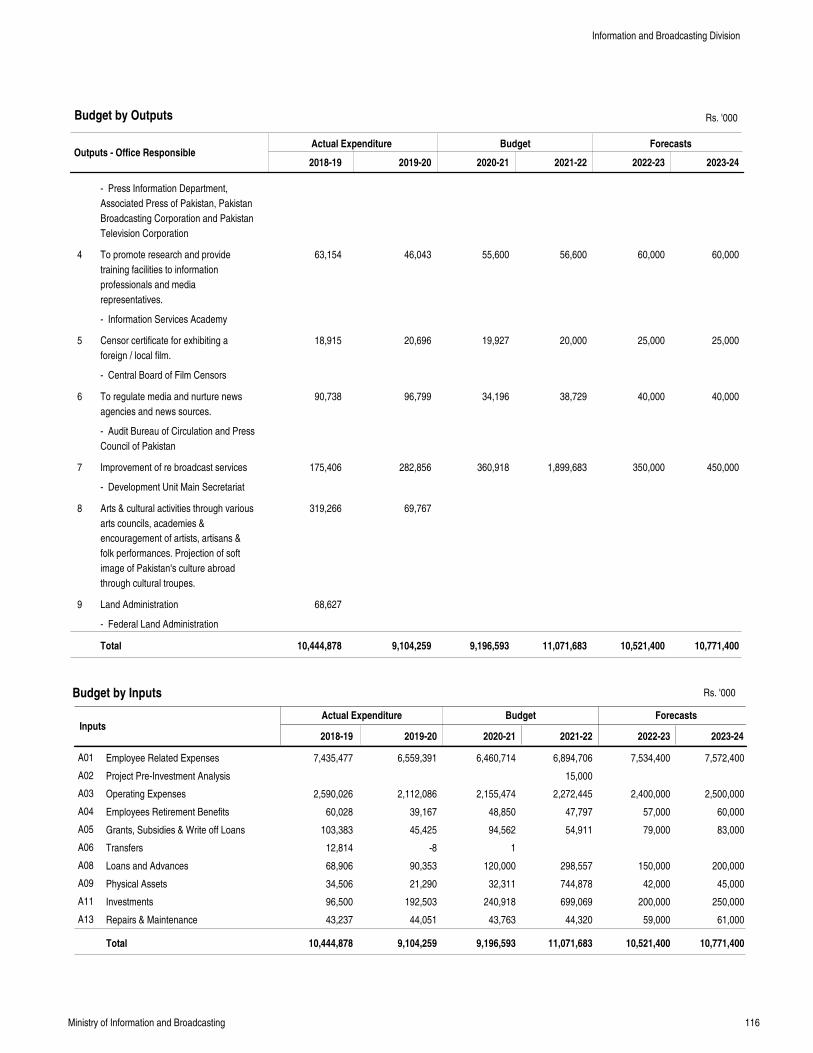
116Ministry of Information and Broadcasting
Outputs - Office ResponsibleActual Expenditure Budget Forecasts
2018-19 2019-20 2020-21 2021-22 2022-23 2023-24
To promote research and provide
training facilities to information
professionals and media
representatives.
Censor certificate for exhibiting a
foreign / local film.
To regulate media and nurture news
agencies and news sources.
Improvement of re broadcast services
Arts & cultural activities through various
arts councils, academies &
encouragement of artists, artisans &
folk performances. Projection of soft
image of Pakistan's culture abroad
through cultural troupes.
Land Administration
63,154
18,915
90,738
175,406
319,266
68,627
46,043
20,696
96,799
282,856
69,767
55,600
19,927
34,196
360,918
56,600
20,000
38,729
1,899,683
60,000
25,000
40,000
350,000
60,000
25,000
40,000
450,000
4
5
6
7
8
9
Total 10,444,878 9,104,259 9,196,593 11,071,683 10,521,400 10,771,400
Rs. '000
InputsActual Expenditure Budget Forecasts
Employee Related Expenses
Project Pre-Investment Analysis
Operating Expenses
Employees Retirement Benefits
Grants, Subsidies & Write off Loans
Transfers
Loans and Advances
Physical Assets
Investments
Repairs & Maintenance
7,435,477
2,590,026
60,028
103,383
12,814
68,906
34,506
96,500
43,237
6,559,391
2,112,086
39,167
45,425
-8
90,353
21,290
192,503
44,051
6,460,714
2,155,474
48,850
94,562
1
120,000
32,311
240,918
43,763
6,894,706
15,000
2,272,445
47,797
54,911
298,557
744,878
699,069
44,320
7,534,400
2,400,000
57,000
79,000
150,000
42,000
200,000
59,000
7,572,400
2,500,000
60,000
83,000
200,000
45,000
250,000
61,000
A01
A02
A03
A04
A05
A06
A08
A09
A11
A13
Total 10,444,878 9,104,259 9,196,593 11,071,683 10,521,400 10,771,400
2018-19 2019-20 2020-21 2021-22 2022-23 2023-24
Budget by Outputs
Budget by Inputs
Information and Broadcasting Division
- Press Information Department,
Associated Press of Pakistan, Pakistan
Broadcasting Corporation and Pakistan
Television Corporation
- Information Services Academy
- Central Board of Film Censors
- Audit Bureau of Circulation and Press
Council of Pakistan
- Development Unit Main Secretariat
- Federal Land Administration
Rs. '000
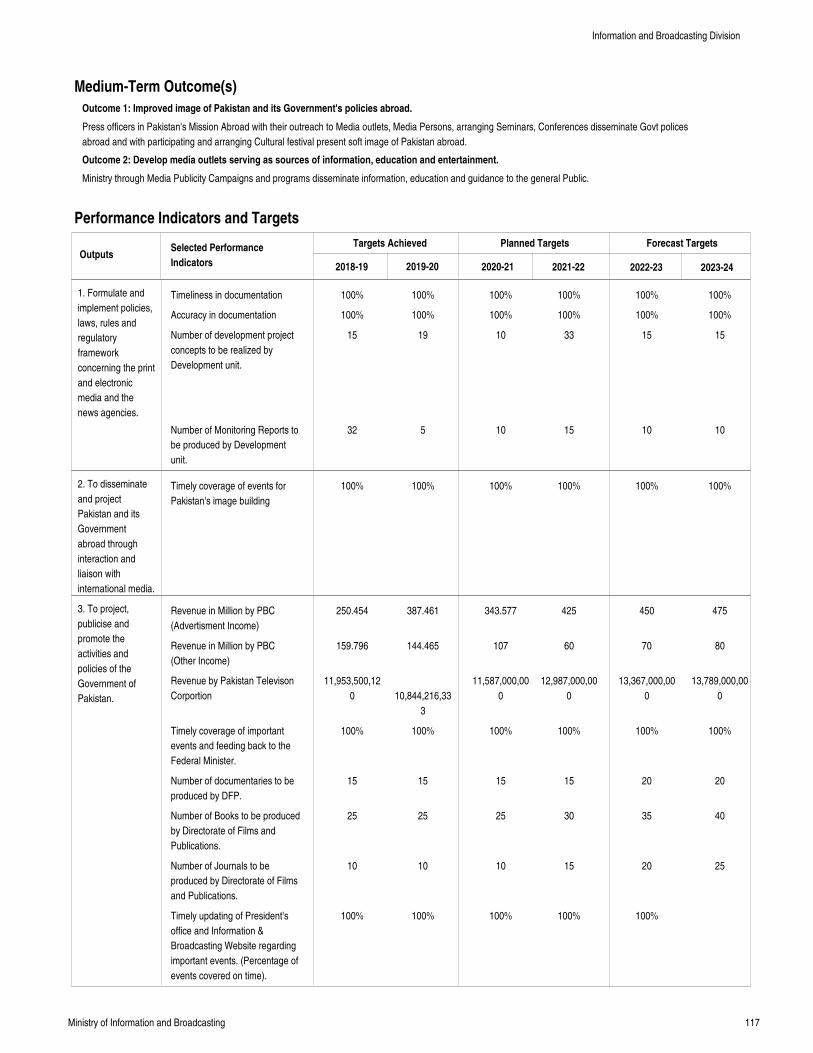
117Ministry of Information and Broadcasting
Press officers in Pakistan's Mission Abroad with their outreach to Media outlets, Media Persons, arranging Seminars, Conferences disseminate Govt polices
abroad and with participating and arranging Cultural festival present soft image of Pakistan abroad.
Ministry through Media Publicity Campaigns and programs disseminate information, education and guidance to the general Public.
Medium-Term Outcome(s)
Outcome 1: Improved image of Pakistan and its Government's policies abroad.
Outcome 2: Develop media outlets serving as sources of information, education and entertainment.
Performance Indicators and Targets
OutputsTargets Achieved Planned Targets Forecast Targets
2018-19 2019-20 2020-21 2021-22 2022-23 2023-24
Selected Performance
Indicators
1. Formulate and
implement policies,
laws, rules and
regulatory
framework
concerning the print
and electronic
media and the
news agencies.
2. To disseminate
and project
Pakistan and its
Government
abroad through
interaction and
liaison with
international media.
3. To project,
publicise and
promote the
activities and
policies of the
Government of
Pakistan.
Timeliness in documentation
Accuracy in documentation
Number of development project
concepts to be realized by
Development unit.
Number of Monitoring Reports to
be produced by Development
unit.
Timely coverage of events for
Pakistan's image building
Revenue in Million by PBC
(Advertisment Income)
Revenue in Million by PBC
(Other Income)
Revenue by Pakistan Televison
Corportion
Timely coverage of important
events and feeding back to the
Federal Minister.
Number of documentaries to be
produced by DFP.
Number of Books to be produced
by Directorate of Films and
Publications.
Number of Journals to be
produced by Directorate of Films
and Publications.
Timely updating of President's
office and Information &
Broadcasting Website regarding
important events. (Percentage of
events covered on time).
100%
100%
15
32
100%
250.454
159.796
11,953,500,12
0
100%
15
25
10
100%
100%
100%
19
5
100%
387.461
144.465
10,844,216,33
3
100%
15
25
10
100%
100%
100%
10
10
100%
343.577
107
11,587,000,00
0
100%
15
25
10
100%
100%
100%
33
15
100%
425
60
12,987,000,00
0
100%
15
30
15
100%
100%
100%
15
10
100%
450
70
13,367,000,00
0
100%
20
35
20
100%
100%
100%
15
10
100%
475
80
13,789,000,00
0
100%
20
40
25
Information and Broadcasting Division
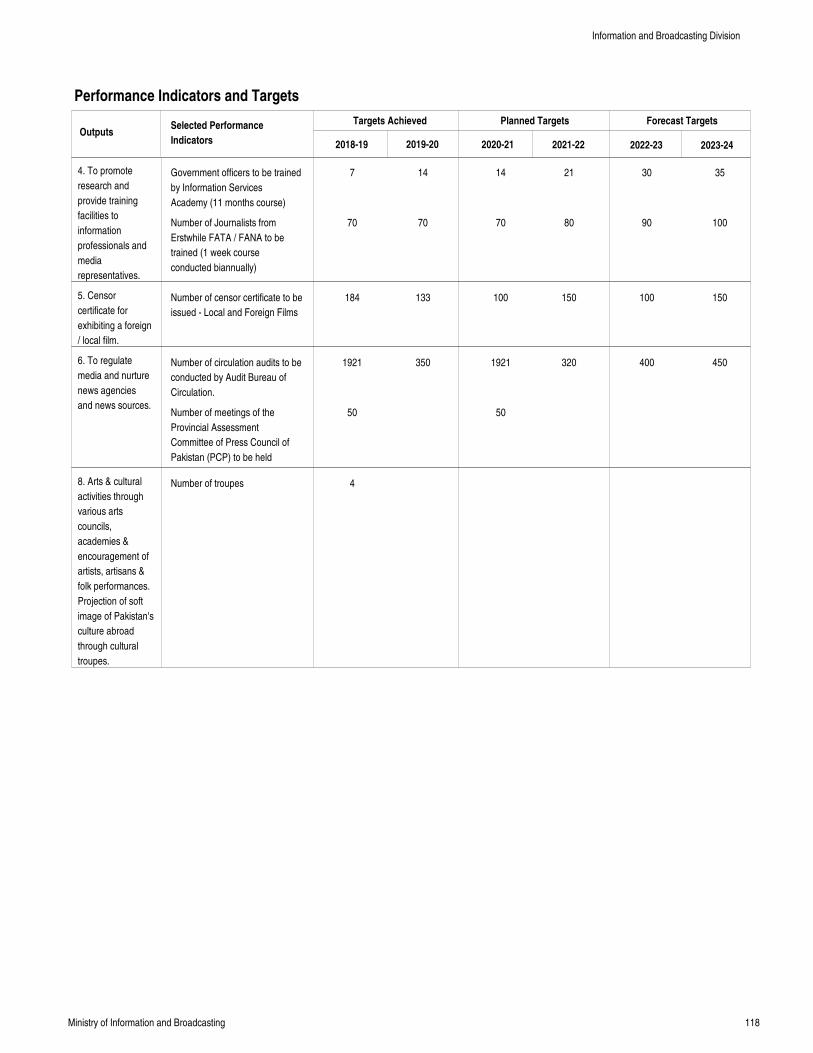
118Ministry of Information and Broadcasting
Performance Indicators and Targets
OutputsTargets Achieved Planned Targets Forecast Targets
2018-19 2019-20 2020-21 2021-22 2022-23 2023-24
Selected Performance
Indicators
4. To promote
research and
provide training
facilities to
information
professionals and
media
representatives.
5. Censor
certificate for
exhibiting a foreign
/ local film.
6. To regulate
media and nurture
news agencies
and news sources.
8. Arts & cultural
activities through
various arts
councils,
academies &
encouragement of
artists, artisans &
folk performances.
Projection of soft
image of Pakistan's
culture abroad
through cultural
troupes.
Government officers to be trained
by Information Services
Academy (11 months course)
Number of Journalists from
Erstwhile FATA / FANA to be
trained (1 week course
conducted biannually)
Number of censor certificate to be
issued - Local and Foreign Films
Number of circulation audits to be
conducted by Audit Bureau of
Circulation.
Number of meetings of the
Provincial Assessment
Committee of Press Council of
Pakistan (PCP) to be held
Number of troupes
7
70
184
1921
50
4
14
70
133
350
14
70
100
1921
50
21
80
150
320
30
90
100
400
35
100
150
450
Information and Broadcasting Division
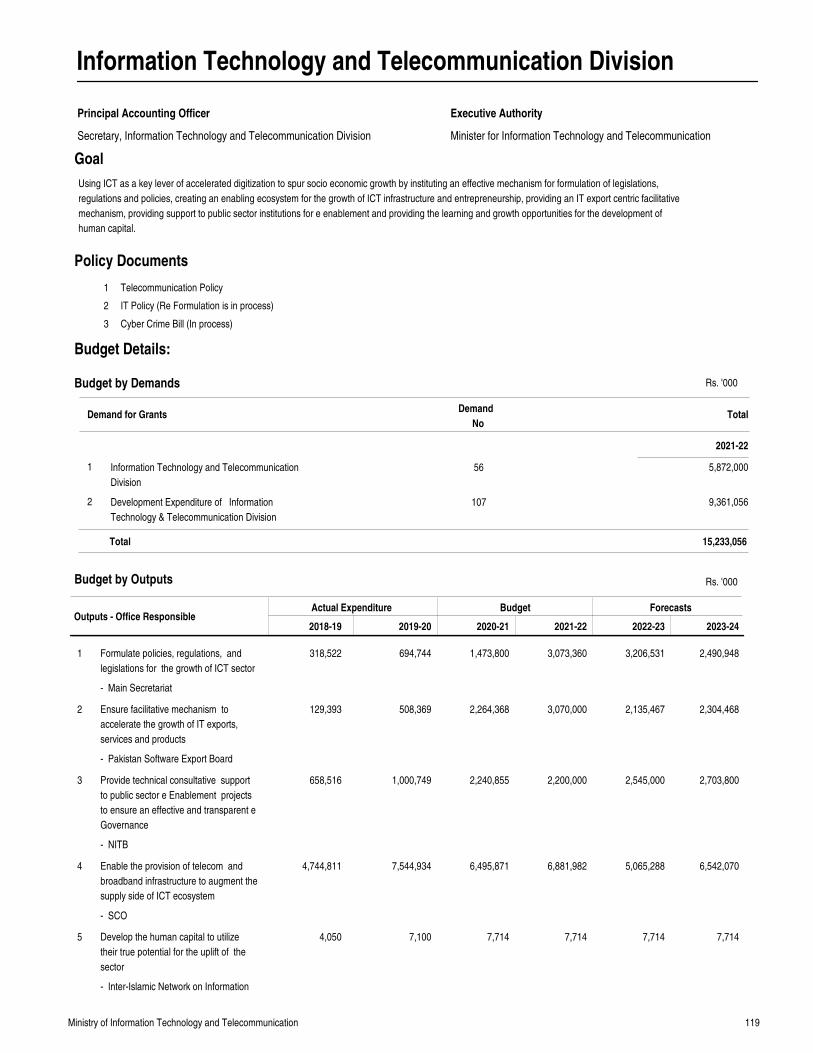
119Ministry of Information Technology and Telecommunication
Information Technology and Telecommunication Division
Principal Accounting Officer
Secretary, Information Technology and Telecommunication Division Minister for Information Technology and Telecommunication
Executive Authority
Goal
Outputs - Office ResponsibleActual Expenditure Budget Forecasts
2018-19 2019-20 2020-21 2021-22 2022-23 2023-24
Formulate policies, regulations, and
legislations for the growth of ICT sector
Ensure facilitative mechanism to
accelerate the growth of IT exports,
services and products
Provide technical consultative support
to public sector e Enablement projects
to ensure an effective and transparent e
Governance
Enable the provision of telecom and
broadband infrastructure to augment the
supply side of ICT ecosystem
Develop the human capital to utilize
their true potential for the uplift of the
sector
318,522
129,393
658,516
4,744,811
4,050
694,744
508,369
1,000,749
7,544,934
7,100
1,473,800
2,264,368
2,240,855
6,495,871
7,714
3,073,360
3,070,000
2,200,000
6,881,982
7,714
3,206,531
2,135,467
2,545,000
5,065,288
7,714
2,490,948
2,304,468
2,703,800
6,542,070
7,714
1
2
3
4
5
Rs. '000
1
2
3
Telecommunication Policy
IT Policy (Re Formulation is in process)
Cyber Crime Bill (In process)
Policy Documents
Budget by Outputs
Using ICT as a key lever of accelerated digitization to spur socio economic growth by instituting an effective mechanism for formulation of legislations,
regulations and policies, creating an enabling ecosystem for the growth of ICT infrastructure and entrepreneurship, providing an IT export centric facilitative
mechanism, providing support to public sector institutions for e enablement and providing the learning and growth opportunities for the development of
human capital.
Demand for GrantsDemand
NoTotal
2021-22
Budget by Demands
Information Technology and Telecommunication
Division
Development Expenditure of Information
Technology & Telecommunication Division
1
2
56
107
5,872,000
9,361,056
15,233,056Total
Budget Details:
- Main Secretariat
- Pakistan Software Export Board
- NITB
- SCO
- Inter-Islamic Network on Information
Rs. '000
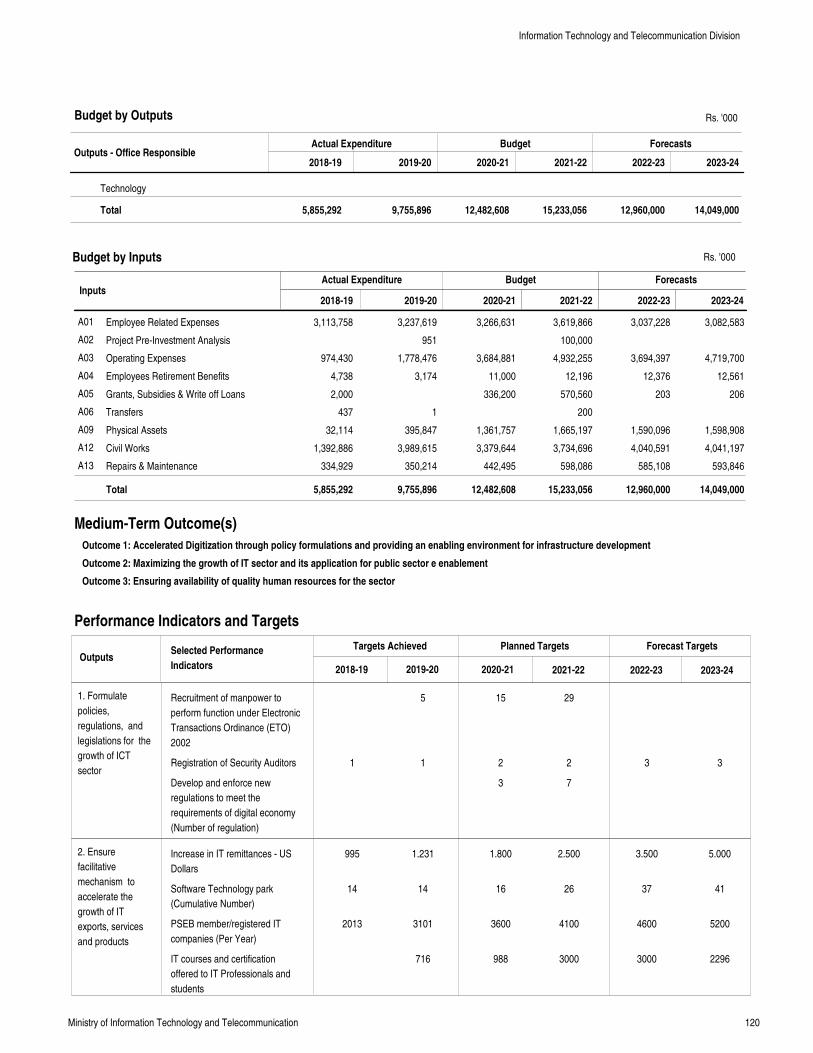
120Ministry of Information Technology and Telecommunication
Outputs - Office ResponsibleActual Expenditure Budget Forecasts
2018-19 2019-20 2020-21 2021-22 2022-23 2023-24
Total 5,855,292 9,755,896 12,482,608 15,233,056 12,960,000 14,049,000
Rs. '000
InputsActual Expenditure Budget Forecasts
Employee Related Expenses
Project Pre-Investment Analysis
Operating Expenses
Employees Retirement Benefits
Grants, Subsidies & Write off Loans
Transfers
Physical Assets
Civil Works
Repairs & Maintenance
3,113,758
974,430
4,738
2,000
437
32,114
1,392,886
334,929
3,237,619
951
1,778,476
3,174
1
395,847
3,989,615
350,214
3,266,631
3,684,881
11,000
336,200
1,361,757
3,379,644
442,495
3,619,866
100,000
4,932,255
12,196
570,560
200
1,665,197
3,734,696
598,086
3,037,228
3,694,397
12,376
203
1,590,096
4,040,591
585,108
3,082,583
4,719,700
12,561
206
1,598,908
4,041,197
593,846
A01
A02
A03
A04
A05
A06
A09
A12
A13
Total 5,855,292 9,755,896 12,482,608 15,233,056 12,960,000 14,049,000
2018-19 2019-20 2020-21 2021-22 2022-23 2023-24
Medium-Term Outcome(s)
Outcome 1: Accelerated Digitization through policy formulations and providing an enabling environment for infrastructure development
Outcome 2: Maximizing the growth of IT sector and its application for public sector e enablement
Outcome 3: Ensuring availability of quality human resources for the sector
Performance Indicators and Targets
OutputsTargets Achieved Planned Targets Forecast Targets
2018-19 2019-20 2020-21 2021-22 2022-23 2023-24
Selected Performance
Indicators
1. Formulate
policies,
regulations, and
legislations for the
growth of ICT
sector
2. Ensure
facilitative
mechanism to
accelerate the
growth of IT
exports, services
and products
Budget by Outputs
Budget by Inputs
Recruitment of manpower to
perform function under Electronic
Transactions Ordinance (ETO)
2002
Registration of Security Auditors
Develop and enforce new
regulations to meet the
requirements of digital economy
(Number of regulation)
Increase in IT remittances - US
Dollars
Software Technology park
(Cumulative Number)
PSEB member/registered IT
companies (Per Year)
IT courses and certification
offered to IT Professionals and
students
1
995
14
2013
5
1
1.231
14
3101
716
15
2
3
1.800
16
3600
988
29
2
7
2.500
26
4100
3000
3
3.500
37
4600
3000
3
5.000
41
5200
2296
Information Technology and Telecommunication Division
Technology
Rs. '000
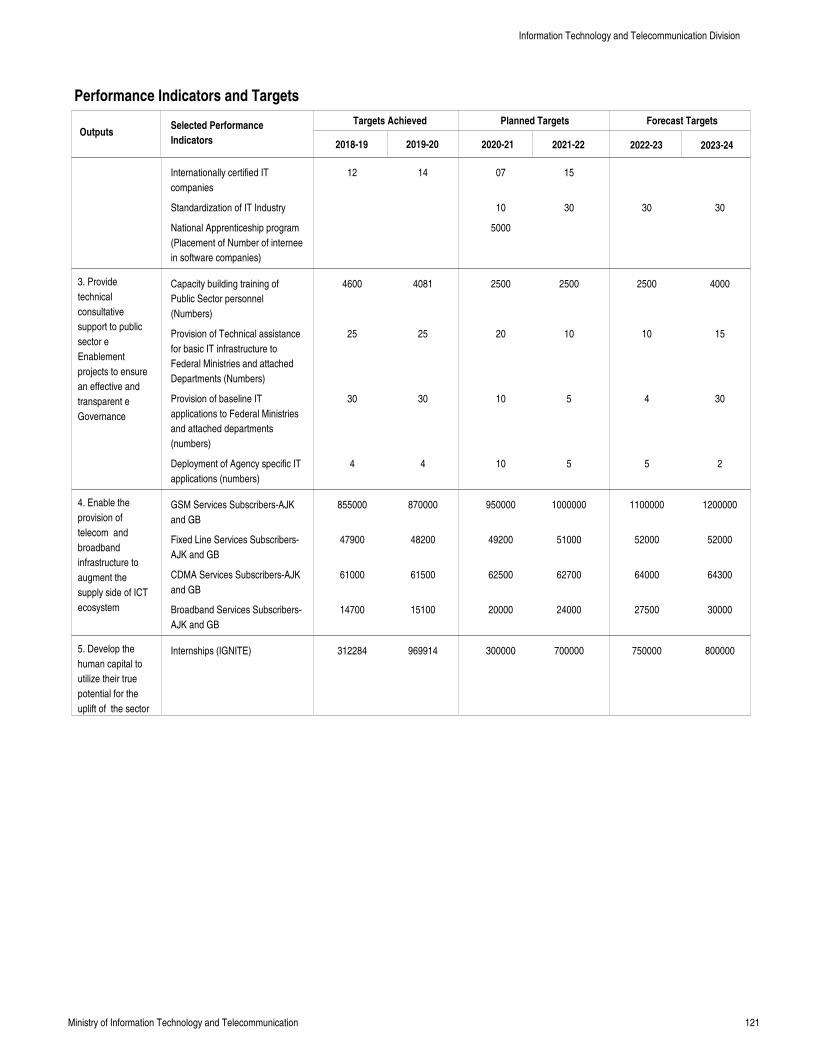
121Ministry of Information Technology and Telecommunication
Performance Indicators and Targets
OutputsTargets Achieved Planned Targets Forecast Targets
2018-19 2019-20 2020-21 2021-22 2022-23 2023-24
Selected Performance
Indicators
3. Provide
technical
consultative
support to public
sector e
Enablement
projects to ensure
an effective and
transparent e
Governance
4. Enable the
provision of
telecom and
broadband
infrastructure to
augment the
supply side of ICT
ecosystem
5. Develop the
human capital to
utilize their true
potential for the
uplift of the sector
Internationally certified IT
companies
Standardization of IT Industry
National Apprenticeship program
(Placement of Number of internee
in software companies)
Capacity building training of
Public Sector personnel
(Numbers)
Provision of Technical assistance
for basic IT infrastructure to
Federal Ministries and attached
Departments (Numbers)
Provision of baseline IT
applications to Federal Ministries
and attached departments
(numbers)
Deployment of Agency specific IT
applications (numbers)
GSM Services Subscribers-AJK
and GB
Fixed Line Services Subscribers-
AJK and GB
CDMA Services Subscribers-AJK
and GB
Broadband Services Subscribers-
AJK and GB
Internships (IGNITE)
12
4600
25
30
4
855000
47900
61000
14700
312284
14
4081
25
30
4
870000
48200
61500
15100
969914
07
10
5000
2500
20
10
10
950000
49200
62500
20000
300000
15
30
2500
10
5
5
1000000
51000
62700
24000
700000
30
2500
10
4
5
1100000
52000
64000
27500
750000
30
4000
15
30
2
1200000
52000
64300
30000
800000
Information Technology and Telecommunication Division
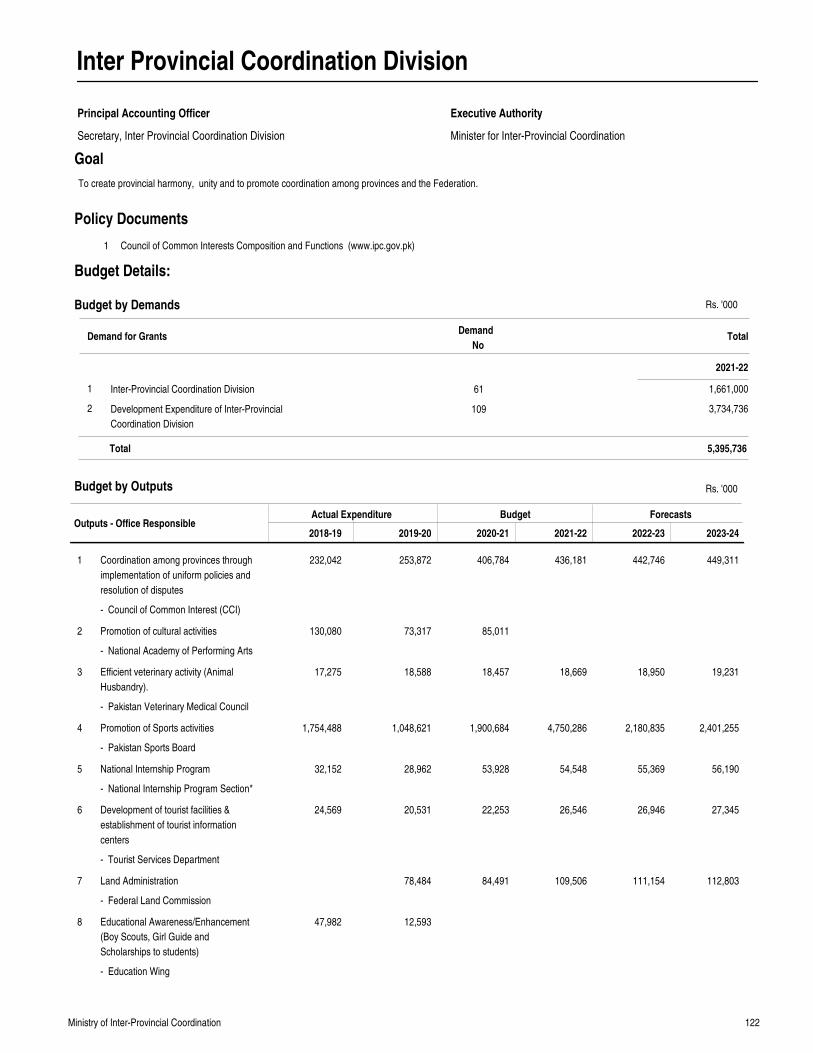
122Ministry of Inter-Provincial Coordination
Inter Provincial Coordination Division
Principal Accounting Officer
Secretary, Inter Provincial Coordination Division Minister for Inter-Provincial Coordination
Executive Authority
Goal
Outputs - Office ResponsibleActual Expenditure Budget Forecasts
2018-19 2019-20 2020-21 2021-22 2022-23 2023-24
Coordination among provinces through
implementation of uniform policies and
resolution of disputes
Promotion of cultural activities
Efficient veterinary activity (Animal
Husbandry).
Promotion of Sports activities
National Internship Program
Development of tourist facilities &
establishment of tourist information
centers
Land Administration
Educational Awareness/Enhancement
(Boy Scouts, Girl Guide and
Scholarships to students)
232,042
130,080
17,275
1,754,488
32,152
24,569
47,982
253,872
73,317
18,588
1,048,621
28,962
20,531
78,484
12,593
406,784
85,011
18,457
1,900,684
53,928
22,253
84,491
436,181
18,669
4,750,286
54,548
26,546
109,506
442,746
18,950
2,180,835
55,369
26,946
111,154
449,311
19,231
2,401,255
56,190
27,345
112,803
1
2
3
4
5
6
7
8
Rs. '000
1 Council of Common Interests Composition and Functions (www.ipc.gov.pk)
Policy Documents
Budget by Outputs
To create provincial harmony, unity and to promote coordination among provinces and the Federation.
Demand for GrantsDemand
NoTotal
2021-22
Budget by Demands
Inter-Provincial Coordination Division
Development Expenditure of Inter-Provincial
Coordination Division
1
2
61
109
1,661,000
3,734,736
5,395,736Total
Budget Details:
- Council of Common Interest (CCI)
- National Academy of Performing Arts
- Pakistan Veterinary Medical Council
- Pakistan Sports Board
- National Internship Program Section*
- Tourist Services Department
- Federal Land Commission
- Education Wing
Rs. '000
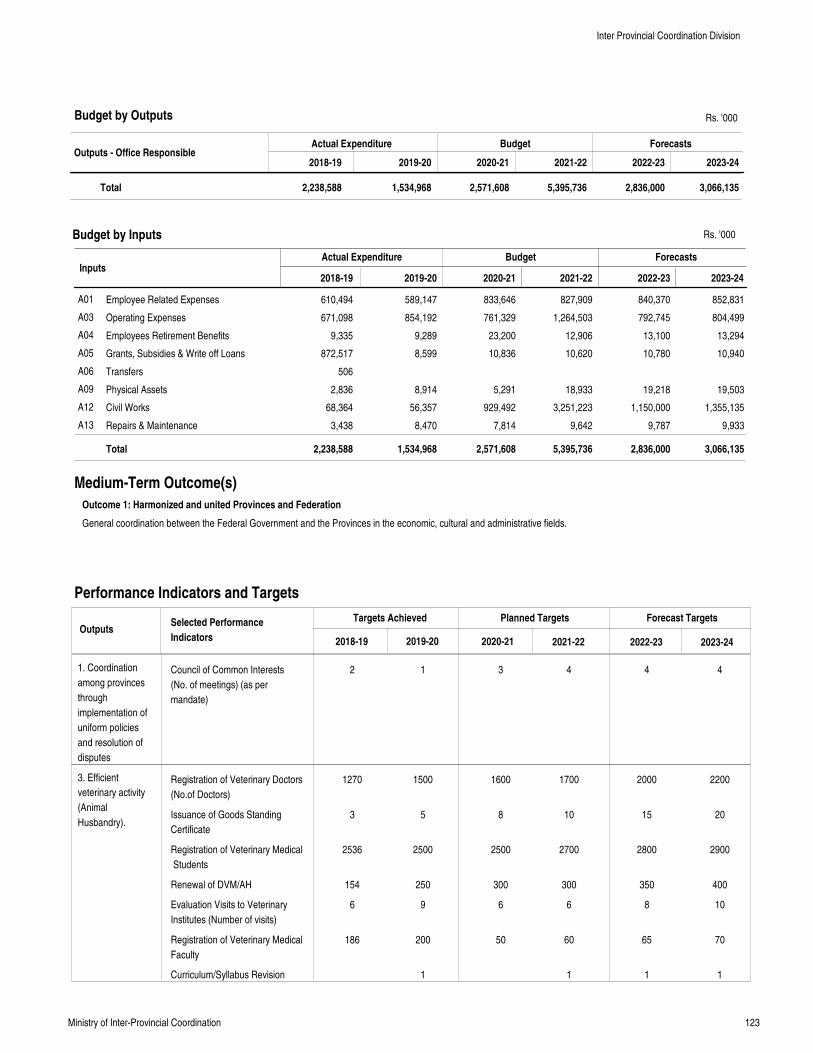
123Ministry of Inter-Provincial Coordination
Outputs - Office ResponsibleActual Expenditure Budget Forecasts
2018-19 2019-20 2020-21 2021-22 2022-23 2023-24
Total 2,238,588 1,534,968 2,571,608 5,395,736 2,836,000 3,066,135
Rs. '000
InputsActual Expenditure Budget Forecasts
Employee Related Expenses
Operating Expenses
Employees Retirement Benefits
Grants, Subsidies & Write off Loans
Transfers
Physical Assets
Civil Works
Repairs & Maintenance
610,494
671,098
9,335
872,517
506
2,836
68,364
3,438
589,147
854,192
9,289
8,599
8,914
56,357
8,470
833,646
761,329
23,200
10,836
5,291
929,492
7,814
827,909
1,264,503
12,906
10,620
18,933
3,251,223
9,642
840,370
792,745
13,100
10,780
19,218
1,150,000
9,787
852,831
804,499
13,294
10,940
19,503
1,355,135
9,933
A01
A03
A04
A05
A06
A09
A12
A13
Total 2,238,588 1,534,968 2,571,608 5,395,736 2,836,000 3,066,135
2018-19 2019-20 2020-21 2021-22 2022-23 2023-24
General coordination between the Federal Government and the Provinces in the economic, cultural and administrative fields.
Medium-Term Outcome(s)
Outcome 1: Harmonized and united Provinces and Federation
Performance Indicators and Targets
OutputsTargets Achieved Planned Targets Forecast Targets
2018-19 2019-20 2020-21 2021-22 2022-23 2023-24
Selected Performance
Indicators
1. Coordination
among provinces
through
implementation of
uniform policies
and resolution of
disputes
3. Efficient
veterinary activity
(Animal
Husbandry).
Budget by Outputs
Budget by Inputs
Council of Common Interests
(No. of meetings) (as per
mandate)
Registration of Veterinary Doctors
(No.of Doctors)
Issuance of Goods Standing
Certificate
Registration of Veterinary Medical
Students
Renewal of DVM/AH
Evaluation Visits to Veterinary
Institutes (Number of visits)
Registration of Veterinary Medical
Faculty
Curriculum/Syllabus Revision
2
1270
3
2536
154
6
186
1
1500
5
2500
250
9
200
1
3
1600
8
2500
300
6
50
4
1700
10
2700
300
6
60
1
4
2000
15
2800
350
8
65
1
4
2200
20
2900
400
10
70
1
Inter Provincial Coordination Division
Rs. '000
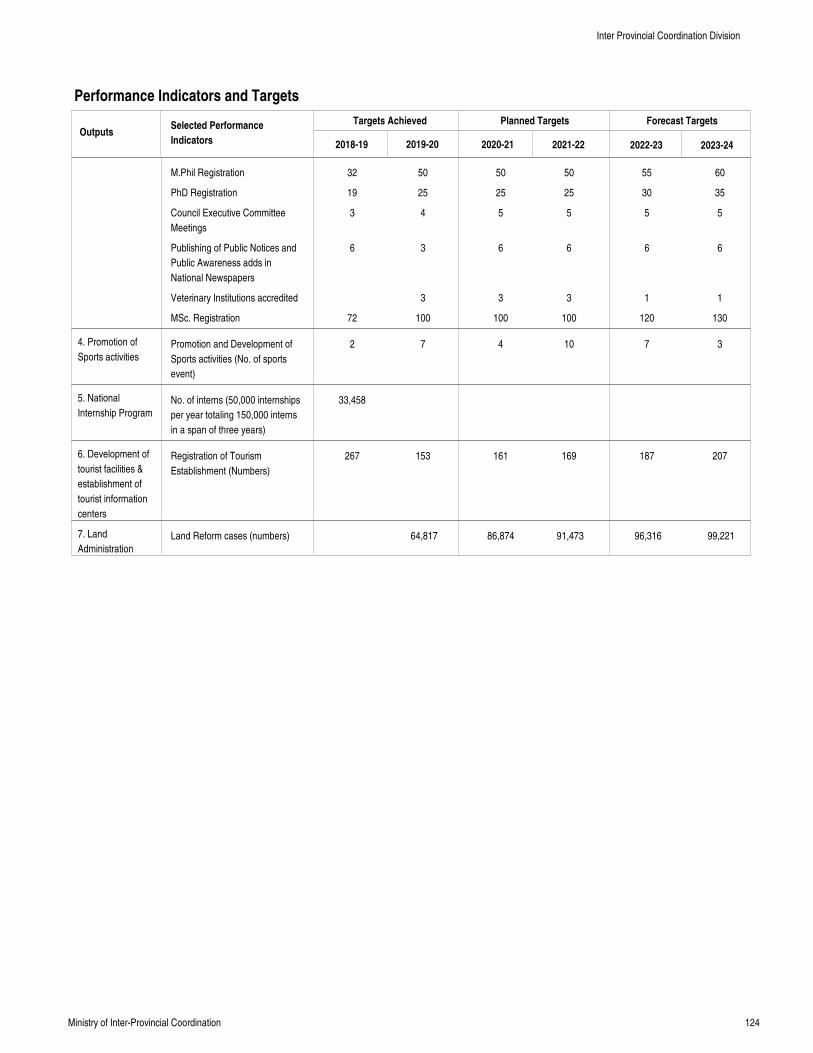
124Ministry of Inter-Provincial Coordination
Performance Indicators and Targets
OutputsTargets Achieved Planned Targets Forecast Targets
2018-19 2019-20 2020-21 2021-22 2022-23 2023-24
Selected Performance
Indicators
4. Promotion of
Sports activities
5. National
Internship Program
6. Development of
tourist facilities &
establishment of
tourist information
centers
7. Land
Administration
M.Phil Registration
PhD Registration
Council Executive Committee
Meetings
Publishing of Public Notices and
Public Awareness adds in
National Newspapers
Veterinary Institutions accredited
MSc. Registration
Promotion and Development of
Sports activities (No. of sports
event)
No. of interns (50,000 internships
per year totaling 150,000 interns
in a span of three years)
Registration of Tourism
Establishment (Numbers)
Land Reform cases (numbers)
32
19
3
6
72
2
33,458
267
50
25
4
3
3
100
7
153
64,817
50
25
5
6
3
100
4
161
86,874
50
25
5
6
3
100
10
169
91,473
55
30
5
6
1
120
7
187
96,316
60
35
5
6
1
130
3
207
99,221
Inter Provincial Coordination Division
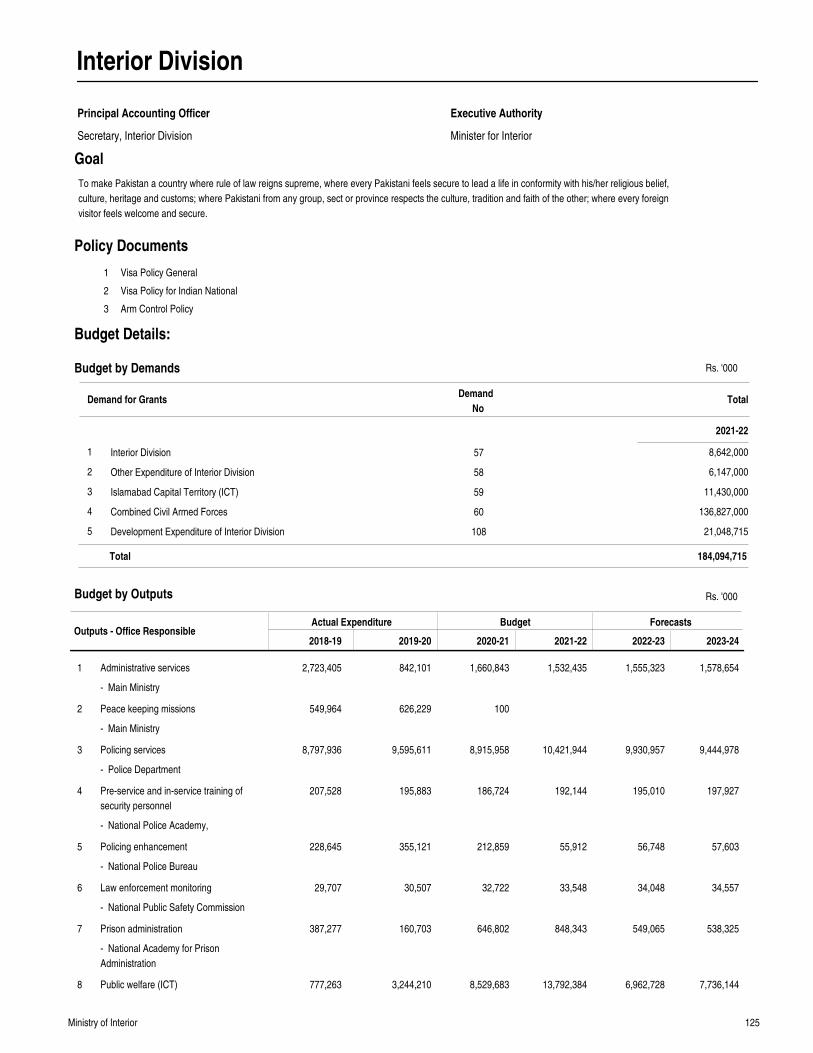
125Ministry of Interior
Interior Division
Principal Accounting Officer
Secretary, Interior Division Minister for Interior
Executive Authority
Goal
Outputs - Office ResponsibleActual Expenditure Budget Forecasts
2018-19 2019-20 2020-21 2021-22 2022-23 2023-24
Administrative services
Peace keeping missions
Policing services
Pre-service and in-service training of
security personnel
Policing enhancement
Law enforcement monitoring
Prison administration
Public welfare (ICT)
2,723,405
549,964
8,797,936
207,528
228,645
29,707
387,277
777,263
842,101
626,229
9,595,611
195,883
355,121
30,507
160,703
3,244,210
1,660,843
100
8,915,958
186,724
212,859
32,722
646,802
8,529,683
1,532,435
10,421,944
192,144
55,912
33,548
848,343
13,792,384
1,555,323
9,930,957
195,010
56,748
34,048
549,065
6,962,728
1,578,654
9,444,978
197,927
57,603
34,557
538,325
7,736,144
1
2
3
4
5
6
7
8
Rs. '000
1
2
3
Visa Policy General
Visa Policy for Indian National
Arm Control Policy
Policy Documents
Budget by Outputs
To make Pakistan a country where rule of law reigns supreme, where every Pakistani feels secure to lead a life in conformity with his/her religious belief,
culture, heritage and customs; where Pakistani from any group, sect or province respects the culture, tradition and faith of the other; where every foreign
visitor feels welcome and secure.
Demand for GrantsDemand
NoTotal
2021-22
Budget by Demands
Interior Division
Other Expenditure of Interior Division
Islamabad Capital Territory (ICT)
Combined Civil Armed Forces
Development Expenditure of Interior Division
1
2
3
4
5
57
58
59
60
108
8,642,000
6,147,000
11,430,000
136,827,000
21,048,715
184,094,715Total
Budget Details:
- Main Ministry
- Main Ministry
- Police Department
- National Police Academy,
- National Police Bureau
- National Public Safety Commission
- National Academy for Prison
Administration
Rs. '000
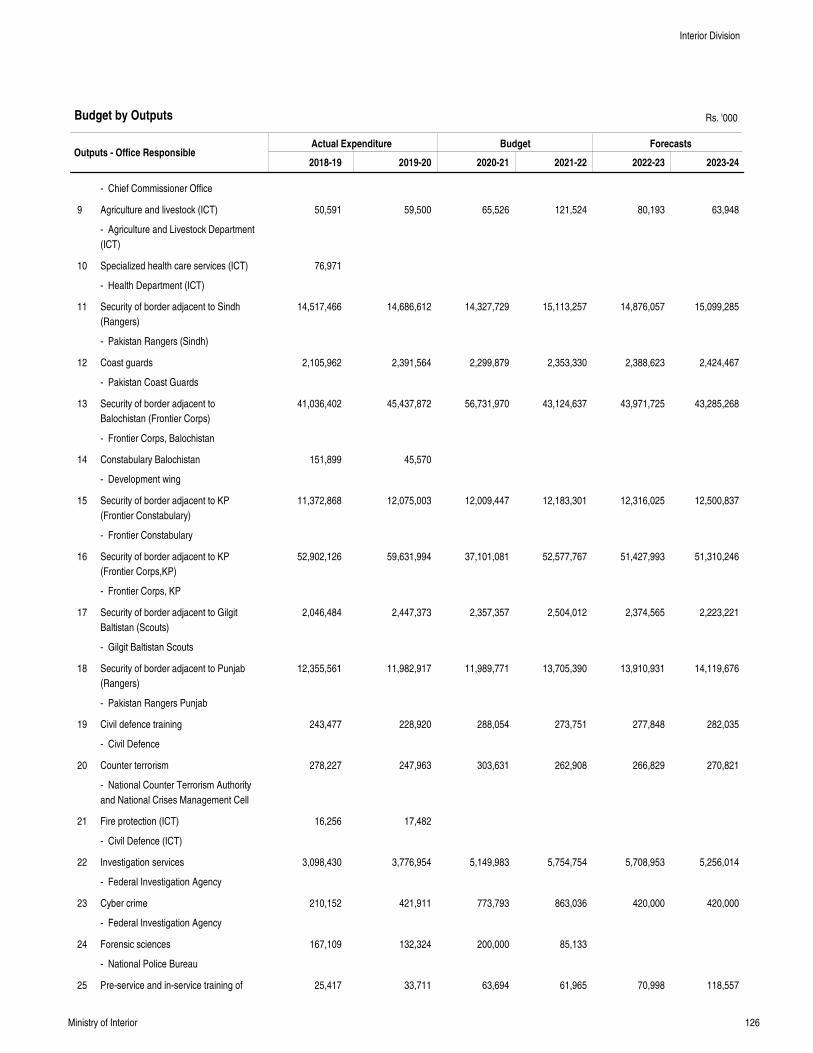
126Ministry of Interior
Outputs - Office ResponsibleActual Expenditure Budget Forecasts
2018-19 2019-20 2020-21 2021-22 2022-23 2023-24
Agriculture and livestock (ICT)
Specialized health care services (ICT)
Security of border adjacent to Sindh
(Rangers)
Coast guards
Security of border adjacent to
Balochistan (Frontier Corps)
Constabulary Balochistan
Security of border adjacent to KP
(Frontier Constabulary)
Security of border adjacent to KP
(Frontier Corps,KP)
Security of border adjacent to Gilgit
Baltistan (Scouts)
Security of border adjacent to Punjab
(Rangers)
Civil defence training
Counter terrorism
Fire protection (ICT)
Investigation services
Cyber crime
Forensic sciences
Pre-service and in-service training of
50,591
76,971
14,517,466
2,105,962
41,036,402
151,899
11,372,868
52,902,126
2,046,484
12,355,561
243,477
278,227
16,256
3,098,430
210,152
167,109
25,417
59,500
14,686,612
2,391,564
45,437,872
45,570
12,075,003
59,631,994
2,447,373
11,982,917
228,920
247,963
17,482
3,776,954
421,911
132,324
33,711
65,526
14,327,729
2,299,879
56,731,970
12,009,447
37,101,081
2,357,357
11,989,771
288,054
303,631
5,149,983
773,793
200,000
63,694
121,524
15,113,257
2,353,330
43,124,637
12,183,301
52,577,767
2,504,012
13,705,390
273,751
262,908
5,754,754
863,036
85,133
61,965
80,193
14,876,057
2,388,623
43,971,725
12,316,025
51,427,993
2,374,565
13,910,931
277,848
266,829
5,708,953
420,000
70,998
63,948
15,099,285
2,424,467
43,285,268
12,500,837
51,310,246
2,223,221
14,119,676
282,035
270,821
5,256,014
420,000
118,557
9
10
11
12
13
14
15
16
17
18
19
20
21
22
23
24
25
Rs. '000Budget by Outputs
Interior Division
- Chief Commissioner Office
- Agriculture and Livestock Department
(ICT)
- Health Department (ICT)
- Pakistan Rangers (Sindh)
- Pakistan Coast Guards
- Frontier Corps, Balochistan
- Development wing
- Frontier Constabulary
- Frontier Corps, KP
- Gilgit Baltistan Scouts
- Pakistan Rangers Punjab
- Civil Defence
- National Counter Terrorism Authority
and National Crises Management Cell
- Civil Defence (ICT)
- Federal Investigation Agency
- Federal Investigation Agency
- National Police Bureau
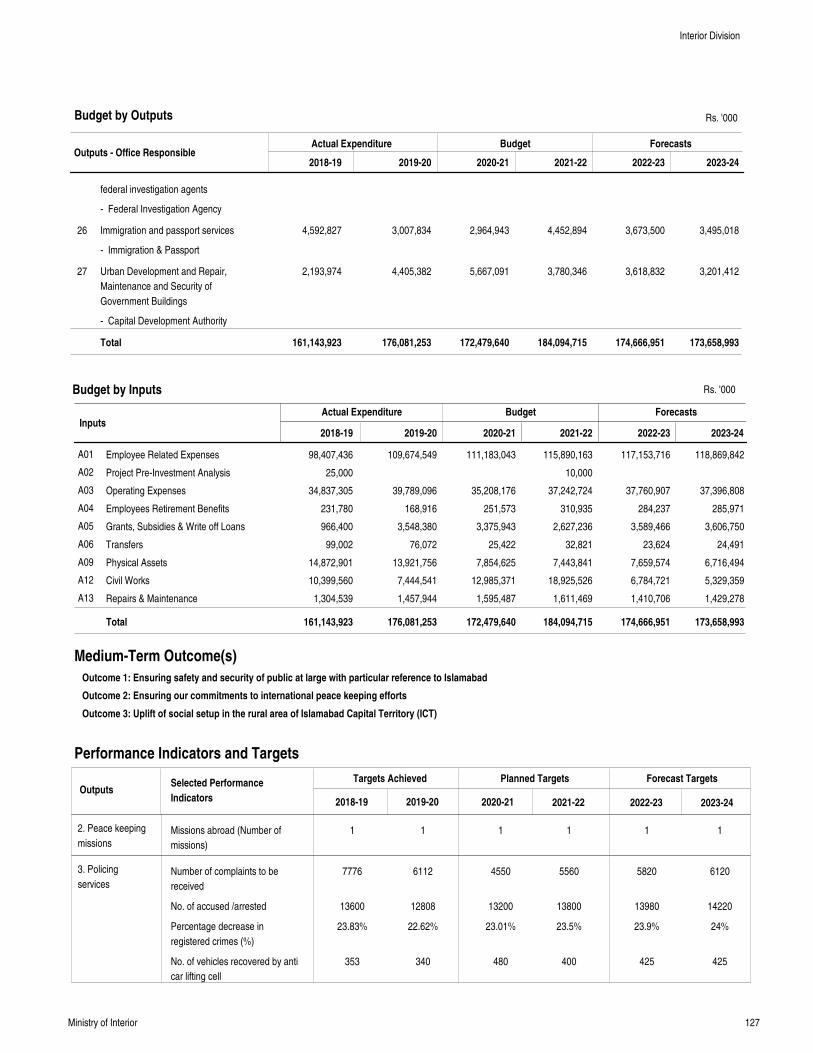
127Ministry of Interior
Outputs - Office ResponsibleActual Expenditure Budget Forecasts
2018-19 2019-20 2020-21 2021-22 2022-23 2023-24
federal investigation agents
Immigration and passport services
Urban Development and Repair,
Maintenance and Security of
Government Buildings
4,592,827
2,193,974
3,007,834
4,405,382
2,964,943
5,667,091
4,452,894
3,780,346
3,673,500
3,618,832
3,495,018
3,201,412
26
27
Total 161,143,923 176,081,253 172,479,640 184,094,715 174,666,951 173,658,993
Rs. '000
InputsActual Expenditure Budget Forecasts
Employee Related Expenses
Project Pre-Investment Analysis
Operating Expenses
Employees Retirement Benefits
Grants, Subsidies & Write off Loans
Transfers
Physical Assets
Civil Works
Repairs & Maintenance
98,407,436
25,000
34,837,305
231,780
966,400
99,002
14,872,901
10,399,560
1,304,539
109,674,549
39,789,096
168,916
3,548,380
76,072
13,921,756
7,444,541
1,457,944
111,183,043
35,208,176
251,573
3,375,943
25,422
7,854,625
12,985,371
1,595,487
115,890,163
10,000
37,242,724
310,935
2,627,236
32,821
7,443,841
18,925,526
1,611,469
117,153,716
37,760,907
284,237
3,589,466
23,624
7,659,574
6,784,721
1,410,706
118,869,842
37,396,808
285,971
3,606,750
24,491
6,716,494
5,329,359
1,429,278
A01
A02
A03
A04
A05
A06
A09
A12
A13
Total 161,143,923 176,081,253 172,479,640 184,094,715 174,666,951 173,658,993
2018-19 2019-20 2020-21 2021-22 2022-23 2023-24
Medium-Term Outcome(s)
Outcome 1: Ensuring safety and security of public at large with particular reference to Islamabad
Outcome 2: Ensuring our commitments to international peace keeping efforts
Outcome 3: Uplift of social setup in the rural area of Islamabad Capital Territory (ICT)
Performance Indicators and Targets
OutputsTargets Achieved Planned Targets Forecast Targets
2018-19 2019-20 2020-21 2021-22 2022-23 2023-24
Selected Performance
Indicators
2. Peace keeping
missions
3. Policing
services
Budget by Outputs
Budget by Inputs
Missions abroad (Number of
missions)
Number of complaints to be
received
No. of accused /arrested
Percentage decrease in
registered crimes (%)
No. of vehicles recovered by anti
car lifting cell
1
7776
13600
23.83%
353
1
6112
12808
22.62%
340
1
4550
13200
23.01%
480
1
5560
13800
23.5%
400
1
5820
13980
23.9%
425
1
6120
14220
24%
425
Interior Division
- Federal Investigation Agency
- Immigration & Passport
- Capital Development Authority
Rs. '000
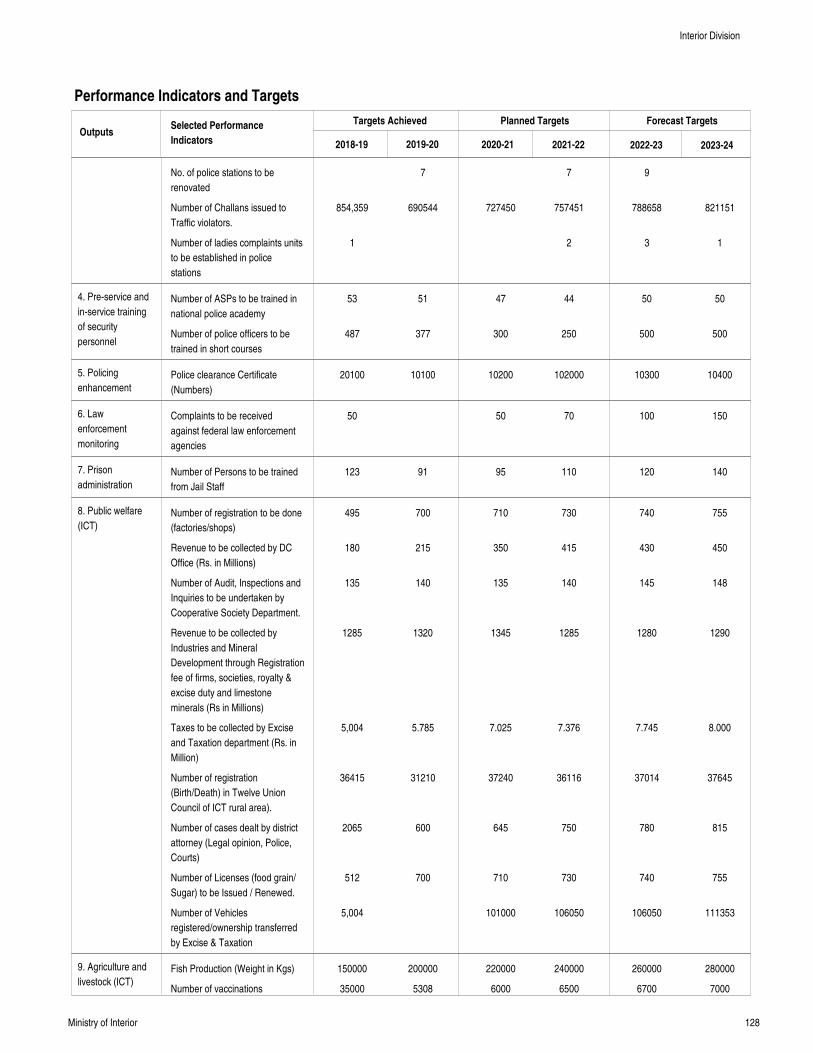
128Ministry of Interior
Performance Indicators and Targets
OutputsTargets Achieved Planned Targets Forecast Targets
2018-19 2019-20 2020-21 2021-22 2022-23 2023-24
Selected Performance
Indicators
4. Pre-service and
in-service training
of security
personnel
5. Policing
enhancement
6. Law
enforcement
monitoring
7. Prison
administration
8. Public welfare
(ICT)
9. Agriculture and
livestock (ICT)
No. of police stations to be
renovated
Number of Challans issued to
Traffic violators.
Number of ladies complaints units
to be established in police
stations
Number of ASPs to be trained in
national police academy
Number of police officers to be
trained in short courses
Police clearance Certificate
(Numbers)
Complaints to be received
against federal law enforcement
agencies
Number of Persons to be trained
from Jail Staff
Number of registration to be done
(factories/shops)
Revenue to be collected by DC
Office (Rs. in Millions)
Number of Audit, Inspections and
Inquiries to be undertaken by
Cooperative Society Department.
Revenue to be collected by
Industries and Mineral
Development through Registration
fee of firms, societies, royalty &
excise duty and limestone
minerals (Rs in Millions)
Taxes to be collected by Excise
and Taxation department (Rs. in
Million)
Number of registration
(Birth/Death) in Twelve Union
Council of ICT rural area).
Number of cases dealt by district
attorney (Legal opinion, Police,
Courts)
Number of Licenses (food grain/
Sugar) to be Issued / Renewed.
Number of Vehicles
registered/ownership transferred
by Excise & Taxation
Fish Production (Weight in Kgs)
Number of vaccinations
854,359
1
53
487
20100
50
123
495
180
135
1285
5,004
36415
2065
512
5,004
150000
35000
7
690544
51
377
10100
91
700
215
140
1320
5.785
31210
600
700
200000
5308
727450
47
300
10200
50
95
710
350
135
1345
7.025
37240
645
710
101000
220000
6000
7
757451
2
44
250
102000
70
110
730
415
140
1285
7.376
36116
750
730
106050
240000
6500
9
788658
3
50
500
10300
100
120
740
430
145
1280
7.745
37014
780
740
106050
260000
6700
821151
1
50
500
10400
150
140
755
450
148
1290
8.000
37645
815
755
111353
280000
7000
Interior Division
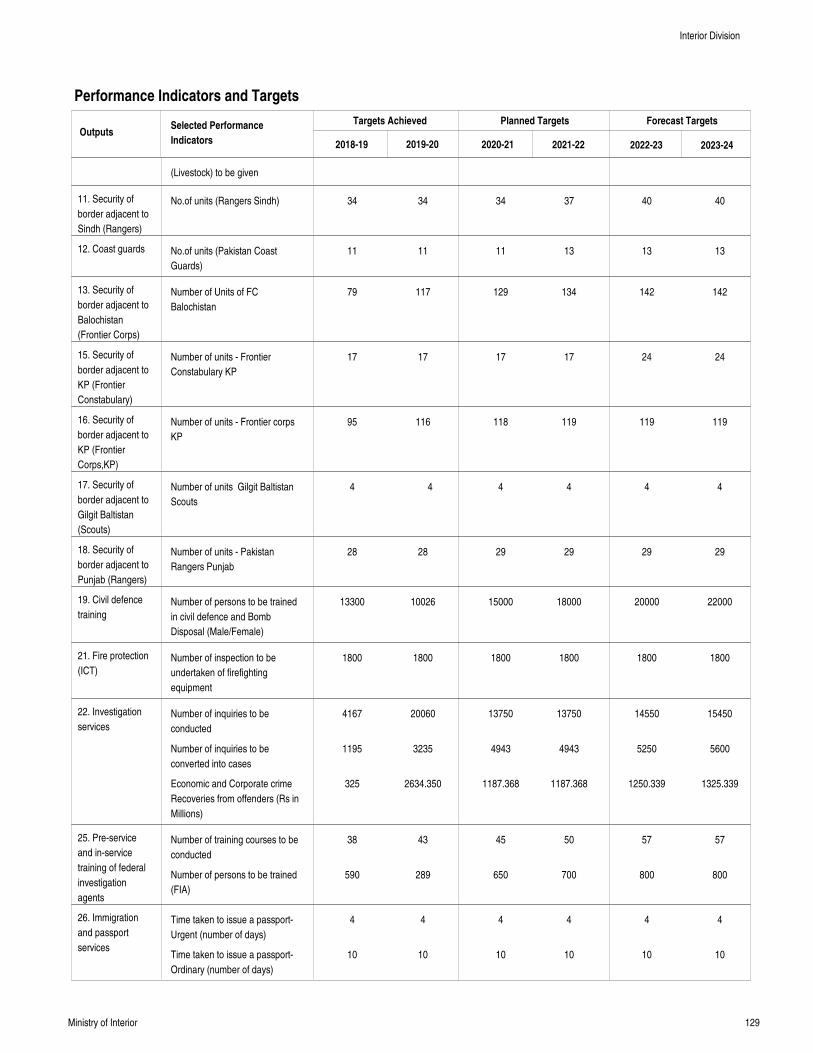
129Ministry of Interior
Performance Indicators and Targets
OutputsTargets Achieved Planned Targets Forecast Targets
2018-19 2019-20 2020-21 2021-22 2022-23 2023-24
Selected Performance
Indicators
11. Security of
border adjacent to
Sindh (Rangers)
12. Coast guards
13. Security of
border adjacent to
Balochistan
(Frontier Corps)
15. Security of
border adjacent to
KP (Frontier
Constabulary)
16. Security of
border adjacent to
KP (Frontier
Corps,KP)
17. Security of
border adjacent to
Gilgit Baltistan
(Scouts)
18. Security of
border adjacent to
Punjab (Rangers)
19. Civil defence
training
21. Fire protection
(ICT)
22. Investigation
services
25. Pre-service
and in-service
training of federal
investigation
agents
26. Immigration
and passport
services
(Livestock) to be given
No.of units (Rangers Sindh)
No.of units (Pakistan Coast
Guards)
Number of Units of FC
Balochistan
Number of units - Frontier
Constabulary KP
Number of units - Frontier corps
KP
Number of units Gilgit Baltistan
Scouts
Number of units - Pakistan
Rangers Punjab
Number of persons to be trained
in civil defence and Bomb
Disposal (Male/Female)
Number of inspection to be
undertaken of firefighting
equipment
Number of inquiries to be
conducted
Number of inquiries to be
converted into cases
Economic and Corporate crime
Recoveries from offenders (Rs in
Millions)
Number of training courses to be
conducted
Number of persons to be trained
(FIA)
Time taken to issue a passport-
Urgent (number of days)
Time taken to issue a passport-
Ordinary (number of days)
34
11
79
17
95
4
28
13300
1800
4167
1195
325
38
590
4
10
34
11
117
17
116
4
28
10026
1800
20060
3235
2634.350
43
289
4
10
34
11
129
17
118
4
29
15000
1800
13750
4943
1187.368
45
650
4
10
37
13
134
17
119
4
29
18000
1800
13750
4943
1187.368
50
700
4
10
40
13
142
24
119
4
29
20000
1800
14550
5250
1250.339
57
800
4
10
40
13
142
24
119
4
29
22000
1800
15450
5600
1325.339
57
800
4
10
Interior Division
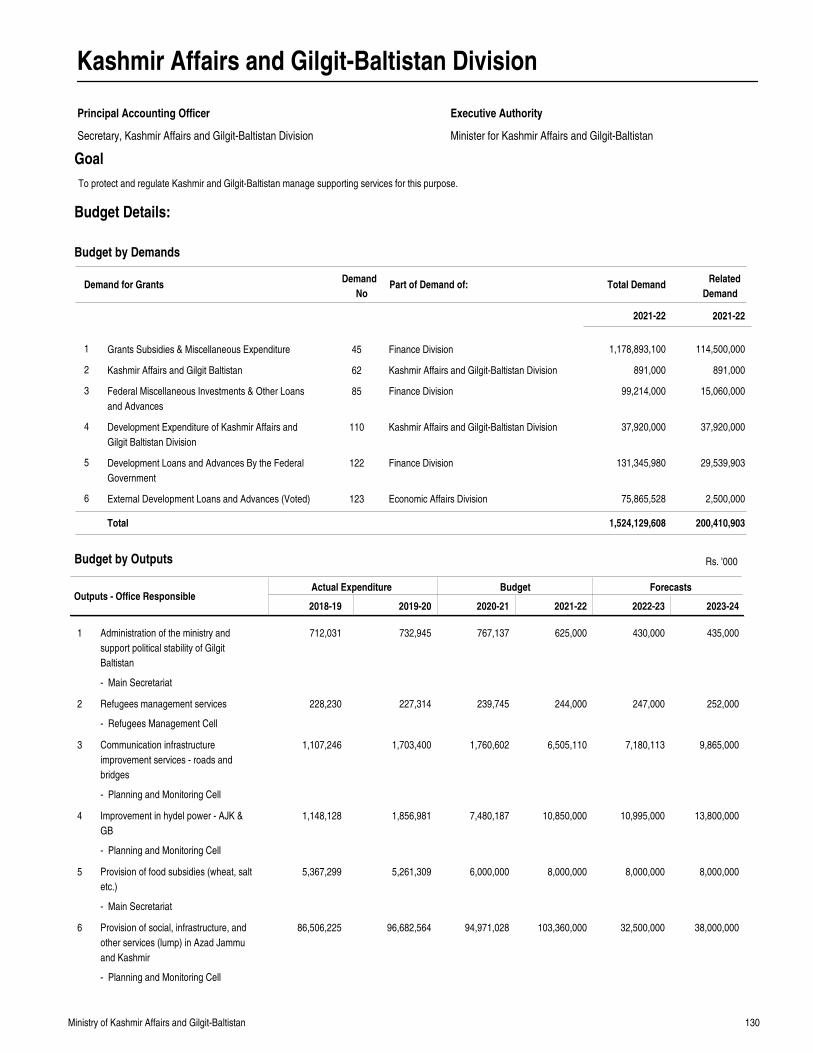
130Ministry of Kashmir Affairs and Gilgit-Baltistan
Kashmir Affairs and Gilgit-Baltistan Division
Principal Accounting Officer
Secretary, Kashmir Affairs and Gilgit-Baltistan Division Minister for Kashmir Affairs and Gilgit-Baltistan
Executive Authority
Goal
Outputs - Office ResponsibleActual Expenditure Budget Forecasts
2018-19 2019-20 2020-21 2021-22 2022-23 2023-24
Administration of the ministry and
support political stability of Gilgit
Baltistan
Refugees management services
Communication infrastructure
improvement services - roads and
bridges
Improvement in hydel power - AJK &
GB
Provision of food subsidies (wheat, salt
etc.)
Provision of social, infrastructure, and
other services (lump) in Azad Jammu
and Kashmir
712,031
228,230
1,107,246
1,148,128
5,367,299
86,506,225
732,945
227,314
1,703,400
1,856,981
5,261,309
96,682,564
767,137
239,745
1,760,602
7,480,187
6,000,000
94,971,028
625,000
244,000
6,505,110
10,850,000
8,000,000
103,360,000
430,000
247,000
7,180,113
10,995,000
8,000,000
32,500,000
435,000
252,000
9,865,000
13,800,000
8,000,000
38,000,000
1
2
3
4
5
6
Rs. '000
Grants Subsidies & Miscellaneous Expenditure
Kashmir Affairs and Gilgit Baltistan
Federal Miscellaneous Investments & Other Loans
and Advances
Development Expenditure of Kashmir Affairs and
Gilgit Baltistan Division
Development Loans and Advances By the Federal
Government
External Development Loans and Advances (Voted)
1
2
3
4
5
6
45
62
85
110
122
123
Finance Division
Kashmir Affairs and Gilgit-Baltistan Division
Finance Division
Kashmir Affairs and Gilgit-Baltistan Division
Finance Division
Economic Affairs Division
1,178,893,100
891,000
99,214,000
37,920,000
131,345,980
75,865,528
114,500,000
891,000
15,060,000
37,920,000
29,539,903
2,500,000
Demand for GrantsDemand
NoPart of Demand of: Total Demand
2021-22
1,524,129,608 200,410,903Total
Budget by Outputs
Budget by Demands
To protect and regulate Kashmir and Gilgit-Baltistan manage supporting services for this purpose.
Budget Details:
- Main Secretariat
- Refugees Management Cell
- Planning and Monitoring Cell
- Planning and Monitoring Cell
- Main Secretariat
- Planning and Monitoring Cell
2021-22
Related
Demand
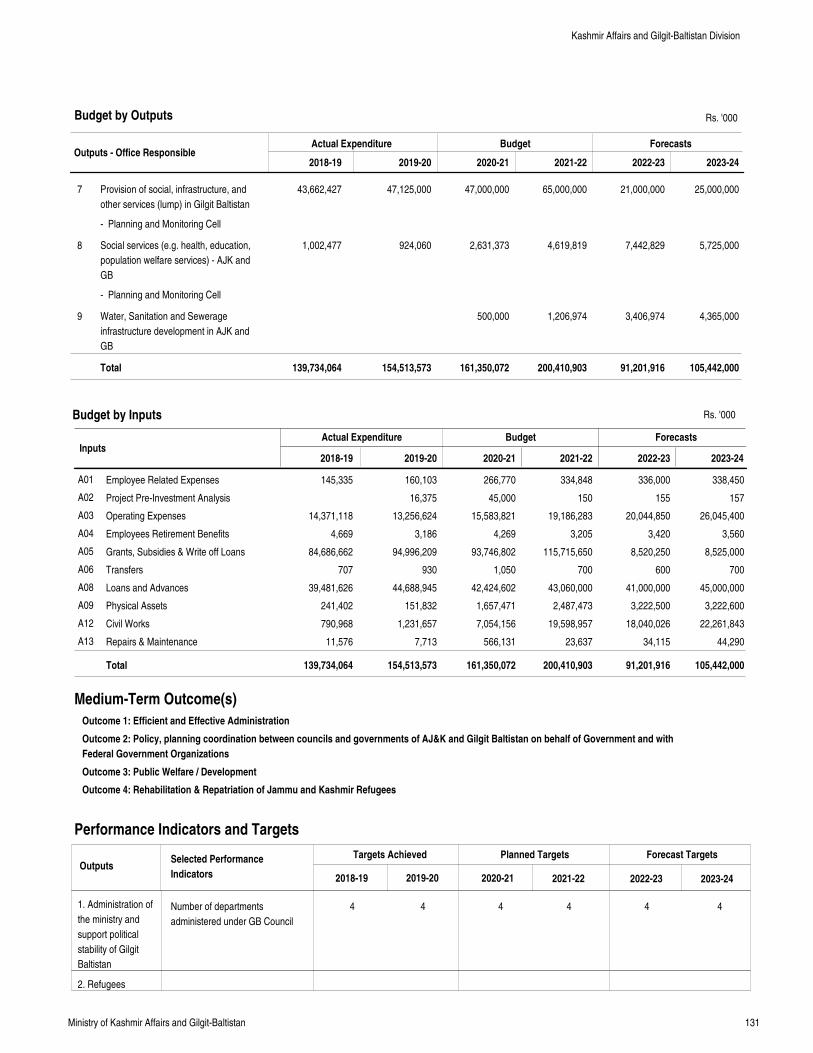
131Ministry of Kashmir Affairs and Gilgit-Baltistan
Outputs - Office ResponsibleActual Expenditure Budget Forecasts
2018-19 2019-20 2020-21 2021-22 2022-23 2023-24
Provision of social, infrastructure, and
other services (lump) in Gilgit Baltistan
Social services (e.g. health, education,
population welfare services) - AJK and
GB
Water, Sanitation and Sewerage
infrastructure development in AJK and
GB
43,662,427
1,002,477
47,125,000
924,060
47,000,000
2,631,373
500,000
65,000,000
4,619,819
1,206,974
21,000,000
7,442,829
3,406,974
25,000,000
5,725,000
4,365,000
7
8
9
Total 139,734,064 154,513,573 161,350,072 200,410,903 91,201,916 105,442,000
Rs. '000
InputsActual Expenditure Budget Forecasts
Employee Related Expenses
Project Pre-Investment Analysis
Operating Expenses
Employees Retirement Benefits
Grants, Subsidies & Write off Loans
Transfers
Loans and Advances
Physical Assets
Civil Works
Repairs & Maintenance
145,335
14,371,118
4,669
84,686,662
707
39,481,626
241,402
790,968
11,576
160,103
16,375
13,256,624
3,186
94,996,209
930
44,688,945
151,832
1,231,657
7,713
266,770
45,000
15,583,821
4,269
93,746,802
1,050
42,424,602
1,657,471
7,054,156
566,131
334,848
150
19,186,283
3,205
115,715,650
700
43,060,000
2,487,473
19,598,957
23,637
336,000
155
20,044,850
3,420
8,520,250
600
41,000,000
3,222,500
18,040,026
34,115
338,450
157
26,045,400
3,560
8,525,000
700
45,000,000
3,222,600
22,261,843
44,290
A01
A02
A03
A04
A05
A06
A08
A09
A12
A13
Total 139,734,064 154,513,573 161,350,072 200,410,903 91,201,916 105,442,000
2018-19 2019-20 2020-21 2021-22 2022-23 2023-24
Medium-Term Outcome(s)
Outcome 1: Efficient and Effective Administration
Outcome 2: Policy, planning coordination between councils and governments of AJ&K and Gilgit Baltistan on behalf of Government and with
Federal Government Organizations
Outcome 3: Public Welfare / Development
Outcome 4: Rehabilitation & Repatriation of Jammu and Kashmir Refugees
Performance Indicators and Targets
OutputsTargets Achieved Planned Targets Forecast Targets
2018-19 2019-20 2020-21 2021-22 2022-23 2023-24
Selected Performance
Indicators
1. Administration of
the ministry and
support political
stability of Gilgit
Baltistan
2. Refugees
Budget by Outputs
Budget by Inputs
Number of departments
administered under GB Council
4 4 4 4 4 4
Kashmir Affairs and Gilgit-Baltistan Division
- Planning and Monitoring Cell
- Planning and Monitoring Cell
Rs. '000
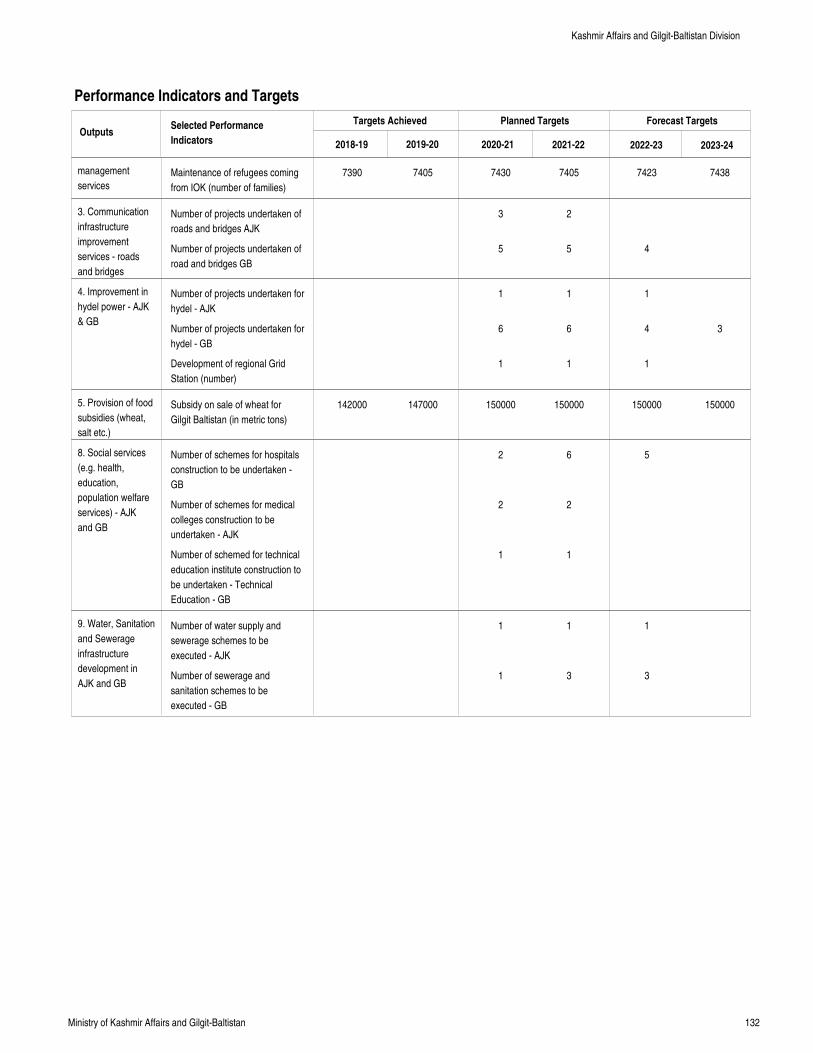
132Ministry of Kashmir Affairs and Gilgit-Baltistan
Performance Indicators and Targets
OutputsTargets Achieved Planned Targets Forecast Targets
2018-19 2019-20 2020-21 2021-22 2022-23 2023-24
Selected Performance
Indicators
management
services
3. Communication
infrastructure
improvement
services - roads
and bridges
4. Improvement in
hydel power - AJK
& GB
5. Provision of food
subsidies (wheat,
salt etc.)
8. Social services
(e.g. health,
education,
population welfare
services) - AJK
and GB
9. Water, Sanitation
and Sewerage
infrastructure
development in
AJK and GB
Maintenance of refugees coming
from IOK (number of families)
Number of projects undertaken of
roads and bridges AJK
Number of projects undertaken of
road and bridges GB
Number of projects undertaken for
hydel - AJK
Number of projects undertaken for
hydel - GB
Development of regional Grid
Station (number)
Subsidy on sale of wheat for
Gilgit Baltistan (in metric tons)
Number of schemes for hospitals
construction to be undertaken -
GB
Number of schemes for medical
colleges construction to be
undertaken - AJK
Number of schemed for technical
education institute construction to
be undertaken - Technical
Education - GB
Number of water supply and
sewerage schemes to be
executed - AJK
Number of sewerage and
sanitation schemes to be
executed - GB
7390
142000
7405
147000
7430
3
5
1
6
1
150000
2
2
1
1
1
7405
2
5
1
6
1
150000
6
2
1
1
3
7423
4
1
4
1
150000
5
1
3
7438
3
150000
Kashmir Affairs and Gilgit-Baltistan Division
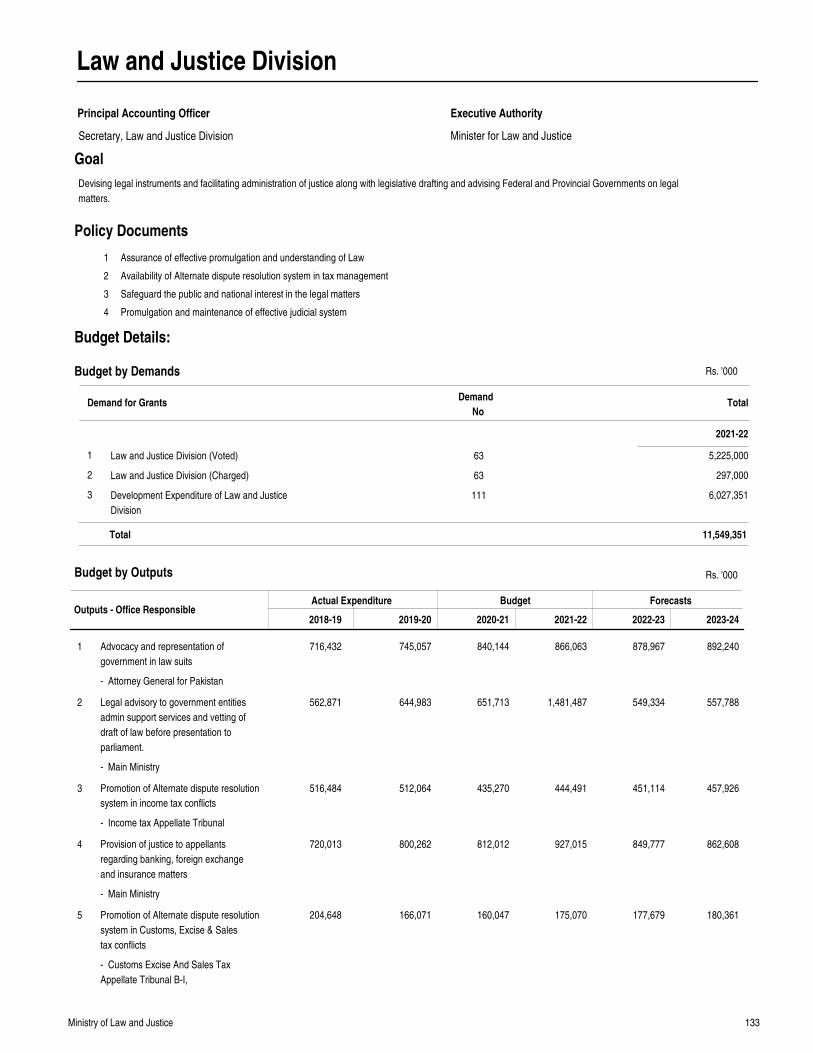
133Ministry of Law and Justice
Law and Justice Division
Principal Accounting Officer
Minister for Law and Justice
Executive Authority
Goal
Outputs - Office ResponsibleActual Expenditure Budget Forecasts
2018-19 2019-20 2020-21 2021-22 2022-23 2023-24
Advocacy and representation of
government in law suits
Legal advisory to government entities
admin support services and vetting of
draft of law before presentation to
parliament.
Promotion of Alternate dispute resolution
system in income tax conflicts
Provision of justice to appellants
regarding banking, foreign exchange
and insurance matters
Promotion of Alternate dispute resolution
system in Customs, Excise & Sales
tax conflicts
716,432
562,871
516,484
720,013
204,648
745,057
644,983
512,064
800,262
166,071
840,144
651,713
435,270
812,012
160,047
866,063
1,481,487
444,491
927,015
175,070
878,967
549,334
451,114
849,777
177,679
892,240
557,788
457,926
862,608
180,361
1
2
3
4
5
Rs. '000
1
2
3
4
Assurance of effective promulgation and understanding of Law
Availability of Alternate dispute resolution system in tax management
Safeguard the public and national interest in the legal matters
Promulgation and maintenance of effective judicial system
Policy Documents
Budget by Outputs
Devising legal instruments and facilitating administration of justice along with legislative drafting and advising Federal and Provincial Governments on legal
matters.
Demand for GrantsDemand
NoTotal
2021-22
Budget by Demands
Law and Justice Division (Voted)
Law and Justice Division (Charged)
Development Expenditure of Law and Justice
Division
1
2
3
63
63
111
5,225,000
297,000
6,027,351
11,549,351Total
Secretary, Law and Justice Division
Budget Details:
- Attorney General for Pakistan
- Main Ministry
- Income tax Appellate Tribunal
- Main Ministry
- Customs Excise And Sales Tax
Appellate Tribunal B-I,
Rs. '000
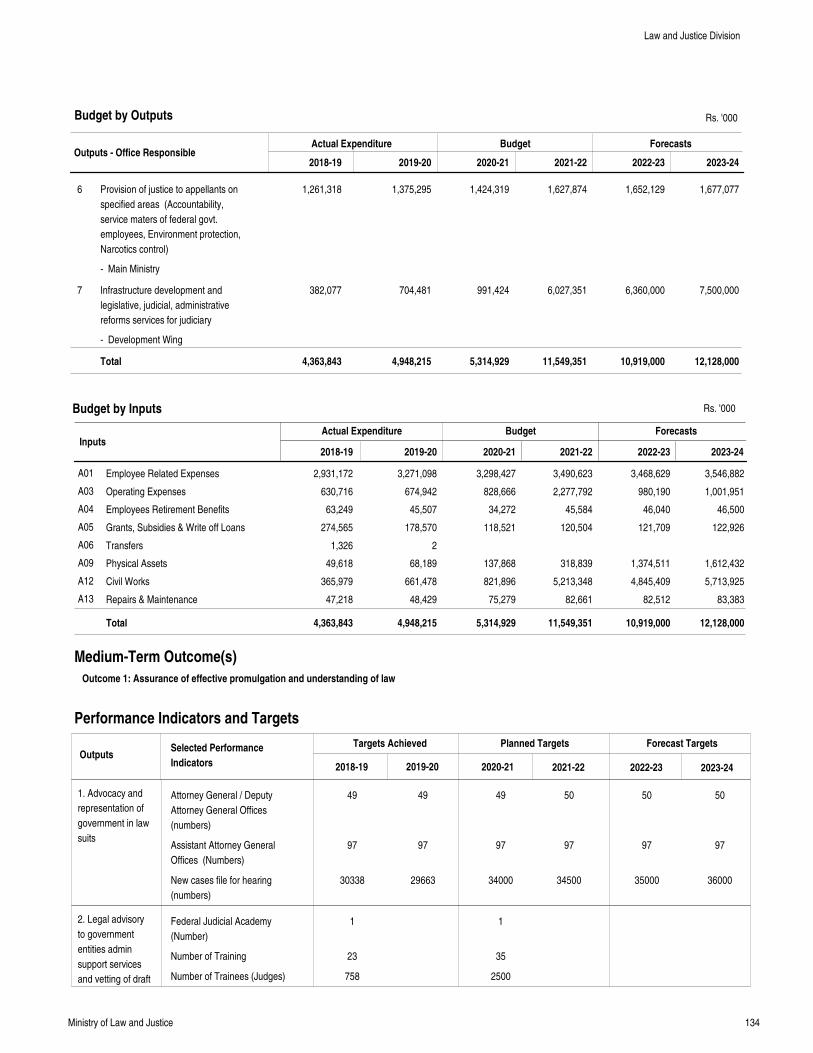
134Ministry of Law and Justice
Outputs - Office ResponsibleActual Expenditure Budget Forecasts
2018-19 2019-20 2020-21 2021-22 2022-23 2023-24
Provision of justice to appellants on
specified areas (Accountability,
service maters of federal govt.
employees, Environment protection,
Narcotics control)
Infrastructure development and
legislative, judicial, administrative
reforms services for judiciary
1,261,318
382,077
1,375,295
704,481
1,424,319
991,424
1,627,874
6,027,351
1,652,129
6,360,000
1,677,077
7,500,000
6
7
Total 4,363,843 4,948,215 5,314,929 11,549,351 10,919,000 12,128,000
Rs. '000
InputsActual Expenditure Budget Forecasts
Employee Related Expenses
Operating Expenses
Employees Retirement Benefits
Grants, Subsidies & Write off Loans
Transfers
Physical Assets
Civil Works
Repairs & Maintenance
2,931,172
630,716
63,249
274,565
1,326
49,618
365,979
47,218
3,271,098
674,942
45,507
178,570
2
68,189
661,478
48,429
3,298,427
828,666
34,272
118,521
137,868
821,896
75,279
3,490,623
2,277,792
45,584
120,504
318,839
5,213,348
82,661
3,468,629
980,190
46,040
121,709
1,374,511
4,845,409
82,512
3,546,882
1,001,951
46,500
122,926
1,612,432
5,713,925
83,383
A01
A03
A04
A05
A06
A09
A12
A13
Total 4,363,843 4,948,215 5,314,929 11,549,351 10,919,000 12,128,000
2018-19 2019-20 2020-21 2021-22 2022-23 2023-24
Medium-Term Outcome(s)
Outcome 1: Assurance of effective promulgation and understanding of law
Performance Indicators and Targets
OutputsTargets Achieved Planned Targets Forecast Targets
2018-19 2019-20 2020-21 2021-22 2022-23 2023-24
Selected Performance
Indicators
1. Advocacy and
representation of
government in law
suits
2. Legal advisory
to government
entities admin
support services
and vetting of draft
Budget by Outputs
Budget by Inputs
Attorney General / Deputy
Attorney General Offices
(numbers)
Assistant Attorney General
Offices (Numbers)
New cases file for hearing
(numbers)
Federal Judicial Academy
(Number)
Number of Training
Number of Trainees (Judges)
49
97
30338
1
23
758
49
97
29663
49
97
34000
1
35
2500
50
97
34500
50
97
35000
50
97
36000
Law and Justice Division
- Main Ministry
- Development Wing
Rs. '000
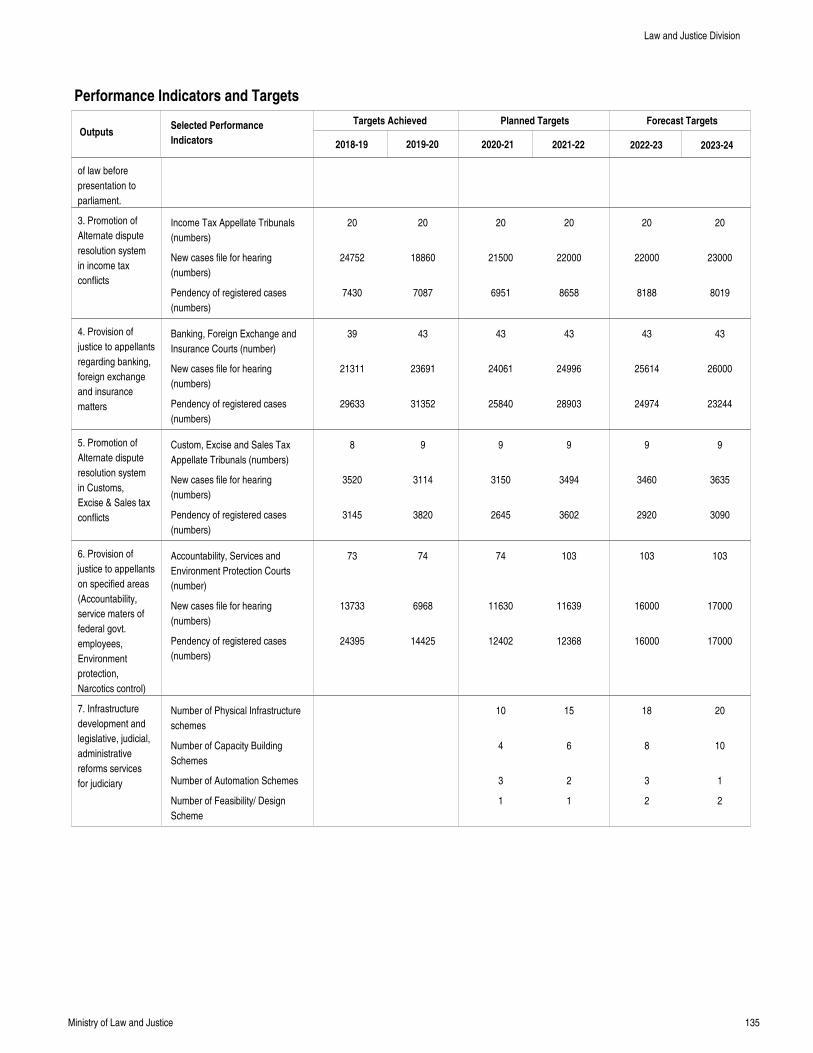
135Ministry of Law and Justice
Performance Indicators and Targets
OutputsTargets Achieved Planned Targets Forecast Targets
2018-19 2019-20 2020-21 2021-22 2022-23 2023-24
Selected Performance
Indicators
of law before
presentation to
parliament.
3. Promotion of
Alternate dispute
resolution system
in income tax
conflicts
4. Provision of
justice to appellants
regarding banking,
foreign exchange
and insurance
matters
5. Promotion of
Alternate dispute
resolution system
in Customs,
Excise & Sales tax
conflicts
6. Provision of
justice to appellants
on specified areas
(Accountability,
service maters of
federal govt.
employees,
Environment
protection,
Narcotics control)
7. Infrastructure
development and
legislative, judicial,
administrative
reforms services
for judiciary
Income Tax Appellate Tribunals
(numbers)
New cases file for hearing
(numbers)
Pendency of registered cases
(numbers)
Banking, Foreign Exchange and
Insurance Courts (number)
New cases file for hearing
(numbers)
Pendency of registered cases
(numbers)
Custom, Excise and Sales Tax
Appellate Tribunals (numbers)
New cases file for hearing
(numbers)
Pendency of registered cases
(numbers)
Accountability, Services and
Environment Protection Courts
(number)
New cases file for hearing
(numbers)
Pendency of registered cases
(numbers)
Number of Physical Infrastructure
schemes
Number of Capacity Building
Schemes
Number of Automation Schemes
Number of Feasibility/ Design
Scheme
20
24752
7430
39
21311
29633
8
3520
3145
73
13733
24395
20
18860
7087
43
23691
31352
9
3114
3820
74
6968
14425
20
21500
6951
43
24061
25840
9
3150
2645
74
11630
12402
10
4
3
1
20
22000
8658
43
24996
28903
9
3494
3602
103
11639
12368
15
6
2
1
20
22000
8188
43
25614
24974
9
3460
2920
103
16000
16000
18
8
3
2
20
23000
8019
43
26000
23244
9
3635
3090
103
17000
17000
20
10
1
2
Law and Justice Division
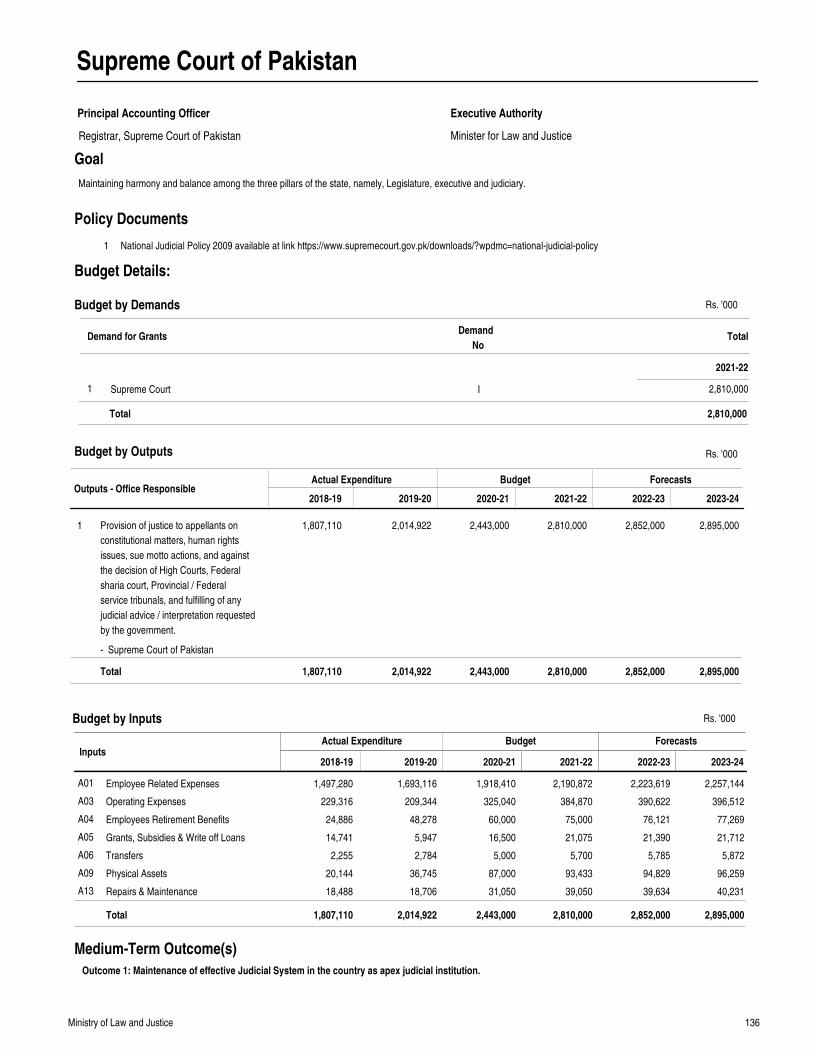
136Ministry of Law and Justice
Supreme Court of Pakistan
Principal Accounting Officer
Minister for Law and Justice
Executive Authority
Goal
Outputs - Office ResponsibleActual Expenditure Budget Forecasts
2018-19 2019-20 2020-21 2021-22 2022-23 2023-24
Provision of justice to appellants on
constitutional matters, human rights
issues, sue motto actions, and against
the decision of High Courts, Federal
sharia court, Provincial / Federal
service tribunals, and fulfilling of any
judicial advice / interpretation requested
by the government.
1,807,110 2,014,922 2,443,000 2,810,000 2,852,000 2,895,0001
Total 1,807,110 2,014,922 2,443,000 2,810,000 2,852,000 2,895,000
Rs. '000
InputsActual Expenditure Budget Forecasts
Employee Related Expenses
Operating Expenses
Employees Retirement Benefits
Grants, Subsidies & Write off Loans
Transfers
Physical Assets
Repairs & Maintenance
1,497,280
229,316
24,886
14,741
2,255
20,144
18,488
1,693,116
209,344
48,278
5,947
2,784
36,745
18,706
1,918,410
325,040
60,000
16,500
5,000
87,000
31,050
2,190,872
384,870
75,000
21,075
5,700
93,433
39,050
2,223,619
390,622
76,121
21,390
5,785
94,829
39,634
2,257,144
396,512
77,269
21,712
5,872
96,259
40,231
A01
A03
A04
A05
A06
A09
A13
Total 1,807,110 2,014,922 2,443,000 2,810,000 2,852,000 2,895,000
2018-19 2019-20 2020-21 2021-22 2022-23 2023-24
1 National Judicial Policy 2009 available at link https://www.supremecourt.gov.pk/downloads/?wpdmc=national-judicial-policy
Policy Documents
Medium-Term Outcome(s)
Outcome 1: Maintenance of effective Judicial System in the country as apex judicial institution.
Budget by Outputs
Budget by Inputs
Maintaining harmony and balance among the three pillars of the state, namely, Legislature, executive and judiciary.
Demand for GrantsDemand
NoTotal
2021-22
Budget by Demands
Supreme Court1 I 2,810,000
2,810,000Total
Registrar, Supreme Court of Pakistan
Budget Details:
- Supreme Court of Pakistan
Rs. '000
Rs. '000
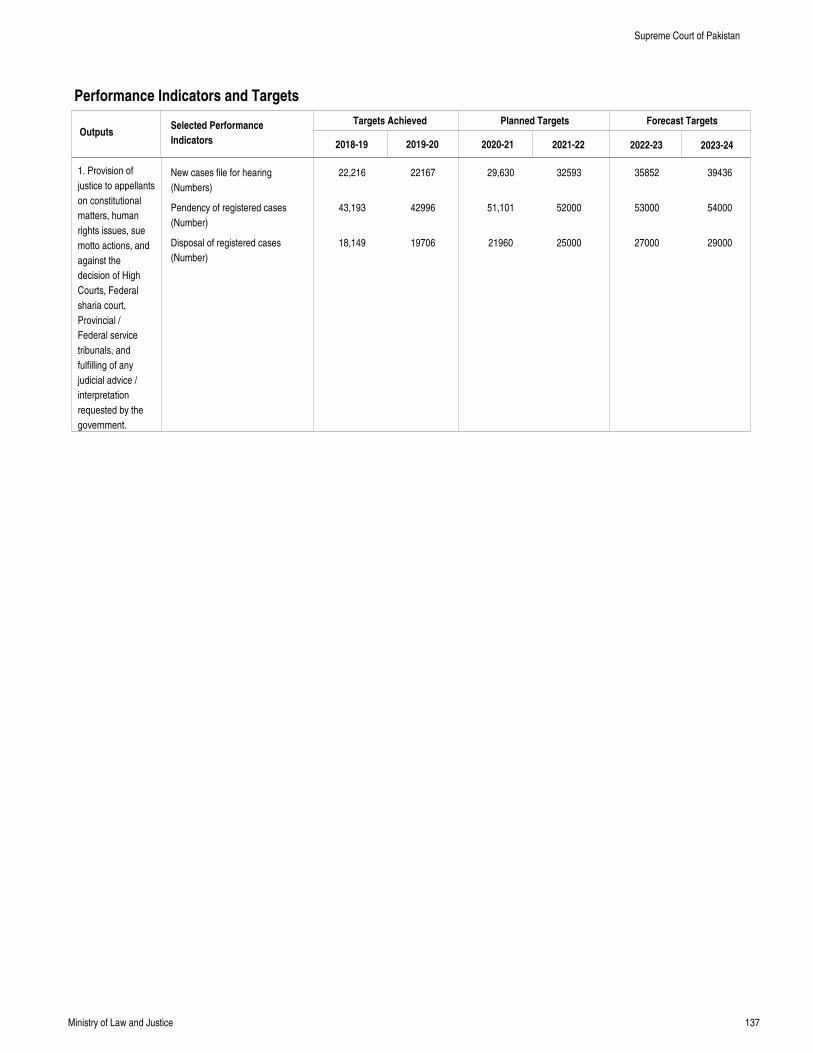
137Ministry of Law and Justice
Performance Indicators and Targets
OutputsTargets Achieved Planned Targets Forecast Targets
2018-19 2019-20 2020-21 2021-22 2022-23 2023-24
Selected Performance
Indicators
1. Provision of
justice to appellants
on constitutional
matters, human
rights issues, sue
motto actions, and
against the
decision of High
Courts, Federal
sharia court,
Provincial /
Federal service
tribunals, and
fulfilling of any
judicial advice /
interpretation
requested by the
government.
New cases file for hearing
(Numbers)
Pendency of registered cases
(Number)
Disposal of registered cases
(Number)
22,216
43,193
18,149
22167
42996
19706
29,630
51,101
21960
32593
52000
25000
35852
53000
27000
39436
54000
29000
Supreme Court of Pakistan
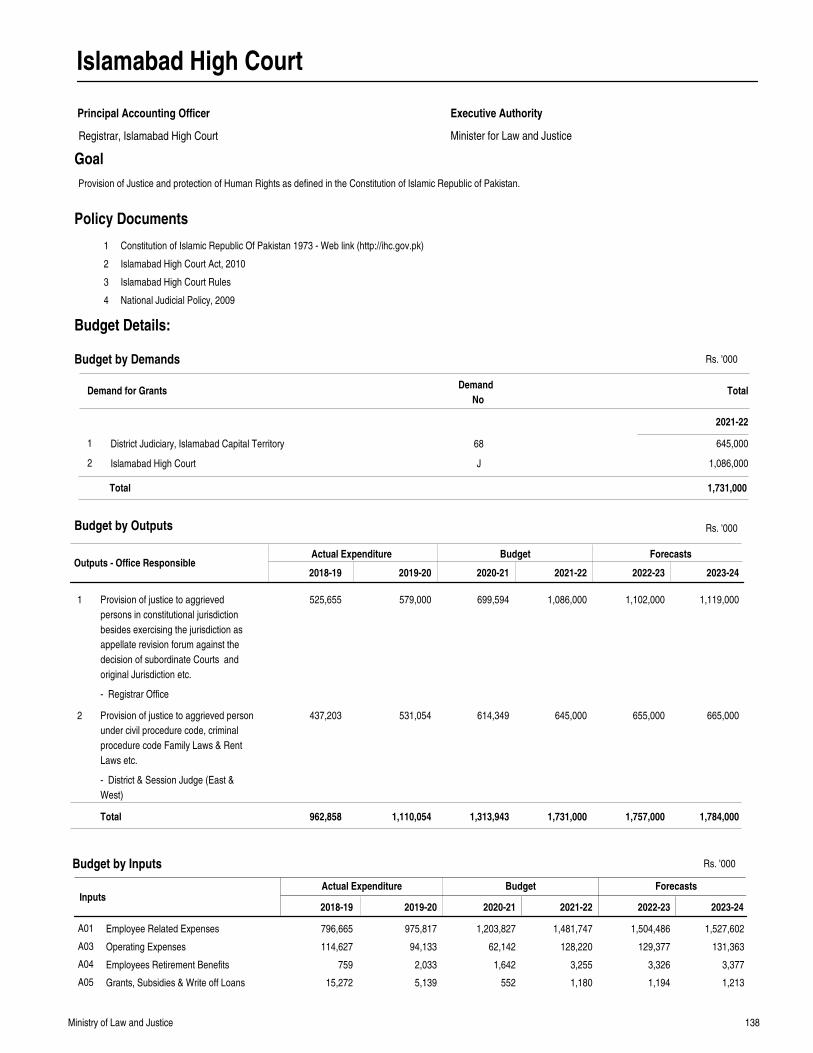
138Ministry of Law and Justice
Islamabad High Court
Principal Accounting Officer
Minister for Law and Justice
Executive Authority
Goal
Outputs - Office ResponsibleActual Expenditure Budget Forecasts
2018-19 2019-20 2020-21 2021-22 2022-23 2023-24
Provision of justice to aggrieved
persons in constitutional jurisdiction
besides exercising the jurisdiction as
appellate revision forum against the
decision of subordinate Courts and
original Jurisdiction etc.
Provision of justice to aggrieved person
under civil procedure code, criminal
procedure code Family Laws & Rent
Laws etc.
525,655
437,203
579,000
531,054
699,594
614,349
1,086,000
645,000
1,102,000
655,000
1,119,000
665,000
1
2
Total 962,858 1,110,054 1,313,943 1,731,000 1,757,000 1,784,000
Rs. '000
InputsActual Expenditure Budget Forecasts
Employee Related Expenses
Operating Expenses
Employees Retirement Benefits
Grants, Subsidies & Write off Loans
796,665
114,627
759
15,272
975,817
94,133
2,033
5,139
1,203,827
62,142
1,642
552
1,481,747
128,220
3,255
1,180
1,504,486
129,377
3,326
1,194
1,527,602
131,363
3,377
1,213
A01
A03
A04
A05
2018-19 2019-20 2020-21 2021-22 2022-23 2023-24
1
2
3
4
Constitution of Islamic Republic Of Pakistan 1973 - Web link (http://ihc.gov.pk)
Islamabad High Court Act, 2010
Islamabad High Court Rules
National Judicial Policy, 2009
Policy Documents
Budget by Outputs
Budget by Inputs
Provision of Justice and protection of Human Rights as defined in the Constitution of Islamic Republic of Pakistan.
Demand for GrantsDemand
NoTotal
2021-22
Budget by Demands
District Judiciary, Islamabad Capital Territory
Islamabad High Court
1
2
68
J
645,000
1,086,000
1,731,000Total
Registrar, Islamabad High Court
Budget Details:
- Registrar Office
- District & Session Judge (East &
West)
Rs. '000
Rs. '000
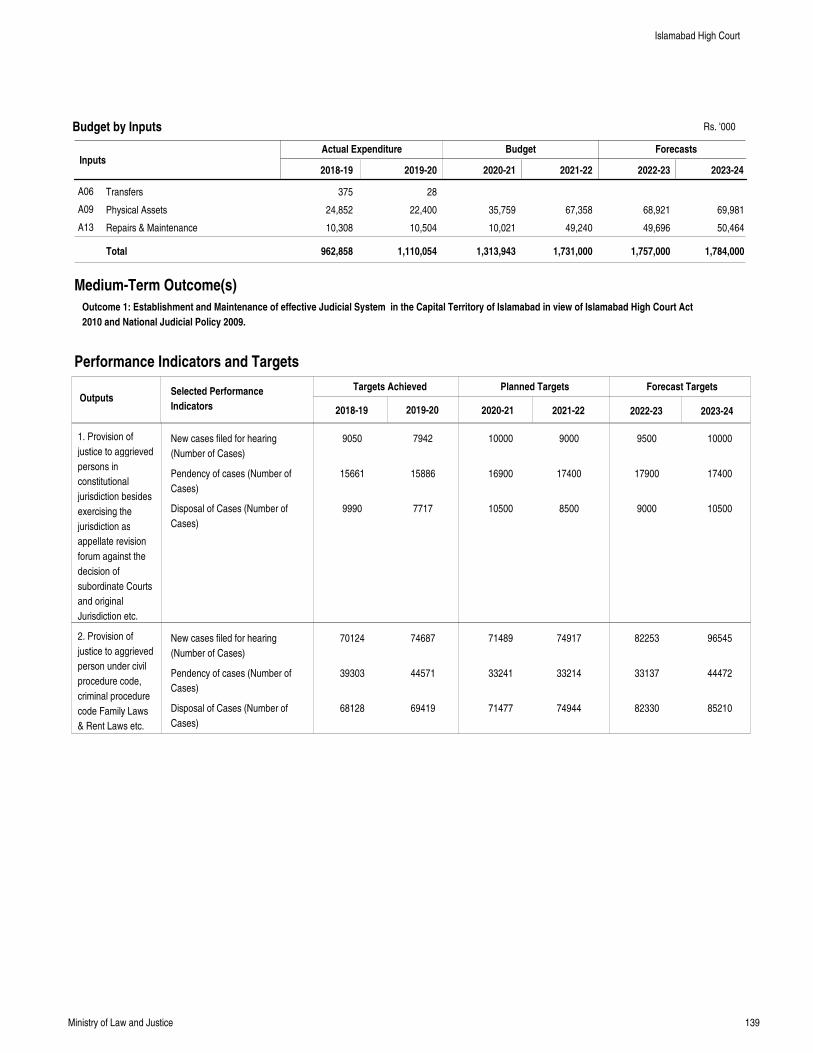
139Ministry of Law and Justice
InputsActual Expenditure Budget Forecasts
Transfers
Physical Assets
Repairs & Maintenance
375
24,852
10,308
28
22,400
10,504
35,759
10,021
67,358
49,240
68,921
49,696
69,981
50,464
A06
A09
A13
Total 962,858 1,110,054 1,313,943 1,731,000 1,757,000 1,784,000
2018-19 2019-20 2020-21 2021-22 2022-23 2023-24
Medium-Term Outcome(s)
Outcome 1: Establishment and Maintenance of effective Judicial System in the Capital Territory of Islamabad in view of Islamabad High Court Act
2010 and National Judicial Policy 2009.
Performance Indicators and Targets
OutputsTargets Achieved Planned Targets Forecast Targets
2018-19 2019-20 2020-21 2021-22 2022-23 2023-24
Selected Performance
Indicators
1. Provision of
justice to aggrieved
persons in
constitutional
jurisdiction besides
exercising the
jurisdiction as
appellate revision
forum against the
decision of
subordinate Courts
and original
Jurisdiction etc.
2. Provision of
justice to aggrieved
person under civil
procedure code,
criminal procedure
code Family Laws
& Rent Laws etc.
Budget by Inputs
New cases filed for hearing
(Number of Cases)
Pendency of cases (Number of
Cases)
Disposal of Cases (Number of
Cases)
New cases filed for hearing
(Number of Cases)
Pendency of cases (Number of
Cases)
Disposal of Cases (Number of
Cases)
9050
15661
9990
70124
39303
68128
7942
15886
7717
74687
44571
69419
10000
16900
10500
71489
33241
71477
9000
17400
8500
74917
33214
74944
9500
17900
9000
82253
33137
82330
10000
17400
10500
96545
44472
85210
Islamabad High Court
Rs. '000
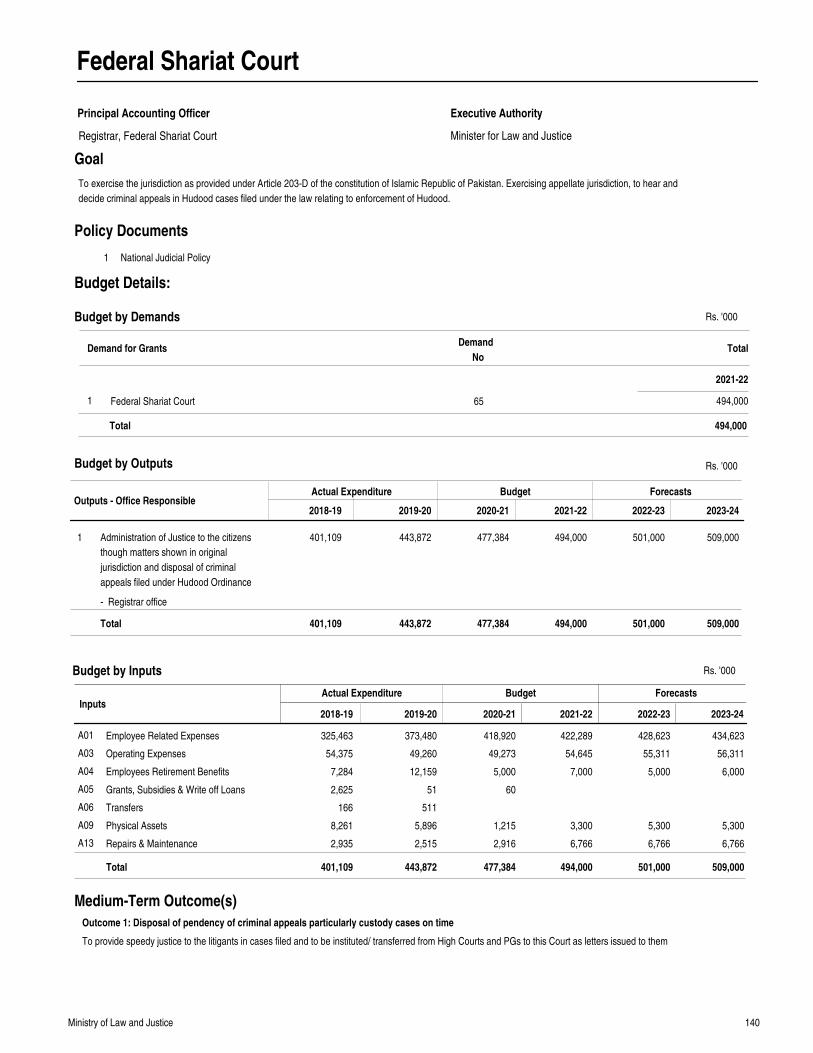
140Ministry of Law and Justice
Federal Shariat Court
Principal Accounting Officer
Minister for Law and Justice
Executive Authority
Goal
Outputs - Office ResponsibleActual Expenditure Budget Forecasts
2018-19 2019-20 2020-21 2021-22 2022-23 2023-24
Administration of Justice to the citizens
though matters shown in original
jurisdiction and disposal of criminal
appeals filed under Hudood Ordinance
401,109 443,872 477,384 494,000 501,000 509,0001
Total 401,109 443,872 477,384 494,000 501,000 509,000
Rs. '000
InputsActual Expenditure Budget Forecasts
Employee Related Expenses
Operating Expenses
Employees Retirement Benefits
Grants, Subsidies & Write off Loans
Transfers
Physical Assets
Repairs & Maintenance
325,463
54,375
7,284
2,625
166
8,261
2,935
373,480
49,260
12,159
51
511
5,896
2,515
418,920
49,273
5,000
60
1,215
2,916
422,289
54,645
7,000
3,300
6,766
428,623
55,311
5,000
5,300
6,766
434,623
56,311
6,000
5,300
6,766
A01
A03
A04
A05
A06
A09
A13
Total 401,109 443,872 477,384 494,000 501,000 509,000
2018-19 2019-20 2020-21 2021-22 2022-23 2023-24
1 National Judicial Policy
Policy Documents
To provide speedy justice to the litigants in cases filed and to be instituted/ transferred from High Courts and PGs to this Court as letters issued to them
Medium-Term Outcome(s)
Outcome 1: Disposal of pendency of criminal appeals particularly custody cases on time
Budget by Outputs
Budget by Inputs
To exercise the jurisdiction as provided under Article 203-D of the constitution of Islamic Republic of Pakistan. Exercising appellate jurisdiction, to hear and
decide criminal appeals in Hudood cases filed under the law relating to enforcement of Hudood.
Demand for GrantsDemand
NoTotal
2021-22
Budget by Demands
Federal Shariat Court1 65 494,000
494,000Total
Registrar, Federal Shariat Court
Budget Details:
- Registrar office
Rs. '000
Rs. '000
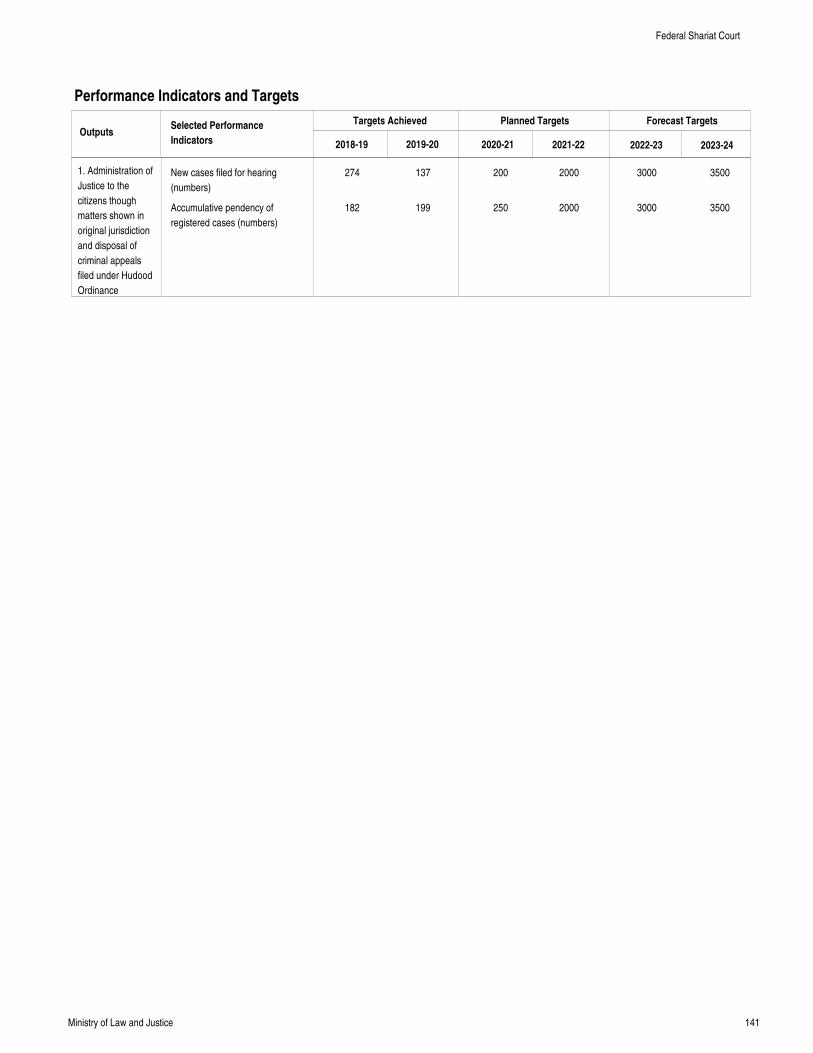
141Ministry of Law and Justice
Performance Indicators and Targets
OutputsTargets Achieved Planned Targets Forecast Targets
2018-19 2019-20 2020-21 2021-22 2022-23 2023-24
Selected Performance
Indicators
1. Administration of
Justice to the
citizens though
matters shown in
original jurisdiction
and disposal of
criminal appeals
filed under Hudood
Ordinance
New cases filed for hearing
(numbers)
Accumulative pendency of
registered cases (numbers)
274
182
137
199
200
250
2000
2000
3000
3000
3500
3500
Federal Shariat Court
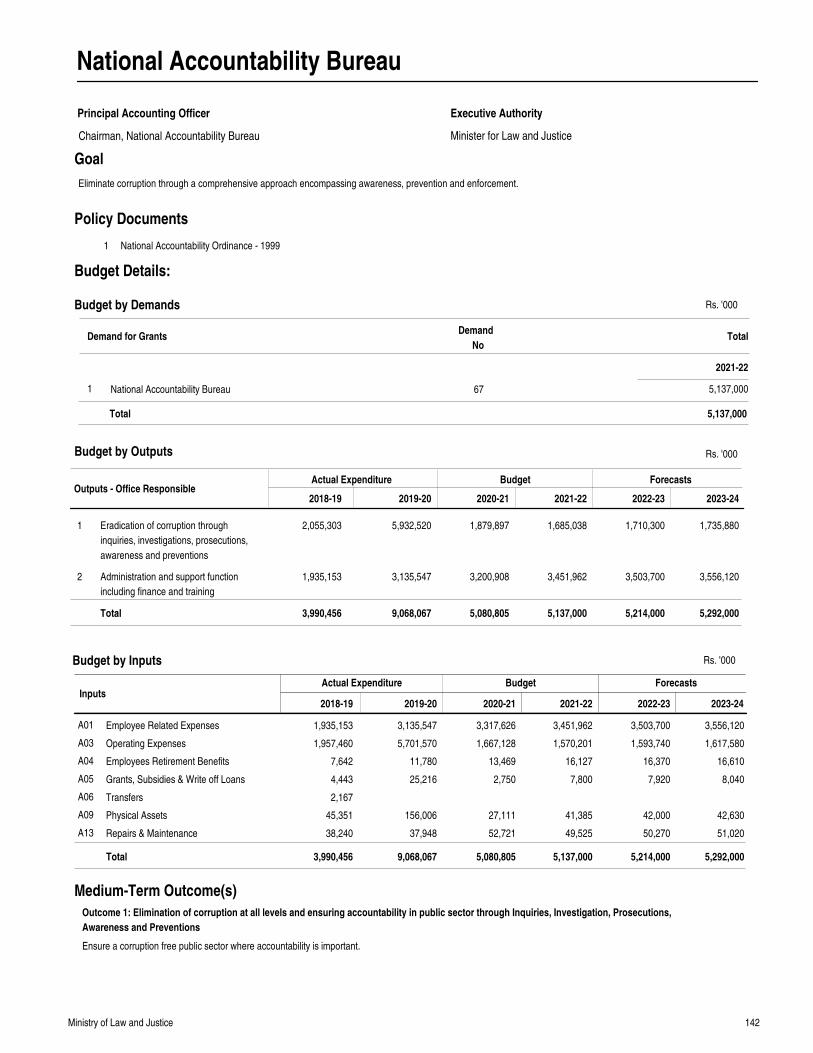
142Ministry of Law and Justice
National Accountability Bureau
Principal Accounting Officer
Minister for Law and Justice
Executive Authority
Goal
Outputs - Office ResponsibleActual Expenditure Budget Forecasts
2018-19 2019-20 2020-21 2021-22 2022-23 2023-24
Eradication of corruption through
inquiries, investigations, prosecutions,
awareness and preventions
Administration and support function
including finance and training
2,055,303
1,935,153
5,932,520
3,135,547
1,879,897
3,200,908
1,685,038
3,451,962
1,710,300
3,503,700
1,735,880
3,556,120
1
2
Total 3,990,456 9,068,067 5,080,805 5,137,000 5,214,000 5,292,000
Rs. '000
InputsActual Expenditure Budget Forecasts
Employee Related Expenses
Operating Expenses
Employees Retirement Benefits
Grants, Subsidies & Write off Loans
Transfers
Physical Assets
Repairs & Maintenance
1,935,153
1,957,460
7,642
4,443
2,167
45,351
38,240
3,135,547
5,701,570
11,780
25,216
156,006
37,948
3,317,626
1,667,128
13,469
2,750
27,111
52,721
3,451,962
1,570,201
16,127
7,800
41,385
49,525
3,503,700
1,593,740
16,370
7,920
42,000
50,270
3,556,120
1,617,580
16,610
8,040
42,630
51,020
A01
A03
A04
A05
A06
A09
A13
Total 3,990,456 9,068,067 5,080,805 5,137,000 5,214,000 5,292,000
2018-19 2019-20 2020-21 2021-22 2022-23 2023-24
1 National Accountability Ordinance - 1999
Policy Documents
Ensure a corruption free public sector where accountability is important.
Medium-Term Outcome(s)
Outcome 1: Elimination of corruption at all levels and ensuring accountability in public sector through Inquiries, Investigation, Prosecutions,
Awareness and Preventions
Budget by Outputs
Budget by Inputs
Eliminate corruption through a comprehensive approach encompassing awareness, prevention and enforcement.
Demand for GrantsDemand
NoTotal
2021-22
Budget by Demands
National Accountability Bureau1 67 5,137,000
5,137,000Total
Chairman, National Accountability Bureau
Budget Details:
Rs. '000
Rs. '000
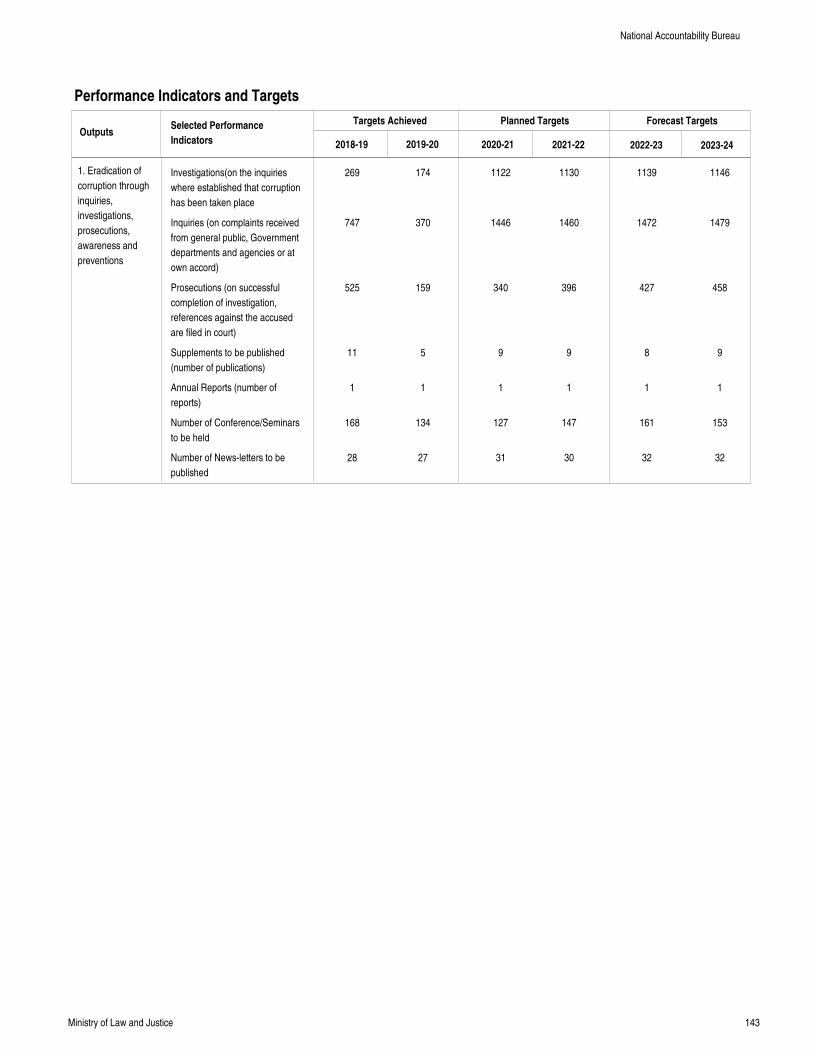
143Ministry of Law and Justice
Performance Indicators and Targets
OutputsTargets Achieved Planned Targets Forecast Targets
2018-19 2019-20 2020-21 2021-22 2022-23 2023-24
Selected Performance
Indicators
1. Eradication of
corruption through
inquiries,
investigations,
prosecutions,
awareness and
preventions
Investigations(on the inquiries
where established that corruption
has been taken place
Inquiries (on complaints received
from general public, Government
departments and agencies or at
own accord)
Prosecutions (on successful
completion of investigation,
references against the accused
are filed in court)
Supplements to be published
(number of publications)
Annual Reports (number of
reports)
Number of Conference/Seminars
to be held
Number of News-letters to be
published
269
747
525
11
1
168
28
174
370
159
5
1
134
27
1122
1446
340
9
1
127
31
1130
1460
396
9
1
147
30
1139
1472
427
8
1
161
32
1146
1479
458
9
1
153
32
National Accountability Bureau
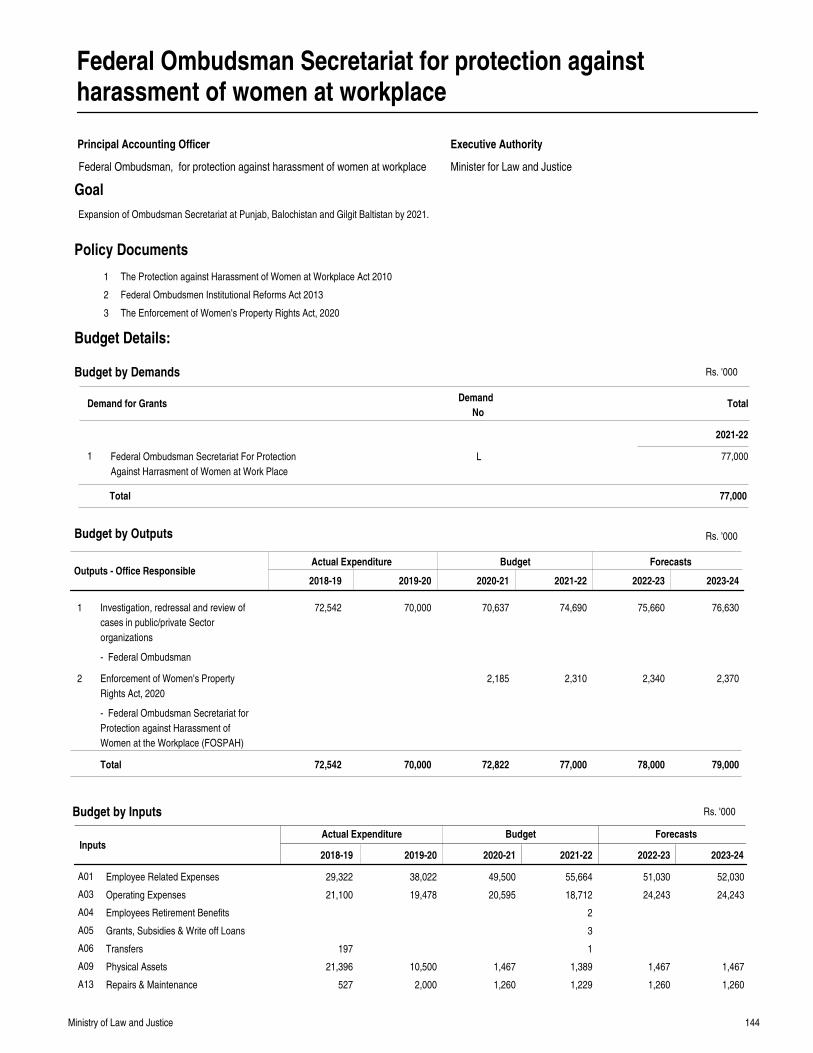
144Ministry of Law and Justice
Federal Ombudsman Secretariat for protection againstharassment of women at workplace
Principal Accounting Officer
Minister for Law and Justice
Executive Authority
Goal
Outputs - Office ResponsibleActual Expenditure Budget Forecasts
2018-19 2019-20 2020-21 2021-22 2022-23 2023-24
Investigation, redressal and review of
cases in public/private Sector
organizations
Enforcement of Women's Property
Rights Act, 2020
72,542 70,000 70,637
2,185
74,690
2,310
75,660
2,340
76,630
2,370
1
2
Total 72,542 70,000 72,822 77,000 78,000 79,000
Rs. '000
InputsActual Expenditure Budget Forecasts
Employee Related Expenses
Operating Expenses
Employees Retirement Benefits
Grants, Subsidies & Write off Loans
Transfers
Physical Assets
Repairs & Maintenance
29,322
21,100
197
21,396
527
38,022
19,478
10,500
2,000
49,500
20,595
1,467
1,260
55,664
18,712
2
3
1
1,389
1,229
51,030
24,243
1,467
1,260
52,030
24,243
1,467
1,260
A01
A03
A04
A05
A06
A09
A13
2018-19 2019-20 2020-21 2021-22 2022-23 2023-24
1
2
3
The Protection against Harassment of Women at Workplace Act 2010
Federal Ombudsmen Institutional Reforms Act 2013
The Enforcement of Women's Property Rights Act, 2020
Policy Documents
Budget by Outputs
Budget by Inputs
Expansion of Ombudsman Secretariat at Punjab, Balochistan and Gilgit Baltistan by 2021.
Demand for GrantsDemand
NoTotal
2021-22
Budget by Demands
Federal Ombudsman Secretariat For Protection
Against Harrasment of Women at Work Place
1 L 77,000
77,000Total
Federal Ombudsman, for protection against harassment of women at workplace
Budget Details:
- Federal Ombudsman
- Federal Ombudsman Secretariat for
Protection against Harassment of
Women at the Workplace (FOSPAH)
Rs. '000
Rs. '000
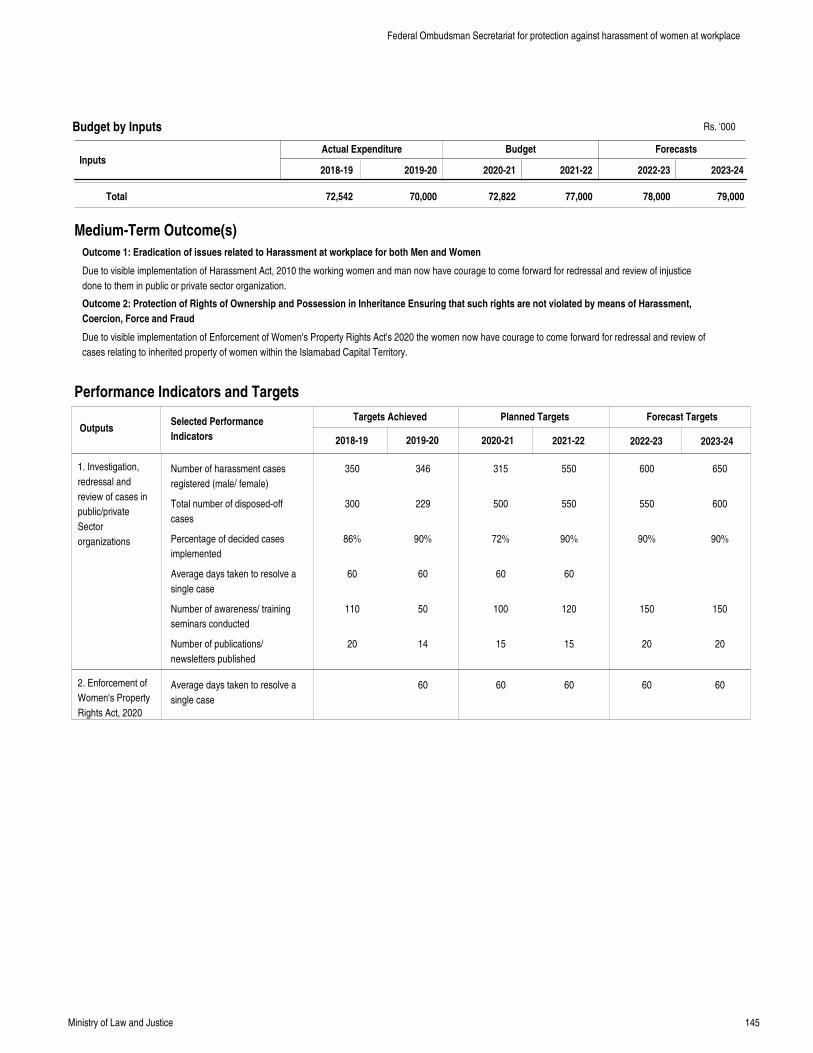
145Ministry of Law and Justice
InputsActual Expenditure Budget Forecasts
Total 72,542 70,000 72,822 77,000 78,000 79,000
2018-19 2019-20 2020-21 2021-22 2022-23 2023-24
Due to visible implementation of Harassment Act, 2010 the working women and man now have courage to come forward for redressal and review of injustice
done to them in public or private sector organization.
Due to visible implementation of Enforcement of Women's Property Rights Act's 2020 the women now have courage to come forward for redressal and review of
cases relating to inherited property of women within the Islamabad Capital Territory.
Medium-Term Outcome(s)
Outcome 1: Eradication of issues related to Harassment at workplace for both Men and Women
Outcome 2: Protection of Rights of Ownership and Possession in Inheritance Ensuring that such rights are not violated by means of Harassment,
Coercion, Force and Fraud
Performance Indicators and Targets
OutputsTargets Achieved Planned Targets Forecast Targets
2018-19 2019-20 2020-21 2021-22 2022-23 2023-24
Selected Performance
Indicators
1. Investigation,
redressal and
review of cases in
public/private
Sector
organizations
2. Enforcement of
Women's Property
Rights Act, 2020
Budget by Inputs
Number of harassment cases
registered (male/ female)
Total number of disposed-off
cases
Percentage of decided cases
implemented
Average days taken to resolve a
single case
Number of awareness/ training
seminars conducted
Number of publications/
newsletters published
Average days taken to resolve a
single case
350
300
86%
60
110
20
346
229
90%
60
50
14
60
315
500
72%
60
100
15
60
550
550
90%
60
120
15
60
600
550
90%
150
20
60
650
600
90%
150
20
60
Federal Ombudsman Secretariat for protection against harassment of women at workplace
Rs. '000
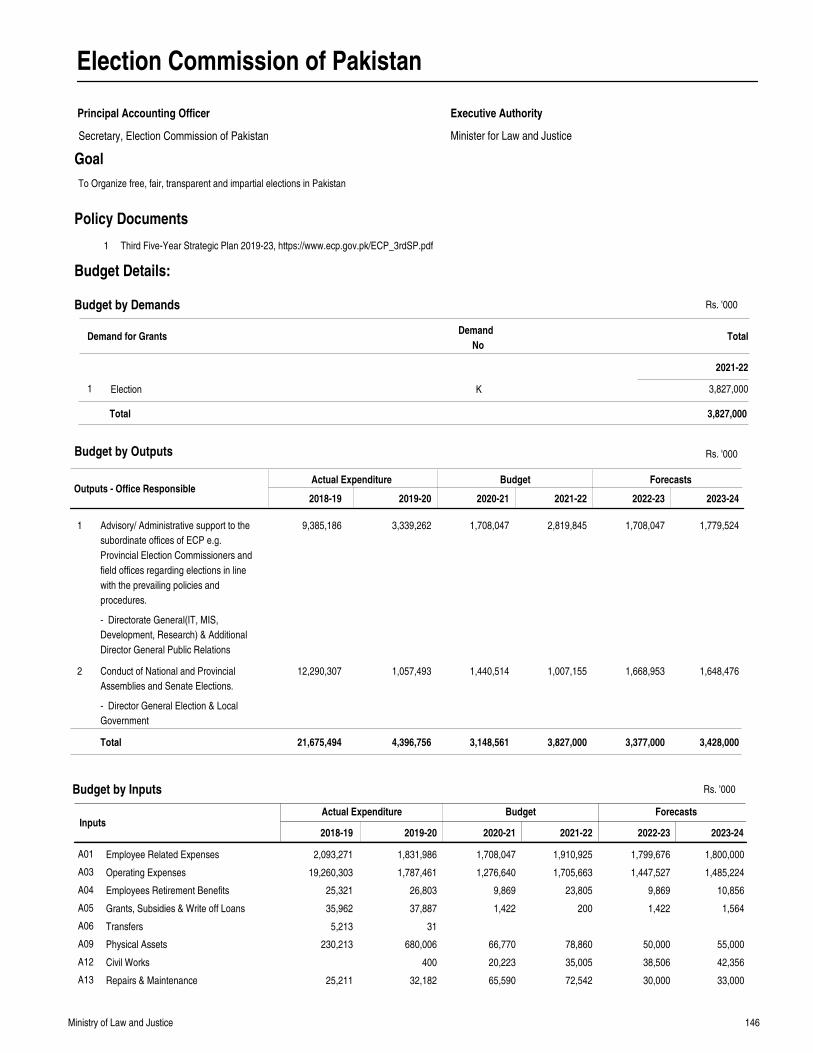
146Ministry of Law and Justice
Election Commission of Pakistan
Principal Accounting Officer
Minister for Law and Justice
Executive Authority
Goal
Outputs - Office ResponsibleActual Expenditure Budget Forecasts
2018-19 2019-20 2020-21 2021-22 2022-23 2023-24
Advisory/ Administrative support to the
subordinate offices of ECP e.g.
Provincial Election Commissioners and
field offices regarding elections in line
with the prevailing policies and
procedures.
Conduct of National and Provincial
Assemblies and Senate Elections.
9,385,186
12,290,307
3,339,262
1,057,493
1,708,047
1,440,514
2,819,845
1,007,155
1,708,047
1,668,953
1,779,524
1,648,476
1
2
Total 21,675,494 4,396,756 3,148,561 3,827,000 3,377,000 3,428,000
Rs. '000
InputsActual Expenditure Budget Forecasts
Employee Related Expenses
Operating Expenses
Employees Retirement Benefits
Grants, Subsidies & Write off Loans
Transfers
Physical Assets
Civil Works
Repairs & Maintenance
2,093,271
19,260,303
25,321
35,962
5,213
230,213
25,211
1,831,986
1,787,461
26,803
37,887
31
680,006
400
32,182
1,708,047
1,276,640
9,869
1,422
66,770
20,223
65,590
1,910,925
1,705,663
23,805
200
78,860
35,005
72,542
1,799,676
1,447,527
9,869
1,422
50,000
38,506
30,000
1,800,000
1,485,224
10,856
1,564
55,000
42,356
33,000
A01
A03
A04
A05
A06
A09
A12
A13
2018-19 2019-20 2020-21 2021-22 2022-23 2023-24
1 Third Five-Year Strategic Plan 2019-23, https://www.ecp.gov.pk/ECP_3rdSP.pdf
Policy Documents
Budget by Outputs
Budget by Inputs
To Organize free, fair, transparent and impartial elections in Pakistan
Demand for GrantsDemand
NoTotal
2021-22
Budget by Demands
Election1 K 3,827,000
3,827,000Total
Secretary, Election Commission of Pakistan
Budget Details:
- Directorate General(IT, MIS,
Development, Research) & Additional
Director General Public Relations
- Director General Election & Local
Government
Rs. '000
Rs. '000
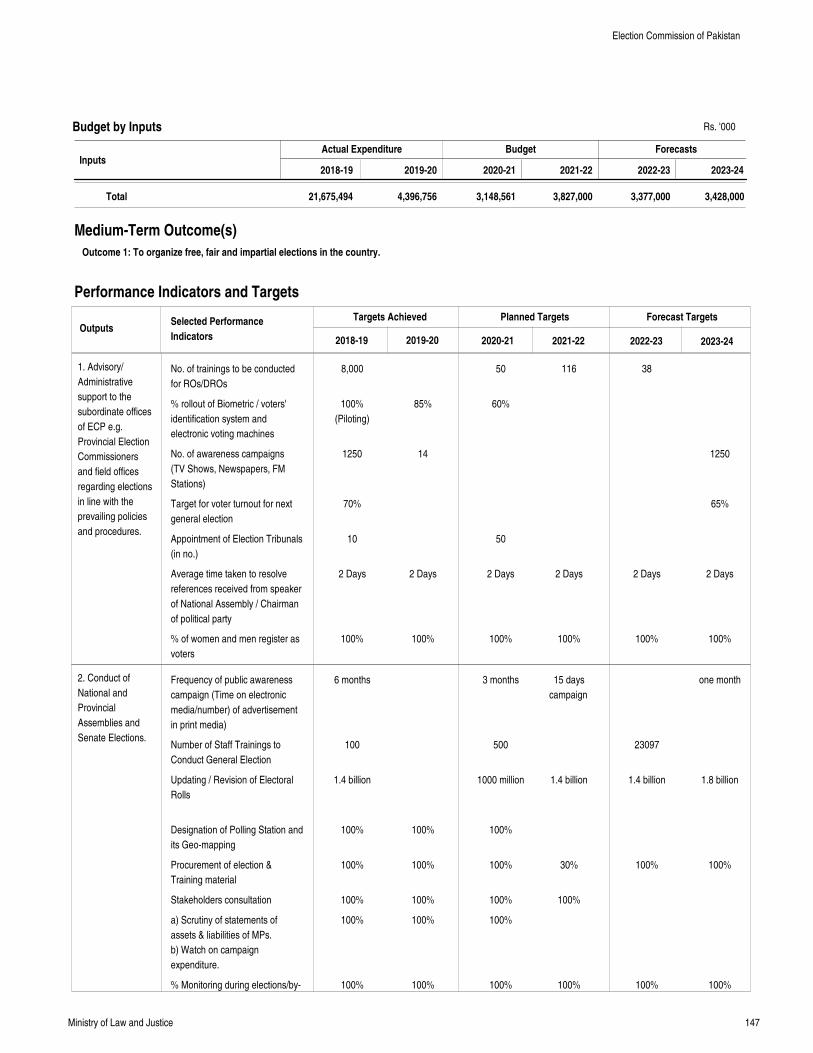
147Ministry of Law and Justice
InputsActual Expenditure Budget Forecasts
Total 21,675,494 4,396,756 3,148,561 3,827,000 3,377,000 3,428,000
2018-19 2019-20 2020-21 2021-22 2022-23 2023-24
Medium-Term Outcome(s)
Outcome 1: To organize free, fair and impartial elections in the country.
Performance Indicators and Targets
OutputsTargets Achieved Planned Targets Forecast Targets
2018-19 2019-20 2020-21 2021-22 2022-23 2023-24
Selected Performance
Indicators
1. Advisory/
Administrative
support to the
subordinate offices
of ECP e.g.
Provincial Election
Commissioners
and field offices
regarding elections
in line with the
prevailing policies
and procedures.
2. Conduct of
National and
Provincial
Assemblies and
Senate Elections.
Budget by Inputs
No. of trainings to be conducted
for ROs/DROs
% rollout of Biometric / voters'
identification system and
electronic voting machines
No. of awareness campaigns
(TV Shows, Newspapers, FM
Stations)
Target for voter turnout for next
general election
Appointment of Election Tribunals
(in no.)
Average time taken to resolve
references received from speaker
of National Assembly / Chairman
of political party
% of women and men register as
voters
Frequency of public awareness
campaign (Time on electronic
media/number) of advertisement
in print media)
Number of Staff Trainings to
Conduct General Election
Updating / Revision of Electoral
Rolls
Designation of Polling Station and
its Geo-mapping
Procurement of election &
Training material
Stakeholders consultation
a) Scrutiny of statements of
assets & liabilities of MPs.
b) Watch on campaign
expenditure.
% Monitoring during elections/by-
8,000
100%
(Piloting)
1250
70%
10
2 Days
100%
6 months
100
1.4 billion
100%
100%
100%
100%
100%
85%
14
2 Days
100%
100%
100%
100%
100%
100%
50
60%
50
2 Days
100%
3 months
500
1000 million
100%
100%
100%
100%
100%
116
2 Days
100%
15 days
campaign
1.4 billion
30%
100%
100%
38
2 Days
100%
23097
1.4 billion
100%
100%
1250
65%
2 Days
100%
one month
1.8 billion
100%
100%
Election Commission of Pakistan
Rs. '000
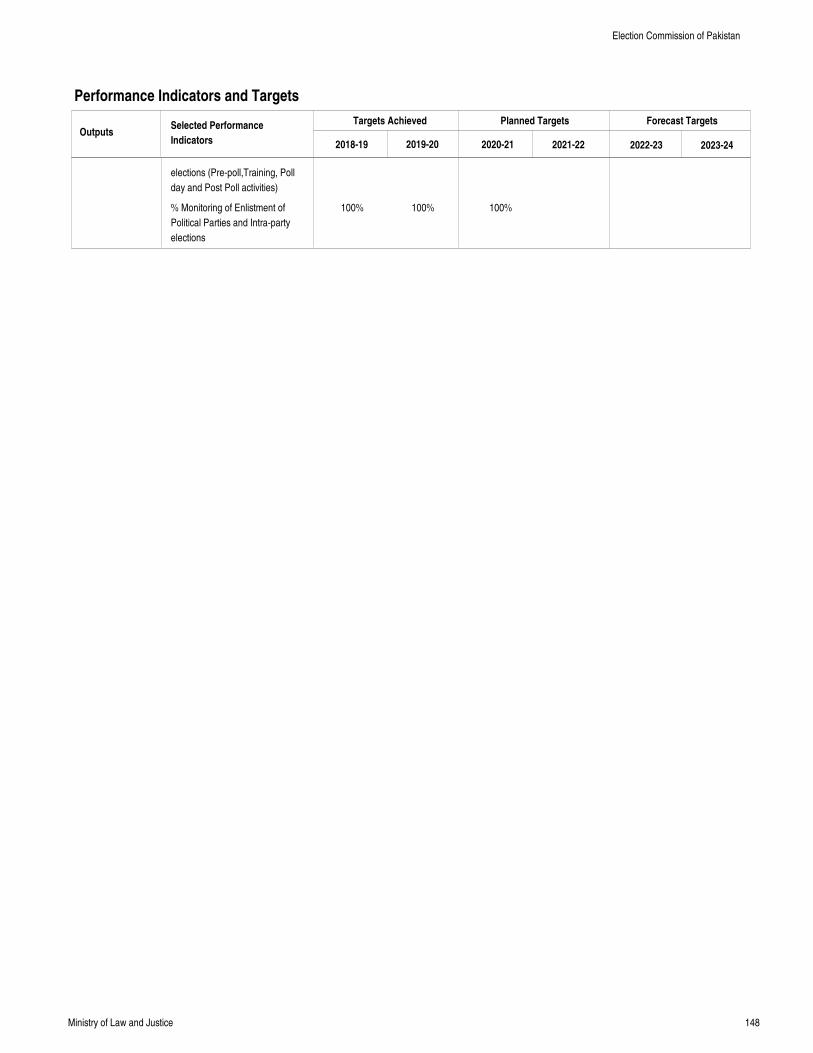
148Ministry of Law and Justice
Performance Indicators and Targets
OutputsTargets Achieved Planned Targets Forecast Targets
2018-19 2019-20 2020-21 2021-22 2022-23 2023-24
Selected Performance
Indicators
elections (Pre-poll,Training, Poll
day and Post Poll activities)
% Monitoring of Enlistment of
Political Parties and Intra-party
elections
100% 100% 100%
Election Commission of Pakistan
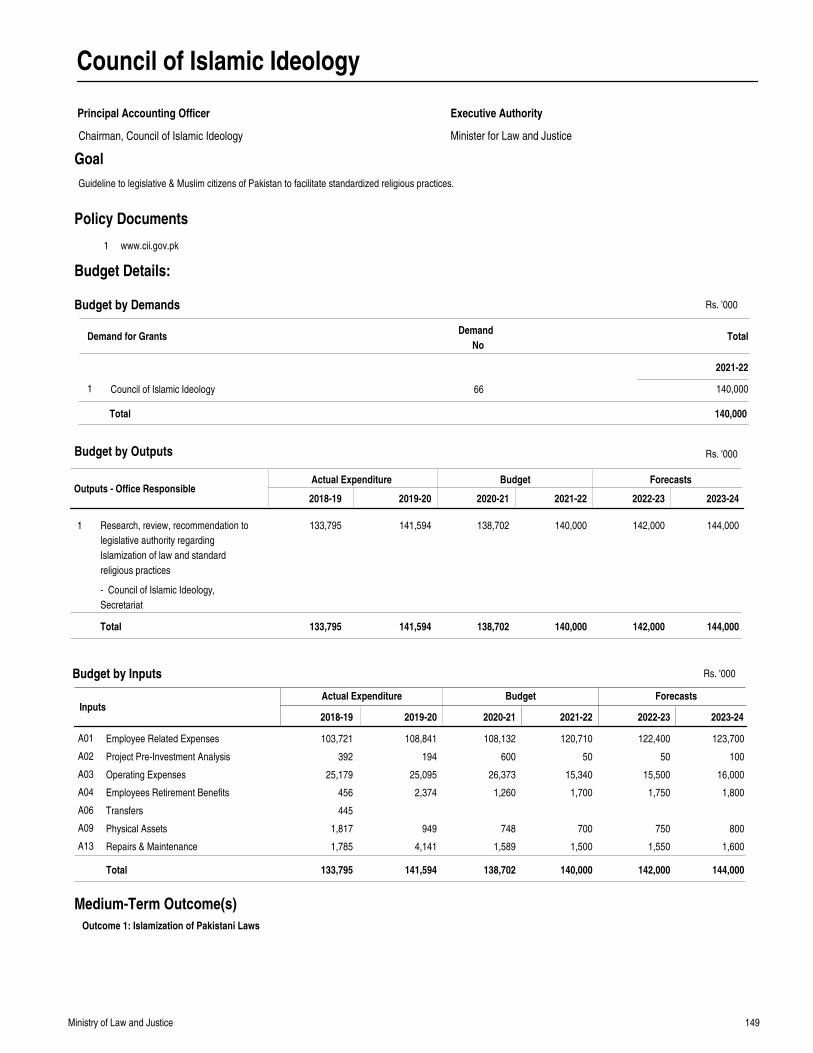
149Ministry of Law and Justice
Council of Islamic Ideology
Principal Accounting Officer
Minister for Law and Justice
Executive Authority
Goal
Outputs - Office ResponsibleActual Expenditure Budget Forecasts
2018-19 2019-20 2020-21 2021-22 2022-23 2023-24
Research, review, recommendation to
legislative authority regarding
Islamization of law and standard
religious practices
133,795 141,594 138,702 140,000 142,000 144,0001
Total 133,795 141,594 138,702 140,000 142,000 144,000
Rs. '000
InputsActual Expenditure Budget Forecasts
Employee Related Expenses
Project Pre-Investment Analysis
Operating Expenses
Employees Retirement Benefits
Transfers
Physical Assets
Repairs & Maintenance
103,721
392
25,179
456
445
1,817
1,785
108,841
194
25,095
2,374
949
4,141
108,132
600
26,373
1,260
748
1,589
120,710
50
15,340
1,700
700
1,500
122,400
50
15,500
1,750
750
1,550
123,700
100
16,000
1,800
800
1,600
A01
A02
A03
A04
A06
A09
A13
Total 133,795 141,594 138,702 140,000 142,000 144,000
2018-19 2019-20 2020-21 2021-22 2022-23 2023-24
1 www.cii.gov.pk
Policy Documents
Medium-Term Outcome(s)
Outcome 1: Islamization of Pakistani Laws
Budget by Outputs
Budget by Inputs
Guideline to legislative & Muslim citizens of Pakistan to facilitate standardized religious practices.
Demand for GrantsDemand
NoTotal
2021-22
Budget by Demands
Council of Islamic Ideology1 66 140,000
140,000Total
Chairman, Council of Islamic Ideology
Budget Details:
- Council of Islamic Ideology,
Secretariat
Rs. '000
Rs. '000
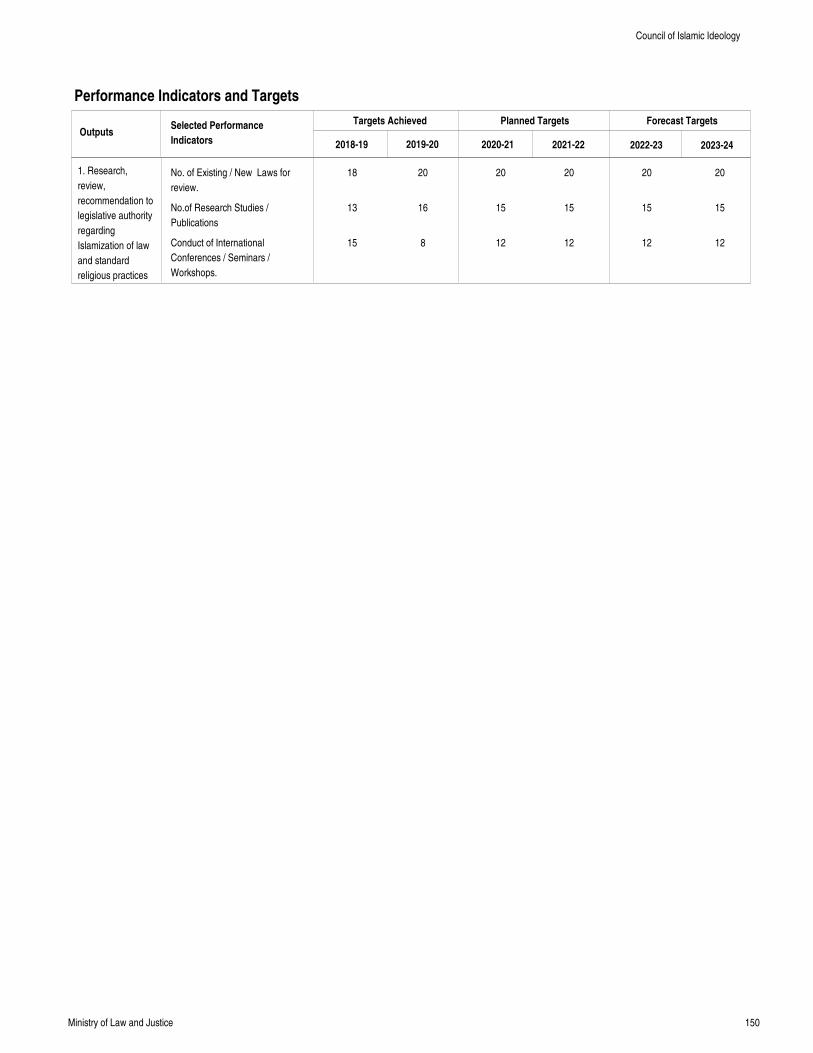
150Ministry of Law and Justice
Performance Indicators and Targets
OutputsTargets Achieved Planned Targets Forecast Targets
2018-19 2019-20 2020-21 2021-22 2022-23 2023-24
Selected Performance
Indicators
1. Research,
review,
recommendation to
legislative authority
regarding
Islamization of law
and standard
religious practices
No. of Existing / New Laws for
review.
No.of Research Studies /
Publications
Conduct of International
Conferences / Seminars /
Workshops.
18
13
15
20
16
8
20
15
12
20
15
12
20
15
12
20
15
12
Council of Islamic Ideology
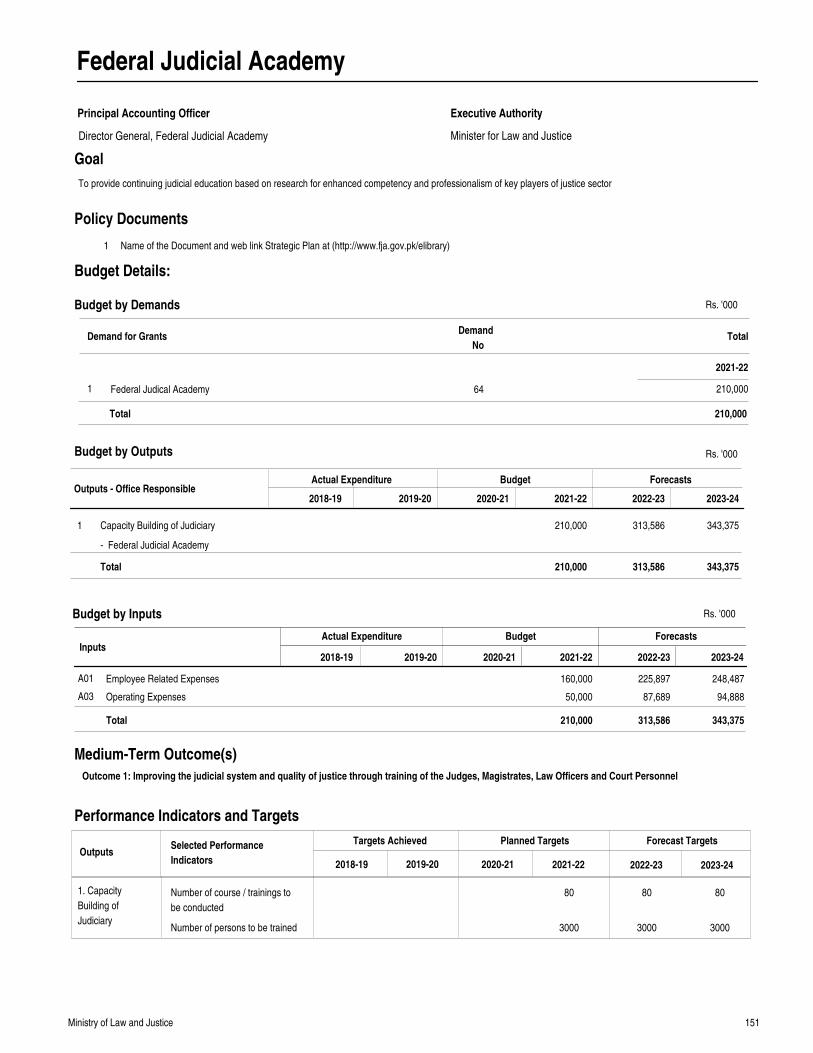
151Ministry of Law and Justice
Federal Judicial Academy
Principal Accounting Officer
Minister for Law and Justice
Executive Authority
Goal
Outputs - Office ResponsibleActual Expenditure Budget Forecasts
2018-19 2019-20 2020-21 2021-22 2022-23 2023-24
Capacity Building of Judiciary 210,000 313,586 343,3751
Total 210,000 313,586 343,375
Rs. '000
InputsActual Expenditure Budget Forecasts
Employee Related Expenses
Operating Expenses
160,000
50,000
225,897
87,689
248,487
94,888
A01
A03
Total 210,000 313,586 343,375
2018-19 2019-20 2020-21 2021-22 2022-23 2023-24
1 Name of the Document and web link Strategic Plan at (http://www.fja.gov.pk/elibrary)
Policy Documents
Medium-Term Outcome(s)
Outcome 1: Improving the judicial system and quality of justice through training of the Judges, Magistrates, Law Officers and Court Personnel
Performance Indicators and Targets
OutputsTargets Achieved Planned Targets Forecast Targets
2018-19 2019-20 2020-21 2021-22 2022-23 2023-24
Selected Performance
Indicators
1. Capacity
Building of
Judiciary
Budget by Outputs
Budget by Inputs
To provide continuing judicial education based on research for enhanced competency and professionalism of key players of justice sector
Number of course / trainings to
be conducted
Number of persons to be trained
80
3000
80
3000
80
3000
Demand for GrantsDemand
NoTotal
2021-22
Budget by Demands
Federal Judical Academy1 64 210,000
210,000Total
Director General, Federal Judicial Academy
Budget Details:
- Federal Judicial Academy
Rs. '000
Rs. '000
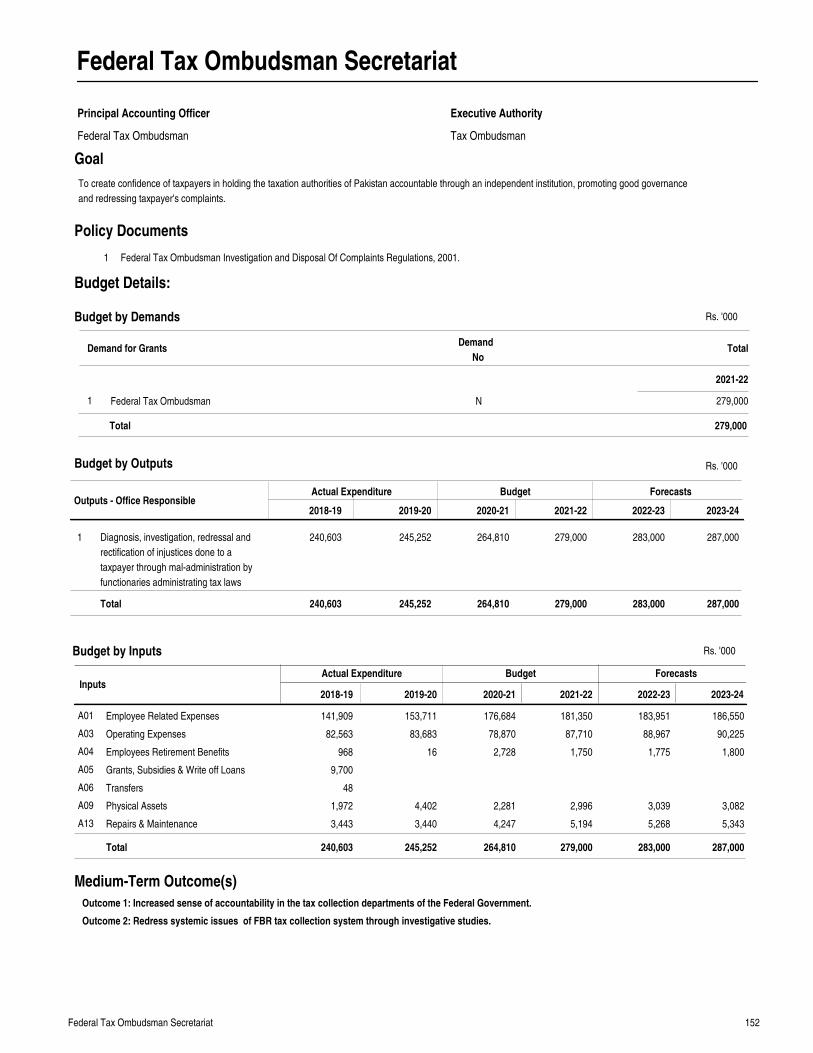
152Federal Tax Ombudsman Secretariat
Federal Tax Ombudsman Secretariat
Principal Accounting Officer
Federal Tax Ombudsman Tax Ombudsman
Executive Authority
Goal
Outputs - Office ResponsibleActual Expenditure Budget Forecasts
2018-19 2019-20 2020-21 2021-22 2022-23 2023-24
Diagnosis, investigation, redressal and
rectification of injustices done to a
taxpayer through mal-administration by
functionaries administrating tax laws
240,603 245,252 264,810 279,000 283,000 287,0001
Total 240,603 245,252 264,810 279,000 283,000 287,000
Rs. '000
InputsActual Expenditure Budget Forecasts
Employee Related Expenses
Operating Expenses
Employees Retirement Benefits
Grants, Subsidies & Write off Loans
Transfers
Physical Assets
Repairs & Maintenance
141,909
82,563
968
9,700
48
1,972
3,443
153,711
83,683
16
4,402
3,440
176,684
78,870
2,728
2,281
4,247
181,350
87,710
1,750
2,996
5,194
183,951
88,967
1,775
3,039
5,268
186,550
90,225
1,800
3,082
5,343
A01
A03
A04
A05
A06
A09
A13
Total 240,603 245,252 264,810 279,000 283,000 287,000
2018-19 2019-20 2020-21 2021-22 2022-23 2023-24
1 Federal Tax Ombudsman Investigation and Disposal Of Complaints Regulations, 2001.
Policy Documents
Medium-Term Outcome(s)
Outcome 1: Increased sense of accountability in the tax collection departments of the Federal Government.
Outcome 2: Redress systemic issues of FBR tax collection system through investigative studies.
Budget by Outputs
Budget by Inputs
To create confidence of taxpayers in holding the taxation authorities of Pakistan accountable through an independent institution, promoting good governance
and redressing taxpayer's complaints.
Demand for GrantsDemand
NoTotal
2021-22
Budget by Demands
Federal Tax Ombudsman1 N 279,000
279,000Total
Budget Details:
Rs. '000
Rs. '000
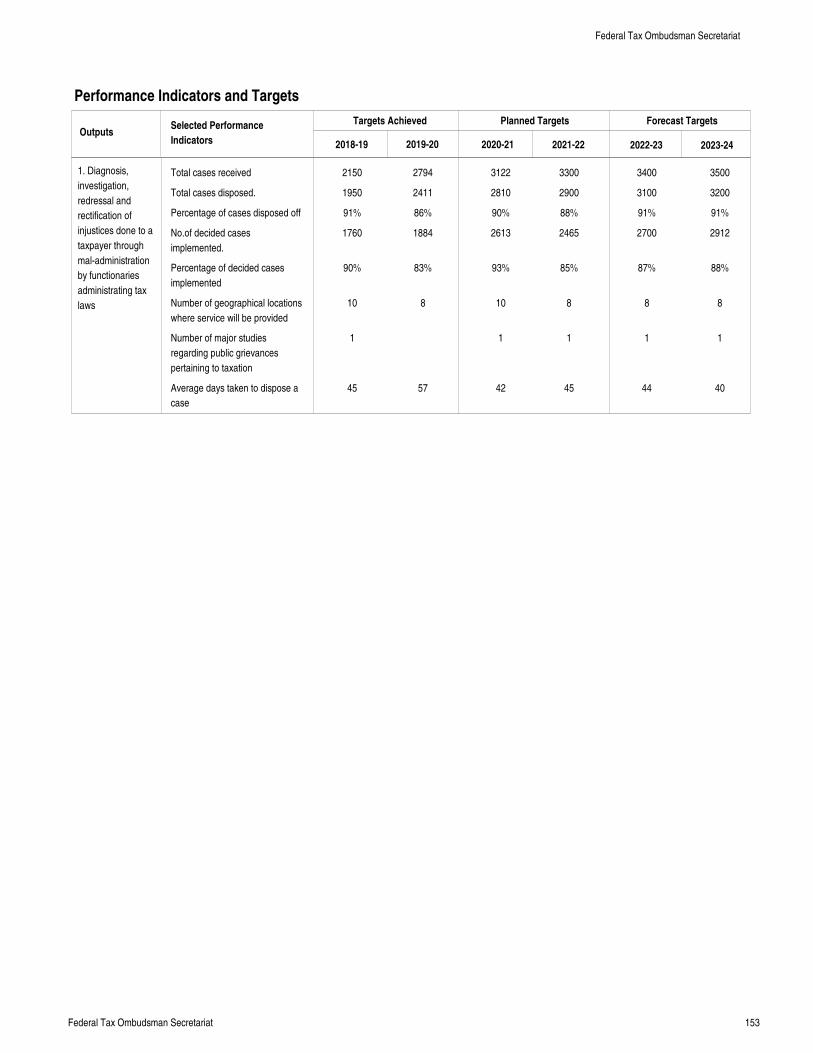
153Federal Tax Ombudsman Secretariat
Performance Indicators and Targets
OutputsTargets Achieved Planned Targets Forecast Targets
2018-19 2019-20 2020-21 2021-22 2022-23 2023-24
Selected Performance
Indicators
1. Diagnosis,
investigation,
redressal and
rectification of
injustices done to a
taxpayer through
mal-administration
by functionaries
administrating tax
laws
Total cases received
Total cases disposed.
Percentage of cases disposed off
No.of decided cases
implemented.
Percentage of decided cases
implemented
Number of geographical locations
where service will be provided
Number of major studies
regarding public grievances
pertaining to taxation
Average days taken to dispose a
case
2150
1950
91%
1760
90%
10
1
45
2794
2411
86%
1884
83%
8
57
3122
2810
90%
2613
93%
10
1
42
3300
2900
88%
2465
85%
8
1
45
3400
3100
91%
2700
87%
8
1
44
3500
3200
91%
2912
88%
8
1
40
Federal Tax Ombudsman Secretariat
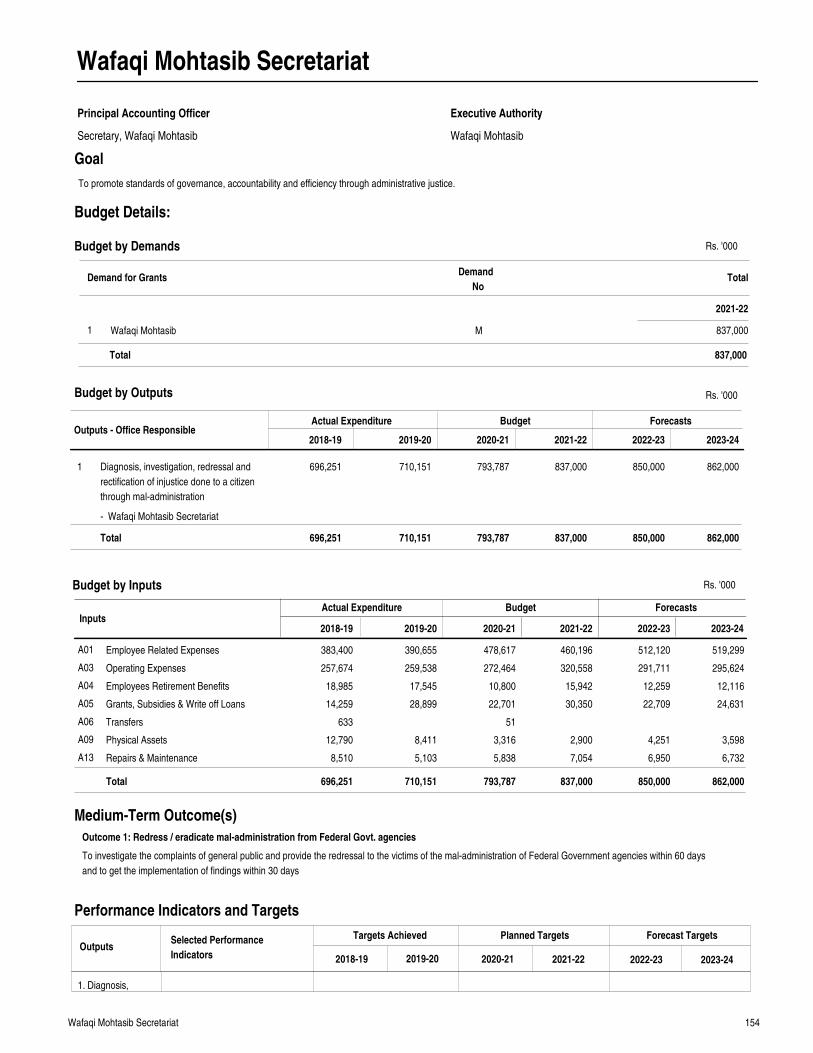
154Wafaqi Mohtasib Secretariat
Wafaqi Mohtasib Secretariat
Principal Accounting Officer
Secretary, Wafaqi Mohtasib Wafaqi Mohtasib
Executive Authority
Goal
Outputs - Office ResponsibleActual Expenditure Budget Forecasts
2018-19 2019-20 2020-21 2021-22 2022-23 2023-24
Diagnosis, investigation, redressal and
rectification of injustice done to a citizen
through mal-administration
696,251 710,151 793,787 837,000 850,000 862,0001
Total 696,251 710,151 793,787 837,000 850,000 862,000
Rs. '000
InputsActual Expenditure Budget Forecasts
Employee Related Expenses
Operating Expenses
Employees Retirement Benefits
Grants, Subsidies & Write off Loans
Transfers
Physical Assets
Repairs & Maintenance
383,400
257,674
18,985
14,259
633
12,790
8,510
390,655
259,538
17,545
28,899
8,411
5,103
478,617
272,464
10,800
22,701
51
3,316
5,838
460,196
320,558
15,942
30,350
2,900
7,054
512,120
291,711
12,259
22,709
4,251
6,950
519,299
295,624
12,116
24,631
3,598
6,732
A01
A03
A04
A05
A06
A09
A13
Total 696,251 710,151 793,787 837,000 850,000 862,000
2018-19 2019-20 2020-21 2021-22 2022-23 2023-24
To investigate the complaints of general public and provide the redressal to the victims of the mal-administration of Federal Government agencies within 60 days
and to get the implementation of findings within 30 days
Medium-Term Outcome(s)
Outcome 1: Redress / eradicate mal-administration from Federal Govt. agencies
Performance Indicators and Targets
OutputsTargets Achieved Planned Targets Forecast Targets
2018-19 2019-20 2020-21 2021-22 2022-23 2023-24
Selected Performance
Indicators
1. Diagnosis,
Budget by Outputs
Budget by Inputs
To promote standards of governance, accountability and efficiency through administrative justice.
Demand for GrantsDemand
NoTotal
2021-22
Budget by Demands
Wafaqi Mohtasib1 M 837,000
837,000Total
Budget Details:
- Wafaqi Mohtasib Secretariat
Rs. '000
Rs. '000
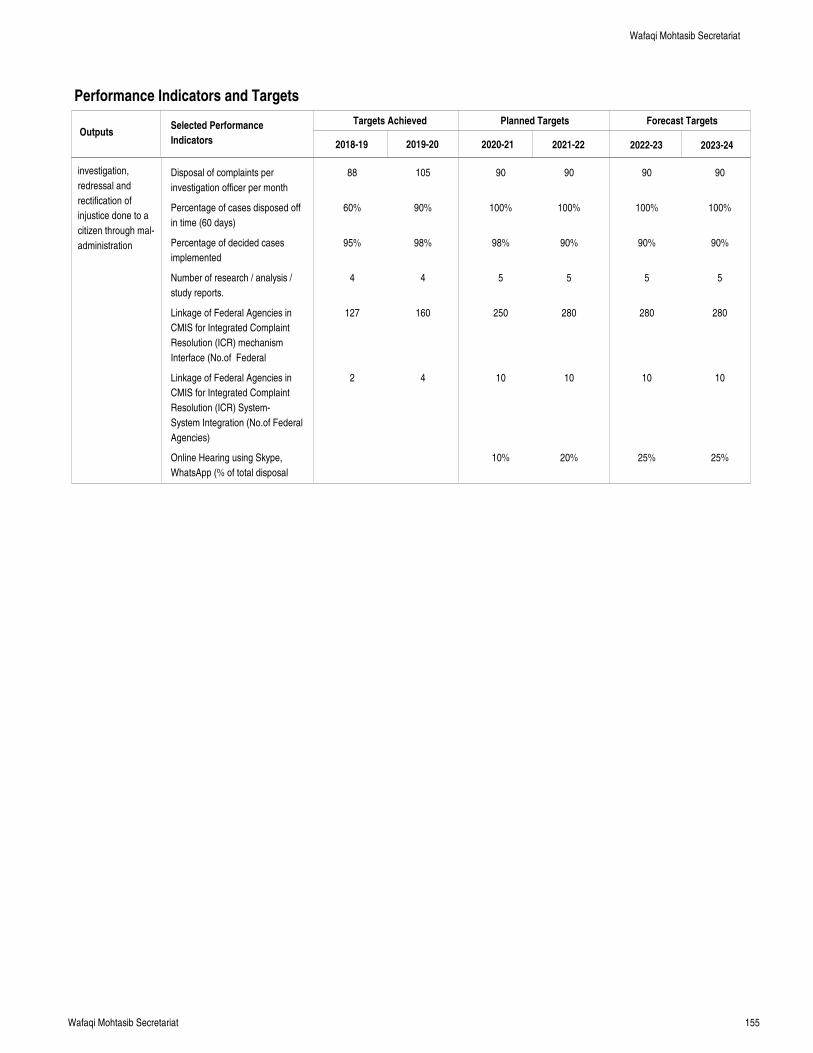
155Wafaqi Mohtasib Secretariat
Performance Indicators and Targets
OutputsTargets Achieved Planned Targets Forecast Targets
2018-19 2019-20 2020-21 2021-22 2022-23 2023-24
Selected Performance
Indicators
investigation,
redressal and
rectification of
injustice done to a
citizen through mal-
administration
Disposal of complaints per
investigation officer per month
Percentage of cases disposed off
in time (60 days)
Percentage of decided cases
implemented
Number of research / analysis /
study reports.
Linkage of Federal Agencies in
CMIS for Integrated Complaint
Resolution (ICR) mechanism
Interface (No.of Federal
Linkage of Federal Agencies in
CMIS for Integrated Complaint
Resolution (ICR) System-
System Integration (No.of Federal
Agencies)
Online Hearing using Skype,
WhatsApp (% of total disposal
88
60%
95%
4
127
2
105
90%
98%
4
160
4
90
100%
98%
5
250
10
10%
90
100%
90%
5
280
10
20%
90
100%
90%
5
280
10
25%
90
100%
90%
5
280
10
25%
Wafaqi Mohtasib Secretariat
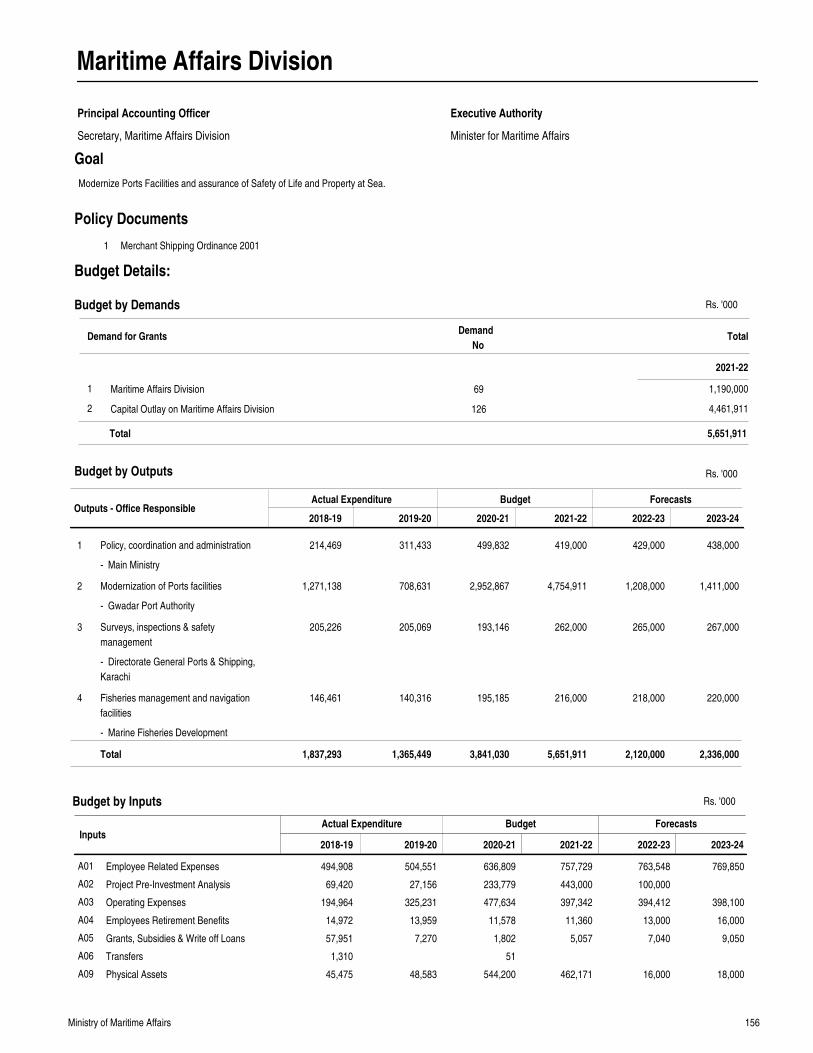
156Ministry of Maritime Affairs
Maritime Affairs Division
Principal Accounting Officer
Secretary, Maritime Affairs Division Minister for Maritime Affairs
Executive Authority
Goal
Outputs - Office ResponsibleActual Expenditure Budget Forecasts
2018-19 2019-20 2020-21 2021-22 2022-23 2023-24
Policy, coordination and administration
Modernization of Ports facilities
Surveys, inspections & safety
management
Fisheries management and navigation
facilities
214,469
1,271,138
205,226
146,461
311,433
708,631
205,069
140,316
499,832
2,952,867
193,146
195,185
419,000
4,754,911
262,000
216,000
429,000
1,208,000
265,000
218,000
438,000
1,411,000
267,000
220,000
1
2
3
4
Total 1,837,293 1,365,449 3,841,030 5,651,911 2,120,000 2,336,000
Rs. '000
InputsActual Expenditure Budget Forecasts
Employee Related Expenses
Project Pre-Investment Analysis
Operating Expenses
Employees Retirement Benefits
Grants, Subsidies & Write off Loans
Transfers
Physical Assets
494,908
69,420
194,964
14,972
57,951
1,310
45,475
504,551
27,156
325,231
13,959
7,270
48,583
636,809
233,779
477,634
11,578
1,802
51
544,200
757,729
443,000
397,342
11,360
5,057
462,171
763,548
100,000
394,412
13,000
7,040
16,000
769,850
398,100
16,000
9,050
18,000
A01
A02
A03
A04
A05
A06
A09
2018-19 2019-20 2020-21 2021-22 2022-23 2023-24
1 Merchant Shipping Ordinance 2001
Policy Documents
Budget by Outputs
Budget by Inputs
Modernize Ports Facilities and assurance of Safety of Life and Property at Sea.
Demand for GrantsDemand
NoTotal
2021-22
Budget by Demands
Maritime Affairs Division
Capital Outlay on Maritime Affairs Division
1
2
69
126
1,190,000
4,461,911
5,651,911Total
Budget Details:
- Main Ministry
- Gwadar Port Authority
- Directorate General Ports & Shipping,
Karachi
- Marine Fisheries Development
Rs. '000
Rs. '000
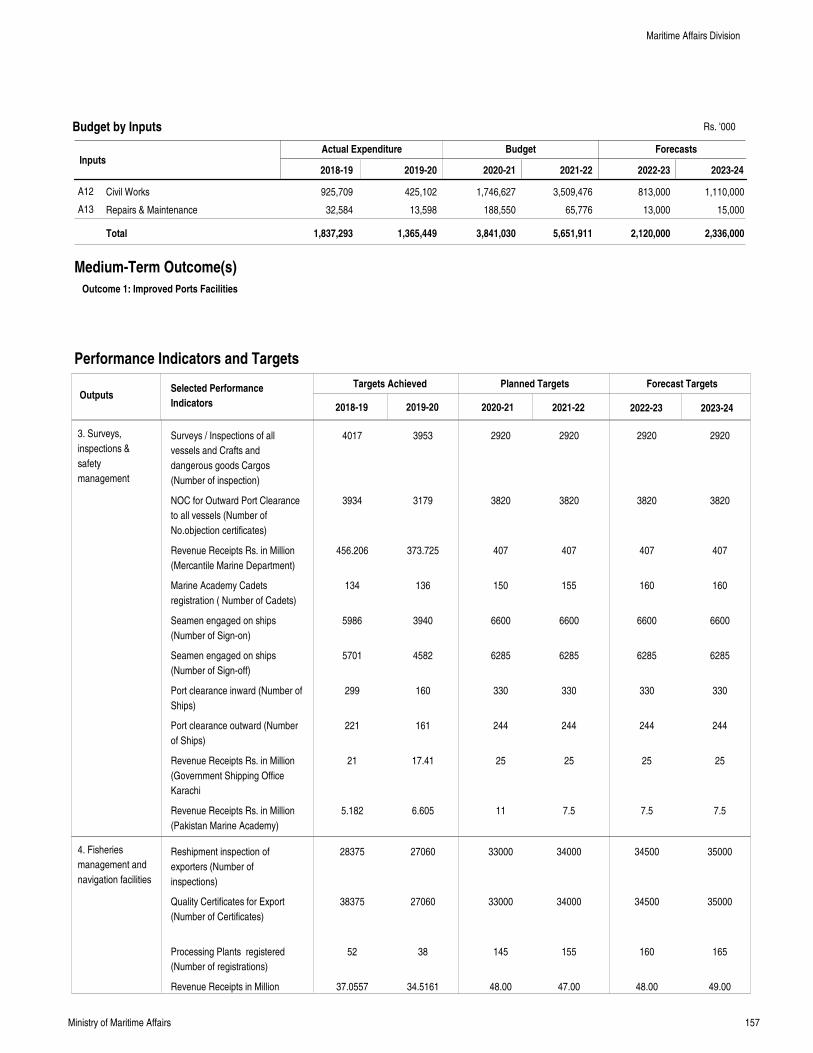
157Ministry of Maritime Affairs
InputsActual Expenditure Budget Forecasts
Civil Works
Repairs & Maintenance
925,709
32,584
425,102
13,598
1,746,627
188,550
3,509,476
65,776
813,000
13,000
1,110,000
15,000
A12
A13
Total 1,837,293 1,365,449 3,841,030 5,651,911 2,120,000 2,336,000
2018-19 2019-20 2020-21 2021-22 2022-23 2023-24
Medium-Term Outcome(s)
Outcome 1: Improved Ports Facilities
Performance Indicators and Targets
OutputsTargets Achieved Planned Targets Forecast Targets
2018-19 2019-20 2020-21 2021-22 2022-23 2023-24
Selected Performance
Indicators
3. Surveys,
inspections &
safety
management
4. Fisheries
management and
navigation facilities
Budget by Inputs
Surveys / Inspections of all
vessels and Crafts and
dangerous goods Cargos
(Number of inspection)
NOC for Outward Port Clearance
to all vessels (Number of
No.objection certificates)
Revenue Receipts Rs. in Million
(Mercantile Marine Department)
Marine Academy Cadets
registration ( Number of Cadets)
Seamen engaged on ships
(Number of Sign-on)
Seamen engaged on ships
(Number of Sign-off)
Port clearance inward (Number of
Ships)
Port clearance outward (Number
of Ships)
Revenue Receipts Rs. in Million
(Government Shipping Office
Karachi
Revenue Receipts Rs. in Million
(Pakistan Marine Academy)
Reshipment inspection of
exporters (Number of
inspections)
Quality Certificates for Export
(Number of Certificates)
Processing Plants registered
(Number of registrations)
Revenue Receipts in Million
4017
3934
456.206
134
5986
5701
299
221
21
5.182
28375
38375
52
37.0557
3953
3179
373.725
136
3940
4582
160
161
17.41
6.605
27060
27060
38
34.5161
2920
3820
407
150
6600
6285
330
244
25
11
33000
33000
145
48.00
2920
3820
407
155
6600
6285
330
244
25
7.5
34000
34000
155
47.00
2920
3820
407
160
6600
6285
330
244
25
7.5
34500
34500
160
48.00
2920
3820
407
160
6600
6285
330
244
25
7.5
35000
35000
165
49.00
Maritime Affairs Division
Rs. '000
158Ministry of Maritime Affairs
Performance Indicators and Targets
OutputsTargets Achieved Planned Targets Forecast Targets
2018-19 2019-20 2020-21 2021-22 2022-23 2023-24
Selected Performance
Indicators
(Marine Fisheries Department)
Maritime Affairs Division
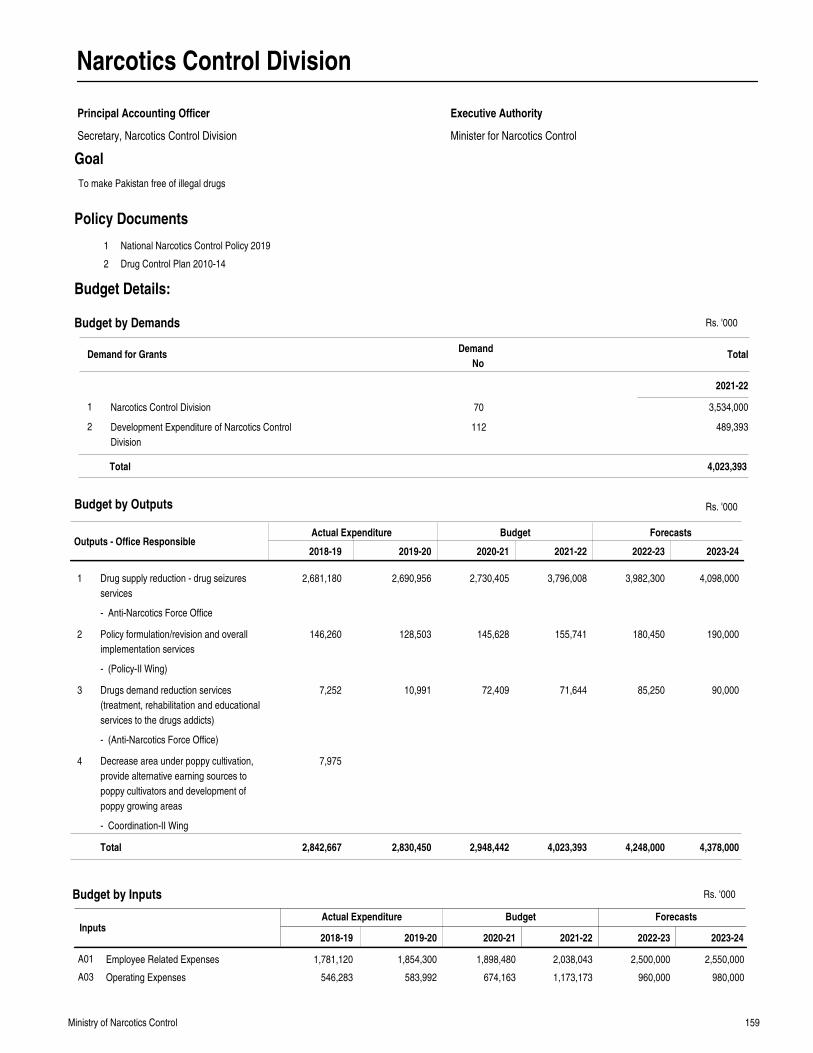
159Ministry of Narcotics Control
Narcotics Control Division
Principal Accounting Officer
Secretary, Narcotics Control Division Minister for Narcotics Control
Executive Authority
Goal
Outputs - Office ResponsibleActual Expenditure Budget Forecasts
2018-19 2019-20 2020-21 2021-22 2022-23 2023-24
Drug supply reduction - drug seizures
services
Policy formulation/revision and overall
implementation services
Drugs demand reduction services
(treatment, rehabilitation and educational
services to the drugs addicts)
Decrease area under poppy cultivation,
provide alternative earning sources to
poppy cultivators and development of
poppy growing areas
2,681,180
146,260
7,252
7,975
2,690,956
128,503
10,991
2,730,405
145,628
72,409
3,796,008
155,741
71,644
3,982,300
180,450
85,250
4,098,000
190,000
90,000
1
2
3
4
Total 2,842,667 2,830,450 2,948,442 4,023,393 4,248,000 4,378,000
Rs. '000
InputsActual Expenditure Budget Forecasts
Employee Related Expenses
Operating Expenses
1,781,120
546,283
1,854,300
583,992
1,898,480
674,163
2,038,043
1,173,173
2,500,000
960,000
2,550,000
980,000
A01
A03
2018-19 2019-20 2020-21 2021-22 2022-23 2023-24
1
2
National Narcotics Control Policy 2019
Drug Control Plan 2010-14
Policy Documents
Budget by Outputs
Budget by Inputs
To make Pakistan free of illegal drugs
Demand for GrantsDemand
NoTotal
2021-22
Budget by Demands
Narcotics Control Division
Development Expenditure of Narcotics Control
Division
1
2
70
112
3,534,000
489,393
4,023,393Total
Budget Details:
- Anti-Narcotics Force Office
- (Policy-II Wing)
- (Anti-Narcotics Force Office)
- Coordination-II Wing
Rs. '000
Rs. '000
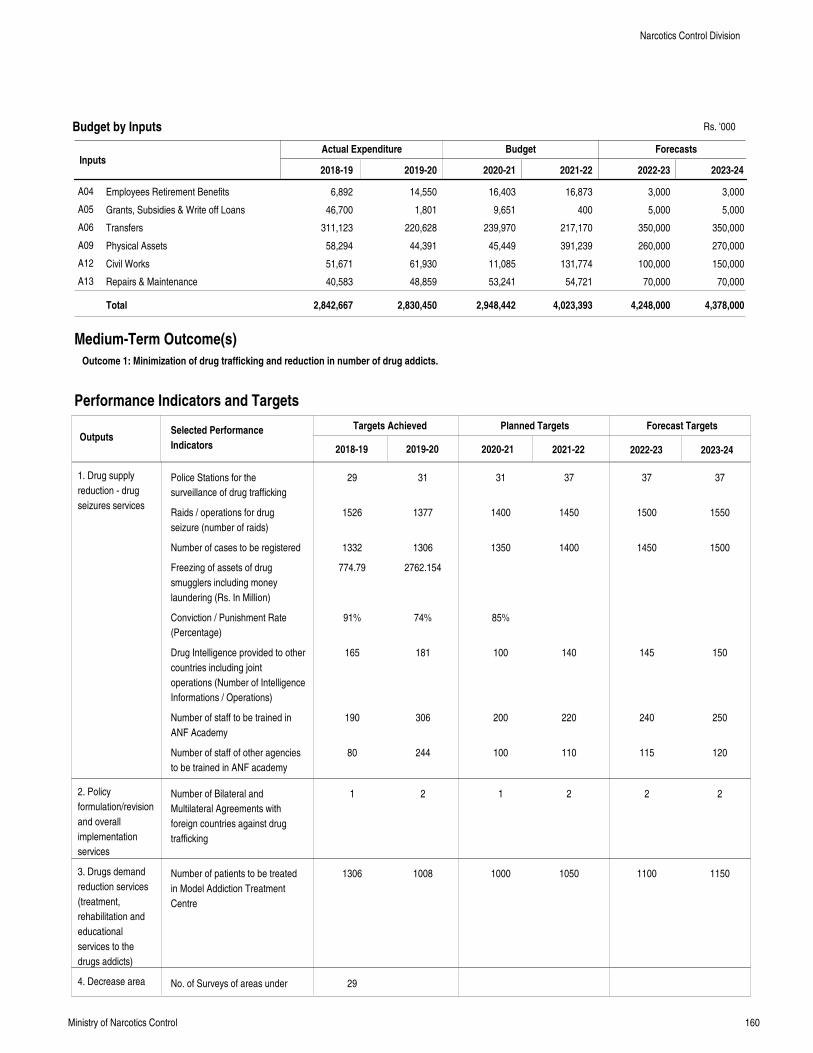
160Ministry of Narcotics Control
InputsActual Expenditure Budget Forecasts
Employees Retirement Benefits
Grants, Subsidies & Write off Loans
Transfers
Physical Assets
Civil Works
Repairs & Maintenance
6,892
46,700
311,123
58,294
51,671
40,583
14,550
1,801
220,628
44,391
61,930
48,859
16,403
9,651
239,970
45,449
11,085
53,241
16,873
400
217,170
391,239
131,774
54,721
3,000
5,000
350,000
260,000
100,000
70,000
3,000
5,000
350,000
270,000
150,000
70,000
A04
A05
A06
A09
A12
A13
Total 2,842,667 2,830,450 2,948,442 4,023,393 4,248,000 4,378,000
2018-19 2019-20 2020-21 2021-22 2022-23 2023-24
Medium-Term Outcome(s)
Outcome 1: Minimization of drug trafficking and reduction in number of drug addicts.
Performance Indicators and Targets
OutputsTargets Achieved Planned Targets Forecast Targets
2018-19 2019-20 2020-21 2021-22 2022-23 2023-24
Selected Performance
Indicators
1. Drug supply
reduction - drug
seizures services
2. Policy
formulation/revision
and overall
implementation
services
3. Drugs demand
reduction services
(treatment,
rehabilitation and
educational
services to the
drugs addicts)
4. Decrease area
Budget by Inputs
Police Stations for the
surveillance of drug trafficking
Raids / operations for drug
seizure (number of raids)
Number of cases to be registered
Freezing of assets of drug
smugglers including money
laundering (Rs. In Million)
Conviction / Punishment Rate
(Percentage)
Drug Intelligence provided to other
countries including joint
operations (Number of Intelligence
Informations / Operations)
Number of staff to be trained in
ANF Academy
Number of staff of other agencies
to be trained in ANF academy
Number of Bilateral and
Multilateral Agreements with
foreign countries against drug
trafficking
Number of patients to be treated
in Model Addiction Treatment
Centre
No. of Surveys of areas under
29
1526
1332
774.79
91%
165
190
80
1
1306
29
31
1377
1306
2762.154
74%
181
306
244
2
1008
31
1400
1350
85%
100
200
100
1
1000
37
1450
1400
140
220
110
2
1050
37
1500
1450
145
240
115
2
1100
37
1550
1500
150
250
120
2
1150
Narcotics Control Division
Rs. '000
161Ministry of Narcotics Control
Performance Indicators and Targets
OutputsTargets Achieved Planned Targets Forecast Targets
2018-19 2019-20 2020-21 2021-22 2022-23 2023-24
Selected Performance
Indicators
under poppy
cultivation, provide
alternative earning
sources to poppy
cultivators and
development of
poppy growing
areas
poppy cultivation conducted
Narcotics Control Division
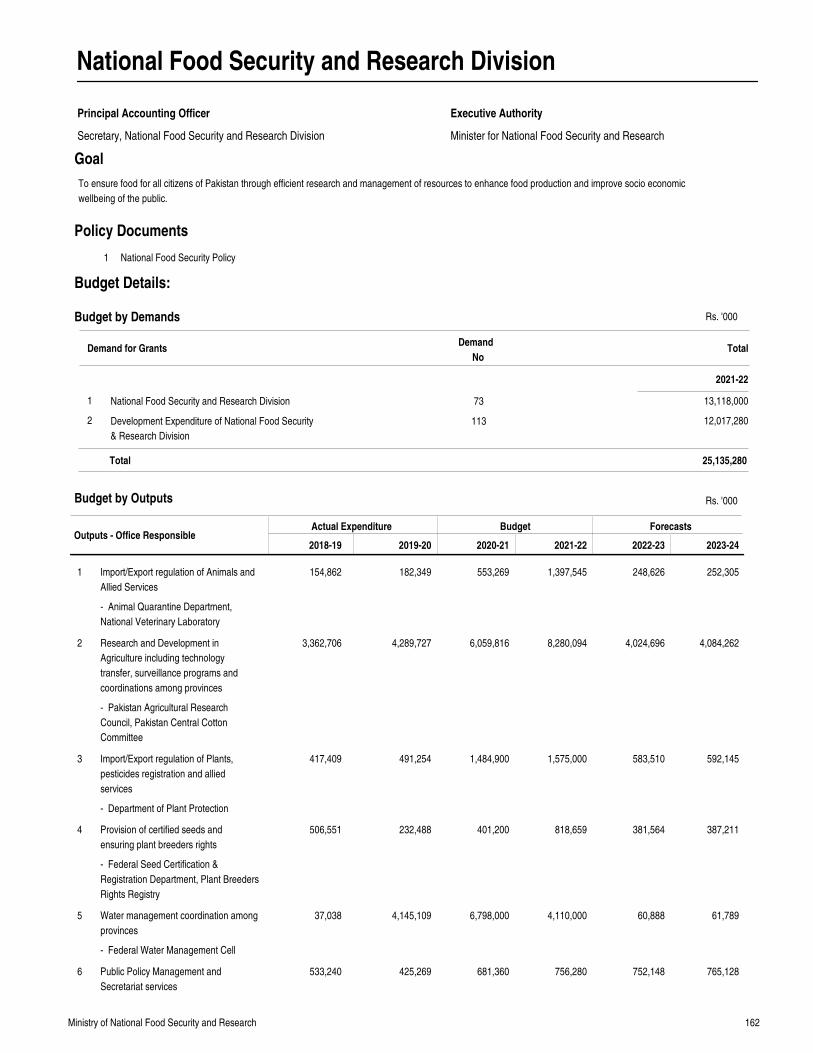
162Ministry of National Food Security and Research
National Food Security and Research Division
Principal Accounting Officer
Secretary, National Food Security and Research Division Minister for National Food Security and Research
Executive Authority
Goal
Outputs - Office ResponsibleActual Expenditure Budget Forecasts
2018-19 2019-20 2020-21 2021-22 2022-23 2023-24
Import/Export regulation of Animals and
Allied Services
Research and Development in
Agriculture including technology
transfer, surveillance programs and
coordinations among provinces
Import/Export regulation of Plants,
pesticides registration and allied
services
Provision of certified seeds and
ensuring plant breeders rights
Water management coordination among
provinces
Public Policy Management and
Secretariat services
154,862
3,362,706
417,409
506,551
37,038
533,240
182,349
4,289,727
491,254
232,488
4,145,109
425,269
553,269
6,059,816
1,484,900
401,200
6,798,000
681,360
1,397,545
8,280,094
1,575,000
818,659
4,110,000
756,280
248,626
4,024,696
583,510
381,564
60,888
752,148
252,305
4,084,262
592,145
387,211
61,789
765,128
1
2
3
4
5
6
Rs. '000
1 National Food Security Policy
Policy Documents
Budget by Outputs
To ensure food for all citizens of Pakistan through efficient research and management of resources to enhance food production and improve socio economic
wellbeing of the public.
Demand for GrantsDemand
NoTotal
2021-22
Budget by Demands
National Food Security and Research Division
Development Expenditure of National Food Security
& Research Division
1
2
73
113
13,118,000
12,017,280
25,135,280Total
Budget Details:
- Animal Quarantine Department,
National Veterinary Laboratory
- Pakistan Agricultural Research
Council, Pakistan Central Cotton
Committee
- Department of Plant Protection
- Federal Seed Certification &
Registration Department, Plant Breeders
Rights Registry
- Federal Water Management Cell
Rs. '000
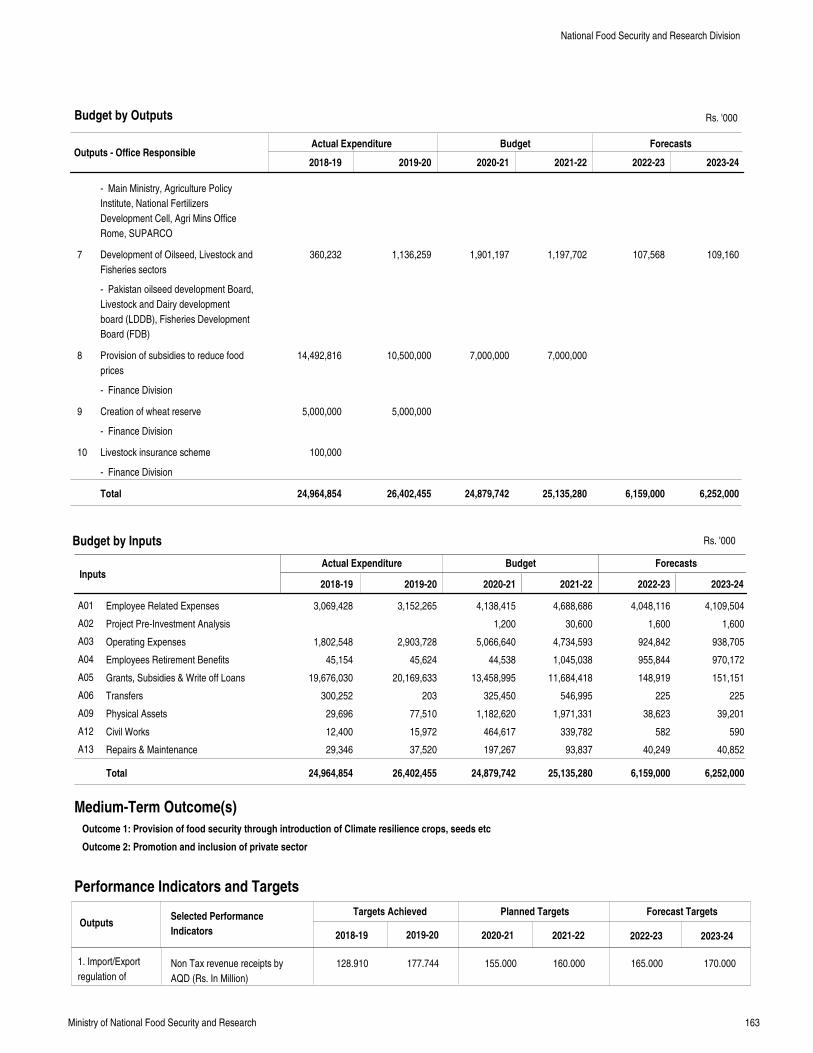
163Ministry of National Food Security and Research
Outputs - Office ResponsibleActual Expenditure Budget Forecasts
2018-19 2019-20 2020-21 2021-22 2022-23 2023-24
Development of Oilseed, Livestock and
Fisheries sectors
Provision of subsidies to reduce food
prices
Creation of wheat reserve
Livestock insurance scheme
360,232
14,492,816
5,000,000
100,000
1,136,259
10,500,000
5,000,000
1,901,197
7,000,000
1,197,702
7,000,000
107,568 109,1607
8
9
10
Total 24,964,854 26,402,455 24,879,742 25,135,280 6,159,000 6,252,000
Rs. '000
InputsActual Expenditure Budget Forecasts
Employee Related Expenses
Project Pre-Investment Analysis
Operating Expenses
Employees Retirement Benefits
Grants, Subsidies & Write off Loans
Transfers
Physical Assets
Civil Works
Repairs & Maintenance
3,069,428
1,802,548
45,154
19,676,030
300,252
29,696
12,400
29,346
3,152,265
2,903,728
45,624
20,169,633
203
77,510
15,972
37,520
4,138,415
1,200
5,066,640
44,538
13,458,995
325,450
1,182,620
464,617
197,267
4,688,686
30,600
4,734,593
1,045,038
11,684,418
546,995
1,971,331
339,782
93,837
4,048,116
1,600
924,842
955,844
148,919
225
38,623
582
40,249
4,109,504
1,600
938,705
970,172
151,151
225
39,201
590
40,852
A01
A02
A03
A04
A05
A06
A09
A12
A13
Total 24,964,854 26,402,455 24,879,742 25,135,280 6,159,000 6,252,000
2018-19 2019-20 2020-21 2021-22 2022-23 2023-24
Medium-Term Outcome(s)
Outcome 1: Provision of food security through introduction of Climate resilience crops, seeds etc
Outcome 2: Promotion and inclusion of private sector
Performance Indicators and Targets
OutputsTargets Achieved Planned Targets Forecast Targets
2018-19 2019-20 2020-21 2021-22 2022-23 2023-24
Selected Performance
Indicators
1. Import/Export
regulation of
Budget by Outputs
Budget by Inputs
Non Tax revenue receipts by
AQD (Rs. In Million)
128.910 177.744 155.000 160.000 165.000 170.000
National Food Security and Research Division
- Main Ministry, Agriculture Policy
Institute, National Fertilizers
Development Cell, Agri Mins Office
Rome, SUPARCO
- Pakistan oilseed development Board,
Livestock and Dairy development
board (LDDB), Fisheries Development
Board (FDB)
- Finance Division
- Finance Division
- Finance Division
Rs. '000
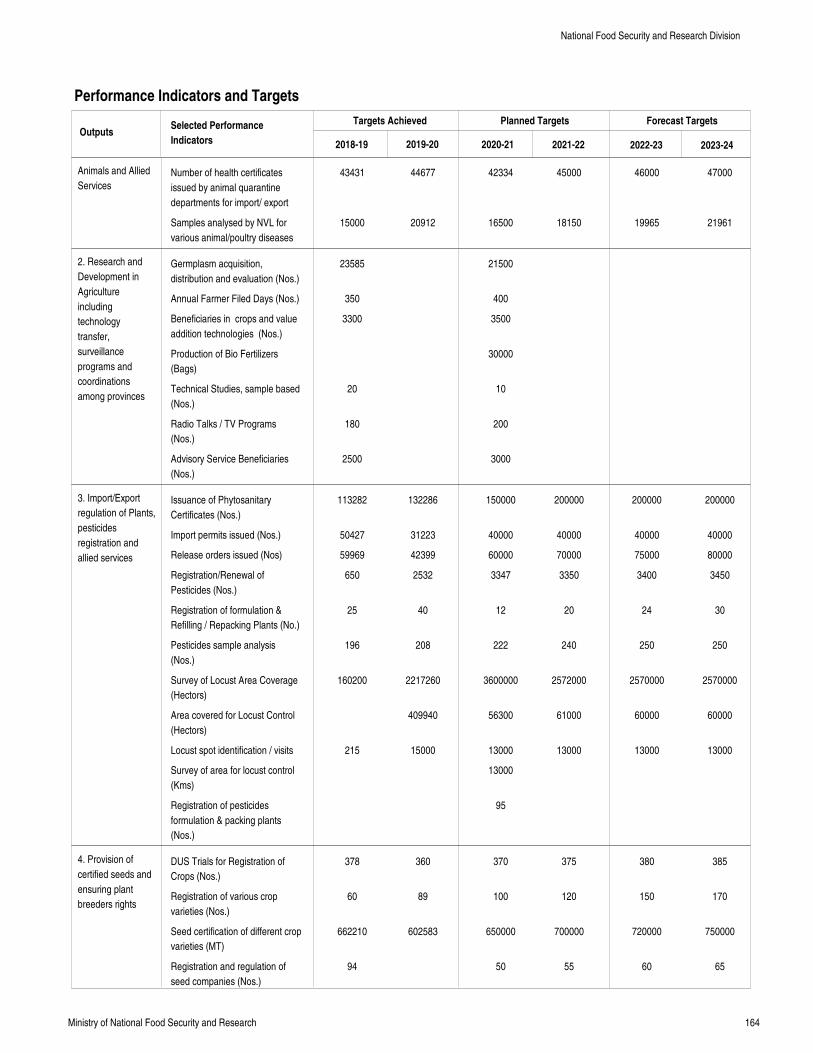
164Ministry of National Food Security and Research
Performance Indicators and Targets
OutputsTargets Achieved Planned Targets Forecast Targets
2018-19 2019-20 2020-21 2021-22 2022-23 2023-24
Selected Performance
Indicators
Animals and Allied
Services
2. Research and
Development in
Agriculture
including
technology
transfer,
surveillance
programs and
coordinations
among provinces
3. Import/Export
regulation of Plants,
pesticides
registration and
allied services
4. Provision of
certified seeds and
ensuring plant
breeders rights
Number of health certificates
issued by animal quarantine
departments for import/ export
Samples analysed by NVL for
various animal/poultry diseases
Germplasm acquisition,
distribution and evaluation (Nos.)
Annual Farmer Filed Days (Nos.)
Beneficiaries in crops and value
addition technologies (Nos.)
Production of Bio Fertilizers
(Bags)
Technical Studies, sample based
(Nos.)
Radio Talks / TV Programs
(Nos.)
Advisory Service Beneficiaries
(Nos.)
Issuance of Phytosanitary
Certificates (Nos.)
Import permits issued (Nos.)
Release orders issued (Nos)
Registration/Renewal of
Pesticides (Nos.)
Registration of formulation &
Refilling / Repacking Plants (No.)
Pesticides sample analysis
(Nos.)
Survey of Locust Area Coverage
(Hectors)
Area covered for Locust Control
(Hectors)
Locust spot identification / visits
Survey of area for locust control
(Kms)
Registration of pesticides
formulation & packing plants
(Nos.)
DUS Trials for Registration of
Crops (Nos.)
Registration of various crop
varieties (Nos.)
Seed certification of different crop
varieties (MT)
Registration and regulation of
seed companies (Nos.)
43431
15000
23585
350
3300
20
180
2500
113282
50427
59969
650
25
196
160200
215
378
60
662210
94
44677
20912
132286
31223
42399
2532
40
208
2217260
409940
15000
360
89
602583
42334
16500
21500
400
3500
30000
10
200
3000
150000
40000
60000
3347
12
222
3600000
56300
13000
13000
95
370
100
650000
50
45000
18150
200000
40000
70000
3350
20
240
2572000
61000
13000
375
120
700000
55
46000
19965
200000
40000
75000
3400
24
250
2570000
60000
13000
380
150
720000
60
47000
21961
200000
40000
80000
3450
30
250
2570000
60000
13000
385
170
750000
65
National Food Security and Research Division
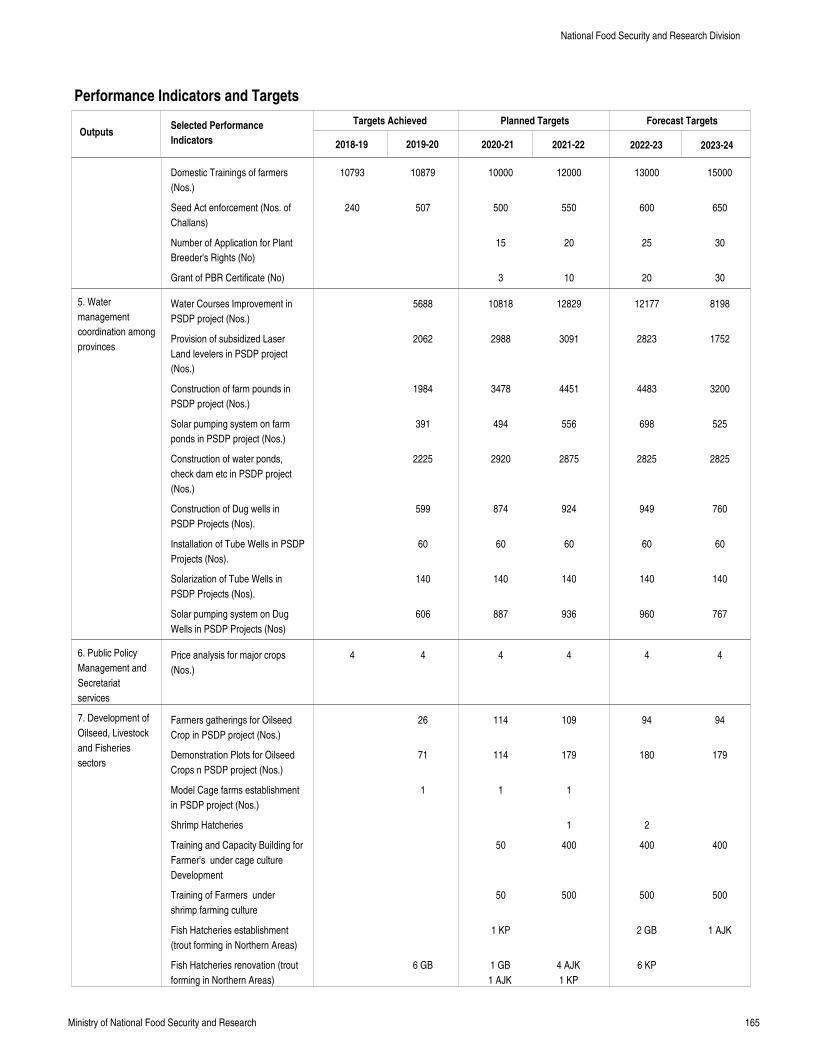
165Ministry of National Food Security and Research
Performance Indicators and Targets
OutputsTargets Achieved Planned Targets Forecast Targets
2018-19 2019-20 2020-21 2021-22 2022-23 2023-24
Selected Performance
Indicators
5. Water
management
coordination among
provinces
6. Public Policy
Management and
Secretariat
services
7. Development of
Oilseed, Livestock
and Fisheries
sectors
Domestic Trainings of farmers
(Nos.)
Seed Act enforcement (Nos. of
Challans)
Number of Application for Plant
Breeder's Rights (No)
Grant of PBR Certificate (No)
Water Courses Improvement in
PSDP project (Nos.)
Provision of subsidized Laser
Land levelers in PSDP project
(Nos.)
Construction of farm pounds in
PSDP project (Nos.)
Solar pumping system on farm
ponds in PSDP project (Nos.)
Construction of water ponds,
check dam etc in PSDP project
(Nos.)
Construction of Dug wells in
PSDP Projects (Nos).
Installation of Tube Wells in PSDP
Projects (Nos).
Solarization of Tube Wells in
PSDP Projects (Nos).
Solar pumping system on Dug
Wells in PSDP Projects (Nos)
Price analysis for major crops
(Nos.)
Farmers gatherings for Oilseed
Crop in PSDP project (Nos.)
Demonstration Plots for Oilseed
Crops n PSDP project (Nos.)
Model Cage farms establishment
in PSDP project (Nos.)
Shrimp Hatcheries
Training and Capacity Building for
Farmer's under cage culture
Development
Training of Farmers under
shrimp farming culture
Fish Hatcheries establishment
(trout forming in Northern Areas)
Fish Hatcheries renovation (trout
forming in Northern Areas)
10793
240
4
10879
507
5688
2062
1984
391
2225
599
60
140
606
4
26
71
1
6 GB
10000
500
15
3
10818
2988
3478
494
2920
874
60
140
887
4
114
114
1
50
50
1 KP
1 GB
1 AJK
12000
550
20
10
12829
3091
4451
556
2875
924
60
140
936
4
109
179
1
1
400
500
4 AJK
1 KP
13000
600
25
20
12177
2823
4483
698
2825
949
60
140
960
4
94
180
2
400
500
2 GB
6 KP
15000
650
30
30
8198
1752
3200
525
2825
760
60
140
767
4
94
179
400
500
1 AJK
National Food Security and Research Division
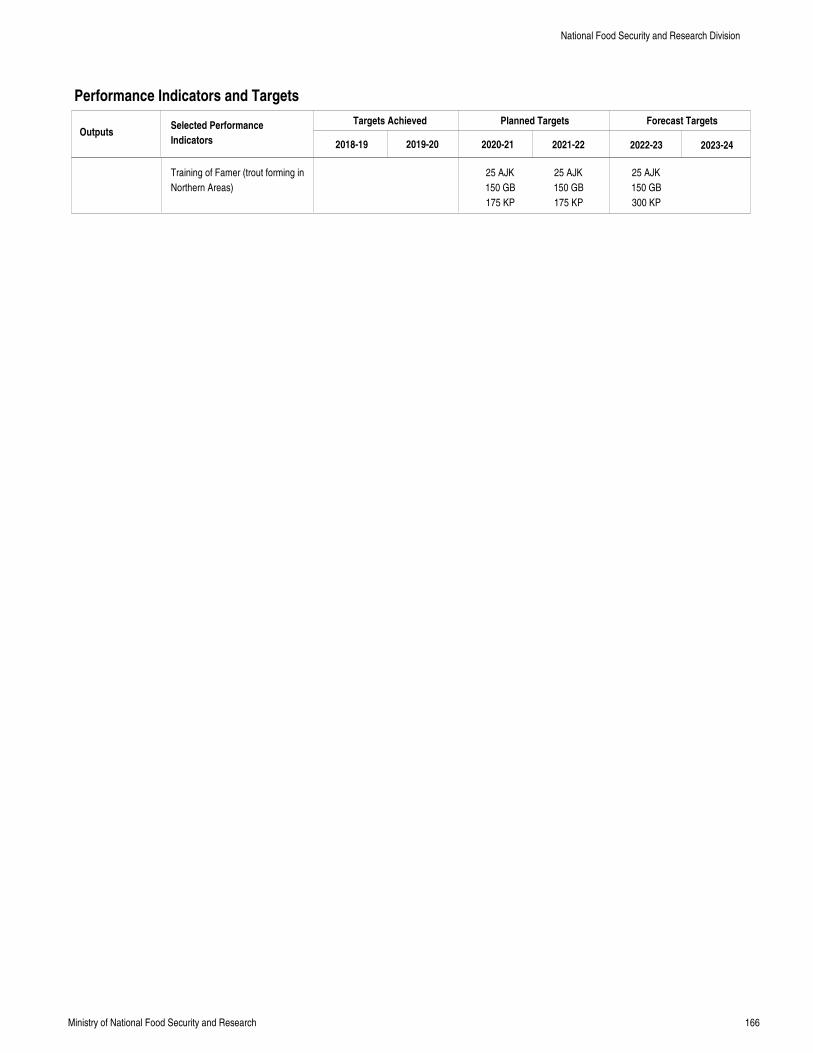
166Ministry of National Food Security and Research
Performance Indicators and Targets
OutputsTargets Achieved Planned Targets Forecast Targets
2018-19 2019-20 2020-21 2021-22 2022-23 2023-24
Selected Performance
Indicators
Training of Famer (trout forming in
Northern Areas)
25 AJK
150 GB
175 KP
25 AJK
150 GB
175 KP
25 AJK
150 GB
300 KP
National Food Security and Research Division
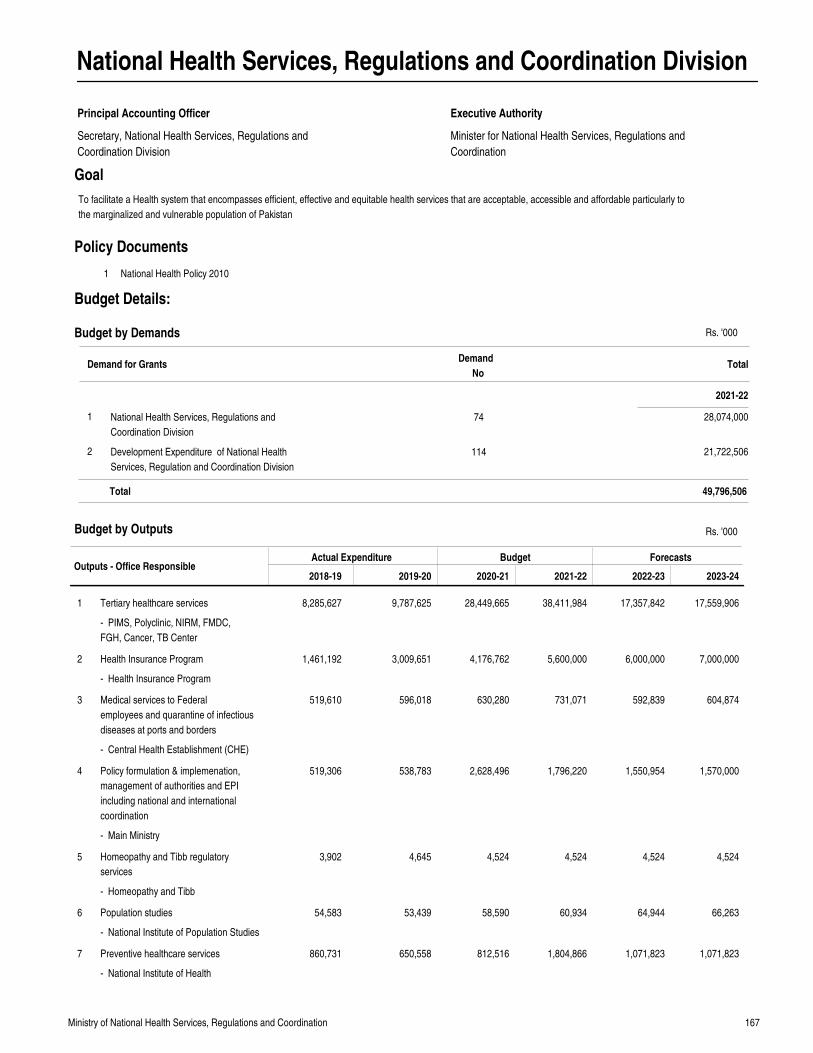
167Ministry of National Health Services, Regulations and Coordination
National Health Services, Regulations and Coordination Division
Principal Accounting Officer
Secretary, National Health Services, Regulations and
Coordination Division
Minister for National Health Services, Regulations and
Coordination
Executive Authority
Goal
Outputs - Office ResponsibleActual Expenditure Budget Forecasts
2018-19 2019-20 2020-21 2021-22 2022-23 2023-24
Tertiary healthcare services
Health Insurance Program
Medical services to Federal
employees and quarantine of infectious
diseases at ports and borders
Policy formulation & implemenation,
management of authorities and EPI
including national and international
coordination
Homeopathy and Tibb regulatory
services
Population studies
Preventive healthcare services
8,285,627
1,461,192
519,610
519,306
3,902
54,583
860,731
9,787,625
3,009,651
596,018
538,783
4,645
53,439
650,558
28,449,665
4,176,762
630,280
2,628,496
4,524
58,590
812,516
38,411,984
5,600,000
731,071
1,796,220
4,524
60,934
1,804,866
17,357,842
6,000,000
592,839
1,550,954
4,524
64,944
1,071,823
17,559,906
7,000,000
604,874
1,570,000
4,524
66,263
1,071,823
1
2
3
4
5
6
7
Rs. '000
1 National Health Policy 2010
Policy Documents
Budget by Outputs
To facilitate a Health system that encompasses efficient, effective and equitable health services that are acceptable, accessible and affordable particularly to
the marginalized and vulnerable population of Pakistan
Demand for GrantsDemand
NoTotal
2021-22
Budget by Demands
National Health Services, Regulations and
Coordination Division
Development Expenditure of National Health
Services, Regulation and Coordination Division
1
2
74
114
28,074,000
21,722,506
49,796,506Total
Budget Details:
- PIMS, Polyclinic, NIRM, FMDC,
FGH, Cancer, TB Center
- Health Insurance Program
- Central Health Establishment (CHE)
- Main Ministry
- Homeopathy and Tibb
- National Institute of Population Studies
- National Institute of Health
Rs. '000
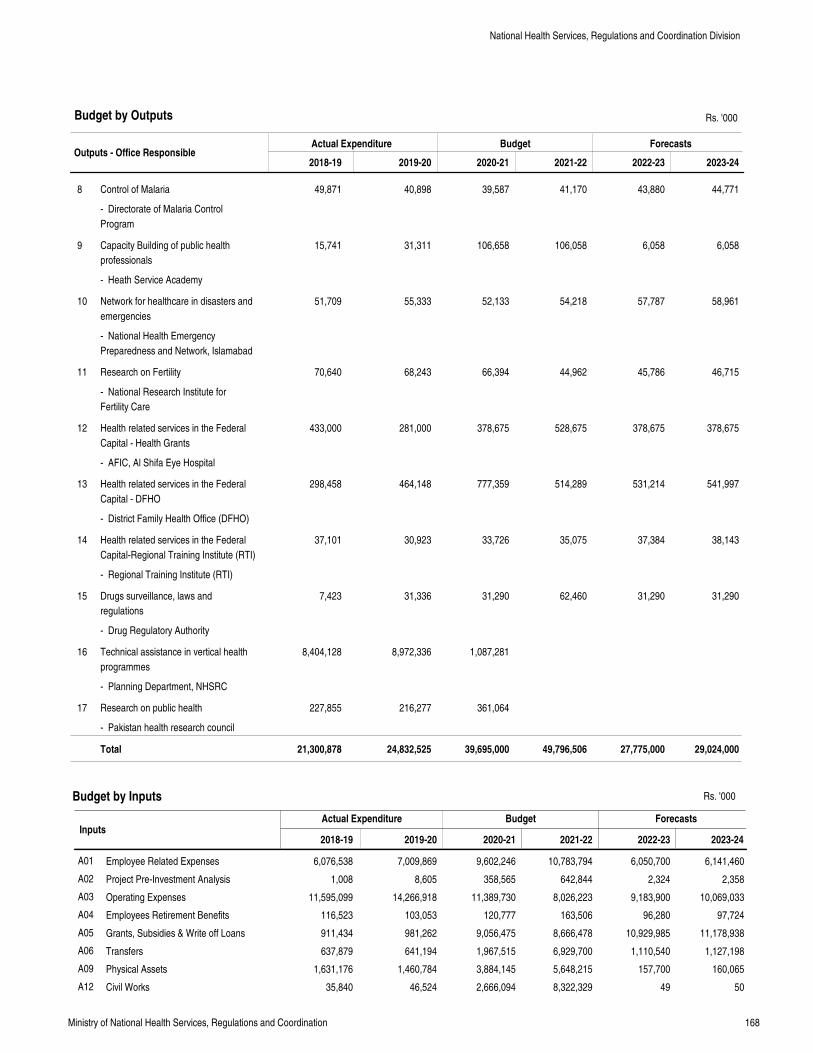
168Ministry of National Health Services, Regulations and Coordination
Outputs - Office ResponsibleActual Expenditure Budget Forecasts
2018-19 2019-20 2020-21 2021-22 2022-23 2023-24
Control of Malaria
Capacity Building of public health
professionals
Network for healthcare in disasters and
emergencies
Research on Fertility
Health related services in the Federal
Capital - Health Grants
Health related services in the Federal
Capital - DFHO
Health related services in the Federal
Capital-Regional Training Institute (RTI)
Drugs surveillance, laws and
regulations
Technical assistance in vertical health
programmes
Research on public health
49,871
15,741
51,709
70,640
433,000
298,458
37,101
7,423
8,404,128
227,855
40,898
31,311
55,333
68,243
281,000
464,148
30,923
31,336
8,972,336
216,277
39,587
106,658
52,133
66,394
378,675
777,359
33,726
31,290
1,087,281
361,064
41,170
106,058
54,218
44,962
528,675
514,289
35,075
62,460
43,880
6,058
57,787
45,786
378,675
531,214
37,384
31,290
44,771
6,058
58,961
46,715
378,675
541,997
38,143
31,290
8
9
10
11
12
13
14
15
16
17
Total 21,300,878 24,832,525 39,695,000 49,796,506 27,775,000 29,024,000
Rs. '000
InputsActual Expenditure Budget Forecasts
Employee Related Expenses
Project Pre-Investment Analysis
Operating Expenses
Employees Retirement Benefits
Grants, Subsidies & Write off Loans
Transfers
Physical Assets
Civil Works
6,076,538
1,008
11,595,099
116,523
911,434
637,879
1,631,176
35,840
7,009,869
8,605
14,266,918
103,053
981,262
641,194
1,460,784
46,524
9,602,246
358,565
11,389,730
120,777
9,056,475
1,967,515
3,884,145
2,666,094
10,783,794
642,844
8,026,223
163,506
8,666,478
6,929,700
5,648,215
8,322,329
6,050,700
2,324
9,183,900
96,280
10,929,985
1,110,540
157,700
49
6,141,460
2,358
10,069,033
97,724
11,178,938
1,127,198
160,065
50
A01
A02
A03
A04
A05
A06
A09
A12
2018-19 2019-20 2020-21 2021-22 2022-23 2023-24
Budget by Outputs
Budget by Inputs
National Health Services, Regulations and Coordination Division
- Directorate of Malaria Control
Program
- Heath Service Academy
- National Health Emergency
Preparedness and Network, Islamabad
- National Research Institute for
Fertility Care
- AFIC, Al Shifa Eye Hospital
- District Family Health Office (DFHO)
- Regional Training Institute (RTI)
- Drug Regulatory Authority
- Planning Department, NHSRC
- Pakistan health research council
Rs. '000
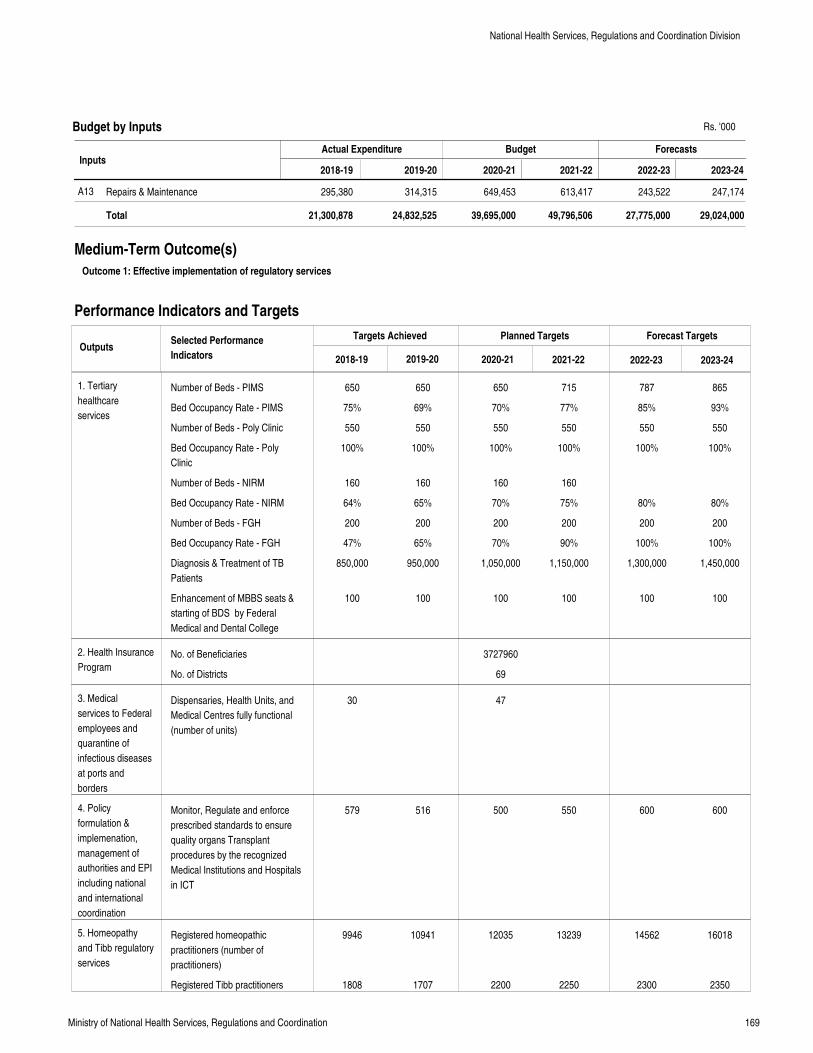
169Ministry of National Health Services, Regulations and Coordination
InputsActual Expenditure Budget Forecasts
Repairs & Maintenance 295,380 314,315 649,453 613,417 243,522 247,174A13
Total 21,300,878 24,832,525 39,695,000 49,796,506 27,775,000 29,024,000
2018-19 2019-20 2020-21 2021-22 2022-23 2023-24
Medium-Term Outcome(s)
Outcome 1: Effective implementation of regulatory services
Performance Indicators and Targets
OutputsTargets Achieved Planned Targets Forecast Targets
2018-19 2019-20 2020-21 2021-22 2022-23 2023-24
Selected Performance
Indicators
1. Tertiary
healthcare
services
2. Health Insurance
Program
3. Medical
services to Federal
employees and
quarantine of
infectious diseases
at ports and
borders
4. Policy
formulation &
implemenation,
management of
authorities and EPI
including national
and international
coordination
5. Homeopathy
and Tibb regulatory
services
Budget by Inputs
Number of Beds - PIMS
Bed Occupancy Rate - PIMS
Number of Beds - Poly Clinic
Bed Occupancy Rate - Poly
Clinic
Number of Beds - NIRM
Bed Occupancy Rate - NIRM
Number of Beds - FGH
Bed Occupancy Rate - FGH
Diagnosis & Treatment of TB
Patients
Enhancement of MBBS seats &
starting of BDS by Federal
Medical and Dental College
No. of Beneficiaries
No. of Districts
Dispensaries, Health Units, and
Medical Centres fully functional
(number of units)
Monitor, Regulate and enforce
prescribed standards to ensure
quality organs Transplant
procedures by the recognized
Medical Institutions and Hospitals
in ICT
Registered homeopathic
practitioners (number of
practitioners)
Registered Tibb practitioners
650
75%
550
100%
160
64%
200
47%
850,000
100
30
579
9946
1808
650
69%
550
100%
160
65%
200
65%
950,000
100
516
10941
1707
650
70%
550
100%
160
70%
200
70%
1,050,000
100
3727960
69
47
500
12035
2200
715
77%
550
100%
160
75%
200
90%
1,150,000
100
550
13239
2250
787
85%
550
100%
80%
200
100%
1,300,000
100
600
14562
2300
865
93%
550
100%
80%
200
100%
1,450,000
100
600
16018
2350
National Health Services, Regulations and Coordination Division
Rs. '000
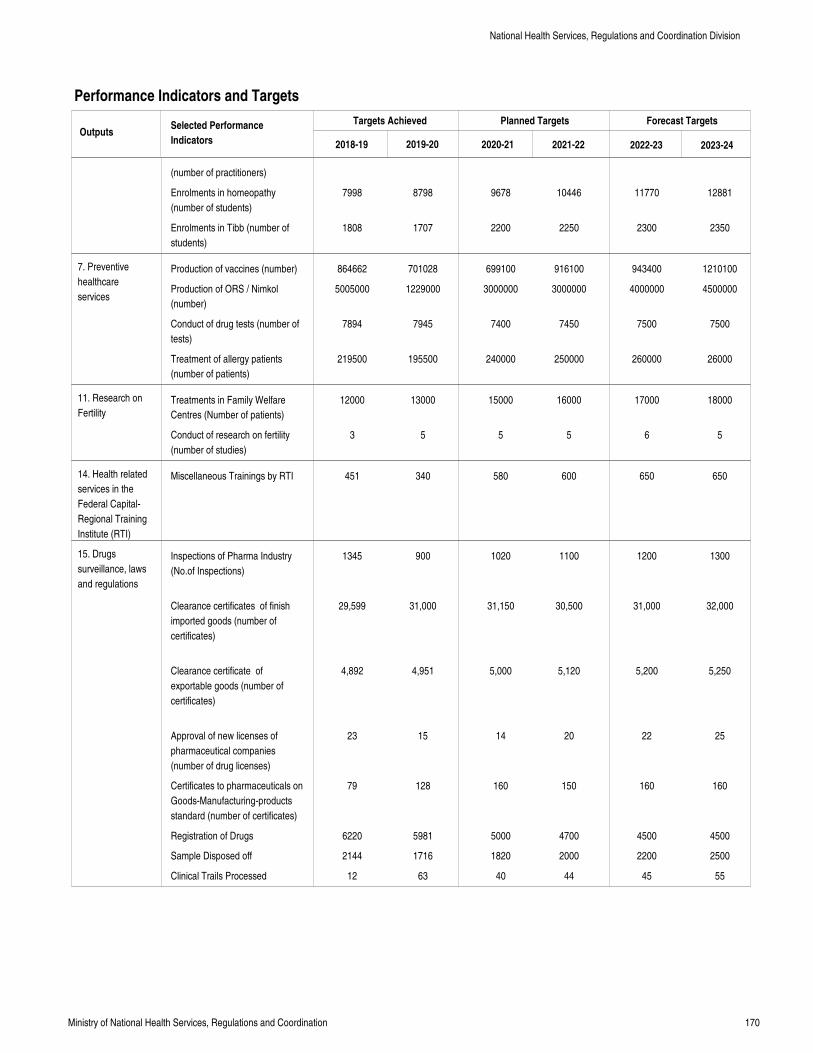
170Ministry of National Health Services, Regulations and Coordination
Performance Indicators and Targets
OutputsTargets Achieved Planned Targets Forecast Targets
2018-19 2019-20 2020-21 2021-22 2022-23 2023-24
Selected Performance
Indicators
7. Preventive
healthcare
services
11. Research on
Fertility
14. Health related
services in the
Federal Capital-
Regional Training
Institute (RTI)
15. Drugs
surveillance, laws
and regulations
(number of practitioners)
Enrolments in homeopathy
(number of students)
Enrolments in Tibb (number of
students)
Production of vaccines (number)
Production of ORS / Nimkol
(number)
Conduct of drug tests (number of
tests)
Treatment of allergy patients
(number of patients)
Treatments in Family Welfare
Centres (Number of patients)
Conduct of research on fertility
(number of studies)
Miscellaneous Trainings by RTI
Inspections of Pharma Industry
(No.of Inspections)
Clearance certificates of finish
imported goods (number of
certificates)
Clearance certificate of
exportable goods (number of
certificates)
Approval of new licenses of
pharmaceutical companies
(number of drug licenses)
Certificates to pharmaceuticals on
Goods-Manufacturing-products
standard (number of certificates)
Registration of Drugs
Sample Disposed off
Clinical Trails Processed
7998
1808
864662
5005000
7894
219500
12000
3
451
1345
29,599
4,892
23
79
6220
2144
12
8798
1707
701028
1229000
7945
195500
13000
5
340
900
31,000
4,951
15
128
5981
1716
63
9678
2200
699100
3000000
7400
240000
15000
5
580
1020
31,150
5,000
14
160
5000
1820
40
10446
2250
916100
3000000
7450
250000
16000
5
600
1100
30,500
5,120
20
150
4700
2000
44
11770
2300
943400
4000000
7500
260000
17000
6
650
1200
31,000
5,200
22
160
4500
2200
45
12881
2350
1210100
4500000
7500
26000
18000
5
650
1300
32,000
5,250
25
160
4500
2500
55
National Health Services, Regulations and Coordination Division
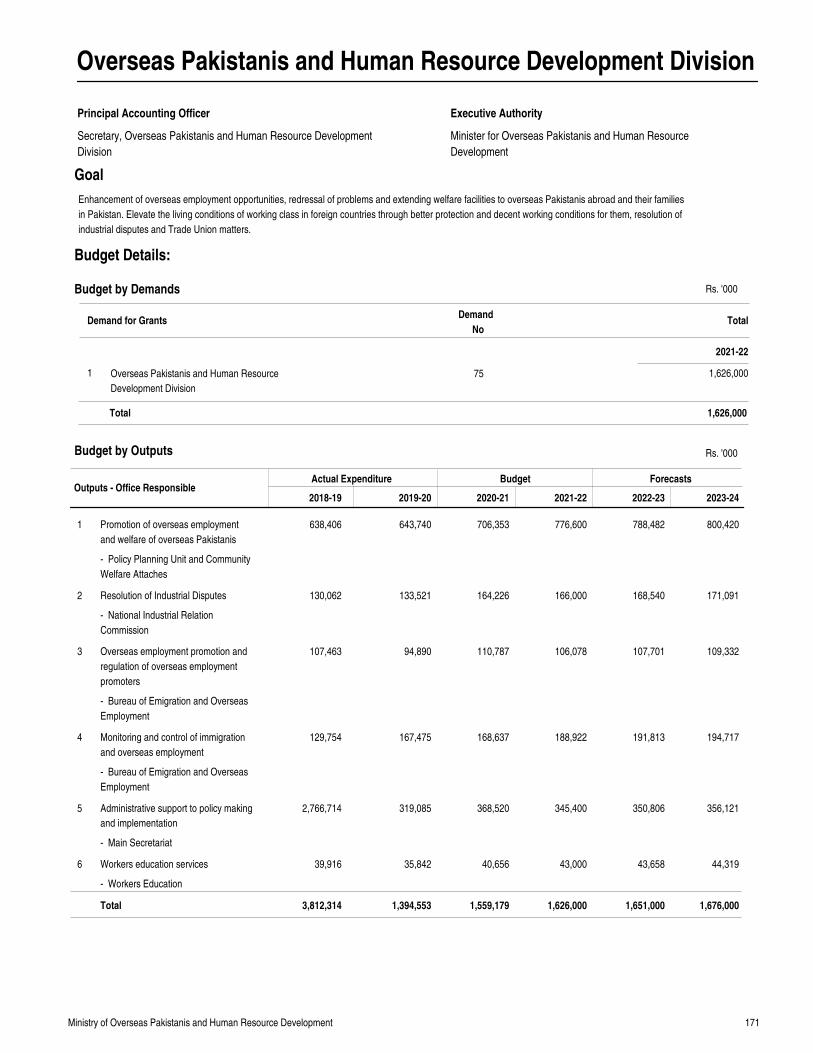
171Ministry of Overseas Pakistanis and Human Resource Development
Overseas Pakistanis and Human Resource Development Division
Principal Accounting Officer
Secretary, Overseas Pakistanis and Human Resource Development
Division
Minister for Overseas Pakistanis and Human Resource
Development
Executive Authority
Goal
Outputs - Office ResponsibleActual Expenditure Budget Forecasts
2018-19 2019-20 2020-21 2021-22 2022-23 2023-24
Promotion of overseas employment
and welfare of overseas Pakistanis
Resolution of Industrial Disputes
Overseas employment promotion and
regulation of overseas employment
promoters
Monitoring and control of immigration
and overseas employment
Administrative support to policy making
and implementation
Workers education services
638,406
130,062
107,463
129,754
2,766,714
39,916
643,740
133,521
94,890
167,475
319,085
35,842
706,353
164,226
110,787
168,637
368,520
40,656
776,600
166,000
106,078
188,922
345,400
43,000
788,482
168,540
107,701
191,813
350,806
43,658
800,420
171,091
109,332
194,717
356,121
44,319
1
2
3
4
5
6
Total 3,812,314 1,394,553 1,559,179 1,626,000 1,651,000 1,676,000
Rs. '000Budget by Outputs
Enhancement of overseas employment opportunities, redressal of problems and extending welfare facilities to overseas Pakistanis abroad and their families
in Pakistan. Elevate the living conditions of working class in foreign countries through better protection and decent working conditions for them, resolution of
industrial disputes and Trade Union matters.
Demand for GrantsDemand
NoTotal
2021-22
Budget by Demands
Overseas Pakistanis and Human Resource
Development Division
1 75 1,626,000
1,626,000Total
Budget Details:
- Policy Planning Unit and Community
Welfare Attaches
- National Industrial Relation
Commission
- Bureau of Emigration and Overseas
Employment
- Bureau of Emigration and Overseas
Employment
- Main Secretariat
- Workers Education
Rs. '000
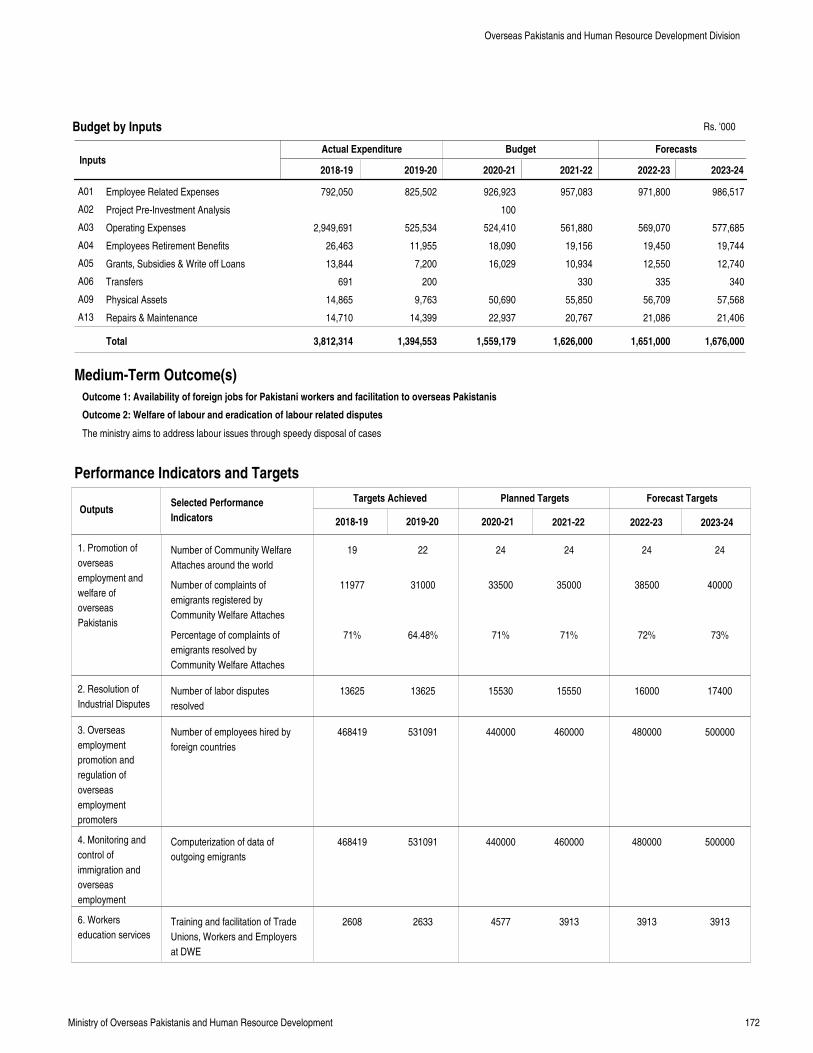
172Ministry of Overseas Pakistanis and Human Resource Development
InputsActual Expenditure Budget Forecasts
Employee Related Expenses
Project Pre-Investment Analysis
Operating Expenses
Employees Retirement Benefits
Grants, Subsidies & Write off Loans
Transfers
Physical Assets
Repairs & Maintenance
792,050
2,949,691
26,463
13,844
691
14,865
14,710
825,502
525,534
11,955
7,200
200
9,763
14,399
926,923
100
524,410
18,090
16,029
50,690
22,937
957,083
561,880
19,156
10,934
330
55,850
20,767
971,800
569,070
19,450
12,550
335
56,709
21,086
986,517
577,685
19,744
12,740
340
57,568
21,406
A01
A02
A03
A04
A05
A06
A09
A13
Total 3,812,314 1,394,553 1,559,179 1,626,000 1,651,000 1,676,000
2018-19 2019-20 2020-21 2021-22 2022-23 2023-24
The ministry aims to address labour issues through speedy disposal of cases
Medium-Term Outcome(s)
Outcome 1: Availability of foreign jobs for Pakistani workers and facilitation to overseas Pakistanis
Outcome 2: Welfare of labour and eradication of labour related disputes
Performance Indicators and Targets
OutputsTargets Achieved Planned Targets Forecast Targets
2018-19 2019-20 2020-21 2021-22 2022-23 2023-24
Selected Performance
Indicators
1. Promotion of
overseas
employment and
welfare of
overseas
Pakistanis
2. Resolution of
Industrial Disputes
3. Overseas
employment
promotion and
regulation of
overseas
employment
promoters
4. Monitoring and
control of
immigration and
overseas
employment
6. Workers
education services
Budget by Inputs
Number of Community Welfare
Attaches around the world
Number of complaints of
emigrants registered by
Community Welfare Attaches
Percentage of complaints of
emigrants resolved by
Community Welfare Attaches
Number of labor disputes
resolved
Number of employees hired by
foreign countries
Computerization of data of
outgoing emigrants
Training and facilitation of Trade
Unions, Workers and Employers
at DWE
19
11977
71%
13625
468419
468419
2608
22
31000
64.48%
13625
531091
531091
2633
24
33500
71%
15530
440000
440000
4577
24
35000
71%
15550
460000
460000
3913
24
38500
72%
16000
480000
480000
3913
24
40000
73%
17400
500000
500000
3913
Overseas Pakistanis and Human Resource Development Division
Rs. '000
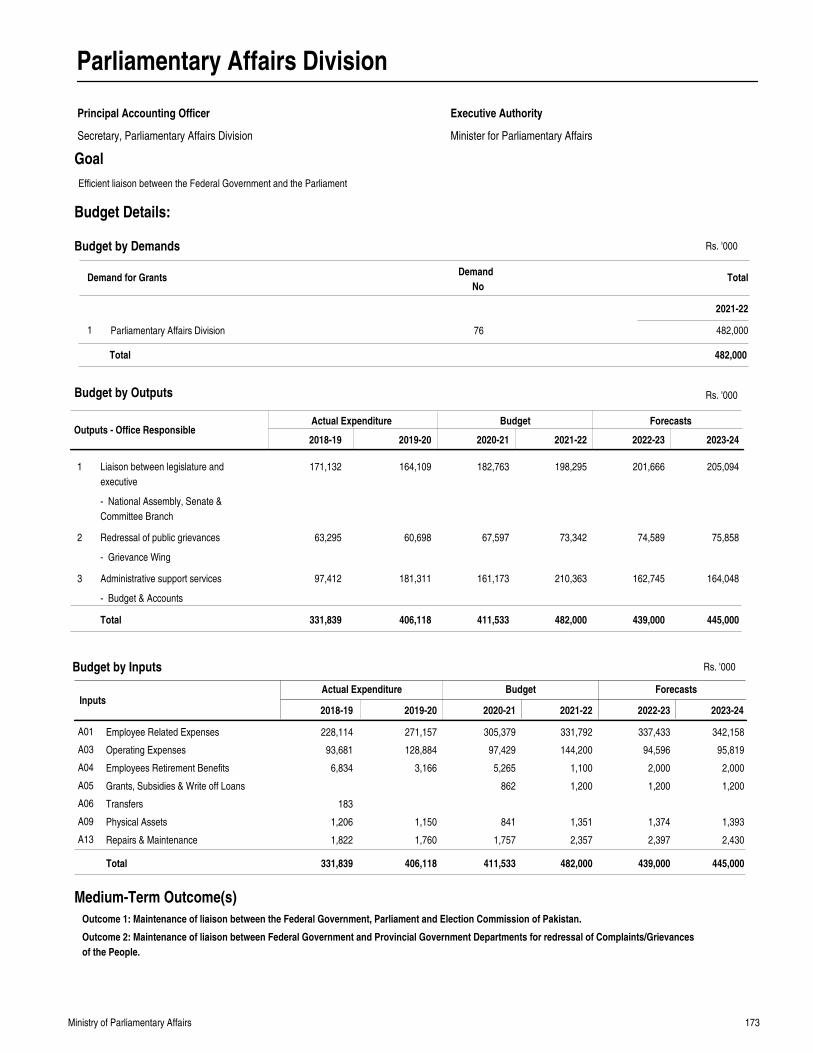
173Ministry of Parliamentary Affairs
Parliamentary Affairs Division
Principal Accounting Officer
Secretary, Parliamentary Affairs Division Minister for Parliamentary Affairs
Executive Authority
Goal
Outputs - Office ResponsibleActual Expenditure Budget Forecasts
2018-19 2019-20 2020-21 2021-22 2022-23 2023-24
Liaison between legislature and
executive
Redressal of public grievances
Administrative support services
171,132
63,295
97,412
164,109
60,698
181,311
182,763
67,597
161,173
198,295
73,342
210,363
201,666
74,589
162,745
205,094
75,858
164,048
1
2
3
Total 331,839 406,118 411,533 482,000 439,000 445,000
Rs. '000
InputsActual Expenditure Budget Forecasts
Employee Related Expenses
Operating Expenses
Employees Retirement Benefits
Grants, Subsidies & Write off Loans
Transfers
Physical Assets
Repairs & Maintenance
228,114
93,681
6,834
183
1,206
1,822
271,157
128,884
3,166
1,150
1,760
305,379
97,429
5,265
862
841
1,757
331,792
144,200
1,100
1,200
1,351
2,357
337,433
94,596
2,000
1,200
1,374
2,397
342,158
95,819
2,000
1,200
1,393
2,430
A01
A03
A04
A05
A06
A09
A13
Total 331,839 406,118 411,533 482,000 439,000 445,000
2018-19 2019-20 2020-21 2021-22 2022-23 2023-24
Medium-Term Outcome(s)
Outcome 1: Maintenance of liaison between the Federal Government, Parliament and Election Commission of Pakistan.
Outcome 2: Maintenance of liaison between Federal Government and Provincial Government Departments for redressal of Complaints/Grievances
of the People.
Budget by Outputs
Budget by Inputs
Efficient liaison between the Federal Government and the Parliament
Demand for GrantsDemand
NoTotal
2021-22
Budget by Demands
Parliamentary Affairs Division1 76 482,000
482,000Total
Budget Details:
- National Assembly, Senate &
Committee Branch
- Grievance Wing
- Budget & Accounts
Rs. '000
Rs. '000
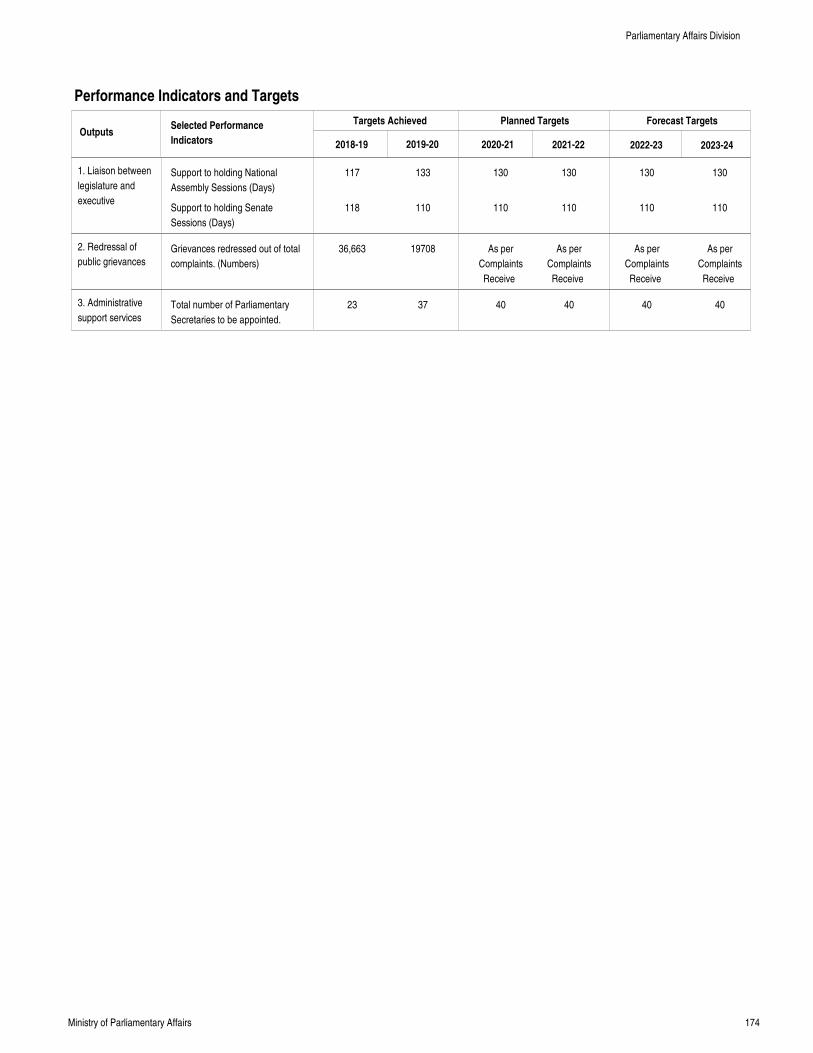
174Ministry of Parliamentary Affairs
Performance Indicators and Targets
OutputsTargets Achieved Planned Targets Forecast Targets
2018-19 2019-20 2020-21 2021-22 2022-23 2023-24
Selected Performance
Indicators
1. Liaison between
legislature and
executive
2. Redressal of
public grievances
3. Administrative
support services
Support to holding National
Assembly Sessions (Days)
Support to holding Senate
Sessions (Days)
Grievances redressed out of total
complaints. (Numbers)
Total number of Parliamentary
Secretaries to be appointed.
117
118
36,663
23
133
110
19708
37
130
110
As per
Complaints
Receive
40
130
110
As per
Complaints
Receive
40
130
110
As per
Complaints
Receive
40
130
110
As per
Complaints
Receive
40
Parliamentary Affairs Division
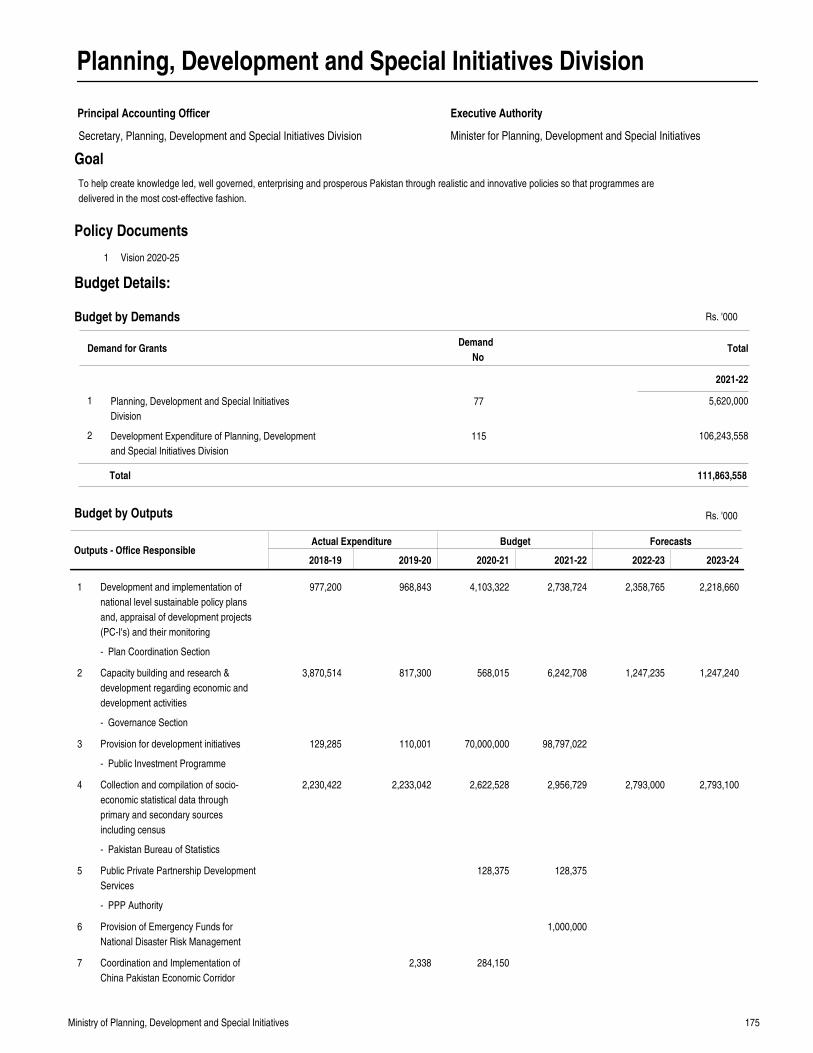
175Ministry of Planning, Development and Special Initiatives
Planning, Development and Special Initiatives Division
Principal Accounting Officer
Minister for Planning, Development and Special Initiatives
Executive Authority
Goal
Outputs - Office ResponsibleActual Expenditure Budget Forecasts
2018-19 2019-20 2020-21 2021-22 2022-23 2023-24
Development and implementation of
national level sustainable policy plans
and, appraisal of development projects
(PC-I's) and their monitoring
Capacity building and research &
development regarding economic and
development activities
Provision for development initiatives
Collection and compilation of socio-
economic statistical data through
primary and secondary sources
including census
Public Private Partnership Development
Services
Provision of Emergency Funds for
National Disaster Risk Management
Coordination and Implementation of
China Pakistan Economic Corridor
977,200
3,870,514
129,285
2,230,422
968,843
817,300
110,001
2,233,042
2,338
4,103,322
568,015
70,000,000
2,622,528
128,375
284,150
2,738,724
6,242,708
98,797,022
2,956,729
128,375
1,000,000
2,358,765
1,247,235
2,793,000
2,218,660
1,247,240
2,793,100
1
2
3
4
5
6
7
Rs. '000
1 Vision 2020-25
Policy Documents
Budget by Outputs
To help create knowledge led, well governed, enterprising and prosperous Pakistan through realistic and innovative policies so that programmes are
delivered in the most cost-effective fashion.
Demand for GrantsDemand
NoTotal
2021-22
Budget by Demands
Planning, Development and Special Initiatives
Division
Development Expenditure of Planning, Development
and Special Initiatives Division
1
2
77
115
5,620,000
106,243,558
111,863,558Total
Secretary, Planning, Development and Special Initiatives Division
Budget Details:
- Plan Coordination Section
- Governance Section
- Public Investment Programme
- Pakistan Bureau of Statistics
- PPP Authority
Rs. '000
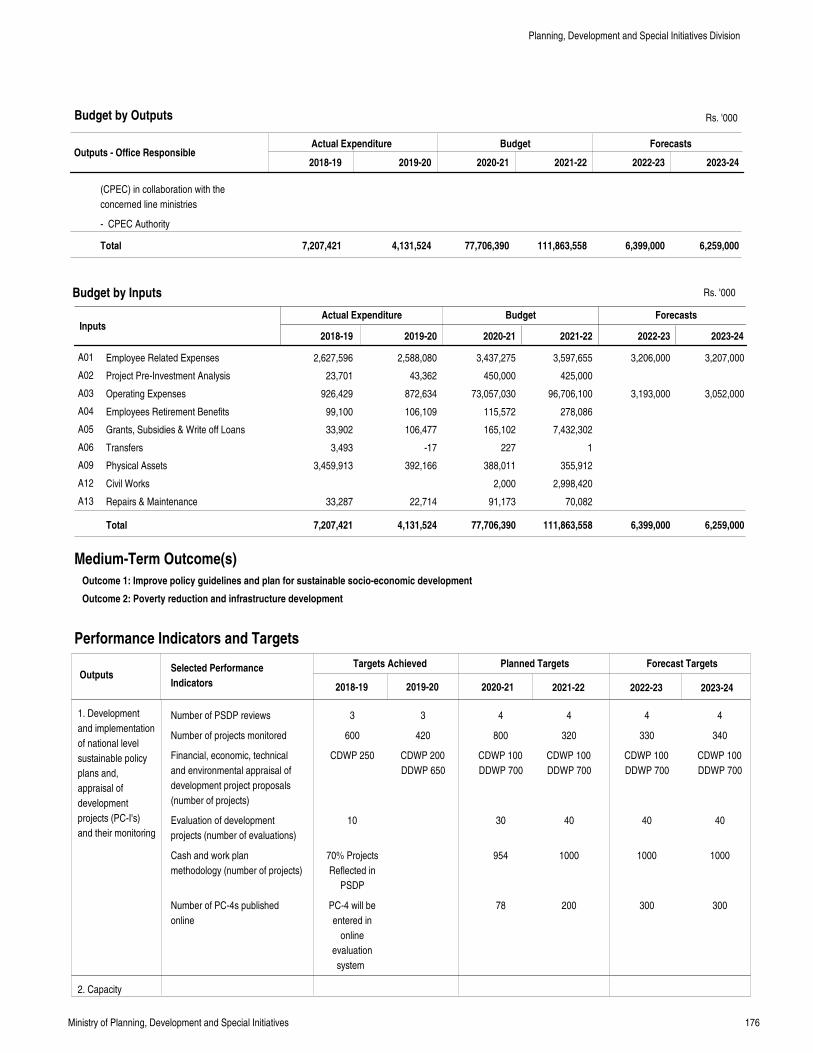
176Ministry of Planning, Development and Special Initiatives
Outputs - Office ResponsibleActual Expenditure Budget Forecasts
2018-19 2019-20 2020-21 2021-22 2022-23 2023-24
(CPEC) in collaboration with the
concerned line ministries
Total 7,207,421 4,131,524 77,706,390 111,863,558 6,399,000 6,259,000
Rs. '000
InputsActual Expenditure Budget Forecasts
Employee Related Expenses
Project Pre-Investment Analysis
Operating Expenses
Employees Retirement Benefits
Grants, Subsidies & Write off Loans
Transfers
Physical Assets
Civil Works
Repairs & Maintenance
2,627,596
23,701
926,429
99,100
33,902
3,493
3,459,913
33,287
2,588,080
43,362
872,634
106,109
106,477
-17
392,166
22,714
3,437,275
450,000
73,057,030
115,572
165,102
227
388,011
2,000
91,173
3,597,655
425,000
96,706,100
278,086
7,432,302
1
355,912
2,998,420
70,082
3,206,000
3,193,000
3,207,000
3,052,000
A01
A02
A03
A04
A05
A06
A09
A12
A13
Total 7,207,421 4,131,524 77,706,390 111,863,558 6,399,000 6,259,000
2018-19 2019-20 2020-21 2021-22 2022-23 2023-24
Medium-Term Outcome(s)
Outcome 1: Improve policy guidelines and plan for sustainable socio-economic development
Outcome 2: Poverty reduction and infrastructure development
Performance Indicators and Targets
OutputsTargets Achieved Planned Targets Forecast Targets
2018-19 2019-20 2020-21 2021-22 2022-23 2023-24
Selected Performance
Indicators
1. Development
and implementation
of national level
sustainable policy
plans and,
appraisal of
development
projects (PC-I's)
and their monitoring
2. Capacity
Budget by Outputs
Budget by Inputs
Number of PSDP reviews
Number of projects monitored
Financial, economic, technical
and environmental appraisal of
development project proposals
(number of projects)
Evaluation of development
projects (number of evaluations)
Cash and work plan
methodology (number of projects)
Number of PC-4s published
online
3
600
CDWP 250
10
70% Projects
Reflected in
PSDP
PC-4 will be
entered in
online
evaluation
system
3
420
CDWP 200
DDWP 650
4
800
CDWP 100
DDWP 700
30
954
78
4
320
CDWP 100
DDWP 700
40
1000
200
4
330
CDWP 100
DDWP 700
40
1000
300
4
340
CDWP 100
DDWP 700
40
1000
300
Planning, Development and Special Initiatives Division
- CPEC Authority
Rs. '000
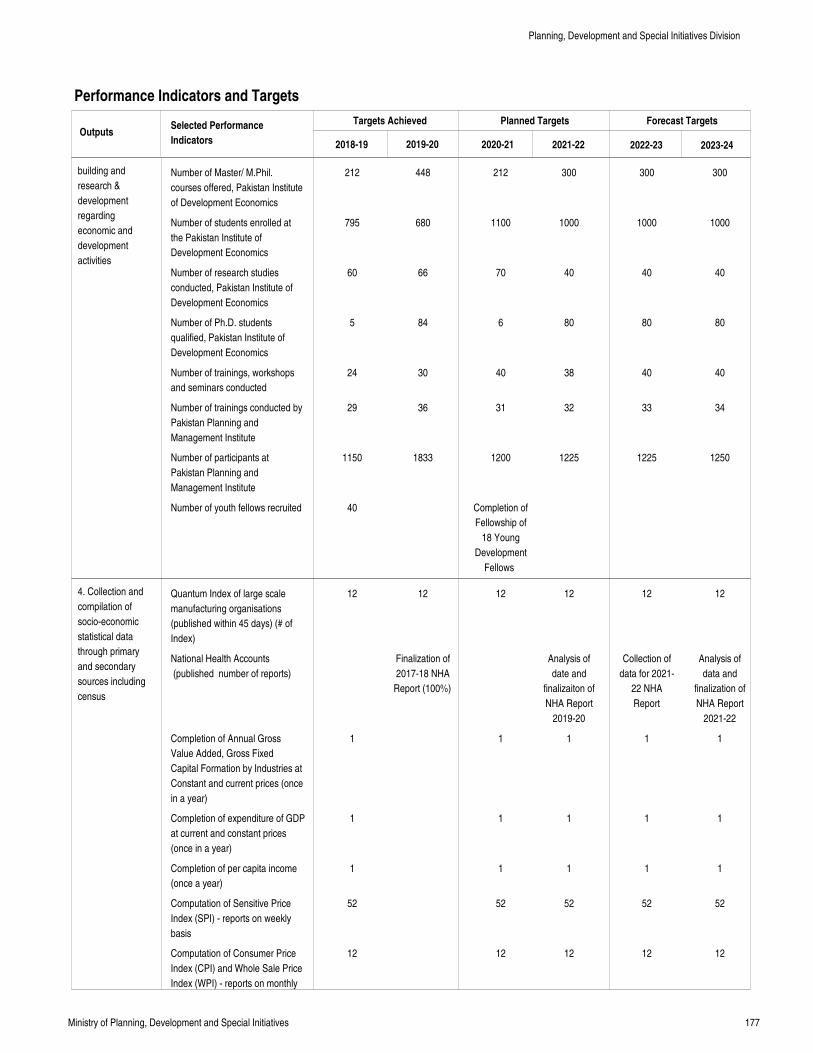
177Ministry of Planning, Development and Special Initiatives
Performance Indicators and Targets
OutputsTargets Achieved Planned Targets Forecast Targets
2018-19 2019-20 2020-21 2021-22 2022-23 2023-24
Selected Performance
Indicators
building and
research &
development
regarding
economic and
development
activities
4. Collection and
compilation of
socio-economic
statistical data
through primary
and secondary
sources including
census
Number of Master/ M.Phil.
courses offered, Pakistan Institute
of Development Economics
Number of students enrolled at
the Pakistan Institute of
Development Economics
Number of research studies
conducted, Pakistan Institute of
Development Economics
Number of Ph.D. students
qualified, Pakistan Institute of
Development Economics
Number of trainings, workshops
and seminars conducted
Number of trainings conducted by
Pakistan Planning and
Management Institute
Number of participants at
Pakistan Planning and
Management Institute
Number of youth fellows recruited
Quantum Index of large scale
manufacturing organisations
(published within 45 days) (# of
Index)
National Health Accounts
(published number of reports)
Completion of Annual Gross
Value Added, Gross Fixed
Capital Formation by Industries at
Constant and current prices (once
in a year)
Completion of expenditure of GDP
at current and constant prices
(once in a year)
Completion of per capita income
(once a year)
Computation of Sensitive Price
Index (SPI) - reports on weekly
basis
Computation of Consumer Price
Index (CPI) and Whole Sale Price
Index (WPI) - reports on monthly
212
795
60
5
24
29
1150
40
12
1
1
1
52
12
448
680
66
84
30
36
1833
12
Finalization of
2017-18 NHA
Report (100%)
212
1100
70
6
40
31
1200
Completion of
Fellowship of
18 Young
Development
Fellows
12
1
1
1
52
12
300
1000
40
80
38
32
1225
12
Analysis of
date and
finalizaiton of
NHA Report
2019-20
1
1
1
52
12
300
1000
40
80
40
33
1225
12
Collection of
data for 2021-
22 NHA
Report
1
1
1
52
12
300
1000
40
80
40
34
1250
12
Analysis of
data and
finalization of
NHA Report
2021-22
1
1
1
52
12
Planning, Development and Special Initiatives Division
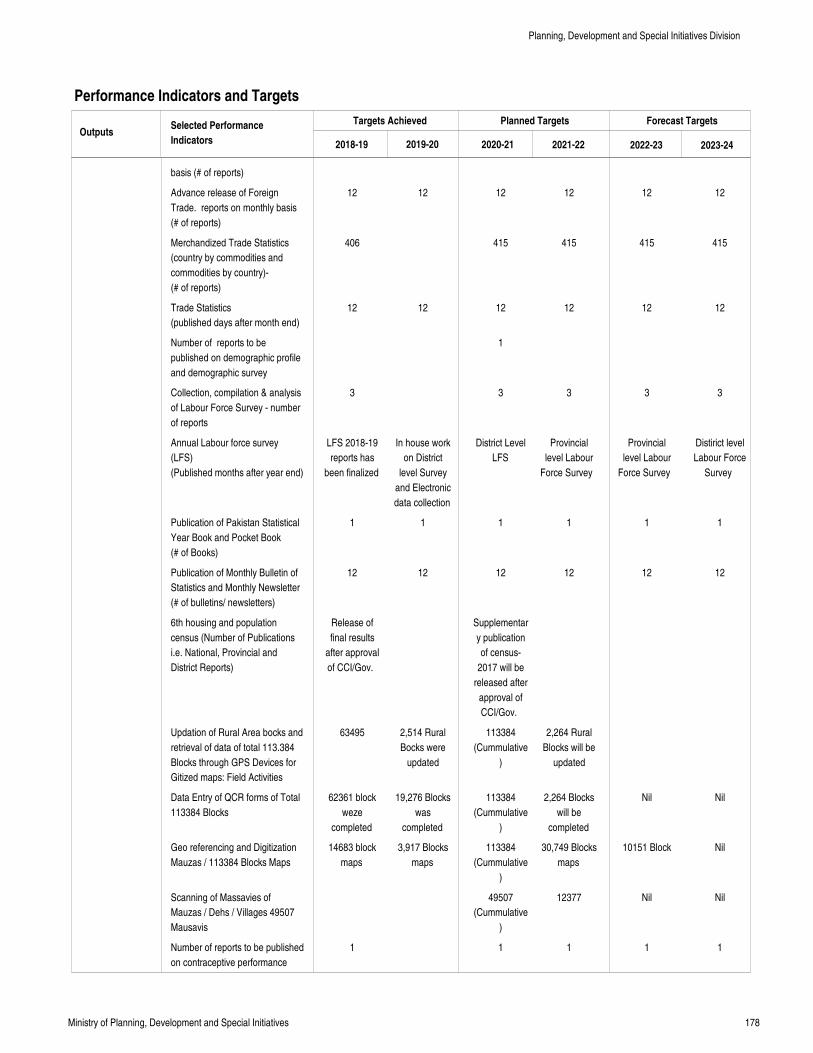
178Ministry of Planning, Development and Special Initiatives
Performance Indicators and Targets
OutputsTargets Achieved Planned Targets Forecast Targets
2018-19 2019-20 2020-21 2021-22 2022-23 2023-24
Selected Performance
Indicators
basis (# of reports)
Advance release of Foreign
Trade. reports on monthly basis
(# of reports)
Merchandized Trade Statistics
(country by commodities and
commodities by country)-
(# of reports)
Trade Statistics
(published days after month end)
Number of reports to be
published on demographic profile
and demographic survey
Collection, compilation & analysis
of Labour Force Survey - number
of reports
Annual Labour force survey
(LFS)
(Published months after year end)
Publication of Pakistan Statistical
Year Book and Pocket Book
(# of Books)
Publication of Monthly Bulletin of
Statistics and Monthly Newsletter
(# of bulletins/ newsletters)
6th housing and population
census (Number of Publications
i.e. National, Provincial and
District Reports)
Updation of Rural Area bocks and
retrieval of data of total 113.384
Blocks through GPS Devices for
Gitized maps: Field Activities
Data Entry of QCR forms of Total
113384 Blocks
Geo referencing and Digitization
Mauzas / 113384 Blocks Maps
Scanning of Massavies of
Mauzas / Dehs / Villages 49507
Mausavis
Number of reports to be published
on contraceptive performance
12
406
12
3
LFS 2018-19
reports has
been finalized
1
12
Release of
final results
after approval
of CCI/Gov.
63495
62361 block
weze
completed
14683 block
maps
1
12
12
In house work
on District
level Survey
and Electronic
data collection
1
12
2,514 Rural
Bocks were
updated
19,276 Blocks
was
completed
3,917 Blocks
maps
12
415
12
1
3
District Level
LFS
1
12
Supplementar
y publication
of census-
2017 will be
released after
approval of
CCI/Gov.
113384
(Cummulative
)
113384
(Cummulative
)
113384
(Cummulative
)
49507
(Cummulative
)
1
12
415
12
3
Provincial
level Labour
Force Survey
1
12
2,264 Rural
Blocks will be
updated
2,264 Blocks
will be
completed
30,749 Blocks
maps
12377
1
12
415
12
3
Provincial
level Labour
Force Survey
1
12
Nil
10151 Block
Nil
1
12
415
12
3
Distirict level
Labour Force
Survey
1
12
Nil
Nil
Nil
1
Planning, Development and Special Initiatives Division
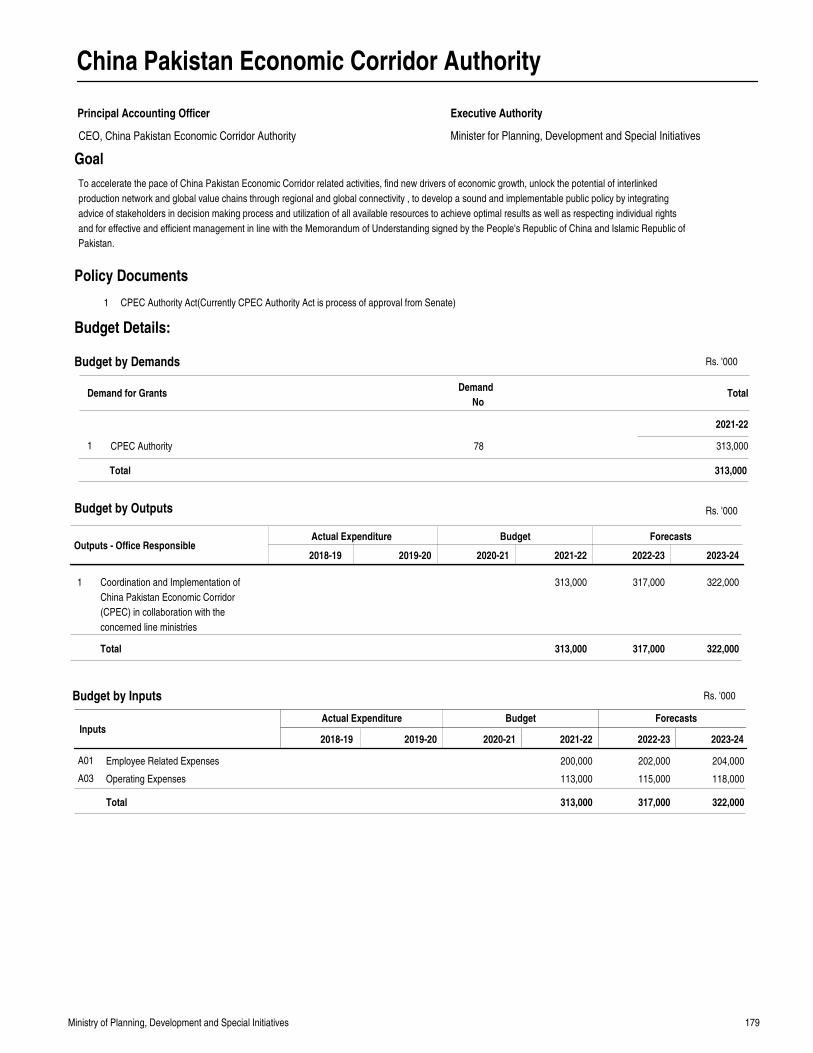
179Ministry of Planning, Development and Special Initiatives
China Pakistan Economic Corridor Authority
Principal Accounting Officer
Minister for Planning, Development and Special Initiatives
Executive Authority
Goal
Outputs - Office ResponsibleActual Expenditure Budget Forecasts
2018-19 2019-20 2020-21 2021-22 2022-23 2023-24
Coordination and Implementation of
China Pakistan Economic Corridor
(CPEC) in collaboration with the
concerned line ministries
313,000 317,000 322,0001
Total 313,000 317,000 322,000
Rs. '000
InputsActual Expenditure Budget Forecasts
Employee Related Expenses
Operating Expenses
200,000
113,000
202,000
115,000
204,000
118,000
A01
A03
Total 313,000 317,000 322,000
2018-19 2019-20 2020-21 2021-22 2022-23 2023-24
1 CPEC Authority Act(Currently CPEC Authority Act is process of approval from Senate)
Policy Documents
Budget by Outputs
Budget by Inputs
To accelerate the pace of China Pakistan Economic Corridor related activities, find new drivers of economic growth, unlock the potential of interlinked
production network and global value chains through regional and global connectivity , to develop a sound and implementable public policy by integrating
advice of stakeholders in decision making process and utilization of all available resources to achieve optimal results as well as respecting individual rights
and for effective and efficient management in line with the Memorandum of Understanding signed by the People's Republic of China and Islamic Republic of
Pakistan.
Demand for GrantsDemand
NoTotal
2021-22
Budget by Demands
CPEC Authority1 78 313,000
313,000Total
CEO, China Pakistan Economic Corridor Authority
Budget Details:
Rs. '000
Rs. '000
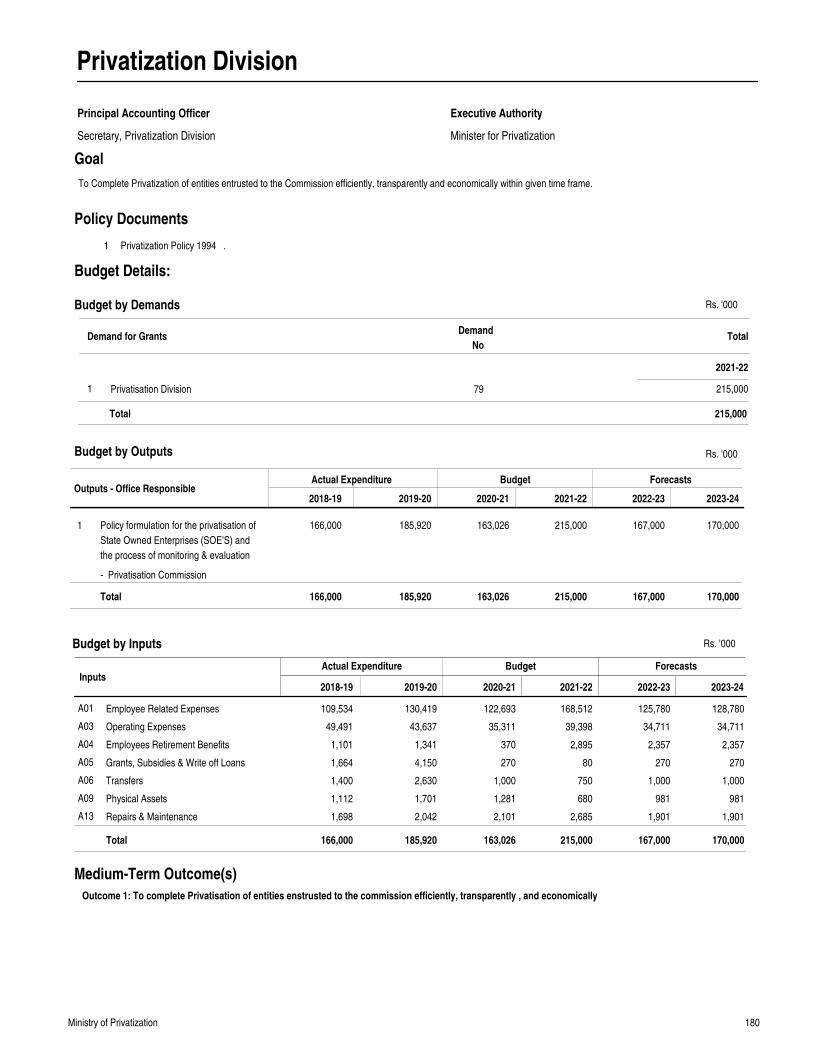
180Ministry of Privatization
Privatization Division
Principal Accounting Officer
Secretary, Privatization Division Minister for Privatization
Executive Authority
Goal
Outputs - Office ResponsibleActual Expenditure Budget Forecasts
2018-19 2019-20 2020-21 2021-22 2022-23 2023-24
Policy formulation for the privatisation of
State Owned Enterprises (SOE'S) and
the process of monitoring & evaluation
166,000 185,920 163,026 215,000 167,000 170,0001
Total 166,000 185,920 163,026 215,000 167,000 170,000
Rs. '000
InputsActual Expenditure Budget Forecasts
Employee Related Expenses
Operating Expenses
Employees Retirement Benefits
Grants, Subsidies & Write off Loans
Transfers
Physical Assets
Repairs & Maintenance
109,534
49,491
1,101
1,664
1,400
1,112
1,698
130,419
43,637
1,341
4,150
2,630
1,701
2,042
122,693
35,311
370
270
1,000
1,281
2,101
168,512
39,398
2,895
80
750
680
2,685
125,780
34,711
2,357
270
1,000
981
1,901
128,780
34,711
2,357
270
1,000
981
1,901
A01
A03
A04
A05
A06
A09
A13
Total 166,000 185,920 163,026 215,000 167,000 170,000
2018-19 2019-20 2020-21 2021-22 2022-23 2023-24
1 Privatization Policy 1994 .
Policy Documents
Medium-Term Outcome(s)
Outcome 1: To complete Privatisation of entities enstrusted to the commission efficiently, transparently , and economically
Budget by Outputs
Budget by Inputs
To Complete Privatization of entities entrusted to the Commission efficiently, transparently and economically within given time frame.
Demand for GrantsDemand
NoTotal
2021-22
Budget by Demands
Privatisation Division1 79 215,000
215,000Total
Budget Details:
- Privatisation Commission
Rs. '000
Rs. '000
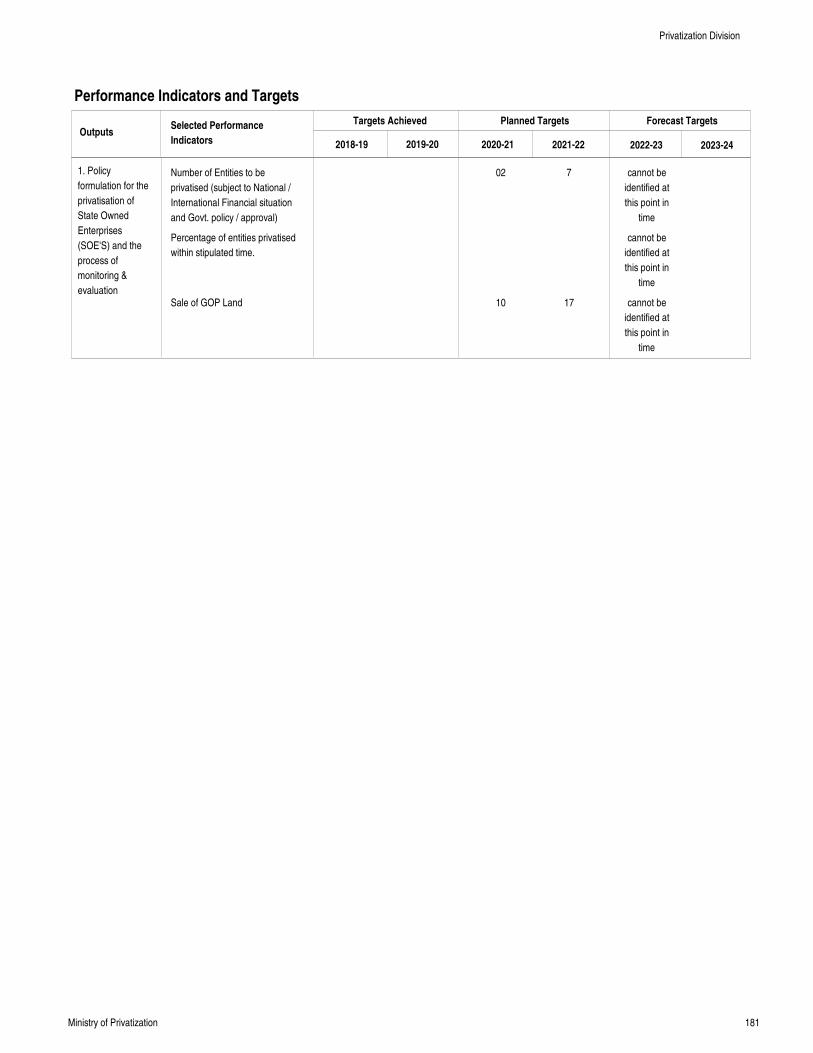
181Ministry of Privatization
Performance Indicators and Targets
OutputsTargets Achieved Planned Targets Forecast Targets
2018-19 2019-20 2020-21 2021-22 2022-23 2023-24
Selected Performance
Indicators
1. Policy
formulation for the
privatisation of
State Owned
Enterprises
(SOE'S) and the
process of
monitoring &
evaluation
Number of Entities to be
privatised (subject to National /
International Financial situation
and Govt. policy / approval)
Percentage of entities privatised
within stipulated time.
Sale of GOP Land
02
10
7
17
cannot be
identified at
this point in
time
cannot be
identified at
this point in
time
cannot be
identified at
this point in
time
Privatization Division
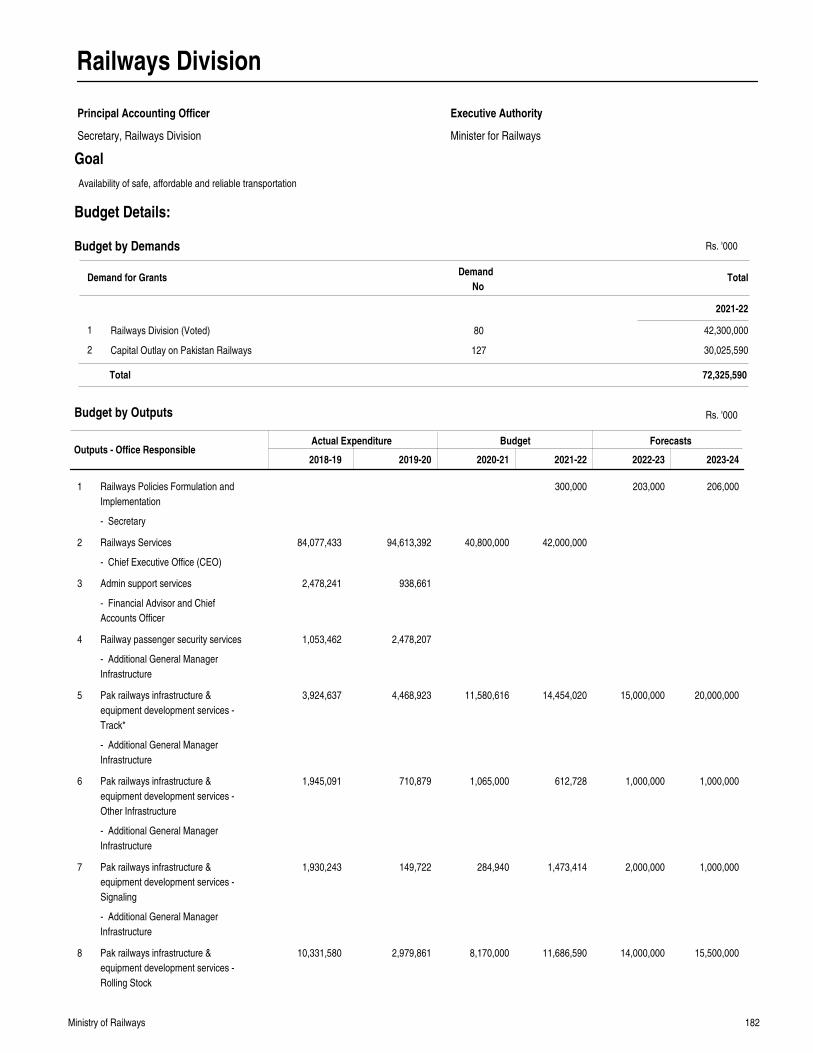
182Ministry of Railways
Railways Division
Principal Accounting Officer
Secretary, Railways Division Minister for Railways
Executive Authority
Goal
Outputs - Office ResponsibleActual Expenditure Budget Forecasts
2018-19 2019-20 2020-21 2021-22 2022-23 2023-24
Railways Policies Formulation and
Implementation
Railways Services
Admin support services
Railway passenger security services
Pak railways infrastructure &
equipment development services -
Track*
Pak railways infrastructure &
equipment development services -
Other Infrastructure
Pak railways infrastructure &
equipment development services -
Signaling
Pak railways infrastructure &
equipment development services -
Rolling Stock
84,077,433
2,478,241
1,053,462
3,924,637
1,945,091
1,930,243
10,331,580
94,613,392
938,661
2,478,207
4,468,923
710,879
149,722
2,979,861
40,800,000
11,580,616
1,065,000
284,940
8,170,000
300,000
42,000,000
14,454,020
612,728
1,473,414
11,686,590
203,000
15,000,000
1,000,000
2,000,000
14,000,000
206,000
20,000,000
1,000,000
1,000,000
15,500,000
1
2
3
4
5
6
7
8
Rs. '000Budget by Outputs
Availability of safe, affordable and reliable transportation
Demand for GrantsDemand
NoTotal
2021-22
Budget by Demands
Railways Division (Voted)
Capital Outlay on Pakistan Railways
1
2
80
127
42,300,000
30,025,590
72,325,590Total
Budget Details:
- Secretary
- Chief Executive Office (CEO)
- Financial Advisor and Chief
Accounts Officer
- Additional General Manager
Infrastructure
- Additional General Manager
Infrastructure
- Additional General Manager
Infrastructure
- Additional General Manager
Infrastructure
Rs. '000
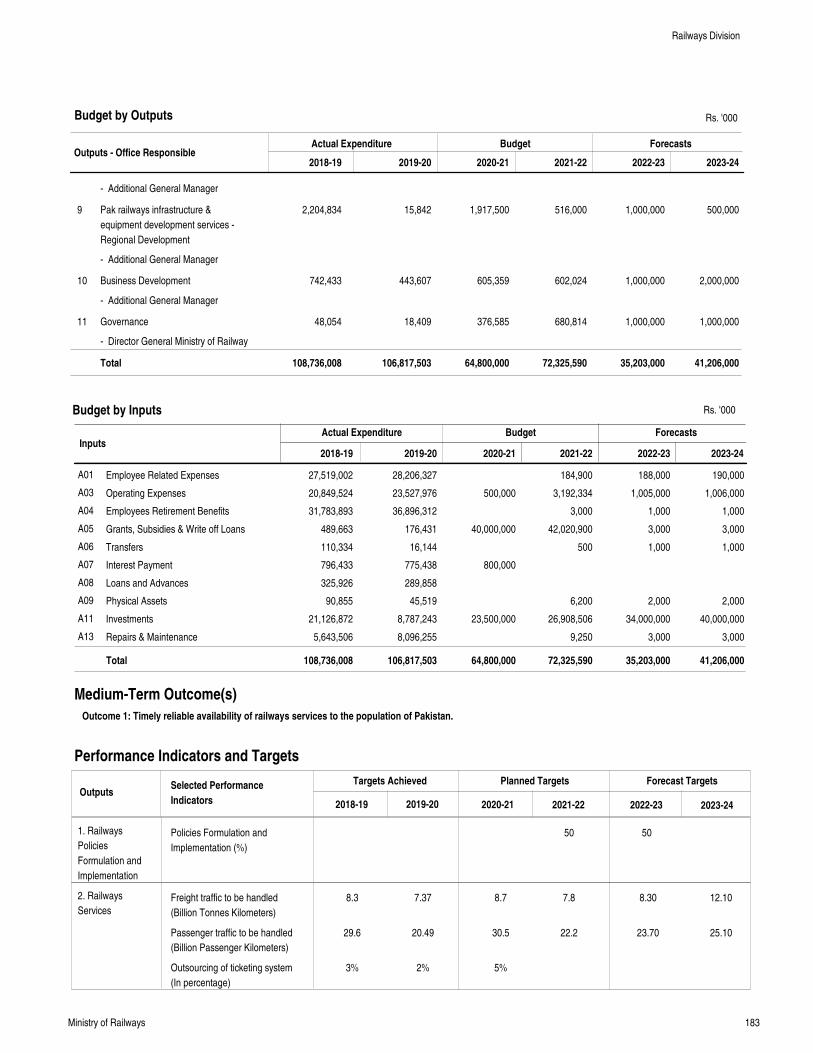
183Ministry of Railways
Outputs - Office ResponsibleActual Expenditure Budget Forecasts
2018-19 2019-20 2020-21 2021-22 2022-23 2023-24
Pak railways infrastructure &
equipment development services -
Regional Development
Business Development
Governance
2,204,834
742,433
48,054
15,842
443,607
18,409
1,917,500
605,359
376,585
516,000
602,024
680,814
1,000,000
1,000,000
1,000,000
500,000
2,000,000
1,000,000
9
10
11
Total 108,736,008 106,817,503 64,800,000 72,325,590 35,203,000 41,206,000
Rs. '000
InputsActual Expenditure Budget Forecasts
Employee Related Expenses
Operating Expenses
Employees Retirement Benefits
Grants, Subsidies & Write off Loans
Transfers
Interest Payment
Loans and Advances
Physical Assets
Investments
Repairs & Maintenance
27,519,002
20,849,524
31,783,893
489,663
110,334
796,433
325,926
90,855
21,126,872
5,643,506
28,206,327
23,527,976
36,896,312
176,431
16,144
775,438
289,858
45,519
8,787,243
8,096,255
500,000
40,000,000
800,000
23,500,000
184,900
3,192,334
3,000
42,020,900
500
6,200
26,908,506
9,250
188,000
1,005,000
1,000
3,000
1,000
2,000
34,000,000
3,000
190,000
1,006,000
1,000
3,000
1,000
2,000
40,000,000
3,000
A01
A03
A04
A05
A06
A07
A08
A09
A11
A13
Total 108,736,008 106,817,503 64,800,000 72,325,590 35,203,000 41,206,000
2018-19 2019-20 2020-21 2021-22 2022-23 2023-24
Medium-Term Outcome(s)
Outcome 1: Timely reliable availability of railways services to the population of Pakistan.
Performance Indicators and Targets
OutputsTargets Achieved Planned Targets Forecast Targets
2018-19 2019-20 2020-21 2021-22 2022-23 2023-24
Selected Performance
Indicators
1. Railways
Policies
Formulation and
Implementation
2. Railways
Services
Budget by Outputs
Budget by Inputs
Policies Formulation and
Implementation (%)
Freight traffic to be handled
(Billion Tonnes Kilometers)
Passenger traffic to be handled
(Billion Passenger Kilometers)
Outsourcing of ticketing system
(In percentage)
8.3
29.6
3%
7.37
20.49
2%
8.7
30.5
5%
50
7.8
22.2
50
8.30
23.70
12.10
25.10
Railways Division
- Additional General Manager
- Additional General Manager
- Additional General Manager
- Director General Ministry of Railway
Rs. '000

184Ministry of Railways
Performance Indicators and Targets
OutputsTargets Achieved Planned Targets Forecast Targets
2018-19 2019-20 2020-21 2021-22 2022-23 2023-24
Selected Performance
Indicators
3. Admin support
services
4. Railway
passenger security
services
5. Pak railways
infrastructure &
equipment
development
services - Track*
6. Pak railways
infrastructure &
equipment
development
services - Other
Infrastructure
7. Pak railways
infrastructure &
equipment
development
services -
Signaling
8. Pak railways
infrastructure &
equipment
development
services - Rolling
Stock
Improvement in punctuality of
passenger Services
Number of freight handling
terminals to be improved
Number of stations where
reservation system is to be
computerized
Reduction in accidents (In
percentage)
Freight Revenue (Rs. in Billion)
Passenger Revenue (Rs. in
Billion)
Revenue Receipts (Rs. in Billion)
Total Revenue (Rs. in Billion)
Automation of Railways Accounts
(In percentage)
Improvement in security related
services (In percentage)
Reduction of crimes in trains
New track (Kms)
Rehabilitation of track (Kms)
Rehabilitation of structures
(bridges, culverts) (Nos)
Up-gradation of Mail Line-1 (ML-
1) under CPEC (K.Ms)
Rehabilitation of existing stations
(Nos)
New Station (Numbers)
Upgradation of signaling system
(Kms)
Upgradation of signaling system
(No.of stations)
Procurement of new locomotives
(Nos)
Rehabilitation of existing
locomotives
Procurement of new coaches
(Nos)
Procurement of new wagons and
power vans (Nos)
Upgradation of maintenance
72%
2
2
18.790
31.400
54.600
54.51
37%
85%
100%
2
120
4
1
33.91
3
1
68%
1
3%
19.21
24.62
47.21
65%
60%
52
15
113
36
73%
2
4%
22
28
60.150
48
10%
100%
100%
32
1
3
1
24
4
20
5
46
200
1
22
26
58
11
180
80
23
46
1
10
20
46
200
1
22
28
60
52
300
40
174
46
2
5
30
60
320
3
29
30
63
174
325
60
339
15
50
100
310
4
Railways Division
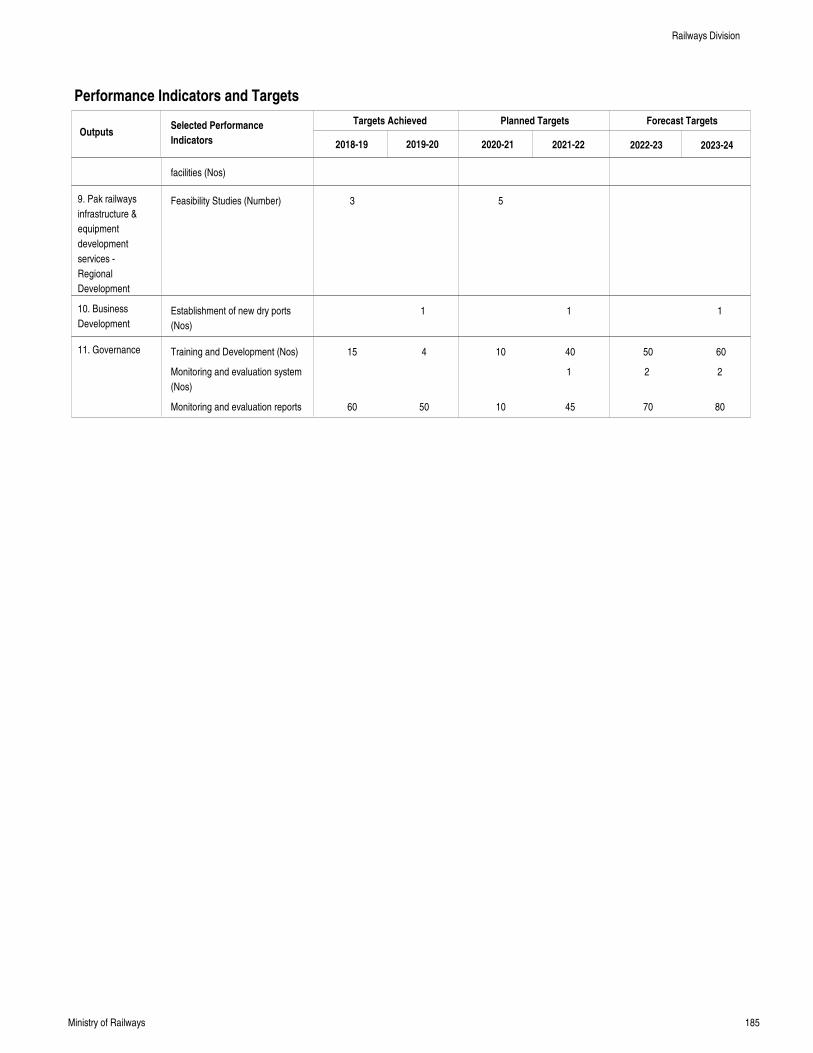
185Ministry of Railways
Performance Indicators and Targets
OutputsTargets Achieved Planned Targets Forecast Targets
2018-19 2019-20 2020-21 2021-22 2022-23 2023-24
Selected Performance
Indicators
9. Pak railways
infrastructure &
equipment
development
services -
Regional
Development
10. Business
Development
11. Governance
facilities (Nos)
Feasibility Studies (Number)
Establishment of new dry ports
(Nos)
Training and Development (Nos)
Monitoring and evaluation system
(Nos)
Monitoring and evaluation reports
3
15
60
1
4
50
5
10
10
1
40
1
45
50
2
70
1
60
2
80
Railways Division
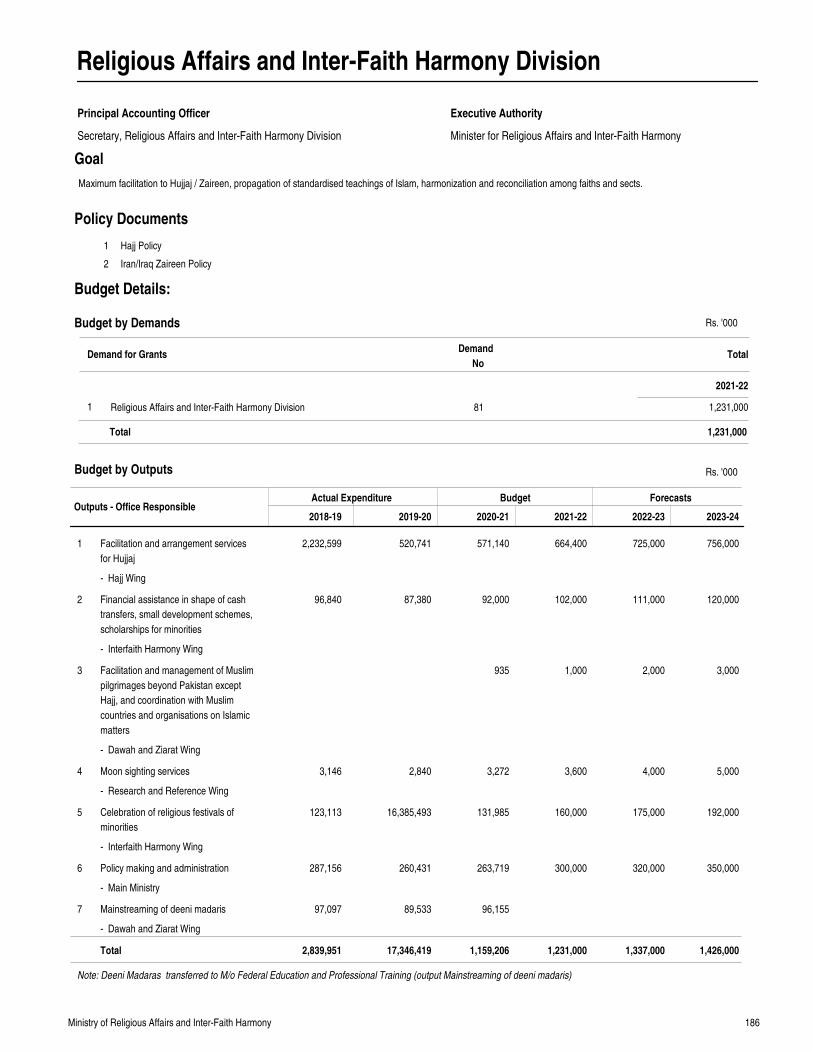
186Ministry of Religious Affairs and Inter-Faith Harmony
Religious Affairs and Inter-Faith Harmony Division
Principal Accounting Officer
Secretary, Religious Affairs and Inter-Faith Harmony Division Minister for Religious Affairs and Inter-Faith Harmony
Executive Authority
Goal
Outputs - Office ResponsibleActual Expenditure Budget Forecasts
2018-19 2019-20 2020-21 2021-22 2022-23 2023-24
Facilitation and arrangement services
for Hujjaj
Financial assistance in shape of cash
transfers, small development schemes,
scholarships for minorities
Facilitation and management of Muslim
pilgrimages beyond Pakistan except
Hajj, and coordination with Muslim
countries and organisations on Islamic
matters
Moon sighting services
Celebration of religious festivals of
minorities
Policy making and administration
Mainstreaming of deeni madaris
2,232,599
96,840
3,146
123,113
287,156
97,097
520,741
87,380
2,840
16,385,493
260,431
89,533
571,140
92,000
935
3,272
131,985
263,719
96,155
664,400
102,000
1,000
3,600
160,000
300,000
725,000
111,000
2,000
4,000
175,000
320,000
756,000
120,000
3,000
5,000
192,000
350,000
1
2
3
4
5
6
7
Total 2,839,951 17,346,419 1,159,206 1,231,000 1,337,000 1,426,000
Note: Deeni Madaras transferred to M/o Federal Education and Professional Training (output Mainstreaming of deeni madaris)
Rs. '000
1
2
Hajj Policy
Iran/Iraq Zaireen Policy
Policy Documents
Budget by Outputs
Maximum facilitation to Hujjaj / Zaireen, propagation of standardised teachings of Islam, harmonization and reconciliation among faiths and sects.
Demand for GrantsDemand
NoTotal
2021-22
Budget by Demands
Religious Affairs and Inter-Faith Harmony Division1 81 1,231,000
1,231,000Total
Budget Details:
- Hajj Wing
- Interfaith Harmony Wing
- Dawah and Ziarat Wing
- Research and Reference Wing
- Interfaith Harmony Wing
- Main Ministry
- Dawah and Ziarat Wing
Rs. '000
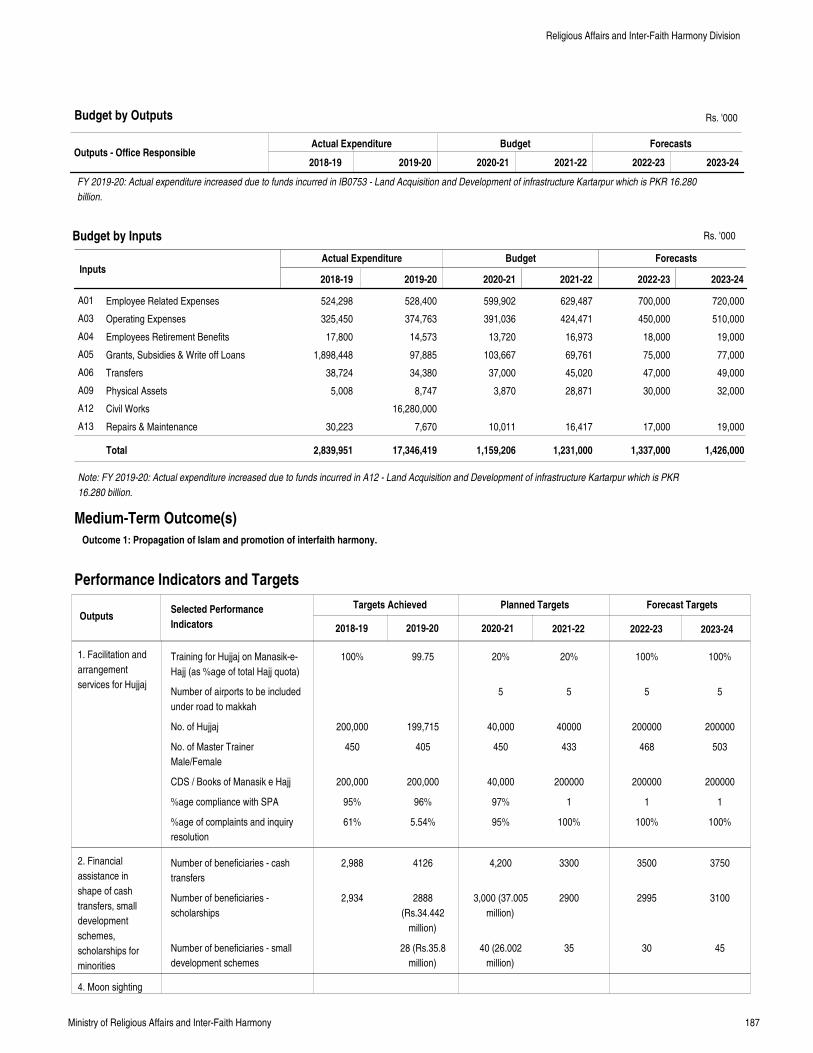
187Ministry of Religious Affairs and Inter-Faith Harmony
Outputs - Office ResponsibleActual Expenditure Budget Forecasts
2018-19 2019-20 2020-21 2021-22 2022-23 2023-24
FY 2019-20: Actual expenditure increased due to funds incurred in IB0753 - Land Acquisition and Development of infrastructure Kartarpur which is PKR 16.280
billion.
Rs. '000
InputsActual Expenditure Budget Forecasts
Employee Related Expenses
Operating Expenses
Employees Retirement Benefits
Grants, Subsidies & Write off Loans
Transfers
Physical Assets
Civil Works
Repairs & Maintenance
524,298
325,450
17,800
1,898,448
38,724
5,008
30,223
528,400
374,763
14,573
97,885
34,380
8,747
16,280,000
7,670
599,902
391,036
13,720
103,667
37,000
3,870
10,011
629,487
424,471
16,973
69,761
45,020
28,871
16,417
700,000
450,000
18,000
75,000
47,000
30,000
17,000
720,000
510,000
19,000
77,000
49,000
32,000
19,000
A01
A03
A04
A05
A06
A09
A12
A13
Total 2,839,951 17,346,419 1,159,206 1,231,000 1,337,000 1,426,000
Note: FY 2019-20: Actual expenditure increased due to funds incurred in A12 - Land Acquisition and Development of infrastructure Kartarpur which is PKR
16.280 billion.
2018-19 2019-20 2020-21 2021-22 2022-23 2023-24
Medium-Term Outcome(s)
Outcome 1: Propagation of Islam and promotion of interfaith harmony.
Performance Indicators and Targets
OutputsTargets Achieved Planned Targets Forecast Targets
2018-19 2019-20 2020-21 2021-22 2022-23 2023-24
Selected Performance
Indicators
1. Facilitation and
arrangement
services for Hujjaj
2. Financial
assistance in
shape of cash
transfers, small
development
schemes,
scholarships for
minorities
4. Moon sighting
Budget by Outputs
Budget by Inputs
Training for Hujjaj on Manasik-e-
Hajj (as %age of total Hajj quota)
Number of airports to be included
under road to makkah
No. of Hujjaj
No. of Master Trainer
Male/Female
CDS / Books of Manasik e Hajj
%age compliance with SPA
%age of complaints and inquiry
resolution
Number of beneficiaries - cash
transfers
Number of beneficiaries -
scholarships
Number of beneficiaries - small
development schemes
100%
200,000
450
200,000
95%
61%
2,988
2,934
99.75
199,715
405
200,000
96%
5.54%
4126
2888
(Rs.34.442
million)
28 (Rs.35.8
million)
20%
5
40,000
450
40,000
97%
95%
4,200
3,000 (37.005
million)
40 (26.002
million)
20%
5
40000
433
200000
1
100%
3300
2900
35
100%
5
200000
468
200000
1
100%
3500
2995
30
100%
5
200000
503
200000
1
100%
3750
3100
45
Religious Affairs and Inter-Faith Harmony Division
Rs. '000
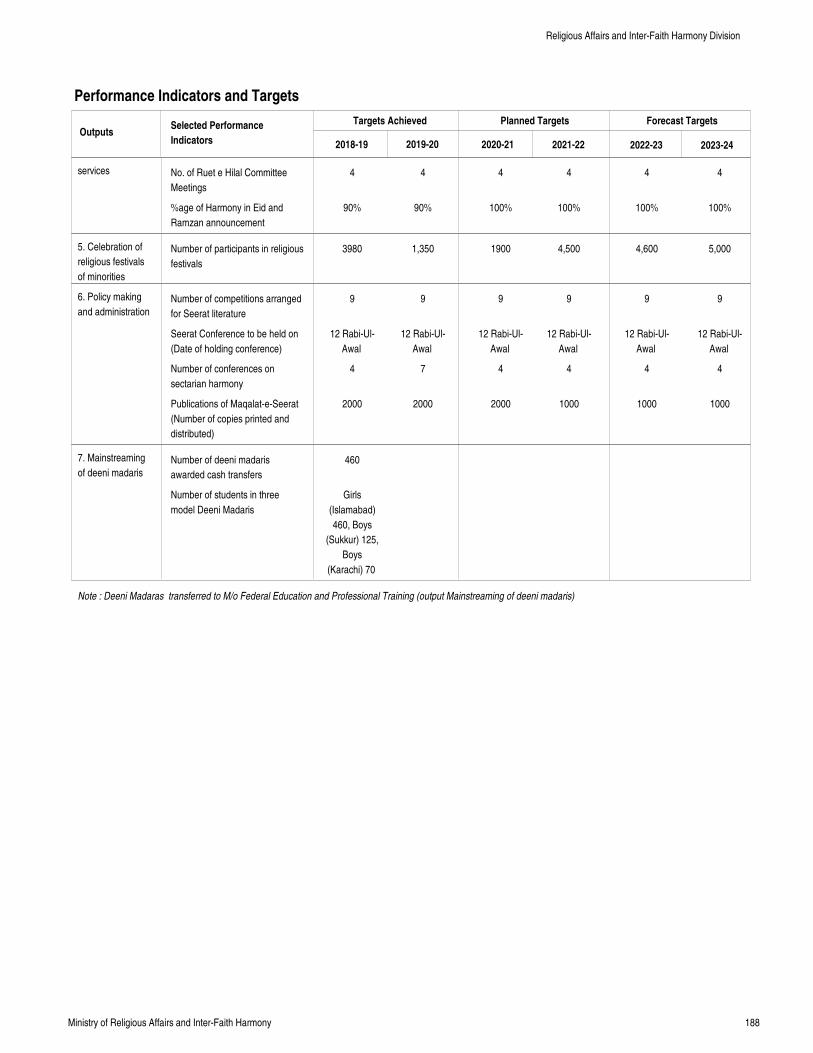
188Ministry of Religious Affairs and Inter-Faith Harmony
Performance Indicators and Targets
OutputsTargets Achieved Planned Targets Forecast Targets
2018-19 2019-20 2020-21 2021-22 2022-23 2023-24
Selected Performance
Indicators
services
5. Celebration of
religious festivals
of minorities
6. Policy making
and administration
7. Mainstreaming
of deeni madaris
Note : Deeni Madaras transferred to M/o Federal Education and Professional Training (output Mainstreaming of deeni madaris)
No. of Ruet e Hilal Committee
Meetings
%age of Harmony in Eid and
Ramzan announcement
Number of participants in religious
festivals
Number of competitions arranged
for Seerat literature
Seerat Conference to be held on
(Date of holding conference)
Number of conferences on
sectarian harmony
Publications of Maqalat-e-Seerat
(Number of copies printed and
distributed)
Number of deeni madaris
awarded cash transfers
Number of students in three
model Deeni Madaris
4
90%
3980
9
12 Rabi-Ul-
Awal
4
2000
460
Girls
(Islamabad)
460, Boys
(Sukkur) 125,
Boys
(Karachi) 70
4
90%
1,350
9
12 Rabi-Ul-
Awal
7
2000
4
100%
1900
9
12 Rabi-Ul-
Awal
4
2000
4
100%
4,500
9
12 Rabi-Ul-
Awal
4
1000
4
100%
4,600
9
12 Rabi-Ul-
Awal
4
1000
4
100%
5,000
9
12 Rabi-Ul-
Awal
4
1000
Religious Affairs and Inter-Faith Harmony Division
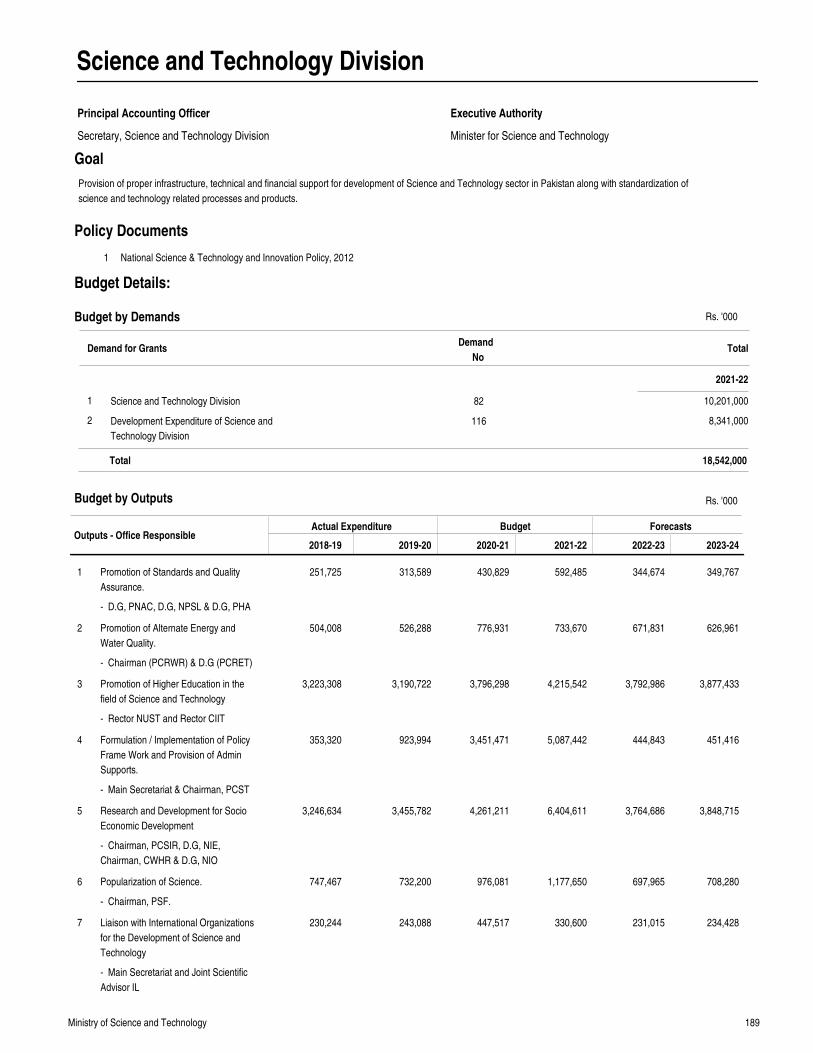
189Ministry of Science and Technology
Science and Technology Division
Principal Accounting Officer
Secretary, Science and Technology Division Minister for Science and Technology
Executive Authority
Goal
Outputs - Office ResponsibleActual Expenditure Budget Forecasts
2018-19 2019-20 2020-21 2021-22 2022-23 2023-24
Promotion of Standards and Quality
Assurance.
Promotion of Alternate Energy and
Water Quality.
Promotion of Higher Education in the
field of Science and Technology
Formulation / Implementation of Policy
Frame Work and Provision of Admin
Supports.
Research and Development for Socio
Economic Development
Popularization of Science.
Liaison with International Organizations
for the Development of Science and
Technology
251,725
504,008
3,223,308
353,320
3,246,634
747,467
230,244
313,589
526,288
3,190,722
923,994
3,455,782
732,200
243,088
430,829
776,931
3,796,298
3,451,471
4,261,211
976,081
447,517
592,485
733,670
4,215,542
5,087,442
6,404,611
1,177,650
330,600
344,674
671,831
3,792,986
444,843
3,764,686
697,965
231,015
349,767
626,961
3,877,433
451,416
3,848,715
708,280
234,428
1
2
3
4
5
6
7
Rs. '000
1 National Science & Technology and Innovation Policy, 2012
Policy Documents
Budget by Outputs
Provision of proper infrastructure, technical and financial support for development of Science and Technology sector in Pakistan along with standardization of
science and technology related processes and products.
Demand for GrantsDemand
NoTotal
2021-22
Budget by Demands
Science and Technology Division
Development Expenditure of Science and
Technology Division
1
2
82
116
10,201,000
8,341,000
18,542,000Total
Budget Details:
- D.G, PNAC, D.G, NPSL & D.G, PHA
- Chairman (PCRWR) & D.G (PCRET)
- Rector NUST and Rector CIIT
- Main Secretariat & Chairman, PCST
- Chairman, PCSIR, D.G, NIE,
Chairman, CWHR & D.G, NIO
- Chairman, PSF.
- Main Secretariat and Joint Scientific
Advisor IL
Rs. '000
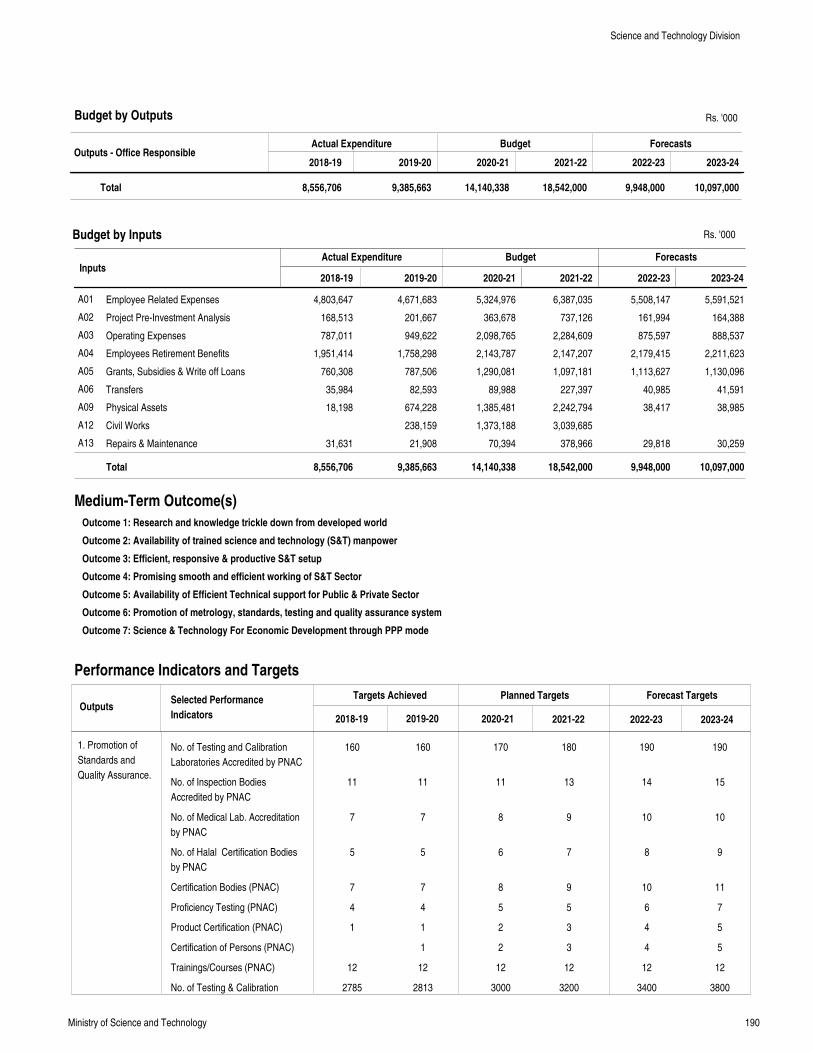
190Ministry of Science and Technology
Outputs - Office ResponsibleActual Expenditure Budget Forecasts
2018-19 2019-20 2020-21 2021-22 2022-23 2023-24
Total 8,556,706 9,385,663 14,140,338 18,542,000 9,948,000 10,097,000
Rs. '000
InputsActual Expenditure Budget Forecasts
Employee Related Expenses
Project Pre-Investment Analysis
Operating Expenses
Employees Retirement Benefits
Grants, Subsidies & Write off Loans
Transfers
Physical Assets
Civil Works
Repairs & Maintenance
4,803,647
168,513
787,011
1,951,414
760,308
35,984
18,198
31,631
4,671,683
201,667
949,622
1,758,298
787,506
82,593
674,228
238,159
21,908
5,324,976
363,678
2,098,765
2,143,787
1,290,081
89,988
1,385,481
1,373,188
70,394
6,387,035
737,126
2,284,609
2,147,207
1,097,181
227,397
2,242,794
3,039,685
378,966
5,508,147
161,994
875,597
2,179,415
1,113,627
40,985
38,417
29,818
5,591,521
164,388
888,537
2,211,623
1,130,096
41,591
38,985
30,259
A01
A02
A03
A04
A05
A06
A09
A12
A13
Total 8,556,706 9,385,663 14,140,338 18,542,000 9,948,000 10,097,000
2018-19 2019-20 2020-21 2021-22 2022-23 2023-24
Medium-Term Outcome(s)
Outcome 1: Research and knowledge trickle down from developed world
Outcome 2: Availability of trained science and technology (S&T) manpower
Outcome 3: Efficient, responsive & productive S&T setup
Outcome 4: Promising smooth and efficient working of S&T Sector
Outcome 5: Availability of Efficient Technical support for Public & Private Sector
Outcome 6: Promotion of metrology, standards, testing and quality assurance system
Outcome 7: Science & Technology For Economic Development through PPP mode
Performance Indicators and Targets
OutputsTargets Achieved Planned Targets Forecast Targets
2018-19 2019-20 2020-21 2021-22 2022-23 2023-24
Selected Performance
Indicators
1. Promotion of
Standards and
Quality Assurance.
Budget by Outputs
Budget by Inputs
No. of Testing and Calibration
Laboratories Accredited by PNAC
No. of Inspection Bodies
Accredited by PNAC
No. of Medical Lab. Accreditation
by PNAC
No. of Halal Certification Bodies
by PNAC
Certification Bodies (PNAC)
Proficiency Testing (PNAC)
Product Certification (PNAC)
Certification of Persons (PNAC)
Trainings/Courses (PNAC)
No. of Testing & Calibration
160
11
7
5
7
4
1
12
2785
160
11
7
5
7
4
1
1
12
2813
170
11
8
6
8
5
2
2
12
3000
180
13
9
7
9
5
3
3
12
3200
190
14
10
8
10
6
4
4
12
3400
190
15
10
9
11
7
5
5
12
3800
Science and Technology Division
Rs. '000
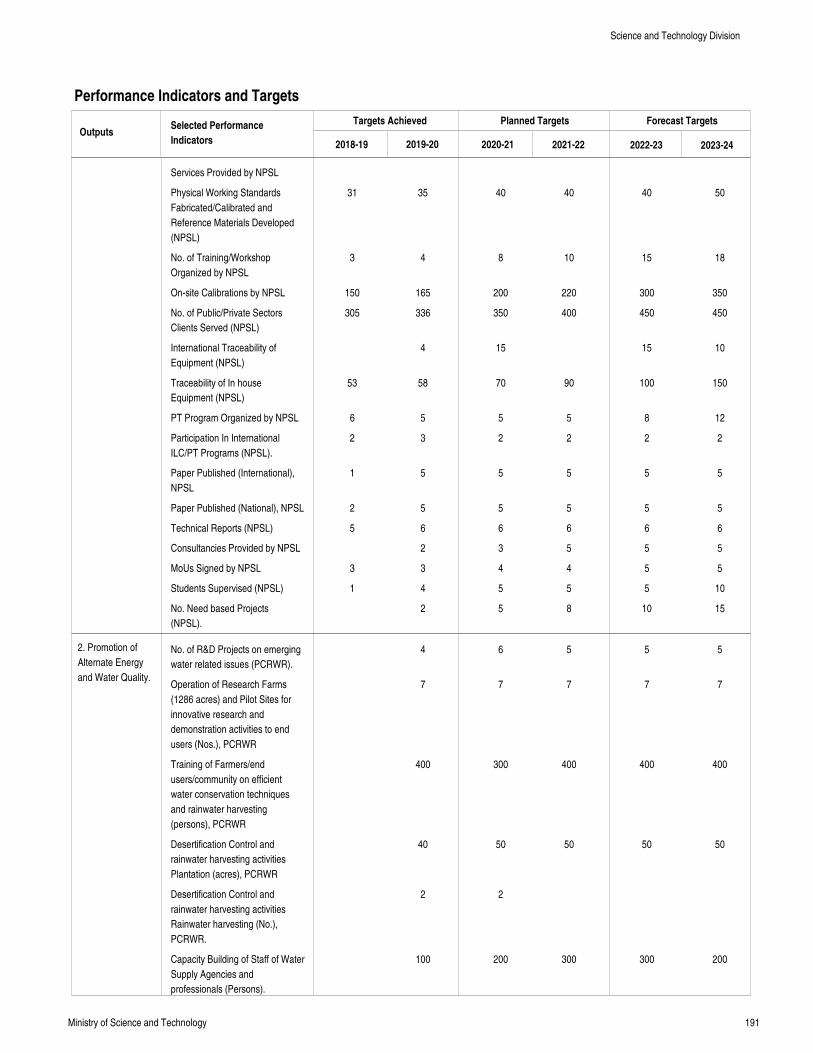
191Ministry of Science and Technology
Performance Indicators and Targets
OutputsTargets Achieved Planned Targets Forecast Targets
2018-19 2019-20 2020-21 2021-22 2022-23 2023-24
Selected Performance
Indicators
2. Promotion of
Alternate Energy
and Water Quality.
Services Provided by NPSL
Physical Working Standards
Fabricated/Calibrated and
Reference Materials Developed
(NPSL)
No. of Training/Workshop
Organized by NPSL
On-site Calibrations by NPSL
No. of Public/Private Sectors
Clients Served (NPSL)
International Traceability of
Equipment (NPSL)
Traceability of In house
Equipment (NPSL)
PT Program Organized by NPSL
Participation In International
ILC/PT Programs (NPSL).
Paper Published (International),
NPSL
Paper Published (National), NPSL
Technical Reports (NPSL)
Consultancies Provided by NPSL
MoUs Signed by NPSL
Students Supervised (NPSL)
No. Need based Projects
(NPSL).
No. of R&D Projects on emerging
water related issues (PCRWR).
Operation of Research Farms
(1286 acres) and Pilot Sites for
innovative research and
demonstration activities to end
users (Nos.), PCRWR
Training of Farmers/end
users/community on efficient
water conservation techniques
and rainwater harvesting
(persons), PCRWR
Desertification Control and
rainwater harvesting activities
Plantation (acres), PCRWR
Desertification Control and
rainwater harvesting activities
Rainwater harvesting (No.),
PCRWR.
Capacity Building of Staff of Water
Supply Agencies and
professionals (Persons).
31
3
150
305
53
6
2
1
2
5
3
1
35
4
165
336
4
58
5
3
5
5
6
2
3
4
2
4
7
400
40
2
100
40
8
200
350
15
70
5
2
5
5
6
3
4
5
5
6
7
300
50
2
200
40
10
220
400
90
5
2
5
5
6
5
4
5
8
5
7
400
50
300
40
15
300
450
15
100
8
2
5
5
6
5
5
5
10
5
7
400
50
300
50
18
350
450
10
150
12
2
5
5
6
5
5
10
15
5
7
400
50
200
Science and Technology Division
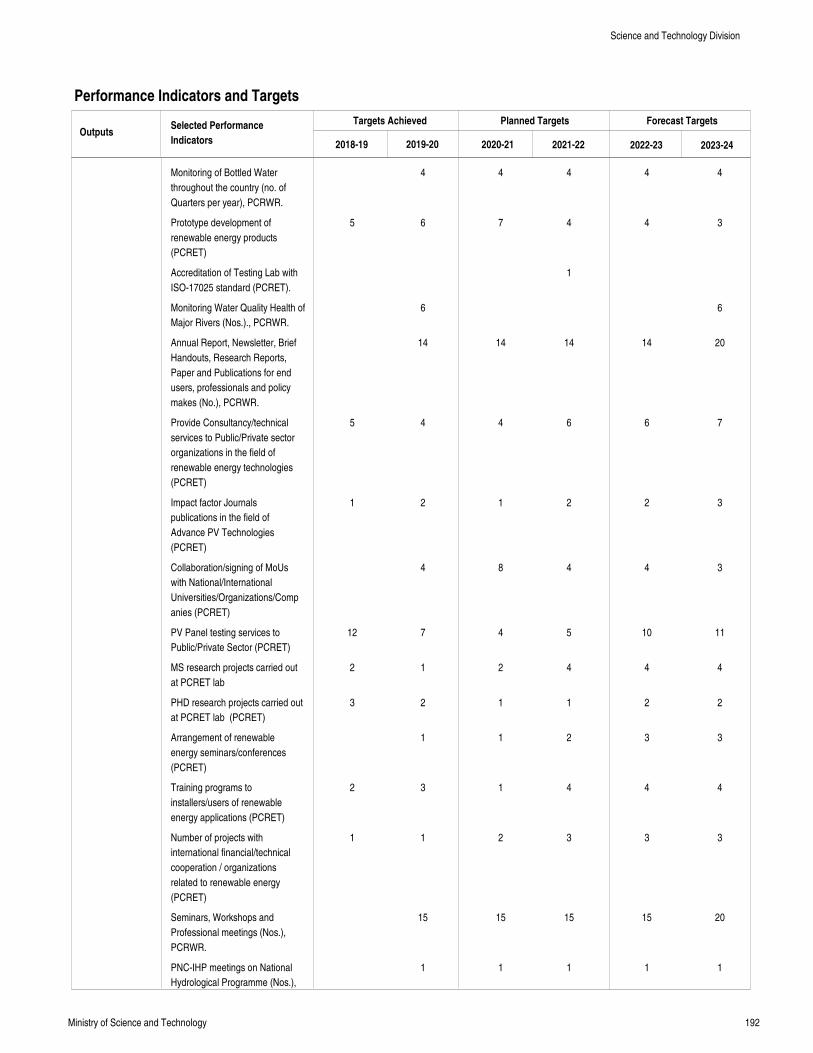
192Ministry of Science and Technology
Performance Indicators and Targets
OutputsTargets Achieved Planned Targets Forecast Targets
2018-19 2019-20 2020-21 2021-22 2022-23 2023-24
Selected Performance
Indicators
Monitoring of Bottled Water
throughout the country (no. of
Quarters per year), PCRWR.
Prototype development of
renewable energy products
(PCRET)
Accreditation of Testing Lab with
ISO-17025 standard (PCRET).
Monitoring Water Quality Health of
Major Rivers (Nos.)., PCRWR.
Annual Report, Newsletter, Brief
Handouts, Research Reports,
Paper and Publications for end
users, professionals and policy
makes (No.), PCRWR.
Provide Consultancy/technical
services to Public/Private sector
organizations in the field of
renewable energy technologies
(PCRET)
Impact factor Journals
publications in the field of
Advance PV Technologies
(PCRET)
Collaboration/signing of MoUs
with National/International
Universities/Organizations/Comp
anies (PCRET)
PV Panel testing services to
Public/Private Sector (PCRET)
MS research projects carried out
at PCRET lab
PHD research projects carried out
at PCRET lab (PCRET)
Arrangement of renewable
energy seminars/conferences
(PCRET)
Training programs to
installers/users of renewable
energy applications (PCRET)
Number of projects with
international financial/technical
cooperation / organizations
related to renewable energy
(PCRET)
Seminars, Workshops and
Professional meetings (Nos.),
PCRWR.
PNC-IHP meetings on National
Hydrological Programme (Nos.),
5
5
1
12
2
3
2
1
4
6
6
14
4
2
4
7
1
2
1
3
1
15
1
4
7
14
4
1
8
4
2
1
1
1
2
15
1
4
4
1
14
6
2
4
5
4
1
2
4
3
15
1
4
4
14
6
2
4
10
4
2
3
4
3
15
1
4
3
6
20
7
3
3
11
4
2
3
4
3
20
1
Science and Technology Division
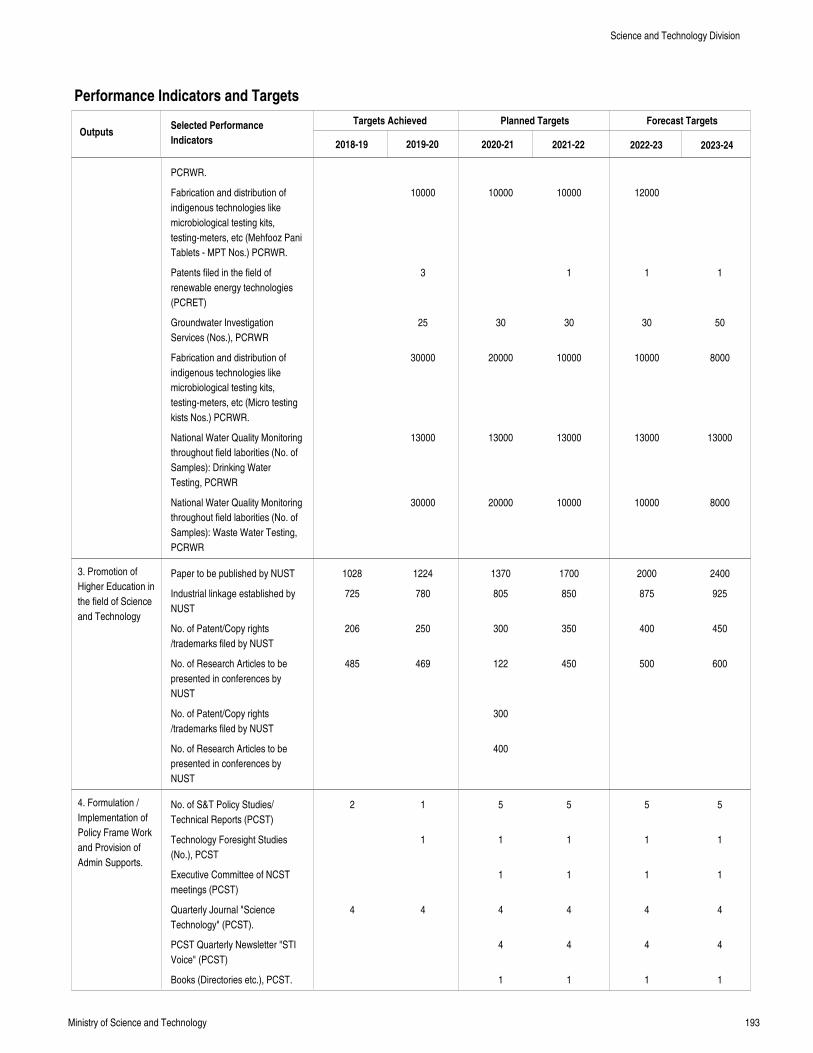
193Ministry of Science and Technology
Performance Indicators and Targets
OutputsTargets Achieved Planned Targets Forecast Targets
2018-19 2019-20 2020-21 2021-22 2022-23 2023-24
Selected Performance
Indicators
3. Promotion of
Higher Education in
the field of Science
and Technology
4. Formulation /
Implementation of
Policy Frame Work
and Provision of
Admin Supports.
PCRWR.
Fabrication and distribution of
indigenous technologies like
microbiological testing kits,
testing-meters, etc (Mehfooz Pani
Tablets - MPT Nos.) PCRWR.
Patents filed in the field of
renewable energy technologies
(PCRET)
Groundwater Investigation
Services (Nos.), PCRWR
Fabrication and distribution of
indigenous technologies like
microbiological testing kits,
testing-meters, etc (Micro testing
kists Nos.) PCRWR.
National Water Quality Monitoring
throughout field laborities (No. of
Samples): Drinking Water
Testing, PCRWR
National Water Quality Monitoring
throughout field laborities (No. of
Samples): Waste Water Testing,
PCRWR
Paper to be published by NUST
Industrial linkage established by
NUST
No. of Patent/Copy rights
/trademarks filed by NUST
No. of Research Articles to be
presented in conferences by
NUST
No. of Patent/Copy rights
/trademarks filed by NUST
No. of Research Articles to be
presented in conferences by
NUST
No. of S&T Policy Studies/
Technical Reports (PCST)
Technology Foresight Studies
(No.), PCST
Executive Committee of NCST
meetings (PCST)
Quarterly Journal "Science
Technology" (PCST).
PCST Quarterly Newsletter "STI
Voice" (PCST)
Books (Directories etc.), PCST.
1028
725
206
485
2
4
10000
3
25
30000
13000
30000
1224
780
250
469
1
1
4
10000
30
20000
13000
20000
1370
805
300
122
300
400
5
1
1
4
4
1
10000
1
30
10000
13000
10000
1700
850
350
450
5
1
1
4
4
1
12000
1
30
10000
13000
10000
2000
875
400
500
5
1
1
4
4
1
1
50
8000
13000
8000
2400
925
450
600
5
1
1
4
4
1
Science and Technology Division
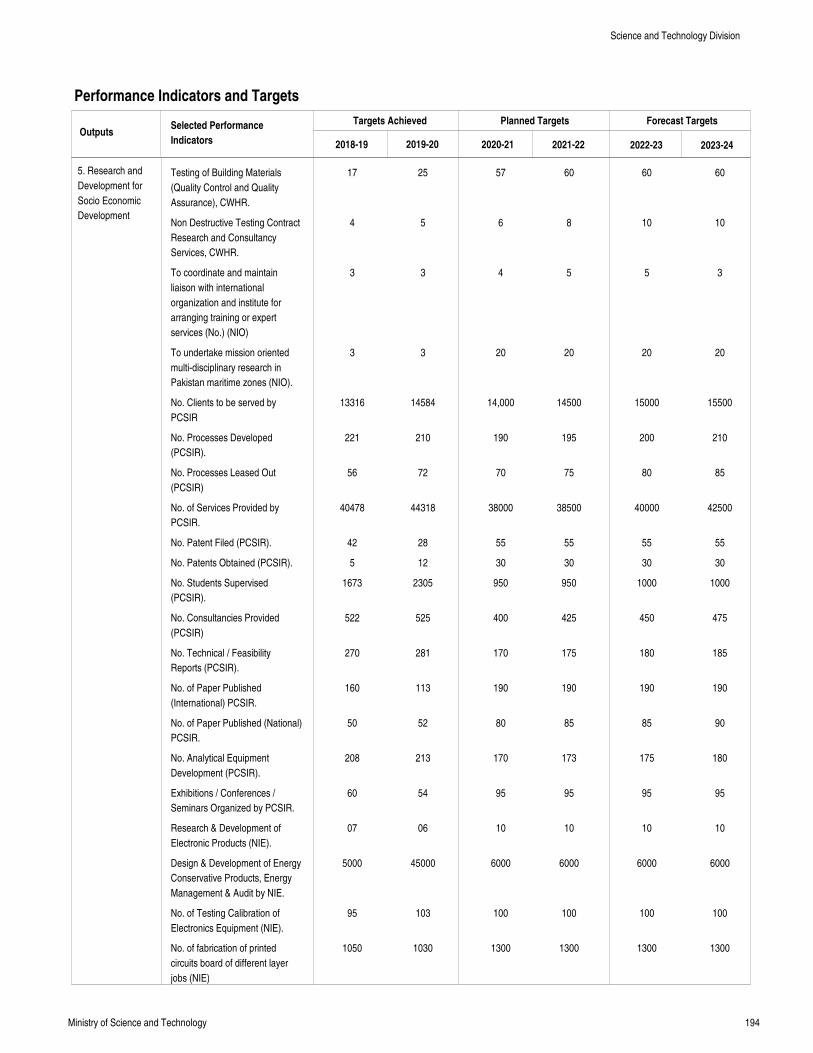
194Ministry of Science and Technology
Performance Indicators and Targets
OutputsTargets Achieved Planned Targets Forecast Targets
2018-19 2019-20 2020-21 2021-22 2022-23 2023-24
Selected Performance
Indicators
5. Research and
Development for
Socio Economic
Development
Testing of Building Materials
(Quality Control and Quality
Assurance), CWHR.
Non Destructive Testing Contract
Research and Consultancy
Services, CWHR.
To coordinate and maintain
liaison with international
organization and institute for
arranging training or expert
services (No.) (NIO)
To undertake mission oriented
multi-disciplinary research in
Pakistan maritime zones (NIO).
No. Clients to be served by
PCSIR
No. Processes Developed
(PCSIR).
No. Processes Leased Out
(PCSIR)
No. of Services Provided by
PCSIR.
No. Patent Filed (PCSIR).
No. Patents Obtained (PCSIR).
No. Students Supervised
(PCSIR).
No. Consultancies Provided
(PCSIR)
No. Technical / Feasibility
Reports (PCSIR).
No. of Paper Published
(International) PCSIR.
No. of Paper Published (National)
PCSIR.
No. Analytical Equipment
Development (PCSIR).
Exhibitions / Conferences /
Seminars Organized by PCSIR.
Research & Development of
Electronic Products (NIE).
Design & Development of Energy
Conservative Products, Energy
Management & Audit by NIE.
No. of Testing Calibration of
Electronics Equipment (NIE).
No. of fabrication of printed
circuits board of different layer
jobs (NIE)
17
4
3
3
13316
221
56
40478
42
5
1673
522
270
160
50
208
60
07
5000
95
1050
25
5
3
3
14584
210
72
44318
28
12
2305
525
281
113
52
213
54
06
45000
103
1030
57
6
4
20
14,000
190
70
38000
55
30
950
400
170
190
80
170
95
10
6000
100
1300
60
8
5
20
14500
195
75
38500
55
30
950
425
175
190
85
173
95
10
6000
100
1300
60
10
5
20
15000
200
80
40000
55
30
1000
450
180
190
85
175
95
10
6000
100
1300
60
10
3
20
15500
210
85
42500
55
30
1000
475
185
190
90
180
95
10
6000
100
1300
Science and Technology Division
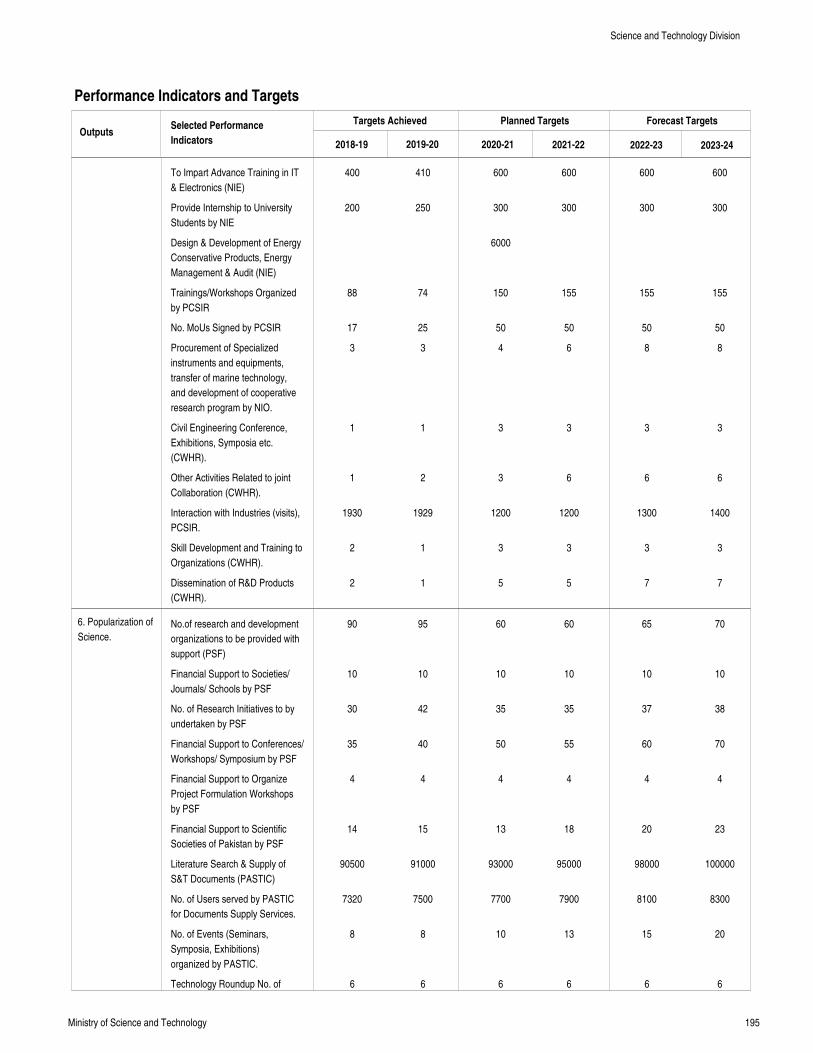
195Ministry of Science and Technology
Performance Indicators and Targets
OutputsTargets Achieved Planned Targets Forecast Targets
2018-19 2019-20 2020-21 2021-22 2022-23 2023-24
Selected Performance
Indicators
6. Popularization of
Science.
To Impart Advance Training in IT
& Electronics (NIE)
Provide Internship to University
Students by NIE
Design & Development of Energy
Conservative Products, Energy
Management & Audit (NIE)
Trainings/Workshops Organized
by PCSIR
No. MoUs Signed by PCSIR
Procurement of Specialized
instruments and equipments,
transfer of marine technology,
and development of cooperative
research program by NIO.
Civil Engineering Conference,
Exhibitions, Symposia etc.
(CWHR).
Other Activities Related to joint
Collaboration (CWHR).
Interaction with Industries (visits),
PCSIR.
Skill Development and Training to
Organizations (CWHR).
Dissemination of R&D Products
(CWHR).
No.of research and development
organizations to be provided with
support (PSF)
Financial Support to Societies/
Journals/ Schools by PSF
No. of Research Initiatives to by
undertaken by PSF
Financial Support to Conferences/
Workshops/ Symposium by PSF
Financial Support to Organize
Project Formulation Workshops
by PSF
Financial Support to Scientific
Societies of Pakistan by PSF
Literature Search & Supply of
S&T Documents (PASTIC)
No. of Users served by PASTIC
for Documents Supply Services.
No. of Events (Seminars,
Symposia, Exhibitions)
organized by PASTIC.
Technology Roundup No. of
400
200
88
17
3
1
1
1930
2
2
90
10
30
35
4
14
90500
7320
8
6
410
250
74
25
3
1
2
1929
1
1
95
10
42
40
4
15
91000
7500
8
6
600
300
6000
150
50
4
3
3
1200
3
5
60
10
35
50
4
13
93000
7700
10
6
600
300
155
50
6
3
6
1200
3
5
60
10
35
55
4
18
95000
7900
13
6
600
300
155
50
8
3
6
1300
3
7
65
10
37
60
4
20
98000
8100
15
6
600
300
155
50
8
3
6
1400
3
7
70
10
38
70
4
23
100000
8300
20
6
Science and Technology Division
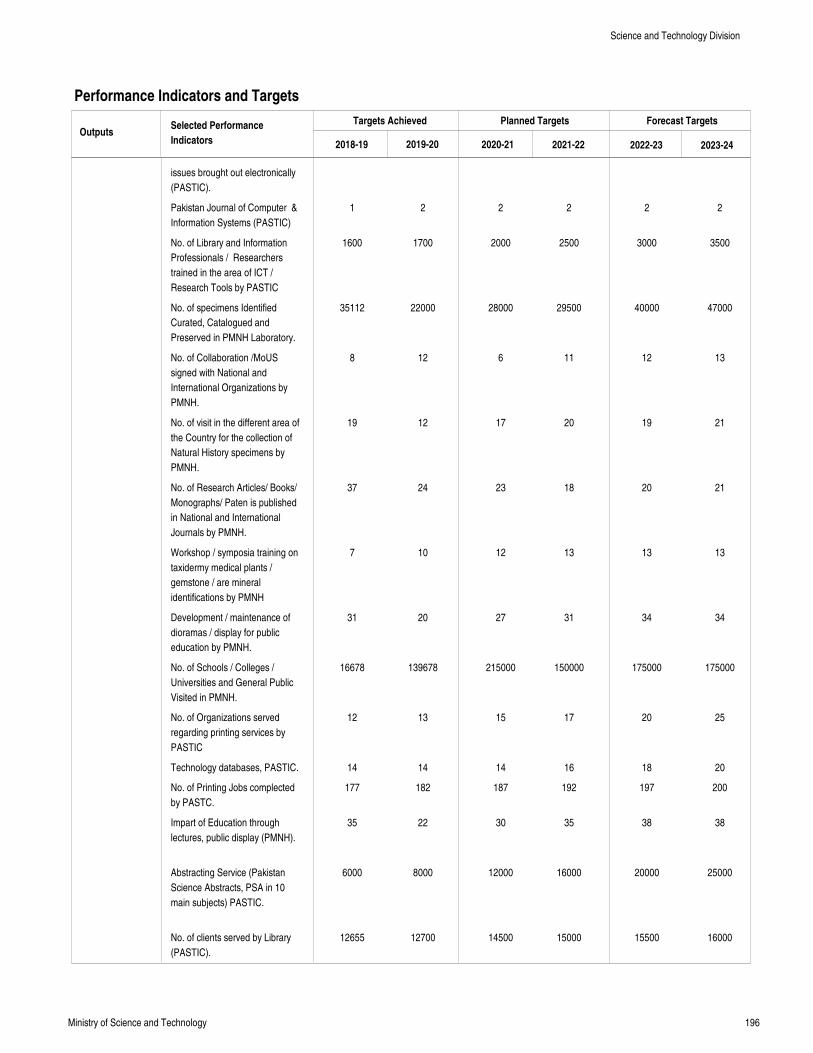
196Ministry of Science and Technology
Performance Indicators and Targets
OutputsTargets Achieved Planned Targets Forecast Targets
2018-19 2019-20 2020-21 2021-22 2022-23 2023-24
Selected Performance
Indicators
issues brought out electronically
(PASTIC).
Pakistan Journal of Computer &
Information Systems (PASTIC)
No. of Library and Information
Professionals / Researchers
trained in the area of ICT /
Research Tools by PASTIC
No. of specimens Identified
Curated, Catalogued and
Preserved in PMNH Laboratory.
No. of Collaboration /MoUS
signed with National and
International Organizations by
PMNH.
No. of visit in the different area of
the Country for the collection of
Natural History specimens by
PMNH.
No. of Research Articles/ Books/
Monographs/ Paten is published
in National and International
Journals by PMNH.
Workshop / symposia training on
taxidermy medical plants /
gemstone / are mineral
identifications by PMNH
Development / maintenance of
dioramas / display for public
education by PMNH.
No. of Schools / Colleges /
Universities and General Public
Visited in PMNH.
No. of Organizations served
regarding printing services by
PASTIC
Technology databases, PASTIC.
No. of Printing Jobs complected
by PASTC.
Impart of Education through
lectures, public display (PMNH).
Abstracting Service (Pakistan
Science Abstracts, PSA in 10
main subjects) PASTIC.
No. of clients served by Library
(PASTIC).
1
1600
35112
8
19
37
7
31
16678
12
14
177
35
6000
12655
2
1700
22000
12
12
24
10
20
139678
13
14
182
22
8000
12700
2
2000
28000
6
17
23
12
27
215000
15
14
187
30
12000
14500
2
2500
29500
11
20
18
13
31
150000
17
16
192
35
16000
15000
2
3000
40000
12
19
20
13
34
175000
20
18
197
38
20000
15500
2
3500
47000
13
21
21
13
34
175000
25
20
200
38
25000
16000
Science and Technology Division
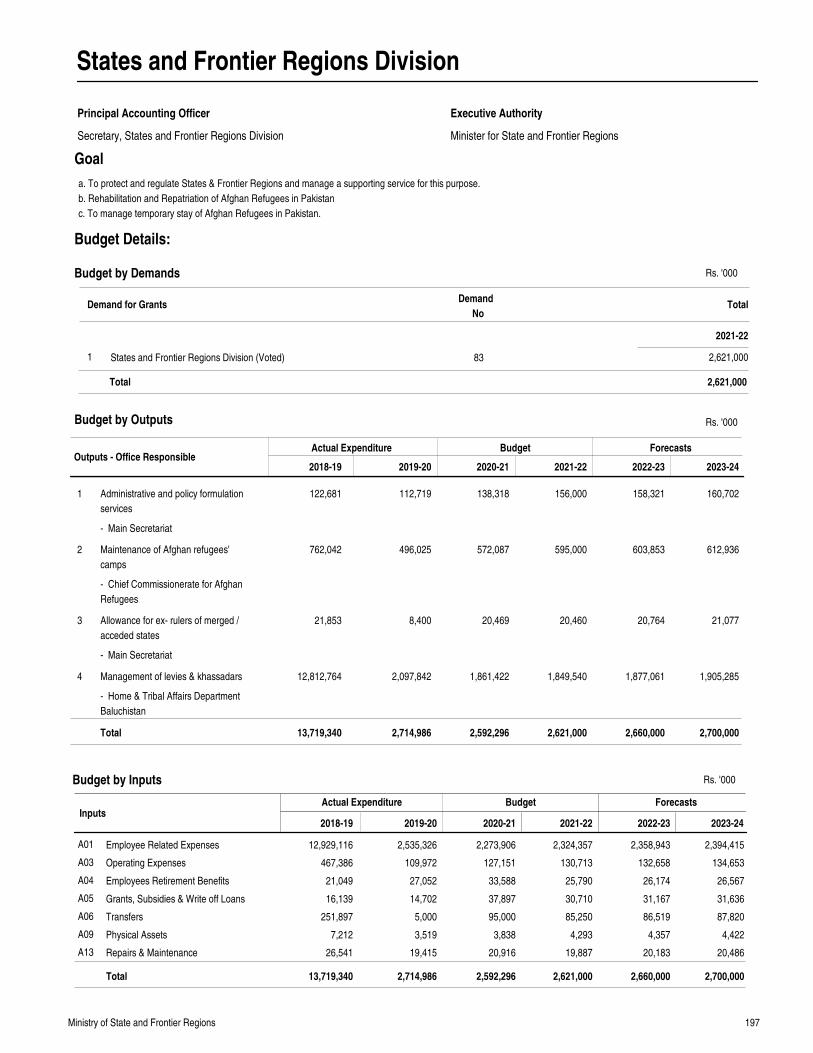
197Ministry of State and Frontier Regions
States and Frontier Regions Division
Principal Accounting Officer
Secretary, States and Frontier Regions Division Minister for State and Frontier Regions
Executive Authority
Goal
Outputs - Office ResponsibleActual Expenditure Budget Forecasts
2018-19 2019-20 2020-21 2021-22 2022-23 2023-24
Administrative and policy formulation
services
Maintenance of Afghan refugees'
camps
Allowance for ex- rulers of merged /
acceded states
Management of levies & khassadars
122,681
762,042
21,853
12,812,764
112,719
496,025
8,400
2,097,842
138,318
572,087
20,469
1,861,422
156,000
595,000
20,460
1,849,540
158,321
603,853
20,764
1,877,061
160,702
612,936
21,077
1,905,285
1
2
3
4
Total 13,719,340 2,714,986 2,592,296 2,621,000 2,660,000 2,700,000
Rs. '000
InputsActual Expenditure Budget Forecasts
Employee Related Expenses
Operating Expenses
Employees Retirement Benefits
Grants, Subsidies & Write off Loans
Transfers
Physical Assets
Repairs & Maintenance
12,929,116
467,386
21,049
16,139
251,897
7,212
26,541
2,535,326
109,972
27,052
14,702
5,000
3,519
19,415
2,273,906
127,151
33,588
37,897
95,000
3,838
20,916
2,324,357
130,713
25,790
30,710
85,250
4,293
19,887
2,358,943
132,658
26,174
31,167
86,519
4,357
20,183
2,394,415
134,653
26,567
31,636
87,820
4,422
20,486
A01
A03
A04
A05
A06
A09
A13
Total 13,719,340 2,714,986 2,592,296 2,621,000 2,660,000 2,700,000
2018-19 2019-20 2020-21 2021-22 2022-23 2023-24
Budget by Outputs
Budget by Inputs
a. To protect and regulate States & Frontier Regions and manage a supporting service for this purpose.
b. Rehabilitation and Repatriation of Afghan Refugees in Pakistan
c. To manage temporary stay of Afghan Refugees in Pakistan.
Demand for GrantsDemand
NoTotal
2021-22
Budget by Demands
States and Frontier Regions Division (Voted)1 83 2,621,000
2,621,000Total
Budget Details:
- Main Secretariat
- Chief Commissionerate for Afghan
Refugees
- Main Secretariat
- Home & Tribal Affairs Department
Baluchistan
Rs. '000
Rs. '000
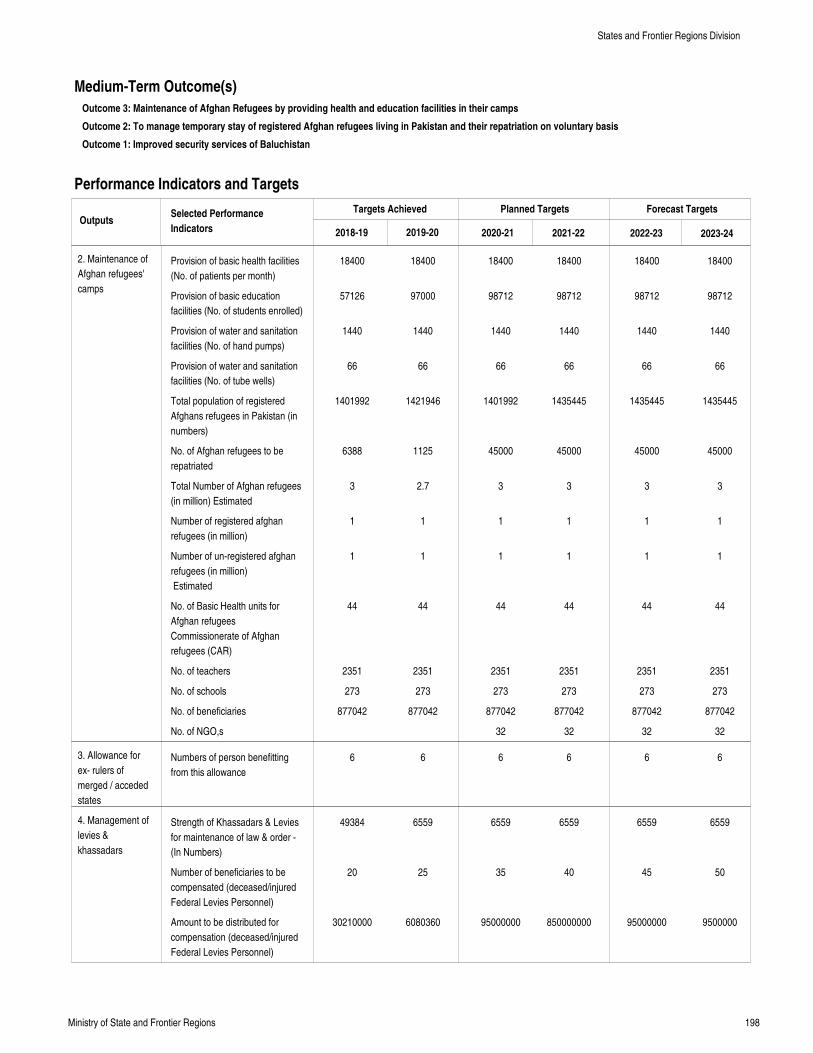
198Ministry of State and Frontier Regions
Medium-Term Outcome(s)
Outcome 3: Maintenance of Afghan Refugees by providing health and education facilities in their camps
Outcome 2: To manage temporary stay of registered Afghan refugees living in Pakistan and their repatriation on voluntary basis
Outcome 1: Improved security services of Baluchistan
Performance Indicators and Targets
OutputsTargets Achieved Planned Targets Forecast Targets
2018-19 2019-20 2020-21 2021-22 2022-23 2023-24
Selected Performance
Indicators
2. Maintenance of
Afghan refugees'
camps
3. Allowance for
ex- rulers of
merged / acceded
states
4. Management of
levies &
khassadars
Provision of basic health facilities
(No. of patients per month)
Provision of basic education
facilities (No. of students enrolled)
Provision of water and sanitation
facilities (No. of hand pumps)
Provision of water and sanitation
facilities (No. of tube wells)
Total population of registered
Afghans refugees in Pakistan (in
numbers)
No. of Afghan refugees to be
repatriated
Total Number of Afghan refugees
(in million) Estimated
Number of registered afghan
refugees (in million)
Number of un-registered afghan
refugees (in million)
Estimated
No. of Basic Health units for
Afghan refugees
Commissionerate of Afghan
refugees (CAR)
No. of teachers
No. of schools
No. of beneficiaries
No. of NGO,s
Numbers of person benefitting
from this allowance
Strength of Khassadars & Levies
for maintenance of law & order -
(In Numbers)
Number of beneficiaries to be
compensated (deceased/injured
Federal Levies Personnel)
Amount to be distributed for
compensation (deceased/injured
Federal Levies Personnel)
18400
57126
1440
66
1401992
6388
3
1
1
44
2351
273
877042
6
49384
20
30210000
18400
97000
1440
66
1421946
1125
2.7
1
1
44
2351
273
877042
6
6559
25
6080360
18400
98712
1440
66
1401992
45000
3
1
1
44
2351
273
877042
32
6
6559
35
95000000
18400
98712
1440
66
1435445
45000
3
1
1
44
2351
273
877042
32
6
6559
40
850000000
18400
98712
1440
66
1435445
45000
3
1
1
44
2351
273
877042
32
6
6559
45
95000000
18400
98712
1440
66
1435445
45000
3
1
1
44
2351
273
877042
32
6
6559
50
9500000
States and Frontier Regions Division
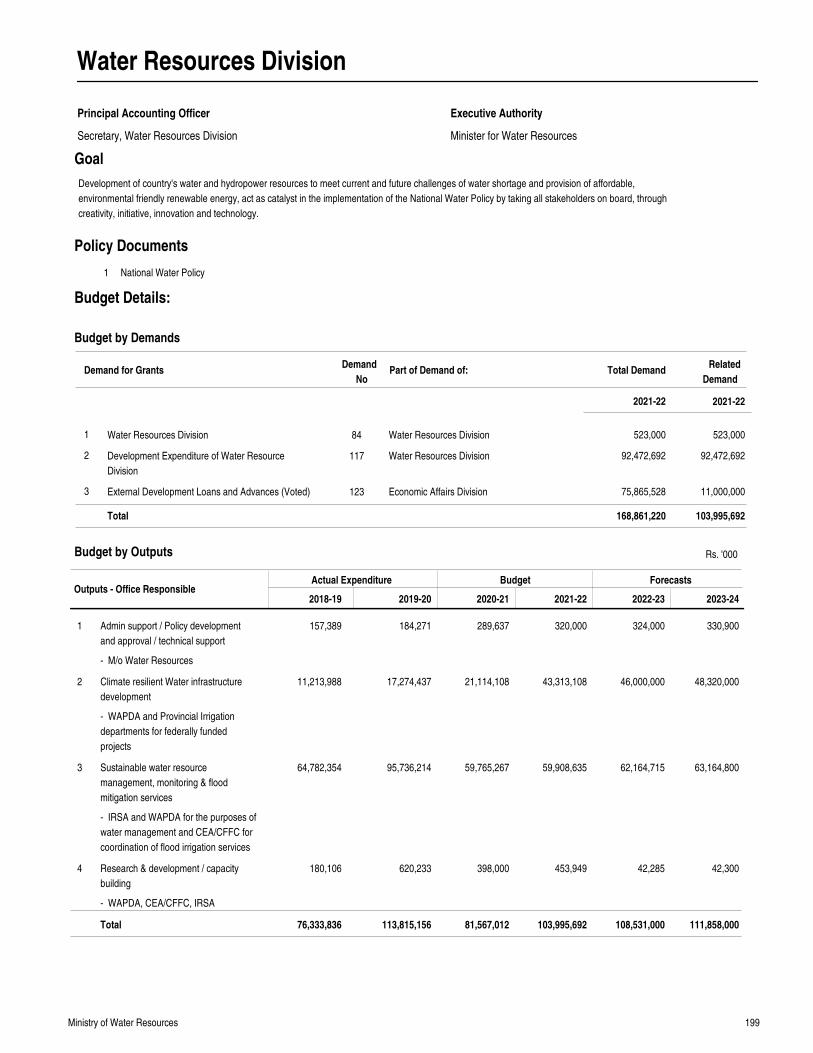
199Ministry of Water Resources
Water Resources Division
Principal Accounting Officer
Secretary, Water Resources Division Minister for Water Resources
Executive Authority
Goal
Outputs - Office ResponsibleActual Expenditure Budget Forecasts
2018-19 2019-20 2020-21 2021-22 2022-23 2023-24
Admin support / Policy development
and approval / technical support
Climate resilient Water infrastructure
development
Sustainable water resource
management, monitoring & flood
mitigation services
Research & development / capacity
building
157,389
11,213,988
64,782,354
180,106
184,271
17,274,437
95,736,214
620,233
289,637
21,114,108
59,765,267
398,000
320,000
43,313,108
59,908,635
453,949
324,000
46,000,000
62,164,715
42,285
330,900
48,320,000
63,164,800
42,300
1
2
3
4
Total 76,333,836 113,815,156 81,567,012 103,995,692 108,531,000 111,858,000
Rs. '000
Water Resources Division
Development Expenditure of Water Resource
Division
External Development Loans and Advances (Voted)
1
2
3
84
117
123
Water Resources Division
Water Resources Division
Economic Affairs Division
523,000
92,472,692
75,865,528
523,000
92,472,692
11,000,000
Demand for GrantsDemand
NoPart of Demand of: Total Demand
2021-22
168,861,220 103,995,692Total
1 National Water Policy
Policy Documents
Budget by Outputs
Budget by Demands
Development of country's water and hydropower resources to meet current and future challenges of water shortage and provision of affordable,
environmental friendly renewable energy, act as catalyst in the implementation of the National Water Policy by taking all stakeholders on board, through
creativity, initiative, innovation and technology.
Budget Details:
- M/o Water Resources
- WAPDA and Provincial Irrigation
departments for federally funded
projects
- IRSA and WAPDA for the purposes of
water management and CEA/CFFC for
coordination of flood irrigation services
- WAPDA, CEA/CFFC, IRSA
2021-22
Related
Demand
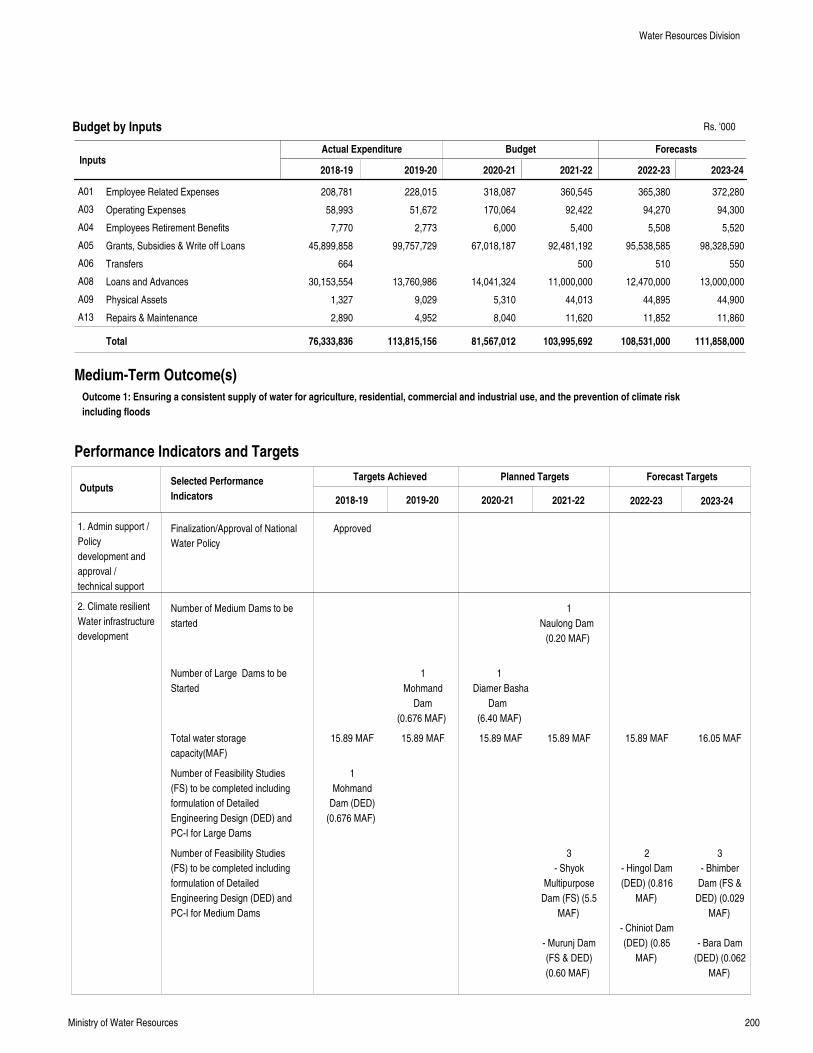
200Ministry of Water Resources
InputsActual Expenditure Budget Forecasts
Employee Related Expenses
Operating Expenses
Employees Retirement Benefits
Grants, Subsidies & Write off Loans
Transfers
Loans and Advances
Physical Assets
Repairs & Maintenance
208,781
58,993
7,770
45,899,858
664
30,153,554
1,327
2,890
228,015
51,672
2,773
99,757,729
13,760,986
9,029
4,952
318,087
170,064
6,000
67,018,187
14,041,324
5,310
8,040
360,545
92,422
5,400
92,481,192
500
11,000,000
44,013
11,620
365,380
94,270
5,508
95,538,585
510
12,470,000
44,895
11,852
372,280
94,300
5,520
98,328,590
550
13,000,000
44,900
11,860
A01
A03
A04
A05
A06
A08
A09
A13
Total 76,333,836 113,815,156 81,567,012 103,995,692 108,531,000 111,858,000
2018-19 2019-20 2020-21 2021-22 2022-23 2023-24
Medium-Term Outcome(s)
Outcome 1: Ensuring a consistent supply of water for agriculture, residential, commercial and industrial use, and the prevention of climate risk
including floods
Performance Indicators and Targets
OutputsTargets Achieved Planned Targets Forecast Targets
2018-19 2019-20 2020-21 2021-22 2022-23 2023-24
Selected Performance
Indicators
1. Admin support /
Policy
development and
approval /
technical support
2. Climate resilient
Water infrastructure
development
Budget by Inputs
Finalization/Approval of National
Water Policy
Number of Medium Dams to be
started
Number of Large Dams to be
Started
Total water storage
capacity(MAF)
Number of Feasibility Studies
(FS) to be completed including
formulation of Detailed
Engineering Design (DED) and
PC-I for Large Dams
Number of Feasibility Studies
(FS) to be completed including
formulation of Detailed
Engineering Design (DED) and
PC-I for Medium Dams
Approved
15.89 MAF
1
Mohmand
Dam (DED)
(0.676 MAF)
1
Mohmand
Dam
(0.676 MAF)
15.89 MAF
1
Diamer Basha
Dam
(6.40 MAF)
15.89 MAF
1
Naulong Dam
(0.20 MAF)
15.89 MAF
3
- Shyok
Multipurpose
Dam (FS) (5.5
MAF)
- Murunj Dam
(FS & DED)
(0.60 MAF)
15.89 MAF
2
- Hingol Dam
(DED) (0.816
MAF)
- Chiniot Dam
(DED) (0.85
MAF)
16.05 MAF
3
- Bhimber
Dam (FS &
DED) (0.029
MAF)
- Bara Dam
(DED) (0.062
MAF)
Water Resources Division
Rs. '000
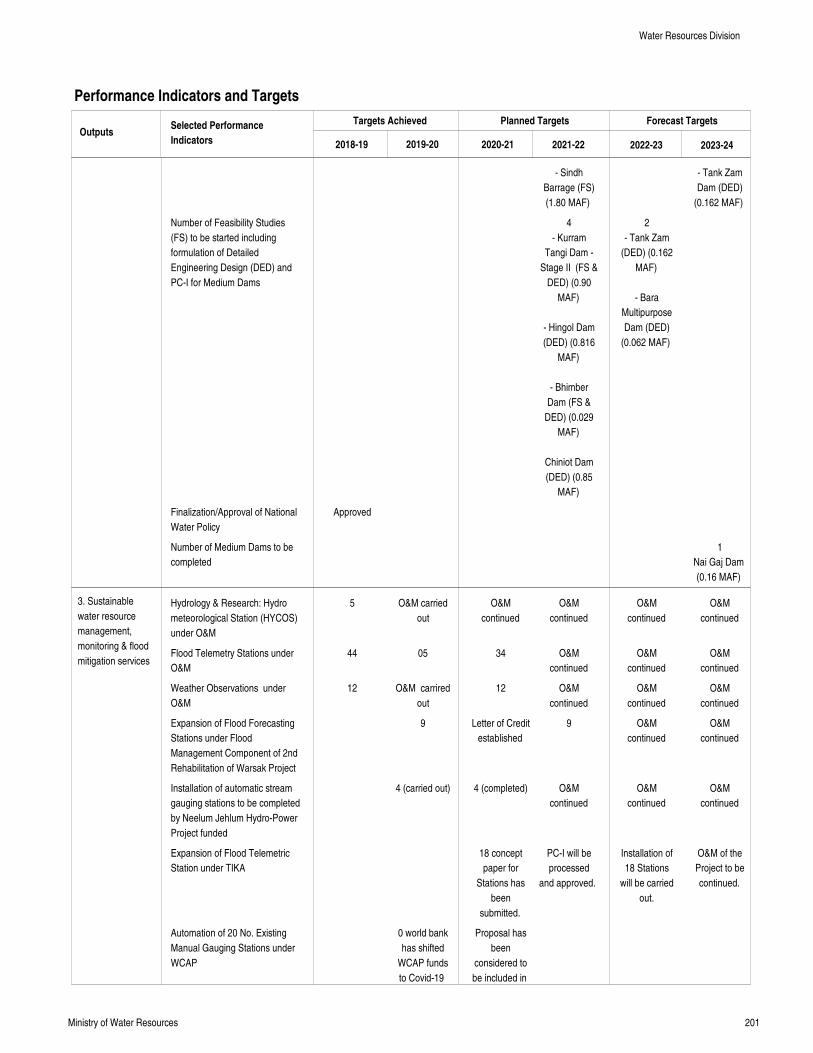
201Ministry of Water Resources
Performance Indicators and Targets
OutputsTargets Achieved Planned Targets Forecast Targets
2018-19 2019-20 2020-21 2021-22 2022-23 2023-24
Selected Performance
Indicators
3. Sustainable
water resource
management,
monitoring & flood
mitigation services
Number of Feasibility Studies
(FS) to be started including
formulation of Detailed
Engineering Design (DED) and
PC-I for Medium Dams
Finalization/Approval of National
Water Policy
Number of Medium Dams to be
completed
Hydrology & Research: Hydro
meteorological Station (HYCOS)
under O&M
Flood Telemetry Stations under
O&M
Weather Observations under
O&M
Expansion of Flood Forecasting
Stations under Flood
Management Component of 2nd
Rehabilitation of Warsak Project
Installation of automatic stream
gauging stations to be completed
by Neelum Jehlum Hydro-Power
Project funded
Expansion of Flood Telemetric
Station under TIKA
Automation of 20 No. Existing
Manual Gauging Stations under
WCAP
Approved
5
44
12
O&M carried
out
05
O&M carrired
out
9
4 (carried out)
0 world bank
has shifted
WCAP funds
to Covid-19
O&M
continued
34
12
Letter of Credit
established
4 (completed)
18 concept
paper for
Stations has
been
submitted.
Proposal has
been
considered to
be included in
- Sindh
Barrage (FS)
(1.80 MAF)
4
- Kurram
Tangi Dam -
Stage II (FS &
DED) (0.90
MAF)
- Hingol Dam
(DED) (0.816
MAF)
- Bhimber
Dam (FS &
DED) (0.029
MAF)
Chiniot Dam
(DED) (0.85
MAF)
O&M
continued
O&M
continued
O&M
continued
9
O&M
continued
PC-I will be
processed
and approved.
2
- Tank Zam
(DED) (0.162
MAF)
- Bara
Multipurpose
Dam (DED)
(0.062 MAF)
O&M
continued
O&M
continued
O&M
continued
O&M
continued
O&M
continued
Installation of
18 Stations
will be carried
out.
- Tank Zam
Dam (DED)
(0.162 MAF)
1
Nai Gaj Dam
(0.16 MAF)
O&M
continued
O&M
continued
O&M
continued
O&M
continued
O&M
continued
O&M of the
Project to be
continued.
Water Resources Division
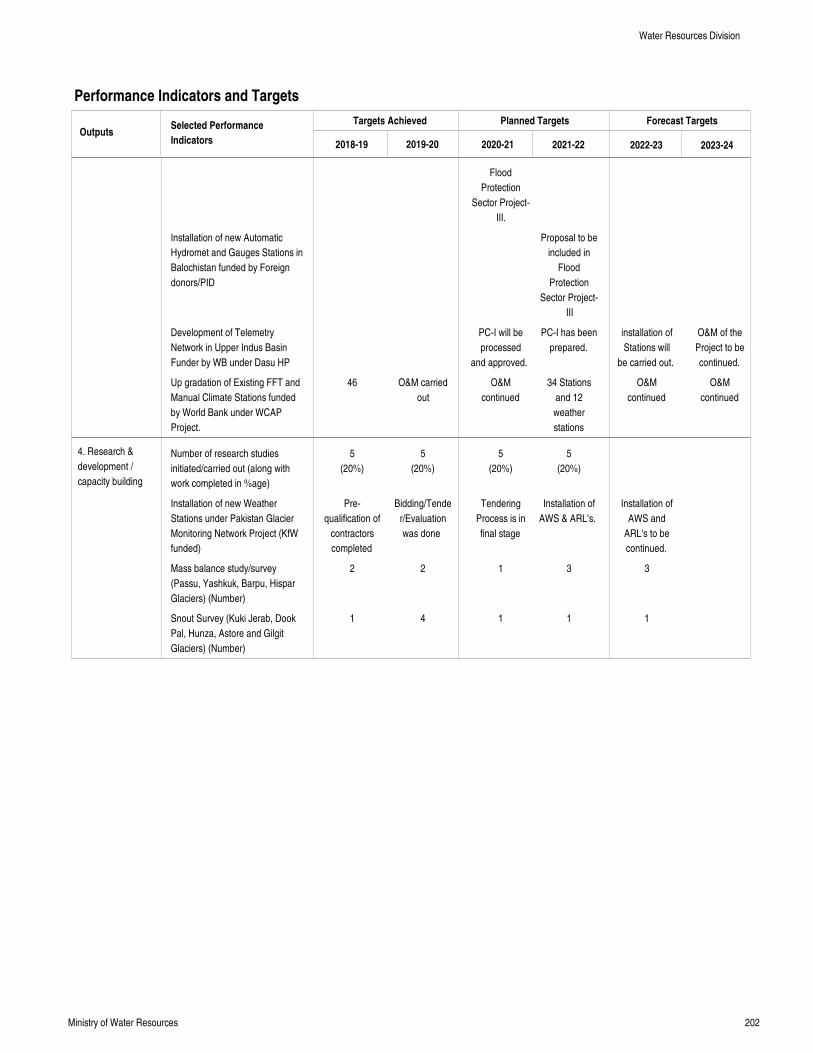
202Ministry of Water Resources
Performance Indicators and Targets
OutputsTargets Achieved Planned Targets Forecast Targets
2018-19 2019-20 2020-21 2021-22 2022-23 2023-24
Selected Performance
Indicators
4. Research &
development /
capacity building
Installation of new Automatic
Hydromet and Gauges Stations in
Balochistan funded by Foreign
donors/PID
Development of Telemetry
Network in Upper Indus Basin
Funder by WB under Dasu HP
Up gradation of Existing FFT and
Manual Climate Stations funded
by World Bank under WCAP
Project.
Number of research studies
initiated/carried out (along with
work completed in %age)
Installation of new Weather
Stations under Pakistan Glacier
Monitoring Network Project (KfW
funded)
Mass balance study/survey
(Passu, Yashkuk, Barpu, Hispar
Glaciers) (Number)
Snout Survey (Kuki Jerab, Dook
Pal, Hunza, Astore and Gilgit
Glaciers) (Number)
46
5
(20%)
Pre-
qualification of
contractors
completed
2
1
O&M carried
out
5
(20%)
Bidding/Tende
r/Evaluation
was done
2
4
Flood
Protection
Sector Project-
III.
PC-I will be
processed
and approved.
O&M
continued
5
(20%)
Tendering
Process is in
final stage
1
1
Proposal to be
included in
Flood
Protection
Sector Project-
III
PC-I has been
prepared.
34 Stations
and 12
weather
stations
5
(20%)
Installation of
AWS & ARL's.
3
1
installation of
Stations will
be carried out.
O&M
continued
Installation of
AWS and
ARL's to be
continued.
3
1
O&M of the
Project to be
continued.
O&M
continued
Water Resources Division
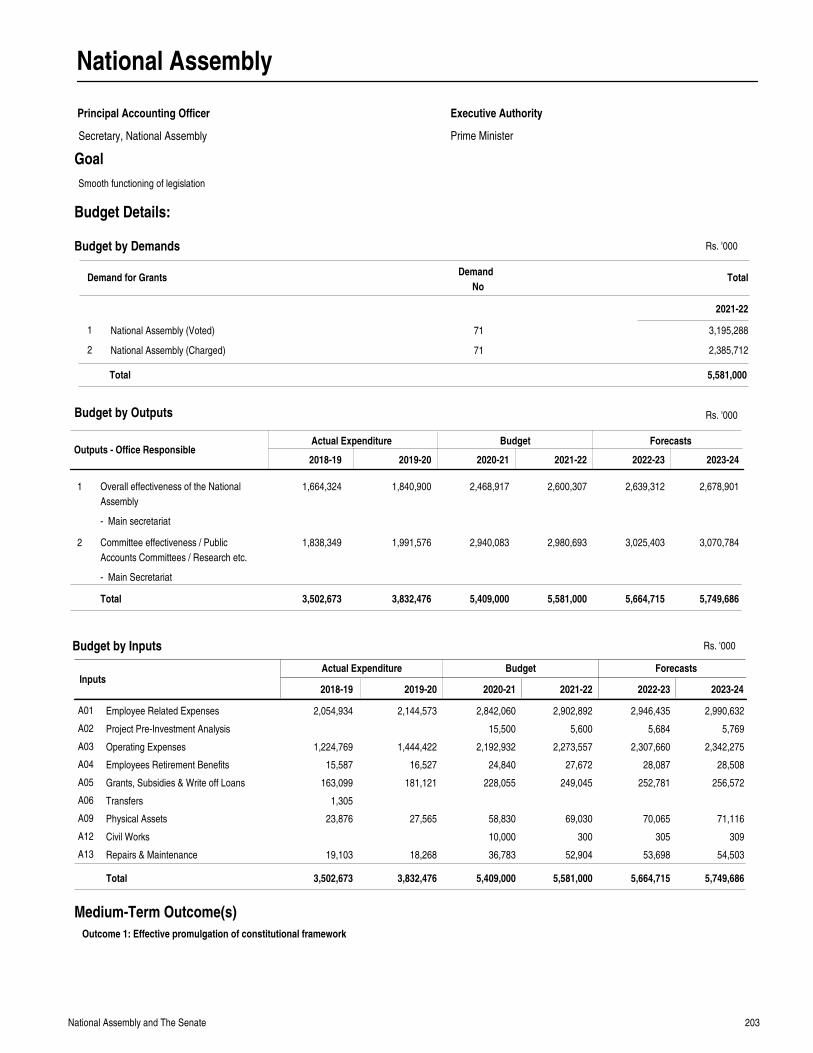
203National Assembly and The Senate
National Assembly
Principal Accounting Officer
Prime Minister
Executive Authority
Goal
Outputs - Office ResponsibleActual Expenditure Budget Forecasts
2018-19 2019-20 2020-21 2021-22 2022-23 2023-24
Overall effectiveness of the National
Assembly
Committee effectiveness / Public
Accounts Committees / Research etc.
1,664,324
1,838,349
1,840,900
1,991,576
2,468,917
2,940,083
2,600,307
2,980,693
2,639,312
3,025,403
2,678,901
3,070,784
1
2
Total 3,502,673 3,832,476 5,409,000 5,581,000 5,664,715 5,749,686
Rs. '000
InputsActual Expenditure Budget Forecasts
Employee Related Expenses
Project Pre-Investment Analysis
Operating Expenses
Employees Retirement Benefits
Grants, Subsidies & Write off Loans
Transfers
Physical Assets
Civil Works
Repairs & Maintenance
2,054,934
1,224,769
15,587
163,099
1,305
23,876
19,103
2,144,573
1,444,422
16,527
181,121
27,565
18,268
2,842,060
15,500
2,192,932
24,840
228,055
58,830
10,000
36,783
2,902,892
5,600
2,273,557
27,672
249,045
69,030
300
52,904
2,946,435
5,684
2,307,660
28,087
252,781
70,065
305
53,698
2,990,632
5,769
2,342,275
28,508
256,572
71,116
309
54,503
A01
A02
A03
A04
A05
A06
A09
A12
A13
Total 3,502,673 3,832,476 5,409,000 5,581,000 5,664,715 5,749,686
2018-19 2019-20 2020-21 2021-22 2022-23 2023-24
Medium-Term Outcome(s)
Outcome 1: Effective promulgation of constitutional framework
Budget by Outputs
Budget by Inputs
Smooth functioning of legislation
Demand for GrantsDemand
NoTotal
2021-22
Budget by Demands
National Assembly (Voted)
National Assembly (Charged)
1
2
71
71
3,195,288
2,385,712
5,581,000Total
Secretary, National Assembly
Budget Details:
- Main secretariat
- Main Secretariat
Rs. '000
Rs. '000
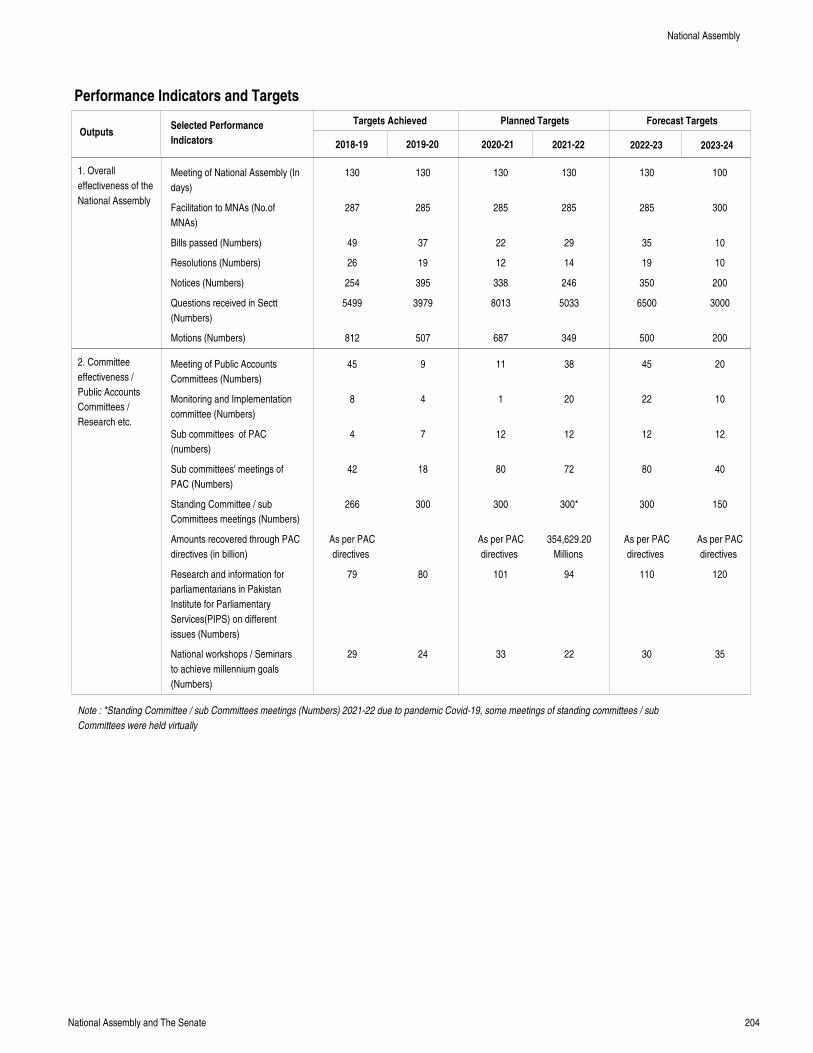
204National Assembly and The Senate
Performance Indicators and Targets
OutputsTargets Achieved Planned Targets Forecast Targets
2018-19 2019-20 2020-21 2021-22 2022-23 2023-24
Selected Performance
Indicators
1. Overall
effectiveness of the
National Assembly
2. Committee
effectiveness /
Public Accounts
Committees /
Research etc.
Note : *Standing Committee / sub Committees meetings (Numbers) 2021-22 due to pandemic Covid-19, some meetings of standing committees / sub
Committees were held virtually
Meeting of National Assembly (In
days)
Facilitation to MNAs (No.of
MNAs)
Bills passed (Numbers)
Resolutions (Numbers)
Notices (Numbers)
Questions received in Sectt
(Numbers)
Motions (Numbers)
Meeting of Public Accounts
Committees (Numbers)
Monitoring and Implementation
committee (Numbers)
Sub committees of PAC
(numbers)
Sub committees' meetings of
PAC (Numbers)
Standing Committee / sub
Committees meetings (Numbers)
Amounts recovered through PAC
directives (in billion)
Research and information for
parliamentarians in Pakistan
Institute for Parliamentary
Services(PIPS) on different
issues (Numbers)
National workshops / Seminars
to achieve millennium goals
(Numbers)
130
287
49
26
254
5499
812
45
8
4
42
266
As per PAC
directives
79
29
130
285
37
19
395
3979
507
9
4
7
18
300
80
24
130
285
22
12
338
8013
687
11
1
12
80
300
As per PAC
directives
101
33
130
285
29
14
246
5033
349
38
20
12
72
300*
354,629.20
Millions
94
22
130
285
35
19
350
6500
500
45
22
12
80
300
As per PAC
directives
110
30
100
300
10
10
200
3000
200
20
10
12
40
150
As per PAC
directives
120
35
National Assembly
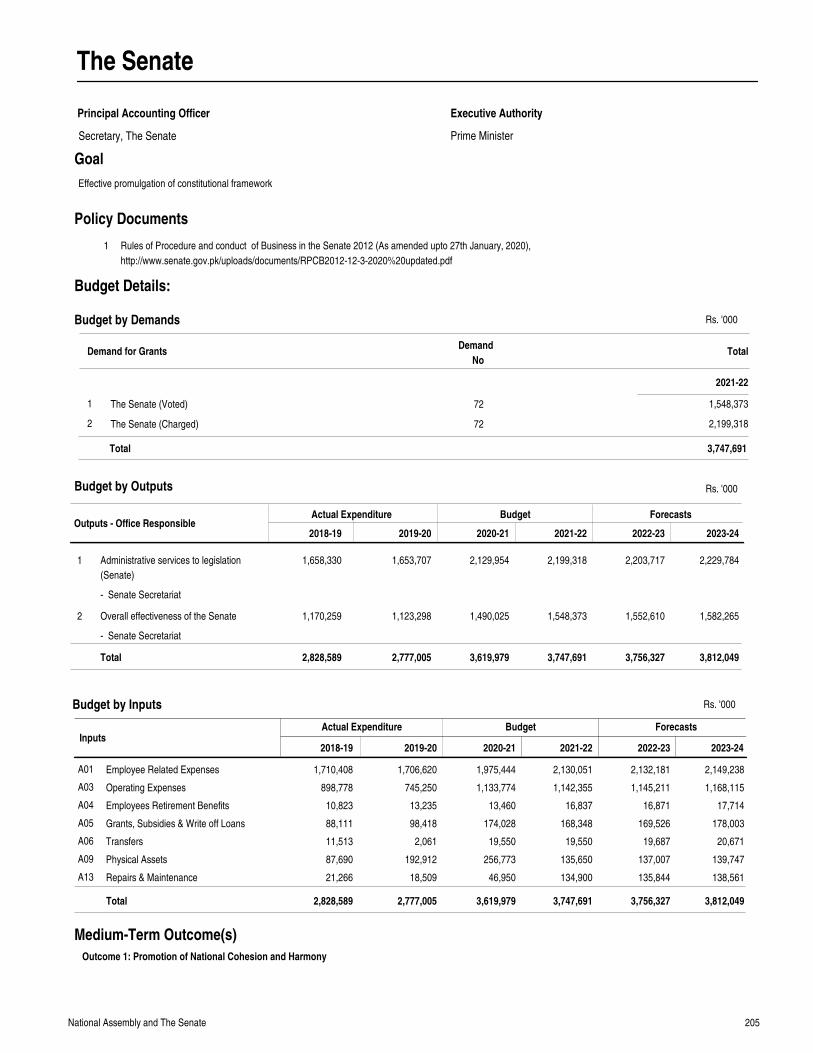
205National Assembly and The Senate
The Senate
Principal Accounting Officer
Prime Minister
Executive Authority
Goal
Outputs - Office ResponsibleActual Expenditure Budget Forecasts
2018-19 2019-20 2020-21 2021-22 2022-23 2023-24
Administrative services to legislation
(Senate)
Overall effectiveness of the Senate
1,658,330
1,170,259
1,653,707
1,123,298
2,129,954
1,490,025
2,199,318
1,548,373
2,203,717
1,552,610
2,229,784
1,582,265
1
2
Total 2,828,589 2,777,005 3,619,979 3,747,691 3,756,327 3,812,049
Rs. '000
InputsActual Expenditure Budget Forecasts
Employee Related Expenses
Operating Expenses
Employees Retirement Benefits
Grants, Subsidies & Write off Loans
Transfers
Physical Assets
Repairs & Maintenance
1,710,408
898,778
10,823
88,111
11,513
87,690
21,266
1,706,620
745,250
13,235
98,418
2,061
192,912
18,509
1,975,444
1,133,774
13,460
174,028
19,550
256,773
46,950
2,130,051
1,142,355
16,837
168,348
19,550
135,650
134,900
2,132,181
1,145,211
16,871
169,526
19,687
137,007
135,844
2,149,238
1,168,115
17,714
178,003
20,671
139,747
138,561
A01
A03
A04
A05
A06
A09
A13
Total 2,828,589 2,777,005 3,619,979 3,747,691 3,756,327 3,812,049
2018-19 2019-20 2020-21 2021-22 2022-23 2023-24
1 Rules of Procedure and conduct of Business in the Senate 2012 (As amended upto 27th January, 2020),
http://www.senate.gov.pk/uploads/documents/RPCB2012-12-3-2020%20updated.pdf
Policy Documents
Medium-Term Outcome(s)
Outcome 1: Promotion of National Cohesion and Harmony
Budget by Outputs
Budget by Inputs
Effective promulgation of constitutional framework
Demand for GrantsDemand
NoTotal
2021-22
Budget by Demands
The Senate (Voted)
The Senate (Charged)
1
2
72
72
1,548,373
2,199,318
3,747,691Total
Secretary, The Senate
Budget Details:
- Senate Secretariat
- Senate Secretariat
Rs. '000
Rs. '000

206National Assembly and The Senate
Performance Indicators and Targets
OutputsTargets Achieved Planned Targets Forecast Targets
2018-19 2019-20 2020-21 2021-22 2022-23 2023-24
Selected Performance
Indicators
2. Overall
effectiveness of the
Senate
Number of days, the Senate shall
meet during a year
Number of Senator to be
facilitated
Number Chairmen Standing
Committees to be facilitated
110
104
38
110
104
38
110
104
40
118
100
40
118
100
40
118
100
40
The Senate
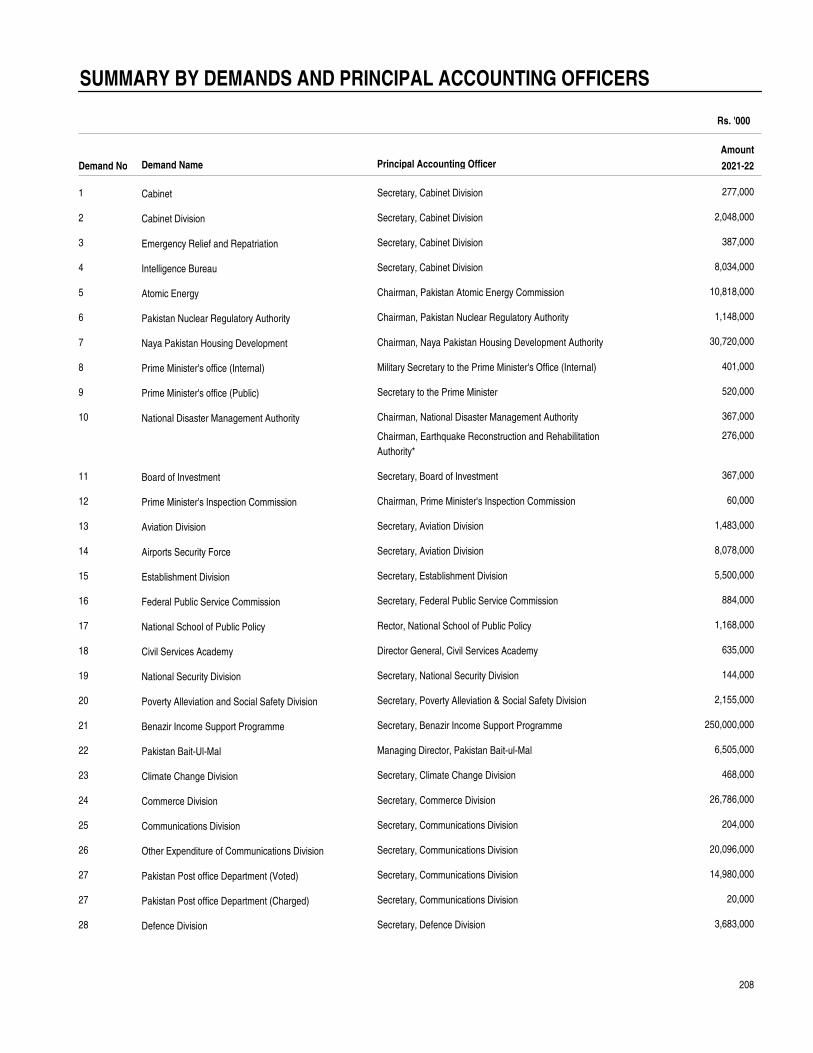
208
Secretary, Cabinet Division
Secretary, Cabinet Division
Secretary, Cabinet Division
Secretary, Cabinet Division
Chairman, Pakistan Atomic Energy Commission
Chairman, Pakistan Nuclear Regulatory Authority
Chairman, Naya Pakistan Housing Development Authority
Military Secretary to the Prime Minister's Office (Internal)
Secretary to the Prime Minister
Chairman, National Disaster Management Authority
Chairman, Earthquake Reconstruction and Rehabilitation
Authority*
Secretary, Board of Investment
Chairman, Prime Minister's Inspection Commission
Secretary, Aviation Division
Secretary, Aviation Division
Secretary, Establishment Division
Secretary, Federal Public Service Commission
Rector, National School of Public Policy
Director General, Civil Services Academy
Secretary, National Security Division
Secretary, Poverty Alleviation & Social Safety Division
Secretary, Benazir Income Support Programme
Managing Director, Pakistan Bait-ul-Mal
Secretary, Climate Change Division
Secretary, Commerce Division
Secretary, Communications Division
Secretary, Communications Division
Secretary, Communications Division
Secretary, Communications Division
Secretary, Defence Division
SUMMARY BY DEMANDS AND PRINCIPAL ACCOUNTING OFFICERS
Rs. '000
277,000
2,048,000
387,000
8,034,000
10,818,000
1,148,000
30,720,000
401,000
520,000
367,000
276,000
367,000
60,000
1,483,000
8,078,000
5,500,000
884,000
1,168,000
635,000
144,000
2,155,000
250,000,000
6,505,000
468,000
26,786,000
204,000
20,096,000
14,980,000
20,000
3,683,000
Demand No
Amount
2021-22
1
2
3
4
5
6
7
8
9
10
11
12
13
14
15
16
17
18
19
20
21
22
23
24
25
26
27
27
28
Cabinet
Cabinet Division
Emergency Relief and Repatriation
Intelligence Bureau
Atomic Energy
Pakistan Nuclear Regulatory Authority
Naya Pakistan Housing Development
Prime Minister's office (Internal)
Prime Minister's office (Public)
National Disaster Management Authority
Board of Investment
Prime Minister's Inspection Commission
Aviation Division
Airports Security Force
Establishment Division
Federal Public Service Commission
National School of Public Policy
Civil Services Academy
National Security Division
Poverty Alleviation and Social Safety Division
Benazir Income Support Programme
Pakistan Bait-Ul-Mal
Climate Change Division
Commerce Division
Communications Division
Other Expenditure of Communications Division
Pakistan Post office Department (Voted)
Pakistan Post office Department (Charged)
Defence Division
Demand Name Principal Accounting Officer
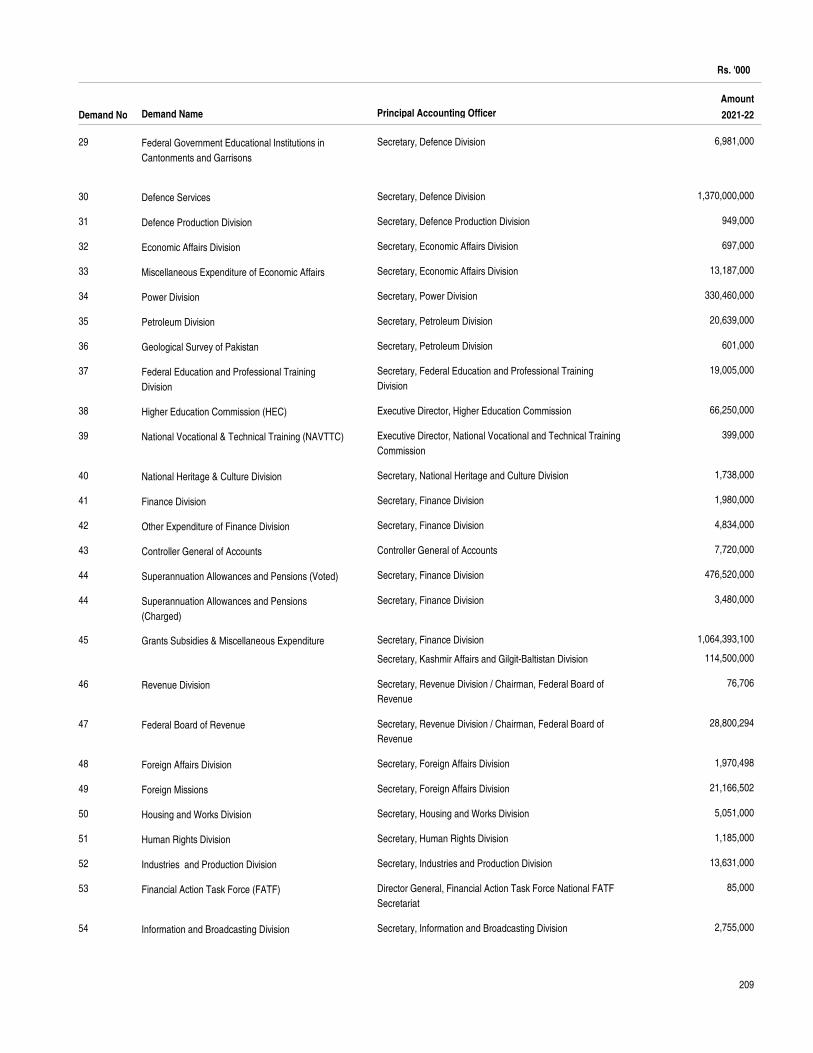
209
Secretary, Defence Division
Secretary, Defence Division
Secretary, Defence Production Division
Secretary, Economic Affairs Division
Secretary, Economic Affairs Division
Secretary, Power Division
Secretary, Petroleum Division
Secretary, Petroleum Division
Secretary, Federal Education and Professional Training
Division
Executive Director, Higher Education Commission
Executive Director, National Vocational and Technical Training
Commission
Secretary, National Heritage and Culture Division
Secretary, Finance Division
Secretary, Finance Division
Controller General of Accounts
Secretary, Finance Division
Secretary, Finance Division
Secretary, Finance Division
Secretary, Kashmir Affairs and Gilgit-Baltistan Division
Secretary, Revenue Division / Chairman, Federal Board of
Revenue
Secretary, Revenue Division / Chairman, Federal Board of
Revenue
Secretary, Foreign Affairs Division
Secretary, Foreign Affairs Division
Secretary, Housing and Works Division
Secretary, Human Rights Division
Secretary, Industries and Production Division
Director General, Financial Action Task Force National FATF
Secretariat
Secretary, Information and Broadcasting Division
Rs. '000
6,981,000
1,370,000,000
949,000
697,000
13,187,000
330,460,000
20,639,000
601,000
19,005,000
66,250,000
399,000
1,738,000
1,980,000
4,834,000
7,720,000
476,520,000
3,480,000
1,064,393,100
114,500,000
76,706
28,800,294
1,970,498
21,166,502
5,051,000
1,185,000
13,631,000
85,000
2,755,000
Demand No
Amount
2021-22
29
30
31
32
33
34
35
36
37
38
39
40
41
42
43
44
44
45
46
47
48
49
50
51
52
53
54
Federal Government Educational Institutions in
Cantonments and Garrisons
Defence Services
Defence Production Division
Economic Affairs Division
Miscellaneous Expenditure of Economic Affairs
Power Division
Petroleum Division
Geological Survey of Pakistan
Federal Education and Professional Training
Division
Higher Education Commission (HEC)
National Vocational & Technical Training (NAVTTC)
National Heritage & Culture Division
Finance Division
Other Expenditure of Finance Division
Controller General of Accounts
Superannuation Allowances and Pensions (Voted)
Superannuation Allowances and Pensions
(Charged)
Grants Subsidies & Miscellaneous Expenditure
Revenue Division
Federal Board of Revenue
Foreign Affairs Division
Foreign Missions
Housing and Works Division
Human Rights Division
Industries and Production Division
Financial Action Task Force (FATF)
Information and Broadcasting Division
Demand Name Principal Accounting Officer
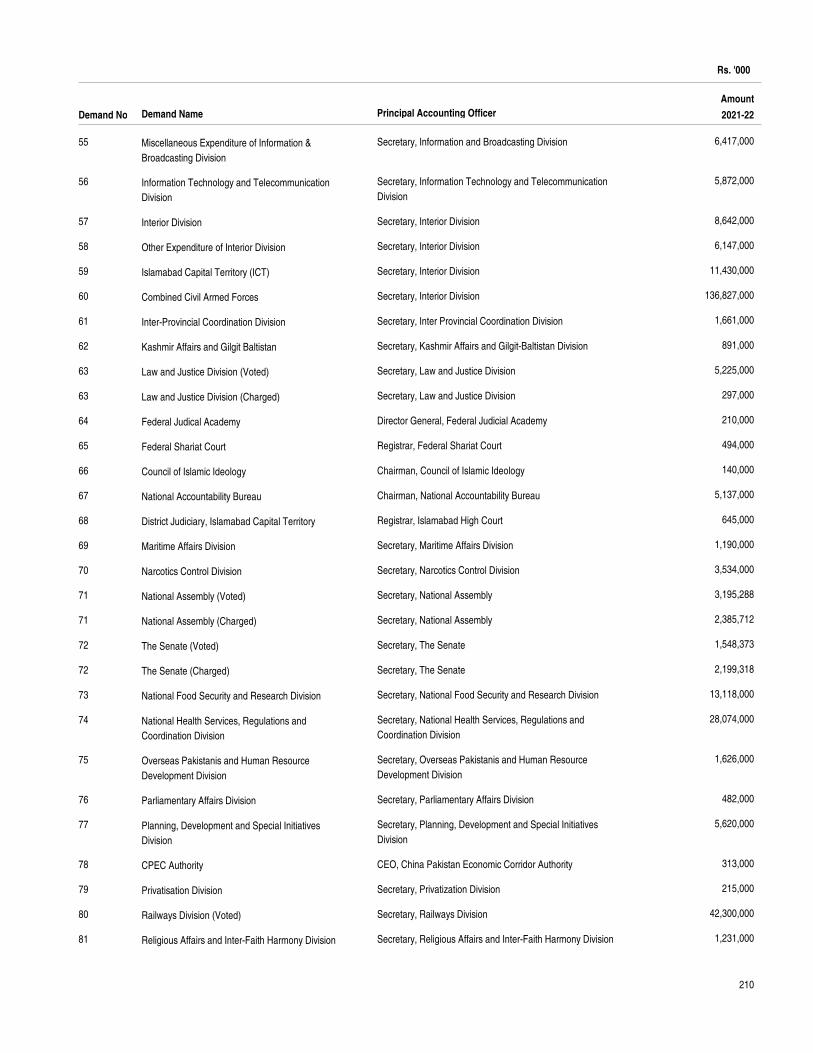
210
Secretary, Information and Broadcasting Division
Secretary, Information Technology and Telecommunication
Division
Secretary, Interior Division
Secretary, Interior Division
Secretary, Interior Division
Secretary, Interior Division
Secretary, Inter Provincial Coordination Division
Secretary, Kashmir Affairs and Gilgit-Baltistan Division
Secretary, Law and Justice Division
Secretary, Law and Justice Division
Director General, Federal Judicial Academy
Registrar, Federal Shariat Court
Chairman, Council of Islamic Ideology
Chairman, National Accountability Bureau
Registrar, Islamabad High Court
Secretary, Maritime Affairs Division
Secretary, Narcotics Control Division
Secretary, National Assembly
Secretary, National Assembly
Secretary, The Senate
Secretary, The Senate
Secretary, National Food Security and Research Division
Secretary, National Health Services, Regulations and
Coordination Division
Secretary, Overseas Pakistanis and Human Resource
Development Division
Secretary, Parliamentary Affairs Division
Secretary, Planning, Development and Special Initiatives
Division
CEO, China Pakistan Economic Corridor Authority
Secretary, Privatization Division
Secretary, Railways Division
Secretary, Religious Affairs and Inter-Faith Harmony Division
Rs. '000
6,417,000
5,872,000
8,642,000
6,147,000
11,430,000
136,827,000
1,661,000
891,000
5,225,000
297,000
210,000
494,000
140,000
5,137,000
645,000
1,190,000
3,534,000
3,195,288
2,385,712
1,548,373
2,199,318
13,118,000
28,074,000
1,626,000
482,000
5,620,000
313,000
215,000
42,300,000
1,231,000
Demand No
Amount
2021-22
55
56
57
58
59
60
61
62
63
63
64
65
66
67
68
69
70
71
71
72
72
73
74
75
76
77
78
79
80
81
Miscellaneous Expenditure of Information &
Broadcasting Division
Information Technology and Telecommunication
Division
Interior Division
Other Expenditure of Interior Division
Islamabad Capital Territory (ICT)
Combined Civil Armed Forces
Inter-Provincial Coordination Division
Kashmir Affairs and Gilgit Baltistan
Law and Justice Division (Voted)
Law and Justice Division (Charged)
Federal Judical Academy
Federal Shariat Court
Council of Islamic Ideology
National Accountability Bureau
District Judiciary, Islamabad Capital Territory
Maritime Affairs Division
Narcotics Control Division
National Assembly (Voted)
National Assembly (Charged)
The Senate (Voted)
The Senate (Charged)
National Food Security and Research Division
National Health Services, Regulations and
Coordination Division
Overseas Pakistanis and Human Resource
Development Division
Parliamentary Affairs Division
Planning, Development and Special Initiatives
Division
CPEC Authority
Privatisation Division
Railways Division (Voted)
Religious Affairs and Inter-Faith Harmony Division
Demand Name Principal Accounting Officer
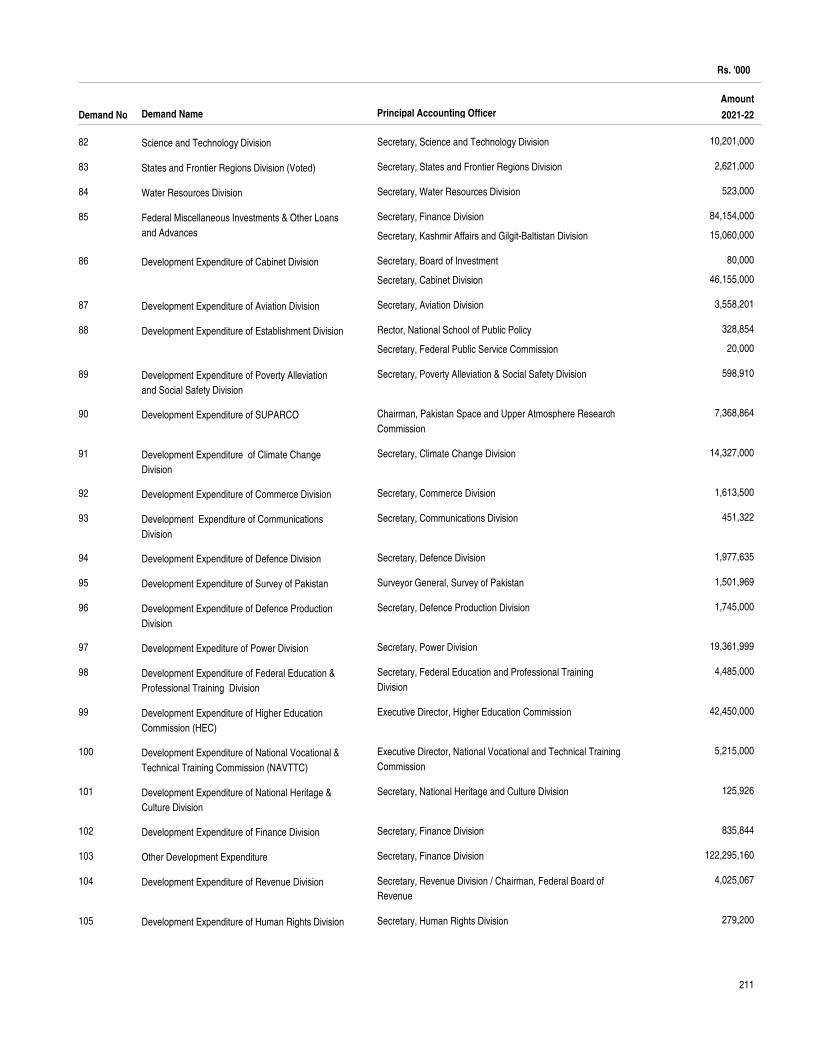
211
Secretary, Science and Technology Division
Secretary, States and Frontier Regions Division
Secretary, Water Resources Division
Secretary, Finance Division
Secretary, Kashmir Affairs and Gilgit-Baltistan Division
Secretary, Board of Investment
Secretary, Cabinet Division
Secretary, Aviation Division
Rector, National School of Public Policy
Secretary, Federal Public Service Commission
Secretary, Poverty Alleviation & Social Safety Division
Chairman, Pakistan Space and Upper Atmosphere Research
Commission
Secretary, Climate Change Division
Secretary, Commerce Division
Secretary, Communications Division
Secretary, Defence Division
Surveyor General, Survey of Pakistan
Secretary, Defence Production Division
Secretary, Power Division
Secretary, Federal Education and Professional Training
Division
Executive Director, Higher Education Commission
Executive Director, National Vocational and Technical Training
Commission
Secretary, National Heritage and Culture Division
Secretary, Finance Division
Secretary, Finance Division
Secretary, Revenue Division / Chairman, Federal Board of
Revenue
Secretary, Human Rights Division
Rs. '000
10,201,000
2,621,000
523,000
84,154,000
15,060,000
80,000
46,155,000
3,558,201
328,854
20,000
598,910
7,368,864
14,327,000
1,613,500
451,322
1,977,635
1,501,969
1,745,000
19,361,999
4,485,000
42,450,000
5,215,000
125,926
835,844
122,295,160
4,025,067
279,200
Demand No
Amount
2021-22
82
83
84
85
86
87
88
89
90
91
92
93
94
95
96
97
98
99
100
101
102
103
104
105
Science and Technology Division
States and Frontier Regions Division (Voted)
Water Resources Division
Federal Miscellaneous Investments & Other Loans
and Advances
Development Expenditure of Cabinet Division
Development Expenditure of Aviation Division
Development Expenditure of Establishment Division
Development Expenditure of Poverty Alleviation
and Social Safety Division
Development Expenditure of SUPARCO
Development Expenditure of Climate Change
Division
Development Expenditure of Commerce Division
Development Expenditure of Communications
Division
Development Expenditure of Defence Division
Development Expenditure of Survey of Pakistan
Development Expenditure of Defence Production
Division
Development Expediture of Power Division
Development Expenditure of Federal Education &
Professional Training Division
Development Expenditure of Higher Education
Commission (HEC)
Development Expenditure of National Vocational &
Technical Training Commission (NAVTTC)
Development Expenditure of National Heritage &
Culture Division
Development Expenditure of Finance Division
Other Development Expenditure
Development Expenditure of Revenue Division
Development Expenditure of Human Rights Division
Demand Name Principal Accounting Officer
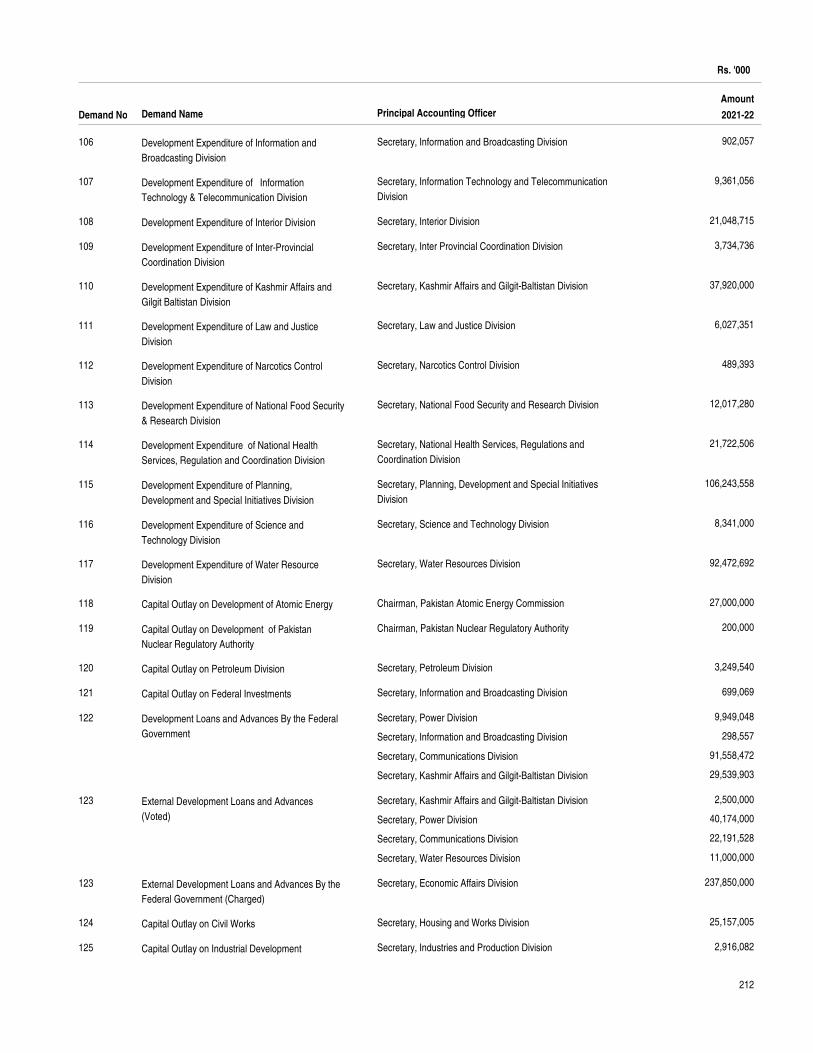
212
Secretary, Information and Broadcasting Division
Secretary, Information Technology and Telecommunication
Division
Secretary, Interior Division
Secretary, Inter Provincial Coordination Division
Secretary, Kashmir Affairs and Gilgit-Baltistan Division
Secretary, Law and Justice Division
Secretary, Narcotics Control Division
Secretary, National Food Security and Research Division
Secretary, National Health Services, Regulations and
Coordination Division
Secretary, Planning, Development and Special Initiatives
Division
Secretary, Science and Technology Division
Secretary, Water Resources Division
Chairman, Pakistan Atomic Energy Commission
Chairman, Pakistan Nuclear Regulatory Authority
Secretary, Petroleum Division
Secretary, Information and Broadcasting Division
Secretary, Power Division
Secretary, Information and Broadcasting Division
Secretary, Communications Division
Secretary, Kashmir Affairs and Gilgit-Baltistan Division
Secretary, Kashmir Affairs and Gilgit-Baltistan Division
Secretary, Power Division
Secretary, Communications Division
Secretary, Water Resources Division
Secretary, Economic Affairs Division
Secretary, Housing and Works Division
Secretary, Industries and Production Division
Rs. '000
902,057
9,361,056
21,048,715
3,734,736
37,920,000
6,027,351
489,393
12,017,280
21,722,506
106,243,558
8,341,000
92,472,692
27,000,000
200,000
3,249,540
699,069
9,949,048
298,557
91,558,472
29,539,903
2,500,000
40,174,000
22,191,528
11,000,000
237,850,000
25,157,005
2,916,082
Demand No
Amount
2021-22
106
107
108
109
110
111
112
113
114
115
116
117
118
119
120
121
122
123
123
124
125
Development Expenditure of Information and
Broadcasting Division
Development Expenditure of Information
Technology & Telecommunication Division
Development Expenditure of Interior Division
Development Expenditure of Inter-Provincial
Coordination Division
Development Expenditure of Kashmir Affairs and
Gilgit Baltistan Division
Development Expenditure of Law and Justice
Division
Development Expenditure of Narcotics Control
Division
Development Expenditure of National Food Security
& Research Division
Development Expenditure of National Health
Services, Regulation and Coordination Division
Development Expenditure of Planning,
Development and Special Initiatives Division
Development Expenditure of Science and
Technology Division
Development Expenditure of Water Resource
Division
Capital Outlay on Development of Atomic Energy
Capital Outlay on Development of Pakistan
Nuclear Regulatory Authority
Capital Outlay on Petroleum Division
Capital Outlay on Federal Investments
Development Loans and Advances By the Federal
Government
External Development Loans and Advances
(Voted)
External Development Loans and Advances By the
Federal Government (Charged)
Capital Outlay on Civil Works
Capital Outlay on Industrial Development
Demand Name Principal Accounting Officer
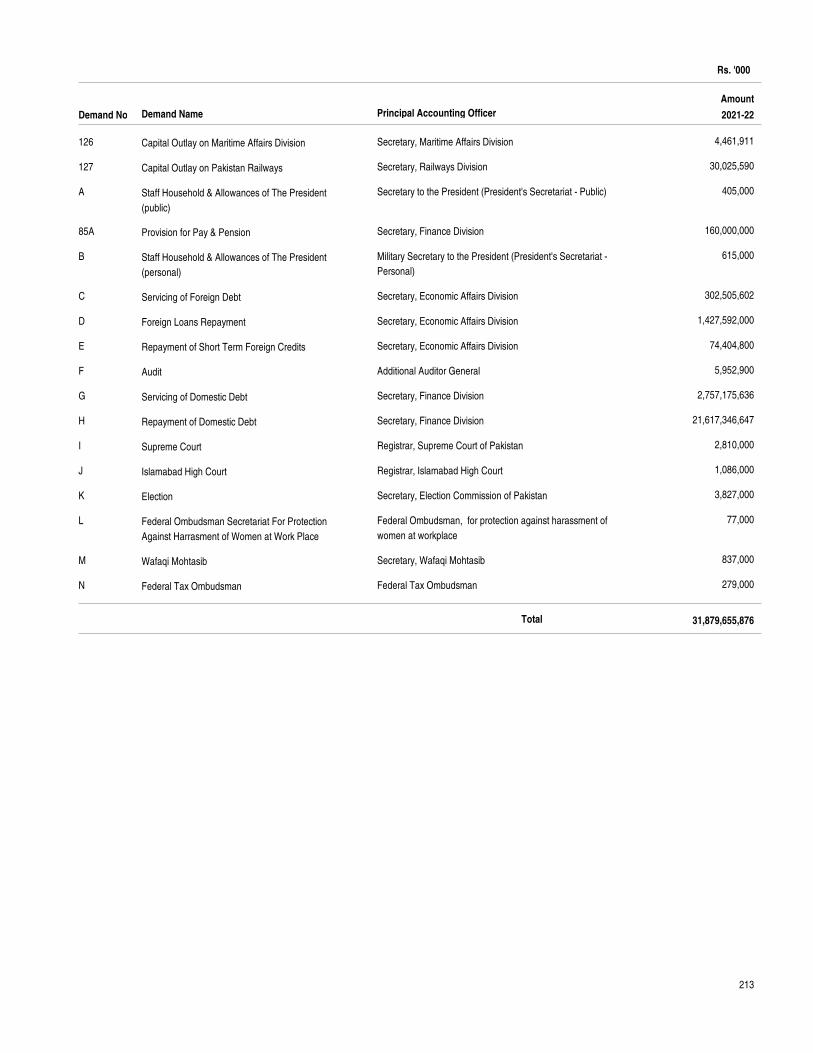
213
Secretary, Maritime Affairs Division
Secretary, Railways Division
Secretary to the President (President's Secretariat - Public)
Secretary, Finance Division
Military Secretary to the President (President's Secretariat -
Personal)
Secretary, Economic Affairs Division
Secretary, Economic Affairs Division
Secretary, Economic Affairs Division
Additional Auditor General
Secretary, Finance Division
Secretary, Finance Division
Registrar, Supreme Court of Pakistan
Registrar, Islamabad High Court
Secretary, Election Commission of Pakistan
Federal Ombudsman, for protection against harassment of
women at workplace
Secretary, Wafaqi Mohtasib
Federal Tax Ombudsman
Rs. '000
4,461,911
30,025,590
405,000
160,000,000
615,000
302,505,602
1,427,592,000
74,404,800
5,952,900
2,757,175,636
21,617,346,647
2,810,000
1,086,000
3,827,000
77,000
837,000
279,000
Demand No
Amount
2021-22
Total 31,879,655,876
126
127
A
85A
B
C
D
E
F
G
H
I
J
K
L
M
N
Capital Outlay on Maritime Affairs Division
Capital Outlay on Pakistan Railways
Staff Household & Allowances of The President
(public)
Provision for Pay & Pension
Staff Household & Allowances of The President
(personal)
Servicing of Foreign Debt
Foreign Loans Repayment
Repayment of Short Term Foreign Credits
Audit
Servicing of Domestic Debt
Repayment of Domestic Debt
Supreme Court
Islamabad High Court
Election
Federal Ombudsman Secretariat For Protection
Against Harrasment of Women at Work Place
Wafaqi Mohtasib
Federal Tax Ombudsman
Demand Name Principal Accounting Officer
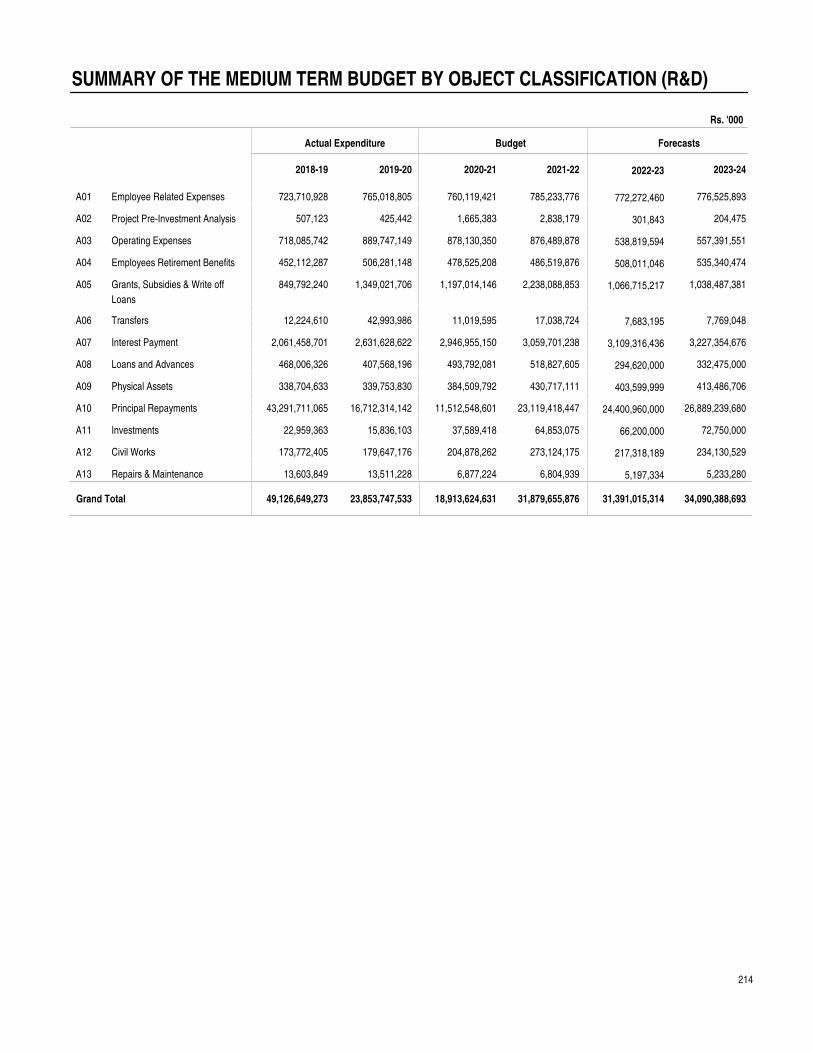
214
SUMMARY OF THE MEDIUM TERM BUDGET BY OBJECT CLASSIFICATION (R&D)
A01
A02
A03
A04
A05
A06
A07
A08
A09
A10
A11
A12
A13
723,710,928
507,123
718,085,742
452,112,287
849,792,240
12,224,610
2,061,458,701
468,006,326
338,704,633
43,291,711,065
22,959,363
173,772,405
13,603,849
765,018,805
425,442
889,747,149
506,281,148
1,349,021,706
42,993,986
2,631,628,622
407,568,196
339,753,830
16,712,314,142
15,836,103
179,647,176
13,511,228
760,119,421
1,665,383
878,130,350
478,525,208
1,197,014,146
11,019,595
2,946,955,150
493,792,081
384,509,792
11,512,548,601
37,589,418
204,878,262
6,877,224
785,233,776
2,838,179
876,489,878
486,519,876
2,238,088,853
17,038,724
3,059,701,238
518,827,605
430,717,111
23,119,418,447
64,853,075
273,124,175
6,804,939
776,525,893
204,475
557,391,551
535,340,474
1,038,487,381
7,769,048
3,227,354,676
332,475,000
413,486,706
26,889,239,680
72,750,000
234,130,529
5,233,280
Rs. '000
772,272,460
301,843
538,819,594
508,011,046
1,066,715,217
7,683,195
3,109,316,436
294,620,000
403,599,999
24,400,960,000
66,200,000
217,318,189
5,197,334
Actual Expenditure Budget Forecasts
2018-19 2019-20 2020-21 2021-22 2022-23 2023-24
Grand Total
Employee Related Expenses
Project Pre-Investment Analysis
Operating Expenses
Employees Retirement Benefits
Grants, Subsidies & Write off
Loans
Transfers
Interest Payment
Loans and Advances
Physical Assets
Principal Repayments
Investments
Civil Works
Repairs & Maintenance
49,126,649,273 23,853,747,533 18,913,624,631 31,879,655,876 34,090,388,693 31,391,015,314